the futurebrand index - ranking the brands brand index 2014... · the futurebrand index ......
TRANSCRIPT
The FutureBrandIndex
Measuring what matters for future success
100
2The FutureBrand Index FutureBrand ©
What’s inside?
1.0 Introduction2.0 Our methodology3.0 Global top 100 rankings4.0 What is a ‘future brand’ and why does it matter?5.0 Rankings by sector6.0 The ones to watch
The FutureBrand Index 3 FutureBrand ©
1.0 IntroductionIntroduction
4FutureBrand ©
FutureBrand ©FutureBrand ©
We believe 21st century brand strength is best understood in terms of the balance of perceptions between what a company stands for – its purpose – and how far it delivers on it – the resulting experience. And organizations that strike this balance will have a competitive advantage in the future. To test this hypothesis, we set out to measure global public perception of the Global Top 100 Companies by market capitalization.
Our research highlights that whilst the top 100 companies are undoubtedly to be admired for their financial performance, only 22 of them qualify as ‘future brands’ in the opinion of an informed public.
Why does this matter? Because when people rate a company highly in both areas, they are more likely to want to buy from, pay more and work for that company. This gives them an advantage now and in the future that is not dependent on their financial strength, but could be a driver of it tomorrow.
Organizational reputation has never mattered more.In an age of real-time global communication and transparency, constrained resources and macro-economic shifts to new centres of power, we are increasingly concerned about the beliefs and behaviours of the companies that provide the products and services we trust and depend on. Arguably, global perception of these companies makes a difference to their future reputation and value – they inform our decisions about what to buy, invest in and where to work. This is why it is critical to understand organizational brand strength as an input to strategies for future success. For example, as research by Weber Shandwick has revealed, company reputation provides things like product quality assurance, with 67% of consumers checking product labels to see what company is behind them. Despite this, we tend ultimately to reduce our understanding of their performance and strength to purely financial measures. However, financial value does not always correlate to perception strength: in other words, a high market capitalization does not guarantee a strong brand, nor inform the billions of everyday decisions that create our future.
Introduction
What will drive futureorganizational success?
The FutureBrand Index
Being seen as a ‘future brand’ offers a competitive advantage.
FutureBrand ©The FutureBrand Index FutureBrand ©
Introduction
We need to broaden our understanding of value.So it is important to broaden our understanding of value to include how far a company is seen to address broader emotional and societal needs and wants – from fostering trust to driving innovation and being indispensable to our lives – and re-order the top 100 by those measures as an alternative indicator or ‘Index’ of future success. This is not least because they are the drivers of choice influencing more conventional measures of commercial performance – from sales to price premium and employer of choice. But also because when we look at global opinion around which of the top 100 companies are most likely to be ‘moving forward’ in three years, half of them are not even in the current top 20 by market capitalization. In addition to this, our research shows that the key drivers of a ‘future brand’ relate to strength of perception around thought leadership, innovation and authenticity, rather than commercial power.
What will drive futureorganizational success?
5
What does this mean for leaders?This report aims to demonstrate that it has never been more important to understand global perceptions of your organization, and that even the most successful companies have levers they can pull for further competitive advantage. It provides a lens for understanding the drivers of future success by organization and industry sector based on global public perception. And perhaps most importantly, it demonstrates that ‘brand strength’ needs to be understood as the ability to balance decisions and perceptions relating to both ‘why’ you are here, and ‘what’ you do, beyond making money for shareholders.
Arguably, the organizations that achieve this will create a more positive future for themselves, their customers, investors and society as a whole.
6
Pu
rpos
e brand Future brand
Experience brandCorpora
te b
ran
d
The FutureBrand Index 7 FutureBrand ©
Our methodology
2.0 Our methodology
The FutureBrand Index 8
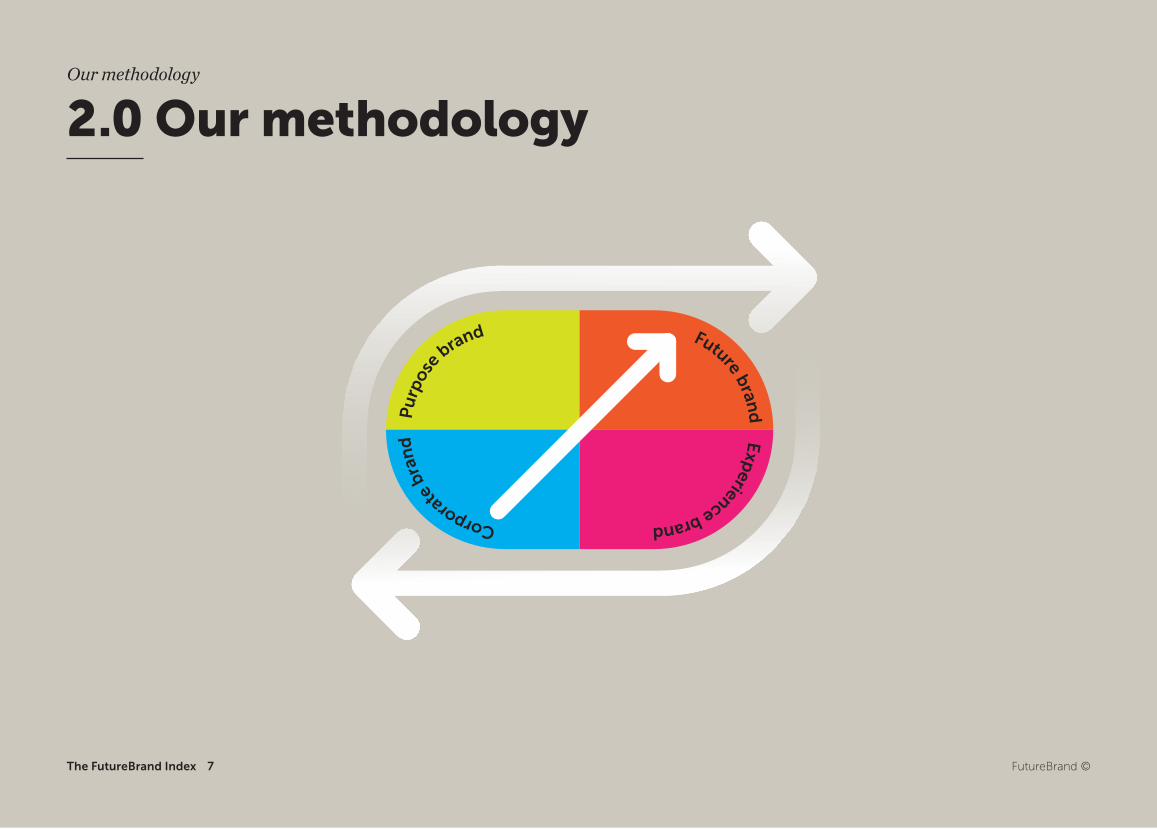
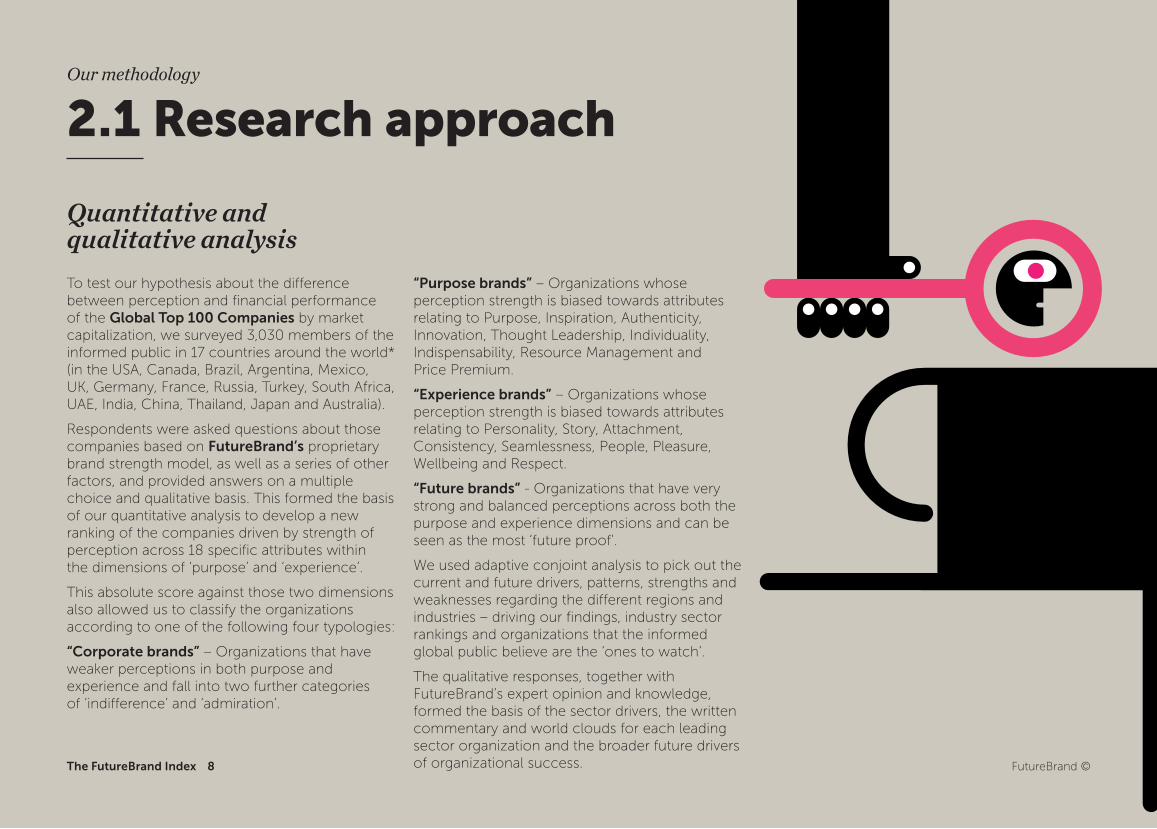
“Purpose brands” – Organizations whose perception strength is biased towards attributes relating to Purpose, Inspiration, Authenticity, Innovation, Thought Leadership, Individuality, Indispensability, Resource Management and Price Premium.
“Experience brands” – Organizations whose perception strength is biased towards attributes relating to Personality, Story, Attachment, Consistency, Seamlessness, People, Pleasure, Wellbeing and Respect.
“Future brands” - Organizations that have very strong and balanced perceptions across both the purpose and experience dimensions and can be seen as the most ‘future proof’.
We used adaptive conjoint analysis to pick out the current and future drivers, patterns, strengths and weaknesses regarding the different regions and industries – driving our findings, industry sector rankings and organizations that the informed global public believe are the ‘ones to watch’.
The qualitative responses, together with FutureBrand’s expert opinion and knowledge, formed the basis of the sector drivers, the written commentary and world clouds for each leading sector organization and the broader future drivers of organizational success.
Quantitative and qualitative analysisTo test our hypothesis about the difference between perception and financial performance of the Global Top 100 Companies by market capitalization, we surveyed 3,030 members of the informed public in 17 countries around the world* (in the USA, Canada, Brazil, Argentina, Mexico, UK, Germany, France, Russia, Turkey, South Africa, UAE, India, China, Thailand, Japan and Australia).
Respondents were asked questions about those companies based on FutureBrand’s proprietary brand strength model, as well as a series of other factors, and provided answers on a multiple choice and qualitative basis. This formed the basis of our quantitative analysis to develop a new ranking of the companies driven by strength of perception across 18 specific attributes within the dimensions of ‘purpose’ and ‘experience’.
This absolute score against those two dimensions also allowed us to classify the organizations according to one of the following four typologies:
“Corporate brands” – Organizations that have weaker perceptions in both purpose and experience and fall into two further categories of ‘indifference’ and ‘admiration’.
Our methodology
2.1 Research approach
FutureBrand ©
Quantitive& qualitive
analysis
The FutureBrand Index 9
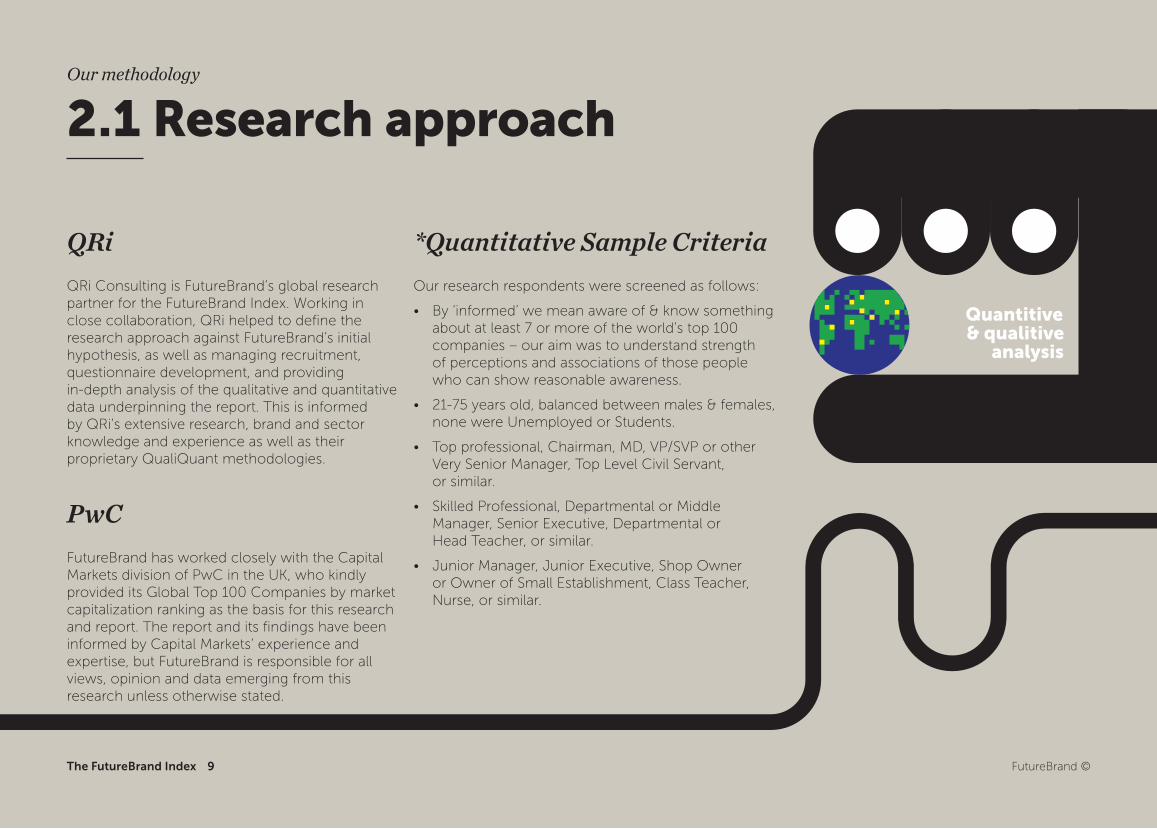
QRiQRi Consulting is FutureBrand’s global research partner for the FutureBrand Index. Working in close collaboration, QRi helped to define the research approach against FutureBrand’s initial hypothesis, as well as managing recruitment, questionnaire development, and providing in-depth analysis of the qualitative and quantitative data underpinning the report. This is informed by QRi’s extensive research, brand and sector knowledge and experience as well as their proprietary QualiQuant methodologies.
PwCFutureBrand has worked closely with the Capital Markets division of PwC in the UK, who kindly provided its Global Top 100 Companies by market capitalization ranking as the basis for this research and report. The report and its findings have been informed by Capital Markets’ experience and expertise, but FutureBrand is responsible for all views, opinion and data emerging from this research unless otherwise stated.
*Quantitative Sample CriteriaOur research respondents were screened as follows:
• By‘informed’wemeanawareof&knowsomethingabout at least 7 or more of the world’s top 100 companies – our aim was to understand strength of perceptions and associations of those people who can show reasonable awareness.
• 21-75yearsold,balancedbetweenmales&females,none were Unemployed or Students.
• Topprofessional,Chairman,MD,VP/SVPorother VerySeniorManager,TopLevelCivilServant, or similar.
• SkilledProfessional,DepartmentalorMiddle Manager, Senior Executive, Departmental or Head Teacher, or similar.
• JuniorManager,JuniorExecutive,ShopOwner or Owner of Small Establishment, Class Teacher, Nurse, or similar.
Our methodology
FutureBrand ©
2.1 Research approach
10 FutureBrand ©The FutureBrand Index
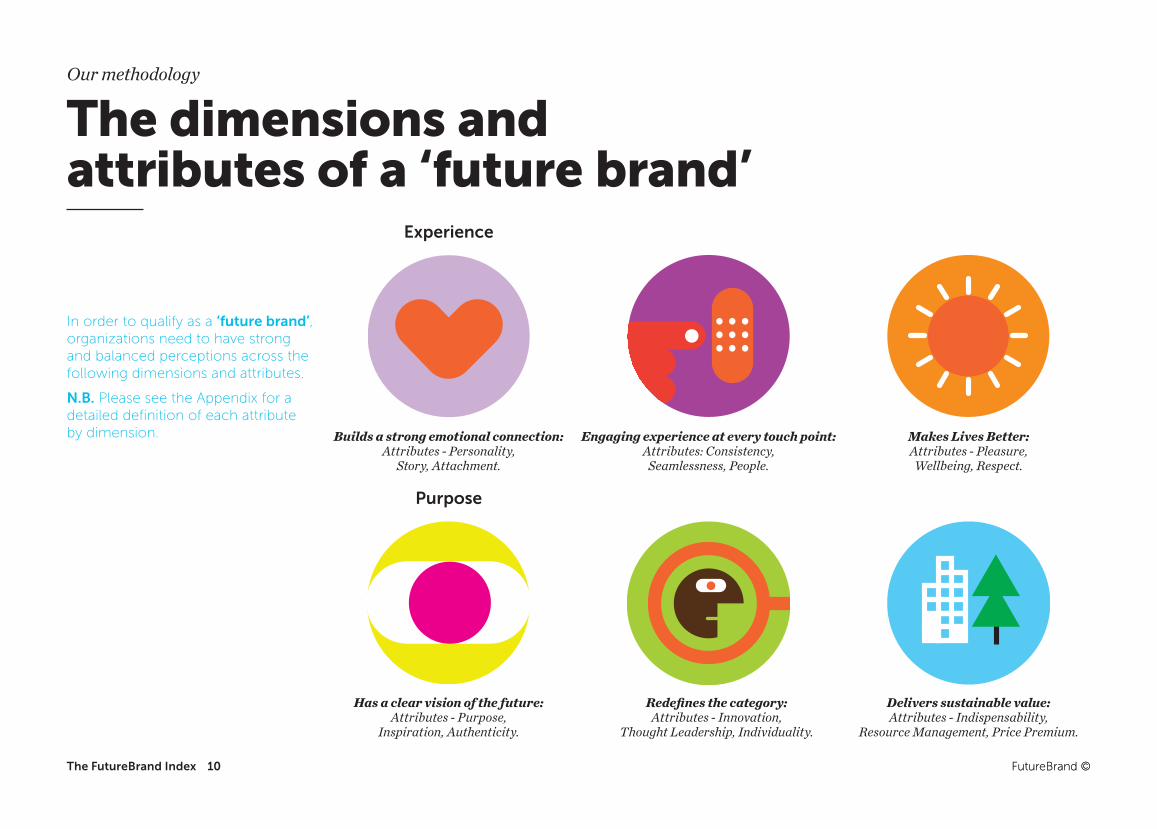
Experience
Builds a strong emotional connection: Attributes - Personality,
Story, Attachment.
Purpose
Has a clear vision of the future: Attributes - Purpose,
Inspiration, Authenticity.
Engaging experience at every touch point: Attributes: Consistency,
Seamlessness, People.
Redefines the category: Attributes - Innovation,
Thought Leadership, Individuality.
Makes Lives Better: Attributes - Pleasure,
Wellbeing, Respect.
Delivers sustainable value: Attributes - Indispensability,
Resource Management, Price Premium.
The dimensions and attributes of a ‘future brand’
In order to qualify as a ‘future brand’, organizations need to have strong and balanced perceptions across the following dimensions and attributes.
N.B. Please see the Appendix for a detailed definition of each attribute by dimension.
Our methodology
FutureBrand ©
Direntiation100
erentiation1
11
3.0 Global top 100 rankingsGlobal top 100 rankings
FutureBrand ©
100
1The FutureBrand Index
The FutureBrand Index 12 FutureBrand ©
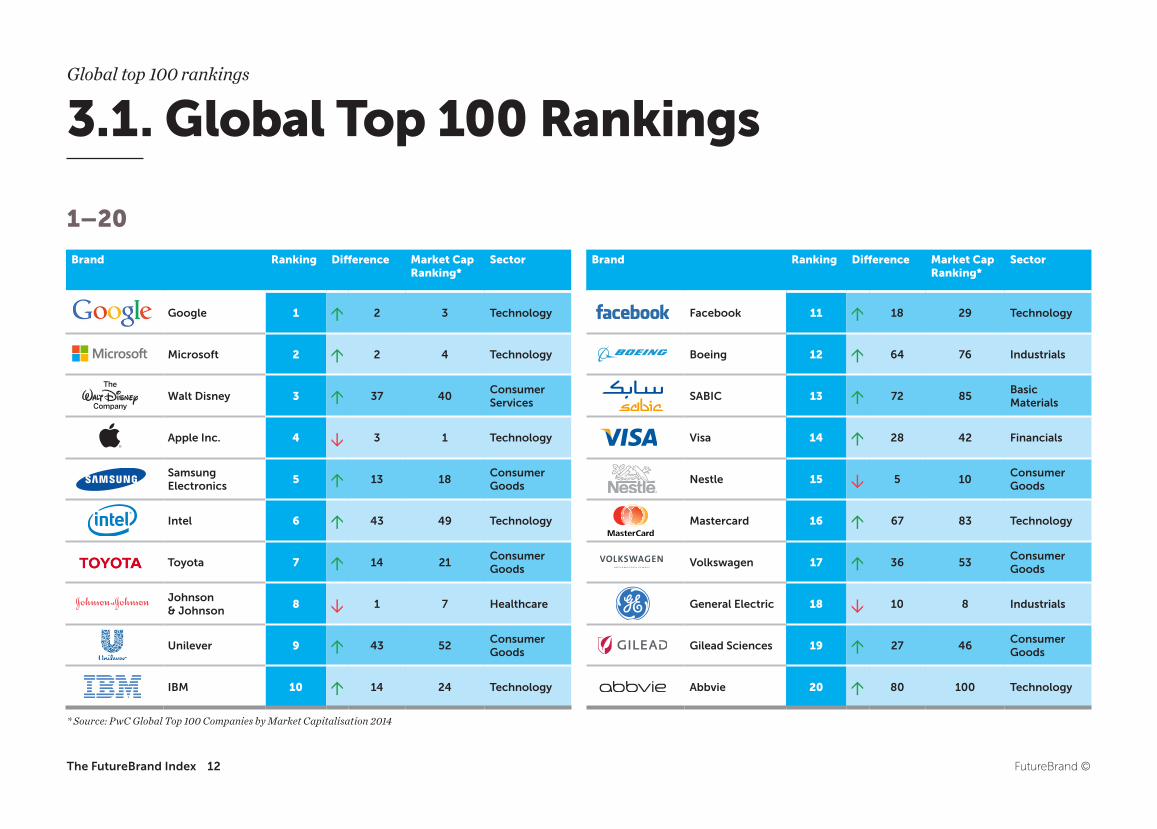
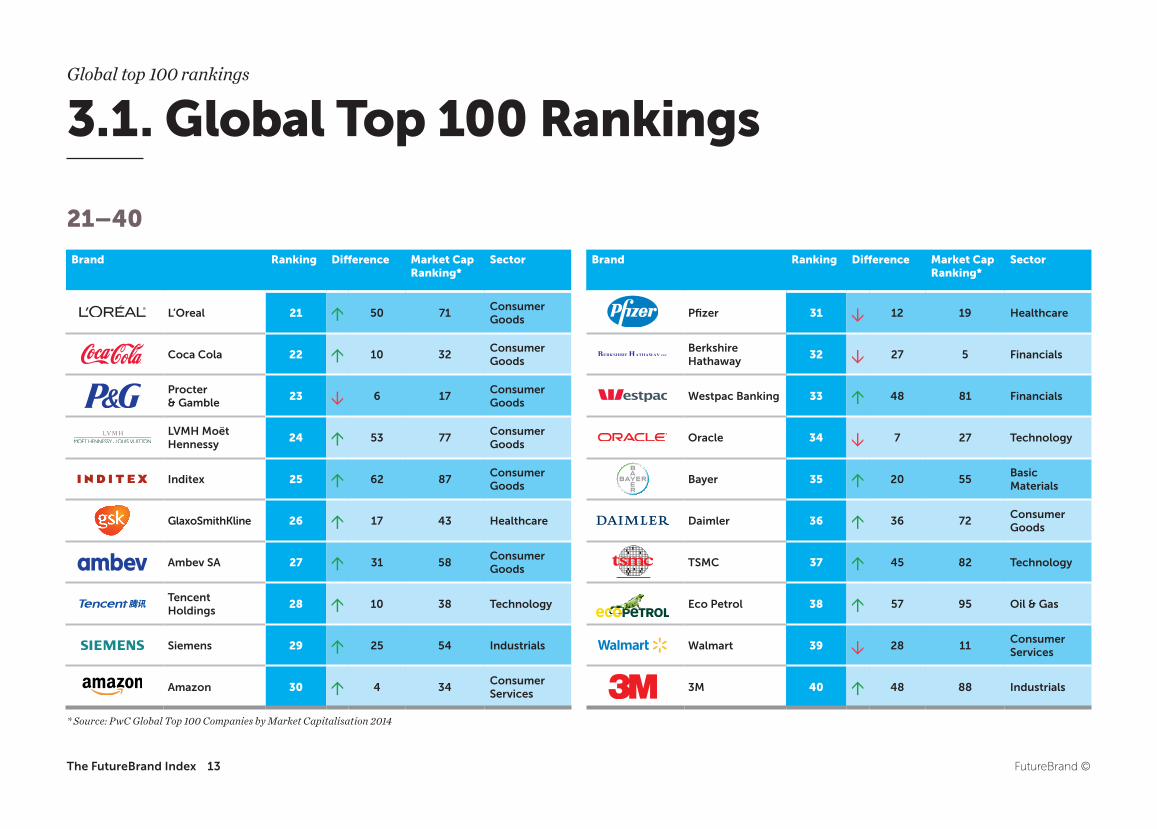
3.1. Global Top 100 RankingsGlobal top 100 rankings
1–20
* Source: PwC Global Top 100 Companies by Market Capitalisation 2014
Brand Ranking Difference Market Cap Ranking*
Sector
Google 1 2 3 Technology
Microsoft 2 2 4 Technology
Walt Disney 3 37 40Consumer Services
Apple Inc. 4 3 1 Technology
Samsung Electronics
5 13 18Consumer Goods
Intel 6 43 49 Technology
Toyota 7 14 21Consumer Goods
Johnson & Johnson
8 1 7 Healthcare
Unilever 9 43 52Consumer Goods
IBM 10 14 24 Technology
Brand Ranking Difference Market Cap Ranking*
Sector
Facebook 11 18 29 Technology
Boeing 12 64 76 Industrials
SABIC 13 72 85Basic Materials
Visa 14 28 42 Financials
Nestle 15 5 10Consumer Goods
Mastercard 16 67 83 Technology
Volkswagen 17 36 53Consumer Goods
General Electric 18 10 8 Industrials
Gilead Sciences 19 27 46Consumer Goods
Abbvie 20 80 100 Technology
The FutureBrand Index 13 FutureBrand ©
21–40
* Source: PwC Global Top 100 Companies by Market Capitalisation 2014
Brand Ranking Difference Market Cap Ranking*
Sector
L’Oreal 21 50 71Consumer Goods
Coca Cola 22 10 32Consumer Goods
Procter & Gamble
23 6 17Consumer Goods
LVMH Moët Hennessy
24 53 77Consumer Goods
Inditex 25 62 87Consumer Goods
GlaxoSmithKline 26 17 43 Healthcare
Ambev SA 27 31 58Consumer Goods
Tencent Holdings
28 10 38 Technology
Siemens 29 25 54 Industrials
Amazon 30 4 34Consumer Services
Brand Ranking Difference Market Cap Ranking*
Sector
Pfizer 31 12 19 Healthcare
Berkshire Hathaway
32 27 5 Financials
Westpac Banking 33 48 81 Financials
Oracle 34 7 27 Technology
Bayer 35 20 55Basic Materials
Daimler 36 36 72Consumer Goods
TSMC 37 45 82 Technology
Eco Petrol 38 57 95 Oil & Gas
Walmart 39 28 11Consumer Services
3M 40 48 88 Industrials
3.1. Global Top 100 RankingsGlobal top 100 rankings
The FutureBrand Index 14 FutureBrand ©
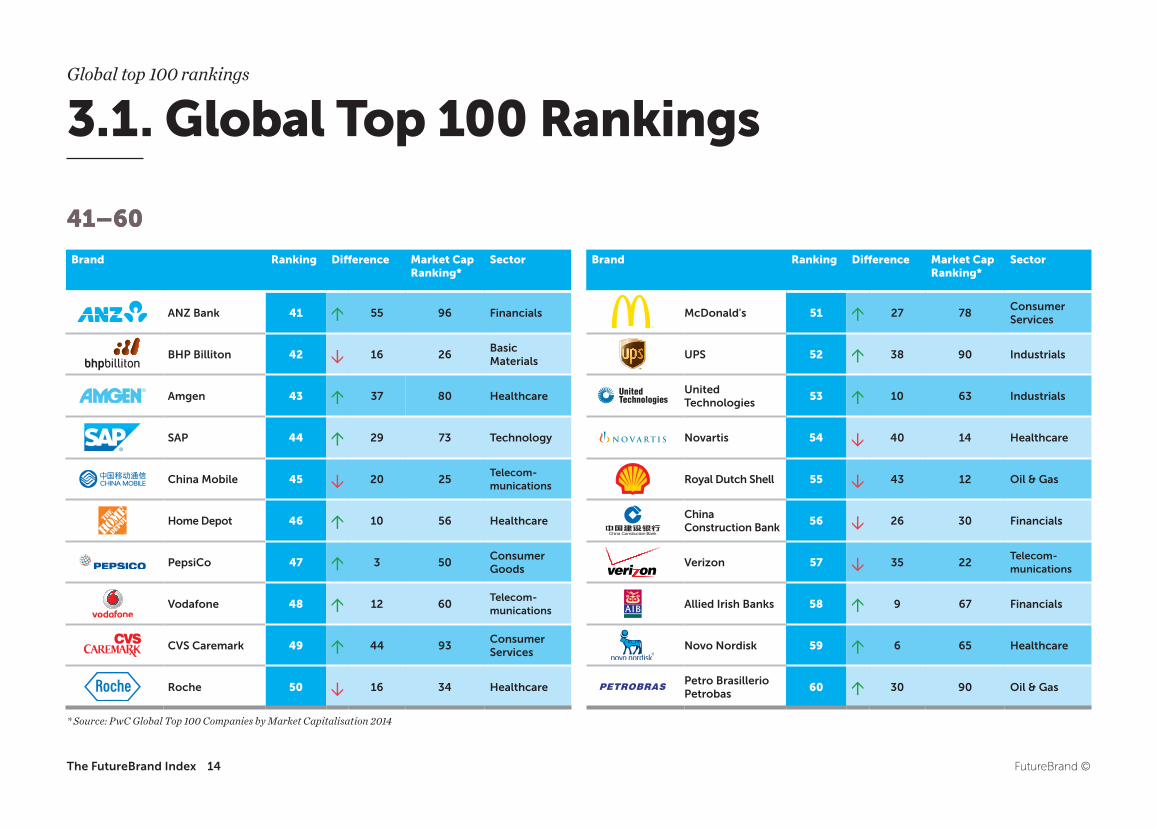
41–60
3.1. Global Top 100 RankingsGlobal top 100 rankings
41–60
Brand Ranking Difference Market Cap Ranking*
Sector
ANZ Bank 41 55 96 Financials
BHP Billiton 42 16 26Basic Materials
Amgen 43 37 80 Healthcare
SAP 44 29 73 Technology
China Mobile 45 20 25Telecom- munications
Home Depot 46 10 56 Healthcare
PepsiCo 47 3 50Consumer Goods
Vodafone 48 12 60Telecom- munications
CVS Caremark 49 44 93Consumer Services
Roche 50 16 34 Healthcare
Brand Ranking Difference Market Cap Ranking*
Sector
McDonald's 51 27 78Consumer Services
UPS 52 38 90 Industrials
United Technologies
53 10 63 Industrials
Novartis 54 40 14 Healthcare
Royal Dutch Shell 55 43 12 Oil & Gas
China Construction Bank
56 26 30 Financials
Verizon 57 35 22Telecom- munications
Allied Irish Banks 58 9 67 Financials
Novo Nordisk 59 6 65 Healthcare
Petro Brasillerio Petrobas
60 30 90 Oil & Gas
* Source: PwC Global Top 100 Companies by Market Capitalisation 2014
The FutureBrand Index 15 FutureBrand ©
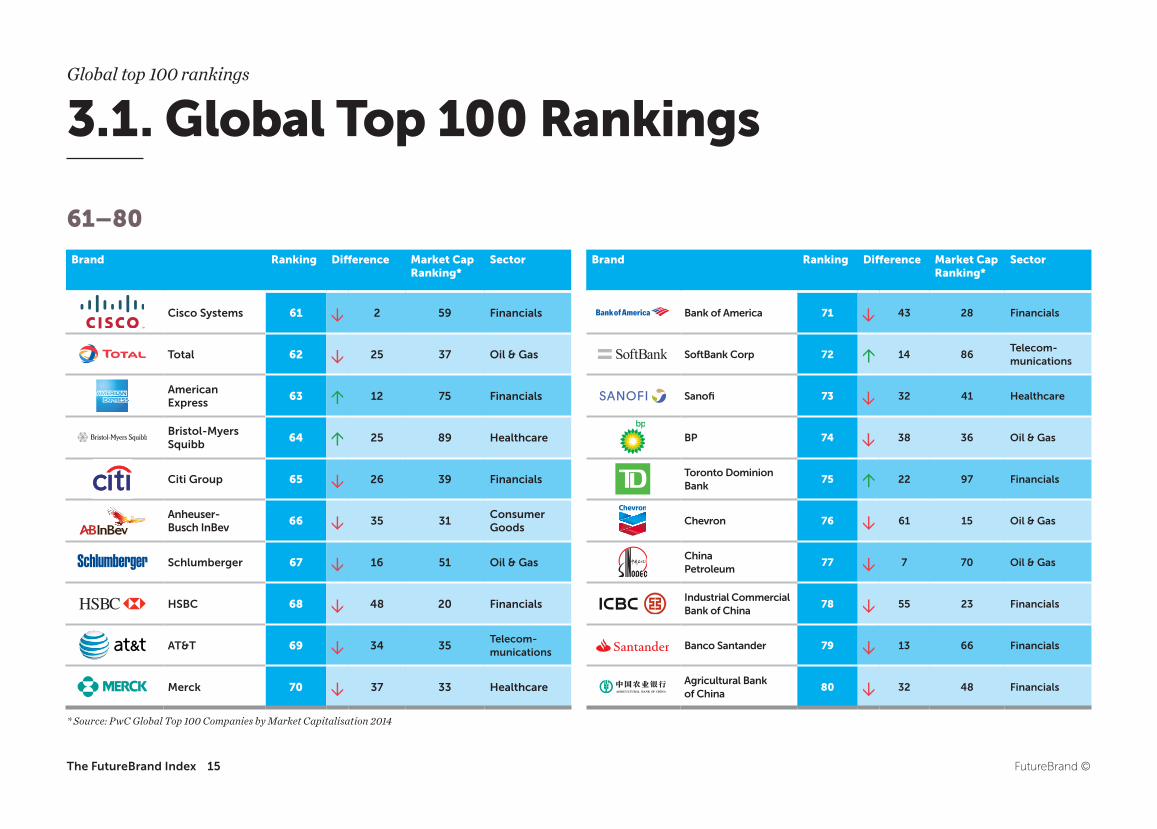
61–80
* Source: PwC Global Top 100 Companies by Market Capitalisation 2014
Brand Ranking Difference Market Cap Ranking*
Sector
Cisco Systems 61 2 59 Financials
Total 62 25 37 Oil & Gas
American Express
63 12 75 Financials
Bristol-Myers Squibb
64 25 89 Healthcare
Citi Group 65 26 39 Financials
Anheuser- Busch InBev
66 35 31Consumer Goods
Schlumberger 67 16 51 Oil & Gas
HSBC 68 48 20 Financials
AT&T 69 34 35Telecom- munications
Merck 70 37 33 Healthcare
Brand Ranking Difference Market Cap Ranking*
Sector
Bank of America 71 43 28 Financials
SoftBank Corp 72 14 86Telecom- munications
Sanofi 73 32 41 Healthcare
BP 74 38 36 Oil & Gas
Toronto Dominion Bank
75 22 97 Financials
Chevron 76 61 15 Oil & Gas
China Petroleum
77 7 70 Oil & Gas
Industrial Commercial Bank of China
78 55 23 Financials
Banco Santander 79 13 66 Financials
Agricultural Bank of China
80 32 48 Financials
3.1. Global Top 100 RankingsGlobal top 100 rankings
The FutureBrand Index 16 FutureBrand ©
3.1. Global Top 100 RankingsGlobal top 100 rankings
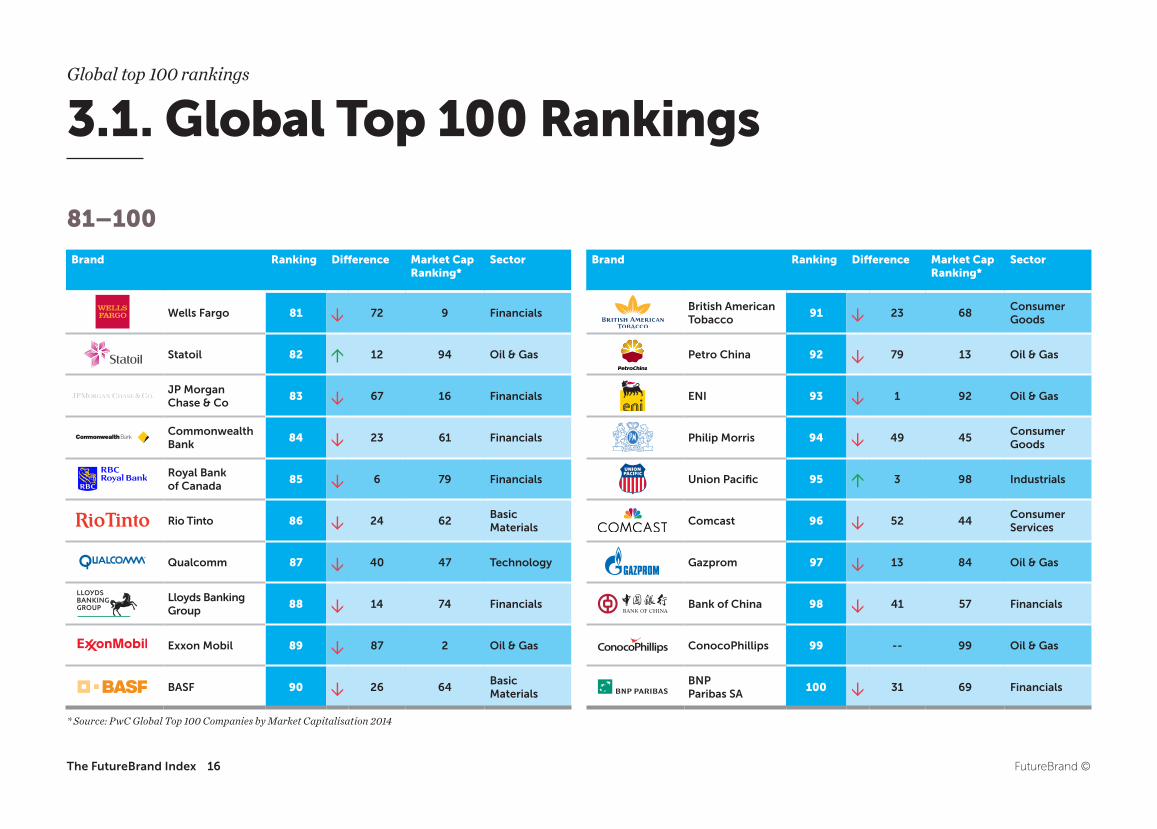
81–100
* Source: PwC Global Top 100 Companies by Market Capitalisation 2014
Brand Ranking Difference Market Cap Ranking*
Sector
Wells Fargo 81 72 9 Financials
Statoil 82 12 94 Oil & Gas
JP Morgan Chase & Co
83 67 16 Financials
Commonwealth Bank
84 23 61 Financials
Royal Bank of Canada
85 6 79 Financials
Rio Tinto 86 24 62Basic Materials
Qualcomm 87 40 47 Technology
Lloyds Banking Group
88 14 74 Financials
Exxon Mobil 89 87 2 Oil & Gas
BASF 90 26 64Basic Materials
Brand Ranking Difference Market Cap Ranking*
Sector
British American Tobacco
91 23 68Consumer Goods
Petro China 92 79 13 Oil & Gas
ENI 93 1 92 Oil & Gas
Philip Morris 94 49 45Consumer Goods
Union Pacific 95 3 98 Industrials
Comcast 96 52 44Consumer Services
Gazprom 97 13 84 Oil & Gas
Bank of China 98 41 57 Financials
ConocoPhillips 99 -- 99 Oil & Gas
BNP Paribas SA
100 31 69 Financials
Vs.
BRAND
FutureBrand ©The FutureBrand Index 17
3.2 Key findings
1. Financial value and past performance are no guarantee of future brand strength.
The first and most striking finding from our research is that a high market capitalization does not always correlate with strong perceptions across our dimensions. In fact, some of the largest organizations by market capitalization have some of the weakest perceptions, and vice versa. For example, Exxon Mobil is currently ranked at number two by market capitalization, but is at 89th position in the FutureBrand Index. Less dramatic but significant ranking differences include JP Morgan and Petrochina. Alternatively, there are some organizations whose strength of perception is significantly higher than their financial strength, led by Walt Disney but also including Intel, Sabic, L’Oreal and Abbvie which benefits from the largest ranking differential of 80 places.
Some of these differences are perhaps reflective of broader sector challenges, for example the rankings for JP Morgan and PetroChina are typical of the kinds of differences we see in the financial and oil and gas industries as a whole. However, there is sufficient diversity in the top and bottom performers to indicate that some organizations are doing a better job of managing perception than others.
Global top 100 rankings
FutureBrand ©The FutureBrand Index 18
2. Being global makes a difference to brand strength.
Regardless of financial strength, organizations that are better known in individual markets, or which depend on fewer markets for their commercial success, tend to suffer from weaker perceptions in our study. And the best performers tend to be genuinely global, including most of the top 20 in our ranking. Of those organizations, 14 are American international companies, which shows that the USA still dominates the global corporate stage in terms of strength of perception, although being American on its own does not guarantee a high ranking. Wells Fargo is 9th by market capitalization globally, but drops to 81st position in our public perception rankings, and Bank of America is 71st. Similarly, perception strength does not seem to be restricted to specific sectors, with representation across every category in the top twenty except telecommunications, suggesting that global reach is as much a driver of perception strength as membership of a particular industry.
3. The value-perception gap for brands varies by sector.
Whilst the top 20 organizations tend to be global, and are distributed across the industries, it is clear that the value-perception gap is different by sector across the top 100, and some sectors perform more strongly than others. For example, financial and oil and gas companies tend to dominate the top 30% by market capitalization, but largely appear in the bottom 30% by strength of perception. 7 of the bottom 20 organisations in the FutureBrand Index are banks, and 6 are in Oil and Gas, and two of the bottom ten are tobacco companies, despite being in the top two thirds by capitalization. Conversely, technology and consumer services and goods companies dominate the FutureBrand Index top 10 and the market capitalization rankings, with a particular focus on consumer electronics, FMCG, software and entertainment.
This reflects a broader reputational challenge for certain sectors as a whole – particularly banking in the wake of the global financial crisis – that seems to have a correlation to perceptions of individual organizations. It is as if people are unable to separate organizational perception from sector perception. There are some exceptions to this rule, including Eco Petrol in the Oil and Gas sectorthatis57placeshigherintheIndexrankingthan its financial position. So whilst it is certainly possible, it would appear that few organizations have managed to challenge or break out of their category positioning to stand for something new in the eyes of the public – a possible opportunity for companies keen to differentiate, or that have a genuine difference they are not being given credit for.
Global top 100 rankings
3.2 Key findings
FutureBrand ©The FutureBrand Index 19
4. Brand awareness is not enough to drive strong perceptions.
A further striking finding of the research is that some of the most famous household name organizations that share their corporate name with their most famous product are outperformed in strength of perception by companies with significantly lower awareness. For example, whilst Coca-Cola (22), PepsiCo (47) andMcDonald's(51)allenjoyahigherrankinginthe FutureBrand Index than their market cap position, they are still lower than more niche or anonymous organizations without the same high levels of public awareness, like Sabic (in 13th position) in Basic Materials, and Gilead and Abbvie (respectively 19th and 20th overall) in the Healthcare sector. Other organizations that have significant public awareness through global advertising and reach like HSBC, or exposure through international events and longevity like BP, enjoy a lower strength of perception ranking in our research than their market capitalization position. This perhaps correlates again to negative or weaker perceptions of their sector overall, or individual reputational issues, but it presumably cannot be reduced to these factors alone given the often difficult reputation
challenges faced by pharmaceutical companies and their relatively strong performance in the Index overall. It also perhaps reflects a broader public preoccupation with consumer electronics and internet services organizations that have come to dominate the global discourse around consumption in the last decade, perhaps overshadowing their still popular but less relevant counterparts in food and beverage – hinting that Google and Apple are the Coca-Cola and McDonald’s of the 21st century.
Global top 100 rankings
3.2 Key findings
FutureBrand ©The FutureBrand Index 20
5. Chinese companies and brands are not yet future proof.
The only two Chinese companies in the top half of the FutureBrand Index ranking are Tencent (28th)andChinaMobile(45th), with four of the remaining five falling into the bottom quartile, including ICBC (78th) and PetroChina (98th), which are55and79positionslowerthantheirmarketcap ranking respectively. Unlike the majority of American International companies that have genuinely global reach, it is arguable that whilst the largest Chinese organizations are undoubtedly financially strong – reflecting China’s vast consumer market, growth and economic position – they do not yet have strong global perceptions. As a result, they are not as future proof, or as insulated by strong reputation, as their East Asian counterparts like Samsung and Toyota that genuinely address global markets and sell products and services to customers worldwide. Toyota is a good example of how brand strength can provide some insulation against commercial difficulties, given its position in the top 10 by perception at a time of global product recalls.
However, whilst this might be true now, it is likely that as Chinese organizations expand into new markets across Asia and beyond, they will begin to benefit from the same awareness as their better-established global counterparts. We see this in our ‘ones to watch’ forecasts with two of the eight organisations seen to be ‘moving forward’ in three years time being Chinese. The key will be how well these companies manage perception and attend to the balance of purpose and experience, to ensure they are not just financially strong and secure across markets, but that they are the kind of companies people want to work for, and for whose products and services they are prepared to pay a premium.
Global top 100 rankings
3.2 Key findings
FutureBrand ©21
What is a future brand and why does it matter?
4.0 What is a future brand and why does it matter?
The FutureBrand Index
PUR
POSE
EX
PE
RIE
NC
E
FutureBrand ©The FutureBrand Index 22
What is a future brand and why does it matter ?
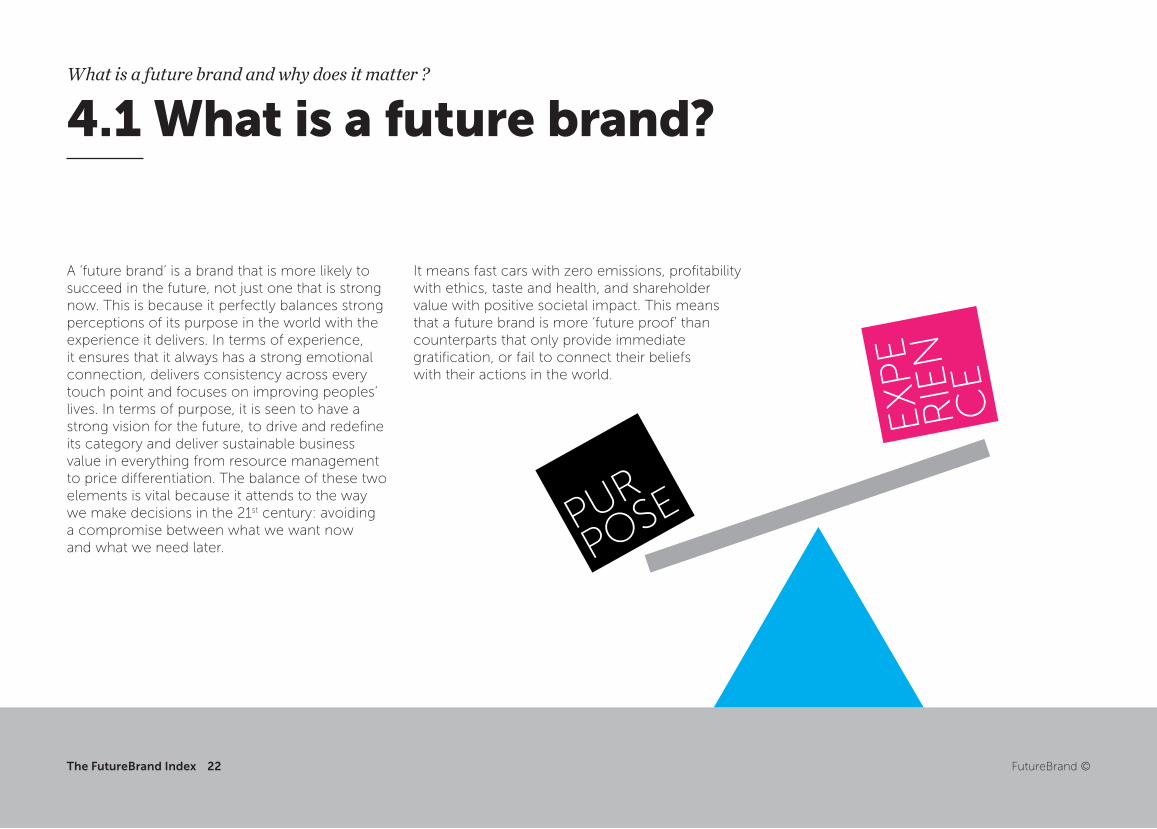
A ‘future brand’ is a brand that is more likely to succeed in the future, not just one that is strong now. This is because it perfectly balances strong perceptions of its purpose in the world with the experience it delivers. In terms of experience, it ensures that it always has a strong emotional connection, delivers consistency across every touch point and focuses on improving peoples’ lives. In terms of purpose, it is seen to have a strong vision for the future, to drive and redefine its category and deliver sustainable business value in everything from resource management to price differentiation. The balance of these two elements is vital because it attends to the way we make decisions in the 21st century: avoiding a compromise between what we want now and what we need later.
It means fast cars with zero emissions, profitability with ethics, taste and health, and shareholder value with positive societal impact. This means that a future brand is more ‘future proof’ than counterparts that only provide immediate gratification, or fail to connect their beliefs with their actions in the world.
4.1 What is a future brand?
0 %
10 %
20 %
30 %
40 %
50 %
60 %
I would like to work for this company 24% Average
I would buy products & services from this company 31% Average
‘Future brands’Would work for and buy products/services
‘Corporate brands’Would work for and buy products/services
0 %
10 %
20 %
30 %
40 %
50 %
60 %
I would like to work for this company 24% Average
I would buy products & services from this company 31% Average
FutureBrand ©The FutureBrand Index 23
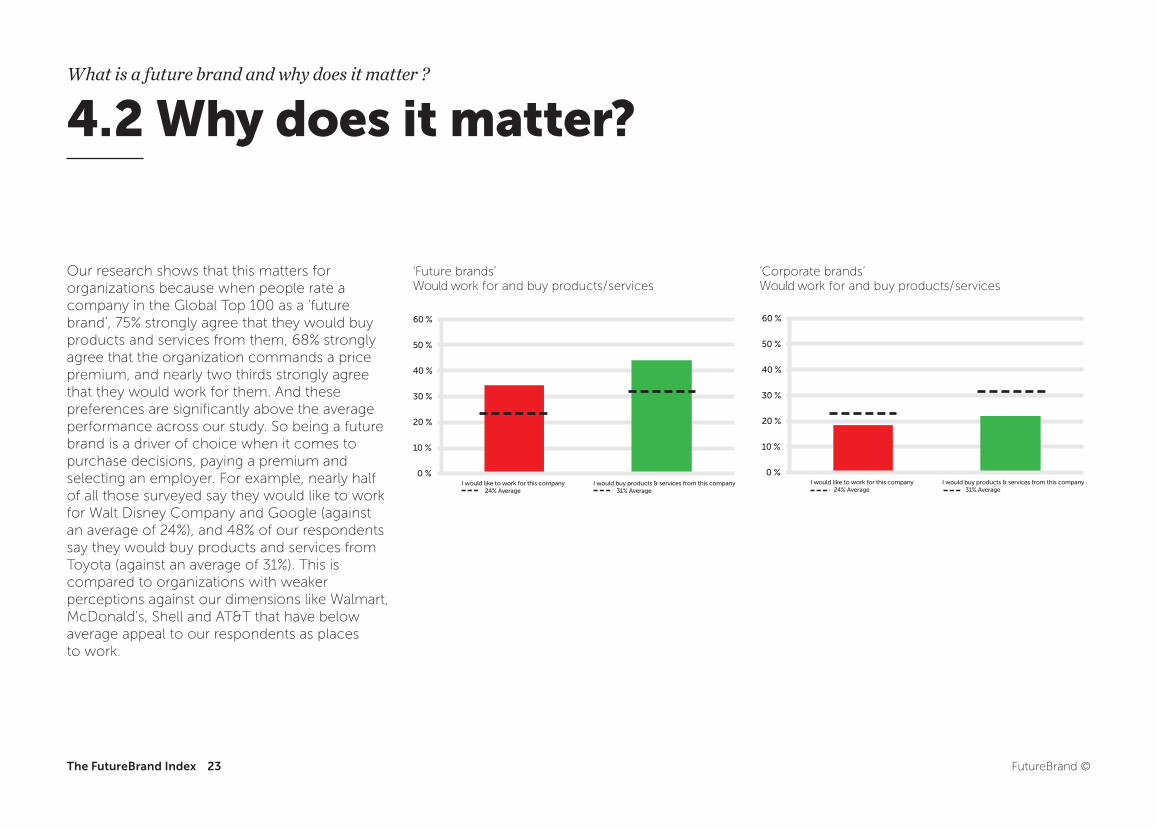
Our research shows that this matters for organizations because when people rate a company in the Global Top 100 as a ‘future brand’,75%stronglyagreethattheywouldbuyproducts and services from them, 68% strongly agree that the organization commands a price premium, and nearly two thirds strongly agree that they would work for them. And these preferences are significantly above the average performance across our study. So being a future brand is a driver of choice when it comes to purchase decisions, paying a premium and selecting an employer. For example, nearly half of all those surveyed say they would like to work for Walt Disney Company and Google (against an average of 24%), and 48% of our respondents say they would buy products and services from Toyota (against an average of 31%). This is compared to organizations with weaker perceptions against our dimensions like Walmart, McDonald’s,ShellandAT&Tthathavebelowaverage appeal to our respondents as places to work.
4.2 Why does it matter?What is a future brand and why does it matter ?
24
INNOVATION
THOUGHT AUTHENTICITYLEADERSHIP
THE
KEY DRIVERS OF A FUTURE BRAND
The FutureBrand Index FutureBrand ©
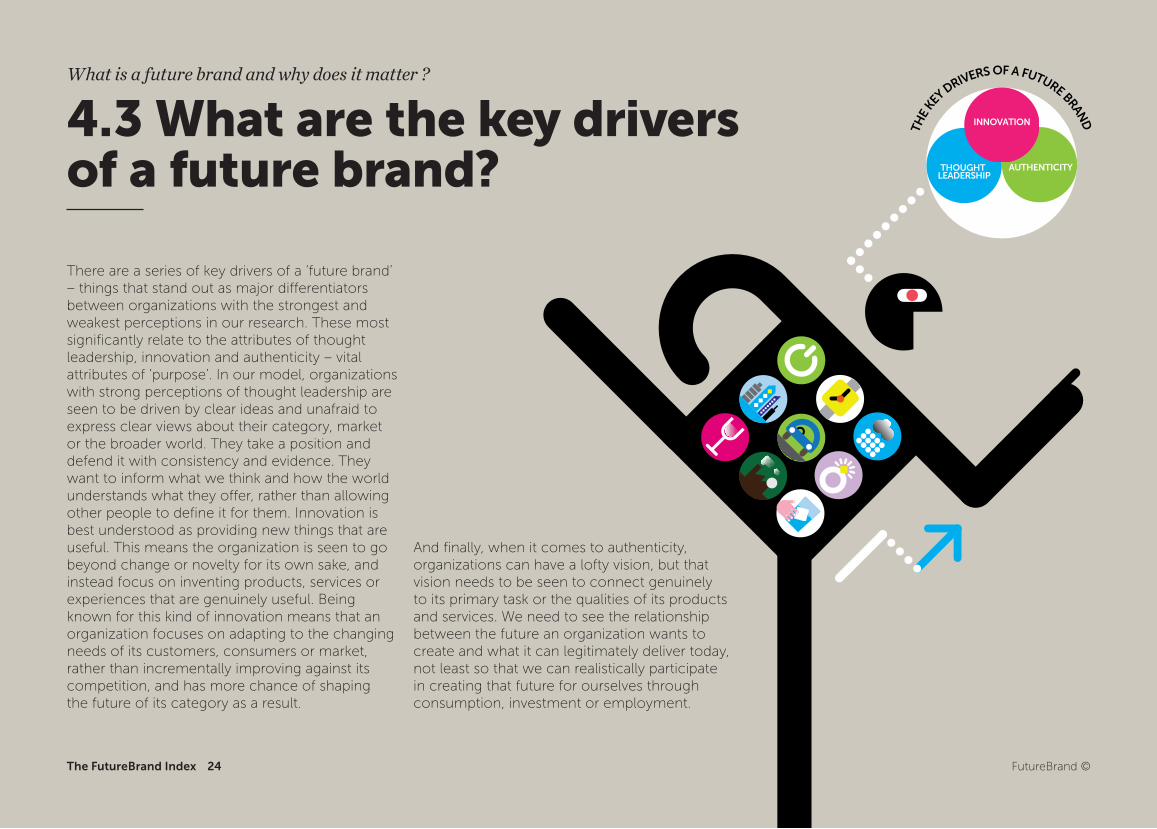
There are a series of key drivers of a ‘future brand’ – things that stand out as major differentiators between organizations with the strongest and weakest perceptions in our research. These most significantly relate to the attributes of thought leadership, innovation and authenticity – vital attributes of ‘purpose’. In our model, organizations with strong perceptions of thought leadership are seen to be driven by clear ideas and unafraid to express clear views about their category, market or the broader world. They take a position and defend it with consistency and evidence. They want to inform what we think and how the world understands what they offer, rather than allowing other people to define it for them. Innovation is best understood as providing new things that are useful. This means the organization is seen to go beyond change or novelty for its own sake, and instead focus on inventing products, services or experiences that are genuinely useful. Being known for this kind of innovation means that an organization focuses on adapting to the changing needs of its customers, consumers or market, rather than incrementally improving against its competition, and has more chance of shaping the future of its category as a result.
And finally, when it comes to authenticity, organizations can have a lofty vision, but that vision needs to be seen to connect genuinely to its primary task or the qualities of its products and services. We need to see the relationship between the future an organization wants to create and what it can legitimately deliver today, not least so that we can realistically participate in creating that future for ourselves through consumption, investment or employment.
4.3 What are the key drivers of a future brand?
What is a future brand and why does it matter ?
24
25
FutureBrand ©The FutureBrand Index
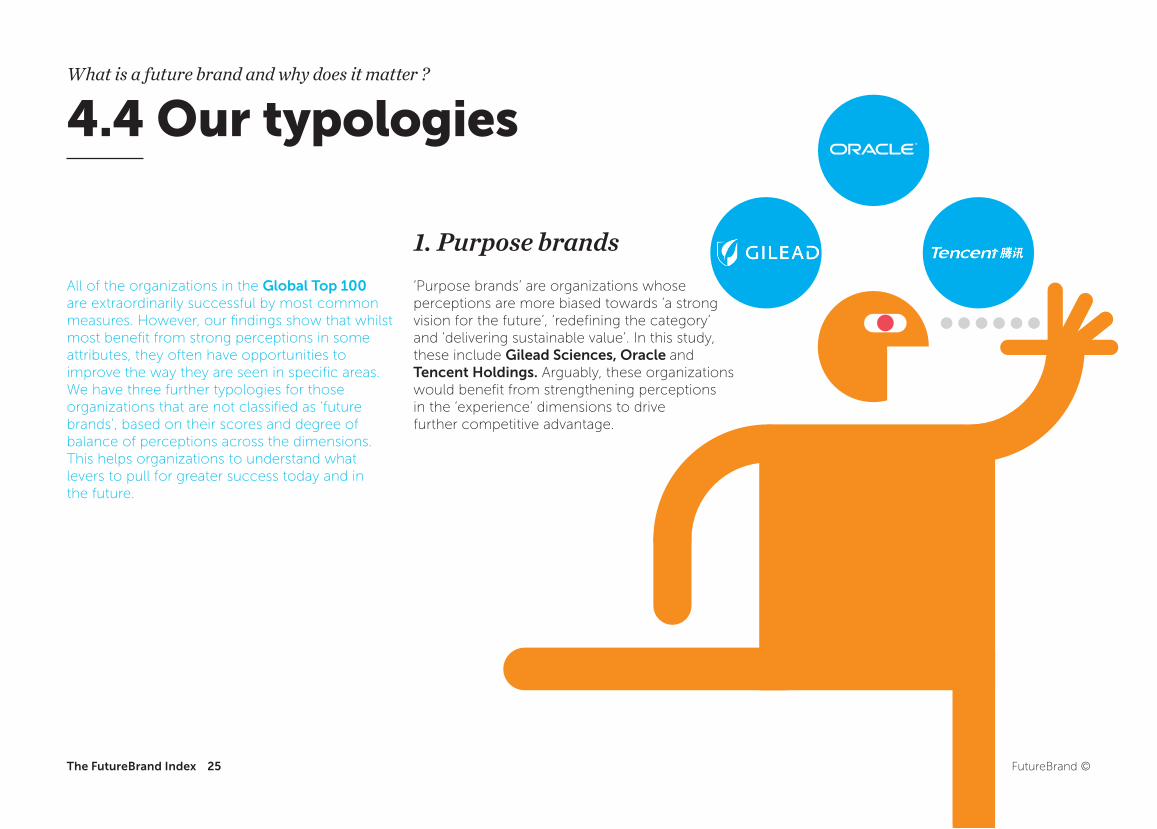
All of the organizations in the Global Top 100 are extraordinarily successful by most common measures. However, our findings show that whilst most benefit from strong perceptions in some attributes, they often have opportunities to improve the way they are seen in specific areas. We have three further typologies for those organizations that are not classified as ‘future brands’, based on their scores and degree of balance of perceptions across the dimensions. This helps organizations to understand what levers to pull for greater success today and in the future.
4.4 Our typologies
1. Purpose brands‘Purpose brands’ are organizations whose perceptions are more biased towards ‘a strong vision for the future’, ‘redefining the category’ and ‘delivering sustainable value’. In this study, these include Gilead Sciences, Oracle and Tencent Holdings. Arguably, these organizations would benefit from strengthening perceptions in the ‘experience’ dimensions to drive further competitive advantage.
What is a future brand and why does it matter ?
26 FutureBrand ©The FutureBrand Index
4.4 Our typologies
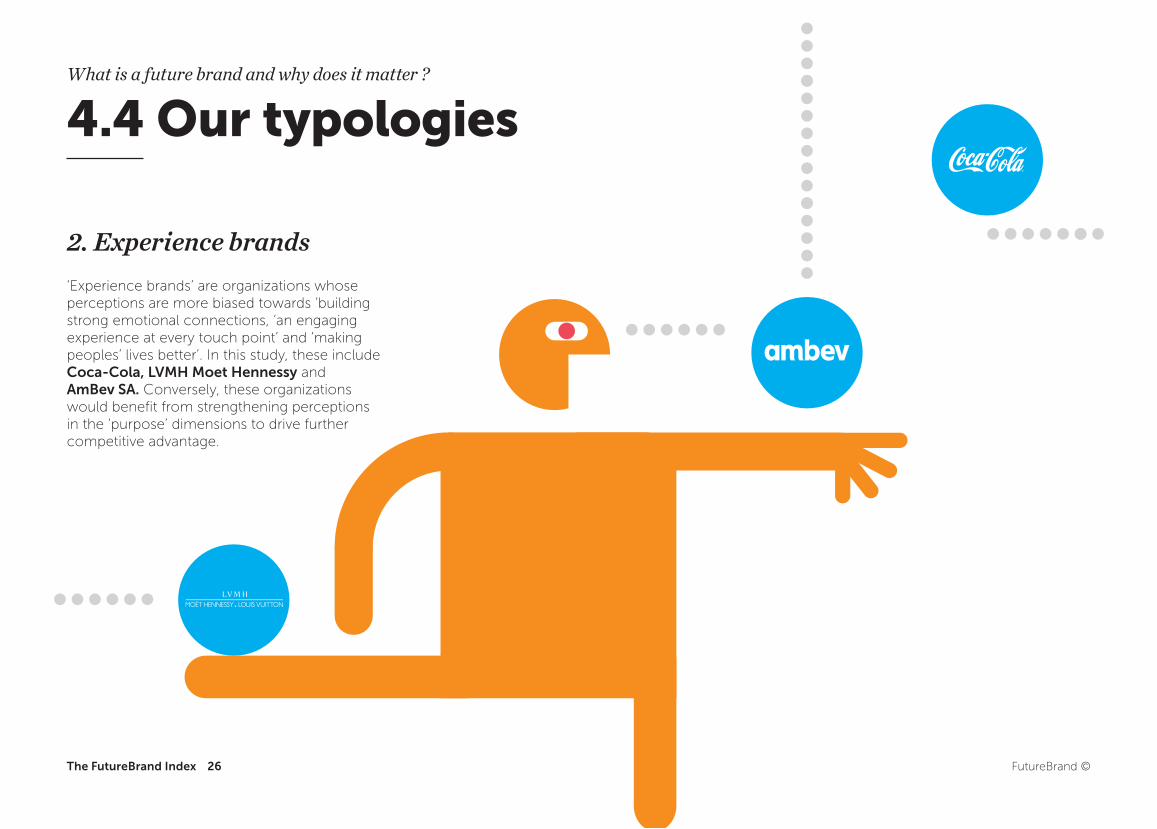
2. Experience brands‘Experience brands’ are organizations whose perceptions are more biased towards ‘building strong emotional connections, ‘an engaging experience at every touch point’ and ‘making peoples’ lives better’. In this study, these include Coca-Cola, LVMH Moet Hennessy and AmBev SA. Conversely, these organizations would benefit from strengthening perceptions in the ‘purpose’ dimensions to drive further competitive advantage.
What is a future brand and why does it matter ?
27 FutureBrand ©
4.4 Our typologies
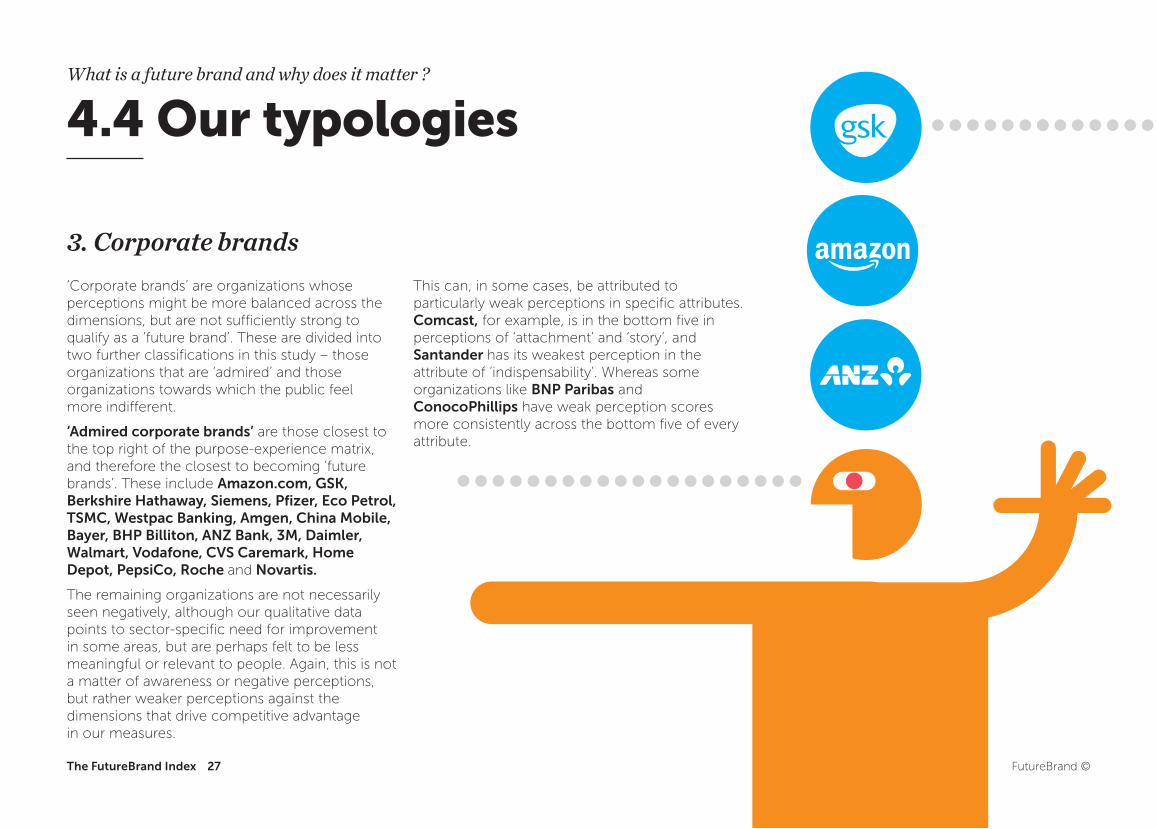
3. Corporate brands ‘Corporate brands’ are organizations whose perceptions might be more balanced across the dimensions, but are not sufficiently strong to qualify as a ‘future brand’. These are divided into two further classifications in this study – those organizations that are ‘admired’ and those organizations towards which the public feel more indifferent.
‘Admired corporate brands’ are those closest to the top right of the purpose-experience matrix, and therefore the closest to becoming ‘future brands’. These include Amazon.com, GSK, Berkshire Hathaway, Siemens, Pfizer, Eco Petrol, TSMC, Westpac Banking, Amgen, China Mobile, Bayer, BHP Billiton, ANZ Bank, 3M, Daimler, Walmart, Vodafone, CVS Caremark, Home Depot, PepsiCo, Roche and Novartis.
The remaining organizations are not necessarily seen negatively, although our qualitative data points to sector-specific need for improvement in some areas, but are perhaps felt to be less meaningful or relevant to people. Again, this is not a matter of awareness or negative perceptions, but rather weaker perceptions against the dimensions that drive competitive advantage in our measures.
This can, in some cases, be attributed to particularly weak perceptions in specific attributes. Comcast, for example, is in the bottom five in perceptions of ‘attachment’ and ‘story’, and Santander has its weakest perception in the attribute of ‘indispensability’. Whereas some organizations like BNP Paribas and ConocoPhillips have weak perception scores more consistently across the bottom five of every attribute.
What is a future brand and why does it matter ?
The FutureBrand Index
28 FutureBrand ©The FutureBrand Index
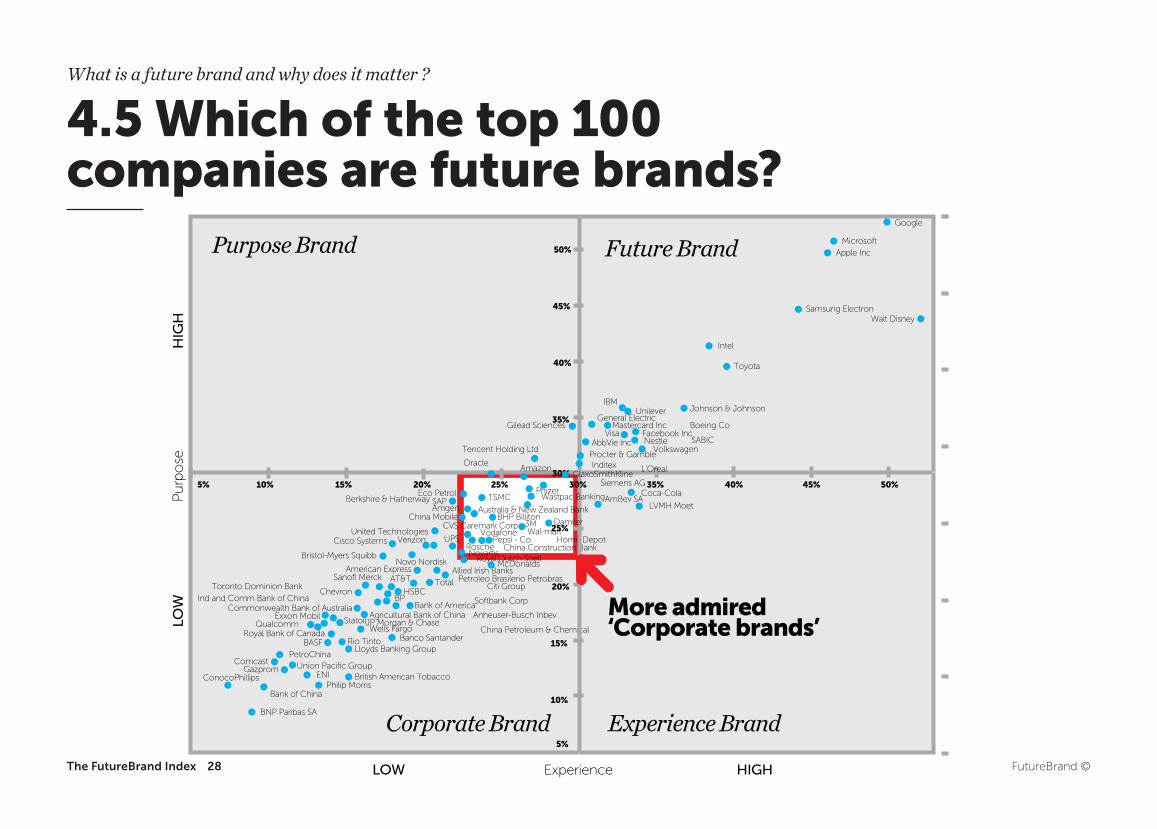
4.5 Which of the top 100 companies are future brands?
Toronto Dominion Bank
BASF
Ind and Comm Bank of ChinaCommonwealth Bank of Australia
Exxon Mobil
Rio Tinto
ENIPhilip Morris
Lloyds Banking GroupPetroChina
Union Pacific GroupBritish American Tobacco
Bank of China
BNP Paribas SA
QualcommRoyal Bank of Canada
ComcastGazprom
ConocoPhillips
Bank of America
Citi GroupTotal
China Petroleum & Chemical
Softbank Corp
Novo Nordisk
Verizon
Anheuser-Busch Inbev
AT&T
HSBC
Agricultural Bank of China
BP
Allied Irish Banks
Banco SantanderWells Fargo
Petroleo Brasilerio PetrobrasAmerican Express
Sanofi Merck
Chevron
United TechnologiesCisco Systems
Bristol-Myers SquibbMcDonalds
Oracle
Berkshire & Hatherway
Vodafone
Eco PetrolSAP TSMC
China MobileAmgen
BHP Billiton
PhizerSiemens AG
Wal-martHome DepotPepsi - Co
China Construction Bank
Coca-ColaAmBev SA
CVS Caremark Corp 3M
Tencent Holding Ltd
Intel
IBM
Toyota
Gilead Sciences
Johnson & JohnsonUnilever
VisaMastercard Inc
General ElectricBoeing Co
Facebook IncAbbVie Inc SABICNestle
VolkswagenProcter & GambleInditex
Walt Disney
Apple Inc
Microsoft
Samsung Electron
JP Morgan & ChaseStatoil
UPSRosche
Royal Dutch ShellNovartis
LVMH Moet
50%
45%
40%
35%
30%
25%
20%
15%
10%
5%
35% 40% 45% 50%15% 20% 25% 30%5% 10%
Purp
ose
Experience LOW HIGH
LOW
HIG
H
Corporate Brand Experience Brand
Purpose Brand Future Brand
More admired ‘Corporate brands’
Damiler
AmazonGlaxoSmithKline
Australia & New Zealand Bank
Wastpac Banking
L’Oreal
What is a future brand and why does it matter ?
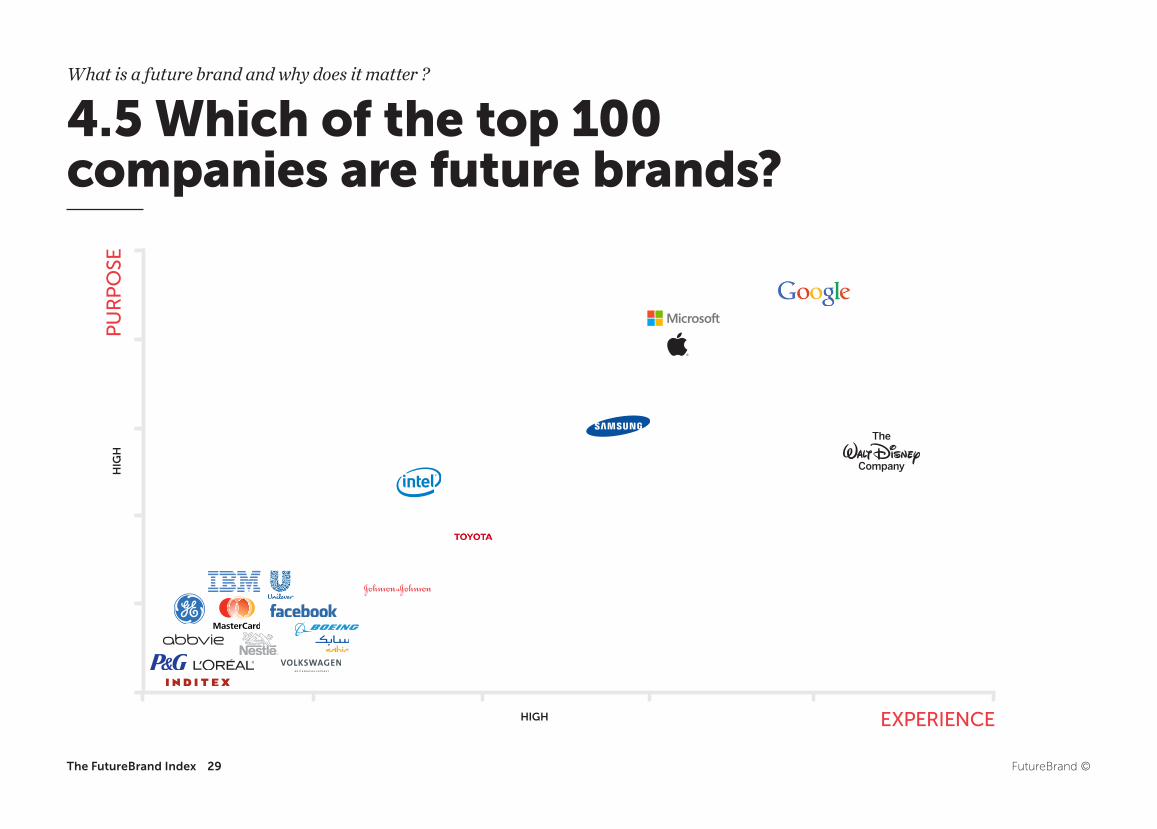
29 FutureBrand ©The FutureBrand Index
4.5 Which of the top 100 companies are future brands?
What is a future brand and why does it matter ?
HIG
H
HIGH EXPERIENCE
PU
RP
OSE
What is a future brand and why does it matter ?
The FutureBrand Index 30 FutureBrand ©
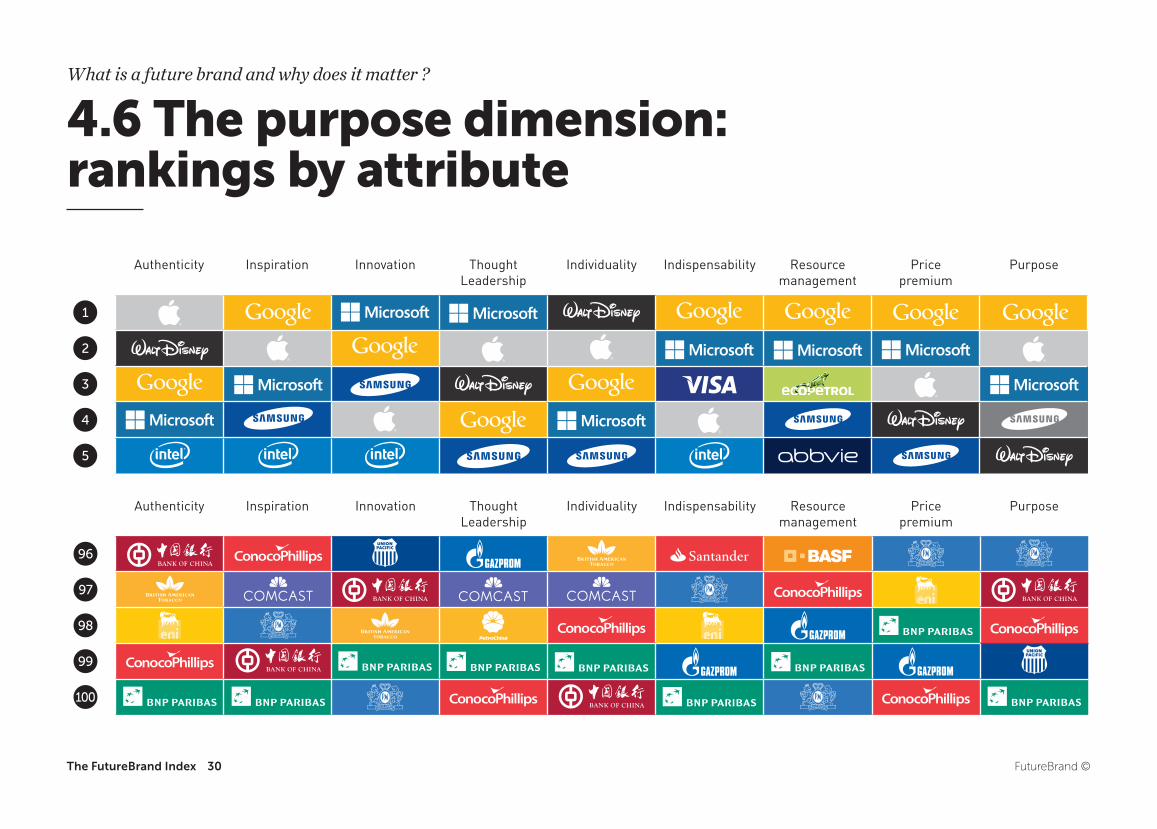
4.6 The purpose dimension: rankings by attribute
Authenticity Inspiration Innovation Thought Leadership
Individuality Indispensability Resource management
Price premium
Purpose
96
97
98
99
100
Authenticity Inspiration Innovation Thought Leadership
Individuality Indispensability Resource management
Price premium
Purpose
1
2
3
4
5
What is a future brand and why does it matter ?
The FutureBrand Index 31 FutureBrand ©
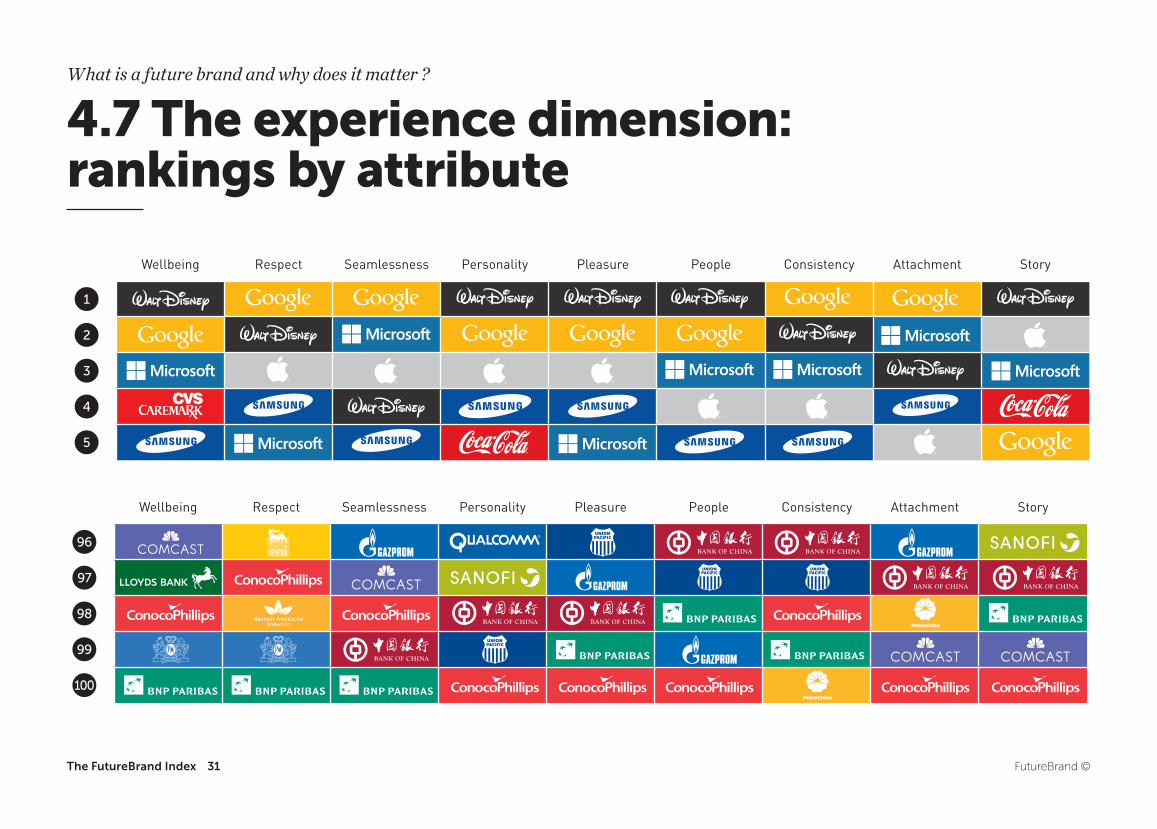
4.7 The experience dimension: rankings by attribute
Wellbeing Respect Seamlessness Personality Pleasure People Consistency Attachment Story
96
97
98
99
100
Wellbeing Respect Seamlessness Personality Pleasure People Consistency Attachment Story
1
2
3
4
5
32 FutureBrand ©
5.0 Rankings by sectorRankings by sector
1The FutureBrand Index
33 FutureBrand ©
1. Sector leaders, averages and drivers.
In addition to showing the difference between perception and market capitalization across the entire Top 100 Global Companies, our data provides industry-specific insights, including organizational rankings and drivers by sector as determined by our informed global public.
Rankings by sector: The sector rankings show the relative performance of organizations grouped by super-sector only.
Radar maps: The radar maps highlight the perceived strengths and weaknesses of each sector by each of our 18 attributes and an indication of the purpose -experience balance in each case. The maps also offer a comparison of these strengths and weaknesses of perception between the sector leader and the sector average.
Sector drivers & organization sentiment: In each case, we summarise the most important drivers of each sector according to the informed general public, expressed as what companies in the sector will need to do to meet their future expectations. We also capture specific quotations from respondents in relation to the top ranked organization.
5.1 What drives success by industry sector?
Rankings by sector
The FutureBrand Index
Personality
Story
Attachment
Seamlessness
Pleasure
Well being
Inspiration
Authenticity
Innovation
Thought leadership
Individuality
Resource management
Price premium
People
Consistency Indispensability
Purpose
Respect
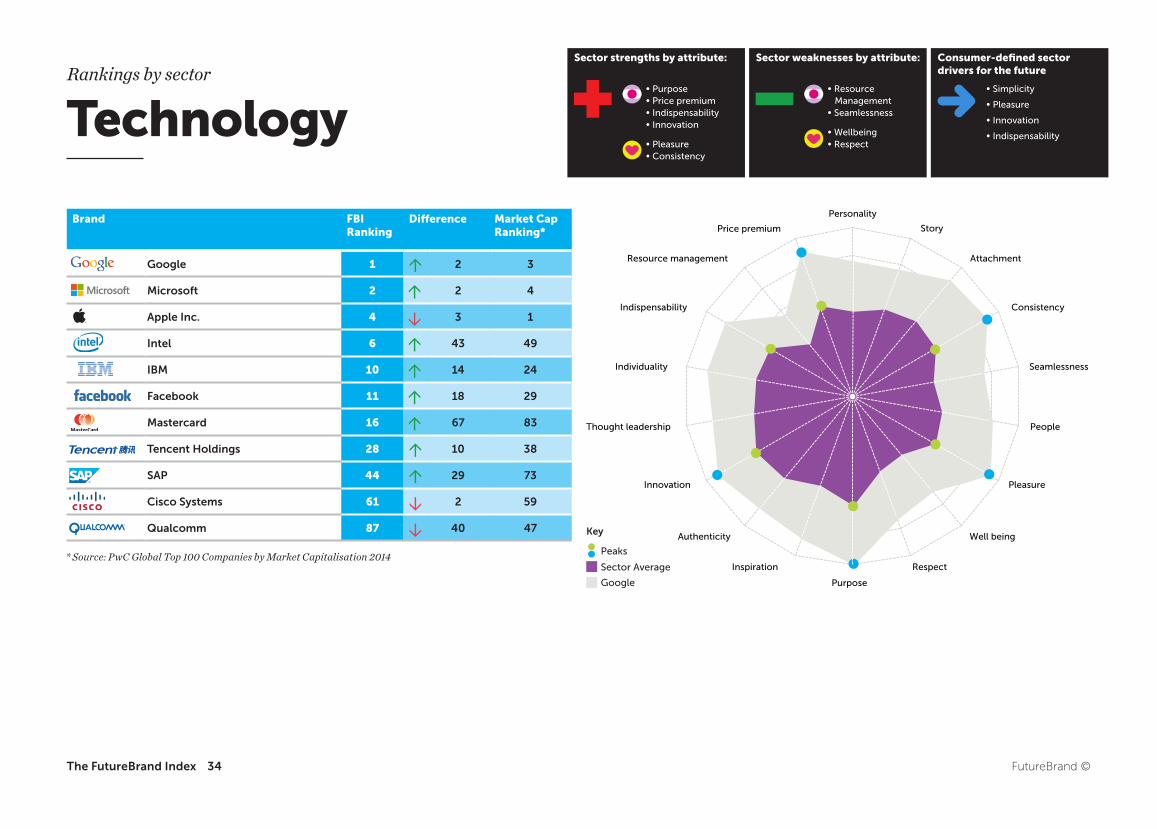
Brand FBI Ranking
Difference Market Cap Ranking*
Google 1 2 3
Microsoft 2 2 4
Apple Inc. 4 3 1
Intel 6 43 49
IBM 10 14 24
Facebook 11 18 29
Mastercard 16 67 83
Tencent Holdings 28 10 38
SAP 44 29 73
Cisco Systems 61 2 59
Qualcomm 87 40 47
34
Rankings by sector
Technology
* Source: PwC Global Top 100 Companies by Market Capitalisation 2014
• Purpose • Price premium • Indispensability • Innovation
• Pleasure • Consistency
• Resource Management • Seamlessness
• Wellbeing • Respect
• Simplicity
• Pleasure
• Innovation
• Indispensability
Sector strengths by attribute: Sector weaknesses by attribute: Consumer-defined sector drivers for the future
Sector Average
Peaks
Key
FutureBrand ©The FutureBrand Index
FBI Report
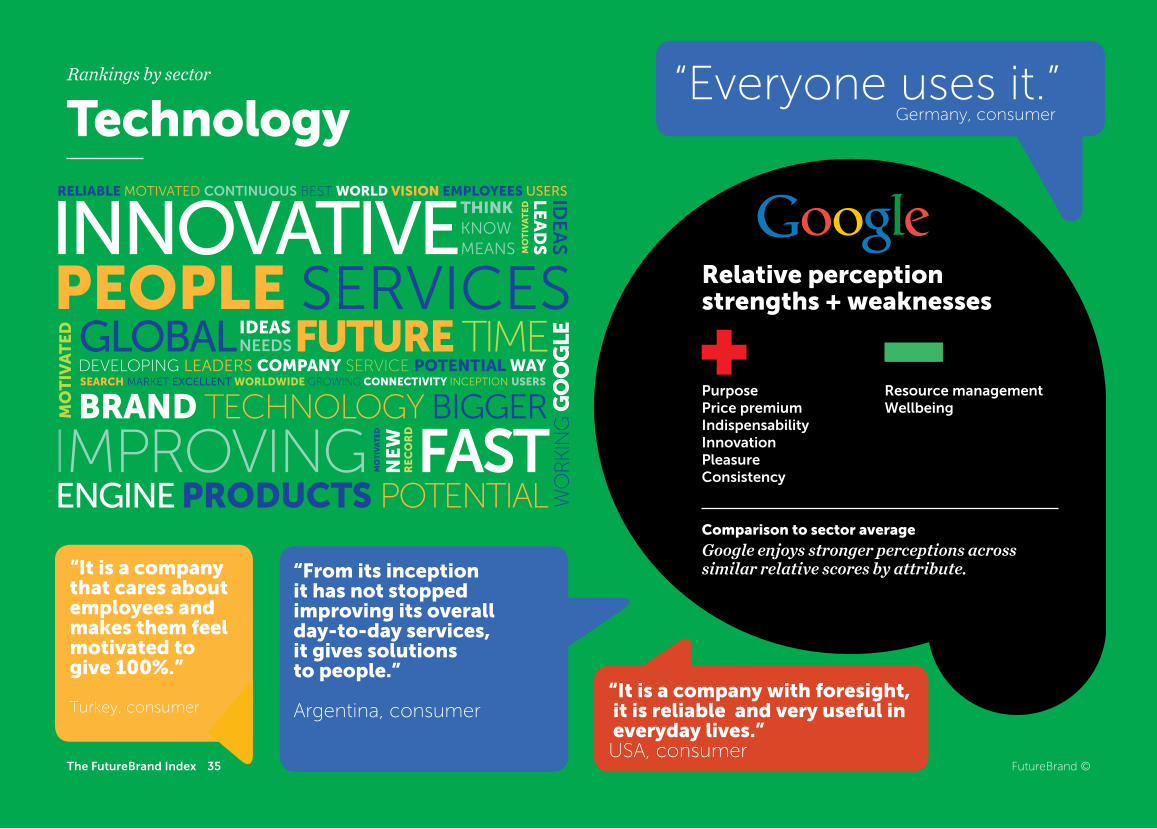
PurposePrice premiumIndispensabilityInnovationPleasureConsistency
Comparison to sector average
Google enjoys stronger perceptions across similar relative scores by attribute.
Relative perception strengths + weaknesses
Resource managementWellbeing
RELIABLE MOTIVATED CONTINUOUS BEST WORLD VISION EMPLOYEES USERS
DEVELOPING LEADERS COMPANY SERVICE POTENTIAL WAY
MO
TIV
AT
ED
MO
TIV
AT
ED
RE
CO
RD
NE
W
MO
TIV
AT
ED
PEOPLE SERVICES
IMPROVING FAST
INNOVATIVEGLOBAL FUTURE TIME
ENGINE PRODUCTS POTENTIAL
BRAND TECHNOLOGY BIGGER
IDEASNEEDS
IDE
AS
LE
AD
S
THINKKNOWMEANS
WO
RKI
NG
GO
OG
LE
SEARCH MARKET EXCELLENT WORLDWIDE GROWING CONNECTIVITY INCEPTION USERS
“From its inception it has not stopped improving its overallday-to-day services, it gives solutions to people.”
Argentina, consumer
“It is a company that cares aboutemployees and makes them feel motivated to give 100%.”
Turkey, consumer “It is a company with foresight, it is reliable and very useful in everyday lives.”USA, consumer
“Everyone uses it.”Germany, consumer
35 FutureBrand ©
TechnologyRankings by sector
The FutureBrand Index
Personality
Story
Attachment
Seamlessness
Pleasure
Well being
Inspiration
Innovation
Thought leadership
Individuality
Resource management
Price premium
People
Consistency Indispensability
Purpose
Respect
Authenticity
Brand FBI Ranking
Difference Market Cap Ranking*
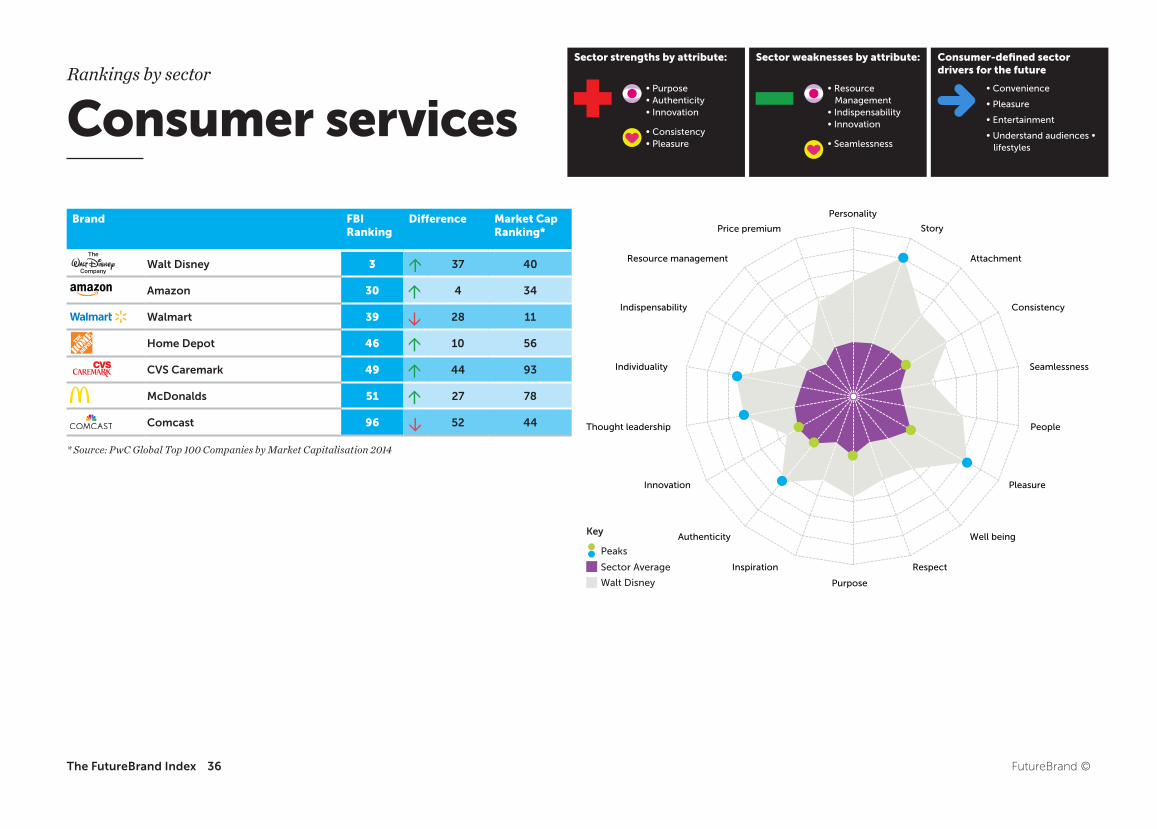
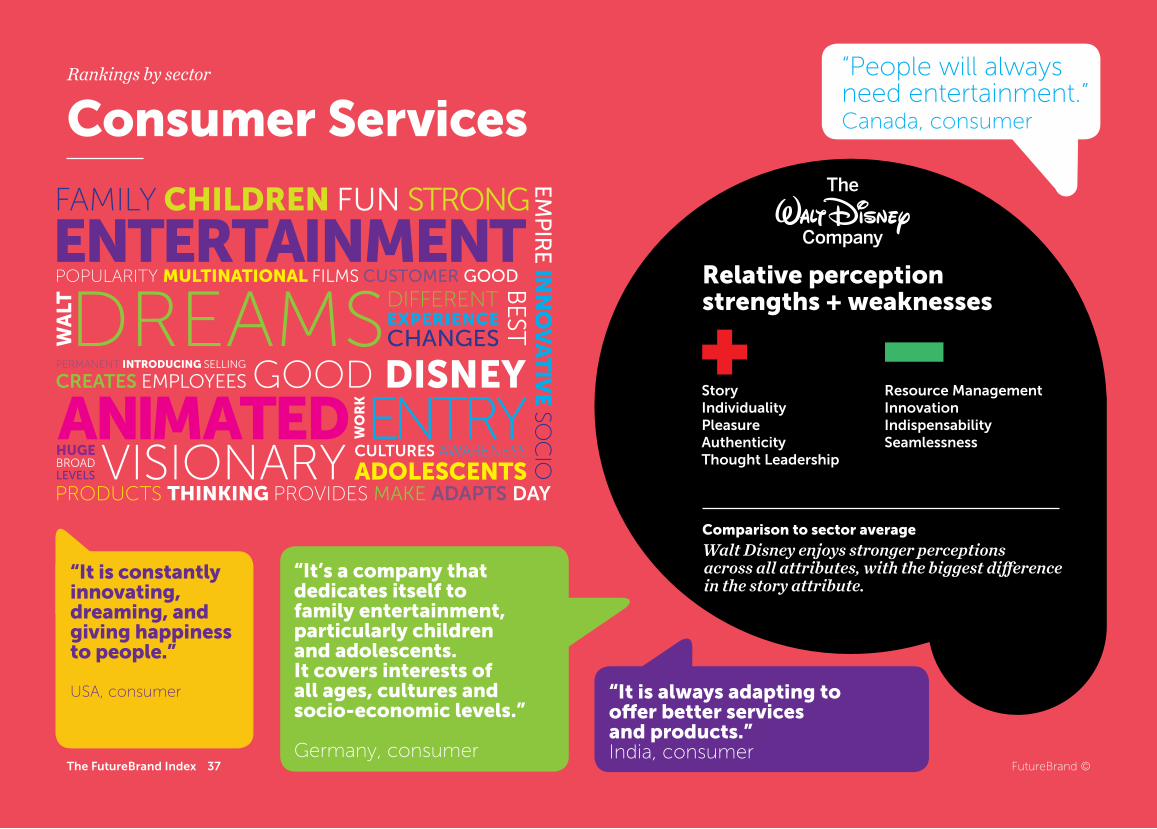
Walt Disney 3 37 40
Amazon 30 4 34
Walmart 39 28 11
Home Depot 46 10 56
CVS Caremark 49 44 93
McDonalds 51 27 78
Comcast 96 52 44
* Source: PwC Global Top 100 Companies by Market Capitalisation 2014
Consumer services• Purpose • Authenticity • Innovation
• Consistency • Pleasure
• Resource Management • Indispensability• Innovation
• Seamlessness
• Convenience
• Pleasure
• Entertainment
• Understand audiences • lifestyles
Sector strengths by attribute: Sector weaknesses by attribute: Consumer-defined sector drivers for the futureRankings by sector
Walt Disney
Sector Average
Peaks
Key
FutureBrand ©The FutureBrand Index 36
FBI Report
Comparison to sector average
Walt Disney enjoys stronger perceptions
Relative perception strengths + weaknesses
“It’s a company that dedicates itself to family entertainment, particularly children and adolescents. It covers interests ofall ages, cultures and socio-economic levels.”
Germany, consumer
“It is constantlyinnovating, dreaming, and giving happinessto people.”
USA, consumer “It is always adapting to o�er better services and products.”India, consumer
“People will always need entertainment.”Canada, consumer
ENTERTAINMENT
ANIMATED
FAMILY CHILDREN FUN STRONG
GOOD DISNEY ENTRY
POPULARITY MULTINATIONAL FILMS CUSTOMER GOOD
PERMANENT INTRODUCING SELLING
CREATES EMPLOYEES
PRODUCTS THINKING PROVIDES MAKE ADAPTS DAY
CULTURES AWARENESS
ADOLESCENTS VISIONARY
EMP
IRE IN
NO
VA
TIV
E SO
CIO
WA
LT
HUGEBROADLEVELS
WO
RK
DREAMS
BEST
DIFFERENTEXPERIENCECHANGES
StoryIndividualityPleasureAuthenticityThought Leadership
Resource ManagementInnovationIndispensabilitySeamlessness
in the story attribute.across all attributes, with the biggest di�erence
37 FutureBrand ©
Consumer ServicesRankings by sector
The FutureBrand Index
38
Personality
Story
Attachment
Seamlessness
Pleasure
Well being
Inspiration
Innovation
Thought leadership
Individuality
Resource management
Price premium
People
Consistency Indispensability
Purpose
Respect
Authenticity
Brand FBI Ranking
Difference Market Cap Ranking*
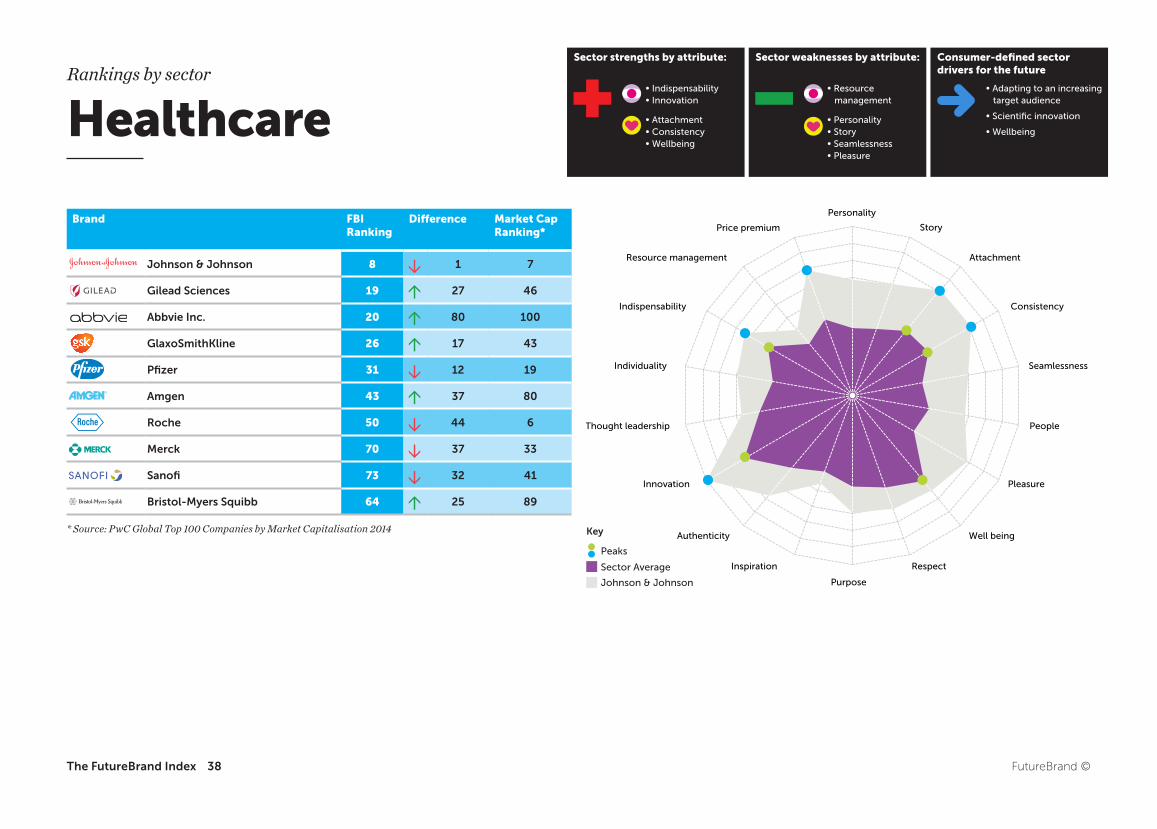
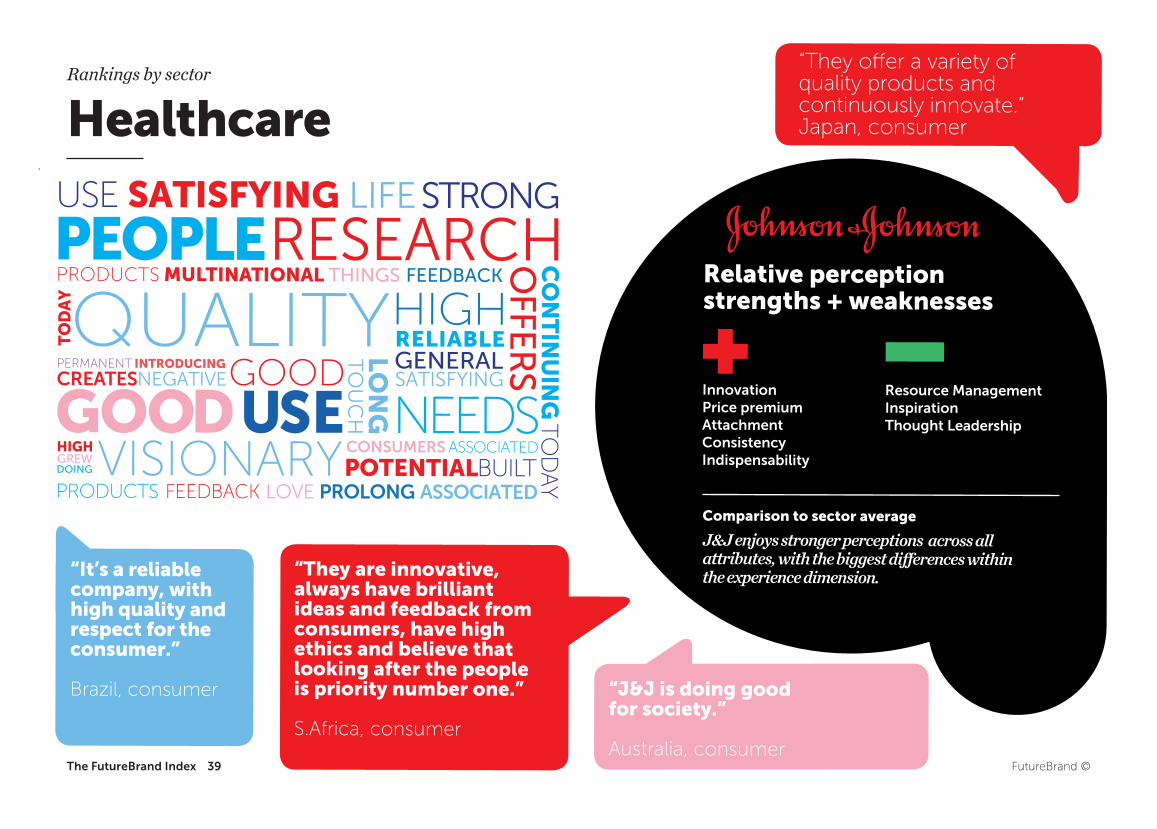
Johnson & Johnson 8 1 7
Gilead Sciences 19 27 46
Abbvie Inc. 20 80 100
GlaxoSmithKline 26 17 43
Pfizer 31 12 19
Amgen 43 37 80
Roche 50 44 6
Merck 70 37 33
Sanofi 73 32 41
Bristol-Myers Squibb 64 25 89
Rankings by sector
Healthcare• Indispensability • Innovation
• Attachment • Consistency • Wellbeing
• Resource management
• Personality • Story • Seamlessness • Pleasure
• Adapting to an increasing target audience
• Scientific innovation
• Wellbeing
Sector strengths by attribute: Sector weaknesses by attribute: Consumer-defined sector drivers for the future
* Source: PwC Global Top 100 Companies by Market Capitalisation 2014
Johnson & Johnson
Sector Average
Peaks
Key
FutureBrand ©The FutureBrand Index
FBI Report
Comparison to sector average
J&J enjoys stronger perceptions across all attributes, with the biggest di�erences withinthe experience dimension.
Relative perception strengths + weaknesses
“They are innovative,always have brilliant ideas and feedback from consumers, have highethics and believe thatlooking after the people is priority number one.”
S.Africa, consumer
“It’s a reliable company, with high quality and respect for theconsumer.”
Brazil, consumer
“They o�er a variety of quality products andcontinuously innovate.”Japan, consumer
PEOPLE
GOOD
USE SATISFYING LIFE STRONG
GOOD
RESEARCH
NEEDS
PRODUCTS MULTINATIONAL THINGS FEEDBACK
PERMANENT INTRODUCING
SATISFYINGCREATESNEGATIVE
PRODUCTS THINKING PROVIDES LOVE PROLONG DAY
CONSUMERS ASSOCIATED POTENTIAL VISIONARY
OFFER
S C
ON
TIN
UIN
G TO
DA
Y
TO
DA
Y
HIGHBROADGREW
WO
RK
QUALITY HIGHRELIABLEGENERAL
InnovationPrice premiumAttachmentConsistencyIndispensability
Resource ManagementInspirationThought Leadership
TO
UC
HLO
NGUSE
DOING
FEEDBACK ASSOCIATEDBUILT
“J&J is doing good for society.”
Australia, consumer The FutureBrand Index 39 FutureBrand ©
Rankings by sector
Healthcare
40
Personality
Story
Attachment
Seamlessness
Pleasure
Well being
Inspiration
Innovation
Thought leadership
Individuality
Resource management
Price premium
People
Consistency Indispensability
Purpose
Respect
Authenticity
Brand FBI Ranking
Difference Market Cap Ranking*
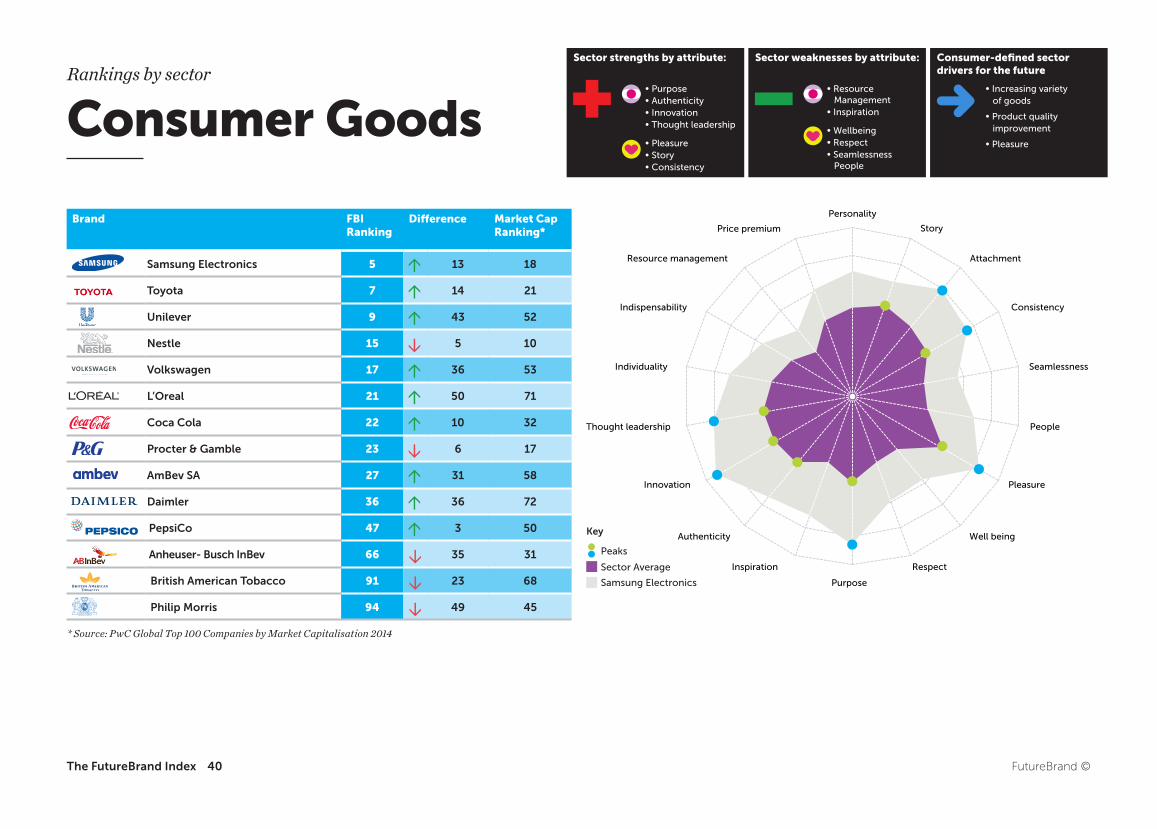
Samsung Electronics 5 13 18
Toyota 7 14 21
Unilever 9 43 52
Nestle 15 5 10
Volkswagen 17 36 53
L’Oreal 21 50 71
Coca Cola 22 10 32
Procter & Gamble 23 6 17
AmBev SA 27 31 58
Daimler 36 36 72
PepsiCo 47 3 50
Anheuser- Busch InBev 66 35 31
British American Tobacco 91 23 68
Philip Morris 94 49 45
Rankings by sector
Consumer Goods
* Source: PwC Global Top 100 Companies by Market Capitalisation 2014
• Purpose • Authenticity • Innovation • Thought leadership
• Pleasure • Story • Consistency
• Resource Management • Inspiration
• Wellbeing • Respect • Seamlessness People
• Increasing variety of goods
• Product quality improvement
• Pleasure
Sector strengths by attribute: Sector weaknesses by attribute: Consumer-defined sector drivers for the future
Samsung Electronics
Sector Average
Peaks
Key
FutureBrand ©The FutureBrand Index
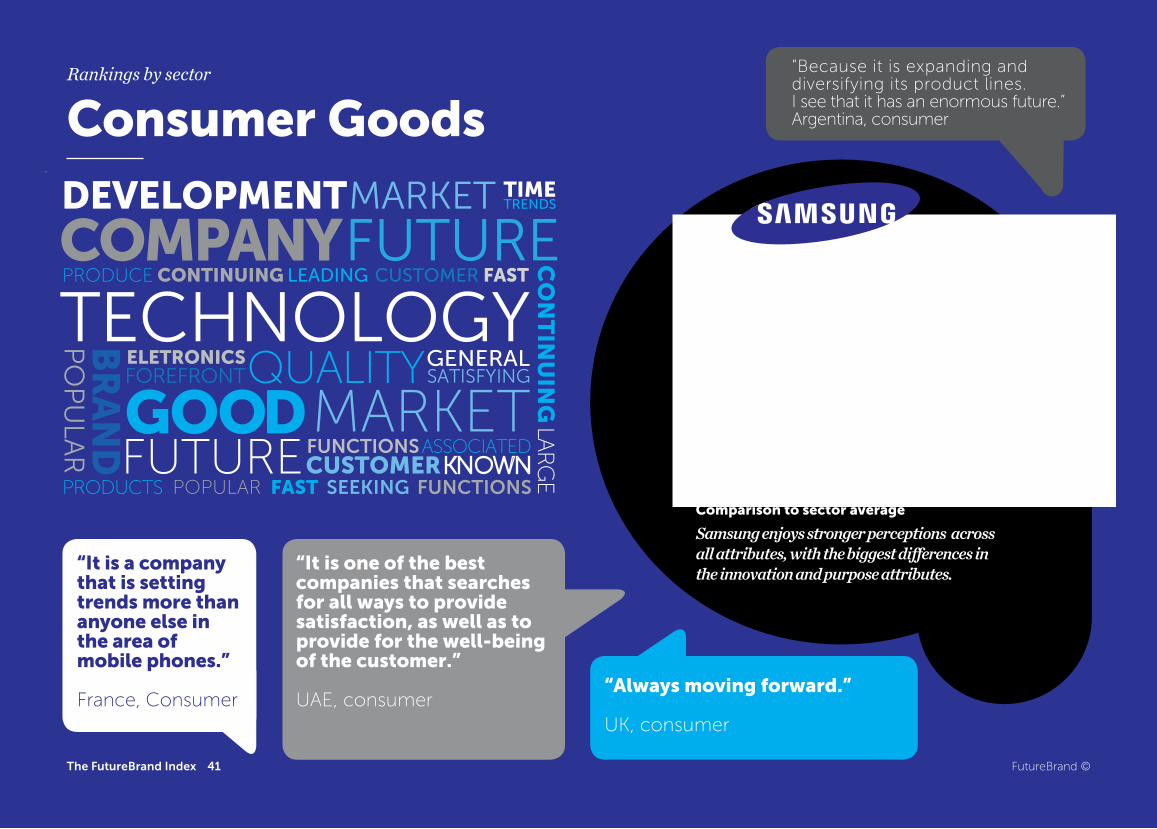
Comparison to sector average
Samsung enjoys stronger perceptions across all attributes, with the biggest di�erences in the innovation and purpose attributes.
Relative perception strengths + weaknesses
“It is one of the best companies that searches for all ways to provide satisfaction, as well as to provide for the well-being of the customer.”
UAE, consumer
“It is a company that is setting trends more thananyone else in the area of mobile phones.”
France, Consumer“Always moving forward.”
UK, consumer
“Because it is expanding and diversifying its product lines. I see that it has an enormous future.”Argentina, consumer
COMPANY
GOOD
DEVELOPMENT MARKET
QUALITY
FUTUREPRODUCE CONTINUING LEADING CUSTOMER
ELETRONICS
SATISFYINGFOREFRONT
PRODUCTS FAST SEEKING
FUNCTIONSASSOCIATED CUSTOMER FUTURE
CO
NT
INU
ING
LAR
GE
GENERAL
InnovationAttachmentThought LeadershipIndividuality
PO
PU
LAR
BR
AN
D MARKETPOPULAR FUNCTIONS
KNOWN
Resource managementInspirationThought Leadership
TECHNOLOGY
TIMETRENDS
FAST
41 FutureBrand ©
Consumer GoodsRankings by sector
The FutureBrand Index
Personality
Story
Attachment
Seamlessness
Pleasure
Well being
Inspiration
Innovation
Thought leadership
Individuality
Resource management
Price premium
People
Consistency Indispensability
Purpose
Respect
Authenticity
42
Brand FBI Ranking
Difference Market Cap Ranking*
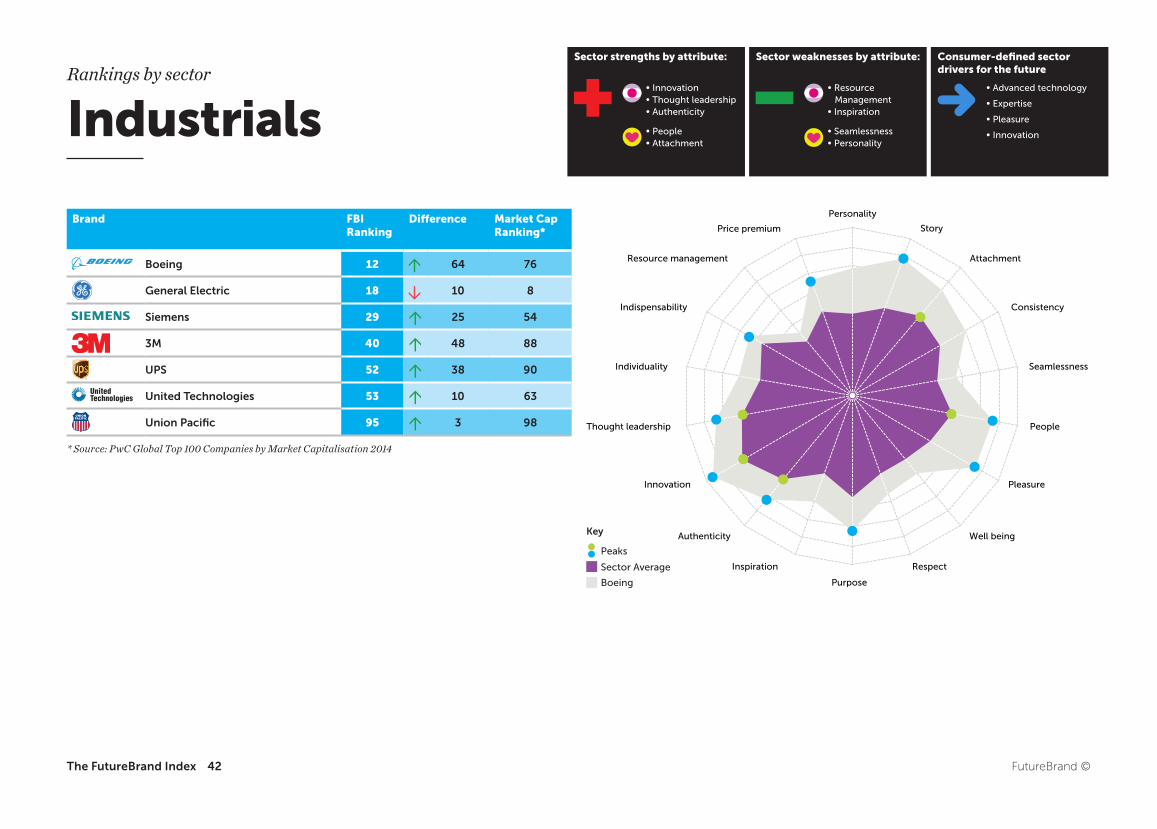
Boeing 12 64 76
General Electric 18 10 8
Siemens 29 25 54
3M 40 48 88
UPS 52 38 90
United Technologies 53 10 63
Union Pacific 95 3 98
* Source: PwC Global Top 100 Companies by Market Capitalisation 2014
IndustrialsRankings by sector
• Innovation • Thought leadership • Authenticity
• People • Attachment
• Resource Management• Inspiration
• Seamlessness • Personality
• Advanced technology
• Expertise
• Pleasure
• Innovation
Sector strengths by attribute: Sector weaknesses by attribute: Consumer-defined sector drivers for the future
Boeing
Sector Average
Peaks
Key
FutureBrand ©The FutureBrand Index
FBI Report
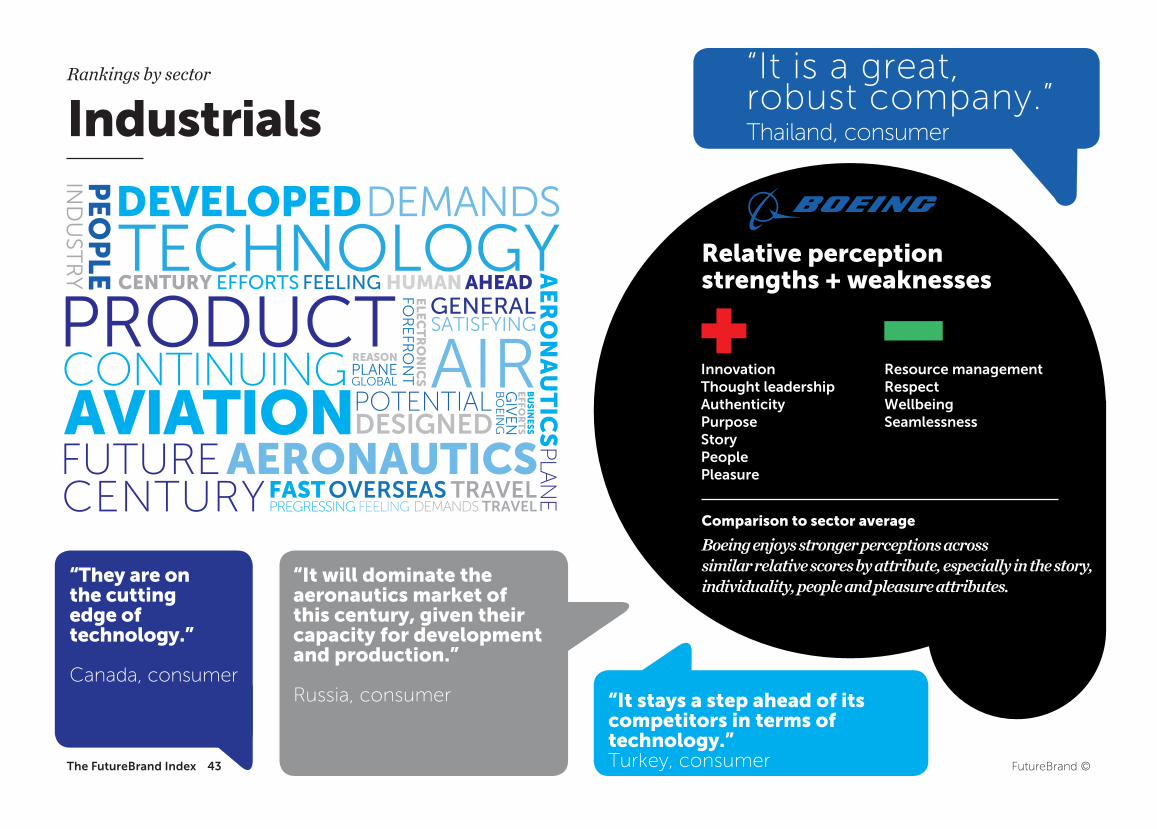
Comparison to sector average
Boeing enjoys stronger perceptions across similar relative scores by attribute, especially in the story,individuality, people and pleasure attributes.
Relative perception strengths + weaknesses
“It will dominate the aeronautics market of this century, given their capacity for development and production.”
Russia, consumer
“They are onthe cutting edge of technology.”
Canada, consumer“It stays a step ahead of its competitors in terms of technology.”Turkey, consumer
“It is a great, robust company.”Thailand, consumer
AVIATION
DEVELOPED DEMANDS
CONTINUING
TECHNOLOGYCENTURY EFFORTS FEELING
ELE
CT
RO
NIC
S
SATISFYING
FOR
EFR
ON
T
FEELING FAST OVERSEAS
AERONAUTICS FUTURE
AE
RO
NA
UT
ICS
PLA
NE
WO
RK
GENERAL
InnovationThought leadership AuthenticityPurposeStoryPeoplePleasure
IND
UST
RY
PEO
PLE
POTENTIAL
DEMANDSTRAVEL
Resource managementRespectWellbeingSeamlessness
PRODUCTHUMAN AHEAD
REASONPLANEGLOBAL AIRDESIGNED
EFFO
RT
SG
IVE
NB
OE
ING
BU
SIN
ES
S
TRAVELPREGRESSINGCENTURY
The FutureBrand Index 43 FutureBrand ©
Rankings by sector
Industrials
Personality
Story
Attachment
Seamlessness
Pleasure
Well being
Inspiration
Innovation
Thought leadership
Individuality
Resource management
Price premium
People
Consistency Indispensability
Purpose
Respect
Authenticity
44
Brand FBI Ranking
Difference Market Cap Ranking*
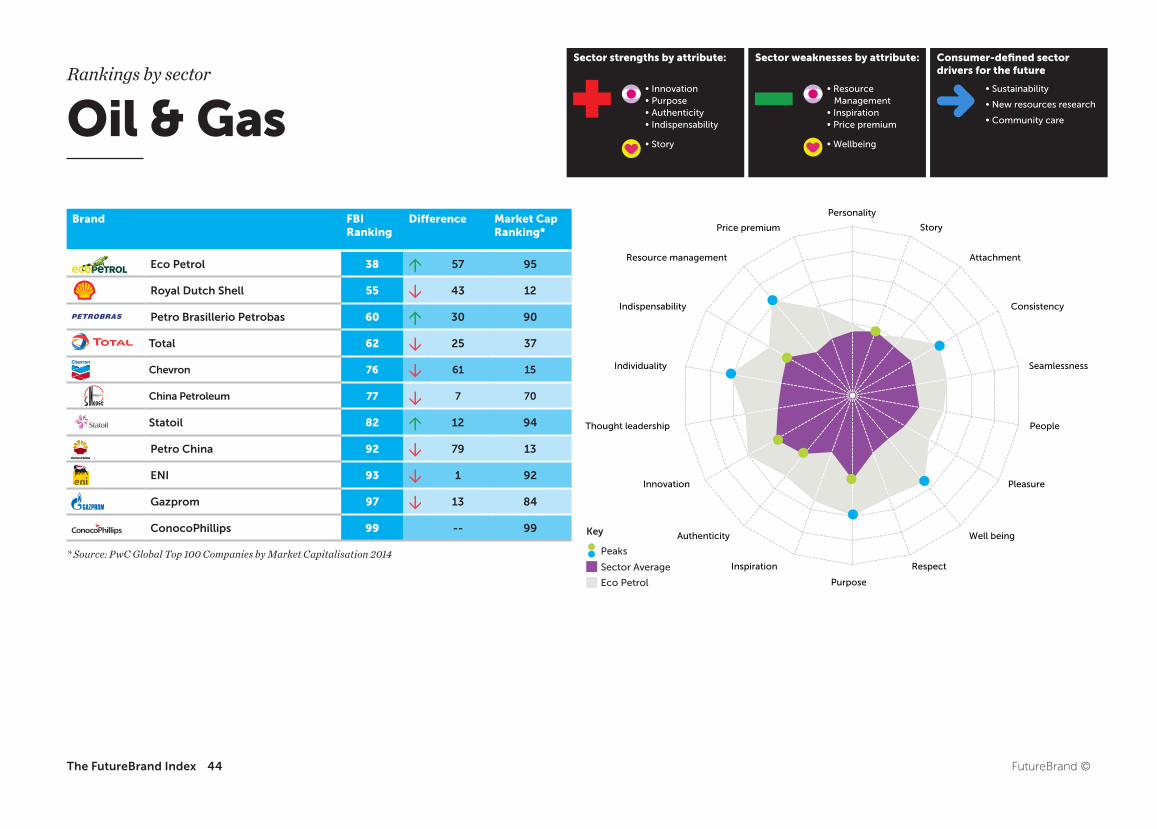
Eco Petrol 38 57 95
Royal Dutch Shell 55 43 12
Petro Brasillerio Petrobas 60 30 90
Total 62 25 37
Chevron 76 61 15
China Petroleum 77 7 70
Statoil 82 12 94
Petro China 92 79 13
ENI 93 1 92
Gazprom 97 13 84
ConocoPhillips 99 -- 99
Rankings by sector
* Source: PwC Global Top 100 Companies by Market Capitalisation 2014
Oil & Gas• Innovation • Purpose • Authenticity • Indispensability
• Story
• Resource Management• Inspiration• Price premium
• Wellbeing
• Sustainability
• New resources research
• Community care
Sector strengths by attribute: Sector weaknesses by attribute: Consumer-defined sector drivers for the future
Eco Petrol
Sector Average
Peaks
Key
FutureBrand ©The FutureBrand Index
Comparison to sector average
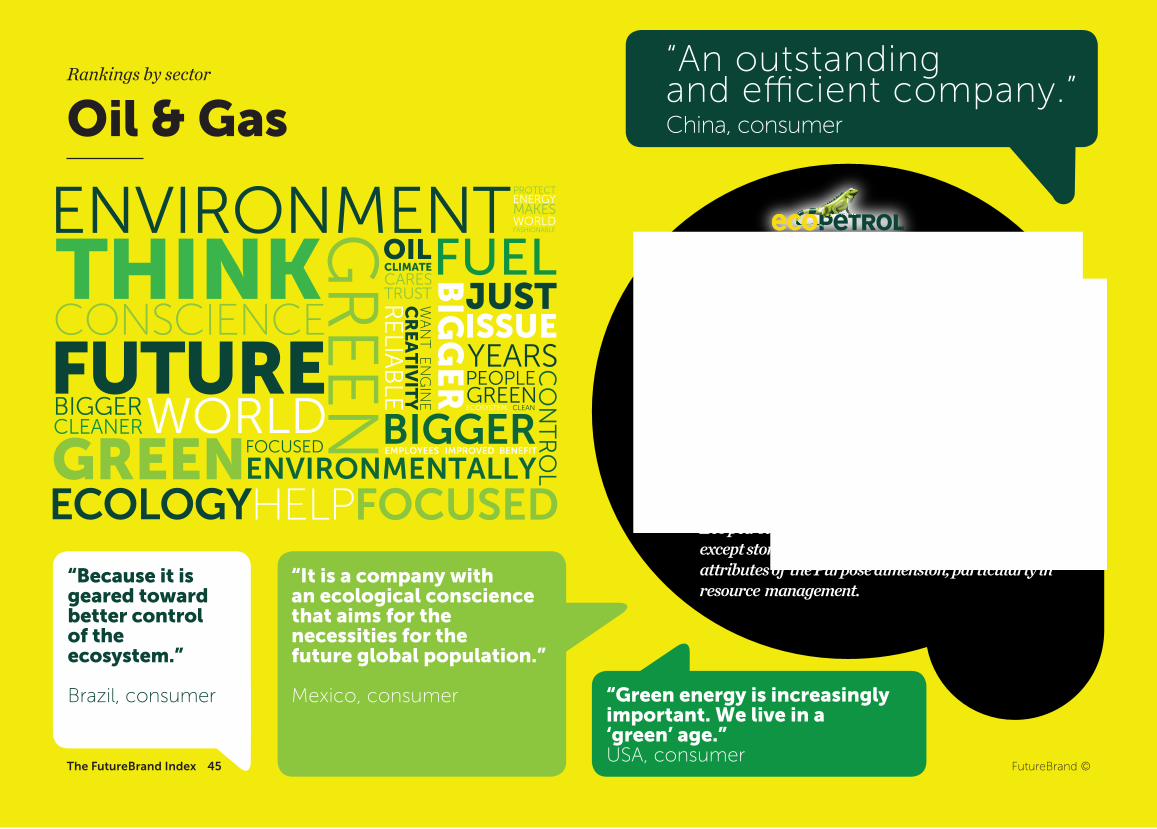
Eco petrol enjoys stronger perceptions in all attributes except story. The biggest di�erences are in most of the attributes of the Purpose dimension, particularly in resource management.
Relative perception strengths + weaknesses
“It is a company with an ecological conscience that aims for the necessities for the future global population.”
Mexico, consumer
“Because it isgeared towardbetter controlof the ecosystem.”
Brazil, consumer “Green energy is increasinglyimportant. We live in a ‘green’ age.” USA, consumer
“An outstanding and e�cient company.”China, consumer
FUTURE
THINK
PROTECT
CONSCIENCE
ENVIRONMENT
CR
EA
TIV
ITY
ENERGY
RE
LIAB
LE
EMPLOYEES
GREEN
FUEL
Resource managementIndividualityInnovationPurposeWellbeingConsistency
CO
NT
RO
L
BIG
GE
R
WORLD
HELPENVIRONMENTALLY
StoryPleasure
GR
EE
N
OILCLIMATECARESTRUST
BIGGER
ISSUEYEARSPEOPLE
JUST
FOCUSEDECOLOGY
WA
NT
EN
GIN
E GREENBIGGERCLEANER
MAKESWORLDFASHIONABLE
ECOSYSTEM CLEAN
IMPROVED BENEFITFOCUSED
The FutureBrand Index 45 FutureBrand ©
Oil & GasRankings by sector
Personality
Story
Attachment
Seamlessness
Pleasure
Well being
Inspiration
Innovation
Thought leadership
Individuality
Resource management
Price premium
People
Consistency Indispensability
Purpose
Respect
Authenticity
46
Brand FBI Ranking
Difference Market Cap Ranking*
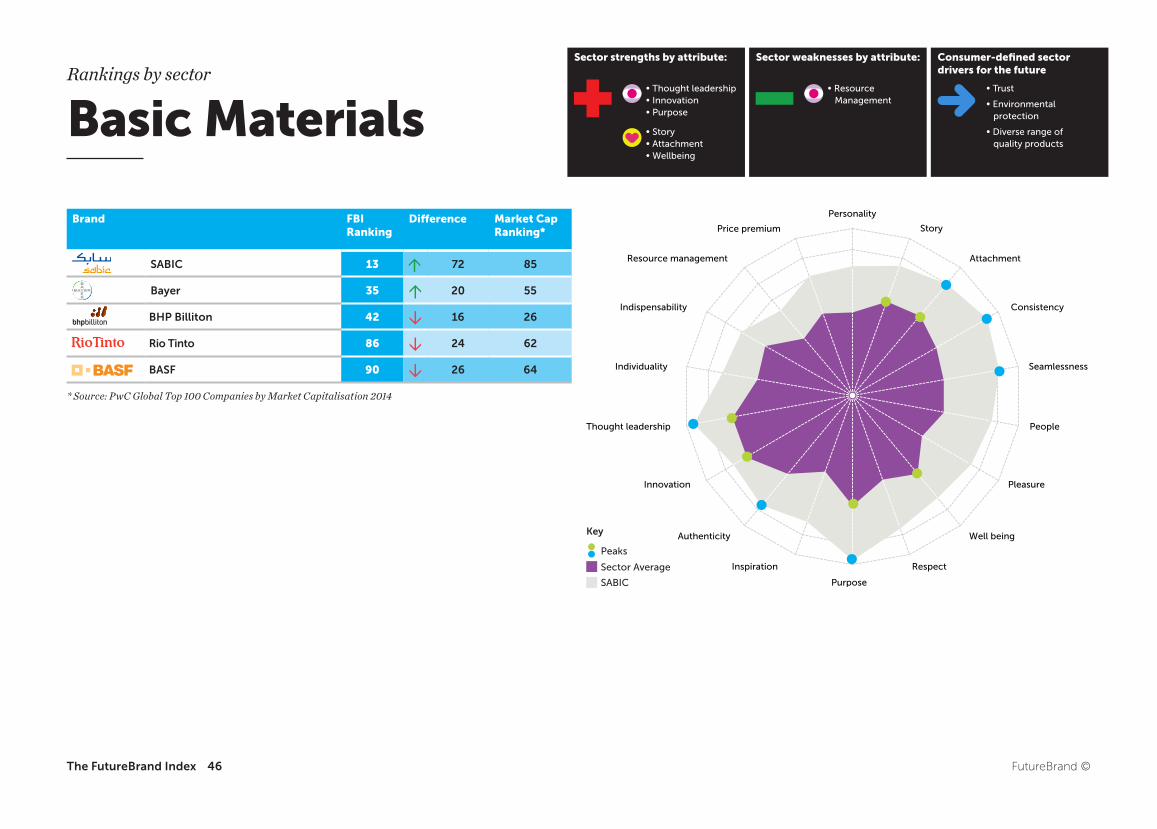
SABIC 13 72 85
Bayer 35 20 55
BHP Billiton 42 16 26
Rio Tinto 86 24 62
BASF 90 26 64
Rankings by sector
Basic Materials• Thought leadership • Innovation • Purpose
• Story • Attachment • Wellbeing
• Resource Management
• Trust
• Environmental protection
• Diverse range of quality products
Sector strengths by attribute: Sector weaknesses by attribute: Consumer-defined sector drivers for the future
* Source: PwC Global Top 100 Companies by Market Capitalisation 2014
SABIC
Sector Average
Peaks
Key
FutureBrand ©The FutureBrand Index
FBI Report
Comparison to sector average
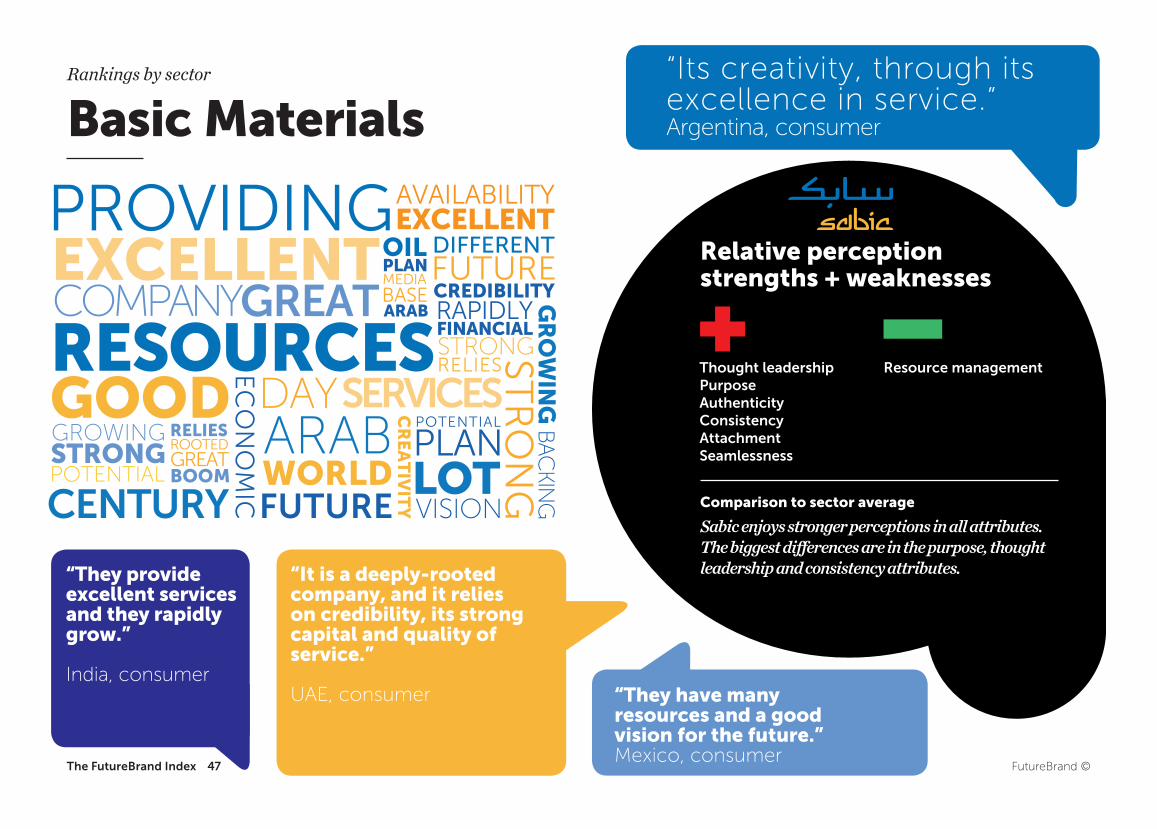
Sabic enjoys stronger perceptions in all attributes. The biggest dierences are in the purpose, thought leadership and consistency attributes.
Relative perception strengths + weaknesses
“It is a deeply-rootedcompany, and it relies on credibility, its strong capital and quality of service.”
UAE, consumer
“They provide excellent services and they rapidly grow.”
India, consumer“They have many resources and a good vision for the future.”Mexico, consumer
“Its creativity, through itsexcellence in service.”Argentina, consumer
RESOURCES
EXCELLENT
GREATCOMPANY
PROVIDING
CR
EA
TIV
ITY
WORLD
GOOD
GROWING
G
RO
WIN
G
BAC
KING
DIFFERENT
Thought leadershipPurposeAuthenticityConsistencyAttachmentSeamlessness
STR
ON
G
EC
ON
OM
IC
DAY
FUTURE
Resource management
OILPLAN
AVAILABILITYEXCELLENT
FUTURE
ARAB
FINANCIALSTRONG
CREDIBILITY
SERVICES
CENTURY
MEDIABASEARAB
STRONGPOTENTIAL
RELIESROOTEDGREATBOOM
RELIES
RAPIDLY
LOTVISION
POTENTIAL
PLAN
The FutureBrand Index 47 FutureBrand ©
Rankings by sector
Basic Materials
Personality
Story
Attachment
Seamlessness
Pleasure
Well being
Inspiration
Innovation
Thought leadership
Individuality
Resource management
Price premium
People
Consistency Indispensability
Purpose
Respect
Authenticity
48
Brand FBI Ranking
Difference Market Cap Ranking*
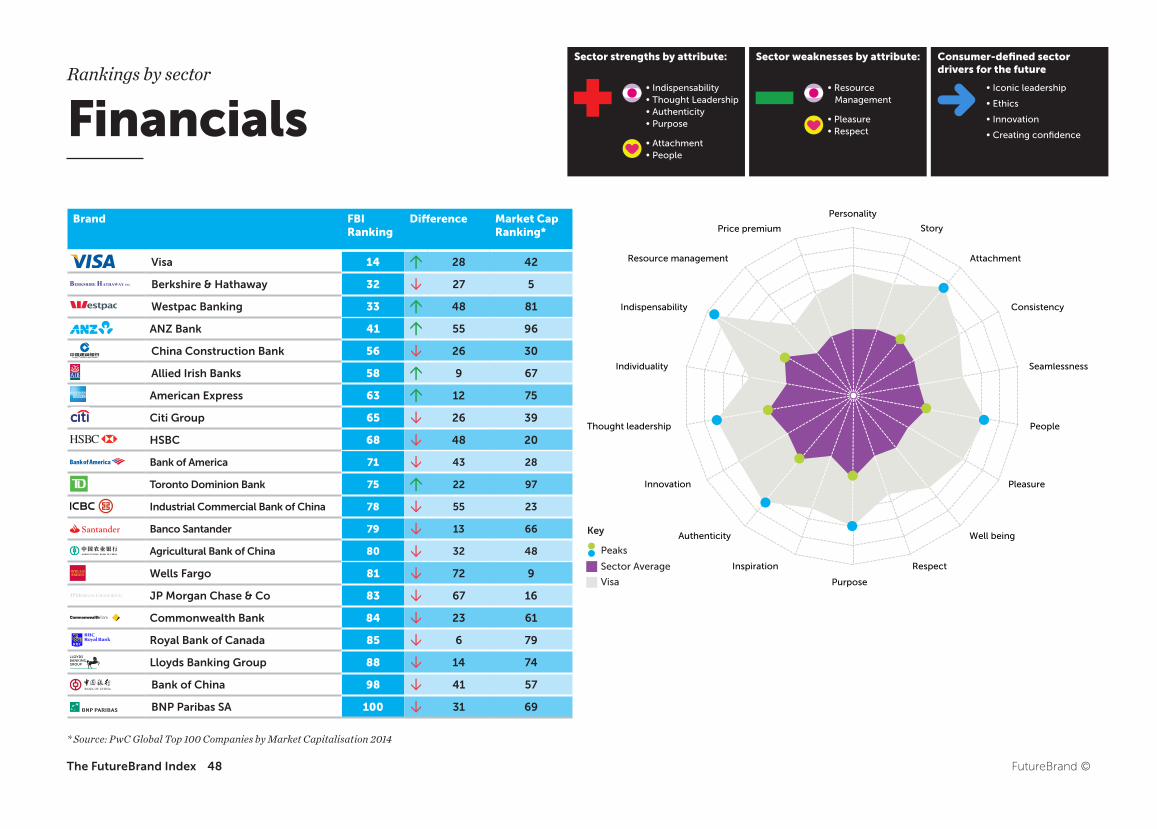
Visa 14 28 42
Berkshire & Hathaway 32
27 5
Westpac Banking 33 48 81
ANZ Bank 41 55 96
China Construction Bank 56
26 30
Allied Irish Banks 58 9 67
American Express 63 12 75
Citi Group 65
26 39
HSBC 68
48 20
Bank of America 71
43 28
Toronto Dominion Bank 75 22 97
Industrial Commercial Bank of China 78
55 23
Banco Santander 79
13 66
Agricultural Bank of China 80
32 48
Wells Fargo 81
72 9
JP Morgan Chase & Co 83
67 16
Commonwealth Bank 84
23 61
Royal Bank of Canada 85
6 79
Lloyds Banking Group 88
14 74
Bank of China 98
41 57
BNP Paribas SA 100
31 69
Financials
* Source: PwC Global Top 100 Companies by Market Capitalisation 2014
Rankings by sector• Indispensability • Thought Leadership • Authenticity • Purpose
• Attachment • People
• Resource Management
• Pleasure • Respect
• Iconic leadership
• Ethics
• Innovation
• Creating confidence
Sector strengths by attribute: Sector weaknesses by attribute: Consumer-defined sector drivers for the future
Visa
Sector Average
Peaks
Key
FutureBrand ©The FutureBrand Index
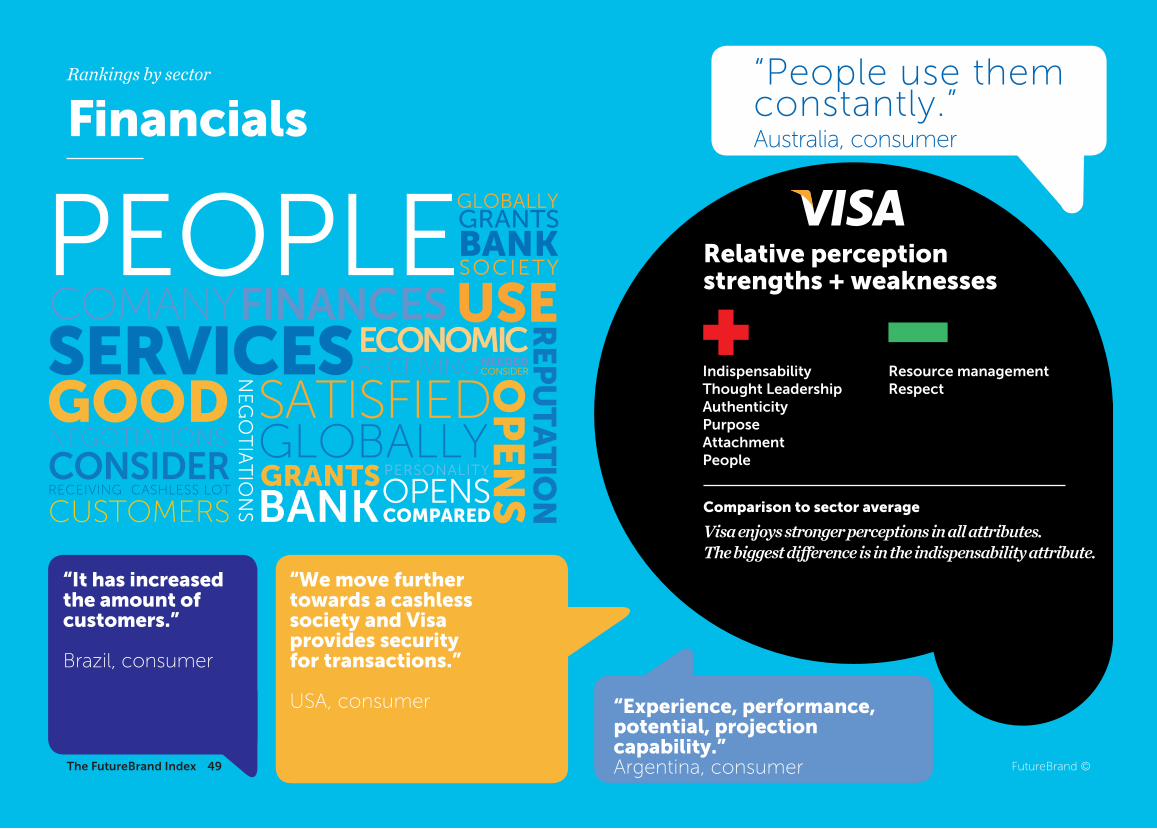
FBI Report
Comparison to sector average
Visa enjoys stronger perceptions in all attributes. The biggest dierence is in the indispensability attribute.
Relative perception strengths + weaknesses
“We move further towards a cashless society and Visa provides security for transactions.”
USA, consumer
“It has increasedthe amount of customers.”
Brazil, consumer
“Experience, performance, potential, projection capability.”Argentina, consumer
“People use them constantly.”Australia, consumer
SERVICES
USE
FINANCESCOMANYPEOPLE
OP
EN
S
GRANTS
GOOD
NEGOTIATIONS
R
EPU
TA
TIO
N
GRANTS
IndispensabilityThought LeadershipAuthenticityPurposeAttachmentPeople
NE
GO
TIA
TIO
NS
SATISFIED
BANK
Resource managementRespect
GLOBALLY
GLOBALLY
ECONOMIC
CONSIDERCUSTOMERS
PERSONALITY
OPENS
BANKSOCIETY
RECEIVINGNEEDEDCONSIDER
COMPARED
RECEIVING CASHLESS LOT
49 FutureBrand ©
FinancialsRankings by sector
The FutureBrand Index
Personality
Story
Attachment
Seamlessness
Pleasure
Well being
Inspiration
Innovation
Thought leadership
Individuality
Resource management
Price premium
People
Consistency Indispensability
Purpose
Respect
Authenticity
Brand FBI Ranking
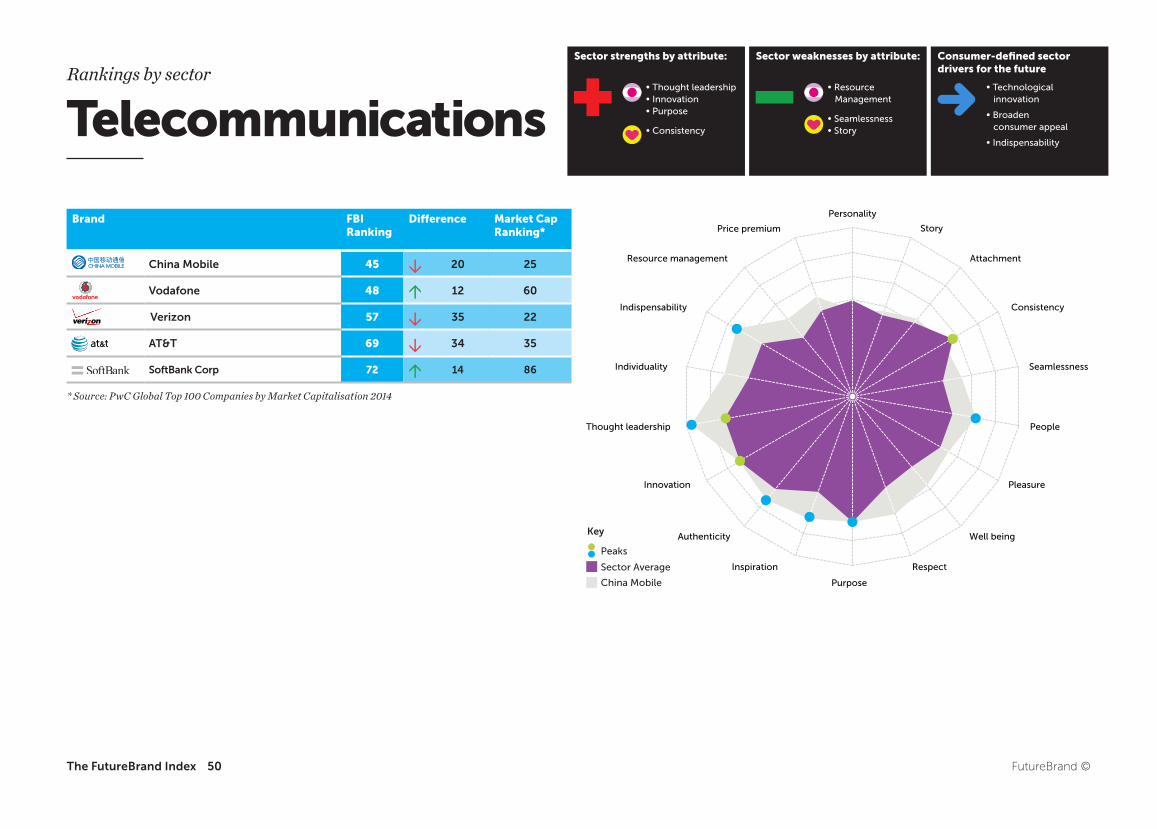
Difference Market Cap Ranking*
China Mobile 45 20 25
Vodafone 48 12 60
Verizon 57 35 22
AT&T 69 34 35
SoftBank Corp 72 14 86
50
China Mobile
Sector Average
Peaks
Key
Rankings by sector
* Source: PwC Global Top 100 Companies by Market Capitalisation 2014
• Thought leadership• Innovation• Purpose
• Consistency
• Resource Management
• Seamlessness • Story
• Technological innovation
• Broaden consumer appeal
• Indispensability
Sector strengths by attribute: Sector weaknesses by attribute:
Telecommunications
Consumer-defined sector drivers for the future
FutureBrand ©The FutureBrand Index
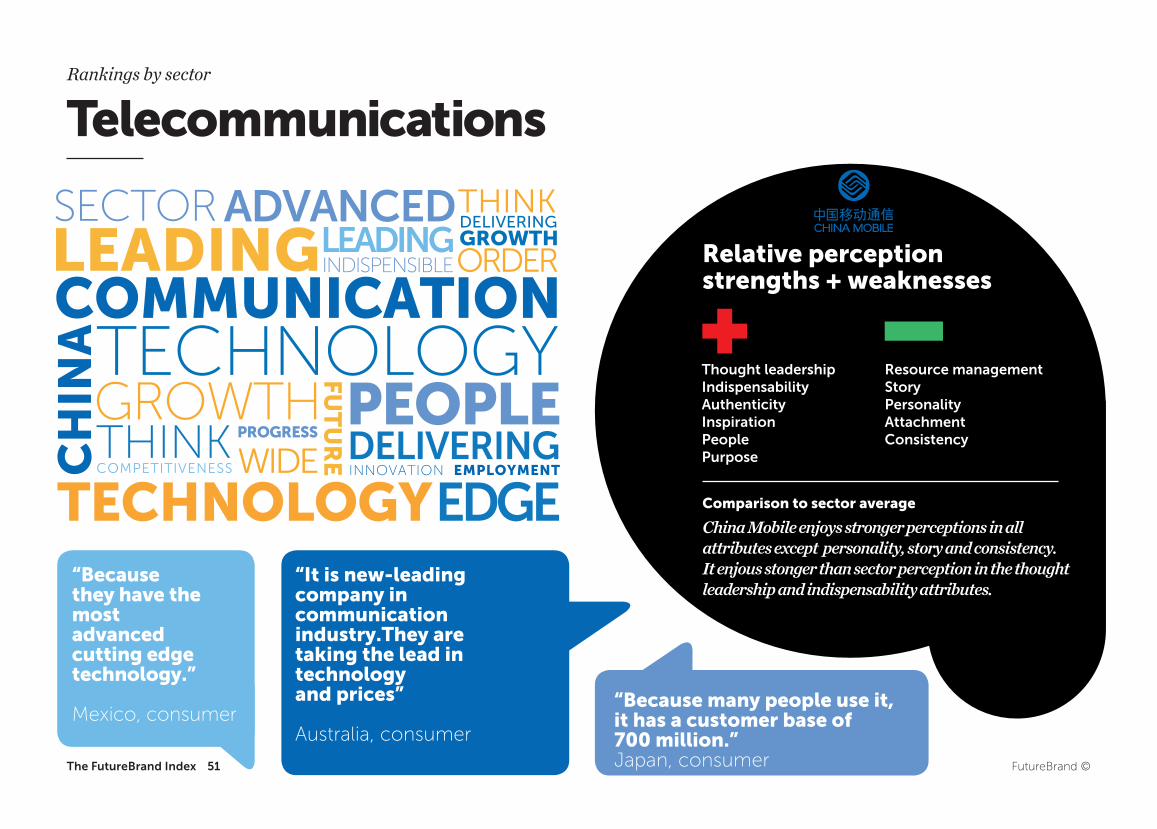
Comparison to sector average
China Mobile enjoys stronger perceptions in all attributes except personality, story and consistency. It enjous stonger than sector perception in the thought leadership and indispensability attributes.
Relative perception strengths + weaknesses
“It is new-leading company in communication industry.They are taking the lead in technology and prices”
Australia, consumer
“Because they have the most advanced cutting edge technology.”
Mexico, consumer“Because many people use it, it has a customer base of 700 million.”Japan, consumer
TECHNOLOGY
TECHNOLOGY
ADVANCEDSECTOR
COMMUNICATION
FUT
UR
E
LEADING
CH
INA
DELIVERING
Thought leadershipIndispensabilityAuthenticityInspirationPeoplePurpose
GROWTHResource managementStoryPersonalityAttachmentConsistency
THINK
THINK
LEADING
DELIVERINGCOMPETITIVENESS
GROWTHORDERINDISPENSIBLE
PROGRESS
WIDE INNOVATION EMPLOYMENT
PEOPLE
EDGE
51 FutureBrand ©
Rankings by sector
Telecommunications
The FutureBrand Index
52 FutureBrand ©
6.0 The ones to watchThe ones to watch
The FutureBrand Index
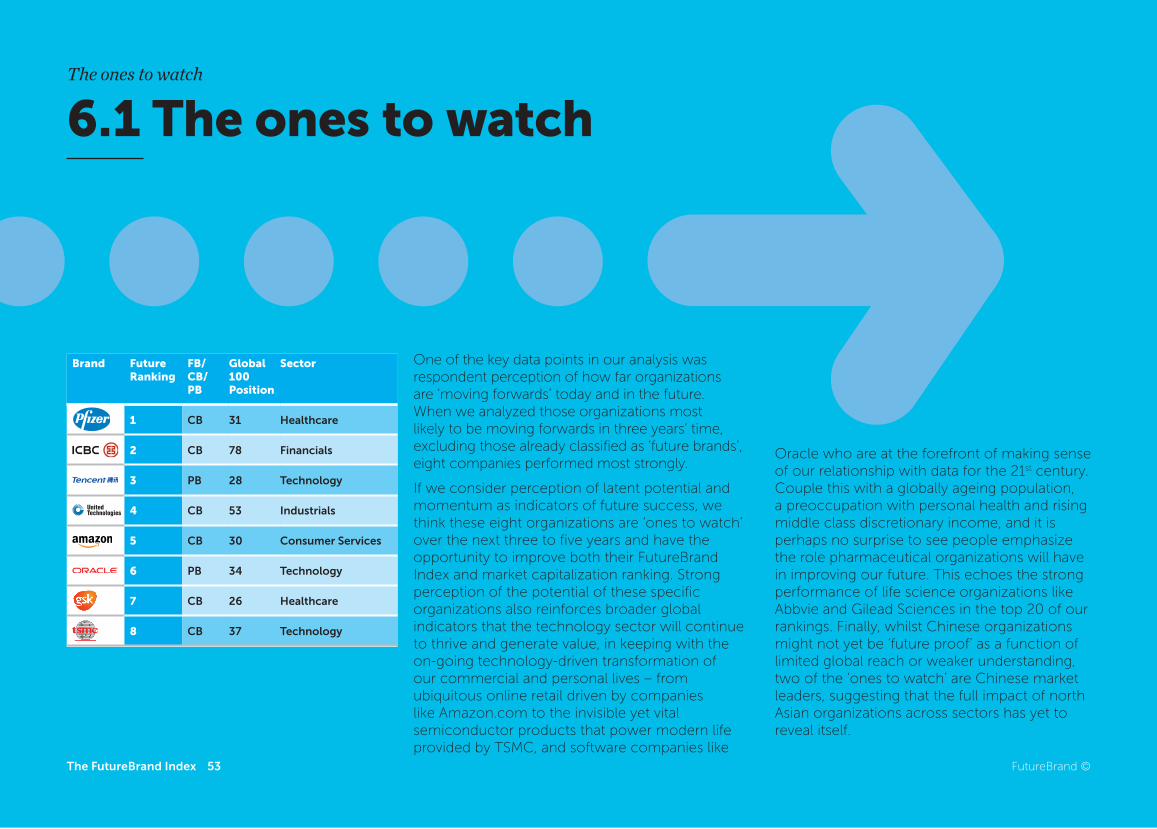
Brand Future Ranking
FB/ CB/ PB
Global 100 Position
Sector
1 CB 31 Healthcare
2 CB 78 Financials
3 PB 28 Technology
4 CB 53 Industrials
5 CB 30 Consumer Services
6 PB 34 Technology
7 CB 26 Healthcare
8 CB 37 Technology
53 FutureBrand ©
The ones to watch
One of the key data points in our analysis was respondent perception of how far organizations are ‘moving forwards’ today and in the future. When we analyzed those organizations most likely to be moving forwards in three years’ time, excluding those already classified as ‘future brands’, eight companies performed most strongly.
If we consider perception of latent potential and momentum as indicators of future success, we think these eight organizations are ‘ones to watch’ over the next three to five years and have the opportunity to improve both their FutureBrand Index and market capitalization ranking. Strong perception of the potential of these specific organizations also reinforces broader global indicators that the technology sector will continue to thrive and generate value, in keeping with the on-going technology-driven transformation of our commercial and personal lives – from ubiquitous online retail driven by companies like Amazon.com to the invisible yet vital semiconductor products that power modern life provided by TSMC, and software companies like
Oracle who are at the forefront of making sense of our relationship with data for the 21st century. Couple this with a globally ageing population, a preoccupation with personal health and rising middle class discretionary income, and it is perhaps no surprise to see people emphasize the role pharmaceutical organizations will have in improving our future. This echoes the strong performance of life science organizations like Abbvie and Gilead Sciences in the top 20 of our rankings. Finally, whilst Chinese organizations might not yet be ‘future proof’ as a function of limited global reach or weaker understanding, two of the ‘ones to watch’ are Chinese market leaders, suggesting that the full impact of north Asian organizations across sectors has yet to reveal itself.
6.1 The ones to watch
The FutureBrand Index
54 FutureBrand ©
The ones to watch
6.2 Future Drivers
There are three dominant future drivers emerging from our research into public perception of the Top 100 Global Companies.
1. Technology, consumer facing and entertainment companies will continue to dominate.
The first and most obvious is that technology, consumer facing and entertainment companies will continue to dominate public perception and the capital markets. This is underscored by the parity of performance of these organizations at the top of the market capitalization and FutureBrand Index rankings. The smaller the gap between public perception across purpose and experience and financial value today indicates that these organizations are not just strong commercial performers now, and benefit from advantages like purchase preference, price premium and employer appeal, but that they are also more ‘future proof’ by our measures.
The FutureBrand Index
55 FutureBrand ©
The ones to watch
6.2 Future Drivers
2. Ethics will be a vital differentiator for Financial, Oil & Gas and Energy organizations.
The second, and this reinforces challenges already known to the sectors, is that ethical business practices will be a vital differentiator for Financial,Oil&GasandEnergyorganizations.Those companies that can demonstrate they are leading change in their industry in relation to obvious areas like the environment and corporate social responsibility, will not only better attend to stakeholder needs, but also will differentiate from their competition. This is not least because the sectors still seem to be hampered by broadly weak or negative perceptions in the wake of the global financial crisis and concerns about the viability of our dependency on fossil fuels: hence the larger negative disparity between market cap and FutureBrand Index ranking for most of the organizations in these sectors.
The FutureBrand Index
56 FutureBrand ©
The ones to watch
6.2 Future Drivers
3. An appetite for increased simplicity and convenience in consumer products and services.
The third driver relates to an appetite for increasing simplicity and convenience in the consumer products and services sectors. As technology continues to integrate different aspects of our lives, from the things we buy to the services we depend on, our social lives and our personal data and wellbeing, people will look to the largest organizations in the world to make life easier. This expectation has, no doubt, been partly created by the powerful positive improvements the top ten organizations in the FutureBrand Index have brought to our lives in the last decade – making everything from global mapping, instant global information, the mobile internet and communications, home computing, workplace productivity, on-demand entertainment, sustainable consumer goods and next generation hybrid fuel technologies available to the mass market for the first time in history.
Given the scale and reach of these changes driven by the world’s largest organizations, it is perhaps no coincidence that the total market capitalization of the Global Top 100 Companies has increased exponentially over the past five years, and that there is a significant differential between the largest companies by market cap and those at the bottom of the ranking – for example, #1 Apple is valued at something like $400bn more than #100 Abbvie Inc. The performance of these companies in terms of strength of perception and financial value offers a guide to other companies looking to define their category and the broader market over the coming decade, not least in terms of addressing their balance between ‘why’ they are here and ‘what’ they deliver in reality.
The FutureBrand Index
5757 FutureBrand ©The FutureBrand Index
1. Builds a strong emotional connection.
Personality Consumers perceive the same kind of personality types in brands as in people – and seek out brands that exhibit their desired personality traits by category. Perceptions of a strong and clear personality are critical to emotional connection. Thereare5keypersonalitydimensions:sincerity,excitement, competence, sophistication and ruggedness.
Story People build their identities around narratives – where they are from, who they know, what they have achieved – and are drawn to brands with strong stories as a result. The strongest stories are those that are created around archetypes – universal ideas and characters that transcend cultures to touch all of human experience.
Attachment Attachment Theory has shown that what we think of as love or emotional connection can actually be understood in terms of degrees of attachment and attachment styles developed through continuous social interaction. The ideal state for people, as for brands, is of a ‘secure’ attachment, in which unquestioned trust and positive dependency is developed through experience.
Appendix
Experience dimensions and their attributes
5858 FutureBrand ©The FutureBrand Index
2. Engaging experience at every touchpoint.
Consistency Brands are a promise of consistent experience. We use them as heuristics – mental shortcuts – in a world of choice and limited time to avoid risk and recreate good experiences. It is vital, therefore, that our experience of a brand across different touch points is as consistent as possible to avoid reducing our belief in the brand being a safe option next time. This means it should look and sound the same, have the same taste and ingredients, communicate the same ideas or deliver the same performance quality every time you encounter it – from eating a meal to standing in a queue for the till.
Seamlessness We live in a world where the physical and digital environments have merged. It is possible to interact with a brand in multiple channels in parallel and we want the brand to acknowledge and optimize our personal experience with that in mind. It is not enough for brands to be consistent. The ‘connectedness’ of a brand, and the intelligent use of data to personalize every interaction in real-time, is vital to a feeling that we are at the heart of a customer-centric experience.
People How people behave, from leaders of corporations to customer care representatives in call-centres, is a critical part of our brand experience. The extent to which those people seem to believe in their work, care about us personally and follow through on their commitments determines how strong we feel the brand to be. In the end, technology can enable self-service and efficiency, but people are at the heart of engagement.
Appendix
Experience dimensions and their attributes
5959 FutureBrand ©The FutureBrand Index
3. Makes peoples’ lives better
Pleasure The best brands bring us pleasure. From sensorial experiences to pride of ownership and the delight of a high quality product, brands should trigger positive feelings. When they do, they improve our experience of life and we want to share them with others and recreate the same pleasures as often as possible. The extent to which an organization, product or service is associated with human pleasure is an important ingredient in brand strength.
Wellbeing People are increasingly preoccupied with their general wellbeing – from mental and physical wellness to spiritual health. In addition to bringing us pleasure, brands have an opportunity to contribute to that wellbeing by focusing on human needs and interests and considering what is ‘good’ for people in consumer, organizational and community life. The more a brand is felt to improve wellbeing, the more it will be connected with making peoples’ lives better.
Respect Brands need to demonstrate that they respect people and the broader environment in which they operate. This can mean everything from respecting human difference and diversity to careful stewardship of natural resources and courtesy in a customer interaction. It is a function of empathy and critical to creating trust and loyalty by helping people to build and maintain self-esteem. The more a brand can show it does this through its experience, the more authentically it will be felt to improve life in the broadest sense.
Appendix
Experience dimensions and their attributes
6060 FutureBrand ©The FutureBrand Index
Appendix
Purpose dimensions and their attributes
4. Compelling vision for the Future.
Purpose We are increasingly drawn to brands with a strong sense of ‘why’ they are here beyond the act of making money. This purpose is an articulation of core beliefs with which people can identify. It also guides the brand or organization towards the future it wants to see, and is the motivational force that gets people up in the morning. It’s what the brand or organization is here to do, rather than a list of its attributes, features or benefits.
Inspiration For a vision to be compelling, it has to inspire change and action. Inspiration is figuratively about the process of being ‘mentally stimulated to do or feel something, and especially to do something creative’. Brands that inspire people to change for the better and help them to see what could be possible in the future are the most compelling choice for today.
Authenticity A brand can have a lofty vision, but it needs to connect genuinely to the task of an organization or the qualities of a product or service. We need to see the relationship between the future a brand wants to create and what it can legitimately deliver today, not least so that we can realistically participate in creating that future for ourselves through consumption, investment or employment.
6161 FutureBrand ©The FutureBrand Index
5. Redefines the category. Innovation A brand needs to go beyond change or novelty for its own sake, and instead focus on inventing products, services or experiences that are genuinely useful. Being known for this kind of innovation means that a brand focuses on adapting to the changing needs of its customers, consumers or market, rather than incrementally improving against its competition, and has more chance of shaping the future of its category as a result.
Thought leadership Strong brands are always driven by strong ideas, and are unafraid of expressing clear views about their category, market or the broader world. They take a position and defend it with consistency and evidence. They want to inform what we think and how the world understands what they offer, rather than allowing other people to define it for them.
Individuality Above all, strong brands are differentiated from their competition. They express a unique identity, values and personality that help them to stand out and be easily recognized. This is often at the cost of ‘fitting in’ and playing to category norms, which calls for a clear sense of who they are, why they are here and how it is of benefit to their customer or consumer.
Appendix
Purpose dimensions and their attributes
6262 FutureBrand ©The FutureBrand Index
6. Delivers sustainable value. Indispensability Would the world, or your life, be worse if the brand ceased to exist tomorrow? In what way and would there be a credible alternative? The key to delivering brand value over the long term is to be seen as vital to peoples’ lives today: to be something we cannot live without. This applies to organizations as much as products and services and the stronger the perception of indispensability, the more likely it is that the brand can be seen to address the fundamental needs of its stakeholders or customers.
Resource management Does the brand make the best use of available resources – from people to materials and energy? Increasingly, brands are scrutinized for their supply chain and ethical credentials as much as their price, availability and quality. Organisations are expected to consider their environmental, economic and social impact in the normal course of business. And the same considerations are increasingly important drivers of consumer choice in categories as diverse as food, fashion and automotive. It is no longer a matter of ‘green washing’ or environmentalism – the imposed sacrifice of comfort and progress to save the world – but a requirement to make the best use of what we have and consider our impact for the long term.
Price premium Brands bring measurable asset value to an organization. The stronger they are, the more valuable the product, service or company becomes. Sustainable business cannot be achieved without consumers, customers or investors being prepared to value your brand more highly than an equivalent competitor. Which means a willingness to pay more to benefit from the brand when presented with a choice. Or feeling that there is no equivalent alternative.
Appendix
Purpose dimensions and their attributes
6363The FutureBrand Index FutureBrand ©
Thank you!
For further information please contact: Damien Moore-Evans Global Marketing Manager
DD.+44(0)2070670595 M.+44(0)7920590345 F.+44(0)8448751520
Follow me: @BranD_M_E Follow @FutureBrand
dmoore-evans@futurebrand
2 Waterhouse Square 140 Holborn London EC1N 2AE fblog.futurebrand.com www.futurebrand.com