the future of voting? - votem® - votem - voting for a ...“online voting is the future” “the...
TRANSCRIPT

The Future of Voting?A survey about the current and future state
of registration and voting
The #1 reason why people did not vote in 2014, nor in the 2016
primary, is solved by technology
Moreover, allowing people to vote securely online or via their
smartphone could increase voter turnout by ~20%

Survey BackgroundIn late June 2016, the non-profit OurTime.org and Votem partnered to conduct a survey about the current and future state of registration and voting.
OurTime is focused on getting young voters to register to vote and actually
make it to the polls.
Votem is focused on building the world’s most secure mobile voting
platform.
Our joint thesis was that by making both registration and voting easier for citizens, that we could truly increase voter turnout. OurTime and similar organizations have done a tremendous job of getting new voters to register. There is some conclusive evidence that getting voters to register will increase voter turnout, but we believe there is still much work to be done.
• Are you currently registered to vote?
• If you answered “no”, what is the primary reason that you are not registered?
• Did you vote in the general election in 2014?
• If you did not vote in 2014, what was the primary reason that you didn’t?
• Did you vote in the recent 2016 Primary / Caucus in your state?
• If you didn’t vote in the 2016 Primary or Caucus, what was your primary reason you did not?
• Do you intend to vote in the 2016 general election in November?
• If you are not going to vote in the 2016 General Election, what is the primary reason for not voting?
• What method did you typically use to vote?
• If you were confident that your vote was truly anonymous and completely secure, how likely would you be to vote via the following methods?
• How much more likely would you be to vote if you could vote electronically (via phone / online)?
• Age, Gender, Political Affiliations?
The following questions were asked regarding past and future intentions to register and vote, past and future methods of voting, and demographics:
3

Respondent & Survey Information• June 28th, 2016 – July 7th, 2016
• Sent to 252,0111 people from OurTime’s extensive email database
• 16% Open Rate
• # of Survey Respondents: 3,586
Age Distribution
Gender
Male46%
Female54%
0.2%
6.9%
26.6%
14.1%
9.9%
17.7%
24.5%
Under 18 18 - 24 25-34 35-44 45 – 54 55 – 64 65 +
Millennials Generation XBaby
BoomersSilent
Generation
Political AffiliationRepublican
6%
Independent21%
Something Else9%
Prefer Not to Answer5%
Democrat60%
Total Count: 3,401
4

DisclaimersSurvey Disclaimer
We are keenly aware that one might consider these results “suspect”
since they are coming from a mobile voting company, however the email
list that was provided, and the subsequent survey that was sent out
came from the non-profit organization, OurTime.org with no attribution
to Votem.
Respondent Disclaimer
Bare in mind, based on the demographic and background information
available on our survey’s participants, that in no way is the respondent
pool representative of the national population pool. This is evident from
the information gathered, but think it is important to explicitly state
that we are not drawing generalized conclusions about the domestic
population, but rather about the respondent pool.
Margin of Error
At a 95% confidence interval, the margin of error is +/- 2 percentage
points.
5

Why People Don’t Vote?If you were legally allowed to and did not vote, what was the primary reason?
30%
20%18%
9% 9% 8%5%
I couldn't makeit to the polls
Other There were nocandidates that
I wanted tovote for
I forget to vote I didn't want tovote
I didn't knowthere was an
election
There weren'tany issues thatmattered to me
on the ballot
35%31%
15%12%
5%2%
I couldn't get tothe polls
Other There were nocandidates that I
wanted to vote for
I didn't want tovote
I didn't know therewas an election
There were noissues that
mattered to me onthe ballot
2014 General Election
In both the 2014 general election and 2016 Primary/Caucus, respondents who did not vote cited inability to get to the polls as the #1 reason why they
didn’t vote
2016 Primary or CaucusTotal Count: 558 *
Total Count: 1,129 *
The respondents to the questions above are the aforementioned sub-set of those who did not vote in the 2014 general and 2016 primary elections respectively.
* 84.7 % of 3,401 survey respondents answered that they voted in the 2014 general election and 76.6% of 3,401 survey
respondents answered that they voted in the 2016 primary / caucus.
I couldn’t make it to the polls
I couldn’t make it to the polls
6

Why People Don’t Vote?
On a far more statistically significant scale, our takeaway holds true – namely, inability to make it to the polls is a
hugely important factor in why people ultimately do not vote
A 2nd Opinion & Nationally Representative Perspective
The U.S. Census Bureau asked 47,593,000 Americanswhy they did not vote in 2014 and here’s what they found:
10.8%9.5%
28.2%
2.1%0.4%
2.3%
16.4%
9.1% 8.3% 7.6%
2.9% 2.4%
Illness or disability
Out of town
Transport-ation
problems
Bad weather conditions
In –convenient
polling place
Did not like candidates
or campaign issues
Registration problems
Not interested
Other reason
Don't know or refused
Forgot to vote
Too busy, conflicting schedule
53.3 % of U.S. Census Respondents’ reasons they didn’t vote can be tied to
inability to make it to the polls
Source: U.S. Census Bureau, Current Population Survey, November 2014.
7

Why People Don’t Vote?
“I Live in Switzerland and underestimated
the process of voting as an absentee.”
“I was moving around a lot and had changed addresses many times in a year. Since in Washington state we
have ballots mailed to us only, I could not track down my ballot. and, I did not know how else to vote. I was very disappointed.”
“I had a mail ballot but didn't mail it in time. I am disabled. I wanted to vote
it's important to me.“
“I couldn't make it because I had work all
day and I couldn't drive at the time being.”
“I was traveling and forgot to request an
absentee ballot.”
“Out of the country for five months and
traveling 30 days before election.”
“Too lazy – forgot / not easy enough”
“I was traveling abroad and missed the date
before hand to cast an absentee ballot.”
…and there are hundreds of similar responses to the ones above.
Some of the comments that respondents included as reasons why they didn’t:
8

How People Who Do Vote, Vote
In-Person on Election Day
60%In-Person Early Voting14%
Vote Absentee8%
Vote By Mail17%
What Method Did You Typically Use To Vote?
Other1%
74% In-Person Voting
Total Count: 3,459
Traditionally, voters in our survey voted primarily in-person on election day. We suspect this is a function of past behavior (it’s simply how we’ve done it for hundreds of years) and legislative mandate. Furthermore, because so many respondents’ comments focused on not being able to get to the polls…
…this supports the idea that there exists an opportunity to increase voter turnout by providing a more
convenient alternative to in-person voting. 9
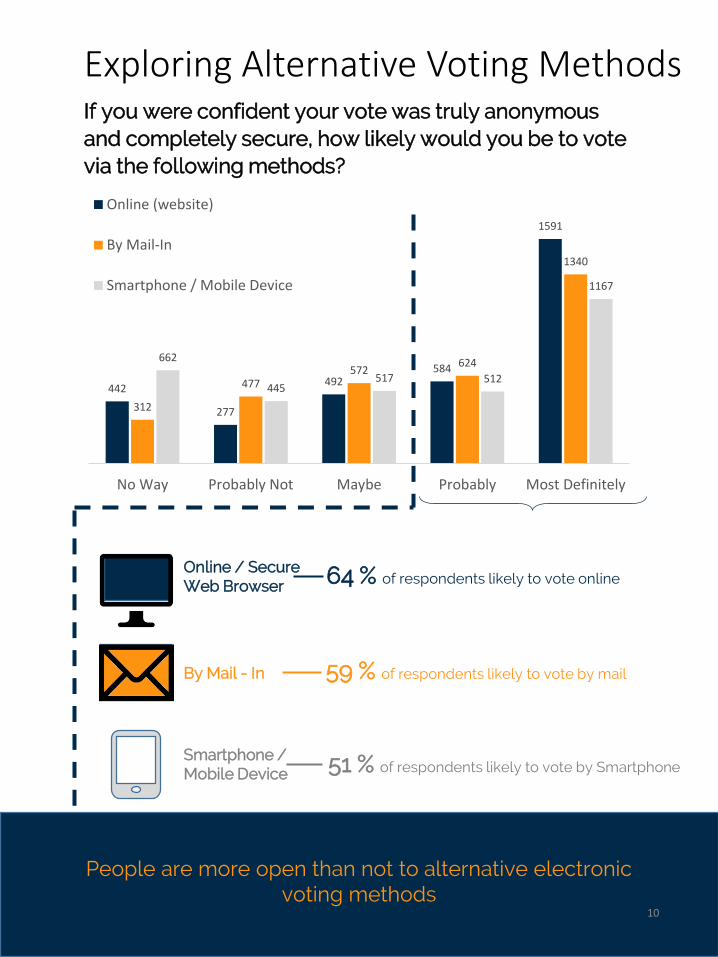
Exploring Alternative Voting MethodsIf you were confident your vote was truly anonymous and completely secure, how likely would you be to vote via the following methods?
442
277
492584
1591
312
477572
624
1340
662
445517 512
1167
No Way Probably Not Maybe Probably Most Definitely
Online (website)
By Mail-In
Smartphone / Mobile Device
Smartphone / Mobile Device
By Mail - In
Online / Secure Web Browser 64 % of respondents likely to vote online
59 % of respondents likely to vote by mail
51 % of respondents likely to vote by Smartphone
People are more open than not to alternative electronic voting methods
10

A Qualitative LookIf you were confident your vote was truly anonymous and completely secure, how likely would you be to vote via the following methods? (Online / Mail / Mobile)
more than 2,000 people commented on this question!
Here’s what people had to say:
“Online voting is the future”
“The internet isn’t secure”
“There is NO way to verify online
voting!!!”
“Believe there could be ways to hack the system”
“I do not trust the integrity of online
voting”
“Voting needs to be made MUCH
easier”
“Electronically is the most
convenient for me”
“I would really love the option to vote
on a secure website”
There emerges a clear tension amongst respondents trying to balance the accessibility and convenience of
online voting with the security and integrity of it. 11

21%
79%
I'd be much more likely to vote if I couldvote online / via my mobile
Wouldn't make a difference because Iplan to vote regardless
21% Of respondents would be more likely to vote
if they could do so electronically
How much more likely would you be to vote if you could vote electronically (via phone / online) ?
So…What effect would electronic voting have on voter turnout?
Total Count: 3,401
12

Does Age Matter?
72%
54%
63%65%
58%55%
62% 63%
45%
56%
66%
32%
Online Mail In Smartphone / Mobile Device
Millenials Generation X Baby Boomers Silent Generation
Let’s revisit: If you were confident your vote was truly anonymous and completely secure, how likely would you be to vote via the following methods?
% of respondents (at least) probably to use:
The overall affinity toward electronic voting options is high – across the age spectrum, by an almost uniform majority (with the exception of those older than 65 for smartphone usage):
people are more likely than not to use a secure web browser or their mobile device as a means of voting if it were available, regardless of age.
With that being said, the proliferation of electronic voting options may affect voter participation rates differently across different age groups.
Simply, it seems younger folk are more amenable to electronic voting whereas older folk are more amenable to relatively traditional voting methods like mail-in ballots. This is not too surprising – we know younger people tend to be very tech-savvy and major proponents of mobile technology. What is surprising though, is that older generations were not far behind their younger counterparts – which we think is more a function of the ease of voting than it is a comfort with technology.
13

While ~ 95% of all respondents in aggregate intend to vote come November, for those older than 55 (Baby Boomers and Silent Generation), the percentage is more like 98%.
In contrast, 8% of millennials (opposed to 2% of the older generations) are not absolutely sold on participating in the vote come November.
Tying in the results that novel electronic voting options may have a relatively greater effect on millennials than on older generations, it’s a fairly sound assumption to make that electronic voting would likely have a larger impact on millennial turnout than on older generations turnout.
The data supports this - this assumption is in total accordance with how each generation self-identifies as reported above:
• 32% of millennials, relative to the survey average of 21%, would be more likely to vote if they could do so online.
• In contrast, only 12% and 9% of Baby Boomers and Silent Generation respectively would be more likely to vote if they could do so online (relative to the survey average of 21%).
32%
24%
12%9%
Millenials Generation X Baby Boomers Silent Generation
% of respondents who’d be more likely to vote if they could vote online
21%
More on Age…
Survey Average
14

As we mentioned before, 95% of all respondents in whole intend to vote come November. What we haven’t discussed though is that:• 76% of those surveyed * actually got out and voted during their state’s 2016
primary - a 24% discrepancy.• 85% of those surveyed* voted in the 2014 general - a 10% discrepancy.
*survey respondent turnout rates, not national voter turnout rates
There does exist a disconnect between intention to vote and actual turnout rates.
Some Final Thoughts
Intend to Vote
76 % in 2016 primary / caucus
85 % in 2014 general
95 %
Actually Vote
VS.
What accounts for this difference? It is a combination of many factors, one key reason being:
the inability to make it to the polls.
By merely increasing the number of ways people can vote, we expect to increase participation and turnout. Specifically, by introducing a method of voting that is markedly more convenient and accessible, like online or mobile voting, we expect the gap between intent and reality will narrow by a statistically significant margin,
15

Technology, in the form of online and mobile voting, will make voting easier for a significant
proportion of the voting population.
The Takeaway
* Assuming secure implementation and guarantees of anonymity, verifiability, and auditability.
16

Jeffrey Stern | Market Intelligence [email protected]
The Future of Voting?A survey about the current and future state of registration and voting
? Any Questions Regarding this Survey?
17