the future of the international monetary and …...the future of the international monetary and...
TRANSCRIPT
The future of the international monetary and financial architecture
Conference proceedings
27-29 June 2016 ⋅ Sintra, Portugal
ECBFORUMON CENTRALBANKING

Contents
Programme 4
Welcome address 6 By Mario Draghi President of the European Central Bank
The domain of central bank independence 7 Dinner speech by Alan S. Blinder Princeton University
The international dimension of monetary policy 13 Introductory speech by Mario Draghi President of the European Central Bank
Global monetary order 21 By Barry Eichengreen
Comment on “Global monetary order” by Barry Eichengreen 64 By Guillermo Calvo
Real interest rates, imbalances and the curse of regional safe asset providers at the Zero Lower Bound 70 By Pierre-Olivier Gourinchas and Hélène Rey
Comment on “Real interest rates, imbalances and the curse of regional safe asset providers at the Zero Lower Bound” by Pierre-Olivier Gourinchas and Hélène Rey 110 By David Vines
The IMF’s power and constraints 123 By Anne O. Krueger
International monetary challenges and responses 127 By Maurice Obstfeld
Three challenges facing emerging market monetary policymakers 136 By Shang-Jin Wei
Financial regulatory reform after the crisis: an assessment 142 By Darrell Duffie
Comment on “Financial regulatory reform after the crisis: an assessment” by Darrell Duffie 184 By Charles Goodhart
Regulation and structural change in financial systems 188 By Stijn Claessens
Comment on “Regulation and structural change in financial systems” by Stijn Claessens 222 By Hyun Song Shin

Financial regulatory reform By Claudia M. Buch, Esteban Prieto and Benjamin Weigert 231
Regulators should take a holistic view of the impact of radical uncertainties on the finance industry By Andrew Sheng 241
Beyond financial system resilience – the need for a new regulatory philosophy By Adair Turner 249
© European Central Bank, 2016
Postal address 60640 Frankfurt am Main, Germany Telephone +49 69 1344 0 Website www.ecb.europa.eu
All rights reserved. Reproduction for educational and non-commercial purposes is permitted provided that the source is acknowledged. These papers should not be reported as representing the views of the European Central Bank (ECB) or the Eurosystem. The views expressed are those of the authors and do not necessarily reflect those of the ECB or the Eurosystem.
ISSN 2363-3239 (online) ISBN 978-92-899-2467-2 (online) DOI 10.2866/482697 (online) EU catalogue No QB-BN-16-001-EN-N (online)

ECB Forum on Central Banking, June 2016 4
Programme Monday, 27 June 2016
6.30 p.m. Opening reception and dinner
Welcome address Mario Draghi, President, European Central Bank
Dinner hosted by the Executive Board of the European Central Bank
Dinner speech – The domain of central bank independence Alan S. Blinder, Professor, Princeton University
Tuesday, 28 June 2016
9 a.m. Introductory speech – The international dimension of monetary policy Mario Draghi, President, European Central Bank
9.30 a.m. Session 1 Macroeconomic and monetary challenges
Chair: Benoît Cœuré, Member of the Executive Board, European Central Bank
Global monetary order Barry Eichengreen, Professor, University of California at Berkeley
Discussant: Guillermo Calvo, Professor, Columbia University
Real interest rates, imbalances and the curse of regional safe asset providers at the Zero Lower Bound Pierre-Olivier Gourinchas, Professor, University of California at Berkeley Hélène Rey, Professor, London Business School
Discussant: David Vines, Professor, University of Oxford
11.30 a.m. Coffee break
12 p.m. Panel: Macroeconomic and monetary challenges Anne O. Krueger, Professor, Johns Hopkins University Maurice Obstfeld, Economic Counsellor and Director of the Research Department, International Monetary Fund Shang-Jin Wei, Chief Economist, Asian Development Bank
1.30 p.m. Lunch
6.30 p.m. Reception and dinner
ECB Forum on Central Banking, June 2016 5
Wednesday, 29 June 2016
9 a.m. Session 2 Financial regulatory challenges
Chair: Benoît Cœuré, Member of the Executive Board, European Central Bank
Financial regulatory reform after the crisis: an assessment Darrell Duffie, Professor, Stanford University
Discussant: Charles Goodhart, Professor em., London School of Economics
Regulation and structural change in financial systems Stijn Claessens, Senior Adviser, Board of Governors of the Federal Reserve System
Discussant: Hyun Song Shin, Economic Adviser and Head of Research, Bank for International Settlements
11 a.m. Coffee break
11.30 a.m. Panel: Financial regulatory challenges
Claudia M. Buch, Deputy President, Deutsche Bundesbank Andrew Sheng, Distinguished Fellow, Fung Global Institute Adair Turner, Chairman, Institute for New Economic Thinking
1 p.m. Lunch
2.30 p.m. Concluding panel
Charles Bean, Professor, London School of Economics Vítor Constâncio, Vice-President, European Central Bank André Sapir, Professor, Université libre de Bruxelles Beatrice Weder di Mauro, Professor, Johannes Gutenberg University Mainz
4 p.m. Award ceremony – young economists' posters
Closing remarks
Group photo
6.30 p.m. Dinner hosted by the Banco de Portugal
ECB Forum on Central Banking, June 2016 6
Welcome address By Mario Draghi President of the European Central Bank
Dear colleagues, Dear friends, Ladies and gentlemen,
Let us for a moment set aside the extraordinary circumstances in which we gather here today. Let us set aside the questions that we have for our British friends, for all of us in the European Union, and indeed for the world at large, and focus on our ECB forum on central banking.
This year’s forum will be devoted to an international topic. Cross-border economic and financial flows have undoubtedly become increasingly relevant.
Over the next days we will focus on both macroeconomic and financial linkages and we will look at the design of the international monetary and financial system.
As in the first two editions, I look forward to an in-depth reflection and inspiring discussion on central banking issues that go beyond our day-to-day policies.
To start off our discussion, I am very glad that Professor Alan Blinder accepted our invitation to deliver tonight’s dinner speech. He is one of the most distinguished economists of our time, professor of economics at Princeton and author of countless key academic articles and books on international economics, fiscal and monetary policy, central banks and the workings of central banks and of financial markets. He served with distinction at the Congressional Budget Office, the Council of Economic Advisers and as Vice-Chairman of the Board of Governors of the Federal Reserve System. In short, I can think of no better speaker for tonight.
ECB Forum on Central Banking, June 2016 7
The domain of central bank independence Dinner speech by Alan S. Blinder Princeton University
Thank you for the kind introduction, Mario, and thanks to the ECB for inviting me to deliver the keynote address to this august and highly knowledgeable gathering. Speaking of which, I am glad to see that so many of you decided to “Remain”, despite the disconcerting vote in the United Kingdom.1 As the title suggests, I want to talk tonight about the proper domain of central bank independence, that is, where should the central bank be independent and where should it not be?
My jumping-off point is a quotation about Montagu Norman, the formidable but not entirely successful Governor of the Bank of England during the interwar period: “Montagu Norman used to dream that the BIS would one day foster a core of central bankers entirely autonomous of governments.”2 Think about that last phrase for a moment: “entirely autonomous of governments”. It’s an audacious wish which, I’d say fortunately, has not come true. Why would Norman even want that? Presumably because politicians could not be trusted to produce “sound money” – a phrase that long predates the modern conception of monetary policy.
As a way to organize my thoughts, I’d like you to notice that the concept of independence implies a kind of monopoly power. If some other agency of government can do (or undo) what you decide, or if you share authority over something, you are not independent. Hence my question about the domain of central bank independence: where do central banks have independence, and where should they have it?
I begin with a list of the five classic functions of a central bank, all but the last of which were known to America’s first Secretary of the Treasury, Alexander Hamilton, who believed that the young United States of America needed a central bank:
1. guardian or operator of the payments system (I subsume, under this heading, acting as the fiscal agent for the government.);
2. supervisor and/or regulator of the nation’s banks or, more broadly, its financial institutions;
3. guardian of financial stability – which is on everyone’s mind today;
4. lender of last resort;
5. monetary policy – the new function, and the one that gets the most attention in the modern world.
I will consider these functions one at a time, in each case asking whether the central bank has or should have a monopoly.
1 The so-called Brexit vote had taken place four days earlier. 2 Solomon (1995).
ECB Forum on Central Banking, June 2016 8
1 The payments system
My phrasing above suggests that the central bank need not have a monopoly over running the payments system, though it is likely to play some role there. In fact, central banks have long been accustomed to sharing this function, that is, to having competitors in providing the various means of payment. The central bank’s primary responsibilities for the payments system are about ensuring that the so-called financial plumbing works extremely well – with far less down time and interruptions than, say, your cable TV provider. We need higher quality than that.
One possible concern here is that a sufficiently large loss of seigniorage revenue from currency could threaten a central bank’s budgetary independence and thus, indirectly, its independence to control monetary policy. So while monopoly may not be important, some reasonable market share may be. Montagu Norman was right about one thing: we don’t want the central bank begging politicians for funding.
2 Supervisor and/or regulator of banks
As this sophisticated audience knows, though many others do not, supervision and regulation are two different, albeit related, functions. So we have at least a 3x3x3 classification under this heading. The central bank can be a supervisor, a regulator, or both. It can supervise/regulate just banks, all financial institutions, or something in-between (example: just SIFIs3). And the central bank can be a microprudential supervisor, a macroprudential supervisor, or both.
In terms of my basic theme, it is clear that the central bank can, in principle, have competitors in most of these 27 cells. And, in practice, most real central banks do have competitors. The 27 cells leave huge scope for cross-country differences in how (and by whom) supervisory and regulatory powers are wielded – something of which Norman probably would not have approved. Here are two well-known examples.
• The Federal Reserve has been a supervisor and regulator since it opened for business in 1914, but has never had monopoly power in either domain. Indeed, the number of competing financial supervisor/regulators we have in the United States is embarrassingly large.
• The ECB was at first written out of the supervisory/regulatory business by design. But then, in the aftermath of the worldwide financial crisis, it was written back in by necessity.
3 Financial stability
The involvement of central banks in preserving (if they could) or restoring (if they could not) financial stability dates back centuries – although it has changed form many times. 3 Systemically important financial institutions.
ECB Forum on Central Banking, June 2016 9
Indeed, the origins of most of the oldest central banks of the world – and of many of the newer ones, too, including the Federal Reserve but not the ECB – stem from the need to protect the country against financial instability. Norman and his friends, by the way, did not acquit themselves very well in this domain.
Do or should central banks have a monopoly in fighting financial instability? I think not. As soon as you begin to ask what other agency of government should have a hand in preserving or restoring financial stability, you realize that the Treasury or Ministry of Finance must be an essential partner – at least in a crisis. Even the legislature might be needed. So monopoly seems out of the question here. As we meet here tonight, I certainly hope Mark Carney and George Osborne are talking!4
4 Lender of last resort
I come now to the first place where the central bank holds a natural monopoly. Indeed, that monopoly is almost a tautology. If you are the lender of last resort, there can’t be another. More substantively, the authority of the lender of last resort (LOLR) would be severely undermined if another hand gripped the throttle.5 Most prominently, to serve as the lender of last resort in a serious crisis, you almost certainly must have the ability to create money, which makes the central bank the only eligible candidate.
With so many central bankers in the room, I feel compelled to call attention to a paradox that is rarely mentioned. Large LOLR loans are almost certain to become highly political events – they will surely be called “bank bailouts”. Yet in all countries that have independent central banks, this function is placed squarely in the hands of non-political, unelected technocrats, that is, people who may not be very skilled at navigating the political waters.
It’s a tough position to be in, but there are good reasons for it. Monopoly power over the LOLR function must be handled with great care for a variety of reasons. Some of them have to do with moral hazard, which can arise if “last resort” status is too easily obtained – something Walter Bagehot understood well almost 150 years ago. Other issues arise in connection with monetary policy because a lender of last resort that is too quick on the trigger can become a source of inflation.
5 Monetary policy
Monetary policy as we know it today is the only central bank function that Hamilton did not imagine. It is also what academic economists are almost always thinking about when they write about central bank independence.
4 Osborne was, at that point, the United Kingdom’s Chancellor of the Exchequer. 5 That said, governments sometimes do, and certainly can, put statutory limits on the central bank’s ability to
make LOLR loans. The post-crisis changes in the Fed’s lending powers under Section 13(3) are a well-known case in point.

ECB Forum on Central Banking, June 2016 10
Skipping blithely over about 70 years of post-Keynesian controversies over the goals and methods of monetary policy, I think it is fair to say that the world’s central banks were well on the way toward a consensus when the crisis struck in 2007-08. According to that developing consensus, monetary policy consisted of manipulating a very short-term (usually overnight) interest rate to achieve a numerical inflation target, typically 2%. The ECB was essentially there with an inflation target “below, but close to, 2%”. The Fed was not quite there yet, with its dual mandate and more vague inflation objective, but it was tolerably close.
Then came the financial crisis which, I would argue, ended that consensus, made the control of inflation less pressing, and also made monetary policy more complicated. Most obviously, central banks’ mandates were either explicitly or implicitly broadened to include financial stability as an important goal.6 In addition, the list of monetary policy instruments was extended well beyond the overnight interest rate, which was rendered inoperable by the effective lower bound. Relatively new tools like quantitative easing and forward guidance, which come in many variants, proliferated.
Let’s remember, in this context, that the main argument for granting central banks independence in the domain of monetary policy was that politicians, with their notoriously short time horizons, would inflate too much. Somewhere, Montagu Norman is nodding. But there are two important buts.
But what if inflation is too low? The first chart shows CPI inflation in the United States from 1948 to now; the second shows the ECB’s favored inflation measure, HICP, since 1996.7 As you know, both central banks post inflation targets near 2% – a little higher for the Fed (because CPI inflation runs above PCE inflation), a little lower for the ECB.8 But, as you also know, actual inflation rates have been scraping zero of late both in the United States and the euro area – and the two central banks have been trying to raise inflation, with limited success. Could it be that non-political central bank technocrats are better at pushing inflation down than up?
But what if modern central banks “listen” to the markets too closely? In teaching my graduate course in central banking at Princeton, where students hail from a wide range of countries, I have learned over the years that the verb “to listen” has the same two meanings in many languages. You can listen as you listen to your mother (that is, obey) or you can listen as you listen to the radio (that is, try to hear). I have long thought that central bankers should listen to the markets in the latter sense, not in the former.9 That distinction is relevant here for a straightforward reason: if central banks listen to the markets in the listen-to-your-mother sense, they will automatically inherit the traders’ super-short time horizons, which make the time horizons of politicians (to wit, until the
6 Curiously, essentially no central banks moved to a dual mandate like the Federal Reserve’s, despite the
acknowledged fact that the Fed’s monetary policy performance was superior to most. 7 See slide 9 of the presentation. 8 Consumer Price Index (CPI), Harmonised Index of Consumer Prices (HICP) and Personal Consumption
Expenditures (PCE). 9 See, for example, my Central Banking in Theory and Practice (1998), pp. 59-62. I developed this theme
further in The Quiet Revolution (2004), Chapter 3. At the conference, Otmar Issing reminded me that Wim Duisenberg, the first president of the ECB, used to say that “we hear, but we don’t listen.”

ECB Forum on Central Banking, June 2016 11
next election) look long by comparison. On trading desks, the time horizon is often the close of business today – or perhaps an hour from now.
If you put these two “buts” together, you are led to a subversive thought, one that seems unsuitable for a gathering of central bankers over dinner. It does, however, lead in a way to my next question: can a central bank be too independent? At one level, the answer is certainly yes. Unlike my foil Montagu Norman, we really don’t want central banks to be “entirely autonomous of governments”.
There is an irony here that won’t be lost on an ECB audience. Back in 1992, when the ECB was designed, and in 1999, when it opened for business, some observers worried that it was too independent. After all, the ECB’s “statutes” are actually part of an international treaty – and hence virtually impossible to change. And, in practice though not in principle, the ECB has no government above it. (Or else it has 19 governments, which is almost the same thing.) So the ECB, it was thought, had absolutely free reign within its legal remit, with no interference from governments – almost like Norman’s vision. In both of these respects, it differed starkly from the Federal Reserve, which must answer to Congress and whose statutes, being ordinary laws, are amendable on a moment’s notice (provided the president will sign laws that Congress passes). But that was then and this is now. Today, President Draghi and his colleagues probably laugh at the notion that the ECB is too independent.
Finally, I want to go back to that pre-crisis consensus on monetary policy, which included central bank independence, and ask whether the crisis changed it. As you will see shortly, central bankers and academics have rather different views on this question.
A new survey conducted by Michael Ehrmann, Jakob de Haan, David-Jan Jansen and myself asked both central bank heads and academics involved in macroeconomics and monetary policy several questions about how central bank independence had or had not changed since the financial crisis.10 I report on the answers to two of them here.
The first question was: how much independence do you believe your central bank either relinquished, saw taken away from it, or gained during the crisis? The chart below shows the answers of central bank heads (in green) and academics (in red).11 They are startlingly different. The academics split about evenly between believing that their country’s central bank lost independence or that it “neither gained nor lost” it. Hardly any academics thought their bank gained independence. Among the central bankers, however, a full 82% placed themselves in the “neither gained nor lost” independence category; and among the remaining 18%, many more chose “gained” than “lost”. One possible explanation for this large discrepancy of views is that the academics come overwhelmingly from the United States and Europe while the central bankers come from all over the world. But that’s speculative at this stage.
Our second question was: how much is your central bank’s independence threatened now or in the near-term future? Here the differences in the responses were, if anything, even more extreme. Central bank heads, whom, I would think, have more accurate readings on 10 Blinder, A.S., Ehrmann, M., de Haan, J. and Jansen, D.J. (2016). 11 See slide 13 of the presentation.

ECB Forum on Central Banking, June 2016 12
such threats, were plainly not worried. Fully 80% thought either that there were no threats or that it was too early to judge. Only 20% worried either “a little”, “a moderate amount”, or “a lot” about such threats. The academics, who were much quicker to reach a judgment (only 3% said it was too early to judge), were also far more concerned – with fully 84% perceiving some threat to independence.
These discrepancies of views are surprising. I’ve surveyed central bankers and academic experts before, and did not find such sharp differences.12 Let’s hope the central bankers have it right.
References
Blinder, A.S. (1998), Central Banking in Theory and Practice, MIT Press, Cambridge, Massachusetts, pp. 59-62.
Blinder, A.S. (2000), “Central Bank Credibility: Why Do We Care? How Do We Build It?”, American Economic Review, December, pp. 1421-1431.
Blinder, A.S. (2004), The Quiet Revolution, Yale University Press, New Haven, Connecticut, Chapter 3.
Blinder, A.S., Ehrmann, M., de Haan, J. and Jansen, D.J. (2016), “Necessity as the mother of invention: Monetary policy after the crisis”, preliminary version of a paper prepared for the 64th Economic Policy Panel, October.
Solomon, S. (1995), The Confidence Game, Simon & Schuster, London, p. 111.
12 Blinder, A.S. (2000).

ECB Forum on Central Banking, June 2016 13
The international dimension of monetary policy Introductory speech by Mario Draghi President of the European Central Bank
In recent years central banks across advanced economies have been engaged in the same task, namely raising inflation and inflation expectations back to levels consistent with price stability. Each has faced conditions particular to its own jurisdiction. Each has deployed measures appropriate to its own context. And each has acted to fulfil the mandate laid down in its own constitution.
And yet, the fact that all central banks have faced a common challenge of low inflation is not coincidental. There are global factors at play. And this begs the question, what is the best way for us to deal with them?
At one extreme, central banks can take global conditions as entirely exogenous and set their policies accordingly. At the other extreme is explicit coordination of monetary policies. In between is a range of informal solutions.
Whatever one’s views on these options, what is clear is that the question of the international dimension of monetary policy is becoming more pertinent, since the common factors affecting central banks are increasing.
1 The global drivers of inflation
Indeed, a growing literature suggests that globalisation has created a common factor in inflation developments, which goes beyond fluctuations in energy or commodity prices. Higher import volumes have increased the importance of international prices and wages relative to domestic ones, making the global output gap more relevant.13
In that context there are two types of factors that are significant for the global low inflation environment we face today: more cyclical factors that have put downward pressure on prices; and more structural factors that have lowered the equilibrium real rate and slowed down the response of the economy to monetary policy.
The first type of factors includes the large negative output gaps generated by the financial crisis and its aftermath, which still average 1% among G7 economies today.14
This global slack has dampened, in particular, import and producer price inflation, both of which have been weak for several years among advanced economies. Prices set by
13 Inflation as a global phenomenon has been documented, for example by Ciccarelli and Mojon (2010).
Measures of global economic slack are good predictors of national inflation in advanced countries, as shown empirically, for example by Borio and Filardo (2007); and in New Keynesian open economy models, for example by Clarida, Galí and Gertler (2002).
14 IMF estimates.
ECB Forum on Central Banking, June 2016 14
producers in the euro area and those set by producers in trading partner countries are indeed highly correlated.15
Also depressing global inflation has been the slump in demand for energy and commodities linked to the slowdown in emerging markets. This has fed not just into lower headline inflation, but also into lower underlying inflation through its effect on costs and imported prices. Indeed, if one decomposes inflation for the average advanced economy, one finds that since mid-2014 there has been a notable rise in the global component, linked largely to oil and commodity price falls.16
These various factors may originate only in parts of the global economy – some originate more in advanced economies, others more in emerging markets – but in an integrated world they have global effects. Cyclical weakness has spilled over through various channels into a similar challenge for all.
The second type of factors is more structural in nature. They concern the global forces that have led to very low real equilibrium interest rates across advanced economies, and hence made it more complicated for monetary policy everywhere to provide the appropriate boost to global demand given an effective lower bound on nominal interest rates. In particular, this has led many central banks in the advanced economies to engage in large-scale unconventional policies.
That low interest rate environment is a consequence of a global excess of desired saving over planned investment, which results from rising net savings as populations plan for retirement; from increased demand for and lower supply of safe assets; from relatively less public capital expenditure in a context of slowing population growth in advanced economies; from the secular shift from industries intensive in physical capital to those more intensive in human capital; and from a slowdown in productivity growth that reduces returns on investment.17
Again, those factors may not be distributed homogenously across economies, but their effects are global because they propagate through global financial markets. With internationally mobile capital, the clearing interest rate that balances saving and investment is more a global concept than a local one. And accordingly, estimates of the equilibrium interest rate suggest that it is very low, possibly even negative, in the euro area, the United States and other advanced economies.18
None of this means that central banks should give up on pursuing their domestic price stability mandates. We have demonstrated with our unconventional tools that it is possible to engineer accommodative financial conditions even when the equilibrium interest rate is low. And we have shown that this can be effective in supporting domestic demand and stoking domestic price pressures, even when disinflationary headwinds are blowing from the global economy.
15 See ECB (2015). 16 See Draghi (2015). 17 See Constâncio (2016). 18 See Holston, Laubach and Williams (2016).
ECB Forum on Central Banking, June 2016 15
But the global nature of low inflation does have two important implications.
2 Coping with monetary policy spillovers
The first is that operating against persistent headwinds arising from abroad has forced central banks to deploy monetary policy with more intensity to deliver their mandates, and that in turn results in higher financial stability risks and spillovers to economic and financial conditions in other jurisdictions.
Such spillovers are not necessarily all negative for the global economy. On the contrary, by securing economic and financial stability in their own jurisdictions, advanced economies also help stabilise other economies through trade and financial linkages. The empirical evidence suggests that the net spillover effect of the measures taken during the crisis has been positive, especially at times – such as after the Lehman crash – when countries have faced common global shocks.19
At the same time, monetary policy has inevitably created destabilising spillovers as well, especially when business cycles have been less aligned. The large exchange rate fluctuations between major currencies, and the pressures some emerging economies have experienced from capital flows, are testament to that. This is not so much a result of the measures central banks have employed20, but rather of the intensity with which they have had to be used.
These negative spillovers have led to a revival of interest in the topic of monetary policy coordination.21
But formal monetary policy coordination is complex, for well-known reasons.22
Central banks have national mandates, not global ones, and are accountable to their domestic parliament. This does not mean, however, that we cannot achieve a better global solution than we have today.
We have seen, for instance, how divergent monetary policies among major central banks can create uncertainty about future policy intentions, which in turn leads to higher exchange rate volatility and risk premia. That then has to be countered with more expansionary monetary policy, increasing spillover effects for others. We also know that competitive devaluations are a lose-lose for the global economy, since they only lead to greater market volatility, to which other central banks are then forced to react to defend their domestic mandates.
So we would all clearly benefit from enhanced understanding among central banks on the relative paths of monetary policy. That comes down, above all, to improving communication over our reaction functions and policy frameworks.
19 See Ammer et al. (2016). See also Georgiadis (forthcoming); Feldkircher and Huber (2015); and Kim (2001). 20 See Ammer et al., op. cit. 21 See Rajan (2016). 22 For a fuller discussion, see Cœuré (2014).
ECB Forum on Central Banking, June 2016 16
The global economy could also benefit from cooperation among spillover-initiating and spillover-receiving economies on how to mitigate unwanted side effects.
One aspect that we need to understand better is how domestic monetary regimes affect the transmission of foreign monetary policy shocks. There has been a debate in recent years as to whether the famous “trilemma” of international macro has collapsed into a “dilemma”, whereby floating exchange rates no longer guarantee autonomy for domestic monetary policy, and policy independence is only possible if capital flows are in fact managed.23
But there is also evidence that exchange rate regimes still matter. Various recent studies support the traditional view that exchange rate flexibility affords at least some degree of insulation from global shocks.24
Another aspect is understanding the role of domestic policies more broadly in mitigating negative spillovers. A large body of empirical work in recent years has shown that fiscal, macroprudential, regulatory and supervisory policies can help mitigate the adverse effects of foreign monetary policy on domestic financial stability.25
Indeed, the experience with the taper tantrum in 2013 showed how differences in domestic policy frameworks shaped the way in which different economies were affected by financial spillovers.26
In other words, it has become clearer since the crisis that the famous “Tinbergen principle”, which we apply at the domestic level, also needs to be applied at the global level. Policymakers need to have sufficient instruments to deliver on their objectives. And when they do have them, they must use them.
3 The need for policy alignment
The second implication of the global nature of low inflation is that there is a common responsibility for addressing its sources, whatever and wherever their origin.
Indeed, to the extent that the environment in which we operate is more affected by the global output gap and the global savings-investment balance, the speed with which monetary policy can achieve domestic goals inevitably becomes more dependent on others – on the success of authorities in other jurisdictions to also close their domestic output gaps; and on our collective ability to tackle the secular drivers of global saving and investment imbalances.
In a recent speech in Brussels I made a similar point regarding the interaction between monetary policy and other policies at the domestic level, such as fiscal and structural policies.27 23 See Rey (2015). 24 For a review, see Frankel (2016). 25 See, for example, Blanchard et al. (2015); Forbes et al. (2015); Afanasieff et al. (2015); Wong et al. (2015); Ostry
et al. (2012); Habermeier et al. (2011); and Lim et al. (2011). 26 See Eichengreen and Gupta (2013).

ECB Forum on Central Banking, June 2016 17
I maintained that central bank independence could best be described as independence in interdependence, since monetary policy can always achieve its objective eventually, but it will do so faster, and with less collateral effects, if the overall policy mix is consistent.
What I am saying here is that the same applies at the global level. We may not need formal coordination of policies. But we can benefit from alignment of policies. What I mean by alignment is a shared diagnosis of the root causes of the challenges that affect us all; and a shared commitment to found our domestic policies on that diagnosis.
Today, for instance, the way in which domestic policies respond to a shortage of demand globally will vary: in some cases, the emphasis may be on increasing public investment; in others, on supporting private demand through more growth-friendly tax and regulatory policy, and of course through monetary policy. The relative stance of stabilisation policies will differ across countries, depending on cyclical positions. But the sign of the effect on global demand needs to be positive.
Similarly, structural policies that aim at raising participation and productivity may take different forms in different places, but they need to achieve the same outcome, which is to increase long-term growth rates and raise equilibrium interest rates.28
Here, fora such as the G20 can play an essential role in bringing about the appropriate alignment of policies. It is key that what is agreed in those fora is translated in the concrete policy actions.
The disappointing outcome of the G20 commitment to raise global growth by 2% with structural measures is one example of how intentions and actions can diverge. It contrasts with the more successful example that was provided by coordinated global fiscal expansion in 2008-09. Such fora of course cannot bind countries into specific actions. But mutual recognition of their common interest can act as a form of coordination device.
That common interest today is a faster closing of the global output gap, more stable global inflation, higher long-term global growth and greater global financial stability.
And such an improved policy mix would help reduce unwanted side effects of monetary policy, since the burden of stabilisation would be better shared across policies. For instance, in the current environment of global slack, the international spillovers from growth-friendly fiscal policies are likely to be wholly positive, since they primarily boost domestic demand in the home country. That is also true within regions, such as the euro area, where there are different local output gaps.
The upshot is that, in a globalised world, the global policy mix matters – and will likely matter more as our economies become more integrated. So we have to think not just about whether our domestic monetary policies are appropriate, but whether they are properly aligned across jurisdictions.
27 See Draghi (2016). 28 For a discussion on the interaction between demand- and supply-side policies at the global level, see Cœuré
(2015).

ECB Forum on Central Banking, June 2016 18
We have to think not just about the composition of policies within our jurisdictions, but about the global composition that can maximise the effects of monetary policy so that our respective mandates can best be delivered without overburdening further monetary policy, and so as to limit any destabilising spillovers. This is not a preference or a choice. It is simply the new reality we face.
References
Afanasieff, Tarsila S., Carvalho, Fabiana L.C.A., de Castro, Eduardo C., Coelho, Rodrigo L.P. and Gregório, Jaime (2015), “Implementing loan-to-value ratios: the case of auto loans in Brazil (2010–11)”, Central Bank of Brazil Working Paper Series, No 380.
Ammer, John, De Pooter, Michiel, Erceg, Christopher and Kamin, Steven (2016), “International Spillovers of Monetary Policy”, IFDP Notes, 8 February 2016.
Blanchard, Olivier, Adler, Gustavo and de Carvalho Filho, Irineu (2015), “Can Foreign Exchange Intervention Stem Exchange Rate Pressures from Global Capital Flow Shocks?”, NBER Working Papers, No 21427.
Borio, Claudio and Filardo, Andrew (2007), “Globalisation and inflation: New cross-country evidence on the global determinants of domestic inflation”, BIS Working Papers, No 227.
Ciccarelli, Matteo and Mojon, Benoît (2010), “Global Inflation”, The Review of Economics and Statistics, Vol. 92, Issue 3, pp. 524-535.
Clarida, Richard, Galí, Jordi and Gertler, Mark (2002), “A Simple Framework for International Monetary Policy Analysis”, Journal of Monetary Economics, Vol. 49, Issue 5, pp. 879–904.
Cœuré, Benoît (2014), “Policy coordination in a multipolar world”, speech at the 5th annual Cusco conference organised by the Central Reserve Bank of Peru and the Reinventing Bretton Woods Committee on “70 years after Bretton Woods: Managing the interconnectedness of the world economy”, Cusco, 22 July 2014.
Cœuré, Benoît (2015), “Paradigm lost: Rethinking international adjustments”, Egon and Joan von Kashnitz Lecture, Clausen Center for International Business and Policy, Berkeley, 21 November 2015.
Constâncio, Vítor (2016), “The challenge of low real interest rates for monetary policy”, lecture at the Utrecht School of Economics, 15 June 2016.
Draghi, Mario (2015), “Global and domestic inflation”, speech at the Economic Club of New York, 4 December 2015.
Draghi, Mario (2016), “On the importance of policy alignment to fulfil our economic potential”, 5th Annual Tommaso Padoa-Schioppa Lecture at the Brussels Economic Forum 2016, Brussels, 9 June 2016.

ECB Forum on Central Banking, June 2016 19
ECB (2015), “The impact of oil prices on euro area inflation”, Box 3, Annual Report 2014.
Eichengreen, Barry and Gupta, Poonam (2013), “Fed tapering and emerging markets”, VOXeu.org.
Feldkircher, Martin and Huber, Florian (2015), “The international transmission of US shocks – Evidence from Bayesian global vector autoregressions”, European Economic Review, Vol. 81(C), pp. 167-188.
Forbes, Kristin, Fratzscher, Marcel and Straub, Roland (2015), “Capital flow management measures: What are they good for?”, Journal of International Economics, Vol. 96, Supplement 1, pp. S76-S97.
Frankel, Jeffrey (2016), “International Coordination”, presented at the 2015 Asia Economic Policy Conference, Federal Reserve Bank of San Francisco.
Georgiadis, Georgios (forthcoming), “Determinants of global spillovers from US monetary policy”, Journal of International Money and Finance.
Habermeier, Karl, Kokenyne, Annamaria and Baba, Chikako (2011), “The effectiveness of capital controls and prudential policies in managing large inflows”, IMF Staff Discussion Note: SDN/11/14.
Holston, Kathryn, Laubach, Thomas and Williams, John C. (2016), “Measuring the Natural Rate of Interest: International Trends and Determinants”, Federal Reserve Bank of San Francisco Working Paper Series, No 2016-11.
Kim, Soyoung (2001), “International transmission of U.S. monetary policy shocks: Evidence from VARs”, Journal of Monetary Economics, No 48, Issue 2, pp. 339-372.
Lim, Cheng Hoon, Columba, Francesco, Costa, Alejo, Kongsamut, Piyabha, Otani, Akira, Saiyid, Mustafa, Wezel, Torsten and Wu, Xiaoyong (2011), “Macroprudential policy: What instruments and how to use them? Lessons from country experiences”, IMF Working Paper, No WP/11/238.
Miranda-Agrippino, Silvia and Rey, Hélène (2015), “World Asset Markets and the Global Financial Cycle”, NBER Working Papers, No 21722.
Ostry, Jonathan D., Ghosh, Atish R., Chamon, Marcos and Qureshi, Mahvash S. (2012), “Tools for managing financial-stability risks from capital inflows”, Journal of International Economics, Vol. 88, Issue 2, pp. 407-421.
Rajan, Raghuram (2016), “Towards rules of the monetary game”, speech at the IMF/Government of India Conference on “Advancing Asia: Investing for the Future”, New Delhi, 12 March 2016.
Rey, Hélène (2015), “Dilemma not Trilemma: The global Financial Cycle and Monetary Policy Independence”, NBER Working Papers, No 21162.

ECB Forum on Central Banking, June 2016 20
Seng, Wong Nai, Lim, Aloysius and Leng, Wong Siang (2015), “Using macro-prudential tools to address systemic risks in the property sector in Singapore”, SEACEN Financial Stability Journal, Vol. 4, pp. 27–41.

ECB Forum on Central Banking, June 2016 21
Global monetary order29 By Barry Eichengreen30
1 Introduction
The title of this paper, given to me by our conference organizers, is an oxymoron. Earlier generations of economists distinguished the international monetary system of the Bretton Woods years from the international monetary “non-system” of the subsequent period (Williamson 1977 was probably the first to use the term). Building on their insight or their way with words, it is tempting to similarly distinguish global monetary order from global monetary disorder and to ponder which term better captures the current state of affairs.
I will argue that the current international monetary and financial architecture, to invoke another popular phrase – this one adopted by the organizers as the title for our conference – displays elements of both order and disorder.31 Order is defined as an arrangement of items in relation to one another according to a particular sequence, pattern or method. Thus, we see elements of order in the exchange-rate arrangements operated by different countries, which are not entirely without logic. We see elements of order in policies toward international capital flows, which include, in different countries, restrictions on capital account transactions, adjustments in macroeconomic policies and the adoption of macroprudential measures. We see elements of order in the provision of international liquidity, denominated mainly in a handful of leading national currencies that are traded in deep and liquid markets and used internationally. Finally, we see elements of order in how oversight of exchange rates, capital flows and international liquidity is provided through the International Monetary Fund, but also through other groupings of countries.32
In some cases this order reflects conscious organization by governments; an example is the creation of the IMF in 1944 and official support for its continuing role in the international monetary and financial system. In other cases the global monetary order is
29 Prepared for the ECB Forum on Central Banking on “The future of the international monetary and financial
architecture”, Sintra, 27-29 June 2016. For various forms of help I am very grateful to Cheryl Applewood, David Beers, Guillermo Calvo, Edd Denbee, Rex Ghosh, Poonam Gupta, Philipp Hartmann, Riit Keerati, Domenico Lombardi, Arnaud Mehl, Jonathan Ostry, Magvash Qureshi, Evan Rose, Minouche Shafik and an anonymous ECB referee.
30 University of California at Berkeley. 31 The phrase “international financial architecture” was popularized by US Treasury Secretary Robert Rubin in a
speech at the Brookings Institution in 1998 prompted by the experience of the Asian financial crisis. First use is seemingly confirmed by Google’s Ngram Viewer, in which the phrase first registers positively that year. There is then a spike in the frequency of references that peaks in 2001-02 before heading steadily downward. The meaning of the phrase is disputed. Rubin did not define it; neither did Michel Camdessus, then Managing Director of the IMF. The one thing about which Camdessus was unambiguously clear was that whatever the concept entailed he wanted the Fund to be in charge of it. Hence my own involvement as an IMF staffer and author of a series of “non-papers” characterizing key aspects of the architecture and suggesting desirable reforms, subsequently published as Eichengreen (1999).
32 The four aspects of the global monetary order cited in this sentence consciously echo the aspects emphasized by Williamson in his 1977 book: Williamson referred to the exchange-rate regime and exchange-rate/balance of payments adjustment; the extent of “market convertibility” (the presence or absence of capital controls and related policies toward capital controls); the supply of reserve assets (international liquidity); and the institution charged with managing the system (the IMF).
ECB Forum on Central Banking, June 2016 22
more spontaneous than organized.33 The pattern observed may not have been consciously assembled but is no less well defined (no less “patterned”) for the fact. An example is the current constellation of pegged and floating exchange rates, which was not planned – unlike the Bretton Woods System it is not the result of an international treaty obligation – but nonetheless has a number of well-defined characteristics.
At the same time, the current architecture also displays elements of disorder, defined by Merriam-Webster as “a confused or messy state”. The constellation of exchange-rate arrangements is nothing if not messy. There is disagreement and confusion about whether these deliver an appropriate degree of economic, monetary and financial stability. The same can be said of the management of capital flows, the provision of international liquidity, and the global safety net cobbled together out of multilateral, regional and bilateral arrangements.
In the next section I explore further what is meant by the global monetary order. The subsequent four sections then examine further four aspects of that order highlighted in this introduction: exchange rates, capital flows, international liquidity, and the global safety net (including the contribution of the IMF). This terrain has been reconnoitred before, but I hope to highlight some surprising and underappreciated facets.
2 What do we mean by global monetary order?
Maybe the most obvious metric on which to gauge the performance of a monetary order is its success in delivering price stability. The first panel of Chart 1 shows global consumer price inflation since 1980. Progress in a more orderly direction, so measured, is impressive. In 1980, recall, the United States was still reeling from high pre-Volcker inflation and other countries were still feeling the inflationary repercussions of two oil shocks. But it is the early 1990s, interestingly, that most stands out for monetary disorder, so measured. 1993, the year with the highest rate of CPI inflation, saw quadruple-digit inflation in the Commonwealth of Independent States, triple-digit inflation in Latin America and the Caribbean, high-double-digit inflation in Emerging and Developing Europe, and mid-double-digit inflation in Sub-Saharan Africa.
Progress since has been impressive. A global inflation rate of 3 ½ per cent is not unsatisfactory by historical standards, nor relative to the professed targets of governments and central banks. It is still closer to those targets (typically 2-3 per cent) if one believes that conventional measures underestimate technical progress and improvements in living standards and therefore overestimate underlying inflation.
Behind these global averages lie less satisfactory national outcomes. Countries in Sub-Saharan Africa are still experiencing inflation well into the double digits, as are Latin American countries like Argentina, Venezuela and Brazil at the time of writing.34 Numerous countries in Europe and East Asia are seeing the change in the CPI dangerously close to or
33 Spontaneous in the sense of Hayek (1973). 34 Space constraints do not allow us to pursue the issue of the accuracy of published inflation charts for
Argentina, Venezuela and other countries; here I simply flag the existence of the problem.

ECB Forum on Central Banking, June 2016 23
in deflationary territory. Chart 1, which shows the unweighted coefficient of variation of CPI inflation rates across IMF members, is a reminder that the cross-country variation in inflation rates has not come down along with average inflation.35
Chart 1 World inflation, annual average and coefficient of variation
(y-axis: world CPI inflation (left-hand scale); coefficient of variation (right-hand scale))
Source: IMF WEO database.
Chart 2 shows the distribution of monetary policy frameworks for 191 IMF members.36 The picture is a bit surprising relative to the conventional wisdom. Starting in 2008, perhaps as expected, there has been some decline in the share of countries formulating monetary policy with respect to a foreign currency or basket of currencies. In practice, this is mainly a decline in the share of countries pegging to the US dollar. However, that there has been no decline in the share of countries that practice monetary-aggregate targeting is surprising given the notice paid to the instability of the relationship between monetary aggregates and inflation.37 There has been no increase in the share of countries engaged in inflation targeting, which is again surprising given the fashion for the latter and the fact that countries adopting inflation targets rarely if ever abandon them (evidence, in other words, that inflation targeting is an absorbing state).38 The growing share of monetary frameworks has been almost entirely concentrated in “other” arrangements in which countries either do not specify their framework or else formulate policy with reference to a
35 The GDP-weighted coefficient of variation paints basically the same picture, aside from a larger drop in cross-
country dispersion in 2009, when many of the world’s large countries experienced the same drop in inflation. Whether greater dispersion of inflation rates is a problem depends, of course, on the nature of the shock causing changes in price levels. One might say the same about deflation itself of course, although I have made my own contrary views clear elsewhere (Eichengreen, Park and Shin 2015).
36 188 members in 2008. These are de facto frameworks as identified by IMF staff, which may differ from officially-announced frameworks.
37 This is true in Europe (as relevant for this conference) and elsewhere; see OECD (2007). 38 Rose (2007), who makes this point about the absorbing-state nature of inflation-targeting regimes, goes so far
as to characterize the result as a “stable international monetary system”. The present perspective suggests that reality is more complex and that more time will have to pass before Rose’s conclusion is definitive.
0
20
40
60
80
100
120
0
5
10
15
20
25
30
35
40
45
1980
1981
1982
1983
1984
1985
1986
1987
1988
1989
1990
1991
1992
1993
1994
1995
1996
1997
1998
1999
2000
2001
2002
2003
2004
2005
2006
2007
2008
2009
2010
2011
2012
2013
2014
world CPI inflation (%, left-hand scale)coefficient of variation (right-hand scale)

ECB Forum on Central Banking, June 2016 24
mix of indicators.39 Evidently, opaque and eclectic approaches continue to have a place in the global monetary order.40
Chart 2 Monetary policy frameworks and exchange-rate anchors, 2008-14
(percentage of IMF members as of 30 April)
2008 2014
Source: IMF AREAER database. Notes: Charts cover 188 member countries and 3 territories: Aruba and Curaçao and Saint Maarten (all in the Kingdom of the Netherlands) and Hong Kong SAR (China). “Other” includes countries that have no explicitly stated nominal anchor but instead monitor various indicators in conducting monetary policy. Also used in a few cases when no relevant information on the country is available.
Chart 3 similarly shows the shares of countries operating hard pegs, intermediate regimes and floating exchange rates (along with the residual category “other”) in 2008 and 2014 according to the IMF’s de facto exchange-rate regime classification.41 The share operating hard pegs has risen due entirely to countries with no separate legal tender (whether through unilateral adoption of the dollar and euro or accession to the euro area).42 There has also been a rise in the share of countries operating intermediate regimes, due almost entirely to increases in crawling pegs; this is the largest single change over this six-year period. Correspondingly, there has been a decline in the share of countries operating floating rates.43 That decline is evident in the share of countries whose currencies float subject to various degrees of intervention, but it is especially evident in the share whose currencies float freely. One possible conclusion is that the global monetary order will continue to feature a variety of different exchange-rate arrangements since no single arrangement is right for all times and places.44 Another conclusion is that, academic 39 The “other” category includes also countries where no information is available. Starting in 2010, however,
country officials were asked to report specific information on monetary frameworks, so the information base has in fact improved over time.
40 This picture is even more pronounced when countries are weighted by their shares in global GDP. 41 Readers will know that there exist a number of alternative taxonomies of de facto exchange-rate regimes that
differ in coverage and merits. For discussion see Tavlas, Dellas and Stockman (2008). 42 Whether euro area members are properly classified as maintaining hard pegs to their monetary-union
partners because there is no separate legal tender or as floating collectively is a judgment call (the answer presumably depends on the question asked); this points up the hazards of adopting the IMF classification.
43 Bleaney, Tian and Yin (2016) analyze trends over a longer period. They similarly conclude that the trend in the direction of greater flexibility has slowed in recent years. They attribute the change mainly to the decline in the level and variability of inflation as documented in Chart 1 above, which has made it easier for countries wishing to do so to hold their exchange rates relatively stable.
44 As argued by Frankel (1999).
U.S. Dollar33.0
Euro14.4
Composite8.0
Other currency3.7
Monetary aggregate
11.7
Inflation targeting
22.9
Other6.4
U.S. Dollar22.5
Euro13.6
Composite6.3
Other currency4.2
Monetary aggregate
13.1
Inflation targeting
17.8
Other22.5

ECB Forum on Central Banking, June 2016 25
advocacy of floating notwithstanding, the prerequisites for successful maintenance of a freely-floating exchange rate are daunting, since they include deep and liquid financial markets, supervision and regulation capable of limiting currency mismatches, a clear and credible policy framework that does not revolve around the exchange rate, and substantial economic size.45 A global monetary order based on free floating, it follows, is no more realistic than a return to a Bretton Woods-style global system of hard pegs.
Chart 3 Exchange-rate arrangements, 2008-14
(percentage of IMF members as of 30 April)
2008 2014
Source: IMF AREAER database. Notes: Charts cover 188 member countries and 3 territories: Aruba and Curaçao and Saint Maarten (all in the Kingdom of the Netherlands) and Hong Kong SAR (China). 2008 data as retroactively classified on 2 February 2009; does not include Kosovo, Tuvalu and South Sudan, which became IMF members on 29 June 2009, 24 June 2010 and 18 April 2012, respectively.
Chart 2 above showed some decline in the shares of countries formulating monetary policy with respect to the value of the currency relative to the dollar, the euro and explicit currency baskets. This of course does not rule out the possibility that countries are implicitly adjusting policy in response to movements in the dollar, the euro and other currencies, shadowing these currencies in ways that the IMF’s de facto exchange-rate classifiers do not perceive. A popular approach to identifying such tendencies is by estimating Frankel-and-Wei (2008) regressions, where the value of the national currency relative to a stable and systematically-neutral numeraire (the SDR or the Swiss franc, for example) is regressed on the major bilateral exchange rates relative to that same numeraire, where the estimated coefficients are interpreted as implicit basket weights.
45 This list of prerequisites suggests that de facto floating should be more frequently observed in advanced than
developing countries. My own preferred measure of the de facto exchange-rate regime (following Urban 2009) is the standard deviation of the change in the exchange rate normalized by the kurtosis of the change in the exchange rate. Intuitively, the standard deviation measures day-to-day fluctuations, while the kurtosis captures the frequency and importance of large jumps or realignments. This measure (aggregated with GDP weights) suggests, as expected, that advanced countries have, on average, been moving toward greater flexibility in recent years and decades, while developing countries have not. For the purpose of these calculations, the post-2008 euro area is treated as a single economy.
Hard peg12.2
Intermediate regime
39.9
Floating39.9
Other managed
arrangement8.0
Hard peg13.1
Intermediate regime
43.5
Floating34.0
Other managed
arrangement9.4

ECB Forum on Central Banking, June 2016 26
Table 1 Exchange-rate regressions, January 2013 – January 2016
Renminbi (RMB)
US dollar (USD)
Euro (EUR)
Japanese yen (JPY)
Adj. R Dominant reference
Albania -0.014 0.058 0.956*** 0.003 0.953 Euro
Argentina 0.537 0.346 0.162 -0.033 0.217 Renminbi
Bolivia -0.023* 1.023*** 0.002 0 0.995 US Dollar
Bosnia -0.001 0.002 0.999*** 0 0.999 Euro
Brazil 0.567** 0.125 0.294*** 0.03 0.325 Renminbi
Bulgaria -0.008 0.019 0.995*** -0.008* 0.991 Euro
Chile 0.392*** 0.410*** 0.207*** -0.014 0.625 US Dollar
Colombia 0.758*** 0.061 0.157** -0.113* 0.419 Renminbi
Croatia 0.033 -0.038 1.010*** 0.002 0.966 Euro
Czech Republic -0.065 0.026 1.012*** 0.003 0.845 Euro
Egypt 0.025 0.956*** -0.010 0.001 0.943 US Dollar
Hong Kong 0.023** 0.976*** 0.003** -0.001 0.999 US Dollar
Hungary 0.091 -0.067 1.012*** -0.015 0.675 Euro
India 0.468*** 0.482*** 0.062* -0.036 0.696 US Dollar
Indonesia 0.650*** 0.343** 0.005 -0.035 0.732 Renminbi
Israel 0.223*** 0.374*** 0.418*** 0.005 0.744 Euro
Jamaica 0.078** 0.906*** 0.010 0.006 0.901 US Dollar
Jordan 0.019 0.992*** -0.004 -0.012** 0.988 US Dollar
Latvia -0.036 0.050 0.990*** 0.001 0.982 Euro
Lebanon 0.021 0.976*** -0.001 -0.002 0.986 US Dollar
Malaysia 0.953*** -0.060 0.070* -0.018 0.658 Renminbi
Mexico 0.643*** 0.117 0.284*** -0.039 0.574 Renminbi
Pakistan 0.020 1.006*** -0.009 -0.029 0.920 US Dollar
Paraguay 0.022 0.956*** 0.030 -0.002 0.759 US Dollar
Peru 0.312*** 0.637*** 0.057*** 0.010 0.886 US Dollar
Philippines 0.403*** 0.571*** 0.018 0.001 0.877 US Dollar
Poland 0.082 -0.051 1.013*** 0.001 0.755 Euro
Romania 0.100* -0.077 1.035*** -0.032 0.879 Euro
Russia 0.956*** 0.066 -0.023 -0.133 0.190 Renminbi
Singapore 0.494*** 0.121 0.205*** 0.135*** 0.845 Renminbi
South Africa 0.651*** -0.151 0.390*** 0.099 0.380 Renminbi
South Korea 0.906*** -0.060 0.076** 0.060* 0.698 Renminbi
Sri Lanka 0.037 0.974*** -0.005 -0.020 0.964 Renminbi
Taiwan 0.530*** 0.448*** -0.005 0.002 0.923 Renminbi
Thailand 0.140 0.157 0.171 0.008 0.137 Euro
Tunisia -0.012 0.318*** 0.660*** 0.029** 0.906 Euro
Turkey 0.048 0.388 0.301** -0.033 0.266 US Dollar
Ukraine 0.328 0.425 0.263 -0.037 0.066 US Dollar
Uruguay -0.152 1.153*** 0.062 -0.052 0.679 US Dollar
Vietnam -0.059 0.960*** -0.006 -0.007 0.980 US Dollar
*** p < 0.01, ** p < 0.05, * p < 0.1. Source: See text.
Table 1 reports such regressions for a sample of 40 emerging markets, using monthly average data from January 2013 through January 2016 from Datastream, including not just the dollar and the euro but also the Japanese yen and Chinese renminbi as possible influences and using the Swiss franc as numeraire. Some of these results are a bit surprising, reflecting the short sample period and correlation among different bilateral rates – all of which is to say that, as with all econometrics, they should be taken with a

ECB Forum on Central Banking, June 2016 27
grain of salt. For what they are worth, the point estimates suggest that in 40 per cent of cases policy is made mainly with reference to the dollar exchange rate, while in another 40 per cent it is made mainly with reference to the euro, and in the remaining 20 per cent it is made mainly with reference to the renminbi. Plausibly, the dominance of the euro is most prevalent in Europe, while dollar dominance is most prevalent in Latin America and the renminbi is most likely to dominate in Asia. This is an indication that today’s international monetary order has regional as well as global dimensions, although it is equally evident (in the results for Asia, for example) that the two geographical dimensions overlap.
To what extent have these changes in exchange-rate management enabled countries to avoid serious bouts of instability – currency crises or crashes? Chart 4 shows a conventional measure of these episodes: instances where the exchange rate depreciates by at least 20 per cent between successive quarters and does not recover 5 per cent or more of that depreciation in the subsequent quarter. Incidence spikes during well-known episodes: with the Latin American crisis in 1982, the EMS crisis in 1992, the Tequila crisis in 1994, the Asian crisis in 1997 and the global financial crisis in 2008. It is tempting to argue that the chart is bell-shaped, that incidence rises with the post-Bretton Woods capital-account liberalization but then falls after the mid-1990s with policy adjustment and reform that better accommodates the post-Bretton Woods reality. But the shape of the curve is in the eye of the beholder.46
Chart 4 Number of currency crises by year
(Q(t) vs. Q(t-1))
Source: See text.
A classic question is whether exchange-rate changes are useful for correcting trade imbalances. In the older literature on the international monetary system or order, this is referred to as “the adjustment problem”. It is fair to say that there is skepticism about the adequacy of this mechanism. When exchange rates change, trade flows and balances do not always respond as expected. Estimates of the elasticity of exports and imports with respect to the real exchange rate vary, to put an understated gloss on the point. Cases like
46 I return to the problem of currency crashes and their correlates in Section 3 below.
23
5
13
76
5
87
3
68
1312
9 9
13
6
98
13
21
6
26
45
13
87 7
6
10
42
10 0
9
4
02
32
3
7
0
5
10
15
20
25
30
1970
1971
1972
1973
1974
1975
1976
1977
1978
1979
1980
1981
1982
1983
1984
1985
1986
1987
1988
1989
1990
1991
1992
1993
1994
1995
1996
1997
1998
1999
2000
2001
2002
2003
2004
2005
2006
2007
2008
2009
2010
2011
2012
2013
2014
2015

ECB Forum on Central Banking, June 2016 28
Japan, where the real exchange rate fell sharply in recent years but exports showed little response, underscore the prevailing sense of doubt.
That said, recent research as I read it comes down firmly on the side that changes in real exchange rates affect the growth of real total exports, exports of goods, exports of manufactures, and real net exports. However, researchers report some evidence of a decline in these elasticities over time. Ahmed, Appendino and Ruta (2015), analyzing 46 countries over the period 1996-2012, find that the elasticity of exports with respect to the real exchange rate is positive and significant (positive in the sense that real depreciation raises real exports) but that the elasticity in question has been falling. They attribute the change to the importance of trade in intermediate goods resulting from the growth of global supply chains, the argument being real depreciation does not reduce the cost of the imported-input component of a country’s exports.47 They provide evidence that the elasticity of exports is less for countries where the import content of exports is higher. Leigh, Lian, Poplawski-Ribiero and Tsyrennikov (2015) and IMF (2016) reach similar conclusions while cautioning that evidence of changes over time is fragile.48 I conclude that real exchange rate changes are still relevant to international adjustment, although there is some reason to think that large changes in real rates, which can have other uncomfortable consequences, may be required to deliver the requisite results.
Separate from whether exchange rates affect exports and the current account is the question of whether currencies tend to move in directions consistent with current account adjustment. The modern literature on the exchange rate as an asset price focuses on the capital rather than the current account. It highlights the enormous growth of capital flows and emphasizes their volatility. Capital flows are also more difficult to measure than trade flows. Conventional balance of payments statistics measure changes in foreign assets and liabilities on the basis of the residence of the issuer, thus failing to capture changes in foreign borrowing and lending by overseas subsidiaries of a country’s financial and non-financial corporations. For some purposes, such as gauging risks to financial stability, borrowing and lending offshore by nationals (which does not result in measured capital flows) may be as consequential as cross-border lending and borrowing. Attempts have been made to adjust statistics on capital flows for this “hidden debt” for some assets, countries and years (see e.g. Turner 2014 and Nordvig and Fritz 2015).
Bearing this in mind, Chart 5 shows two measures of capital flows, capital inflows attributable to non-residents and capital outflows attributable to residents, both scaled by GDP. Three aspects stand out. First, gross capital flows have grown by a factor of five over the period for both advanced economies and emerging markets.49 Contrary to the impression left by some of the literature, the growth of gross flows is not a phenomenon specific to emerging markets. 47 In addition, in a world of global supply chains, real depreciation will reduce the cost of a country’s
intermediate exports to foreign producers, enhancing the competitiveness of the latter in turn and further reducing the effect on real net exports.
48 Trade related to global supply chains has increased only gradually over time, making the associated structural shift in elasticities difficult to pinpoint. Efforts to isolate this effect are complicated by the fact that trade barriers have been reduced, transport costs have declined (due to, inter alia, containerization) and trade in services (where intermediates matter less and elasticities are higher) has increased (Eichengreen and Gupta 2013).
49 The period covered in the chart is longer for the advanced countries than emerging markets, reflecting data availability.

ECB Forum on Central Banking, June 2016 29
Chart 5 The evolution of total gross and net capital flows: advanced and emerging economies
(% of group GDP)
a) Advanced economies
b) Emerging economies
Source: IMF Balance of Payments Statistics.
Second, gross flows are large relative to net flows, and the gap has been widening. This is telling us that gross inflows and outflows are positively correlated in the medium term, something that is sometimes lost from sight in discussions of capital-flow bonanzas and reversals. It makes sense that gross inflows and outflows should be positively correlated in the medium term, of course, insofar as both inflows and outflows tend to be encouraged by the same financial liberalization measures and by financial development more generally.50 Third, net capital flows remain less volatile in advanced countries than emerging markets. This is not immediately apparent from Chart 5, but it is clear in the first panel of Table 2, regardless of whether one’s preferred measure of volatility is the standard deviation or the coefficient of variation of net flows of the median country. (Data here on capital flows are taken from the IMF’s Balance of Payments Statistics; data on GDP are from the World Bank’s World Development Indicators and the IMF’s World Economic
50 Although there can be exceptions, as in the case of emerging markets since the global financial crisis (detailed
below).
-6
-4
-2
0
2
4
6
-30
-20
-10
0
10
20
3019
7019
7119
7219
7319
7419
7519
7619
7719
7819
7919
8019
8119
8219
8319
8419
8519
8619
8719
8819
8919
9019
9119
9219
9319
9419
9519
9619
9719
9819
9920
0020
0120
0220
0320
0420
0520
0620
0720
0820
0920
1020
1120
1220
1320
14
gross outflowsgross inflowsnet Inflows (right-hand scale)
-8
-6
-4
-2
0
2
4
6
8
-20
-15
-10
-5
0
5
10
15
20
1986
1987
1988
1989
1990
1991
1992
1993
1994
1995
1996
1997
1998
1999
2000
2001
2002
2003
2004
2005
2006
2007
2008
2009
2010
2011
2012
2013
2014
gross outflowsgross inflowsnet inflows (right-hand scale)

ECB Forum on Central Banking, June 2016 30
Outlook database. The country sample is limited by data availability; the sample here includes slightly over 100 countries.) That said, there is some evidence of convergence of these alternative measures of volatility between advanced countries on the one hand and emerging and developing economies on the other. The traditional interpretation was that net flows to emerging markets were more volatile because emerging markets were more volatile.51 This is therefore a hint as to what has changed (can you say “Great Recession”?).
Table 2 Capital flows: summary statistics
All economies Advanced economies Emerging economies Developing economies
Median average
Median std. dev.
Median coeff. var.
Median average
Median std. dev.
Median coeff. var.
Median average
Median std. dev.
Median coeff. var.
Median average
Median std. dev.
Median coeff. var.
Net capital flows (CIF - COD)
All sample 1.54 5.30 1.09 0.23 3.19 0.61 1.36 5.34 1.40 2.86 6.70 1.05
1970s 1.88 2.92 0.57 1.21 1.61 0.62 3.19 3.32 0.47 3.40 5.78 0.72
1980s 1.55 3.91 1.01 1.12 1.70 0.60 1.47 4.13 0.97 2.85 5.40 1.68
1990s 1.23 3.70 0.75 0.49 1.84 0.55 1.43 3.97 0.93 0.06 5.41 0.53
2000s 0.75 3.85 0.41 -1.09 3.10 -0.33 0.74 3.55 0.44 3.36 5.77 0.64
2010s 1.27 2.35 0.23 -0.46 2.72 0.02 1.18 2.15 0.22 5.75 2.98 0.32
Total gross capital flows (CIF + COD)
All sample 11.60 10.61 1.00 16.39 15.38 0.96 8.74 8.82 1.04 12.27 11.11 0.94
1970s 7.65 3.45 0.41 6.51 2.28 0.32 7.86 3.52 0.41 11.26 4.29 0.79
1980s 5.77 5.33 0.60 8.83 4.17 0.49 3.67 4.67 0.67 6.32 7.67 0.70
1990s 8.65 6.53 0.68 15.21 9.18 0.67 7.25 5.64 0.69 10.36 6.53 0.61
2000s 15.48 9.95 0.74 33.22 16.25 0.59 12.84 8.55 0.76 14.48 10.32 0.74
2010s 11.40 6.25 0.51 11.83 11.86 0.62 10.69 5.30 0.50 12.30 5.75 0.49
Capital inflows by foreign agents (CIF)
All sample 6.34 6.34 1.00 8.15 8.42 0.99 4.52 5.63 1.10 7.34 7.52 0.91
1970s 5.06 2.48 0.43 4.13 1.89 0.44 5.20 2.47 0.41 6.30 3.22 0.81
1980s 3.86 3.43 0.63 5.26 2.85 0.53 2.68 3.37 0.67 5.35 5.71 0.99
1990s 4.99 4.44 0.67 7.41 5.00 0.64 4.25 4.25 0.73 5.04 4.47 0.62
2000s 7.41 5.71 0.74 16.12 8.16 0.67 5.13 4.69 0.76 7.81 5.94 0.74
2010s 5.94 3.10 0.45 6.05 6.37 0.83 4.69 2.71 0.43 8.78 3.10 0.43
Capital outflows by domestic agents (COD)
All sample 4.48 5.67 1.18 8.41 7.69 1.00 3.92 4.27 1.27 4.30 5.78 1.44
1970s 2.62 2.13 0.77 2.56 1.55 0.68 2.52 2.19 0.79 3.60 3.29 0.71
1980s 1.57 2.59 1.09 3.79 2.38 0.64 1.00 2.35 1.27 1.14 4.10 1.24
1990s 3.82 3.47 0.95 7.42 4.54 0.65 2.92 2.84 1.09 3.88 3.58 0.95
2000s 7.52 5.36 0.82 17.30 7.46 0.55 5.51 4.22 0.77 4.96 5.73 1.14
2010s 4.32 3.53 0.58 6.01 5.97 0.53 4.48 3.34 0.55 3.79 3.41 0.87
Number of countries 103 22 57 24
Source: See text. Notes: This table shows the summary statistics of capital flows by both foreign and domestic agents (CIF and COD), net capital inflows (CIF - COD) and total gross capital flows (CIF + COD). Capital flows are scaled by trend GDP. The median values of country averages and of country standard deviations of capital flows are reported. The chart reports the results for all of the countries in the sample, as well as separately for high-income, upper-middle-income and lower-middle-income countries. The sample period is from 1970 to 2014.
Total gross flows (the second panel of Table 2) are larger in advanced countries, but their volatility as measured by the coefficient of variation of the median country again looks similar across the three country groupings. The volatility of gross flows, so measured, has been rising for the advanced countries but not obviously for emerging markets and developing countries, consistent with what we saw above.
51 Where net capital flows are used to smooth consumption in the face of output volatility in the conventional
model.
ECB Forum on Central Banking, June 2016 31
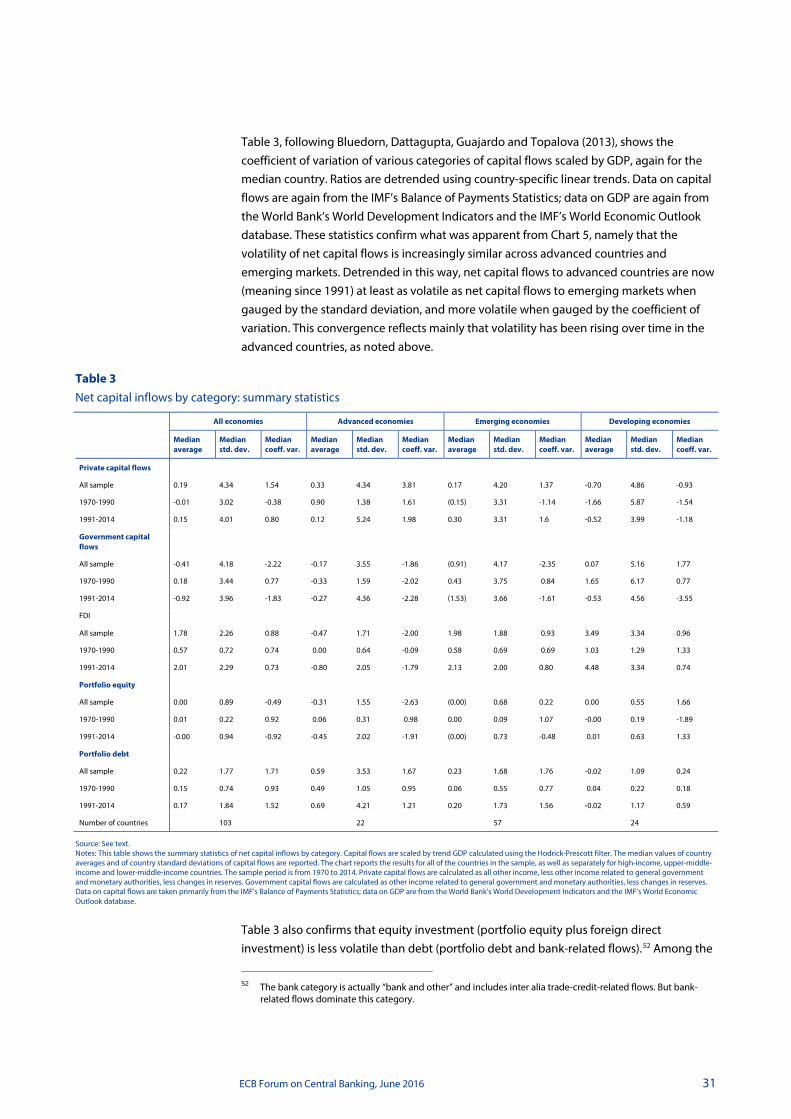
Table 3, following Bluedorn, Dattagupta, Guajardo and Topalova (2013), shows the coefficient of variation of various categories of capital flows scaled by GDP, again for the median country. Ratios are detrended using country-specific linear trends. Data on capital flows are again from the IMF’s Balance of Payments Statistics; data on GDP are again from the World Bank’s World Development Indicators and the IMF’s World Economic Outlook database. These statistics confirm what was apparent from Chart 5, namely that the volatility of net capital flows is increasingly similar across advanced countries and emerging markets. Detrended in this way, net capital flows to advanced countries are now (meaning since 1991) at least as volatile as net capital flows to emerging markets when gauged by the standard deviation, and more volatile when gauged by the coefficient of variation. This convergence reflects mainly that volatility has been rising over time in the advanced countries, as noted above.
Table 3 Net capital inflows by category: summary statistics
All economies Advanced economies Emerging economies Developing economies
Median average
Median std. dev.
Median coeff. var.
Median average
Median std. dev.
Median coeff. var.
Median average
Median std. dev.
Median coeff. var.
Median average
Median std. dev.
Median coeff. var.
Private capital flows
All sample 0.19 4.34 1.54 0.33 4.34 3.81 0.17 4.20 1.37 -0.70 4.86 -0.93
1970-1990 -0.01 3.02 -0.38 0.90 1.38 1.61 (0.15) 3.31 -1.14 -1.66 5.87 -1.54
1991-2014 0.15 4.01 0.80 0.12 5.24 1.98 0.30 3.31 1.6 -0.52 3.99 -1.18
Government capital flows
All sample -0.41 4.18 -2.22 -0.17 3.55 -1.86 (0.91) 4.17 -2.35 0.07 5.16 1.77
1970-1990 0.18 3.44 0.77 -0.33 1.59 -2.02 0.43 3.75 0.84 1.65 6.17 0.77
1991-2014 -0.92 3.96 -1.83 -0.27 4.36 -2.28 (1.53) 3.66 -1.61 -0.53 4.56 -3.55
FDI
All sample 1.78 2.26 0.88 -0.47 1.71 -2.00 1.98 1.88 0.93 3.49 3.34 0.96
1970-1990 0.57 0.72 0.74 0.00 0.64 -0.09 0.58 0.69 0.69 1.03 1.29 1.33
1991-2014 2.01 2.29 0.73 -0.80 2.05 -1.79 2.13 2.00 0.80 4.48 3.34 0.74
Portfolio equity
All sample 0.00 0.89 -0.49 -0.31 1.55 -2.63 (0.00) 0.68 0.22 0.00 0.55 1.66
1970-1990 0.01 0.22 0.92 0.06 0.31 0.98 0.00 0.09 1.07 -0.00 0.19 -1.89
1991-2014 -0.00 0.94 -0.92 -0.45 2.02 -1.91 (0.00) 0.73 -0.48 0.01 0.63 1.33
Portfolio debt
All sample 0.22 1.77 1.71 0.59 3.53 1.67 0.23 1.68 1.76 -0.02 1.09 0.24
1970-1990 0.15 0.74 0.93 0.49 1.05 0.95 0.06 0.55 0.77 0.04 0.22 0.18
1991-2014 0.17 1.84 1.52 0.69 4.21 1.21 0.20 1.73 1.56 -0.02 1.17 0.59
Number of countries 103 22 57 24
Source: See text. Notes: This table shows the summary statistics of net capital inflows by category. Capital flows are scaled by trend GDP calculated using the Hodrick-Prescott filter. The median values of country averages and of country standard deviations of capital flows are reported. The chart reports the results for all of the countries in the sample, as well as separately for high-income, upper-middle-income and lower-middle-income countries. The sample period is from 1970 to 2014. Private capital flows are calculated as all other income, less other income related to general government and monetary authorities, less changes in reserves. Government capital flows are calculated as other income related to general government and monetary authorities, less changes in reserves. Data on capital flows are taken primarily from the IMF’s Balance of Payments Statistics; data on GDP are from the World Bank’s World Development Indicators and the IMF’s World Economic Outlook database.
Table 3 also confirms that equity investment (portfolio equity plus foreign direct investment) is less volatile than debt (portfolio debt and bank-related flows).52 Among the
52 The bank category is actually “bank and other” and includes inter alia trade-credit-related flows. But bank-
related flows dominate this category.

ECB Forum on Central Banking, June 2016 32
advanced economies, the volatility of all types of capital flows rose between the first and second halves of the period, 1970-1990 and 1991-2014; this is true whether one measures volatility of flows by the standard deviation or the coefficient of variation. For emerging markets and developing countries, the standard deviations of the various types of capital flows similarly rose between the first and second subperiods, although the corresponding coefficients of variation did not rise uniformly, given how average levels also rose sharply.
It is worth asking how the recent decline in capital flows, to emerging markets in particular, fits into this picture. Net capital flows to emerging markets turned negative in 2015 for the first time since 1980. The swing from peak in 2009 to trough in 2015 is comparable as a share of recipient-country GDP to that experienced in the first half of the 1980s and second half of the 1990s. This is consistent with the observation that the volatility of net flows remains a fact of life for emerging markets. But as Chart 5 makes clear, net capital flows between advanced economies have also fallen (Bussiere, Schmidt and Valla 2016), consistent with the observation that the volatility of flows, so measured, is no longer a phenomenon peculiar to emerging markets. On balance, equity investment, especially FDI, has held up better than debt flows in the current episode, consistent with our emphasis on the relative stability of the former. The one obvious difference from previous episodes is that where gross inflows and outflows tended to be positively correlated in past cycles, this time there is more evidence of negative co-movement, with gross outflows from emerging markets rising at the same time as gross inflows decline. IMF (2016a) describes this as an unintended consequence of financial development and of the growing integration of emerging economies into global financial markets, which work to amplify the volatility of net capital flows.
Another important aspect of international capital flows, in addition to the distinction between debt and equity and between banks and bonds, is that between domestic- and foreign-currency-denominated debt. (For my sins I am obliged to discuss “original sin”.) Foreign-currency-denominated debt complicates use of the exchange rate as an adjustment mechanism, since any favorable impact of depreciation on the trade balance will be accompanied by an unfavorable impact on the real burden of debt (Kliatskova and Mikkelsen 2015). It hamstrings efforts to extend emergency assistance to indebted nationals insofar as the authorities possess limited foreign-currency-denominated resources. Thus, the fact that emerging markets have made progress in marketing domestic-currency-denominated debt securities, to non-nationals in particular, is seen as important progress in developing a more stable and smoothly-functioning global monetary order (see inter alia Burger, Warnock and Warnock 2012, Moody’s 2015 and IMF 2016).
As recent events have made clear, this picture is incomplete. Du and Schreger (2015), in a review of 14 emerging markets, confirm that the share of external public debt denominated in domestic currency rose across the board between 2004 and 2012.53 The same was not true, however, of the external debt of corporations. Its currency composition
53 Governments of European countries like Poland and Hungary, which borrowed increasingly in euros, were the
exception. The authors combine data from BIS debt statistics, Bloomberg and Thomson. In principle, this should account for the problem of hidden offshore borrowing by foreign corporate subsidiaries cited above.

ECB Forum on Central Banking, June 2016 33
showed little change, and the vast majority of external corporate debt (80 to 90 per cent of the total) is still denominated in foreign currency.54
I am not aware of a convincing explanation for why emerging-market corporates have loaded up on foreign-currency borrowing since the financial crisis.55 The reassuring interpretation, heard more often in the past than the present, is that the corporations in question are naturally hedged. Because they export, they have foreign-currency-denominated assets to match their liabilities. But the fact that countries in which corporates have large amounts of foreign-currency debt also have lower sovereign ratings cautions against this interpretation. Nor is there any obvious reason why natural hedges should have become more prevalent since the crisis.
It could be that emerging markets have made more progress in strengthening government budgets than strengthening corporate governance, allowing corporate borrowers to systematically undervalue the risks of foreign-currency borrowing (Caballero and Krishnamurthy 2003), and that risk-neutral foreign lenders allow them to do so. It could be that international investors underestimate the risk of default by corporations with foreign-currency debts when the borrower’s currency depreciates (see e.g. Delikouras, Dittmar and Li 2012). It could be that non-financial corporations in emerging markets are arbitraging regulations constraining the activities of financial institutions, borrowing abroad where interest rates are low and investing in higher-yielding domestic assets like bank deposits (Caballero, Panizza and Powell 2015). The closest thing to a synthesis is that emerging market corporates have been lured to borrow in foreign currency by unprecedentedly low interest rates in countries engaged in quantitative easing (Chui, Kuruc and Turner 2016); they are prepared to incur those foreign-currency exposures, and foreign creditors are willing to extend them, because emerging-market countries have accumulated massive foreign-currency reserves which they will use to pay off these debts in extremis.56
No discussion of the role of capital flows would be complete without corresponding discussion of capital-flow regulation, the liberalization of restrictions on capital movements obviously having played a role in their extraordinary growth, and residual regulation being a conspicuous feature of the global monetary and financial order. Chart 6 shows the Chinn-Ito (2006) index of capital account openness, constructed on the basis of the IMF’s de jure “Exchange Arrangements and Exchange Restrictions” measures, since 1970, separately for advanced and developing countries. As is well known, the advanced countries moved further in the direction of open capital accounts over the period than emerging and developing economies, with the value of the Chinn-Ito index tripling in the advanced countries but rising more slowly and erratically in emerging and developing countries. The advanced countries underwent a sharp increase in financial openness in the 54 Using IMF data, Acharya et al. (2015) document the same pattern. IMF (2016) shows the share of non-
governmental emerging market debt in domestic currency rising from 2004 through 2009 but then falling through 2015, where the share of the median country is again between 10 and 20 per cent.
55 This is in contrast to the literature seeking to understand why governments borrow in foreign currency, for example Calvo (1996), where foreign-currency debt is a self-imposed constraint on monetary policymakers otherwise lacking in discipline.
56 In addition, Jeanne (2005) suggests that foreign-currency liabilities may be optimal for corporations when monetary policymakers lack discipline and chief financial officers wish to hedge against the risk of a rise in local-currency borrowing costs. However, Jeanne’s mechanism is hard to square with a world in which governments possess the credibility needed to borrow in local currency.
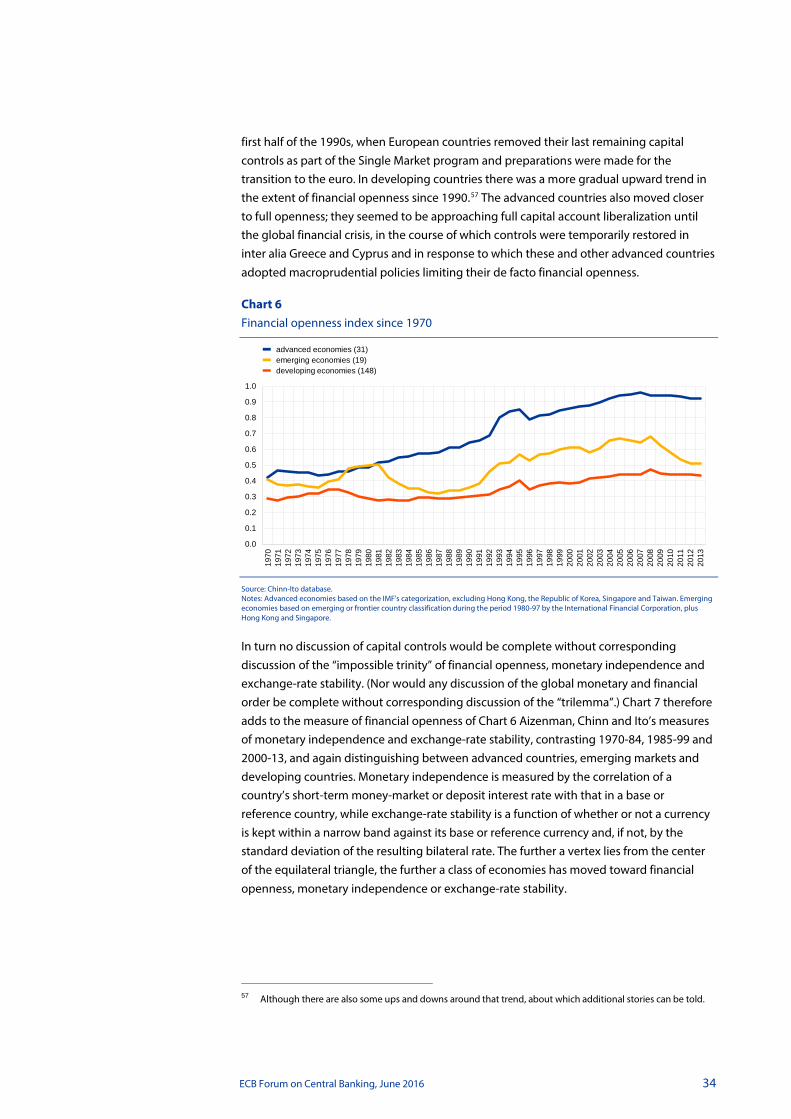
ECB Forum on Central Banking, June 2016 34
first half of the 1990s, when European countries removed their last remaining capital controls as part of the Single Market program and preparations were made for the transition to the euro. In developing countries there was a more gradual upward trend in the extent of financial openness since 1990.57 The advanced countries also moved closer to full openness; they seemed to be approaching full capital account liberalization until the global financial crisis, in the course of which controls were temporarily restored in inter alia Greece and Cyprus and in response to which these and other advanced countries adopted macroprudential policies limiting their de facto financial openness.
Chart 6 Financial openness index since 1970
Source: Chinn-Ito database. Notes: Advanced economies based on the IMF's categorization, excluding Hong Kong, the Republic of Korea, Singapore and Taiwan. Emerging economies based on emerging or frontier country classification during the period 1980-97 by the International Financial Corporation, plus Hong Kong and Singapore.
In turn no discussion of capital controls would be complete without corresponding discussion of the “impossible trinity” of financial openness, monetary independence and exchange-rate stability. (Nor would any discussion of the global monetary and financial order be complete without corresponding discussion of the “trilemma”.) Chart 7 therefore adds to the measure of financial openness of Chart 6 Aizenman, Chinn and Ito’s measures of monetary independence and exchange-rate stability, contrasting 1970-84, 1985-99 and 2000-13, and again distinguishing between advanced countries, emerging markets and developing countries. Monetary independence is measured by the correlation of a country’s short-term money-market or deposit interest rate with that in a base or reference country, while exchange-rate stability is a function of whether or not a currency is kept within a narrow band against its base or reference currency and, if not, by the standard deviation of the resulting bilateral rate. The further a vertex lies from the center of the equilateral triangle, the further a class of economies has moved toward financial openness, monetary independence or exchange-rate stability.
57 Although there are also some ups and downs around that trend, about which additional stories can be told.
0.0
0.1
0.2
0.3
0.4
0.5
0.6
0.7
0.8
0.9
1.0
1970
1971
1972
1973
1974
1975
1976
1977
1978
1979
1980
1981
1982
1983
1984
1985
1986
1987
1988
1989
1990
1991
1992
1993
1994
1995
1996
1997
1998
1999
2000
2001
2002
2003
2004
2005
2006
2007
2008
2009
2010
2011
2012
2013
advanced economies (31)emerging economies (19)developing economies (148)
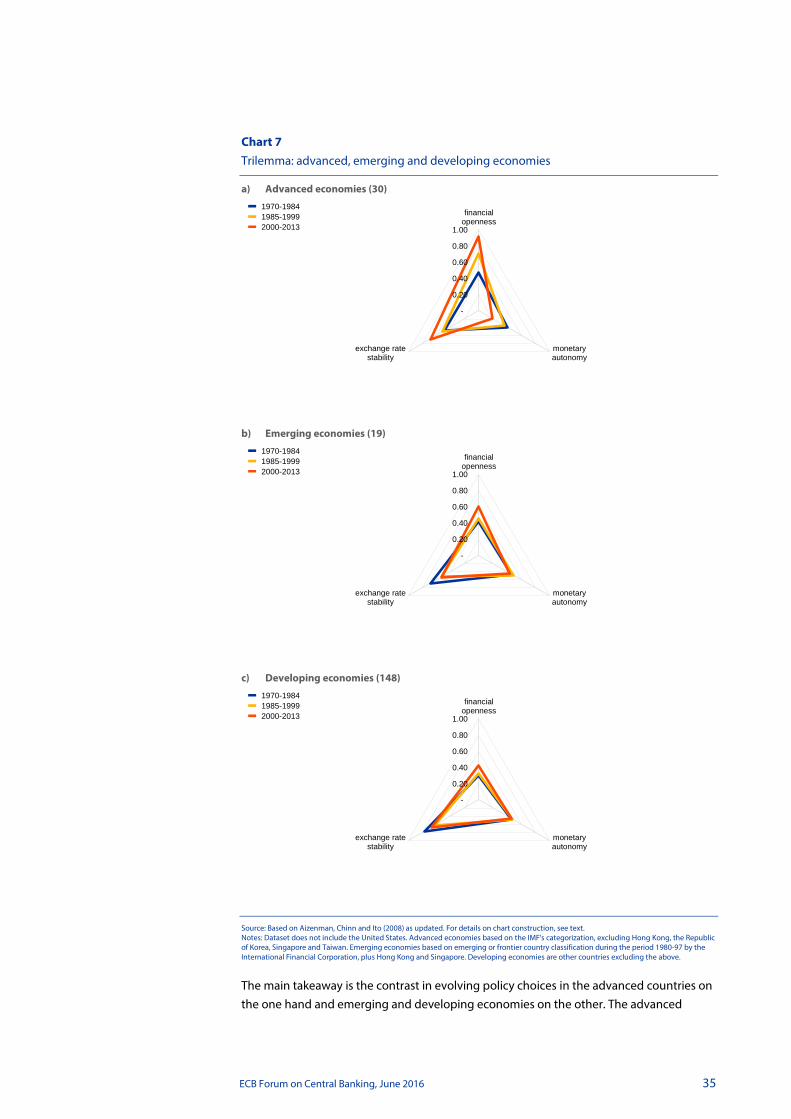
ECB Forum on Central Banking, June 2016 35
Chart 7 Trilemma: advanced, emerging and developing economies
a) Advanced economies (30)
b) Emerging economies (19)
c) Developing economies (148)
Source: Based on Aizenman, Chinn and Ito (2008) as updated. For details on chart construction, see text. Notes: Dataset does not include the United States. Advanced economies based on the IMF's categorization, excluding Hong Kong, the Republic of Korea, Singapore and Taiwan. Emerging economies based on emerging or frontier country classification during the period 1980-97 by the International Financial Corporation, plus Hong Kong and Singapore. Developing economies are other countries excluding the above.
The main takeaway is the contrast in evolving policy choices in the advanced countries on the one hand and emerging and developing economies on the other. The advanced
-
0.20
0.40
0.60
0.80
1.00
financialopenness
monetaryautonomy
exchange ratestability
1970-19841985-19992000-2013
-
0.20
0.40
0.60
0.80
1.00
financialopenness
monetaryautonomy
exchange ratestability
1970-19841985-19992000-2013
-
0.20
0.40
0.60
0.80
1.00
financialopenness
monetaryautonomy
exchange ratestability
1970-19841985-19992000-2013

ECB Forum on Central Banking, June 2016 36
countries on balance have opted for greater financial integration and exchange-rate stability, sacrificing a degree of national monetary autonomy in the bargain. While movement toward greater financial openness at the expense of monetary autonomy is evident in both euro-area and non-euro-area advanced countries, movement in the direction of greater exchange-rate stability is almost entirely a euro-related phenomenon, although there is also some movement in the direction of greater exchange-rate stability, as measured here, for other countries such as Denmark and Switzerland.
Movement in emerging markets and developing countries is less apparent to the naked eye. To the extent that it is evident, it appears that emerging markets and to a lesser extent developing countries have coupled greater financial openness with greater exchange-rate flexibility, thereby sacrificing less monetary autonomy relative to the status quo.58 Whether one is convinced that this is evidence that developing countries and emerging markets possess significant monetary independence depends, of course, on one’s assessment of the adequacy of the correlation of short-term interest rates as a measure of monetary-policy autonomy.59
In sum, the global monetary order continues to be characterized by a variety of different exchange-rate and monetary regimes, by increasingly large and volatile international capital flows, by currency mismatches whose locus is changing but whose risks are not, and by adjustment mechanisms whose adequacy is subject to question.
3 Exchange rates
The trilemma also offers a way of thinking about the longer-term evolution of exchange-rate arrangements. Under the gold standard currencies were held stable (relative to gold and, through gold-market arbitrage, to one another). Since capital accounts were open, central banks and governments had only limited monetary autonomy.60 But the intellectual and political context made sacrificing monetary autonomy feasible. Intellectually, there was no articulated theory linking monetary policy (in practice the level of the discount rate) to the state of the economy or even appreciation of the central bank’s lender-of-last-resort function. Politically, there was little resistance to prioritizing exchange-rate stability and little pressure to target other monetary goals when the electoral franchise was limited to the wealthy, when trade unions and parliamentary labor parties were unimportant, and when information (both conceptual and statistical) on other potentially relevant aggregates like unemployment was missing (Eichengreen 1998).
In the interwar period, central banks and governments approached the trilemma the same way, but the preconditions for forsaking monetary autonomy were no longer present. The
58 Sacrificing little in the way of monetary autonomy as measured here, it should be emphasized. Arteta, Klein
and Schambaugh (2016), slicing the data in a different way, similarly conclude that exchange-rate stability and financial openness are negatively correlated in emerging markets.
59 Nor is this to assert that such monetary autonomy as they possess necessarily provides complete insulation against shocks; Rey (2015) makes the counter-case.
60 That is, central banks and governments enjoyed limited monetary autonomy in normal times. In exceptional circumstances they might suspend convertibility (reintroducing exchange-rate flexibility) in order to regain the ability to act as lenders of last resort (Bordo 1996). This of course presupposed an appreciation of the lender-of-last-resort function (see below).
ECB Forum on Central Banking, June 2016 37
franchise was extended after World War I, and parliamentary labor parties gained voice. Union density rose. New analytical frameworks linked money, prices and, by implication, central bank policy to the state of the economy (see e.g. Keynes 1923). Hence when economic or financial conditions deteriorated, it was not clear whether policymakers would be able to prioritize exchange-rate stability as before. Markets were quick to test their commitment (Eichengreen and Jeanne 2000). Some countries responded by abandoning currency stability. Others responded by sacrificing financial openness.
This experience was not happy. The contradictions of a system prioritizing exchange-rate stability and capital mobility while sacrificing monetary autonomy when the circumstances needed in order to do so were no longer present were widely blamed for the onset of the global depression. The currency wars and capital controls with which countries responded in the 1930s were indicted as beggar thy neighbor. The monetary policies made possible by the new exchange-rate cum capital control regime lacked coherence and failed to promptly end the depression.
Bretton Woods was then an experiment with an alternative trilemma configuration: stable exchange rates, greater monetary autonomy, and limits on capital flows. In practice, however, monetary policy was acyclic. Capital controls provided only partial insulation (more partial as the period progressed). There was nothing resembling inflation targeting to guide monetary policy, so central banks continued to make policy with reference to currency pegs. Systematic monetary policy responding to the output gap and deviations of inflation from desired levels then developed in two stages, as McGetigan et al. (2013) show. First, there was an increase in the countercyclicality of monetary policy in the 1970s, mainly in the advanced countries, following the abandonment of Bretton Woods’ par values.61 Then there was a further increase in countercyclicality in the late 1980s and early-to-mid-1990s, first in advanced countries and then emerging markets, as inflation targeting and Taylor-like rules were adopted as frameworks for monetary policy. Different countries implemented these frameworks in different ways as a function of their willingness to trade off exchange-rate stability and open capital accounts, where different countries positioned themselves differently on this spectrum (see Section 2 above).
Where they positioned themselves was shaped in part by the relationship between the exchange-rate regime and susceptibility to crises – both the reality and perception. Much of the literature has focused on currency crises in emerging markets (e.g. Obstfeld and Rogoff 1995, Rogoff et al. 2004), concluding that hard pegs and free floats are less crisis prone than intermediate regimes. Ghosh, Ostry and Qureshi (2014) generalize the point: their tabulations for 52 emerging markets over the period 1980-2011 confirm that countries with intermediate regimes (managed floats, soft pegs, bands and crawls) suffer from more frequent currency crises than countries with hard pegs and freely-floating rates. There is also a relatively high incidence of banking crises, debt crises and growth collapses in emerging markets with intermediate regimes, although that incidence is comparable for emerging markets operating hard pegs in the case of debt crises, and it is even greater for growth crises (as if countries with hard pegs obtain their currency stability at the cost of other forms of instability).
61 The cyclicality of policy is measured by the correlation between the cyclical component of real GDP and the
cyclical component of the real short-term interest rate.

ECB Forum on Central Banking, June 2016 38
Table 4 updates their tabulations through 2015 and, in addition, extends the comparison from 52 emerging markets to the entire range of IMF members (appropriately, it can be argued, for a paper on the global monetary order). Crisis dates are constructed following standard practice in the literature and by Ghosh, Ostry and Qureshi, although for currency crises we focus on large quarter-over quarter changes in exchange rates, rather than large year-on-year changes, as the former work better for situating crises in the years suggested by the qualitative literature.62
Table 4 Crisis frequency, 1980-2015
(%)
Banking Currency Sovereign Growth
51 emerging markets
Hard pegs 3.10 0.78 1.55 6.98
Intermediate 4.10 6.03 2.24 3.79
Peg to single currency 2.98 7.28 3.31 5.30
Basket peg 5.15 3.09 1.03 7.22
Horizontal band 7.04 7.04 2.82 2.82
Crawling peg/band 6.89 7.49 2.69 3.59
Managed float 2.24 4.69 1.43 2.45
Independent float 1.12 5.59 0.56 3.91
181 IMF members
Hard pegs 2.57 1.21 1.37 5.15
Intermediate 2.32 4.90 1.26 3.33
Peg to single currency 1.08 4.98 1.08 4.26
Basket peg 2.21 4.43 1.85 4.61
Horizontal band 2.76 2.76 1.03 1.03
Crawling peg/band 5.64 6.55 1.52 3.20
Managed float 1.85 4.64 1.10 2.28
Independent float 2.12 3.92 0.33 3.43
Source: See text.
For emerging markets, the updated data again suggest that intermediate regimes are especially susceptible to banking, currency and sovereign debt crises.63 These patterns basically carry over to the tabulations for the larger set of (181) IMF members, although tabulations for this expanded set paint hard pegs in a less favorable light (the incidence of banking and sovereign debt crises in countries with such regimes is relatively high),
62 Banking crises come from the Laeven and Valencia (2012) database as updated by the author. Currency crises
are defined as in Chart 4 above, i.e. they are instances when there is a decline in the exchange rate of at least 20 per cent over the previous quarter against the US dollar that is at least 5 percentage points greater than in the previous quarter (as opposed to 30 per cent year over year and at least 10 percentage points more than in the previous year, as in Ghosh et al.). Sovereign debt crises are from Laeven and Valencia (2012) and Beers and Nadeau (2015), as updated by the authors. Growth crises are years in the bottom 5 per cent of all annual growth rates (current year relative to the average of the three preceding years). Ghosh, Ostry and Qureshi (2014) extrapolated back to 1980 the IMF’s de facto exchange-rate classification for the post-2006 period and kindly shared their data, which were then extended through 2015 by the author.
63 The quarter-on-quarter dating scheme suggests that the incidence of currency crises is not that different between intermediate regimes and independent floats. Laeven and Valencia (2012) use an alternative measure of currency crises; using their measure and updating their series points to a much greater incidence in countries with independent regimes than in countries with free floats.

ECB Forum on Central Banking, June 2016 39
presumably reflecting reliance on hard pegs in a number of relatively fragile less-developed frontier economies.
Thus, there is tension between the relatively high frequency of stability problems in countries operating intermediate regimes and their revealed preference for such arrangements (Chart 3 above). That said, there are caveats to the conclusion that the persistence of intermediate regimes is a problem for the global monetary order. First, the economic and financial stability, such as it is, of countries with floating rates may reflect not the exchange-rate regime per se but other characteristics of countries that allow their currencies to float. Countries with floating rates have smaller foreign-currency mismatches and less violent credit cycles, perhaps indicative of better developed and managed financial systems that make for economic and financial stability and limit fear of floating.64 Similarly, countries with hard pegs often have stronger political links with their currency-union and currency-board partners and political systems capable of coping with greater output volatility.
Whether this is the same as or different from the previous point is partly a matter of semantics. The problem for the global monetary order is that countries have not put in place that stronger supervision and regulation. They have not succeeded in deepening and developing their financial markets in order to be able to float more freely. They have not put in place the political links and systems needed to sustain hard pegs. It is these deeper problems that render their exchange-rate arrangements and stability outcomes problematic. The problem, in this interpretation, is not with their exchange-rate arrangements per se.
Second, not all intermediate regimes are alike. Some studies suggest that intermediate regimes where the authorities announce explicit limits on flexibility and then seek to enforce them (as in the cases of soft pegs, preannounced bands and preannounced crawls) are more crisis prone than managed floats where such limits, where they exist, are implicit and more flexible. Table 4 is not inconsistent with this view. Evidently, managed floats are more like free floats in terms of the private-sector behavior they induce and the public-sector responses they permit.65
Although most such studies take the exchange rate and its management as a country characteristic, it is important from the perspective of the global monetary order to be cognizant of cross-country spillovers. This observation is of long standing; the particular context in which it arises currently is that of currency wars. The point is specific to an environment in which, whether because of secular stagnation or the aftermath of a financial crisis, economies are in a liquidity trap. Interest rates are as low as they can go, and banks’ demand for reserves is perfectly elastic.66 The only way of making monetary policy effective (of reducing the real interest rate) is then by changing expectations of
64 Again, see Ghosh, Ostry and Qureshi (2014). Alternatively, lower currency mismatches could be a result of
freer floating, insofar as this introduces the possibility of two-way variability in the exchange rate and leads prudent borrowers and lenders to limit their foreign-currency exposures. This interpretation would be consistent with the “un-caveated” version of the argument that floating rates make for greater financial stability, as in the preceding paragraph.
65 That said, there is less than full agreement on the point. 66 For present purposes it makes no difference whether as low as they can go means zero or some negative
number.

ECB Forum on Central Banking, June 2016 40
inflation, and the only way of changing expectations of inflation is by pushing down the exchange rate. The exchange rate, being the single most visible price in the economy, may be singularly important for shaping expectations. Manipulating it may be a prominent way for policymakers to signal their commitment to reflation. Higher import prices then help to deliver on this promise.67
Two implications follow. First, exchange-rate changes in this environment are beggar thy neighbor. Currency depreciation by one country that changes expectations in desirable directions changes them in undesirable directions in other countries with the same liquidity-trap problem. Second, to the extent that countries respond in similar fashion, no one’s exchange rate changes, no one’s expectations are modified, and the economy is only further depressed by volatility and uncertainty in the period when offsetting actions are unilaterally taken. “Currency manipulation”, so defined, is a negative-sum game. Despite having written more than 70 years ago, Nurkse (1944) would recognize the problem and the case it creates for multilateral exchange-rate surveillance.
But one can also question whether this is an accurate diagnosis of the problem in the 1930s, the episode of which Nurkse wrote, much less of the problem today. Even with interest rates near zero, it is not clear that monetary policy worked in the 1930s only by pushing down the exchange rate. In a number of the cases of which Nurkse wrote, exchange rates did not depreciate significantly, but monetary policy nonetheless had sustained effects. The United Kingdom allowed sterling to fall against the dollar in 1931, but the currency recovered fully to earlier levels in 1933 when the dollar was pushed down.68 Yet the authorities continued to expand money and credit with visibly positive effects on price expectations (real interest rates fell as inflation rose while nominal interest rates remained at low levels) and on the economy (Crafts and Fearon 2013).
The explanation for this positive impact on expectations, absent sustained depreciation of the currency, lies in institutional arrangements and leadership. Effective control of policy was transferred from a cautious Bank of England to a more aggressive Chancellor of the Exchequer, Neville Chamberlain, who managed monetary conditions through the Exchange Equalisation Account (Howson 1980). Interest rates were pushed down and expectations were pushed up despite little if any subsequent change in the exchange rate. What was true for Britain was also true for a variety of other countries. There was no further depreciation of the dollar exchange rate after 1933, for example. But there was the transfer of control over policy from a temperamentally cautious Fed to a more aggressive Treasury under Henry Morgenthau, which regulated monetary conditions through its gold sterilization operations.69
In both cases, in other words, it is not clear that the liquidity trap was binding in the sense that monetary policy was incapable of operating through channels other than the exchange rate. Monetary-cum-exchange-rate policies, even in this environment, were not
67 Caballero, Fahri and Gourinchas (2015) formalize the argument. 68 The value of sterling and the dollar was still lower against the Gold Bloc countries than it had been in 1931,
but this change in currency values was similarly reversed over the next couple of years. 69 Again, see Crafts and Fearon (2013). My own interpretation of these same points is in Eichengreen (2015).
Authors like Eggertsson (2008) would also point to a role of fiscal policy in shaping expectations in the 1930s and suggest that can play a similar role today (viz. the discussion of Japan two paragraphs below).

ECB Forum on Central Banking, June 2016 41
a zero-sum game. In this interpretation, the conditions in question do not create a prima-facie case for multilateral exchange-rate surveillance or international policy coordination; instead they create a case for forceful policy action at the national level (although one can still argue that there is a case for international coordination of those national actions to limit exchange-rate volatility and uncertainty).
Today it is similarly said that with near-zero interest rates and an enlarged balance sheet the only way the Bank of Japan can create expectations of inflation and reduce the real interest rate is by depreciating the yen, but that since other central banks are in a similar quandary the policy is self-defeating. But one also hears arguments that forceful leadership and action can raise inflation expectations even in the absence of a sustained change in the exchange rate. Time will tell.
4 Capital flows and sudden stops
Capital flows are inextricably linked to the sudden-stop problem. Much of the literature on the global monetary order – on capital-flow volatility, IMF facilities, the adequacy of the global financial safety net, and episodes of turbulence like the 2013 taper tantrum and the 2015 capital-flow reversal – is similarly linked to sudden stops. This section therefore establishes that sudden stops remain a feature of the global monetary order. It provides evidence on how their incidence and characteristics have been changing.70
For present purposes, sudden stops are when portfolio and other inflows by non-residents decline below the average in the previous 20 quarters by at least one standard deviation, when that decline lasts for more than one quarter, and when flows are two standard deviations below their prior average in at least one quarter. The episode then ends when capital flows recover to within one standard deviation of their prior mean.71 The sample is made up of all emerging markets for which quarterly data on gross capital flows are available for at least 24 consecutive quarters between 1991 and 2015. The result is an unbalanced panel of 34 countries. The sample period can then be divided in half, distinguishing 1991-2002 from 2003-2015, as a way of highlighting what if anything has changed relative to the conclusions of the early literature focusing on the first period.
These procedures and sample identify 46 sudden stops, as summarized in Table 5. For no country does the temporary interruption of capital flows to emerging markets in 2013 at the time of the “taper tantrum” qualify as a sudden stop according to these criteria. The decline in capital flows into emerging markets and/or capital-flow reversals in this period lasted only one quarter, as opposed to four quarters on average in our sudden-stop cases. The average swing from quarterly inflow to quarterly outflow was 1 ½ per cent of GDP, as
70 Or, more precisely, not been changing. Evidence in this section is drawn from Eichengreen and Gupta (2016),
where Poonam Gupta deserves much of the credit for whatever insight it contains. 71 When two sudden stops occur in close proximity, they are treated as a single episode. In focusing on gross
inflows by non-residents, we follow Efremidze et al. (2015), who show that sharp reductions in gross flows from abroad tend to be most strongly associated with sudden stops as defined here (and are more informative for understanding the latter than, inter alia, net flows). Cavallo et al. (2013) show that the sudden stops in flows from non-residents tend to be larger and have larger impacts on economies than those which are driven by outflows by residents.

ECB Forum on Central Banking, June 2016 42
opposed to more than 3 per cent of GDP in our sudden-stop episodes. Currency depreciation was less than a third as large as in the sudden-stop episodes.72
Table 5 Sudden stops, 1991-2002 vs. 2003-2015
1991-2002 2003-2015
Number of sudden stops 16 30
As a percentage of available observations (stops/total observations) 1.8% (16/903)
2.1% (30/1354)
Quarters for which the sudden stops last 4.0 3.6
Capital flows during sudden stops (% of GDP), first quarter -1.6 -1.3
Capital flows during sudden stops (% of GDP), average for first four quarters -1.8 -1.7
Capital flows in the four quarters preceding sudden stops (% of GDP) 1.3 2.0*
Capital-flow turnaround: Avg. capital flows during four quarters of sudden stops - Avg. capital flows in the four preceding quarters
-3.1 -3.5*
Capital-flow turnaround: Avg. capital flows during all quarters of sudden stops - Avg. capital flows in the four preceding quarters
-2.3 3.2**
Decline in GDP during sudden stop: 4 quarters year on year 3.8 2.3
Source: Derived from Eichengreen and Gupta (2016). *, **, and *** indicate that the value is significantly different than that in the preceding column at the 10, 5 or 1 per cent level.
A striking facet of Table 5 is how little difference there is between the first period, when the sudden-stop problem first came to the fore, and the second period, when a wide range of measures to address it were taken at the national and international levels. The raw probability of a sudden stop in a given country in a given quarter, 2 per cent, is the same in both periods. The length of sudden-stop episodes is the same in both periods. The decline in GDP in the sudden-stop episode is again basically the same in the two periods. The significant differences are in the magnitude of the capital flows themselves. Total inflows are larger in the four quarters preceding the sudden stop in 2003-2015, as is the subsequent turnaround in flows.
A small handful of country characteristics and variables are robustly associated with the incidence of sudden stops. The main such variables are predictable but no less important for the fact. The likelihood of a sudden stop is positively associated with the magnitude of the capital inflow in the preceding period; it is positively associated with the rate of growth of domestic credit to the private sector while those inflows are underway (as highlighted by inter alia Mendoza and Terrones 2012). Factors such as the VIX, as a measure of global risk appetite, and the Federal Reserve discount rate, as a measure of the stance of global monetary policy, also matter. The role of global factors has increased relative to that of country-specific determinants between the two periods. In terms of which global factors matter, the US policy rate plays the largest role in the first period, the VIX in the second.
At one level, that there has not been more progress – that the frequency and impact of the sudden-stop problem has remained largely unchanged – is disheartening. At the same
72 The decline in equity prices was less than a fifth as large. In 2015, another prominent recent instance of
capital-flow reversals, quarterly data identify two interruptions to capital flows that qualify as sudden stops only in Chile and South Korea. News reports in early 2016 (Moore 2016) of emerging markets such as Brazil, Turkey, Saudi Arabia, Russia and Argentina issuing or planning to issue international bonds to non-resident investors are consistent with the idea that all we have seen so far is a temporary interruption (“temporary” by the criteria used to identify sudden stops).
ECB Forum on Central Banking, June 2016 43
time, the fact that the capital-flow turnaround is larger but the drop in output is not suggests that someone is doing something right. Indeed, there are noticeable differences in policy responses between periods. There was less of a tendency to sharply tighten both monetary and fiscal policies in response to outflows in the second subperiod. Between 2003 and 2015 monetary policy as measured by the level of the policy rate was reduced, on average, in response to sudden stops instead of being raised as in the first subperiod. On average, fiscal policy was tightened in response to sudden stops in both subperiods, although the extent of fiscal consolidation was less in the second subperiod.
That fiscal contraction was less in the second subperiod is consistent with the idea that fiscal positions were stronger on average, making it less imperative to undertake further fiscal consolidation to reassure investors and accommodate the declining availability of finance. That central banks were able to loosen monetary conditions and tolerate some depreciation of the currency is consistent with the idea that countries had made progress in addressing the currency mismatch problem that had made depreciation so costly in the first subperiod. This willingness and ability to reduce policy interest rates and allow the currency to depreciate also plausibly reflected the fact that inflation rates were lower coming into the sudden-stop episode (6.4 per cent in the second subperiod versus 10.7 per cent in the first, in the eight quarters prior to the sudden stop), making any consequent depreciation-induced inflation less of a problem.
Putting these parts together paints the following picture. Comparing the most recent decade with its predecessor, the problem is basically the same. The main difference is that the magnitude of the turnaround in capital flows in sudden-stop episodes, relative to recipient-country GDP, is even larger now than before, reflecting the continued expansion of international capital markets. At the same time, stronger monetary, fiscal and financial positions have allowed emerging markets to buffer the macroeconomic impact, or at least to avoid having to exacerbate it, through the adoption of countercyclical (or less procyclical) policy responses. These larger shocks and more stabilizing policy responses have cancelled out in the sense that the resulting drop in GDP is the same across subperiods. Whether this is progress is for others to judge.
5 International liquidity and international currencies
International capital flows serve a variety of purposes. Among them is contributing to international liquidity. Writing in 1961 in an earlier era when private cross-border financial flows were tightly controlled, J. Marcus Fleming of Mundell-Fleming-model fame defined international liquidity as “such resources as are readily available to [a country’s] monetary authorities for the purpose of financing deficits in its balance of payments and defending the stability of its exchange rate”.73 Today, when banks, firms and households in addition to governments engage in cross-border financial transactions, one might wish to add to Fleming’s definition “liquid resources available to the private sector for meeting foreign obligations”. 1961 being the heyday of the Bretton Woods System, Fleming’s focus was official resources denominated in US dollars and gold. Now that other economies have
73 Fleming (1961), p. 439. Fleming spoke of external liquidity rather than international liquidity, but no matter.

ECB Forum on Central Banking, June 2016 44
open capital accounts and deep and liquid financial markets, one might wish to add resources denominated in their currencies to those denominated in dollars.
International liquidity so defined is distinct from safe assets. Safe assets are securities that are accepted and held in settlement of financial transactions because they are perceived as low risk and can be bought and sold at low cost in significant quantities without moving prices (IMF 2012).74 They provide pricing benchmarks. They are widely accepted in payment. They are reliable stores of value. They serve as collateral in financial transactions and satisfy prudential requirements.
But some safe assets may only have these attributes domestically. Investment-grade bonds denominated in some currencies may only provide a reliable store of value for domestic residents or only satisfy prudential requirements in the issuing country, exchange risk and regulatory obstacles to cross-border use preventing them from providing these same services elsewhere. International safe assets (Fleming’s “international liquidity”) are those that provide these functions globally, or at least in a significant number of countries.
This is how international safe assets are related to international currency status. International currencies are national units that are recognized in a number of countries as providing means of payment, unit of account and store of value services. An international currency is a national unit in which international safe assets are denominated.
Moving from theory to practice, one quickly encounters the problem of where to draw the line between assets that are safe and widely accepted in transactions internationally and those that are not.75 Specifically, there is the question of whether privately-issued high-quality obligations should be regarded as a constituent of international safe assets.76 This question dates to the 1990s when observers quaintly worried that the US Treasury might retire its outstanding debt. The issue then was whether high-quality corporate securities might become an accepted form of international reserves. But as Gourinchas and Jeanne (2012) emphasize, private or inside assets that are safe in normal times may be reassessed as risky in periods of volatility.77 For the purpose of assessing whether the supply of such instruments is adequate for coping with volatility, it makes sense to focus on publicly-provided or outside assets.78
74 Ability to buy and sell significant quantities without moving prices being the definition of liquidity. This
definition of liquidity is a reminder that this dimension of safety is a function not only of the characteristics of the security but also of the market in which it is traded (Gourinchas and Jeanne 2012, p. 6). In this context, the constituents of low risk include low credit risk, low inflation risk, low exchange risk and low idiosyncratic risk (low idiosyncratic risk in the sense that the instrument is insensitive to information about the characteristics of the issuer).
75 For more on this, see below. 76 Privately-issued assets are sometimes referred to, interchangeably, as “private-label” assets or securities and,
as betrayed by the use of both “assets” and “obligations” in the preceding sentence, they are referred to as “inside liquidity”.
77 Insofar as there is no emergency lender with the capacity to provide elastic supplies of liquidity in that currency standing behind them. Gorton (2016) develops this same idea in the national context.
78 Some would argue that commercial bank deposits should be included to the extent that these are fully and credibly guaranteed by the public sector, whether through deposit insurance or implicit guarantees, but their addition would not materially affect the analysis that follows.
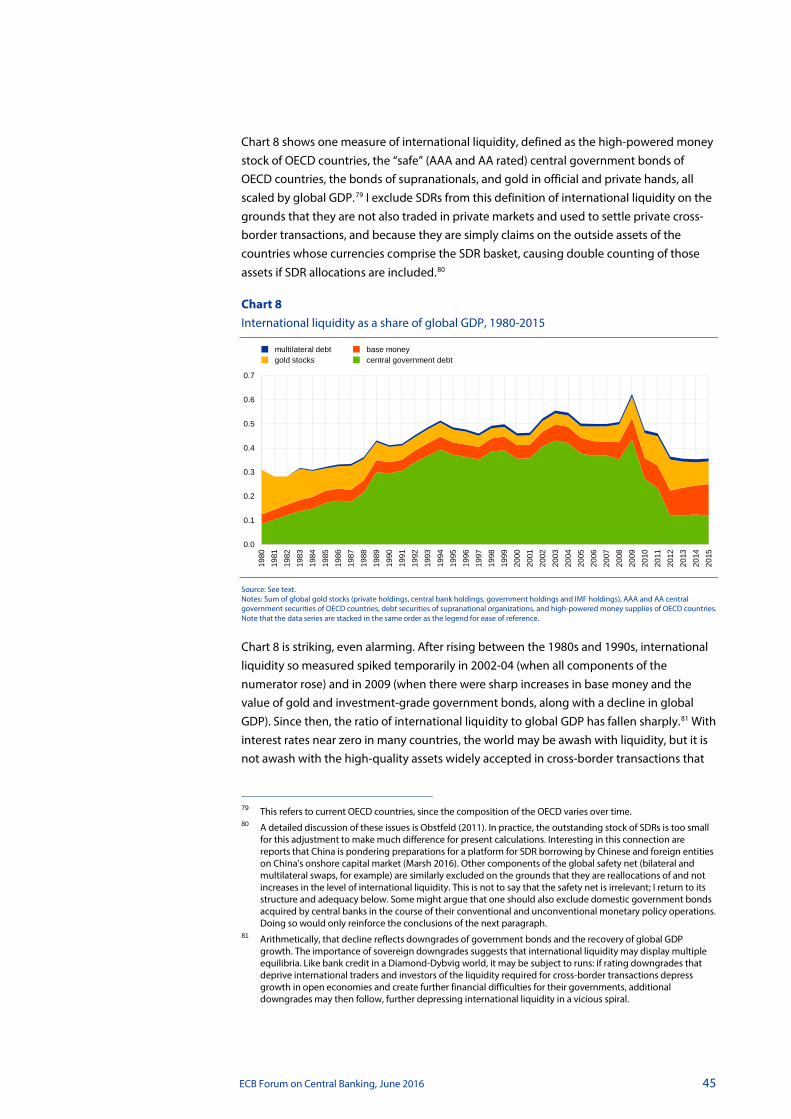
ECB Forum on Central Banking, June 2016 45
Chart 8 shows one measure of international liquidity, defined as the high-powered money stock of OECD countries, the “safe” (AAA and AA rated) central government bonds of OECD countries, the bonds of supranationals, and gold in official and private hands, all scaled by global GDP.79 I exclude SDRs from this definition of international liquidity on the grounds that they are not also traded in private markets and used to settle private cross-border transactions, and because they are simply claims on the outside assets of the countries whose currencies comprise the SDR basket, causing double counting of those assets if SDR allocations are included.80
Chart 8 International liquidity as a share of global GDP, 1980-2015
Source: See text. Notes: Sum of global gold stocks (private holdings, central bank holdings, government holdings and IMF holdings), AAA and AA central government securities of OECD countries, debt securities of supranational organizations, and high-powered money supplies of OECD countries. Note that the data series are stacked in the same order as the legend for ease of reference.
Chart 8 is striking, even alarming. After rising between the 1980s and 1990s, international liquidity so measured spiked temporarily in 2002-04 (when all components of the numerator rose) and in 2009 (when there were sharp increases in base money and the value of gold and investment-grade government bonds, along with a decline in global GDP). Since then, the ratio of international liquidity to global GDP has fallen sharply.81 With interest rates near zero in many countries, the world may be awash with liquidity, but it is not awash with the high-quality assets widely accepted in cross-border transactions that
79 This refers to current OECD countries, since the composition of the OECD varies over time. 80 A detailed discussion of these issues is Obstfeld (2011). In practice, the outstanding stock of SDRs is too small
for this adjustment to make much difference for present calculations. Interesting in this connection are reports that China is pondering preparations for a platform for SDR borrowing by Chinese and foreign entities on China’s onshore capital market (Marsh 2016). Other components of the global safety net (bilateral and multilateral swaps, for example) are similarly excluded on the grounds that they are reallocations of and not increases in the level of international liquidity. This is not to say that the safety net is irrelevant; I return to its structure and adequacy below. Some might argue that one should also exclude domestic government bonds acquired by central banks in the course of their conventional and unconventional monetary policy operations. Doing so would only reinforce the conclusions of the next paragraph.
81 Arithmetically, that decline reflects downgrades of government bonds and the recovery of global GDP growth. The importance of sovereign downgrades suggests that international liquidity may display multiple equilibria. Like bank credit in a Diamond-Dybvig world, it may be subject to runs: if rating downgrades that deprive international traders and investors of the liquidity required for cross-border transactions depress growth in open economies and create further financial difficulties for their governments, additional downgrades may then follow, further depressing international liquidity in a vicious spiral.
0.0
0.1
0.2
0.3
0.4
0.5
0.6
0.7
1980
1981
1982
1983
1984
1985
1986
1987
1988
1989
1990
1991
1992
1993
1994
1995
1996
1997
1998
1999
2000
2001
2002
2003
2004
2005
2006
2007
2008
2009
2010
2011
2012
2013
2014
2015
multilateral debtgold stocks
base moneycentral government debt

ECB Forum on Central Banking, June 2016 46
contribute to international liquidity.82 In the 1930s a shortage of international liquidity brought an abrupt end to an earlier era of globalization. This is a reminder that our current globalization could be at risk if the trend in Chart 8 is allowed to continue.
The traditional framing of the international liquidity problem, which traces back to Triffin (1947), is that international currency status is a natural monopoly because of the strength of network increasing returns – that the incentive to utilize a specific currency in international transactions strongly increases with the number of other agents using that same currency in their own international transactions. International currency status is effectively the monopoly privilege of the leading economy. But that leading economy will not be able to supply safe and liquid assets (it will not be able to supply international liquidity) on the scale required by an expanding world economy on its own forever, insofar as the logic of economic convergence implies faster growth of the world economy – and therefore faster growth in the demand for international liquidity than in the monopolist’s capacity to supply. This then provides motivation for the creation of supranational sources of international liquidity.83
A number of authors have argued on this basis for significant new SDR issuance on a one-time, continuing or countercyclical basis (see Ocampo 2010, Stiglitz 2011). SDRs would be sold to the central banks that issue international currencies in exchange for domestic high-powered money, thereby creating additional outside assets (addressing the problem that traditional SDR allocations simply involve a redistribution of existing claims on the liquid assets of the countries whose currencies comprise the SDR basket).84 Private markets would be created on which SDRs could be traded and through which private transactions could be settled. Whatever the merits of this idea, operationalizing it would require truly revolutionary changes in the structure of private markets, in the responsibilities of the IMF and in the autonomy of central banks, which would be obliged to create additional high-powered money when the IMF came calling. Beyond that, there would have to be an order-of-magnitude change in the stock of SDRs if this mechanism is to offset a decline in the supply of international liquidity like that which has occurred since 2009. The calculations underlying Chart 8 suggest that the stock of SDRs would have to increase by a factor of 50 to offset the 2009-15 decline, which is not something that the IMF’s principal shareholders are obviously prepared to contemplate.
Fortunately, there is another solution to Triffin’s dilemma, suggested by the so-called new view of international currency status.85 The new view questions this natural-monopoly characterization. It posits that multiple international currencies can coexist – that network effects, even if present, are not so strong as to leave room for only one international currency. This suggests that the international liquidity problem can be solved through the development of more national sources of safe and liquid internationally-accepted assets,
82 It is worth recalling that any measure of global liquidity is arbitrary insofar as there are gradations of liquidity
(assets are not simply either “liquid” or “illiquid”). Global liquidity as measured in Chart 8 fell sharply after 2008 partly because AAA and AA rated bonds were downgraded, as noted above. The reality is that these bonds do not suddenly become “illiquid”, only less liquid. But this observation does not alter the striking and potentially alarming implications of the chart.
83 Although how these fit into a framework emphasizing strongly increasing network returns is not entirely clear. 84 Details of one such scheme are in Truman (2010). 85 The terminology is from Frankel (2011). A formal statement of the new view is Eichengreen, Mehl and Chitu
(2016).
ECB Forum on Central Banking, June 2016 47
in the form of high-quality public assets issued by additional governments whose financial markets also exhibit the requisite scale, stability and depth.86
Two types of evidence support the new view. First, changes in financial technology suggest that interchangeability costs giving rise to network increasing returns and therefore favoring a single dominant international currency are no longer as strong as in the past. This idea builds on a literature on technology standards that emphasizes open systems, in which users of a particular technology or system can interact with users of other technologies or systems at low cost.87 In these models, network effects still exist, but the technical barriers separating competing systems or standards can be surmounted by so-called gateway technologies that enable suppliers or customers to overcome pre-existing technical incompatibilities and integrate rival systems into “an enlarged production system or extended network”.88 In the presence of these gateway technologies, interchangeability costs are no longer prohibitive. The network increasing returns associated with use of a particular technological system or standard are no longer so dramatic. First-mover advantage and the dominance of an established standard may still be present but they are no longer so pronounced.
This 21st century picture of low costs of information, transactions and coordination is more plausible for the modern-day foreign-exchange market than the traditional assumption of high switching costs and costly information leading to strongly increasing network returns. In an age of high-speed communications, it is straightforward for potential customers to get real-time quotes on the price of foreign exchange and to compare the prices of commodities denominated in different currencies. When over half of all foreign-exchange transactions occur on electronic platforms, it is possible to purchase and sell multiple currencies at microscopic bid-ask spreads in a matter of milliseconds. This is true not just for high-speed traders utilizing EBS and Thomson-Reuters servers and for large financial institutions with interbank electronic platforms but, as well, for retail investors with access to Internet-based foreign-exchange gateway technologies like Oanda and World First.
Likewise, it is now possible for firms to obtain protection from future exchange-rate changes that might otherwise arbitrarily affect their costs and revenues by purchasing and selling currency forwards, swaps and other foreign-exchange derivatives, transactions that can be undertaken at low cost in high-tech 21st century financial markets. Thus, the need for a firm to price its exports in the same currency in which its imported inputs are priced, as a way of naturally hedging its supply-chain risk, is no longer as pressing. And as more countries open their capital accounts and develop their financial markets, more national markets acquire the depth and liquidity necessary to render the assets traded there attractive to international investors.
Second, historical evidence suggests that network increasing returns were not, in fact, so strong in the past as to render international currency status a virtual natural monopoly,
86 Readers of the preceding footnote, anticipating that I am an adherent to the new view, will understand why I
included the base money and investment-grade bonds of all OECD countries and not just those of the United States in the measure of international liquidity in Chart 8.
87 Here the analogy between technology standards and monetary standards is intentional and direct. 88 David and Bunn (1988), p. 170.

ECB Forum on Central Banking, June 2016 48
the anomalous Bretton Woods period notwithstanding. And while the IMF’s data for the final decades of the 20th century confirm that the dollar accounted for the single largest share of identified foreign-exchange reserves, that share was only of the order of 60 per cent. Other currencies, evidently, also played consequential international roles. Neither do the data in Lindert (1969) on the period before 1914 support the assertion that international currency status is a natural monopoly; they show that other currencies in addition to sterling – the German mark and the French franc in particular – also accounted for non-negligible shares of central bank reserves. Evidence for the 1920s and 1930s, when both sterling and the dollar served as consequential international currencies, points to the same conclusion (Eichengreen and Flandreau 2009).
None of this is to deny that the adequate provision of international liquidity is a problem. But it does suggest that it can be solved through the emergence of other sources in addition to the United States and the dollar. Here the euro and the renminbi are the obvious candidates, insofar as the euro area and China possess the requisite scale. Large economic size gives them the fiscal capacity to back a large outstanding stock of government bonds attractive to international users. Because of their size and openness, these economies engage in a large volume of transactions with the rest of the world, creating a natural habitat for their currencies in the international domain.
But there are also questions about whether their currencies are capable of contributing to international liquidity in the manner of the dollar. In the euro area, unlike the United States, fiscal capacity is not pooled but divided among the member states. In some cases it is already exhausted (optimists would say “temporarily exhausted”), as a result of which the bonds of the governments in question lack investment-grade status, are not readily accepted by foreign investors, and do not contribute to international liquidity according to our calculations. Bond market liquidity has been further limited (the stock of euro area government bonds available to international investors has been further reduced) by the security purchases the ECB has been compelled to undertake to fend off the threat of deflation. All this is simply to say that in order to contribute significantly to international liquidity going forward, Europe will have to draw a line under its crisis.
Notwithstanding the publicity surrounding Beijing’s renminbi internationalization drive, China’s currency remains far behind the dollar and for that matter the euro on every relevant dimension.89 For a national currency to play a significant international role, its markets must possess not only size but also stability and liquidity. Stability is not exactly an attribute that Chinese financial markets possess in abundance, as the events of the last year have made clear. There are also questions about the liquidity of those markets, insofar as residual capital controls and other regulations limit access. Ultimately, liquidity is a function of rule of law and reliable contract enforcement, insofar as “liquid” means that investors can buy and sell as much as they want whenever they want at the prevailing market price, subject to minimal legal and regulatory uncertainty and interference.90 This
89 Relevant dimensions include the share of allocated global foreign-exchange reserves, the share in
international debt securities outstanding, the share in global foreign-exchange market turnover, and the share in global trade settlements.
90 For elaboration see footnote 74 above.

ECB Forum on Central Banking, June 2016 49
leads one to ask whether aspirations for the renminbi to contribute significantly to international liquidity are in fact compatible with China’s prevailing political system.91
6 The global safety net and the IMF
Firms in different countries manage the liquidity needs associated with their cross-border transactions as best they can. Governments for their part require international liquid resources to finance fluctuations in their own cross-border transactions, to intervene in the foreign-exchange market, and to assist financial and non-financial firms with emergency liquidity needs they do not anticipate or with which they are unable to cope. This last set of resources is what has come to be known as the global safety net.
Chart 9 summarizes the size and composition of that safety net, scaled by global external liabilities calculated in the manner of Lane and Milesi-Ferretti (2007). Included here are IMF facilities, regional lending arrangements, bilateral swap agreements and foreign-exchange reserves. Four aspects of the chart stand out. First, these resources, so measured, trace out a u-shaped pattern. They fall initially, due to the rapid expansion of external liabilities, and then rise as the growth of external liabilities slows following the onset of the global financial crisis and policymakers respond by augmenting swap lines, regional financial arrangements and IMF facilities. Second, there are signs that the rise in the size of the global safety net, so measured, has now plateaued. In both these respects there is a contrast with Chart 8, which shows international liquidity declining rather than rising following the crisis, with no indication of that decline tending to abate.92
Chart 9 Global financial safety net as a percentage of external liabilities, 1980-2014
(percentages)
Sources: IMF International Financial Statistics, IMF World Economic Outlook, RFAs, updated and extended version of dataset constructed by Lane and Milesi-Ferretti (2007). Notes: Ratification of the IMF’s 14th General Review of Quotas will see IMF permanent resources double and temporary resources fall by a similar amount. The series are stacked in the same order as the legend for ease of reference.
91 I have asked these questions in Eichengreen (2013). 92 This is relative to global GDP, recall.
0
2
4
6
8
10
12
14
16
1980
1981
1982
1983
1984
1985
1986
1987
1988
1989
1990
1991
1992
1993
1994
1995
1996
1997
1998
1999
2000
2001
2002
2003
2004
2005
2006
2007
2008
2009
2010
2011
2012
2013
2014
FX ReservesRegional Financial ArrangementsSwap Lines
IMF TemporaryIMF Permanent
ECB Forum on Central Banking, June 2016 50
Third, despite the expansion of bilateral, multilateral and regional financial resources, foreign reserves held at the national level still comprise by far the largest component of the global safety net. Fourth, despite significant growth in recent years, the magnitude of that safety net relative to external liabilities has not yet matched the levels of the early 1980s.
Moreover, it can be argued that the available safety net is in fact less than meets the eye.93 The Bank of Korea famously entered the global financial crisis with more than $260 billion of reserves but, once these began to decline, $200 billion somehow came to be identified as a critical threshold, or floor, below which reserves could not be allowed to fall (Asian Development Bank 2011, Aizenman and Sun 2012). Economists have models (e.g. Krugman 1979) in which a crisis and a run on the central bank can occur even when reserves are significantly above zero, but these do not suggest that this critical threshold or floor is necessarily so high or that it is such a conveniently round number. The IMF (2011) has rules of thumb for reserve adequacy, which it takes as a function of exports (so as to capture the potential loss of reserves from a drop in external demand or a terms of trade shock), short- and long-term debt (as a measure of interest payments and rollover risk), and broad money (as a measure of the scope for capital flight), with weights that depend on the exchange-rate regime and the openness of the capital account. These rules of thumb suggest that China, for example, should be holding somewhere between $1.1 trillion and $2.8 trillion of reserves, depending on one’s preferred characterization of its exchange-rate and capital account regimes, where actual reserves are in excess of $3 trillion at the time of writing.
The problem is that investors, in their wisdom, appear to regard these thresholds ($1.1 trillion or $2.8 trillion) as a floor rather than a ceiling on adequate reserves. They act as if reserves should not be permitted to fall below this threshold under any circumstances, implying that they should not be used to finance shocks to the balance of payments, where ironically this is the express purpose for which reserves are held and the use relative to which their adequacy is gauged. This may be a fundamental misperception of the meaning of reserve adequacy, but to the extent that it is held in financial circles, governments and central banks may feel inhibited from actually using their otherwise adequate reserves.94
Then there is the problem of IMF stigma – that countries are reluctant to draw IMF resources even when these are lightly conditioned and subject to prequalification. To some extent this stigma is likely to reflect coordination issues. Drawing IMF resources might not be seen as sending a bad signal if multiple countries displayed a willingness to do so at the same time, but there is the inevitable “after you, Alphonse” problem. The Fund has sought to orchestrate a collective solution, encouraging groups of countries to sign up for its unconditional or lightly-conditioned facilities, but to no avail. This suggests that the syndrome also has other sources. For example, it could be that IMF stigma has historical roots, something that has been argued for other forms of stigma (Goffman 1964, Kurzban and Leary 2001). In the case of the Asian countries, for example, IMF stigma could 93 That is, less than is depicted in Chart 9. 94 Another interpretation of the adverse effects of allowing reserves to fall is in terms of asymmetric
information – that allowing reserves to fall is seen as sending a signal of some deeper underlying problem. I return to this in the final section.

ECB Forum on Central Banking, June 2016 51
be rooted in the historical experience of the 1997-98 financial crisis and in how that experience affected perceptions, norms and behavior and how it continues to promote other desired objectives – group solidarity, for example, being a well-known by-product of stigmatization, even today.95
There also appears to be reluctance to draw on bilateral swaps and regional financial arrangements. The Chiang Mai Initiative Multilateralization, for example, has not been drawn on in the decade and a half since its creation, not even at the depths of the global financial crisis. There is similarly reason to question whether the BRICS’ Contingent Reserve Facility will be activated in times of need.96 This is typically explained on the grounds that governments, notwithstanding their formal commitments, hesitate to lend without attaching conditions, but countries find it politically problematic to accept conditions imposed by their neighbors. In addition it is suggested that individual governments are in a poor position to determine whether their neighbors are merely experiencing liquidity problems, in which case repayment is likely, or have deeper insolvency problems, in which case the creditors’ funds will be at risk. This is an argument for creating a link between IMF programs and regional financial arrangements, as in the case of the CMIM, since conditionality and the liquidity/solvency determination can then be outsourced to the Fund, which is in a better position to make these determinations. This assumes, of course, a solution to the aforementioned problem of IMF stigma.
An exception to this general reluctance is the bilateral swaps of the Federal Reserve System, extension of which during the global crisis was widely seen as having a calming effect (Park 2011) and which were actually utilized (Destais 2014). Five of the Fed’s 14 temporary swap arrangements were subsequently made standing arrangements – those to the five largest advanced-country counterparties.97 Whether the Fed would have the political cover to significantly expand the list of recipients in a future crisis is a good question. Another good question is why the Fed’s swaps are not subject to the same stigma as other facilities.98 A conjecture is that they are extended by an apolitical entity, namely an independent central bank, and therefore do not come lumbered with political conditions and obligations, either explicit or implicit, whereas the IMF and CMIM are directly answerable to and perceived as carrying out the bidding of governments.
The patchwork nature of the existing swap network has led observers like Reserve Bank of India Governor Raghuram Rajan to suggest that this network should be multilateralized and channelled through the IMF. The Fund would provide swaps of dollars and euros obtained from the Fed, the ECB and other issuers of international currencies to countries with sound policies and temporary liquidity needs. A moment’s reflection suggests that this is less a new proposal than a repackaging of existing ideas. IMF dollar and euro swaps for countries with sound policies and temporary liquidity needs are simply the Flexible
95 To be clear, it is those applying the stigma and not those on the receiving end who are thought to experience
the group solidarity. Since the crisis, Asian countries have sought to advance regional solidarity through a variety of mechanisms, such as the Asian Bond Fund, Asian Bond Markets Initiative, and Chiang Mai Initiative Multilateralization (more on which below).
96 Other observers like Truman (2010), generalizing from the European case, argue that regional financial assistance is too freely activated. My overall conclusion is the opposite.
97 The distinction between “made standing arrangements” and “made permanent” is important, since standing arrangements can always be revoked.
98 One can ask the same question about the ECB’s swap lines with the Danish and Swedish central banks.
ECB Forum on Central Banking, June 2016 52
Credit Line (FCL) and the Precautionary and Liquidity Line (PLL) in another guise. The idea that such swaps should be made available through the Fund to a greater extent than in the past is exactly analogous to proposals for further increases in IMF quotas, together with more active use of the Designation Rule under which the IMF can oblige member countries to provide it and its other members with their currencies in return for SDRs. As such, any such scheme is subject to familiar objections and obstacles. Countries remain reluctant to sign up for the FCL and PLL (only five have done so at the time of writing despite the Fund’s repeated efforts to make the facilities more attractive). Issuers of international currencies, like the United States, are reluctant to incur the financial risk (real or imagined) of swapping dollars for SDRs and to thus dilute their decision-making control (Talley 2014).
What is to be done? A first step would be to authorize the IMF to unilaterally prequalify groups of countries as eligible for the FCL and PLL, as has been suggested before (Moghadam et al. 2010, Eichengreen 2010). Credible prequalification might suppose an increase in IMF resources, given that credit lines will reassure only to the extent that the IMF has the wherewithal to disburse them, and an increase in the range of such facilities to avoid triggering a crisis when a country was “downgraded” from one to another. If prequalified countries continued to display a reluctance to tap these facilities, further reforms might be needed. Reinhart and Trebesch (2016) suggest limiting all future IMF lending to short-term liquidity support for countries with “correctible maladjustments” in their balance of payments. They argue that because the IMF also lends for other purposes – for example, it provides the equivalent of debtor-in-possession finance to “insolvent” governments forced to restructure their debts – a country that takes an IMF loan would be signalling to the rest of the world that it is insolvent, thereby preventing the Fund from acting as an emergency lender to countries that are illiquid. This international equivalent of the Bagehot Rule for domestic lenders of last resort – provide only temporary liquidity support to solvent borrowers against good collateral – is intuitively appealing. But others of us would observe that limiting IMF lending to short-term liquidity assistance, to the exclusion of other programs and facilities, would have costs as well as benefits.99 We would suggest that the line between illiquidity and insolvency is not always that easy to draw, especially for sovereigns. Hopefully unilateral prequalification would be enough.
The reluctance of countries like the United States to provide additional dollar swaps could be addressed by allowing the IMF to offer the US a guarantee against financial losses in the event that the SDR depreciated significantly against the dollar while the swap line was being utilized. This would not eliminate the risk, but it would shift it from the balance sheet of the Fed to the balance sheet of the Fund. Such an arrangement would therefore have to be accompanied by agreement among the members to recapitalize the Fund in the event of significant capital losses. The United States would not be protected from all losses, but its part would be reduced to its quota share (currently some 17 per cent). This is an acceptable price, it can be argued, for a global insurance policy. Whether the US Congress would view it this way remains to be seen. 99 Denying all IMF assistance under all circumstances to countries with solvency problems is especially
problematic in a world where institutions for efficient restructuring of sovereign debt are absent. There is of course a large literature on how to create or reform those institutions, but pursuing this issue would take me too far afield in what is already a long paper.
ECB Forum on Central Banking, June 2016 53
It is tempting to argue that further governance reform – rebalancing voting shares toward emerging markets – will help to create the necessary confidence that the IMF will execute these functions in an even-handed way. But the preceding discussion suggests that focusing on voting shares and government control of the IMF’s day-to-day operations may not be the correct emphasis. If the reason why Fed swaps are seen by the recipients as more attractive and effective than IMF lending is that they are provided by an independent agency that does not attach political conditions, either explicitly or implicitly, to its assistance, then strengthening the control of national governments over the Fund’s day-to-day operations may be a mixed blessing. An alternative is to give the IMF’s managing directors more independence, like that possessed by the members of the Federal Open Market Committee who are responsible for authorizing the extension of Federal Reserve swap lines.100 The role of governance reform would then be to create a more representative executive board to which the managing directors would periodically report, and which would then be better positioned to hold those managing directors accountable for their decisions. This kind of arrangement would be more in line with Keynes’ original vision of the role of the IMF in the global monetary order.
7 An incremental approach to reform
Critics of the global monetary order fall into two camps: radical reformers and incrementalists. Radical reformers envisage inter alia the wholesale reimposition of controls on international capital flows, a new Bretton Woods Agreement requiring cooperation among central banks to stabilize exchange rates worldwide, replacement of the dollar as the leading international currency by a transnational unit, and the creation of an international bankruptcy tribunal or court for sovereigns. Incrementalists dismiss these ambitious initiatives as infeasible or undesirable and advocate instead “tinkering around the edges” so as to strengthen the existing order and enhance its operation. Being an incrementalist by nature, I will leave radical reform to others and conclude with a few modest proposals for strengthening the existing order.
First, the volatility of capital flows and the continuing problem of sudden stops is best addressed through policy incentives, applied in the context of the existing framework, to shift the composition of flows from short term to long term and from debt to equity. This means reforms of tax codes at the national level that make the bias toward debt less pronounced (eliminating the tax deductibility of debt service payments for banks and corporates in the United States, for example). It means changes in prudential regulation (further changes in capital and related charges for lenders designed to make short-term debt finance more costly and therefore less attractive compared to equity investment, including FDI). The evidence is overwhelming that short-term debt flows are especially
100 Proposals to this effect have a long history, dating all the way back to the Keynes-authored UK proposal for an
International Clearing Union. Some readers of an earlier draft of this paper asked for a more detailed proposal about how a more independent management team might operate – for example, would the Managing Director and Deputy Managing Directors take decisions by majority vote, in the manner of a monetary policy committee, or would they do so by consensus, and at what frequency and under what circumstances would they be answerable to the Board of Governors of the institution? Filling in these details would require considerable additional space. Fortunately, the relevant details are already available, in De Gregorio, Eichengreen, Ito and Wyplosz (2001). A longer paper would also discuss other aspects of IMF reform, and the associated political economy. Fortunately this one has been written as well (Eichengreen and Woods 2016).
ECB Forum on Central Banking, June 2016 54
volatile and associated with sudden-stop problems and that these flows are encouraged by tax and regulatory distortions. Once upon a time, these problems could be dismissed as specific to emerging markets. Recent trends and experience suggest that they need to be addressed by emerging markets and advanced countries alike.
It is worth flagging the potential policy implications of these initiatives designed to address capital-flow volatility for the international liquidity problem, addressed further below. Tax and regulatory initiatives that encourage the issuance of equity-like claims in preference to debt instruments may reduce capital-flow volatility but at the same time reduce the supply of suitably safe and liquid assets, insofar as equity and equity-like claims, returns on which are strongly correlated with economic conditions in the issuing countries, are perceived as risky. This is a caution as to how far policymakers should go in using this approach to damp down capital-flow volatility. Economists are in the business of analyzing trade-offs; here there is a trade-off between enhancing the stability of capital flows on the one hand and maintaining the supply of international liquidity on the other.
A particularly difficult capital-flow-related issue, which has a strong if not exclusively emerging-market flavor, is that of foreign-currency-denominated corporate debt. Strengthening corporate governance requirements is the most straightforward way of discouraging corporations from incurring dangerous levels of foreign-currency debt but is easier said than done (Ananchotikul and Eichengreen 2009). Putting in place a proper insolvency code and efficient judicial procedures would help by strengthening market discipline: if financial reorganization is a viable alternative, then the government will not be forced to use its foreign reserves to bail out insolvent corporates for wont of an alternative, and lenders will provide foreign-currency finance less freely. Using supervision and regulation to avoid a “Korea in 1997 scenario” where foreign-currency debt is channelled through domestic banks will further reduce the pressure for the authorities to bail out insolvent corporates and thereby further limit moral hazard for lenders. Finally, developing deeper and more liquid domestic corporate bond markets would provide firms seeking low-cost finance an attractive alternative to risky foreign-currency funding (Eichengreen and Luengnaruemitchai 2006). But corporate bond markets are almost always and everywhere slow to develop, displaying as they do formidable information requirements and presupposing effective corporate disclosure, efficient rating-agency infrastructure and predictable legal regimes. More generally, that these were all well-known lessons of the Asian financial crisis, yet that they remain incompletely acted on even today, suggests that implementing these solutions will not be easy.
Second, while we are likely to continue to observe a variety of different exchange-rate regimes and different opinions regarding their efficacy, my reading of the evidence is that intermediate regimes remain disproportionately crisis prone. Countries should be encouraged, it follows, to move toward either freer floats or harder fixes. For the floaters, this requires putting in place the “deeper” prerequisites for the viability of a more flexible exchange-rate regime alluded to in Section 3 above. In particular, as my discussant has observed, a floating exchange rate is not a monetary rule; it is the absence of a monetary rule (Calvo 2001). Countries moving to freer floats therefore need to articulate an alternative that does not involve targeting the exchange rate. Formal inflation targeting is an attractive alternative, although there is still only limited movement in this direction, as noted above. A corollary benefit is that inflation targeting also tends to deliver stable,

ECB Forum on Central Banking, June 2016 55
better-behaved exchange rates between pairs of inflation-targeting countries (Eichengreen and Taylor 2004). In terms of delivering a “stable system of exchange rates” (to paraphrase the IMF’s 1977 decision on surveillance), I would suggest that this is the best we can do.
But to work smoothly and provide a relatively stable system of exchange rates and other benefits, inflation targeting must be accompanied by an effective communications strategy, as China’s experience since August 2015 reminds us. It also must be implemented in a flexible manner that addresses financial concerns (where these are not adequately addressed by other agencies of government and their instruments), as we have been reminded by the global financial crisis.
Third, steps should be taken at national and global levels to address international liquidity needs. For the foreseeable future, the principal source of international liquidity on the margin will continue to be the liabilities of national governments, and specifically those national governments the claims on which are liquid and widely accepted. In practice this means mainly the bonds of the US government, euro area governments, and potentially China. For the US to remain a source of safe assets, it will be important to shun proposals for radical tax reform that threaten to blow a hole in the budget, of a sort that regularly arise during the presidential campaign silly season. For the euro area to enhance its status as a source of safe assets, European governments that lack investment-grade ratings will have to rebuild their creditworthiness, or else members will have to agree on a scheme whereby they – and specifically members with strong credit – jointly guarantee their collective liabilities (can you say Eurobonds?). Either way, Europe will have to draw a line under its crisis. But both solutions will take time, which is another reason to anticipate that progress on the international liquidity problem will be incremental, rather than discrete. Effective internationalization of the renminbi, in the sense of enhancing the liquidity, access to and acceptance of renminbi-denominated assets internationally, will similarly take time. Recent events suggest that it will take even more time than previously supposed.
SDRs cannot supplement the overall stock of international liquidity in the short run, since conventional SDR allocations are simply claims on the aforementioned stock of government bonds. On the other hand, allocating SDRs directly to the central banks of the countries whose currencies are constituents of the SDR basket, in return for high-powered money, would make a difference for international liquidity provision. Here too there is an argument for proceeding incrementally. Members could agree to authorize the IMF to allocate SDRs to central banks in exchange for national currencies up to a modest ceiling, for temporary periods, under special circumstances, while guaranteeing the participating central banks against balance-sheet losses. This would modestly enhance the IMF’s lending capacity and augment the supply of international liquidity under those special circumstances, where both lending and liquidity were most urgently needed.
Proceeding on even a small scale would set a useful precedent. Establishing that this practice did inflict financial losses on participating central banks or undermine their monetary control might then set the stage for expanding the mechanism in the future.

ECB Forum on Central Banking, June 2016 56
An alternative or complement would be to permit the IMF to borrow on capital markets to fund its liquidity-provision operations.101 The bonds of other multilaterals such as the World Bank are included in international liquidity as measured in Chart 8 because these are sold to private investors and have investment-grade status courtesy of the collective backing of members. Again, authorization to borrow on the markets could start modestly and then be ramped up gradually. Either way – either if the IMF guaranteed SDR allocations to central banks or if it issued bonds – there would have to be agreement by the members to recapitalize the institution in the event of losses if it is to stand behind its obligations. Again, the incremental approach suggests overcoming political resistance by experimenting with this mechanism on a modest scale.
Yet another approach to addressing global liquidity needs, at least in theory, is to pool the bonds of super-AAA governments with the sub-investment-grade bonds of other countries to create a “mezzanine tranche” of international liquidity (in effect extracting surplus liquidity from high-grade bonds and assigning it to the holders of lower-grade securities). One wonders why, if international liquidity needs are pressing, private markets have not leapt into this breach. One answer is that such private-sector securitizations would not be attractive for the same reason that private-sector liabilities are not attractive as a component of international liquidity, namely information sensitivity and counterparty risk (as discussed in Section 6 above). This, then, is an argument for an international financial institution like the IMF to undertake the role, presumably starting on a small scale, by issuing its own asset-backed securities.
If there is no silver bullet that will solve the problem of capital-flow volatility, eliminate the sudden-stop problem, or radically augment the supply of international liquidity, then it becomes even more urgent to fill the holes in the global safety net in order to ensure that the limited supply of international liquidity is made available to individual countries as appropriate. This means sending the message that reserves are there to be used, and that IMF reserve-adequacy calculations are intended to identify the ceiling for reserves, not the floor. To the extent that countries are reluctant to utilize their reserves for fear of sending an adverse signal, it means strengthening IMF surveillance so as to ameliorate the underlying asymmetric-information problem. It means addressing IMF stigma through collective, unilateral prequalification for IMF credit lines and continued procedural reform of the institution. It means expanding the currently limited network of permanent central bank swap agreements. The result will not be perfect. But the perfect should not be allowed to be the enemy of the good.
References
Acharya, Viral, Cecchetti, Stephen, De Gregorio, Jose, Kalemli-Ozcan, Sebnem, Lane, Philip and Panizza, Ugo (2015), “Corporate Debt in Emerging Economies: A Threat to Financial Stability?”, Brookings Institution, Washington, D.C., September.
101 The IMF already has a framework in place for issuing bonds (Prasad 2009), but only to governments, not on
private markets.

ECB Forum on Central Banking, June 2016 57
Ahmed, Swarnali, Appendino, Maximiliano and Ruta, Michele (2015), “Depreciations without Exports: Global Value Chains and the Exchange Rate Elasticity of Exports”, Policy Research Working Paper No 7390, World Bank, Washington, D.C., August.
Aizenman, Joshua, Chinn, Menzie and Ito, Hiro (2008), “Assessing the Emerging Global Financial Architecture: Measuring the Trilemma’s Configurations over Time”, NBER Working Paper, No 14533, December.
Aizenman, Joshua and Sun, Yi (2012), “The Financial Crisis and Sizable International Reserves Depletion: From ‘Fear of Floating’ to the ‘Fear of Losing International Reserves’?”, International Review of Economics and Finance 24, pp. 250-269.
Ananchotikul, Sudarat and Eichengreen, Barry (2009), “Corporate Governance Reform in Emerging Markets: How Much, Why, and With What Effects?”, Journal of the Japanese and International Economies 23, pp. 149-176.
Arteta, Carlos, Klein, Michael and Shambaugh, Jay (2016), “Peg and Control? The Links between Exchange Rate Regimes and Capital Account Policies”, Global Economic Prospects, World Bank, Washington, D.C., Chapter 4, pp. 237-249.
Asian Development Bank (2011), Reshaping Global Economic Governance and the Role of Asia in the Group of Twenty (G20), Asian Development Bank, Manila, and Peterson Institute for International Economics, Washington, D.C.
Beers, David and Nadeau, Jean-Sebastien (2015), “Data Base of Sovereign Defaults, 2015”, Technical Report No 101, Bank of Canada, Ottawa, May.
Bleaney, Michael, Tian, Mo and Yin, Lin (2016), “Global Trends in the Choice of Exchange Rate Regime”, Open Economies Review 27, pp. 71-86.
Bluedorn, John, Dattagupta, Rupa, Guajardo, Jaime and Topalova, Petia (2013), “Capital Flows are Fickle: Anytime, Anywhere”, IMF Working Paper No 13/183, August.
Bordo, Michael (1996), “The Specie Standard as a Contingent Rule: Some Evidence for Core and Peripheral Countries, 1880-1990”, in Jorge Braga de Macedo, Barry Eichengreen and Jaime Reis (eds.), Currency Convertibility: The Gold Standard and Beyond, London: Routledge, pp. 11-83.
Broner, Fernando, Didier, Tatiana, Erce, Aitor and Schmukler, Sergio (2013), “Gross Capital Flows: Dynamics and Crises”, Journal of Monetary Economics 60, pp. 113-133.
Burger, John, Warnock, Frank and Warnock, Virginia (2012), “Emerging Local Currency Bond Markets”, Financial Analysts Journal 68, pp. 73-93.
Bussiere, Matthieu, Schmidt, Julia and Valla, Natacha (2016), “International Financial Flows in the New Normal: Key Patterns (and Why We Should Care)”, CEPII Policy Brief No 10, Paris, March.
Caballerio, Julian, Panizza, Ugo and Powell, Andrew (2015), “The Second Wave of Global Liquidity: Why are Firms Acting like Financial Intermediaries?”, CEPR Discussion Paper No 10926, November.

ECB Forum on Central Banking, June 2016 58
Caballero, Ricardo, Farhi, Emmanuel and Gourinchas, Pierre-Olivier (2015), “Global Imbalances and Currency Wars at the ZLB”, NBER Working Paper, No 21670, March.
Caballero, Ricardo and Krishnamurthy, Arvind (2003), “Excessive Dollar Debt: Financial Development and Underinsurance”, Journal of Finance 58, pp. 867-894.
Calvo, Guillermo (1996), Money, Exchange Rates and Output, Cambridge, Mass.: MIT Press.
Calvo, Guillermo (2001), “Capital Markets and the Exchange Rate, with Special Reference to the Dollarization Debate in Latin America”, Journal of Money, Credit and Banking 33, pp. 312-334.
Cavallo, Eduardo, Powell, Andrew, Pedemonte, Mathieu and Tavella, Pilar (2013), “A New Taxonomy of Sudden Stops: Which Sudden Stops Should Countries Be Most Concerned About?”, Inter-American Development Bank Working Paper No 430, August.
Chinn, Menzie and Ito, Hiro (2006), “What Matters for Financial Development? Capital Controls, Institutions and Interactions”, Journal of Development Economics 81, pp. 163-192.
Chui, Michael, Kuruc, Emese and Turner, Philip (2015), “A New Dimension to Currency Mismatches in Emerging Markets: Non-Financial Companies”, BIS Working Paper No 550, March.
Crafts, Nicholas and Fearon, Peter (2013), “The 1930s: Understanding the Lessons”, in Crafts, Nicholas and Fearon, Peter (eds.), The Great Depression of the 1930s: Lessons for Today, Oxford: Oxford University Press, pp. 45-74.
David, Paul and Bunn, Julie (1988), “The Economics of Gateway Technologies and Network Evolution: Lessons from Electricity Supply History”, Information Economics and Policy 3, pp. 165-202.
De Gregorio, Jose, Eichengreen, Barry, Ito, Takatoshi and Wyplosz, Charles (2001), “An Independent and Accountable IMF”, CEPR, London.
Delikouras, Stefanos, Dittmar, Robert and Li, Haitao (2012), “Do Dollar-Denominated Emerging Market Corporate Bonds Insure Foreign Exchange Risk?”, unpublished manuscript, University of Michigan at Ann Arbor, November.
Denbee, Ed, Jung, Carsten and Paterno, Francesco (2016), “Stitching Together the Global Financial Safety Net”, Financial Stability Paper No 36, Bank of England, London, February.
Destais, Christophe (2014), “Central Bank Currency Swaps and the International Monetary System”, CEPII Policy Brief No 5, Paris, September.
Du, Wenxin and Schreger, Jesse (2015), “Sovereign Risk, Currency Risk and Corporate Balance Sheets”, unpublished manuscript, Federal Reserve Board and Harvard University, May.
Efremidze, Levan, Kim, Sungsoo, Sula, Ozan and Willett, Thomas (2015), “The Relationships among Capital Flow Surges, Reversals and Sudden Stops”, unpublished manuscript, Claremont Institute for Economic Policy Studies, December.
ECB Forum on Central Banking, June 2016 59
Eichengreen, Barry (1998), Globalizing Capital: A History of the International Monetary System, Princeton: Princeton University Press.
Eichengreen, Barry (1999), Toward a New International Financial Architecture: A Practical Post-Asia Agenda, Washington, D.C.: Institute for International Economics.
Eichengreen, Barry (2010), “The G-20 and the IMF: An Uneasy Relationship”, Global Asia 5, pp. 28-32.
Eichengreen, Barry (2013), “Renminbi Internationalization: Tempest in a Teapot?”, Asian Development Review 30, pp. 148-164.
Eichengreen, Barry (2015), Hall of Mirrors: The Great Depression, the Great Recession, and the Uses – and Misuses – of History, New York: Oxford University Press.
Eichengreen, Barry and Flandreau, Marc (2009), “The Rise and Fall of the Dollar (Or When Did the Dollar Replace Sterling as the Leading Reserve Currency?)”, European Review of Economic History 13, pp. 377-411.
Eichengreen, Barry and Gupta, Poonam (2013), “The Real Exchange Rate and Export Growth: Are Services Different?”, Policy Research Working Paper No 6629, World Bank, Washington, D.C., September.
Eichengreen, Barry and Gupta, Poonam (2016), “Managing Sudden Stops”, unpublished manuscript, University of California, Berkeley, and World Bank, March.
Eichengreen, Barry and Jeanne, Olivier (2000), “Currency Crisis and Unemployment: Sterling in 1931”, in Paul Krugman (ed.), Currency Crises, Chicago: University of Chicago Press, pp. 7-43.
Eichengreen, Barry and Luengnaruemitchai, Pipat (2006), “Why Doesn’t Asia Have Bigger Bond Markets?”, in Bank for International Settlements (ed.), Asian Bond Markets: Issues and Prospects, BIS Papers No 30, pp. 40-77.
Eichengreen, Barry, Mehl, Arnaud and Chitu, Livia (2016), International Currencies Past, Present and Future: Two Views from Economic History (forthcoming).
Eichengreen, Barry, Park, Donghyun and Shin, Kwanho, “Deflation in Asia: Should the Dangers be Dismissed?”, unpublished manuscript, Asian Development Bank, February.
Eichengreen, Barry and Taylor, Alan (2004), “The Monetary Consequences of a Free Trade Area of the Americas”, in Antoni Estevadeordal, Dani Rodrik, Alan Taylor and Andres Velasco (eds.), Integrating the Americas: FTAA and Beyond, Cambridge, Mass.: Harvard University Press, pp. 189-226.
Eichengreen, Barry and Woods, Ngaire (2016), “The IMF’s Unmet Challenges”, Journal of Economic Perspectives 30, pp. 29-52.
Eggertsson, Gauti (2008), “Great Expectations and the End of the Depression”, American Economic Review 98, pp. 1476-1516.
ECB Forum on Central Banking, June 2016 60
Fleming, J. Marcus (1961), “International Liquidity: Ends and Means”, IMF Staff Papers 8, pp. 439-463.
Frankel, Jeffrey (1999), “No Single Currency Regime is Right for All Countries or at All Times”, Essays in International Finance No 215, International Finance Section, Department of Economics, Princeton University, August.
Frankel, Jeffrey (2011), “Historical Precedents for Internationalization of the RMB”, Council on Foreign Relations Occasional Paper, Council on Foreign Relations, New York, November.
Frankel, Jeffrey and Wei, Shang-Jin (2008), “Estimation of De Facto Exchange Rate Regimes: Synthesis of the Techniques for Inferring Flexibility and Basket Weights”, IMF Staff Papers 55, pp. 384-416.
Ghosh, Atish, Ostry, Jonathan and Qureshi, Mahvash (2014), “Exchange Rate Management and Crisis Susceptibility: A Reassessment”, IMF Working Paper No 14/11, January.
Goffman, Erving (1963), Stigma: Notes on the Management of a Spoiled Identity, Englewood Cliffs: Prentice Hall.
Gorton, Gary (2016), “The History and Economics of Safe Assets”, NBER Working Paper, No 22210, April.
Gourinchas, Pierre-Olivier and Jeanne, Olivier (2012), “Global Safe Assets”, paper prepared for the 11th BIS Annual Conference, Lucerne, 20-21 June.
Hayek, Friedrick (1973), Rules and Order, Vol. 1 of Law, Legislation and Liberty, Chicago: University of Chicago Press.
Howson, Susan (1980), “Sterling’s Managed Float: The Operations of the Exchange Equalisation Account, 1932-39”, Princeton Studies in International Finance, No 46, International Finance Section, Department of Economics, Princeton University, November.
International Monetary Fund (2011), Assessing Reserve Adequacy, Washington, D.C., February.
International Monetary Fund (2012), Global Financial Stability Report: The Quest for Lasting Stability, Washington, D.C., April.
International Monetary Fund (2016a), “Understanding the Slowdown in Capital Flows to Emerging Markets”, World Economic Outlook, Chapter 2, April.
International Monetary Fund (2016b), “Strengthening the International Monetary System – A Stocktaking”, Washington, D.C., February.
Jeanne, Olivier (2005), “Why Do Emerging Market Economies Borrow in Foreign Currency?”, in Barry Eichengreen and Ricardo Hausmann (eds.), Other People’s Money: Debt Denomination and Financial Instability in Emerging Market Economies, Chicago: University of Chicago Press, pp. 190-217.
Keynes, John Maynard (1923), A Tract on Monetary Reform, London: Macmillan.

ECB Forum on Central Banking, June 2016 61
Kliatkova, Tatsiana and Mikkelsen, Uffe (2015), “Floating with a Load of FX-Debt?”, IMF Working Paper, No 15/284, December.
Krugman, Paul (1979), “A Model of Balance of Payments Crises”, Journal of Money, Credit and Banking 11, pp. 311-325.
Kurzban, Robert and Leary, Mark (2001), “Evolution Origins of Stigmatization: The Functions of Social Exclusion”, Psychological Bulletin 127, pp. 187-208.
Laeven, Luc and Valencia, Fabian (2012), “Systemic Banking Crises Database: An Update”, IMF Working Paper, No 12/163, June.
Lane, Philip and Milesi-Ferretti, Gian-Maria (2007), “The External Wealth of Nations Mark II: Revised and Extended Estimates of Foreign Assets and Liabilities, 1970-2004”, Journal of International Economics 73, pp. 223-250.
Leigh, Daniel, Lian, Weicheng, Poplawski-Ribeiro, Marcos and Tsyrennikov, Viktor (2015), “Exchange Rates and Trade Flows: Disconnected?”, World Economic Outlook, IMF, Washington, D.C., October, pp. 105-142.
Lindert, Peter (1969), “Key Currencies and Gold, 1900-1913”, Princeton Studies in International Finance, No 24, International Finance Section, Department of Economics, Princeton University.
Marsh, David (2016), “China Accelerates SDR Bond Platform”, OMFIF Commentary 7, 26 April.
McGettigan, Doinal, Moriyama, Kenji, Ntsama, Noah, Painchaud, François, Qu, Haonan and Steinberg, Chad (2013), “Monetary Policy in Emerging Markets: Taming the Cycle”, IMF Working Paper No 13/96, May.
Mendoza, Enrique and Terrones, Marco (2012), “An Anatomy of Credit Booms and their Demise”, The Chilean Economy 15, pp. 4-32.
Moghadam, Reza, Hagen, Sean, Tweedie, Andrew, Viñals, José and Ostry, Jonathan (2010), “The Fund’s Mandate – Future Financing Role”, IMF, Washington, D.C., 25 March.
Moody’s (2015), “Dramatic Rise in Local Currency Debt Issuance Reduces Emerging Market Countries’ Vulnerability to Shocks”, Moody’s Investor Service, New York, September.
Moore, Elaine (2016), “Emerging Markets Flock Back to Bonds”, Financial Times, 15 March, p. B1.
Nordvig, Jens and Fritz, David (2015), “Hidden Debt in EM”, Nomura, London, 18 December.
Nurkse, Ragnar (1944), International Currency Experience, United Nations, Geneva.
Obstfeld, Maurice (2011), “The SDR as an International Reserve Asset: What Future?”, Rapid Response Working Paper, No 11/0885, International Growth Centre, London School of Economics, March.

ECB Forum on Central Banking, June 2016 62
Obstfeld, Maurice and Rogoff, Kenneth (1995), “The Mirage of Fixed Exchange Rates”, Journal of Economic Perspectives 9, pp. 74-96.
Ocampo, José Antonio (2010), “Special Drawing Rights and the Reform of the Global Reserve System”, report, Intergovernmental Group of Twenty-Four.
OECD (2007), Economic Survey of the Euro Area 2007, Paris.
Park, Yung Chul (2011), “The Role of Macroprudential Policy for Financial Stability in East Asia’s Emerging Economies”, in Eswar Prasad (ed.), Asian Perspectives on Financial Sector Reforms and Regulation, Brookings Institution, Washington, D.C., pp. 138-163.
Prasad, Eswar (2009), “IMF Bonds: Details and Implications”, Brookings Institution, Washington, D.C.
Reinhart, Carmen and Trebesch, Christoph (2016), “The International Monetary Fund: 70 Years of Reinvention”, Journal of Economic Perspectives 30, pp. 3-28.
Rey, Hélène (2015), “Dilemma, Not Trilemma: The Global Financial Cycle and Monetary Policy Independence”, NBER Working Paper, No 21162, May.
Rogoff, Kenneth, Husain, Aasim, Mody, Ashoka, Brooks, Robin and Oomes, Nienke (2004), “Evolution and Performance of Exchange Rate Regimes,” IMF Occasional Paper, No 229.
Rose, Andrew (2007), “A Stable International Monetary System Emerges: Inflation Targeting is Bretton Woods Reversed”, Journal of International Money and Finance 25, pp. 663-681.
Stiglitz, Joseph (2011), “The Best Alternative to a New Global Currency”, Financial Times, 31 March.
Talley, Ian (2014), “In Face-Off, Fed’s Keeping the IMF Out of its Currency Swap Domain”, Wall Street Journal, 22 May.
Tavlas, George, Dellas, Harris and Stockman, Alan (2008), “The Classification and Performance of Alternative Exchange Rate Systems”, European Economic Review 52, pp. 941-963.
Triffin, Robert (1947), “National Central Banking and the International Economy”, Postwar Economic Studies 7, pp. 46-81.
Truman, Edwin (2010), “The G-20 and International Financial Institution Governance”, Working Paper 10-13, Peterson Institute for International Economics, Washington, D.C., September.
Turner, Philip (2014), “The Global Long-Term Interest Rate, Financial Risks and Policy Choices in EMEs”, BIS Working Paper, No 441, Bank for International Settlements, Basel, February.
Urban, Scott (2009), “The Name of the Rose: Classifying 1930s Exchange-Rate Regimes”, Discussion Paper in Economic and Social History, No 78, University of Oxford, April.

ECB Forum on Central Banking, June 2016 63
Williamson, John (1977), The Failure of World Monetary Reform, 1971-1974, Sunbury-on-Thames: Nelson & Sons.

ECB Forum on Central Banking, June 2016 64
Comment on “Global monetary order” by Barry Eichengreen By Guillermo Calvo102
I greatly enjoyed reading this paper. It provides a thorough and largely self-contained narrative of the current central macro-financial issues, including issues regarding policies to ensure that the world economy rids itself of monetary crises, especially those that give rise to a costly stoppage of credit flows (or credit sudden stops). The view that emerges from the paper is that problems associated with crises in emerging market economies (EMEs) and the Great Recession have not subsided and, if anything, have spread all across the globe. Advanced market economies (AEs), which once were thought to be immune to damaging volatile capital flows, are now almost indistinguishable from the rest. International liquidity, which is at the heart of these crises, has suffered a major collapse since 2009 (Chart 8) from which it has not recovered, while the global safety net has reached a low-level plateau (Chart 9).103
This bleak view is further reinforced by the observation that policymaking seems to have lost the zest that characterized the first stages of the Great Recession. To illustrate, the 2008 Lehman crisis saw advanced economies take the lead to prevent a replay of the Great Depression, decidedly relaxing monetary and fiscal policy. AE central banks reacted quickly, lowering their policy interest rates and, as the latter reached the zero lower bound (ZLB), launched a massive increase of monetary aggregates (i.e. quantitative easing, QE), a policy that the Fed had abandoned in the 1980s. However, this flurry of creative and courageous ideas soon came to a standstill despite slow recovery. AE central banks continue, on and off, to announce new QE and are now venturing into negative interest rate territory, but structural change including debt or fiscal reprofiling, which is probably at the root of current problems, has not taken centre stage. In particular, overindebtedness in the eurozone, highlighted by the serious problems of Italian banks, continues to put a brake on credit flows. Moreover, the current monetary order discussion is not paying enough attention to liquidity issues of the type raised by Triffin104 a long while ago.
In this context, the International Monetary Fund (IMF) is searching for new rules of the game that will guarantee sustainable and equitable growth. Thus far, however, much of what has come out of the IMF research and policy notes endorses a more permissive stance towards intervention in the foreign exchange market and controls on international capital mobility. These policies are welcomed in particular circumstances and for individual economies, but run counter to the objectives that inspired the creation of the Bretton Woods institutions, i.e. developing rules of the game for the global economy that, among other things, helped prevent “currency wars”. The more permissive stance, coupled with strong endorsement of floating exchange rates expressed by the IMF at
102 Columbia University. 103 Chart numbers correspond to those in Eichengreen’s paper. 104 Triffin (1960).

ECB Forum on Central Banking, June 2016 65
every turn, brings us back to the mid-1940s with an important difference: in the mid-1940s the world had recovered from the Great Depression, while we are still struggling (particularly in the eurozone). In view of this, it should cause no great surprise if the global economy is not running on an even keel and markets failed to converge to a “new normal”. Market failure is still the rule and, thus, reverting to a non-cooperative equilibrium may be counterproductive.
The biggest challenge at the moment is to offer politically feasible ideas that will accelerate recovery and ensure a much smoother ride going forward. Eichengreen’s paper excels in reviewing and discussing these ideas. His conclusion is that virtually every radical reform proposal is likely to face severe political resistance. This leads the author to endorse what he calls incremental reforms, which basically involve “tinkering around the edges” of the actual global monetary order.
In the following remarks, I will (1) suggest that the actual monetary order may be at the brink of further collapse owing to a liquidity shortage that could be exacerbated by dirty floating among AE currencies and negative interest rates; and (2) discuss the creation of an Emerging Market Fund, which may help to remove some of the stigma associated with the recent IMF emergency credit lines.
1 Exchange rate and monetary policy: don’t lose sight of global liquidity!
The case for incremental reform is very persuasive. However, it runs the risk of fostering a laid-back attitude. The problem is that nothing ensures that the current situation is stable, and that no new episodes of liquidity crunch are in the offing. This view appears to be shared by the Fed as it recently made abundantly clear that they were ready to offer new currency swaps to the ECB if Brexit destabilized the eurozone financial sector. I do not disagree with the announcement, but it evidences some dissonance with the view often touted by the Fund that flexible exchange rates among reserve currencies is better than keeping exchange rates within narrow bands. These facts suggest that the current international monetary order favours floating exchange rates under “normal” conditions but intervention to prevent large volatility, particularly in liquidity crunch episodes – ignoring that the world is already in a liquidity quagmire, as depicted in Chart 8, that may require immediate and decisive action.
Eichengreen’s paper shows some concern about this finding, and I agree. My concern is even greater given that Chart 8 does not take into account the “quality” of the liquidity being measured there. We became aware of the macroeconomic importance of liquidity quality in the Lehman crisis. Gorton and Metrick (2012) show, for example, that during the Lehman crisis, the “haircut” on asset-backed securities (ABS) quickly rose from negligible to more than 40%. This shock deprived ABS of liquidity because it made its fragility fully evident. Interestingly, a similar computation for euro-denominated assets shows that the euro devaluation with respect to the US dollar in the period from April 2014 to the same month of 2015 would be equivalent to a haircut exceeding 20%. This is half the ABS haircut but covers a much larger set of assets. Hence, the question arises: did the 2014-15 devaluation lower the liquidity quality of euro-denominated assets? And, perhaps more

ECB Forum on Central Banking, June 2016 66
relevant: is exchange rate volatility a deterrent to the creation of high-quality liquidity, particularly liquidity relevant for international transactions? I do not know the answer. However, given the risks, I believe liquidity quality has to be given special attention and, if anything, policymakers should err on the side of being excessively cautious about this matter. Low quality international liquidity invites liquidity crunch episodes that carry severe global economic and political consequences. Therefore, I find it hard to endorse a system like the one we seem to have adopted in which, as pointed out above, foreign exchange intervention to stabilize AE exchange rates is implemented only when a liquidity breakdown is about to occur. It is like making an appointment with your doctor only when you are about to suffer a heart attack! This may sound alarmist, but it is worth recalling the string of recent crises from the 1998 Russian crisis to the 2013 “Taper Tantrum”105 for which it is hard to offer a rationale that does not include a meltdown of low-quality liquid assets.
Let me now turn to negative policy interest rates. This policy proposal goes back to at least Gesell (1916)106 (see also Keynes discussion of Gesell’s stamped money proposal in his General Theory, Chapter 23).107 Contrary to initial misgivings, central banks seem to be able to perforate the ZLB without causing damaging bank runs. The policy is inspired by the hunch that the impact of the Great Recession is so serious that the new full-employment equilibrium is associated with a negative real interest rate. Hence, in an IS/LM model where the central bank controls the “pure” or liquidity-free interest rate, if inflation is undesirable and the ZLB is not binding, full employment calls for setting the policy interest rate below zero at the appropriate level. This has been criticized as possibly giving rise to risky investment projects that could militate against sustainable growth.108 But, irrespective of that, negative central bank interest rates have an impact on the rate of return on liquid assets, since it is akin to imposing an inflation tax: it makes liquid assets less attractive, shrinking total liquidity, and possibly exacerbating the liquidity shortage highlighted in Eichengreen’s paper. Moreover, negative AE interest rates may give incentives for the creation of low-quality liquid assets, which are bound to unravel when AE rates threaten to rise, generating phenomena looking like speculative bubbles.109 Actually, this helps to explain the large flow of capital to EMEs that occurred after Lehman and unravelled since the Taper Tantrum episode, when the market expected that the Fed would start raising its policy interest rate.
Section 6 of Eichengreen’s paper takes a somewhat optimistic view of the possibility of the system finding a better equilibrium by endogenously developing new high-quality (or “safe”) liquid assets. This may be so in the long run but I doubt that a stable system can be developed under the present conditions absent international coordination of monetary policies. Coordination may involve a new version of the Bretton Woods arrangement, mutually compatible inflation-targeting regimes110 or some combination of the two. I am afraid that without coordination, new high-quality liquid assets could crowd out existing
105 Sahay et al. (2014). 106 The date corresponds to the first edition in German, as reported in Keynes (1936), Chapter 23. 107 Keynes (1936). 108 Stiglitz (2016). 109 Calvo (2016). 110 Taylor (2016).
ECB Forum on Central Banking, June 2016 67
ones or even trigger a race to the bottom, in which effective liquidity shrinks even more. “Currency wars” in one form or another are hard to rule out under the present conditions in which, as mentioned at the outset, fundamental fiscal and debt issues have not been resolved.
2 Emerging market economies safety net: overcoming the IMF stigma
Another central topic in Eichengreen’s paper is the vulnerability of emerging markets to financial shocks that, in many cases, are triggered by external sources. In response to this, after the Russian 1998 crisis several countries accumulated sizable stocks of international reserves in order to protect the domestic financial system from sudden stop (of external and domestic credit). This trend was spearheaded by Asian economies in response to highly pro-cyclical IMF programs, which are blamed for deepening recession.
However, this self-insurance strategy is costly. International reserves currently earn rock-bottom interest rates, while owing to still high country risk factors interest rates on EME liabilities are much higher. This prompted the IMF to devise rapid-disbursement emergency credit facilities. In contrast with standard IMF credit, those funds are available on the spot, subject to pre-qualification by the Fund. The facilities (e.g. Flexible Credit Line) mimic a lender of last resort but, in contrast with the latter, the available funds have a well-defined upper bound. Several emerging markets have acceded to these facilities although, as discussed in Eichengreen’s paper, there is still an uncomfortable air of stigma around them. Countries fear that merely applying for these kinds of facilities may signal that the economy is vulnerable to a financial crisis. Moreover, qualifying for IMF emergency funding offers little assurance that qualification will hold true in the future. Hence, there are grounds for policymakers to fear that by accessing IMF emergency funding they may become “hostages” of the Fund’s unilateral criteria, because failing to qualify may cast a pall on credibility and even trigger a liquidity crisis.
Elsewhere,111 I have discussed this issue and proposed setting up an Emerging Market Fund (EMF). The main difference between the EMF and the present IMF emergency facilities is that the EMF objective is to stabilize an EME index like the J.P. Morgan EMBI+112 around trend. This could be implemented by stabilizing the market value of a pool of assets from EMEs that agree to participate in the EMF index. No individual country represented in the pool has access to EMF funding or has a say on EMF operations. This should help to remove a great deal of the stigma of existing facilities, especially if a large number of EMEs join in.
The EMF proposal was inspired by the 1998 Russian crisis in which the average EMBI+ suffered a major negative shock from which it did not recover until about five years later. Russia was at the epicentre. At the time, Russia represented less than 1% of world GDP, had little trade with the other EMEs and was not even a local financial centre. Hence, the
111 Calvo (2002, 2015). 112 Emerging Market Bond Index.

ECB Forum on Central Banking, June 2016 68
spread across all the EMEs included in EMBI+ appears as an accident that may have been attenuated, at least, by global lenders of last resort, which in this case decided to keep their distance. The conjecture gets some support from the Lehman crisis episode in which, as already pointed out, AE central banks successfully prevented massive financial sector bankruptcies by engineering an unprecedented relaxation of monetary policy. In spite of that, the EMBI+ shows a steep hike in response to Lehman Brothers’ bankruptcy but, in sharp contrast with the Russian episode, the index recovers within just one year!
One big hurdle that is likely to stand in the way of implementing the EMF is the sums involved. In a back-of-the-envelope calculation,113 I estimated that if the EMF were equivalent to 30% of external short-term debt of developing economies, the sum would have to be around USD 400 billion. This looks large relative to the IMF credit outstanding in July 2014, which amounts to around USD 130 billion. But it is a pittance compared with the growth of high-powered money to palliate the effects of the Lehman crisis recession in the United States (around USD 1.2 trillion during the Lehman recession interval as defined by the NBER114). Moreover, given the high historical return on EME liabilities, the initial sums could actually rise over time. Actually, existence of the EMF should make the latter more likely.
A natural candidate to administer the EMF is the Fund. At the very minimum, the EMF should give the IMF additional time to design other country-specific facilities by preventing major financial disarray, and improve the quality of its stabilization programs. One important reason for the latter is that financial disarray makes it exceedingly difficult to distinguish fundamental from liquidity-crunch provoked imbalances (e.g. fiscal deficit).
Needless to say, though, details will have to be worked out. I suspect that the proposal will not be easy to sell. However, I would encourage the Fund to keep exploring EMF alternatives. Incentives to reinforce EME financial resilience may actually rise over time, especially if AE output does not exhibit a much livelier trend, and EMEs become the new American Dream.
References
Calvo, G. (2002), “Globalization Hazard and Delayed Reform in Emerging Markets”, Economia, 2 (Spring), pp. 1-29. Reprinted in Calvo, G. (2006), Emerging Capital Markets in Turmoil: Bad Luck or Bad Policy?, Chapter 18, MIT Press, Cambridge, MA.
Calvo, G. (2015), “Towards an Emerging Market Fund”, in Bretton Woods: The Next 70 Years, published by the Reinventing Bretton Woods Committee.
Calvo, G. (2016), Macroeconomics in Times of Liquidity Crises: Searching for Economic Essentials, MIT Press, Cambridge, MA, forthcoming.
Gesell, S. (1916), The Natural Economic Order; reprinted by Isha Books, New Delhi, 2013.
113 Calvo (2015). 114 National Bureau of Economic Research.

ECB Forum on Central Banking, June 2016 69
Gorton, G. and Metrick, A. (2012), “Securitized Banking and the Run on Repo”, Journal of Financial Economics, 104, pp. 425-451.
Keynes, J.M. (1936), The General Theory of Employment, Interest and Money, reprinted by Macmillan & Co. Ltd, London, United Kingdom, 1961.
Sahay, R., Arora, V., Arvanities, T., Faruqee, H., N’Diaye, P., Mancini-Grifoli, T. and an IMF Team (2014), “Emerging Market Volatility: Lessons from the Taper Tantrum”, IMF Staff Discussion Note, SND/14/09.
Stiglitz, J. (2016), “What's Wrong with Negative Rates”, Project Syndicate, April.
Taylor, J.B. (2016), “Rethinking the International Monetary System”, Cato Journal, Vol. 36, No 2 (Spring/Summer), pp. 1-12.
Triffin, R. (1960), Gold and the Dollar Crisis, Yale University Press, New Haven, Connecticut.

ECB Forum on Central Banking, June 2016 70
Real interest rates, imbalances and the curse of regional safe asset providers at the Zero Lower Bound115 By Pierre-Olivier Gourinchas and Hélène Rey116
Abstract
The current environment is characterized by low real rates and by policy rates close to or at their lower bound in all major financial areas. We analyze these unusual economic conditions from a historical perspective and draw some implications for external imbalances, safe asset demand and the process of external adjustment. First, we decompose the fluctuations in the world consumption-to-wealth ratio over long periods of time and show that they anticipate movements of the real rate of interest. Second, our estimates suggest that the world real rate of interest is likely to remain low or negative for an extended period of time. In this context, we argue that there is a renewed Triffin dilemma where safe asset providers face a trade-off in terms of external exposure and real appreciation of their currency. This trade-off is particularly acute for smaller economies. This is the “curse of the regional safe asset provider”. We discuss how this “curse” is playing out for two prominent regional safe asset providers: core EMU and Switzerland.
1 Introduction
The current macroeconomic environment remains a serious source of worry for policymakers. Global real and nominal interest rates are at historical lows across advanced economies, both at the short and long end of the term structure. Policy rates are close to or at their effective lower bound in all major financial areas.117 Charts 1 and 2 report the nominal policy rates and long yields for the United States, the eurozone, the United Kingdom and Japan since 1980. Increasingly large amounts of wealth are invested at zero or negative yields.118
Yet economic activity in many parts of the advanced world remains quite anemic, or insufficiently vigorous to sustain a normalization of monetary policy, as evidenced by the repeated delays in the US Federal Reserve System’s “lift-off”. Charts 3 and 4 report the
115 Nick Sander and Maxime Sauzet provided outstanding research assistance. We thank our discussant, David
Vines, and furthermore Ricardo Caballero, Barry Eichengreen, Philipp Hartmann, Òscar Jordà, Ralph Koijen, Martin Lettau, Richard Portes, Ken Rogoff, Andrew Sheng, Alan Taylor, David Thesmar and Gabriel Zucman for comments. All errors remain our own. Special thanks to Òscar Jordà, Moritz Schularick and Alan Taylor for sharing their data with us. Contact email: [email protected]; [email protected]
116 University of California at Berkeley and London Business School. 117 This effective lower bound may well be negative. In this paper, and with a slight abuse of language, we refer
to the “effective” lower bound as the “Zero Lower Bound” (ZLB). It should be clear that there is no conceptual difference between a small positive and a small negative lower bound on policy rates.
118 According to Fitch Ratings (2016), the total amount of fixed-rate sovereign debt trading at negative yields reached $11.7 trillion at the end of June 2016.

ECB Forum on Central Banking, June 2016 71
output gap of advanced economies, as calculated in the IMF’s April 2016 World Economic Outlook database. While output gap calculations are always imprecise, the figures indicate that, with the exception of Germany and the United Kingdom, most advanced economies remain significantly below their potential level of output.119
Chart 2 Long yields for Germany, Japan, the United Kingdom and the United States (1980-2016)
(percentages)
Sources: United States: 10-year bond constant maturity rate; Germany: 10-year benchmark bond; United Kingdom: 10-year government bond yield; Japan: 10-year government bond yield. Note: Data from Global Financial Database.
That, despite the aggressive global monetary policy treatment administered, levels of economic activity remain so weak across the advanced world strongly suggests that the natural interest rate – i.e. the real interest rate at which the global economy would be able to reach its potential output – remains substantially below observed real interest rates. Far from being overly accommodating, current levels of monetary stimulus may well be insufficiently aggressive because of the Zero Lower Bound (ZLB) constraint on policy rates.120
Understanding whether natural rates are indeed low, for how much longer and the source of their decline has become a first-order macroeconomic question. In a celebrated speech given at the IMF in 2013, five years after the onset of the Global Financial Crisis, Summers (2015) ventured that we may have entered an age of “secular stagnation”, i.e. an era where output remains chronically below its potential, or equivalently real rates remain above their natural rate. Not coincidentally, the secular stagnation hypothesis was first voiced by Hansen (1939), ten years after the onset of the Great Depression.
119 Potential output data from other sources, such as AMECO or the OECD, are broadly consistent. 120 Most central banks also deployed non-conventional monetary policy, mostly in the form of asset purchases, or
forward guidance. While the evidence suggests these policies have contributed to stabilize the economy, they may not have been sufficient to raise the natural rate above actual rates.
-2
0
2
4
6
8
10
12
14
16
18
1980 1983 1986 1989 1992 1995 1998 2001 2004 2007 2010 2013 2016
financial crisis eurozone crisis
United StatesGermanyUnited Kingdom
Japan
Chart 1 Policy rates for the eurozone, Japan, the United States and the United Kingdom (1980-2016)
(percentages)
Sources: US Federal Funds Official Target Rate; eurozone: until December 1998, Germany’s Lombard rate; thereafter, ECB marginal rate of refinancing operations; United Kingdom: Bank of England base lending rate; Japan: Bank of Japan target call rate. Note: Data from Global Financial Database.
-2
0
2
4
6
8
10
12
14
16
18
1980 1983 1986 1989 1992 1995 1998 2001 2004 2007 2010 2013 2016
financial crisis eurozone crisis
United StateseurozoneUnited Kingdom.
Japan

ECB Forum on Central Banking, June 2016 72
Chart 4 Output gap for the eurozone, France, Germany, Italy and Spain (1990-2015)
(percentage of potential output)
Source: World Economic Outlook, April 2016. Note: The chart shows the persistent decline in the output gap following the global financial crisis and European sovereign debt crises.
This paper contributes to this debate along three dimensions. We start by asking whether global real interest rates are likely to remain low and why. Using a novel empirical approach to this question, we conclude that they will, for an extended period of time, and that global economic activity is likely to remain muted. We argue that, as in other historical periods, most notably in the 1930s, this is the likely outcome of an extended and ongoing process of deleveraging that creates a “scarcity of safe assets”.
Next, we consider the question of global imbalances. Previous studies have emphasized that the global imbalances of the 1990s and 2000s originated from a combination of low levels of financial development and rapid economic growth in emerging market economies.121 If we enter an era of secular low growth, does it follow that global imbalances should recede? We answer this question in the negative: as argued in Caballero et al. (2015) and also in Eggertsson et al. (2016), global imbalances “mutate” at the ZLB from a benign phenomenon to a malign one.122 At the ZLB, external surpluses propagate stagnation as countries attempt to grab a higher share of a depressed global aggregate demand via a more depreciated currency, increasing the potential for negative spillovers and the prospect of currency wars.
The last part of our analysis focuses on safe asset providers. We argue that safe asset providers must, in equilibrium, either be more exposed to global shocks with the incipient risk of large ex-post losses, or choose to let their currency appreciate with potentially adverse immediate real effects. Furthermore, we show that the terms of this trade-off worsen the smaller the safe asset provider is, a phenomenon we dub the “curse of the regional safe asset provider”. We document how this “curse” has played out for two 121 See Caballero et al. (2008), Mendoza et al. (2009), and Bernanke (2005). 122 Of course, there may be reasons linked to financial stability for which large imbalances might constitute a risk
even outside the ZLB.
-8
-6
-4
-2
0
2
4
6
8
1990 1993 1996 1999 2002 2005 2008 2011 2014
financial crisis eurozone crisis
eurozoneGermanyFranceItaly
Spain
Chart 3 Output gap for the eurozone, Japan, the United Kingdom and the United States (1990-2015)
(percentage of potential output)
Source: World Economic Outlook, April 2016. Note: The chart shows the persistent decline in the output gap following the global financial crisis and European sovereign debt crises.
-8
-6
-4
-2
0
2
4
1990 1993 1996 1999 2002 2005 2008 2011 2014
financial crisis eurozone crisis
United StateseurozoneUnited Kingdom
Japan

ECB Forum on Central Banking, June 2016 73
regional safe asset providers in recent years: Switzerland, and core members of the European Monetary Union (EMU), including Germany, but also the Netherlands, Belgium and France. Looping back to our initial global focus, we argue that the curse of these EMU safe asset providers contributes significantly to the headwinds faced by the global economy and to the current pattern of global imbalances. We conclude by outlining some potential solutions.
Our empirical exercise begins by analyzing the consumption-to-wealth ratio in four advanced economies: the United States, the United Kingdom, France and Germany, for which we have data going back to at least 1920.123 We show that, at any point in time over the last century, the aggregate consumption-to-wealth ratio contained a great deal of information about future short-term real rates. According to our empirical analysis, actual and natural real interest rates are likely to remain low for an extended period of time: our point estimates suggest that short-term real interest rates could remain between -2% and 0% until 2021, with natural rates likely to be even lower. Our findings provide a bleak assessment of the medium-run growth prospects in advanced economies, and how difficult the return to prosperity may be for most advanced economies: we may well be stuck at the ZLB for the foreseeable future.
Our approach requires minimal assumptions, likely to hold under very general circumstances. In effect, we extract the historical information encoded in households’ decisions to consume out of wealth. The consumption-to-wealth ratio tends to be abnormally low following periods of rapid increases in wealth, as is often the case during episodes of financial exuberance. In the aftermath of these booms, the return on wealth tends to be low or negative, and the consumption-to-wealth ratio reverts to equilibrium. Our empirical results indicate that this low return on wealth is traceable in large part to future low real risk-free rates.
We document two stark historical episodes where the consumption-to-wealth ratio was inordinately low. The first episode starts in 1929 with the onset of the Great Depression and lasts until the Second World War. This is when Alvin Hansen first wrote about secular stagnation. The second episode starts in 1997 and is still ongoing. It is during this period that Larry Summers revived the concept of secular stagnation.
What might cause a persistent decline in real interest rates? The literature emphasizes four candidate explanations (see Eichengreen (2015)): a slowdown in technological progress, demographic forces, a savings glut and a decline in investment, possibly due to a decline in its relative price. The first force is well understood: a slower rate of technological progress reduces the marginal product of capital. Demographic forces, especially a slowdown in fertility, or an increase in life expectancy, also have the potential to increase savings, depressing equilibrium rates of return. The “savings glut” explanation has multiple components. On the trend side, it originates from the combination of low levels of financial development in Emerging Market Economies and rapid economic growth relative to Advanced Economies (see Bernanke (2005) and Caballero et al. (2008)). Low short-term real interest rates can also result from an increased demand for “safe assets” 123 Our measure of consumption consists of households’ aggregate consumption expenditures. Our measure of
wealth consists of households’ financial assets minus financial liabilities, plus housing and agricultural land. It does not include human wealth (the present discounted value of present and future non-financial income).
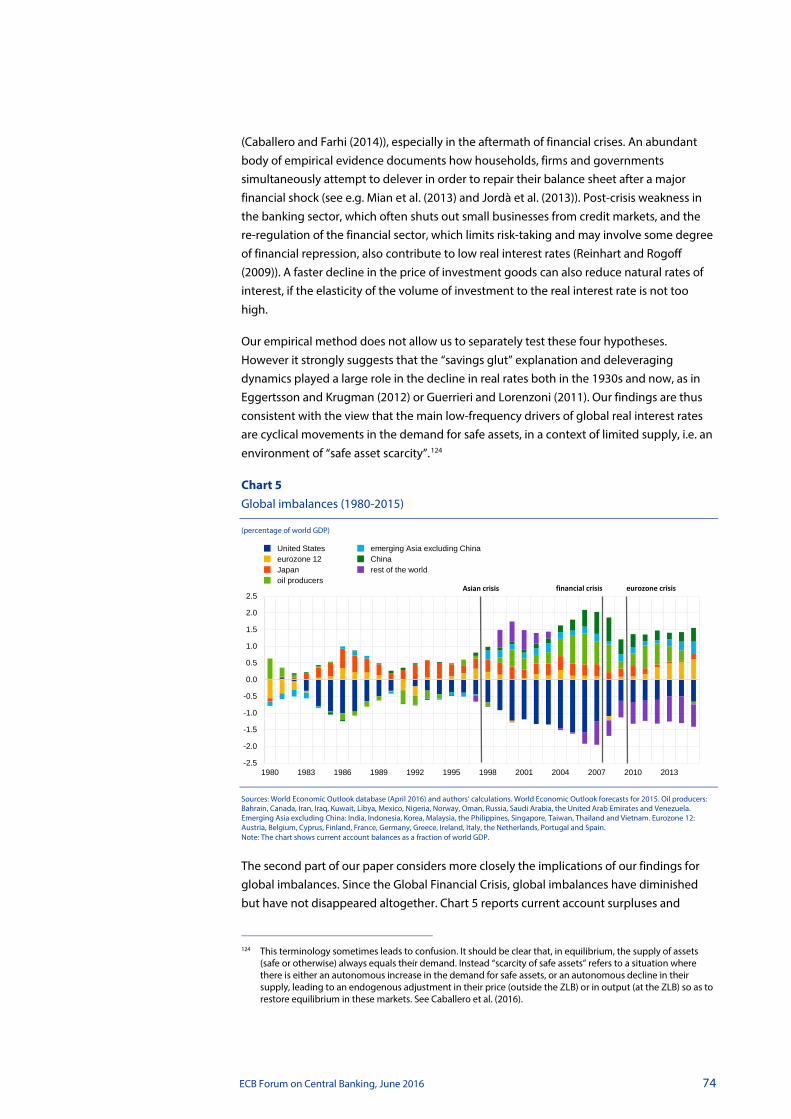
ECB Forum on Central Banking, June 2016 74
(Caballero and Farhi (2014)), especially in the aftermath of financial crises. An abundant body of empirical evidence documents how households, firms and governments simultaneously attempt to delever in order to repair their balance sheet after a major financial shock (see e.g. Mian et al. (2013) and Jordà et al. (2013)). Post-crisis weakness in the banking sector, which often shuts out small businesses from credit markets, and the re-regulation of the financial sector, which limits risk-taking and may involve some degree of financial repression, also contribute to low real interest rates (Reinhart and Rogoff (2009)). A faster decline in the price of investment goods can also reduce natural rates of interest, if the elasticity of the volume of investment to the real interest rate is not too high.
Our empirical method does not allow us to separately test these four hypotheses. However it strongly suggests that the “savings glut” explanation and deleveraging dynamics played a large role in the decline in real rates both in the 1930s and now, as in Eggertsson and Krugman (2012) or Guerrieri and Lorenzoni (2011). Our findings are thus consistent with the view that the main low-frequency drivers of global real interest rates are cyclical movements in the demand for safe assets, in a context of limited supply, i.e. an environment of “safe asset scarcity”.124
Chart 5 Global imbalances (1980-2015)
(percentage of world GDP)
Sources: World Economic Outlook database (April 2016) and authors’ calculations. World Economic Outlook forecasts for 2015. Oil producers: Bahrain, Canada, Iran, Iraq, Kuwait, Libya, Mexico, Nigeria, Norway, Oman, Russia, Saudi Arabia, the United Arab Emirates and Venezuela. Emerging Asia excluding China: India, Indonesia, Korea, Malaysia, the Philippines, Singapore, Taiwan, Thailand and Vietnam. Eurozone 12: Austria, Belgium, Cyprus, Finland, France, Germany, Greece, Ireland, Italy, the Netherlands, Portugal and Spain. Note: The chart shows current account balances as a fraction of world GDP.
The second part of our paper considers more closely the implications of our findings for global imbalances. Since the Global Financial Crisis, global imbalances have diminished but have not disappeared altogether. Chart 5 reports current account surpluses and
124 This terminology sometimes leads to confusion. It should be clear that, in equilibrium, the supply of assets
(safe or otherwise) always equals their demand. Instead “scarcity of safe assets” refers to a situation where there is either an autonomous increase in the demand for safe assets, or an autonomous decline in their supply, leading to an endogenous adjustment in their price (outside the ZLB) or in output (at the ZLB) so as to restore equilibrium in these markets. See Caballero et al. (2016).
-2.5
-2.0
-1.5
-1.0
-0.5
0.0
0.5
1.0
1.5
2.0
2.5
1980 1983 1986 1989 1992 1995 1998 2001 2004 2007 2010 2013
United Stateseurozone 12Japanoil producers
emerging Asia excluding ChinaChinarest of the world
Asian crisis financial crisis eurozone crisis

ECB Forum on Central Banking, June 2016 75
deficits for countries or regions, scaled by world output since 1980. While US current account deficits have decreased, they remain sizable, at -0.66% of world GDP in 2015, representing around a third of all current account deficits. On the funding side, two developments are noticeable. First, the surpluses of oil producers have disappeared. Second, the eurozone has become a major source of surpluses, with a current account surplus of 0.61% of world output in 2015. Chart 6 reports current account balances and surpluses for members of the eurozone since 1993, as a fraction of eurozone output.125
Chart 6 Eurozone imbalances (1993-2017)
(percentage of eurozone output)
Sources: World Economic Outlook database (April 2016) and authors’ calculations. World Economic Outlook forecasts for 2015-17. Eurozone 12: Austria, Belgium, Cyprus, Finland, France, Germany, Greece, Ireland, Italy, the Netherlands, Portugal and Spain. Note: The chart shows the current account balances of eurozone countries, relative to eurozone output.
It is quite startling to observe that, since 2014, all eurozone countries are running current account surpluses or have a balanced position, and are projected to do so in years to come.
In Caballero et al. (2015) and Caballero et al. (2016), one of us argued that current account imbalances mutate from “benign” to “malign” when the global economy hits the ZLB. Excess savings of surplus countries cannot be accommodated any longer by a decline in global real interest rates. Instead, they push the global economy into a liquidity trap that depresses economic activity. Surplus countries export their recession, at the expense of deficit countries. Moreover, Caballero et al. (2016) argues that exchange rates become indeterminate at the ZLB, yet play a key role in the adjustment process, by shifting relative demand for domestic and foreign goods. The analysis in that paper indicates a tight link between net foreign asset positions and exchange rates: countries or regions running current account surpluses have a more depreciated currency than under financial autarky, and correspondingly higher levels of activity, at the expense of foreign countries. A direct and immediate implication is that the exchange rate becomes a key variable to reallocate
125 In both charts, the eurozone consists of the 12 major members of EMU for which we have consistent data over
that period.
-3%
-2%
-1%
0%
1%
2%
3%
4%
5%
1993 1996 1999 2002 2005 2008 2011 2014 2017
GermanyIrelandGreecePortugalItalySpain
FranceNetherlandsOtherseurozone 12

ECB Forum on Central Banking, June 2016 76
depressed global demand across countries, raising the prospect of “currency wars”.126 This analysis suggests that a period of secular stagnation does not necessarily imply that global imbalances should recede. Instead, imbalances at the ZLB have a greater potential to destabilize the global economy.
Indeed, Chart 7 illustrates that significant exchange rate movements have accompanied most major central bank attempts to stimulate their economy since 2008. The chart reports the cumulated rate of appreciation (+) or depreciation (-) of the euro against the US dollar, the Japanese yen and the Swiss franc since January 2007. The chart illustrates the large recent gyrations in exchange rates, especially in the dollar/euro rate after the implementation of the Federal Reserve’s QE2 in October 2010 or the announcement of the European Central Bank’s public sector purchase program (PSPP) in January 2015; in the yen/euro rate following Abenomics in December 2013; or in the Swiss franc/euro rate after the Swiss National Bank decided to put a floor on the bilateral rate (September 2011) and to abandon it (January 2015). The chart also illustrates the significant depreciation of the euro against the three other currencies since 2014, consistent with the surge in the eurozone’s current account surpluses.
In this context we ask how the growing demand for safe assets shapes external portfolios. Gourinchas et al. (2014) explored the implications of being a world insurer for the United States’ external portfolio.
Chart 8 US net foreign asset position and cumulated current account (1952-2015)
(United States, Q1 1952-Q4 2015)
Sources: Bureau of Economic Analysis (BEA), Flow of Funds and author’s calculations. Note: The chart shows the US net foreign asset position as a fraction of US output and the counterfactual obtained by cumulating current account balances since the first quarter of 1952.
That paper argued that the structure of the United States’ external portfolio (gross assets and gross liabilities) reflects its capacity to provide safe assets. With integrated financial markets, asset prices and returns adjust so that, in equilibrium, the United States provides
126 See Eggertsson et al. (2016) for a similar argument.
-60%
-50%
-40%
-30%
-20%
-10%
0%
10%
20%
1952 1960 1968 1976 1984 1992 2000 2008 2016
net foreign assets/GDPcumulated CA/GDP
Chart 7 Global exchange rates (2007-16)
(percentage)
Source: Global Financial Database. The chart reports ln(E2007m1/E) where E denotes the foreign currency value in euro. Note: The chart shows the cumulated depreciation (+) or appreciation (-) of the dollar, the yen and the Swiss franc against the euro since January 2007.
-60
-50
-40
-30
-20
-10
0
10
20
30
2007 2008 2009 2010 2011 2012 2013 2014 2015 2016
Abenomics ECB QEQE2
dollar/euroyen/euroSwiss franc/euro
CHF floor
ECB Forum on Central Banking, June 2016 77
insurance to the rest of the world. This is reflected in the fact that (a) the United States holds a leveraged position long in risky assets and short in safe assets, relative to the rest of the world; (b) in normal times, the United States earns high returns on its gross assets relative to its gross liabilities (the “exorbitant privilege” of the United States); and (c) the United States experiences large capital losses in times of financial stresses (a phenomenon we called the “exorbitant duty”). This last point has been especially relevant in recent years. Chart 8 reports updated estimates of the US net foreign asset position since 1952. Between the fourth quarter of 2007 and the third quarter of 2015, the US external valuation losses represent $4.13 trillion, or a staggering 22.9% of 2015 US GDP.127 Three episodes account for the bulk of these adjustments: in the fourth quarter of 2008, following the collapse of Lehman Brothers; in the third quarter of 2011, during the eurozone crisis; and in the fourth quarter of 2014, when the dollar appreciated substantially against the yen and the euro. As a result, the bulk of the US cumulated valuation gains since 1952, which reached 35% of US GDP at their peak in 2007, have dissipated.
An important message of Gourinchas et al. (2014) is that the status of safe asset issuer inevitably comes with increased exposure to global shocks. In the current paper, we move away from the United States and consider instead what the implications of our analysis are for regional safe asset providers. As we argued in Gourinchas and Rey (2007a), net safe asset providers face a variant of the old “Triffin dilemma” (Triffin (1960)): faced with a surge in demand for their (safe) assets, regional safe asset providers must choose between increasing their external exposure or letting their currency appreciate. In the former case, the increased exposure can generate potentially large valuation losses in the event of a global crisis, as documented in the case of the United States. In the limit as the exposure grows, it could even threaten the fiscal capacity of the regional safe asset provider, or the loss absorbing capacity of its central bank, leading to run equilibria.128
Alternatively, a regional safe asset provider may choose to limit its exposure, i.e. the supply of its safe assets. The surge in demand then translates into an appreciation of the domestic currency which may adversely impact the real economy, especially the tradable sector. The smaller the regional safe asset provider is, the less palatable either of these alternatives is likely to be, a phenomenon we dub the “curse of the regional safe asset provider”.
In the light of these considerations, we revisit the recent experience of two European safe asset providers: Switzerland and core EMU, consisting of Germany, France, the Netherlands and Belgium. The case of Switzerland illustrates nicely the terms of the basic trade-off: after fixing its exchange rate against the euro in September 2011, the Swiss National Bank grew increasingly worried about its external exposure and the potential for future losses in the wake of the European Central Bank’s PSPP. In January 2015, in a
127 In the fourth quarter of 2007 the US net foreign asset position was $-1.28 trillion. By the third quarter of 2015,
it had reached $-9.03 trillion, a $7.74 trillion decline, $3.61 trillion of which represents cumulated current account deficits, and $4.13 trillion (22.9% of US GDP) valuation losses.
128 See Maggiori et al. (2016) and Amador et al. (forthcoming) for recent related analyses of the Triffin dilemma or the potential for “reverse speculative attacks”. See also He et al. (2015) for a discussion of the issue of the determination of the status of reserve assets in a world with competing stores of value.
ECB Forum on Central Banking, June 2016 78
surprise announcement, the Swiss National Bank chose to let the currency float, a move that was followed by a sharp appreciation of the Swiss currency (see Chart 7).
The case of core EMU is equally fascinating. In the run-up to the financial crisis, it acted as a safe asset provider, with an extra twist. As documented by Hale and Obstfeld (2016), core EMU countries invested in risky projects in peripheral eurozone members, but also intermediated foreign capital from outside the eurozone into these countries, thereby increasing further their exposure. Most of that increased exposure occurred via an expansion in core EMU banks’ balance sheets and leverage (Miranda-Agrippino and Rey (2015)) and cross-border loans instead of portfolio holdings. In the run-up to the eurozone crisis, core EMU banks borrowed globally and lent to peripheral eurozone countries, earning small but positive excess returns in the process. With a common currency, core EMU countries could not let their real exchange rate appreciate in response to a surge in the demand for safe assets, except via gradual domestic inflation. Instead, they have tended to absorb the increased exposure onto their national balance sheet.129
When the eurozone crisis materialized, as in the case of the United States and other safe asset providers, core EMU stood to realize substantial capital losses on its net external position, a combination of losses on its gross external assets and capital gains on its external liabilities. With an exposure structure similar to the United States, rough calculations indicate that the valuation losses could have reached a staggering 40% of output for Germany alone. Unlike the United States, however, where the valuation losses were immediately realized via changes in asset prices and currency price movements, resulting in the sharp decline in the US net foreign asset position documented in Chart 8, the protracted resolution process of the European sovereign debt crisis mitigated the losses of core EMU countries but profoundly hampered the economic recovery of the region. Without a eurozone debt resolution mechanism for banks or sovereigns, and with the fear that markets might turn on them, most peripheral eurozone members embarked on multiple rounds of private and public deleveraging. The result has been a massive shift from a current account balance in 2007 for the eurozone, to a current account surplus of 0.5% of world GDP in 2014, predicted to rise to 0.6% in 2015, as illustrated in Charts 5 and 6.130 If the eurozone had been a closed economy, the resulting deflationary forces may well have proved self-defeating, just like attempts to deflate one’s economy at the expense of one’s trading partners were ultimately self-defeating during the Great Depression under the Gold Exchange Standard. At the global ZLB, the shift towards external surpluses has lessened the burden of adjustment on the eurozone, at the expense of the rest of the world.
In summary, our analysis suggests that core EMU countries have not performed their role as regional safe asset providers. Unlike the United States, which saw its net foreign asset position deteriorate substantially during the crisis, as US Treasuries appreciated while external assets plummeted in value, core EMU economies have not absorbed the banking 129 Some of that increase in financial sector exposure may also reflect risk shifting and expectations of bailouts
using taxpayers’ money. This emphasizes the need for a very careful monitoring of financial fragilities and imbalances, especially for EMU safe asset providers.
130 Chart 6 demonstrates that the bulk of the increase in the eurozone current account surpluses does not come from core EMU. Core EMU current account surpluses increased modestly from 2.3% to 2.6% of the region’s output between 2007 and 2015. Over that period, the rest of the eurozone’s current account improved from -1.9% to 0.5%, representing 87% of the improvement in the eurozone’s current account.

ECB Forum on Central Banking, June 2016 79
losses that were on their balance sheet. Instead they have pushed back the losses onto the peripheral countries’ public sector balance sheet ex post, which has forced them to delever aggressively. This aggregate delevering, and the corresponding surge in saving, continues to have deleterious effects on the global economy. Given our finding that real interest rates will remain low for an extended period of time, we consider that it would be wise to steer away from policies that make us teeter on the edge of a global liquidity trap. Being a regional safe asset provider may prove to be a curse not only to core EMU, but to the eurozone at large, and to the global economy.
2 The dynamics of global real interest rates
As illustrated in Charts 1 and 2, both long and short rates have declined dramatically over the last 30 years. A growing literature has attempted to understand the source of this decline and concludes that the decline in global real rates is likely to be quite persistent.131 In this paper, we borrow from Gourinchas and Rey (2016) and propose a novel approach based on the low frequency movements in the global consumption-to-wealth ratio.
2.1 The global budget constraint: some elements of theory
To fix ideas, denote beginning-of-period world private wealth 𝑊𝑡 . 𝑊𝑡 consists of private financial wealth (assets minus liabilities) as well as private non-financial assets, such as housing, non-incorporated businesses, land etc.132 The accumulation equation for the global economy is:
𝑊𝑡+1 = 𝑅𝑡+1(𝑊𝑡 − 𝐶𝑡), (1)
where 𝐶𝑡 denotes world private consumption expenditures and 𝑅𝑡+1 is the gross return on wealth between 𝑡 and 𝑡 + 1. In this equation, all variables are in real terms so 𝑅𝑡+1 denotes the real return on total wealth. Equation (1) is simply an accounting identity: it has to hold exactly period by period. We add some structure on this equation by observing that, in most models, private agents aim to stabilize the ratio of their consumption to their wealth.133 If the average propensity to consume out of wealth is stationary, equation (1) can be log-linearized around the steady state consumption-to-wealth ratio 𝐶
𝑊= 1 − 𝜌𝑤,
131 Barro and Sala-i-Martin (1990) explores the converse question of why real interest rates were so high in the
1980s. More recently, Laubach and Williams (2003, 2015) and Pescatori and Turunen (2015) attempt to measure the (unobserved) natural rate. Following Wicksell, they define the natural rate as “the real short-term rate consistent with the economy operating at its full potential once transitory shocks to aggregate supply or demand have abated” (Laubach and Williams (2015), p. 2). Hamilton et al. (2015) adopts a similar definition but a different estimation method, relying on a bivariate error correction model for US and world interest rates.
132 In the following discussion, we ignore human wealth, i.e. the present value of current and future labor income. We focus on private consumption and wealth, as opposed to national consumption and wealth, which includes public consumption and net wealth. Our results are largely unchanged if we use either concept, except during wars where public consumption surges, while private consumption declines.
133 For instance, if consumption decisions are taken by an infinitely lived representative household with logarithmic period utility 𝑢(𝐶) = ln𝐶, then the consumption-to-wealth ratio is constant and equal to the discount rate of the representative agent.
ECB Forum on Central Banking, June 2016 80
where 𝜌𝑤 < 1.134 Denoting 𝛥 the difference operator, 𝛦𝑡 the expectation operator and 𝑟𝑡+1 = ln𝑅𝑡+1 the continuously compounded real return on wealth, and following some simple manipulations as in Campbell and Mankiw (1989), Lettau and Ludvigson (2001) and Gourinchas and Rey (2016), we can derive the following fundamental relationship:
𝑐𝑡 − 𝑤𝑡 ≅ 𝛦𝑡 ∑ 𝜌𝑤𝑠 𝑟𝑡+𝑠𝑓∞
𝑠=1 + 𝛦𝑡 ∑ 𝜌𝑤𝑠 𝑟𝑟𝑡+𝑠∞𝑠=1 − 𝛦𝑡 ∑ 𝜌𝑤𝑠 𝛥 ln𝐶𝑡+𝑠∞
𝑠=1 (2)
≡ 𝑐𝑤𝑡𝑟𝑓 + 𝑐𝑤𝑡
𝑟𝑟 + 𝑐𝑤𝑡𝑐,
where 𝑐𝑡 and 𝑤𝑡 denote respectively (log) real consumption (or real wealth) per capita, 𝑟𝑡𝑓
is the real short-term risk-free return and 𝑟𝑟𝑡 is the excess return.135 Equation (2) states that today’s aggregate consumption-to-wealth ratio (the left-hand side) is high if either (a) expected future rates of return on wealth are high so that the denominator of 𝐶/𝑊 is expected to increase or (b) expected future aggregate consumption growth is low, so the numerator of 𝐶/𝑊 is expected to decline.
It is important to emphasize that the assumptions needed to derive this relation are minimal: we started from the law of motion of private wealth, which is simply an accounting identity. In particular, it holds with or without investment or production – these are simply factors that affect the return on wealth. We then performed a log-linearization under mild stationarity condition.136
This simple equation conveys the message that today’s average propensity to consume out of wealth encodes information about expected future consumption growth 𝛦𝑡𝛥 ln𝐶𝑡+𝑠, expected future safe rates 𝛦𝑡𝑟𝑡+𝑠
𝑓 , or future risk premia 𝛦𝑡𝑟𝑟𝑡+𝑠. It also indicates how to construct the contributions of each component (𝑐𝑤𝑡
𝑟𝑓 , 𝑐𝑤𝑡𝑟𝑟 and 𝑐𝑤𝑡
𝑐) as the expected present discounted value of each variable.
Since it is well known that aggregate consumption is close to a random walk, so that its growth rate 𝛥 ln𝐶𝑡+𝑠 is largely unpredictable, and excess returns are also volatile and difficult to predict, we expect from equation (2) that the aggregate consumption-to-wealth ratio will provide us with significant information about the expected path of future real risk-free returns 𝑟𝑡+𝑠
𝑓 .
2.2 Interpretation
Equation (2) does not provide a causal decomposition: in general, the risk-free and risky returns as well as consumption growth are endogenous and interdependent. In Gourinchas and Rey (2016), we discuss how different shocks are likely to impact the various terms on the right-hand side of equation (2) and summarize this discussion here:
134 In steady state, 𝐶/𝑊 satisfies the following relation: 𝛤
𝑅= �1− 𝐶
𝑊� ≡ 𝜌𝑤, where 𝛤 denotes the steady state
growth rate of total wealth and 𝑅 the steady state gross return. 135 The return on wealth can always be decomposed as 𝑟 = 𝑟𝑓 + (𝑟 − 𝑟𝑓), the sum of the real risk-free rate 𝑟𝑓
and an excess return 𝑟 − 𝑟𝑓. We do not observe the excess return on wealth 𝑟 − 𝑟𝑓, so we proxy it with the excess equity return 𝑟𝑟, adjusted with a noise parameter which we estimate to maximize the empirical fit of equation (2). See Gourinchas and Rey (2016) for details.
136 We also impose a transversality condition that simply rules out paths where wealth grows without bounds in relation to consumption.
ECB Forum on Central Banking, June 2016 81
• Productivity shocks: Persistent negative productivity shocks decrease future aggregate consumption growth 𝛥 ln𝐶𝑡+𝑠, which pushes up 𝑐𝑡 − 𝑤𝑡 (direct effect). There is an indirect effect that goes in the opposite direction, since lower productivity growth tends to reduce equilibrium real interest rates, which pushes 𝑐𝑡 − 𝑤𝑡 down. The relative strength of the two effects depends on the intertemporal elasticity of substitution (IES). With a low IES, real rates respond more than consumption growth, hence the indirect effect is likely to dominate and 𝑐𝑡 − 𝑤𝑡 will decline. If instead the IES is high, consumption growth responds more than real rates, the direct effect dominates and 𝑐𝑡 − 𝑤𝑡 increases. More generally, we expect the return component 𝑐𝑤𝑡
𝑟𝑓and the consumption growth components 𝑐𝑤𝑡𝑐 to have
opposite signs if productivity shocks are a main source of fluctuations: low future interest rates would coincide with low per capita and total consumption growth.
• Demographics: A slowdown in population growth has a direct effect on the consumption-to-wealth ratio via the decline in total consumption growth 𝛥 ln𝐶𝑡+𝑠. This direct effect is the same as that of productivity and pushes up 𝑐𝑡 − 𝑤𝑡 . Population growth may also have an indirect effect on the consumption-to-wealth ratio via its effect on savings and global real returns. If the lower population growth induces higher saving rates among currently living generations, the real interest rate will decline and this will tend to push down 𝑐𝑡 − 𝑤𝑡 . Similarly, increases in life expectancy that reduce the ratio of workers to retirees may stimulate savings, as households need to provide for a longer retirement life, pushing down real rates and reducing 𝑐𝑡 − 𝑤𝑡 . Again, we expect opposite movements in the return and the consumption growth components: low future interest rates would coincide with low total consumption growth (but not per capita consumption growth).
• Deleveraging shock: A deleveraging shock can be interpreted as an increase in the saving propensity (see Eggertsson and Krugman (2012), and Guerrieri and Lorenzoni (2011)). There is ample evidence that saving propensities increase in the aftermath of financial crises, as households attempt to repair their balance sheets (see e.g. Mian et al. (2013)). In equilibrium this needs to be offset by a decline in the equilibrium real rate. The response of future total consumption depends on whether the economy operates outside the ZLB or not. Outside the ZLB, investment is likely to increase. While current consumption growth would be low initially, it would increase later as output increases. If the economy is at the ZLB, aggregate demand may remain depressed, which would keep investment low and consumption growth muted. Most of the impact of financial shocks is therefore likely to be reflected in the return component 𝑐𝑤𝑡
𝑟𝑓 .
• Demand for safe asset: A surge in the demand for safe assets should lead to a decline in the real risk-free rate, and an increase in the risk premium, i.e. expected excess returns. The first effect tends to reduce 𝑐𝑡 − 𝑤𝑡 , while the second increases it. The overall effect on consumption growth is unclear. We therefore expect to see the impact of an increase in the demand for safe assets in a decline of the return component 𝑐𝑤𝑡
𝑟𝑓and an opposite movement in the risk premium component.
We conclude that different primitive shocks have different effects on the various components on the right-hand side of equation (2), which we will exploit later to help us identify the relevant source of the variation in the data.
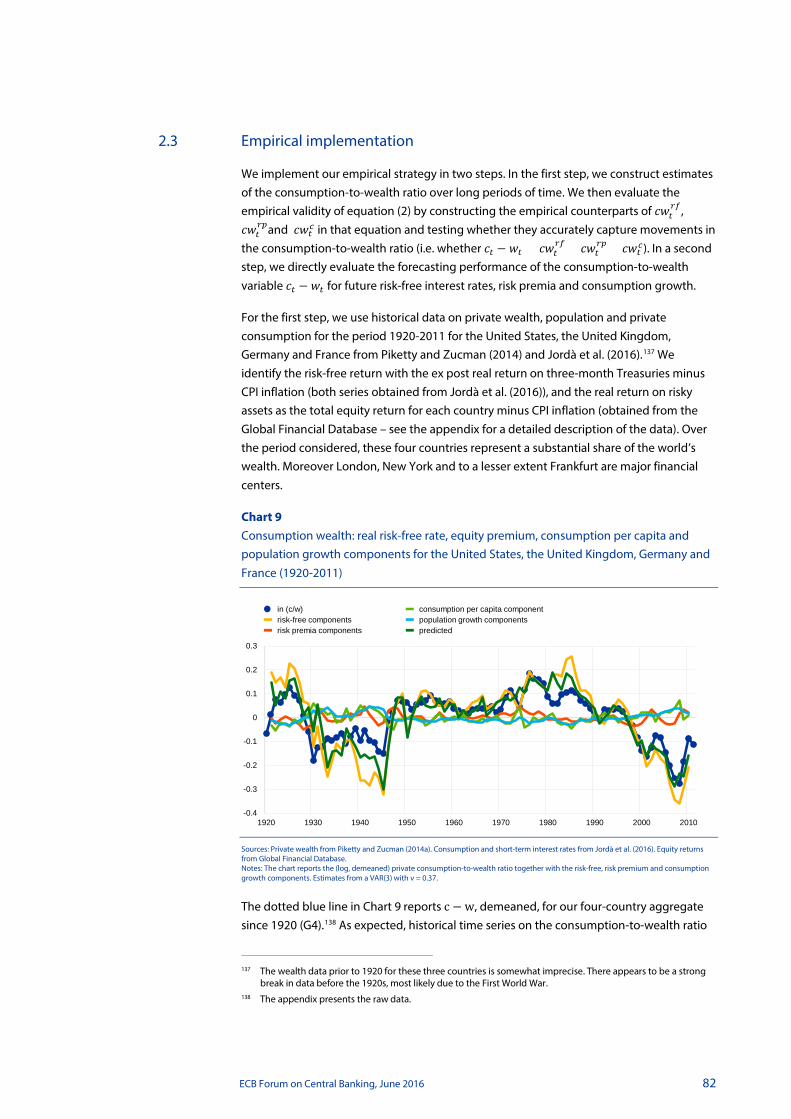
ECB Forum on Central Banking, June 2016 82
2.3 Empirical implementation
We implement our empirical strategy in two steps. In the first step, we construct estimates of the consumption-to-wealth ratio over long periods of time. We then evaluate the empirical validity of equation (2) by constructing the empirical counterparts of 𝑐𝑤𝑡
𝑟𝑓, 𝑐𝑤𝑡
𝑟𝑟and 𝑐𝑤𝑡𝑐 in that equation and testing whether they accurately capture movements in
the consumption-to-wealth ratio (i.e. whether 𝑐𝑡 − 𝑤𝑡 = 𝑐𝑤𝑡𝑟𝑓 + 𝑐𝑤𝑡
𝑟𝑟 + 𝑐𝑤𝑡𝑐). In a second
step, we directly evaluate the forecasting performance of the consumption-to-wealth variable 𝑐𝑡 − 𝑤𝑡 for future risk-free interest rates, risk premia and consumption growth.
For the first step, we use historical data on private wealth, population and private consumption for the period 1920-2011 for the United States, the United Kingdom, Germany and France from Piketty and Zucman (2014) and Jordà et al. (2016).137 We identify the risk-free return with the ex post real return on three-month Treasuries minus CPI inflation (both series obtained from Jordà et al. (2016)), and the real return on risky assets as the total equity return for each country minus CPI inflation (obtained from the Global Financial Database – see the appendix for a detailed description of the data). Over the period considered, these four countries represent a substantial share of the world’s wealth. Moreover London, New York and to a lesser extent Frankfurt are major financial centers.
Chart 9 Consumption wealth: real risk-free rate, equity premium, consumption per capita and population growth components for the United States, the United Kingdom, Germany and France (1920-2011)
Sources: Private wealth from Piketty and Zucman (2014a). Consumption and short-term interest rates from Jordà et al. (2016). Equity returns from Global Financial Database. Notes: The chart reports the (log, demeaned) private consumption-to-wealth ratio together with the risk-free, risk premium and consumption growth components. Estimates from a VAR(3) with v = 0.37.
The dotted blue line in Chart 9 reports c − w, demeaned, for our four-country aggregate since 1920 (G4).138 As expected, historical time series on the consumption-to-wealth ratio
137 The wealth data prior to 1920 for these three countries is somewhat imprecise. There appears to be a strong
break in data before the 1920s, most likely due to the First World War. 138 The appendix presents the raw data.
-0.4
-0.3
-0.2
-0.1
0
0.1
0.2
0.3
1920 1930 1940 1950 1960 1970 1980 1990 2000 2010
in (c/w)risk-free componentsrisk premia components
consumption per capita componentpopulation growth componentspredicted

ECB Forum on Central Banking, June 2016 83
show little long-run trends but significant serial correlation. These long swings in the consumption-to-wealth ratio justify the use of long time series.139
We identify two periods during which the consumption-to-wealth ratio was significantly depressed: the first one spans the 1930s, starting around the time of the Great Depression and ending at the beginning of the 1940s. Interestingly, it is in 1939 that Professor Alvin Hansen wrote his celebrated article about “secular stagnation” (Hansen (1939)). The second episode of low consumption-to-wealth ratio starts in the late 1990s with a pronounced downward peak in 2007 that is reversed during the financial crisis. As this paper is being written, the consumption-to-wealth ratio remains depressed for the G4 aggregate. Not coincidentally, in the fall of 2013 at a conference at the IMF, Larry Summers revived the idea of secular stagnation (Summers (2015)). From an accounting point of view, a low consumption-to-wealth ratio can follow periods of low consumption growth or periods of rapid wealth growth. In both cases (in 1928-29, then in 2007-08), the consumption-to-wealth ratio decreases dramatically right before a financial crisis, then rebounded during the crisis (1930 and 2009). This suggests that the movements in the consumption-to-wealth ratio are driven mostly by the dynamics of wealth during boom-bust episodes.
We estimate each of the components on the right-hand side of equation (2) using a reduced form vector autoregression (VAR).140
2.4 VAR results
Chart 9 shows the consumption-to-wealth ratio as well as the components of the right-hand side of equation (2) for the G4.141 We further decompose total consumption growth 𝛥 ln𝐶𝑡 into per capita consumption growth 𝛥𝑐𝑡 and population growth 𝛥𝑛𝑡 , and report separate components for the expected present value of future population growth (𝑐𝑤𝑛) and per capita consumption growth (𝑐𝑤𝑐𝑟).
The results are striking. First, we note that the fit of the VAR is very good.142 The grey line reports the predicted consumption-to-wealth ratio, i.e. the sum of the four components 𝑐𝑤𝑡
𝑟𝑓 + 𝑐𝑤𝑡𝑟𝑟 + 𝑐𝑤𝑡
𝑛 + 𝑐𝑤𝑡𝑐 . We find that our empirical model is able to reproduce quite
accurately the annual fluctuations in wealth over almost a century of data. This is quite striking since the right-hand side of equation (2) is constructed only from the reduced form forecasts implied by the VAR estimation. Second, most of the movements in the
139 Over shorter time periods, 𝑐𝑡 − 𝑤𝑡 may exhibit a marked trend. For instance, over the 1970-2011 period, we
observe a large decline in 𝑐𝑡 − 𝑤𝑡. 140 Note that our approach does not need to identify the various structural shocks driving the variables. Equation
(2) only requires that we construct present discounted forecasts of real rates, excess returns and consumption growth. We assume a discount rate 𝜌𝑤 = 0.96. Remember that 𝜌𝑤 = 1− 𝐶/𝑊� . This implies an average propensity to consume out of wealth of 4%. Our calculations also estimate a “noise” parameter for potential mismeasurement of the excess return on private wealth. We estimate this noise parameter by regressing 𝑐𝑡 − 𝑤𝑡 − 𝑐𝑤�𝑡
𝑟𝑓 − 𝑐𝑤𝑡𝑐� on our estimate of 𝛦𝑡 ∑ 𝜌𝑤𝑠 𝑟𝑟𝑡+𝑠∞
𝑠=1 . While this maximizes the overall fit of the decomposition, it does not affect the risk-free and consumption growth contributions. See Gourinchas and Rey (2016) for details.
141 We construct global risk-free rates and global equity excess returns using a wealth-weighted average of the corresponding rates for the United States and the United Kingdom. Substantial price instability in the 1920s in Germany and France prevent us from using these countries’ real returns.
142 The lags of the VAR are selected by standard criteria.

ECB Forum on Central Banking, June 2016 84
consumption-to-wealth ratio reflect expected movements in the future risk-free rate, i.e. the 𝑐𝑤𝑡
𝑟𝑓 component. By contrast, the risk premia 𝑐𝑤𝑡𝑟𝑟, population growth 𝑐𝑤𝑡
𝑛 and per capita consumption growth 𝑐𝑤𝑡
𝑐 components are often economically insignificant. It follows that the consumption-to-wealth ratio today contains significant information on future real risk-free rates, as encoded in equation (2). As discussed above, periods of low consumption-to-wealth ratios follow periods of rapid asset price increases. Our empirical results indicate that these are followed by extended periods of low (or negative) real risk-free interest rates. Moreover, we find only weak evidence for the view that productivity growth or demographic forces are key secular drivers of the real risk-free rates, since neither per capita consumption growth nor population growth seem to matter much. Bearing in mind that if productivity or population growth were the main drivers of the consumption-to-wealth ratio, we would expect to find a significant negatively correlated direct contribution of each of these (𝑐𝑤𝑐 and 𝑐𝑤𝑛) with the real interest rate contribution (𝑐𝑤𝑟𝑓). While we find a negatively correlated contribution, it is economically small – and also not very robust.143
Similarly, our estimates indicate that the consumption-to-wealth ratio contains little information about future equity risk premia. This is perhaps a more surprising result in the light of the findings by Lettau and Ludvigson (2001) that a cointegration relation between aggregate consumption, wealth and labor income predicts reasonably well US equity risk premia.144
Table 1 Unconditional variance decomposition of 𝑐𝑡 − 𝑤𝑡
percentage G4
1 𝛽𝑟𝑓 1.406
2 𝛽𝑟𝑟 0.025
3 𝛽𝑐 -0.336
of which:
4 𝛽𝑐𝑟 -0.168
5 𝛽𝑛 -0.168
6 Total 1.094
(Lines 1+2+3)
Notes: 𝛽𝑟𝑓 (or 𝛽𝑟𝑟 , and 𝛽𝑐) represents the share of the unconditional variance of 𝑐 − 𝑤 explained by future risk-free returns (or future risk premia and future total consumption growth); 𝛽𝑐𝑟 (𝛽𝑛) represents the share of the unconditional variance of 𝑐 − 𝑤 explained by per capita consumption growth (population growth). The sum of coefficients 𝛽𝑐𝑟 + 𝛽𝑛 is not exactly equal to 𝛽𝑐 due to numerical rounding in the VAR estimation. Sample: 1920-2011.
Table 1 decomposes the variance of 𝑐𝑡 − 𝑤𝑡 into components reflecting news about future real risk-free rates, future risk premia and future consumption growth. It is immediate that the bulk of the variation in 𝑐 − 𝑤 is accounted for by future movements in the real short-term risk-free rate. The fact that total consumption growth contributes
143 As discussed above, for the interest rate component to dominate, the productivity or population growth
terms would require a very low intertemporal elasticity. 144 A number of factors may account for our result. First and foremost, 𝑐𝑡 − 𝑤𝑡 is stationary in our sample, hence
we do not need to estimate a cointegrating vector with labor income. Second, we consider a longer sample period, going back to 1920. Thirdly, as argued above, our sample is dominated by two large financial crises and their aftermath, unlike in Lettau and Ludvigson (2001). Lastly, we view our analysis as picking up low frequency determinants of real risk-free rates while Lettau and Ludvigson (2001) seem to capture business cycle frequencies.
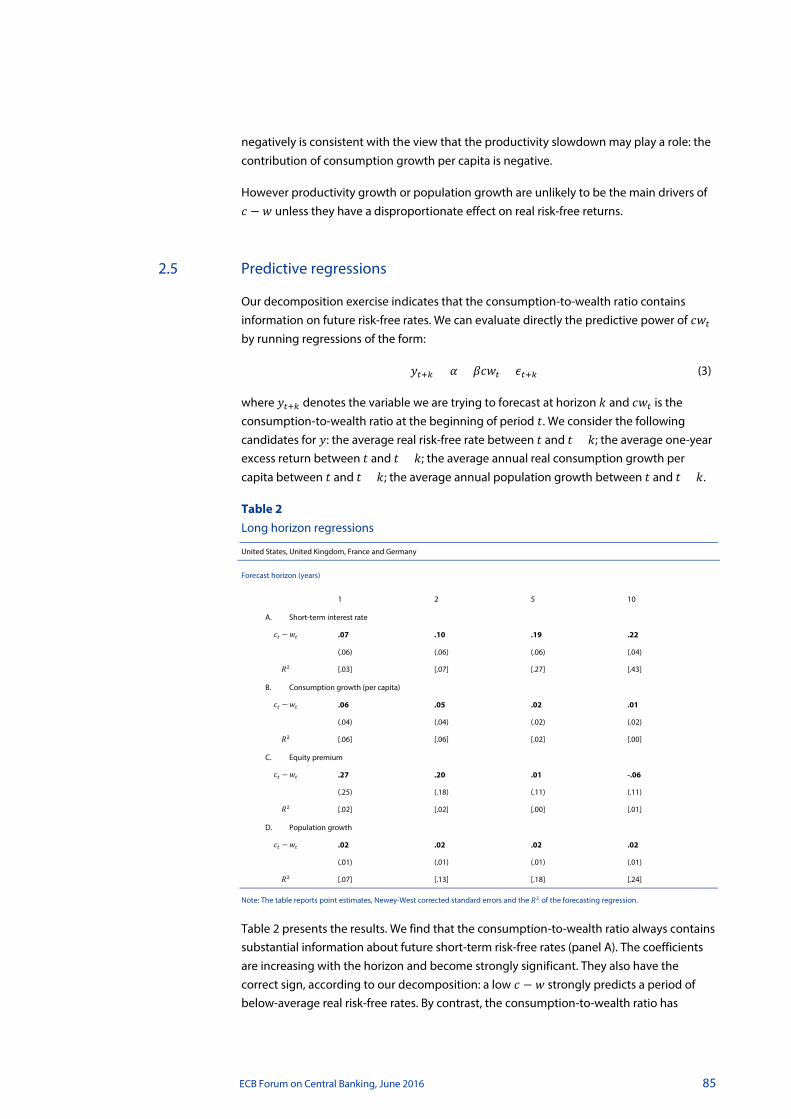
ECB Forum on Central Banking, June 2016 85
negatively is consistent with the view that the productivity slowdown may play a role: the contribution of consumption growth per capita is negative.
However productivity growth or population growth are unlikely to be the main drivers of 𝑐 − 𝑤 unless they have a disproportionate effect on real risk-free returns.
2.5 Predictive regressions
Our decomposition exercise indicates that the consumption-to-wealth ratio contains information on future risk-free rates. We can evaluate directly the predictive power of 𝑐𝑤𝑡 by running regressions of the form:
𝑦𝑡+𝑘 = 𝛼 + 𝛽𝑐𝑤𝑡 + 𝜖𝑡+𝑘 (3)
where 𝑦𝑡+𝑘 denotes the variable we are trying to forecast at horizon 𝑘 and 𝑐𝑤𝑡 is the consumption-to-wealth ratio at the beginning of period 𝑡. We consider the following candidates for 𝑦: the average real risk-free rate between 𝑡 and 𝑡 + 𝑘; the average one-year excess return between 𝑡 and 𝑡 + 𝑘; the average annual real consumption growth per capita between 𝑡 and 𝑡 + 𝑘; the average annual population growth between 𝑡 and 𝑡 + 𝑘.
Table 2 Long horizon regressions
United States, United Kingdom, France and Germany
Forecast horizon (years)
1 2 5 10
A. Short-term interest rate
𝑐𝑡 − 𝑤𝑡 .07 .10 .19 .22
(.06) (.06) (.06) (.04)
𝑅2 [.03] [.07] [.27] [.43]
B. Consumption growth (per capita)
𝑐𝑡 − 𝑤𝑡 .06 .05 .02 .01
(.04) (.04) (.02) (.02)
𝑅2 [.06] [.06] [.02] [.00]
C. Equity premium
𝑐𝑡 − 𝑤𝑡 .27 .20 .01 -.06
(.25) (.18) (.11) (.11)
𝑅2 [.02] [.02] [.00] [.01]
D. Population growth
𝑐𝑡 − 𝑤𝑡 .02 .02 .02 .02
(.01) (.01) (.01) (.01)
𝑅2 [.07] [.13] [.18] [.24]
Note: The table reports point estimates, Newey-West corrected standard errors and the 𝑅2 of the forecasting regression.
Table 2 presents the results. We find that the consumption-to-wealth ratio always contains substantial information about future short-term risk-free rates (panel A). The coefficients are increasing with the horizon and become strongly significant. They also have the correct sign, according to our decomposition: a low 𝑐 − 𝑤 strongly predicts a period of below-average real risk-free rates. By contrast, the consumption-to-wealth ratio has

ECB Forum on Central Banking, June 2016 86
almost no predictive power for the equity risk premium and very limited predictive power for per capita consumption growth.
The regressions indicate some predictive power for population growth: a low 𝑐 − 𝑤 predicts a low future population growth, which suggests that the indirect effect (via changes in real risk-free rates) dominates the direct effect, since the direct effect of a lower future population growth (and total consumption growth) would be to increase 𝑐 − 𝑤 according to equation (2).
Chart 10 reports our forecast of the risk-free rate using the G4 consumption-to-wealth ratio at 1, 2, 5 and 10 year horizon. For each year t , the graph reports 𝑟𝑡,𝑘
𝑓 = 1𝑘∑ 𝑟𝑡+𝑠
𝑓𝑘−1𝑠=0 , the
average of the one-year real risk-free rate between 𝑡 and 𝑡 + 𝑘 where 𝑘 is the forecasting horizon. The graph also reports the predicted value 𝑟𝑡,𝑘
𝑓� based on predictive regression (3). While the fit of the regression is quite poor at 1-year, it becomes quite striking at 10-year. Our point estimates indicate that short-term real risk-free rates are expected to remain around -2% for an extended period of time. The last forecasting point is 2011, indicating a forecast of -2% until 2021 (bottom right graph).

ECB Forum on Central Banking, June 2016 87
Chart 10 Predictive regressions: risk-free rate (1920-2010)
(percentage of GDP)
1 year ahead 2 years ahead
5 years ahead 10 years ahead
Notes: The chart reports forecasts at 1, 2, 5 and 10 years of the annualized global real risk-free rate from a regression on past ln(c/w). Each graph reports, for each time t; the average short real interest rate between t and t + k where k is the forecasting horizon, together with the forecast at time t, based on cwt.
2.6 Interpretation
Taken together, our results suggest that boom-bust financial cycles are a strong determinant of real short-term interest rates. Wealth increases rapidly during the boom, faster than consumption. Increased leverage, financial exuberance and risk appetite fuel asset prices, bringing down 𝑐 − 𝑤.
Two such historical episodes for the global economy are the roaring 1920s and the 2000s. In the subsequent bust, asset prices collapse, collateral constraints bind, and households, firms and governments attempt to simultaneously deleverage, as risk appetite wanes. The combined effect is an increase in saving that keeps future safe real interest rates low. An additional force may come from a weakened banking sector and financial re-regulation or repression that combines to further constrain lending activity to the real sector. Our estimates indicate that short-term real risk-free rates are expected to remain low or even
-0.15
-0.1
-0.05
0
0.05
0.1
0.15
0.2
1920 1930 1940 1950 1960 1970 1980 1990 2000 2010-0.15
-0.1
-0.05
0
0.05
0.1
0.15
0.2
1920 1930 1940 1950 1960 1970 1980 1990 2000 2010
-0.06
-0.04
-0.02
0
0.02
0.04
0.06
0.08
0.1
1920 1930 1940 1950 1960 1970 1980 1990 2000 2010-0.06
-0.04
-0.02
0
0.02
0.04
0.06
0.08
1920 1930 1940 1950 1960 1970 1980 1990 2000 2010
actualfitted
ECB Forum on Central Banking, June 2016 88
negative for an extended period of time. Since current rates are constrained by the ZLB, natural real interest rates might be even lower!
Our empirical results do not directly support the view that low real interest rates are the result of low expected future productivity – since we don’t find much predictive or explanatory power for future per capita consumption growth – or demographic forces. Instead, it points us towards the global financial cycle boom/bust cycle, both in the 1930s and now. Under this interpretation, it is the increase in desired savings and the move away from risky assets that drive real interest rate determination. Therefore, we view these empirical results very much in line with interpretations of recent events that emphasize the global financial cycle (Miranda-Agrippino and Rey (2015), Reinhart and Rogoff (2009)), as well as the scarcity of safe assets (Caballero and Farhi (2014)).
3 Imbalances and the curse of the regional safe asset providers
If the scarcity of safe assets can drive equilibrium real interest rates down – potentially into a global liquidity trap, with most advanced economies at the ZLB – their geographical distribution will determine the pattern of global imbalances. As described in Gourinchas et al. (2014), the country at the center of the international monetary system acts as the world insurer and global liquidity provider. As such, its external balance sheet is particularly remarkable, featuring large amounts of liquid gross external liabilities and large gross, mostly illiquid, external assets. It follows that the center country typically has a large long net position in risky assets and a large short net position in safe liabilities. As shown in Chart 11, US net exposure to risky assets amounts to about 10% of GDP in the fourth quarter of 2015 after having reached 37% of GDP in the fourth quarter of 2007, while US short net position in safe liabilities amounts to around 58% of GDP in the fourth quarter of 2015, having undergone a trend increase (in absolute value) since 1984.145
145 Net exposure to risky assets is defined as FDI assets + equity assets + loans and portfolio debt to emerging
markets and euro area periphery - (FDI liabilities + Equity liabilities). Net safe liability position is defined as net foreign asset position - net risky asset position. The net safe liability position consists therefore of loans and portfolio debt assets to advanced economies (except euro area periphery) + gold and reserves - portfolio and bank liabilities.

ECB Forum on Central Banking, June 2016 89
Chart 11 US net exposure to risky assets and net position in safe liabilities (Q1 1952-Q4 2015)
(percentage of US GDP)
Notes: Net exposure to risky assets is defined as (FDI assets + equity assets + loans and portfolio debt to emerging markets and euro area periphery) - (FDI liabilities + Equity liabilities). Net safe liability position is defined as net foreign asset position - net risky asset position (the net safe liability position consists therefore of loans and portfolio debt assets to advanced economies (except euro area periphery) + gold and reserves - portfolio and bank liabilities)). For portfolio debt we use the geographical breakdown of the Coordinated Portfolio Investment Survey (IMF). For bank loans and liabilities we use the US Treasury International Capital (TIC) data geographical distribution. We compute geographical shares from those two data sources and apply them to the international investment position (IIP) data.
This asymmetric composition of assets and liabilities explains largely the excess returns that the United States earns on its external position. But this exorbitant privilege (see Gourinchas and Rey (2007a)) comes with an exorbitant duty (Gourinchas et al. (2014)). In times of global stress, the value of the external assets of the United States – dominated by risky investment – plummets while the value of its liabilities remains stable or even appreciates. As the center country provides insurance to the rest of the world, its gross liabilities can be large relative to its own economic size. The properties of the external balance sheet of the center country therefore imply massive wealth transfers to the rest of the world in troubled times. Since at least the summer of 2007, financial markets have been in turmoil. The subprime crisis followed by the default, or near default, of several investment banks, insurance companies and nation states has driven volatility to levels not seen in the last two decades. Inspection of the data on the net foreign asset position of the United States during the period of the recent crisis is very revealing. As discussed earlier, Chart 8 reports updated estimates of the US net foreign asset position since 1952.
We observe three dramatic collapses of the US international asset positions as a fraction of GDP during the crisis: between the fourth quarter of 2007 and the first quarter of 2009 as the US investment banking world sank and the US net foreign asset position declined by about 24% of GDP; it initially bounced back but, between the first quarter of 2011 and the second quarter of 2012, it declined again by 20.5% of GDP as the eurozone crisis was unfolding; finally between the third quarter of 2013 and the third quarter of 2015 it decreased by another 19% of GDP as the dollar appreciated substantially against the yen and the euro, decreasing the dollar value of external assets. All in all, between the fourth quarter of 2007 and the third quarter of 2015, we estimate that US valuation losses represent $4.13 trillion, or a staggering 22.9% of 2015 US GDP.
-80%
-60%
-40%
-20%
0%
20%
40%
1952
1954
1956
1958
1960
1962
1964
1966
1968
1970
1972
1974
1976
1978
1980
1982
1984
1986
1988
1990
1992
1994
1996
1998
2000
2002
2004
2006
2008
2010
2012
2014
2016
net risky assets/GDPnet safe assets/GDP
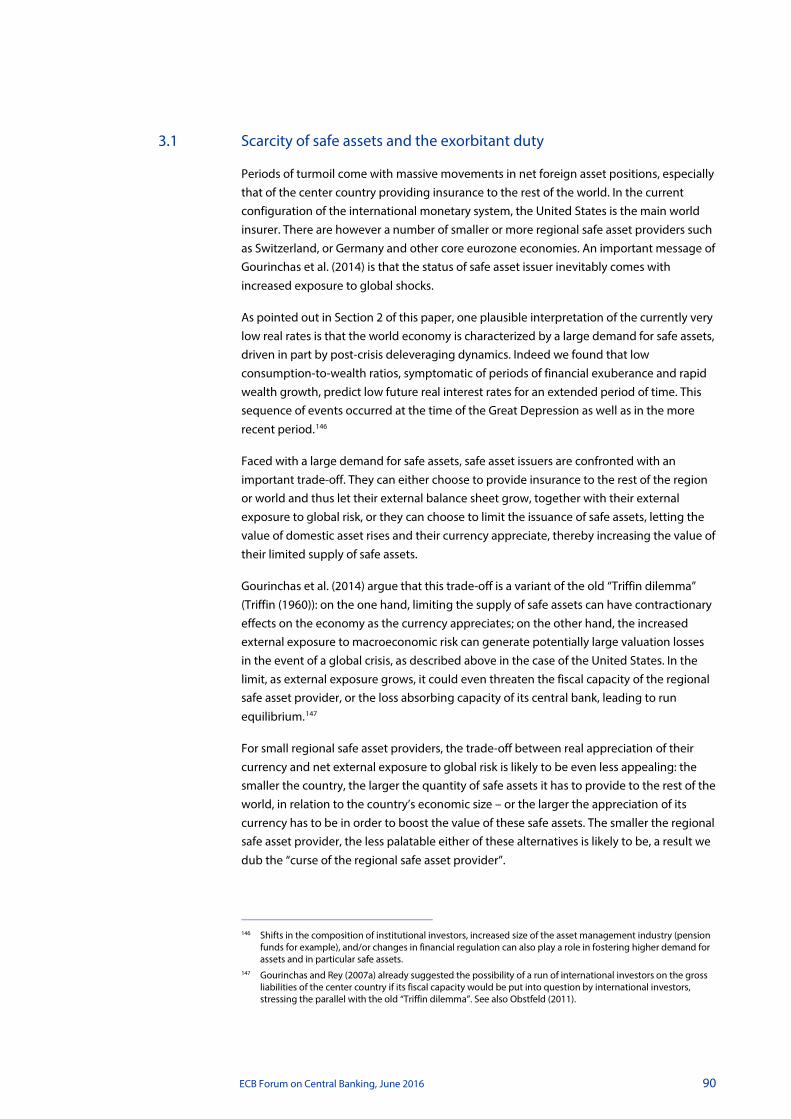
ECB Forum on Central Banking, June 2016 90
3.1 Scarcity of safe assets and the exorbitant duty
Periods of turmoil come with massive movements in net foreign asset positions, especially that of the center country providing insurance to the rest of the world. In the current configuration of the international monetary system, the United States is the main world insurer. There are however a number of smaller or more regional safe asset providers such as Switzerland, or Germany and other core eurozone economies. An important message of Gourinchas et al. (2014) is that the status of safe asset issuer inevitably comes with increased exposure to global shocks.
As pointed out in Section 2 of this paper, one plausible interpretation of the currently very low real rates is that the world economy is characterized by a large demand for safe assets, driven in part by post-crisis deleveraging dynamics. Indeed we found that low consumption-to-wealth ratios, symptomatic of periods of financial exuberance and rapid wealth growth, predict low future real interest rates for an extended period of time. This sequence of events occurred at the time of the Great Depression as well as in the more recent period.146
Faced with a large demand for safe assets, safe asset issuers are confronted with an important trade-off. They can either choose to provide insurance to the rest of the region or world and thus let their external balance sheet grow, together with their external exposure to global risk, or they can choose to limit the issuance of safe assets, letting the value of domestic asset rises and their currency appreciate, thereby increasing the value of their limited supply of safe assets.
Gourinchas et al. (2014) argue that this trade-off is a variant of the old “Triffin dilemma” (Triffin (1960)): on the one hand, limiting the supply of safe assets can have contractionary effects on the economy as the currency appreciates; on the other hand, the increased external exposure to macroeconomic risk can generate potentially large valuation losses in the event of a global crisis, as described above in the case of the United States. In the limit, as external exposure grows, it could even threaten the fiscal capacity of the regional safe asset provider, or the loss absorbing capacity of its central bank, leading to run equilibrium.147
For small regional safe asset providers, the trade-off between real appreciation of their currency and net external exposure to global risk is likely to be even less appealing: the smaller the country, the larger the quantity of safe assets it has to provide to the rest of the world, in relation to the country’s economic size – or the larger the appreciation of its currency has to be in order to boost the value of these safe assets. The smaller the regional safe asset provider, the less palatable either of these alternatives is likely to be, a result we dub the “curse of the regional safe asset provider”.
146 Shifts in the composition of institutional investors, increased size of the asset management industry (pension
funds for example), and/or changes in financial regulation can also play a role in fostering higher demand for assets and in particular safe assets.
147 Gourinchas and Rey (2007a) already suggested the possibility of a run of international investors on the gross liabilities of the center country if its fiscal capacity would be put into question by international investors, stressing the parallel with the old “Triffin dilemma”. See also Obstfeld (2011).

ECB Forum on Central Banking, June 2016 91
Chart 12 illustrates the argument.148 The solid lines (blue) represent the trade-off curves between net exposure to global risks (in units of domestic output) and the appreciation of the domestic currency, for a large and a small safe asset provider. The curse of the regional safe asset provider is simply illustrated by the fact that the trade-off curve for the smaller country lies above that for the larger one: the former faces a larger exposure (relative to its own size) and/or a larger appreciation.149 The dashed (red) lines represent illustrative indifference curves: they capture the notion that countries prefer both less net exposure and less appreciated currencies: utility increases as we move towards the lower left part of the chart. Each country chooses a different optimal point at the tangency between the indifference curve and its size-specific trade-off curve: point 𝐴 for the larger country and point 𝐵 for the smaller one. As is clear from the chart, depending on the shape of these indifference curves, countries may pick different “habitats” on the trade-off curve. For instance, as we have drawn the chart, the smaller country prefers less exposure and more appreciation, relative to the larger country.150
Chart 12 The curse of the regional safe asset provider
Notes: The solid (blue) lines report the trade-off between net exposure (relative to own output) on the vertical axis and the appreciation of the domestic currency on the horizontal axis. The dashed (red) lines report illustrative indifference curves when countries prefer less external exposure and a less appreciated currency. Point A corresponds to the optimal choice of exposure and currency appreciation for a large safe asset provider. Point B is the corresponding point for a small safe asset provider. A small safe asset provider under fixed exchange rates would end up at point C instead.
There are good reasons to believe that larger economies will be content with supplying the safe asset elastically and absorb the (comparatively smaller) exposure, while smaller
148 This discussion builds on Gourinchas et al. (2014). 149 A simple example illustrates the point starkly. Suppose the global net demand for safe assets is inelastic and
equal to 𝑆; for the country supplying the safe asset, it follows that 𝑆 = 𝐸.𝑑.𝑌, where 𝑑 is the net exposure, i.e. the ratio of the domestic value of safe assets held abroad to domestic output 𝑌, and 𝐸 is the value of the safe asset currency, with an increase reflecting an appreciation. This defines a trade-off curve 𝑑.𝐸 = 𝑆
𝑌 that is
higher for smaller economies (lower 𝑌). 150 This is only a relative statement. Since the smaller country faces a worse trade-off, point 𝐵 features a more
appreciated currency and more exposure compared with point 𝐴. But the relative share of the adjustment changes towards more exchange rate flexibility.

ECB Forum on Central Banking, June 2016 92
countries may prefer to let their real exchange rate appreciate more, in order to avoid excessively high levels of external exposure. Smaller countries may be particularly unwilling to let their external exposure grow too much if this would threaten their solvency in case of a bad enough shock. This could in turn potentially endanger their status as safe haven. In the realistic case where small countries are competing with other safe asset providers (including potentially large ones), they could easily lose their share of the exorbitant privilege to their competitors by excessively expanding their exposure. Strategic complementarities between investors could even open the door to run equilibria, to which smaller safe asset providers might be more vulnerable.151 What this suggests is that there are some potentially non-linear responses once exposure levels become too elevated. Smaller safe asset providers are more likely to reach these levels if they attempt to prevent an appreciation of their currency.
A small safe asset provider may therefore subject itself to a “value-at-risk constraint”, to avoid excessively risky exposure levels, and prefer to let its currency appreciate.152
According to this analysis, a small economy such as Switzerland (point 𝐵) will tolerate a more appreciated currency than would the United States (point 𝐴). If instead the small economy attempted to fix the value of its currency, it would face very elevated exposure levels (point 𝐶). Such high levels of exposure may eventually threaten the solvency of the country. For a small asset provider, this discussion suggests that it seems optimal to retain some flexibility in the real exchange rate.
3.2 European safe asset providers
3.2.1 Switzerland
In the light of these considerations, we revisit the recent experience of two European safe asset providers: Switzerland and core EMU, which we will interpret here to mean Germany. The case of Switzerland illustrates nicely the terms of the basic trade-off: after fixing its exchange rate against the euro in September 2011, the Swiss National Bank grew increasingly worried about its external exposure. The decline in the Swiss net external position between the second quarter of 2011 and the first quarter of 2015 was very large: it went from 123% of GDP to 84% of GDP, with a peak of 143% in the third quarter of 2012. In January 2015, in a surprise announcement, the central bank chose to let its currency float, a move that was followed by a sharp appreciation of the Swiss currency (see Chart 7). In Chart 13, we show the rapid growth of official reserves and of the external risky assets of Switzerland (in particular foreign direct investment – FDI) after the beginning of the global financial crisis. At end 2015, FDI and equity external assets amount to about three times the size of Swiss GDP. On the liability side, banking deposits account for the lion’s share of the Swiss external position as evidenced in Chart 14.
151 See Calvo (2013) for related arguments. 152 Large safe asset providers may limit their issuance for a different reason, namely to manipulate their terms of
trade. See Kindleberger (2013) for a discussion of the role of the “benevolent hegemon” in that context.

ECB Forum on Central Banking, June 2016 93
Chart 14 Swiss gross external liabilities (Q1 2000-Q4 2015)
(percentage of GDP)
Notes: The chart reports the gross external liability position of Switzerland. FDI: foreign direct investment; O: bank loan and trade credit; D: portfolio debt; EQ: portfolio equity.
External debt liabilities are very small due to the lack of depth in the Swiss debt market, so that Swiss safe assets are effectively bank deposits. Gross bank deposits and trade credit (the “other liability” category of the balance of payment) reached almost 200% of Swiss GDP by end 2015. This is despite the fact that the Swiss franc was allowed to appreciate substantially, suggesting that the increased exposure would have been even higher had the peg not been abandoned. Chart 15 shows the net exposure of Switzerland to risky assets and the net position in safe liabilities. Both are decreasing in absolute value in recent years though next exposure is still high (about 100% of GDP in net risky assets even if the net safe position is zero) in the fourth quarter of 2015. This decline in net exposure is to some extent misleading however. The reason is that, unlike for the United States, the foreign exchange reserves of Switzerland are very sizable. We included them in the safe assets (hence they decrease the net risky position and increase the net safe position of Switzerland). But because of their currency composition, they carry significant exchange rate risk (in the second quarter of 2016, for example, the Swiss National Bank’s portfolio investments in foreign currency bonds were dominated by euro investments (41%) and dollar ones (32%)).153 Since total reserves grew from 39% to 88% of GDP during the period from the second quarter of 2011 to the first quarter of 2015, taking the associated risk into account would increase very sizably the net risky exposure of Switzerland and decrease its net safe liability position in recent years.
153 Source available here.
0%
100%
200%
300%
400%
500%
600%
700%
2000 2003 2006 2009 2012 2015
FDIL/GDPEQL/GDP
DL/GDPOL/GDP
Chart 13 Swiss gross external assets (Q1 2000-Q4 2015)
(percentage of GDP)
Notes: The chart reports the gross external asset position of Switzerland. RES: reserves; FDI: foreign direct investment; O: bank loan and trade credit; D: portfolio debt; EQ: portfolio equity.
0%
100%
200%
300%
400%
500%
600%
700%
800%
2000 2003 2006 2009 2012 2015
RESA/GDPFDIA/GDPEQA/GDP
DA/GDPOA/GDP

ECB Forum on Central Banking, June 2016 94
Chart 15 Swiss net exposure to risky assets and net position in safe liabilities (Q1 2000-Q4 2015)
(percentage of Swiss GDP)
Notes: Net exposure to risky assets is defined as (FDI assets + equity assets + loans and portfolio debt to emerging markets and euro area periphery) - (FDI liabilities + equity liabilities). Net safe liability position is defined as net foreign asset position - net risky asset position (the net safe liability position consists therefore of loans and portfolio debt assets to advanced economies (except euro area periphery) + gold and reserves - portfolio and bank liabilities)). For portfolio debt we use the geographical breakdown of the Coordinated Portfolio Investment Survey (IMF). For bank loans and liabilities we use the Locational Banking Statistics (BIS) geographical distribution. We compute geographical shares from those two data sources and apply them to the IIP data.
3.2.2 Core EMU
The case of core EMU is equally fascinating. In the run-up to the financial crisis, it acted as a safe asset provider, with an extra twist. As documented by Hale and Obstfeld (2016), Germany, alongside other core eurozone countries such as France, Belgium and the Netherlands, invested in risky projects in peripheral eurozone members, but also intermediated foreign capital into these countries, thereby increasing further their exposure. Most of that increased exposure occurred via an expansion in core EMU banks’ balance sheets and leverage (Miranda-Agrippino and Rey (2015)) and cross-border loans instead of portfolio holdings. In short, core EMU banks borrowed globally and lent to peripheral eurozone countries, earning small but positive excess returns in the process. Importantly, because core EMU shares a common currency with the rest of the eurozone, it cannot let its currency appreciate in response to a surge in demand for safe assets. Instead, it has to absorb the increased exposure onto its national balance sheet. We illustrate how this trade-off has played out by considering in detail the external balance sheet of Germany.154
As can be seen from Chart 16, on the liability side the German external balance sheet has the definite characteristics of a safe asset provider with a very large share of its gross liabilities being either debt or bank liabilities (153% of GDP at end 2015). Over the period 1960-2015Q4, the share of safe liabilities in total liabilities is always above 60% and is sometimes above 80%. Portfolio equity and FDI account for a small share of liabilities.
154 Similar trade-offs are present for other core EMU members. However, Germany plays a prominent role in that
group.
-2.0
-1.5
-1.0
-0.5
0.0
0.5
1.0
1.5
2.0
2.5
3.0
2001 2002 2003 2004 2005 2006 2007 2008 2009 2010 2011 2012 2013 2014 2015
net risky assets/GDPnet safe assets/GDP

ECB Forum on Central Banking, June 2016 95
Interestingly, the amount of safe assets held by foreigners has increased sizably with the euro area crisis in 2010. What is remarkable however is that on the asset side the portfolio is very symmetric in terms of asset classes, with the share of FDI and equity hovering around 20% and 30% of total assets in recent years (Chart 17). A very large proportion of German external assets are fixed income securities or bank loans. This is different from the United States, which is invested heavily in FDI and portfolio equity and exhibits a very asymmetric balance sheet structure in terms of asset classes. The riskiness of the bank loans and deposits may be very different on the two sides of the German balance sheet however. Indeed, German banks have extended large amounts of credit to the euro periphery. At end 2003, the consolidated claims of German banks on the euro area as a whole were about 92% of German GDP. At their peak in July 2007, they amounted to an impressive 125% of GDP while the first warning shots of the global financial crisis were becoming more obvious.
Chart 17 German gross external asset position (Q1 1949-Q4 2015)
(percentage of GDP)
Notes: The chart reports the gross external asset position of Germany disaggregated by asset classes. FDI: foreign direct investment; O: bank loan and trade credit; D: portfolio debt; EQ: portfolio equity.
In Chart 18 we look at the geographical composition of consolidated external claims of German monetary financial institutions (MFIs).155 The share of German banks’ claims on the euro area in total claims climbed by about 10 points (from 33% to 42%) between July 2007 and September 2009. The share of claims on the euro area periphery had been in constant rise from 2002 right up to 2009 while the share of claims on core euro area countries, after dipping in 2005 and decreasing till 2007, resumed its growth from 2007 onwards. The years 2009-10 constitute turning points, with German banks decreasing massively their exposures to the periphery.
155 We looked both at consolidated data and non-consolidated data. Non-consolidated data are consistent with
the external investment position data, which use balance of payment (residency) definitions but do not cover the full exposure of Germany (based on a concept of ownership). A graph using non-consolidated data (data available since 1994) looks very similar, however, as far as the movements in shares are concerned. Expected levels of exposures of German banks to the euro area as a percentage of GDP are higher in the consolidated data nevertheless.
0%
50%
100%
150%
200%
250%
300%
1949
1952
1955
1958
1961
1964
1967
1970
1973
1976
1979
1982
1985
1988
1991
1994
1997
2000
2003
2006
2009
2012
2015
RESA/GDPFDIA/GDPEQA/GDP
DA/GDPOA/GDP
Chart 16 German gross external liability position (Q1 1949-Q4 2015)
(percentage of GDP)
Notes: The chart reports the gross external liability position of Germany disaggregated by asset classes. FDI: foreign direct investment; O: bank loan and trade credit; D: portfolio debt; EQ: portfolio equity.
0%
50%
100%
150%
200%
250%
300%
1949
1952
1955
1958
1961
1964
1967
1970
1973
1976
1979
1982
1985
1988
1991
1994
1997
2000
2003
2006
2009
2012
2015
FDIL/GDPEQL/GDP
DL/GDPOL/GDP
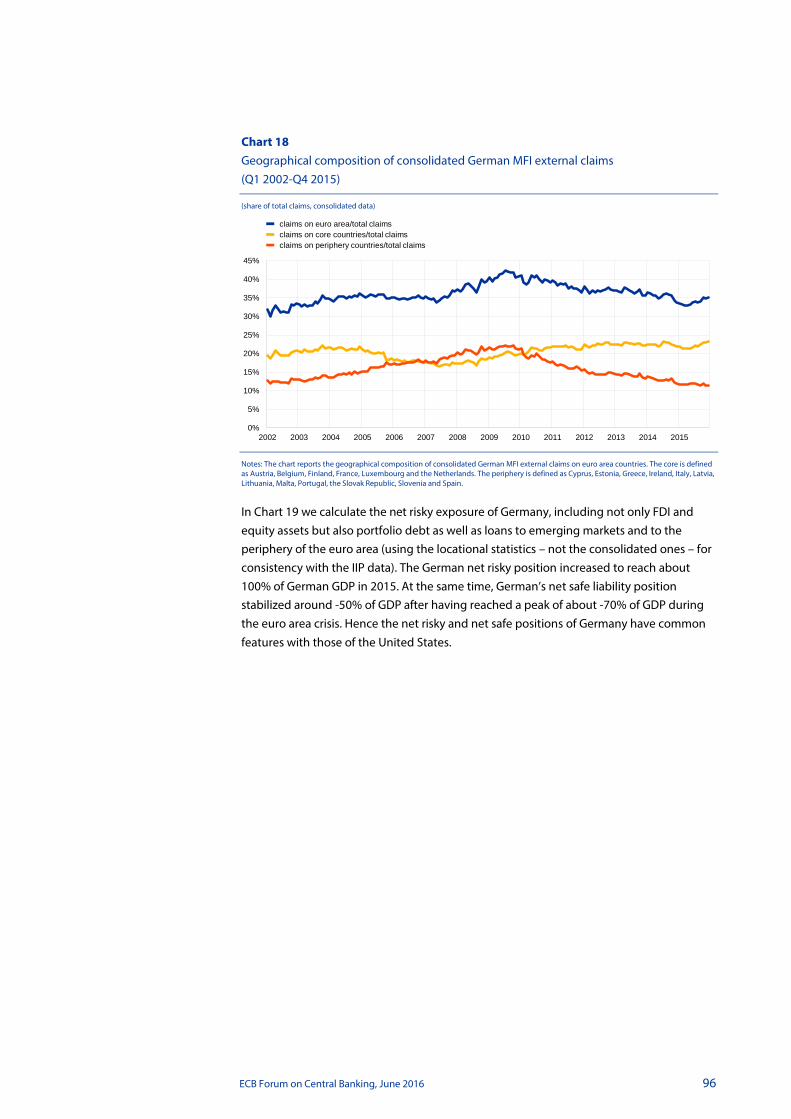
ECB Forum on Central Banking, June 2016 96
Chart 18 Geographical composition of consolidated German MFI external claims (Q1 2002-Q4 2015)
(share of total claims, consolidated data)
Notes: The chart reports the geographical composition of consolidated German MFI external claims on euro area countries. The core is defined as Austria, Belgium, Finland, France, Luxembourg and the Netherlands. The periphery is defined as Cyprus, Estonia, Greece, Ireland, Italy, Latvia, Lithuania, Malta, Portugal, the Slovak Republic, Slovenia and Spain.
In Chart 19 we calculate the net risky exposure of Germany, including not only FDI and equity assets but also portfolio debt as well as loans to emerging markets and to the periphery of the euro area (using the locational statistics – not the consolidated ones – for consistency with the IIP data). The German net risky position increased to reach about 100% of German GDP in 2015. At the same time, German’s net safe liability position stabilized around -50% of GDP after having reached a peak of about -70% of GDP during the euro area crisis. Hence the net risky and net safe positions of Germany have common features with those of the United States.
0%
5%
10%
15%
20%
25%
30%
35%
40%
45%
2002 2003 2004 2005 2006 2007 2008 2009 2010 2011 2012 2013 2014 2015
claims on euro area/total claimsclaims on core countries/total claimsclaims on periphery countries/total claims
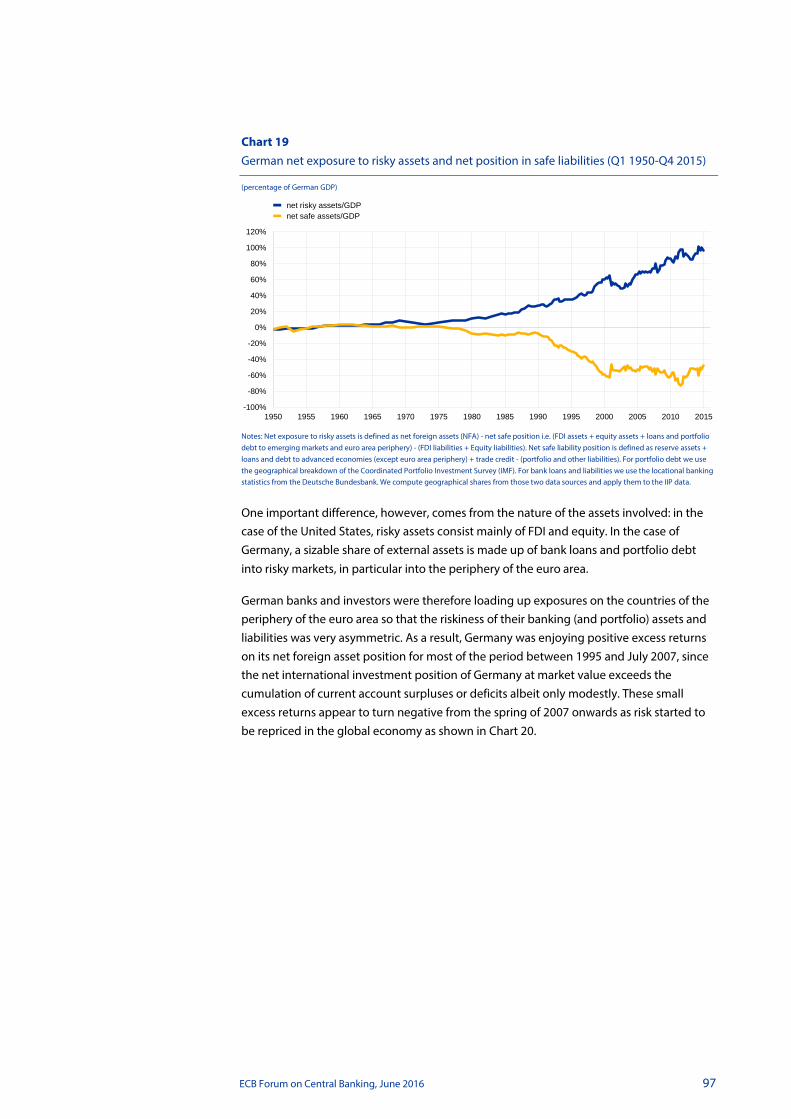
ECB Forum on Central Banking, June 2016 97
Chart 19 German net exposure to risky assets and net position in safe liabilities (Q1 1950-Q4 2015)
(percentage of German GDP)
Notes: Net exposure to risky assets is defined as net foreign assets (NFA) - net safe position i.e. (FDI assets + equity assets + loans and portfolio debt to emerging markets and euro area periphery) - (FDI liabilities + Equity liabilities). Net safe liability position is defined as reserve assets + loans and debt to advanced economies (except euro area periphery) + trade credit - (portfolio and other liabilities). For portfolio debt we use the geographical breakdown of the Coordinated Portfolio Investment Survey (IMF). For bank loans and liabilities we use the locational banking statistics from the Deutsche Bundesbank. We compute geographical shares from those two data sources and apply them to the IIP data.
One important difference, however, comes from the nature of the assets involved: in the case of the United States, risky assets consist mainly of FDI and equity. In the case of Germany, a sizable share of external assets is made up of bank loans and portfolio debt into risky markets, in particular into the periphery of the euro area.
German banks and investors were therefore loading up exposures on the countries of the periphery of the euro area so that the riskiness of their banking (and portfolio) assets and liabilities was very asymmetric. As a result, Germany was enjoying positive excess returns on its net foreign asset position for most of the period between 1995 and July 2007, since the net international investment position of Germany at market value exceeds the cumulation of current account surpluses or deficits albeit only modestly. These small excess returns appear to turn negative from the spring of 2007 onwards as risk started to be repriced in the global economy as shown in Chart 20.
-100%
-80%
-60%
-40%
-20%
0%
20%
40%
60%
80%
100%
120%
1950 1955 1960 1965 1970 1975 1980 1985 1990 1995 2000 2005 2010 2015
net risky assets/GDPnet safe assets/GDP
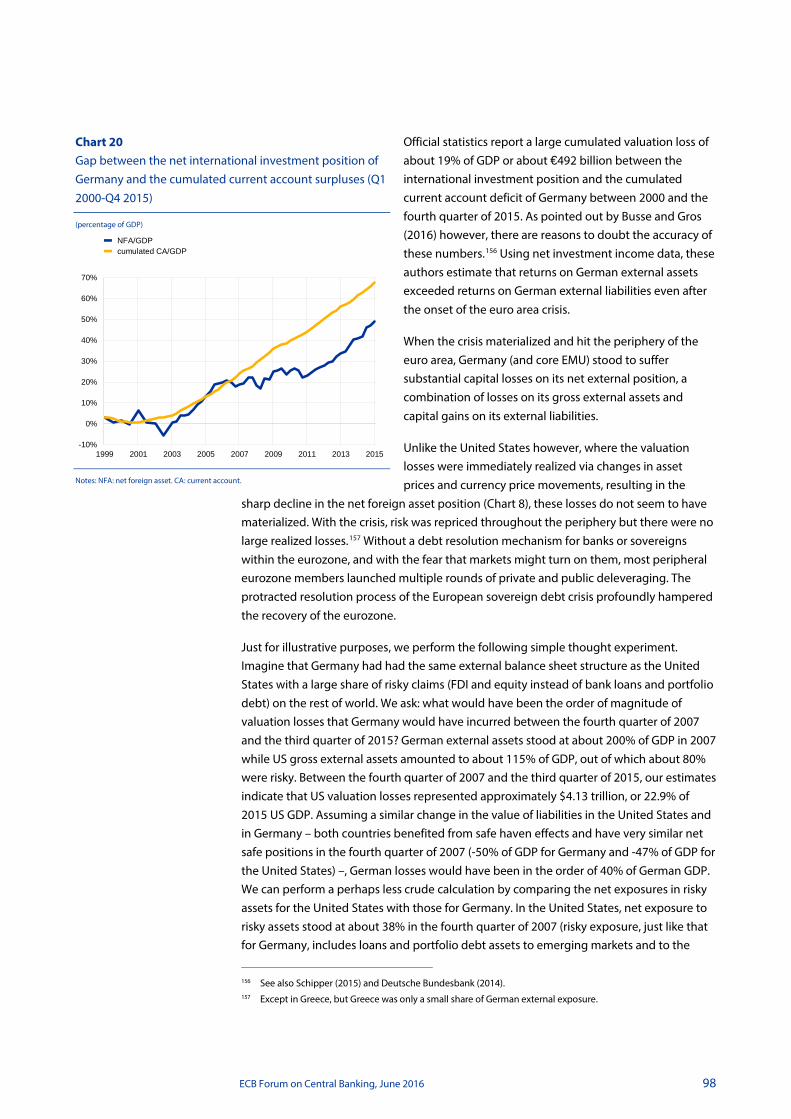
ECB Forum on Central Banking, June 2016 98
Official statistics report a large cumulated valuation loss of about 19% of GDP or about €492 billion between the international investment position and the cumulated current account deficit of Germany between 2000 and the fourth quarter of 2015. As pointed out by Busse and Gros (2016) however, there are reasons to doubt the accuracy of these numbers.156 Using net investment income data, these authors estimate that returns on German external assets exceeded returns on German external liabilities even after the onset of the euro area crisis.
When the crisis materialized and hit the periphery of the euro area, Germany (and core EMU) stood to suffer substantial capital losses on its net external position, a combination of losses on its gross external assets and capital gains on its external liabilities.
Unlike the United States however, where the valuation losses were immediately realized via changes in asset prices and currency price movements, resulting in the
sharp decline in the net foreign asset position (Chart 8), these losses do not seem to have materialized. With the crisis, risk was repriced throughout the periphery but there were no large realized losses.157 Without a debt resolution mechanism for banks or sovereigns within the eurozone, and with the fear that markets might turn on them, most peripheral eurozone members launched multiple rounds of private and public deleveraging. The protracted resolution process of the European sovereign debt crisis profoundly hampered the recovery of the eurozone.
Just for illustrative purposes, we perform the following simple thought experiment. Imagine that Germany had had the same external balance sheet structure as the United States with a large share of risky claims (FDI and equity instead of bank loans and portfolio debt) on the rest of world. We ask: what would have been the order of magnitude of valuation losses that Germany would have incurred between the fourth quarter of 2007 and the third quarter of 2015? German external assets stood at about 200% of GDP in 2007 while US gross external assets amounted to about 115% of GDP, out of which about 80% were risky. Between the fourth quarter of 2007 and the third quarter of 2015, our estimates indicate that US valuation losses represented approximately $4.13 trillion, or 22.9% of 2015 US GDP. Assuming a similar change in the value of liabilities in the United States and in Germany – both countries benefited from safe haven effects and have very similar net safe positions in the fourth quarter of 2007 (-50% of GDP for Germany and -47% of GDP for the United States) –, German losses would have been in the order of 40% of German GDP. We can perform a perhaps less crude calculation by comparing the net exposures in risky assets for the United States with those for Germany. In the United States, net exposure to risky assets stood at about 38% in the fourth quarter of 2007 (risky exposure, just like that for Germany, includes loans and portfolio debt assets to emerging markets and to the
156 See also Schipper (2015) and Deutsche Bundesbank (2014). 157 Except in Greece, but Greece was only a small share of German external exposure.
Chart 20 Gap between the net international investment position of Germany and the cumulated current account surpluses (Q1 2000-Q4 2015)
(percentage of GDP)
Notes: NFA: net foreign asset. CA: current account.
-10%
0%
10%
20%
30%
40%
50%
60%
70%
1999 2001 2003 2005 2007 2009 2011 2013 2015
NFA/GDPcumulated CA/GDP

ECB Forum on Central Banking, June 2016 99
euro periphery). For Germany, it was about 68% for the same quarter. If Germany had undergone a loss proportional to the US one, Germany would have had a valuation loss of about 41% of GDP, which is very similar to the previous estimates. Whatever disagreement one might have about the actual losses on the German net foreign asset position during that period, they are very far from 40% of GDP. According to official statistics – which, as mentioned above, are probably biased upwards – German losses would at most be 19% of GDP.
Three points are important here. First, some of these valuation losses can ultimately be reverted as the global economy recovers and safe asset providers – via their exposure – stand to gain disproportionately from the subsequent recovery. Second, our point here is not to argue that Germany (or other core EMU countries) should have shouldered such a staggering amount of losses. Rather, it is that the external portfolio structure of regional safe asset providers can entail very large levels of exposure which should be properly understood and monitored. Third, this portfolio structure is an equilibrium phenomenon, emerging from market forces and expected returns. If German post-crisis external returns are not very low, German pre-crisis external returns do not appear inordinately large either: the yield difference between core and periphery investment appeared surprisingly low in the run-up to the eurozone crisis. This may have been the result of massive risk shifting on the part of core-EMU financial institutions. It also suggests that safe asset providers are disproportionately vulnerable to periods of excessive risk appetite. Ultimately, this contributes to extremely elevated exposure levels that make it very difficult to achieve a speedy resolution.
The result of the protracted deleveraging in the euro area has been a massive shift from a current account balance, to a current account surplus of 0.7% of world GDP, as illustrated in Charts 5 and 6. In terms of our earlier analysis, these deleveraging forces pushed the natural interest rate in the eurozone far below the rest of the world. If the eurozone were a closed economy, the resulting deflationary forces would have been self-defeating, just as attempts to deflate one’s economy at the expense of one’s trading partners were ultimately self-defeating during the Great Depression. At the ZLB, instead, this shift towards surpluses has lessened the burden of adjustment on the eurozone, at the expense of the rest of the world.
In summary, core EMU has not performed its role as a regional insurer. Unlike the United States, which saw its net foreign asset position deteriorate a great deal during the crisis, as US Treasuries appreciated while external assets plummeted in value, core EMU has not absorbed the banking losses on its balance sheet. Unrealized losses have been pushed onto the peripheral countries’ public sector balance sheet, forcing them to delever aggressively. This aggregate delevering, and the corresponding surge in saving, continues to have deleterious effects on the global economy.158
Given our finding that real interest rates will remain low for an extended period of time, we consider that it would be wise to steer away from policies that make us teeter on the
158 Reinhart and Rogoff (2009) emphasize that, besides deleveraging, post-crisis weakness of the banking sector
and in some cases post-crisis re-regulation of the financial sector (which may involve some degree of financial repression) are also important factors contributing to the weakness of the economy.

ECB Forum on Central Banking, June 2016 100
verge of a global liquidity trap. Being a regional safe asset provider may prove to be a curse not only to core EMU, but to the EMU as a whole and to the global economy.
4 Conclusion
Several policy implications can be derived from our analysis. First, we analyze the long-run historical time series of consumption and wealth of four large economies accounting for much of the international financial and economic activity between the end of the 19th century and today (the United States, the United Kingdom, France and Germany). We show that consumption-to-wealth ratios tend to predict future movements in real risk-free rates. The strength of our analysis comes in particular from the fact that we do not superimpose any structural model on our data; all our results are obtained using merely the intertemporal budget constraint of the world economy proxied by these four countries. Economic common sense and our budget constraint say that low consumption-to-wealth ratios today have to be an indication of future low returns on wealth or high future consumption growth. After decomposing the return on wealth in a real rate component and an excess return component and constructing the relevant VARs, we obtain a first-order result: consumption-to-wealth ratios predict future real riskless rates. Furthermore, we identify two historical periods during which the consumption-to-wealth ratios have been unusually low: these are the two “secular stagnation” periods (the 1930s and the current period). Both periods have been preceded by a period of “financial exuberance” (the 1920s and the 2000s), where wealth has grown quickly. Both periods have seen a major financial crisis followed by a period of deleveraging and low consumption. These deleveraging periods, during which we observe low consumption-to-wealth ratios, announce low future real rates. The bottom line is that our estimates indicate that the real rates should stay low for several more years. Such a long period of low real rates has consequences ranging from the sustainability of the business models of banks and insurance to the solvency of pension plans.
It also makes it more likely that several countries will fall or stay in a liquidity trap. In a world where many countries flirt with the ZLB, it is the reallocation of demand across geographical areas that determine global imbalances, as shown by Caballero et al. (2015) and Eggertsson et al. (2016). There is therefore a large risk that countries will pursue non-cooperative policies. Another important message of our paper is that a world of low real rates also comes with unequal burdens. Safe asset providers and in particular regional or small safe asset providers face a large demand for their assets in times of turmoil. Building on Gourinchas et al. (2014), we show in Section 3 of the paper that such countries face a trade-off between letting their exposure to world risk increase and allowing their currency to appreciate in real terms. The trade-off is starker for smaller economies (such as Switzerland or core EMU countries) than for the United States, as their exposure can rapidly rise to several multiples of GDP. We dub this the “curse of the regional safe asset providers”. The recent experience of Switzerland comes to mind. Unlike the United States, whose net foreign asset positions have massively declined since 2007 (as insurance has been provided to the rest of the world), core EMU countries have postponed or avoided losses on their external assets, forcing euro area economies on the periphery to delever to make good on their external debt. Euro area periphery countries’ deleveraging has
ECB Forum on Central Banking, June 2016 101
translated into a large aggregate current account surplus of the euro area, effectively exporting recession abroad.
What are the policy implications of our analysis? The issue of post-crisis deleveraging leading to low levels of the real interest rate is central to the difficulties of the world economy. Hence our econometric analysis supports the part of the “secular stagnation” literature which assigns the current economic weakness to the post-financial crisis debt hangover and overhang. The policy prescriptions of this literature in terms of increased public spending in particular seem appropriate. But our analysis also suggests a particular role for countries issuing safe assets. Overcoming the “curse of the regional asset provider” seems to be one of the most challenging issues. Several complementary steps could be taken.
First, it would be beneficial for the eurozone to issue safe assets on a larger scale instead of relying only on Bunds, French OATs, or Swiss deposits. This should give impetus to a number of initiatives aiming at developing euro area safe assets, whether red/blue bonds (see Von Weizsäcker and Delpla (2010)), ESBies (see Brunnermeier et al. (2011)) or CDOs (see Corsetti et al. (2016)).
Relying on a broader supply of safe assets, whose safety is not aligned with geographical boundaries but rather spans the entire euro area, would avoid the destabilizing portfolio shifts occurring during periods of high risk. In periods of volatility, endogenous market segmentation increases, hindering the proper transmission of monetary policy and capital flows towards safe haven countries, pushing them instead to either supply insurance or increase their risk exposure or to real appreciation with recessionary risk. Overcoming the curse of the regional asset provider can therefore be done by delinking the supply of safe assets from a particular economy.
Second, having a mechanism which allows orderly loss-taking within the euro area would be beneficial. When losses are not realized and deleveraging drags on, recession takes hold and becomes self-defeating in a closed economy. In an open economy, recession is exported abroad via current account surpluses. One can think of institutionalizing a sovereign debt restructuring mechanism within the euro area to make sure that the current situation does not reproduce itself in the future. By enabling an orderly write-down of debts, a sovereign debt restructuring mechanism avoids long periods of deleveraging and resolves the problem of debt overhang (see Corsetti et al. (2016) for a possible implementation). One should also pay particular attention to the treatment of non-performing loans (NPLs) in the portfolios of banks in order to avoid the well-known phenomenon of zombie lending. Both sovereign debt restructuring and NPL write-downs should not lead to financial instability and contagion across the area. It is therefore important that all the safeguards in terms of banking union (including deposit guarantees) be in place.
Third, developing the capital markets union would allow a quicker write-down of losses. Were risk to be shared through contingent assets – such as FDI and equity – we would not be facing the protracted current period of recession associated with a long and painful deleveraging of the periphery. In that respect, much remains to be done – in particular some major rethinking of the legal infrastructure (bankruptcies).

ECB Forum on Central Banking, June 2016 102
Lastly, core EMU banks and financial intermediaries should be carefully monitored. In this crisis, they have borrowed globally and lent to peripheral eurozone countries, earning small but positive excess returns in the process. Core EMU countries have not let their real exchange rate appreciate in response to a surge in the demand for safe assets. Instead, they have tended to absorb the increased external exposure onto their national balance sheet. Some of that increase in financial sector exposure may well reflect risk shifting and expectations of bailouts using taxpayers’ money. This emphasizes the need for a very careful monitoring of financial fragilities and imbalances, especially for EMU safe asset providers.
References
Amador, M., Bianchi, J., Bocola, L. and Perri, F. (forthcoming), “Reverse Speculative Attacks”, Journal of Economic Dynamics and Control.
Barro, R.J. and Sala-i-Martin, X. (1990), “World Real Interest Rates”, in NBER Macroeconomics Annual 1990, Vol. 5, pp.15-74, edited by Blanchard, O.J. and Fischer, S., Cambridge: MIT Press.
Barro, R.J. and Ursúa, J.F. (2010), Barro-Ursúa Macroeconomic Data.
Bernanke, B.S. (2005), “The Global Saving Glut and the U.S. Current Account Deficit”, Federal Reserve Board, Sandridge Lecture, Virginia Association of Economists, Richmond, Virginia.
Brunnermeier, M.K., Garicano, L., Lane, P.R., Pagano, M., Reis, R., Santos, T., Thesmar, D., Van Nieuwerburgh, S. and Vayanos, D. (2011), “ESBies: A Realistic Reform of Europe’s Financial Architecture”, VOXeu.org: The Future of Banking.
Busse, M. and Gros, D. (2016), “Returns to German Savings Invested Abroad”, VOXeu.org.
Caballero, R.J. and Farhi, E. (2014), “The Safety Trap”, NBER Working Papers, No 19927.
Caballero, R.J., Farhi, E. and Gourinchas, P.-O. (2008), “An Equilibrium Model of ‘Global Imbalances’ and Low Interest Rates”, American Economic Review, Vol. 98, No 1, pp. 358-393.
Caballero, R.J., Farhi, E. and Gourinchas, P.-O. (2015), “Global Imbalances and Currency Wars at the ZLB”, NBER Working Papers, No 21670.
Caballero, R.J., Farhi, E. and Gourinchas, P.-O. (2016), “Safe Asset Scarcity and Aggregate Demand”, NBER Working Papers, No 22044.
Calvo, G. (2013), “The Liquidity Approach and the Price Theory of Money: Disentangling the Mysteries of Financial Crises”.
ECB Forum on Central Banking, June 2016 103
Campbell, J.Y. and Mankiw, N.G. (1989), “Consumption, Income and Interest Rates: Reinterpreting the Time Series Evidence”, in NBER Macroeconomics Annual, Vol. 4, pp. 185-215, edited by Blanchard, O.J. and Fischer, S., Cambridge: MIT Press.
Corsetti, G., Feld, L.P., Koijen, R., Reichlin, L., Reis, R., Rey, H. and Weder di Mauro, B. (2016), “Reinforcing the Eurozone and Protecting an Open Society”, Monitoring the Eurozone 2, London: CEPR Press.
Deutsche Bundesbank (2014), “Discrepancy between changes in foreign assets and the cumulative financial account balance: unsuitable indicator of wealth losses”, Monthly Report, Vol. 66, No 5, pp. 48-50.
Eggertsson, G.B. and Krugman, P. (2012), “Debt, Deleveraging, and the Liquidity Trap: A Fisher-Minsky-Koo Approach”, The Quarterly Journal of Economics, Vol. 127, Issue 3, pp. 1469-1513.
Eggertsson, G.B., Mehrotra, N.R., Singh, S. and Summers, L.H. (2016), “Contagious Malady? Global Dimensions of Secular Stagnation”, NBER Working Paper, No 22299.
Eichengreen, B. (2015), “Secular Stagnation: The Long View”, American Economic Review, Vol. 105, No 5, pp. 66-70.
Fitch Ratings (2016), “Brexit Vote Pushes Negative-Yielding Debt to $11.7 Trn”, last modified 29 June 2016, https://www.fitchratings.com/site/pr/1008156
Gourinchas, P.-O. and Rey, H. (2007a), “From World Banker to World Venture Capitalist: U.S. External Adjustment and the Exorbitant Privilege”, in G-7 Current Account Imbalances: Sustainability and Adjustment, edited by Clarida, R.H., Chicago: University of Chicago Press, pp. 11-55.
Gourinchas, P.-O. and Rey, H. (2007b), “International financial adjustment”, Journal of Political Economy, Vol. 115, No 4, pp. 665-703.
Gourinchas, P.-O. and Rey, H. (2016), “Global Real Rates: A Long Run Approach”, mimeo, UC Berkeley.
Gourinchas, P.-O., Rey, H. and Govillot, N. (2014), “Exorbitant Privilege and Exorbitant Duty”, mimeo, UC Berkeley.
Guerrieri, V. and Lorenzoni, G. (2011), “Credit Crises, Precautionary Savings, and the Liquidity Trap”, NBER Working Paper, No 17583.
Hale, G. and Obstfeld, M. (2016), “The Euro and the Geography of International Debt Flows”, Journal of the European Economic Association, Vol. 14, No 1, pp. 115-144.
Hamilton, J.D., Harris, E.S., Hatzius, J. and West, K.D. (2015), “The Equilibrium Real Funds Rate: Past, Present and Future”, NBER Working Paper, No 21476.
Hansen, A.H. (1939), “Economic Progress and Declining Population Growth”, The American Economic Review, Vol. 29, No 1, pp. 1-15.

ECB Forum on Central Banking, June 2016 104
He, Z., Krishnamurthy, A. and Milbradt, K. (2015), “A Model of the Reserve Asset”, Stanford University, Graduate School of Business: Working Paper, No 3279.
Jordà, Ò., Schularick, M. and Taylor, A.M. (2013), “When Credit Bites Back”, Journal of Money, Credit and Banking, Vol. 45, Issue s2, pp. 3-28.
Jordà, Ò., Schularick, M. and Taylor, A.M. (2016), “Macrofinancial History and the New Business Cycle Facts”, NBER Macroeconomics Annual 2016 (Vol. 31) (forthcoming), edited by Eichenbaum, M. and Parker, J.A., presented at the NBER Macroeconomics Annual Conference 2016, April 2016.
Kindleberger, C.P. (2013), “The world in Depression, 1929-1939”, 40th Anniversary Edition, Berkeley: University of California Press.
Laubach, T. and Williams, J.C. (2003), “Measuring the Natural Rate of Interest”, Review of Economics and Statistics, Vol. 85, Issue 4, pp. 1063-1070.
Laubach, T. and Williams, J.C. (2015), “Measuring the Natural Rate of Interest Redux”, Federal Reserve Bank of San Francisco, Working Paper Series: Working Paper 2015-16.
Lettau, M. and Ludvigson, S. (2001), “Consumption, Aggregate Wealth and Expected Stock Returns”, Journal of Finance, Vol. 56, Issue 3, pp. 815-849.
Maggiori, M. and Farhi, E. (2016), “A Model of the International Monetary System”, mimeo, Harvard University.
Mendoza, E.G., Quadrini, V. and Ríos-Rull, J.-V. (2009), “Financial integration, Financial Development, and Global Imbalances”, Journal of Political Economy, Vol. 117, No 3, pp. 371-416.
Mian, A., Rao, K. and Sufi, A. (2013), “Household Balance Sheets, Consumption, and the Economic Slump”, The Quarterly Journal of Economics, Vol. 128, Issue 4, pp. 1687-1726.
Miranda-Agrippino, S. and Rey, H. (2015), “World Asset Markets and the Global Financial Cycle”, NBER Working Paper, No 21722.
Obstfeld, M. (2011), “International Liquidity: The Fiscal Dimension”, keynote speech given at the 2011 International Conference “Real and Financial Linkage and Monetary Policy”, Institute for Monetary and Economic Studies, Bank of Japan, Tokyo, 1-2 June 2011.
Pescatori, A. and Turunen, J. (2015), “Lower for Longer: Neutral Rates in the United States”, IMF Working Papers, WP/15/135.
Piketty, T. and Zucman, G. (2014), “Capital is back: Wealth-Income Ratios in Rich Countries 1700–2010”, The Quarterly Journal of Economics, Vol. 129, Issue 3, pp. 1255-1310.
Piketty, T. and Zucman, G. (2015), “Wealth and Inheritance in the Long Run”, Handbook of Income Distribution, Vol. 2B, pp. 1303-1368.
Reinhart, C.M. and Rogoff, K.S. (2009), “This Time Is Different: Eight Centuries of Financial Folly”, Princeton, NJ: Princeton University Press.

ECB Forum on Central Banking, June 2016 105
Schipper, U. (2015), “Transaction and valuation effects on Germany's international investment position (IIP) – new statistical approaches and IIP trends”, presented by Robert Kirchner at the IFC Satellite meeting at the ISI 60th WSC, Rio de Janeiro, 24 July 2016.
Summers, L.H. (2015), “Have we entered an age of secular stagnation? IMF Fourteenth Annual Research Conference in Honor of Stanley Fischer, Washington DC”, IMF Economic Review, Vol. 63, Issue 1, pp. 277-280.
Triffin, R. (1960), “Gold and the Dollar Crisis; the Future of Convertibility”, New Haven: Yale University Press.
Delpla, J. and von Weizsäcker, J. (2010), “The Blue Bond Proposal”, Policy Brief Issue 2010/03, Brueghel.

ECB Forum on Central Banking, June 2016 106
Appendix
Data description
The data used in Section 2 were obtained from the following sources:
6. Consumption:
Real per capita consumption going back to 1870 and covering the two world wars was taken from Jordà et al. (2016), who in turn took the data from Barro and Ursúa (2010). As this consumption series is an index rather than a level, we convert it to a level using the consumption data from Piketty and Zucman (2014). To convert to a level, we could use any year we have level data for but chose to use the year 2006 (the year that the index of consumption was 100). In addition, the consumption data was adjusted so that, instead of being based on a 2006 consumption basket, it was based on a 2010 consumption basket to match the wealth data.
7. Wealth:
Real per capita wealth data was taken from Piketty and Zucman (2015). The wealth concept used here is private wealth. As such it does not include government assets but includes private holdings of government issued liabilities as an asset. Where possible, wealth data is measured at market value. Human wealth is not included. Private wealth is computed from the following components: “Non-financial assets” (includes housing and other tangible assets such as software, equipment and agricultural land), and net financial assets (includes equity, pensions, value of life insurance and bonds). Prior to 1954 for France, 1950 for Germany, 1920 for the United Kingdom and 1916 for the United States, wealth data is not available every year (see Piketty-Zucman’s appendix for details on when data is available for each country or refer to Table 6f in the data spreadsheets for each country). When it is available, it is based on the market value of land, housing, other domestic capital assets and net foreign assets less net government assets. For the remaining years, the wealth data is imputed based on savings rate data and assumptions of the rate of capital gains of wealth (see the Piketty-Zucman appendix for details of the precise assumptions on capital gains for each country; the computations can be found in Table 5a in each of the data spreadsheets).
8. Short-term interest rates:
These were taken from Jordà et al. (2016) and are the interest rate on 3-month treasuries.
9. Long-term interest rates:
These were taken from Jordà et al. (2016) and are the interest rate on 10-year treasuries.
10. Return on equity:
This data is the total return on equity series taken from the Global Financial Database.
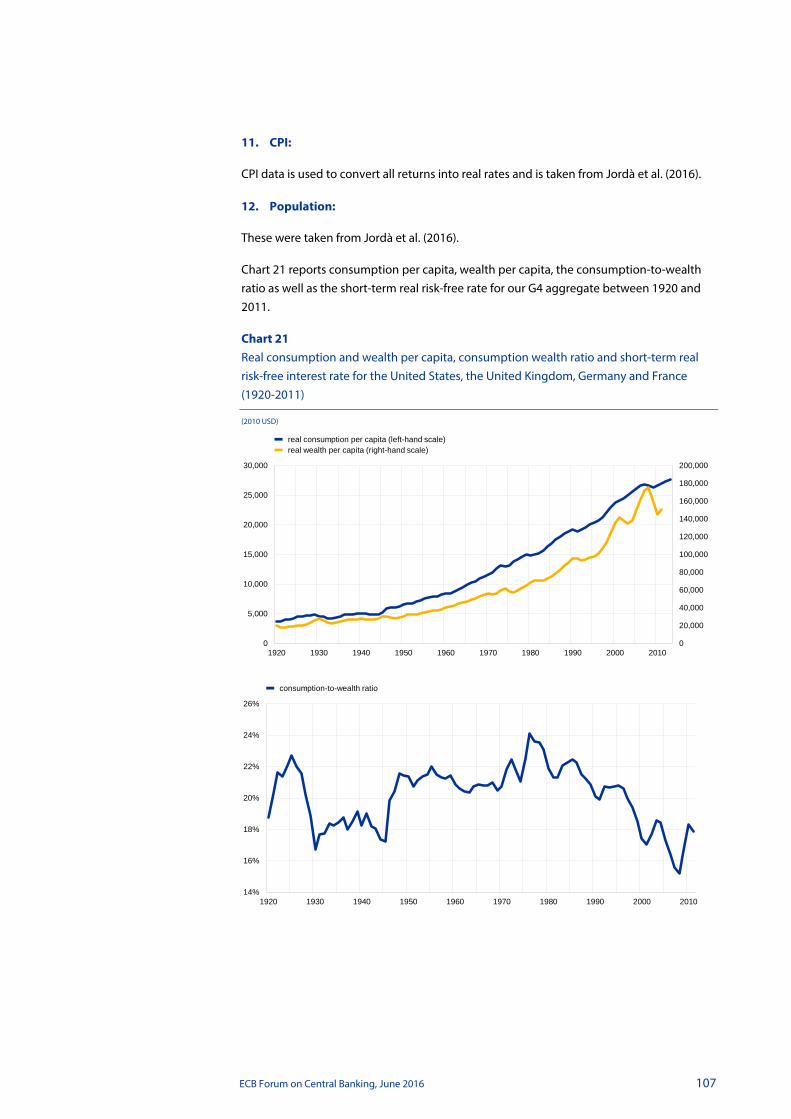
ECB Forum on Central Banking, June 2016 107
11. CPI:
CPI data is used to convert all returns into real rates and is taken from Jordà et al. (2016).
12. Population:
These were taken from Jordà et al. (2016).
Chart 21 reports consumption per capita, wealth per capita, the consumption-to-wealth ratio as well as the short-term real risk-free rate for our G4 aggregate between 1920 and 2011.
Chart 21 Real consumption and wealth per capita, consumption wealth ratio and short-term real risk-free interest rate for the United States, the United Kingdom, Germany and France (1920-2011)
(2010 USD)
0
20,000
40,000
60,000
80,000
100,000
120,000
140,000
160,000
180,000
200,000
0
5,000
10,000
15,000
20,000
25,000
30,000
1920 1930 1940 1950 1960 1970 1980 1990 2000 2010
real consumption per capita (left-hand scale)real wealth per capita (right-hand scale)
14%
16%
18%
20%
22%
24%
26%
1920 1930 1940 1950 1960 1970 1980 1990 2000 2010
consumption-to-wealth ratio

ECB Forum on Central Banking, June 2016 108
The data used in Section 3 were obtained from the following sources:
1. United States: For the United States, the framework of Gourinchas and Rey (2007a, b) is used to construct net and gross foreign asset positions at market value. Data is available from two sources: the US Department of Commerce’s Bureau of Economic Analysis (BEA), and the Federal Reserve Flow of Funds Accounts (FFA). The BEA is the main source for recent data. It has been reporting its International Investment Position of the United States (IIP) annually since 1976, and quarterly since 2006. In addition, the BEA has been reporting quarterly flow data in the US International Transactions (USIT) tables since 1960 for some flow series, and since 1982 for others. Following official classifications, we split the foreign portfolio into four categories: debt (corporate and government bonds), equity, foreign direct investment (FDI), and other. For assets, reserves are also presented as a separate category. The “other” category includes mostly bank loans and trade credits. It also contains gold reserves. US GDP data are obtained at the quarterly frequency on an annualized basis from the BEA’s National Income and Product Accounts (NIPA), Table 1.1.5. – Gross Domestic Product, Line 1. Current account data are from NIPA Table 4.1, Line 33. Appendix B of Gourinchas and Rey (2007a) and Appendix A of Gourinchas and Rey (2007b) provide a complete description of the data construction.
2. Germany: For Germany, net and gross foreign asset positions, as well as current account data, were obtained from the Deutsche Bundesbank’s balance of payments and international investment position series. All series are based on euros, including for historical data, and are available for each year starting from 1949, and for each quarter from the fourth quarter of 2003. We follow the same decomposition as for the United States into debt, equity, FDI, and other (as well as reserve, for the assets side). “Other” is taken as the difference between total external assets (liabilities) and the other four (three) categories. It contains mostly bank loans, trade credits, as well as currency and deposits (which include Target 2 balances). Quarterly GDP data on an unadjusted current-prices basis are from the Bundesbank as well as the Federal Statistical Office of Germany (Statistisches Bundesamt), and are annualized on a rolling four-quarter window. Data are linearly interpolated over very short periods of time when needed. Risky assets include FDI and equity assets, while safe liabilities contain debt and “other investment liabilities” (from the official nomenclature, which
-12%
-8%
-4%
0%
4%
8%
12%
16%
20%
1920 1930 1940 1950 1960 1970 1980 1990 2000 2010
short-term real interest rate
ECB Forum on Central Banking, June 2016 109
is slightly more restrained than our “Other” category). German banks data were also obtained from the Deutsche Bundesbank, in particular the “External position of banks” series. Those series provide details on the currency and geographical composition of banks’ balance sheets. The Bundesbank follows the Bank for International Settlements in providing two main types of classification: locational banking statistics, which are based on the location of banks’ offices (“Banks in Germany (MFIs)” series), and consolidated banking statistics, which are based on the nationality of banking groups (“Claims of German banks, including their foreign branches and subsidiaries vis-à-vis non-residents” series). Consolidated data provide a perhaps more accurate picture of the foreign and currency risk exposure of German banks (concept of ownership), while locational data are more consistent with Balance of Payments data (concept of residency). Finally, Target 2 balances data, which are part of the “Other investment asset” category, were also obtained from the Deutsche Bundesbank, “External position” of the Bundesbank series.
3. Switzerland: Data for the International Investment Position and Current Account of Switzerland are available on a quarterly basis starting with the first quarter of 2000 from the Swiss National Bank (SNB), International Economic Affairs division (Cube ID: auvekomq). We follow the same decomposition as for the United States and Germany into debt, equity, FDI, and other (as well as reserve assets). “Other” is taken as the difference between total external assets or liabilities and the other categories. It contains mostly bank loans, trade credits, as well as currency and deposits. Quarterly GDP data is obtained from the State Secretariat for Economic Affairs (SECO) of the Swiss Confederation. Non-adjusted data are used, to be consistent with current account and net investment position data. We use data based on the production approach, but figures are similar to expenditure and income-based approaches. GDP is annualized using a rolling four-quarter window.

ECB Forum on Central Banking, June 2016 110
Comment on “Real interest rates, imbalances and the curse of regional safe asset providers at the Zero Lower Bound” by Pierre-Olivier Gourinchas and Hélène Rey By David Vines159
1 Introduction
This is an important paper: the authors discuss two major issues facing the world economy. They show that the world faces a twenty-first century “Triffin problem”. And they examine the difficulties which will remain with us if, as seems likely, world interest rates stay low for a long period of time.
One of the authors – Hélène Rey – is well-known for her writings on what she has called the global financial cycle. Her empirical work on this cycle has overturned much of the conventional wisdom in international macroeconomics. It is helpful, I believe, to think of the two major problems discussed in this paper as arising from the same sets of features of international financial markets which give rise to the global financial cycle, i.e. arising from the very same features as those which underlie Rey’s earlier work. My main purpose in these comments is to show how, and why, these two bodies of work are so closely related.
Nevertheless, I will deliberately conclude with a note of optimism. Using Australia as an example, I will argue that, if a country has a good policy framework, it can largely escape from the global financial cycle and shield itself from the problems described in this paper.
2 Rey’s attack on conventional wisdom: it’s time to abandon uncovered interest parity
2.1 The world of Mundell, Fleming, Dornbusch and Woodford
For many years we have known that – if capital is highly mobile internationally – a floating exchange rate is necessary if a country is to have an independent monetary policy. The collapse of the Bretton Woods System in 1971 taught us this, as did Britain’s ejection from the European Monetary System in 1992 and Thailand's currency collapse in 1997. The slogan “Impossible Trinity” captures our understanding. That slogan says that, if a country 159 Economics Department, Balliol College, St Antony’s College and Institute for New Economic Thinking at the
Oxford Martin School, Oxford University. Also Centre for Economic Policy Research and Chatham House, London. Email address: [email protected]

ECB Forum on Central Banking, June 2016 111
fixes its exchange rate and yet also wishes to have an independent monetary policy, it must introduce capital controls.
But according to conventional wisdom, the phrase “Impossible Trinity” has come to mean much more than this. According to a widely held view, if capital is highly mobile internationally, then a floating exchange rate is also sufficient for a country to be able to have an independent monetary policy. Nearly ten years ago Michael Woodford wrote as follows:
“It is difficult to think of plausible economic mechanisms through which globalization should impair in any substantial way the ability of central banks to control domestic inflation through national monetary policy.” (Woodford (2007))
For Woodford, an independent monetary policy is one which can be used to effectively control domestic inflation; he would add that, in the absence of such inflation, an independent monetary policy can also suppress shocks to aggregate demand. He believes – or believed in 2007 – that floating exchange rates make such a monetary policy possible.
There is clearly a world in which these views of Woodford are appropriate – and, as I will discuss at the end of these comments, Australia seems to live in such a world. This is the world of Mundell-Fleming and Dornbusch; a world in which the uncovered interest parity (UIP) condition holds. Mundell Fleming says that if, say, world interest rates fall, then a country’s monetary authorities will be able to offset the effects of this. In the interests of their domestic objectives, they will try to prevent domestic interest rates from falling. This will immediately cause the exchange rate to appreciate. Competent monetary policymakers in such a world will ensure that this appreciation depresses aggregate demand by exactly the amount necessary to counteract the inflationary effects of the lower interest rates. That will lead these policymakers to end up accepting the lower level of interest rates which the world imposes on them.160 A Dornbusch-type modification of this (over-strong) argument plausibly asserts that the monetary authorities will, in fact, need to hold interest rates above the world level for some period of time. This is because an appreciation of the exchange rate does not immediately depress aggregate demand, so interest rates above world levels are temporarily needed to prevent the lower level of world interest rates from having an expansionary effect. As a consequence, the exchange rate will over-appreciate in the short run. Nevertheless, aggregate demand will still be stabilised. In such a Mundell-Fleming-Dornbusch world, floating exchange rates are not just necessary but also sufficient for a country to be able to operate an independent monetary policy.
Furthermore, floating rates will help such a well-conducted monetary policy to do its work. In the example just described, the (temporary) tightening of monetary policy leads to currency appreciation. Such an appreciation helps monetary policy to achieve its desired objective of damping the demand shock coming from the lower level of world interest rates.
160 Appreciation lowers aggregate demand; the monetary authorities will cease trying to hold domestic interest
rates above the new (lower) world level when the reduction in demand caused by the appreciation exactly cancels out the increase in demand caused by the lower level of world interest rates.
ECB Forum on Central Banking, June 2016 112
2.2 Rey’s wake-up call: there is a global financial cycle
Hélène Rey has produced convincing empirical evidence that most countries do not live in a Mundell-Fleming-Dornbusch (henceforth “MFD”) world. Here is a summary of her main claim (Rey (2015)).
“There is a global financial cycle in capital flows, asset prices and in credit growth ... The global financial cycle is not aligned with countries’ specific macroeconomic conditions. In a number of countries, this can lead to excess credit growth (or alternatively to monetary conditions which are too tight) ... Our VAR analysis suggests that one important determinant of the global financial cycle is monetary policy in the center country, which affects leverage of global banks, credit flows and credit growth in the international financial system. This channel invalidates the “trilemma”, which postulates that in a world of free capital mobility, independent monetary policies are feasible if exchange rates are floating.”
Rey’s empirical findings were given prominence in her notable Mundell Fleming Lecture, presented in 2014 (Rey (2016)). By and large, I accept her claims – but see my discussion about Australia at the end of these comments. Rey’s findings mean that we must interpret the “Impossible Trinity” as saying a floating exchange rate is necessary for a country to have an independent monetary policy, but that it is not sufficient.
2.3 The analytical implications of Rey’s empirical findings
But if the analysis provided by conventional wisdom is not adequate, what are we to put in its place? What are the plausible mechanisms which Woodford must have ignored in 2007?
It is clear from the above discussion that Woodford’s ideas about the possibility of an independent monetary policy, in the presence of floating exchange rates, are squarely based on UIP. But UIP involves an application of the efficient markets hypothesis to the international economy. And the experience of the last few years, particularly since the Global Financial Crisis (GFC) of 2007-09, has shown that, in general, it is unwise to adopt analyses which depend on this hypothesis. In particular, we no longer believe two key claims – coming from UIP and thus from the efficient markets hypothesis – that are embodied in the MFD world-view.
First, it is clear that exchange rates do not always move so as to ensure that expected changes in the exchange rate exactly compensate for international differences in interest rates. And even when exchange rates do behave in this way, the movements in the exchange rate are actually often not sensible, since the process of expectations-formation about future values of the exchange rate can easily become unhinged. It can thus be difficult for monetary policy to isolate an economy from the global financial cycle. Second, it is also clear that the exchange rate often does not move in a way which assists monetary policy in its task of protecting an economy from the range of other shocks which affect it.

ECB Forum on Central Banking, June 2016 113
Of course one might argue that there is nothing wrong with UIP. All that is needed, it might be said, is to add an exogenous risk premium to the UIP condition. But this view is inadequate, since the risk premium is clearly not exogenous.
Instead what is needed is the following. The MFD analysis, and the UIP condition, and the efficient markets hypothesis on which that condition rests, must be replaced with a careful analysis, using modern portfolio theory, of the international allocation of investment portfolios.161 Such an analysis will have regard both to the differing risks, and to the differing opportunities for return, which are present across a range of countries. It will postulate realistic distributions of shocks: as between home and foreign countries, as between the real sector and the financial sector, and – within the financial sector – as between risky assets and safe assets. It will seek to study how investors respond to these opportunities and risks. To do this, it will be necessary to examine the preferences of international portfolio managers, including their degree of risk-aversion, and also to examine the influence of any leverage constraints which impinge upon their behaviour. In such a set-up the behaviour of the exchange rate, and so the outcomes for monetary policymakers, will come to depend not just on one or two simple shocks, and on the monetary-policy rule, as in the MFD set-up. These outcomes will depend on all of the things mentioned in this paragraph. In other words, the risk premium to add to the UIP condition will depend on rather a large number of things, all of which are endogenous.
A number of scholars are beginning to carry out the necessary work, including my Oxford student Dylan Smith (Smith (2016)). But there is a lot still to do.
3 Exorbitant privilege and duty
The first major new idea in the paper is to be found towards the end. The discussion there rests very clearly, even if only intuitively, on the kind of analysis which I have just been discussing.
The authors present an argument about the “exorbitant privilege” which accrues to the providers of safe assets in the world economy. The term “exorbitant privilege” is another slogan: this one initially invented by Charles de Gaulle to describe the benefits which accrue to a reserve currency centre. De Gaulle had seigniorage in mind: the ability of a country to costlessly create money and then spend it, simply because the country is a reserve currency centre. But seigniorage of this kind is a thing of the past.162
The authors have in mind something rather different. There are countries, they say, whose assets are, by and large, safer than those in other countries due to a lower level of policy risk. Such lower policy risk can arise for many reasons, which I do not discuss here. At least one such country exists in at least three major regions of the world: in the Americas (the United States), in Europe (Germany) and in East Asia (Japan). It is well known that such
161 The necessary work was begun by Pentti Kouri (Kouri (1981)). But strangely it was never followed up. 162 That is because those agents in other countries who come to hold the money which has been spent by the
inhabitants of the first country must be paid interest on their holdings. However small the interest paid, its existence deprives the issuers of the money of the completely free lunch which would be implied by a process of seigniorage.
ECB Forum on Central Banking, June 2016 114
providers of safe assets may well undertake maturity transformation: accepting short-term deposits and, in return, holding longer-term assets. This has implications which are widely understood. But these countries also undertake risk transformation. This is the new idea on which this paper focuses.
It is the case, the authors say, that asset-holders from many parts of the world, including emerging market economies, seek out the safe assets provided by the countries having a lower level of policy risk. In due course, a fuller discussion will enable us to trace this asset-purchasing behaviour back to the portfolio allocation decisions of asset holders, and will analyse these decisions in the way sketched out in the previous section of these comments. Such an analysis has not yet been done. Nevertheless, it is clear that asset holders will be prepared to accept low yields on the safe assets, precisely because they are safe. Chinese holdings of US Treasuries provide an example. It is a privilege for the countries which issue these assets to be able to pay low interest rates on the assets which they create.
Of course, across the world, the demand and supplies of assets must add up. The regional provider of safe assets thus gets to hold a corresponding quantity of the assets issued in other countries, which are riskier and so must, inevitably, offer higher returns. This is the other side of the coin of the privilege of being able to issue safe assets which need only pay a low interest rate.
For a well-functioning international financial system to exist, these issuers of safe assets must accept three kinds of duty alongside their privilege of being able to pay low interest rates on their debt. First, the regulators in the countries which issue the safe assets must be able to regulate their banking and financial systems to cope with the fact that the banks in their countries will be holding a disproportionately high proportion of the world’s risky assets. The holdings of emerging-market assets by the US financial system, and the holdings of assets in the European periphery by the German banking system are two examples of such risky holdings. A second kind of duty is that the issuers of safe assets must not be able to wriggle out of bearing the risk associated with these assets. They must not be able to offload their risky financial asset holdings back onto depositors in other countries, as US banks did with claims on subprime mortgages (which Chinese depositors were unwilling to hold, with the result that these assets were therefore offloaded onto European asset holders). A third kind of duty is that they must not be able to use political means to prevent the issuers of risky assets from being able to default, at least in part, on their obligations when things turn out worse than had been expected. This has in fact happened within the eurozone, in not just one but two ways, both for political reasons. German banks have been protected from losses on their asset holdings in GIIPS countries, i.e. Greece, Italy, Ireland, Portugal and Spain. And the restructuring and writing down of sovereign debt has been both obstructed and prevented. I discuss this last point further below.
In sum, issuers of safe assets are offered higher return – a privilege – in exchange for a higher risk. It is their duty to regulate this risk appropriately, not to offload it onto other countries, and to accept the losses on the risky assets which they hold as and when these losses occur.
ECB Forum on Central Banking, June 2016 115
3.1 A twenty-first century Triffin problem
The authors identify a problem with the international system just described: there may be sudden change in the attitude of investors towards risk.
It is immediately clear how our ability to understand the effects of such a shock depends on our ability to understand the issues discussed in the previous section of these comments. We must understand the international portfolio allocation process and in particular must be able to analyse the effects of a shift in investor preferences. It is not adequate just to stick a risk premium into the UIP condition and then to say that suddenly this risk premium changes, in different ways in different countries. We must have a sense of how, and why, changes in attitudes towards risk by international investors change their desires for different kinds of assets in different countries.
The authors call the effects of a sudden change in attitude to risk – and in particular an increase in risk aversion – a “Triffin problem”. But this is a Triffin problem of an entirely new kind.
The familiar Triffin problem is often described as a “currency problem” – caused by people not wanting to hold the dollar. But the familiar Triffin problem was not a currency problem at all. The fact that people did not want to hold the dollar was only a symptom of the underlying problem which was, instead, a macroeconomic policy problem of a James Meade/Trevor Swan kind.
In the later part of the 1960s it became impossible for countries within the Bretton Woods system to achieve both internal and external balance. James Meade had recommended that they do this in his Nobel Prize-winning book on the balance of payments (Meade (1951)). Meade’s book was very complex. Trevor Swan used a two-dimensional diagram to recommend exactly the same thing (Swan (1963)). His diagram had the advantage of being very simple (Temin and Vines (2013) and (2014)). But countries became unable to do what was recommended. The impossibility stemmed from an unwillingness of Germany and Japan to appreciate their currencies, and an unwillingness (and inability) of the United States to devalue the dollar. Those countries running current account surpluses – in Europe and in Japan – had to accept an increasing stock of an unwanted currency – the dollar – in return. But the receipt of this increasing stock of an unwanted currency was merely a symptom of the underlying problem, which was a flow problem due to an inability of the countries to achieve current-account adjustment (Vines (2016a)).
But the new Triffin problem is different: it really is a 21st century Triffin problem since it is a stock problem. The problem identified is one that arises when there are sudden changes in the way in which international portfolio holders wish to allocate their assets. That is to say, it can arise due to balance-sheet issues related to the capital account of the balance of payments; it does not have anything to do with an unfixable current account position, which is what gave rise to the original Triffin problem.
This new Triffin problem applies to Japan. This is why the yen has risen so strongly since the Brexit shock. A sudden reduction in the willingness to bear risk led, after the vote, to a flight to safety – in part into the Japanese yen – and so to an appreciation of the yen.
ECB Forum on Central Banking, June 2016 116
But this Triffin problem also applies to Germany. Depositors have accepted low-yielding safe assets in German banks (and this issue has been magnified through TARGET2 balances). And German banks have held risky assets elsewhere. A sudden reduction in the willingness to bear risk led to a flight to safety – in part into the German currency – and to an appreciation of the German currency.
3.2 Implications for debt forgiveness for GIIPS countries
The Triffin problem for Germany has very significant implications for the GIIPS countries in the European periphery, mainly in Southern Europe.163 European Monetary Union (EMU) has the effect of spreading the privilege, and the duty, that accrues to Germany – because it is a provider of safe assets – to the rest of the eurozone.
The “privilege” of providing safe assets creates forces which have caused Germany’s currency to appreciate, in the same way as we described above for Japan. But Germany’s currency is of course the euro; these events have caused an appreciation of the euro. But such behaviour of the euro is not a “privilege” for the GIIPS countries. The “privilege” of German assets being safe – and so attractive at times of risk aversion in the global economy – has imposed an adjustment burden on the GIIPS countries.
The natural thing for the GIIPS countries to have done, at a time of increasing risk aversion in the world economy, would have been to devalue their currencies and thus enable growth to continue. Such action seems particularly necessary since these are countries in which there is a higher degree of risk and thus a higher likelihood of bankruptcy – and of other impediments to growth – at a time of increased riskiness. The inability of these countries to devalue their exchange rates means that they have not been able to defend themselves, ex post, from the consequences of Germany providing safe assets and, in particular, from the consequence of German banks investing the deposits accruing to them (because they are safe) in the (relatively risky) assets in GIIPS countries. At the very time when these countries should have been able to devalue their exchange rates, they have instead been forced to suffer the experience of an appreciating exchange rate.
A depreciation would, as described above, have enabled the GIIPS countries to begin to grow again. It would also have imposed a loss on the holders of their risky assets – namely German banks. But European Monetary Union has meant that neither of these things has happened. In particular, the GIIPS countries have been forced to bear the loss which would have been borne by German banks if the currencies of the GIIPS countries had depreciated.
This argument creates an additional, and initially somewhat surprising, argument for debt forgiveness in some of the GIIPS countries. Many of us have repeatedly argued that a correction of macroeconomic policy is needed in Europe, with less austerity in both the North and the South, more inflation in the North, and forgiveness of sovereign debt in the GIIPS countries (Vines (2015a) and (2016d)). These existing arguments for debt forgiveness in the GIIPS countries are flow arguments – about a (flow) current account surplus of
163 GIIPS is shorthand for Greece, Italy, Ireland, Portugal and Spain.
ECB Forum on Central Banking, June 2016 117
Germany being too large, imposing a (flow) current account deficit on GIIPS countries, which they must correct by policies of austerity. This flow burden should, it is said, have been lessened by debt relief and, in particular, by a restructuring of sovereign debt of at least some of the GIIPS countries. The paper by Gourinchas and Rey provides an additional (stock) argument for such debt relief.
4 Low global real interest rates and implications for fiscal policy
The second major new idea in the paper is related to the question of whether global real interest rates are likely to remain low for a sustained period of time. The paper provides new empirical support for the widely held opinion, which I share, that this will indeed happen. In this section of my comments I suggest that there is an additional reason for this outcome, beyond the reasons which Gourinchas and Rey identify. I aim to show that all of these reasons – the authors’ reasons and my reason – interact with each other.
The authors identify a lack of confidence by consumers and investors – increased risk aversion – as one reason why interest rates are likely to remain low. In simple language this is an IS shock. We can use the MFD framework to analyse the global transmission of such a shock.164 It is clear that the Brexit vote has created additional pressures pushing in this direction.
The authors identify a second reason for a sustained period of low real interest rates: deleveraging by the global financial system. It would be helpful to explicitly use the framework underpinning Rey’s analysis of the global credit cycle to think about the operation of this deleveraging and its international transmission. As already noted, to do this would require an analysis, making explicit use of portfolio theory, of the international allocation of investment portfolios. Such an analysis would have regard to both the risks as seen by international portfolio managers and the degree of risk aversion of these investors. This risk aversion remains high, for reasons not unconnected with the risk aversion of consumers and investors which Gourinchas and Rey describe. The analysis will also require a careful analysis of the effects of the leverage constraints which impinge upon investors’ behaviour. These constraints remain significant. And they are being tightened by the increasing capital requirements which are being imposed on banks by regulators in many countries. The outcome of such an analysis would enable us to determine not just the risk premium to insert in the UIP equation, but also the extent to which the interest rate to be used in the analysis of the IS shock, described in the previous paragraph, would lie above the risk-free interest rate because of the deleveraging process.
Going beyond the authors’ analysis, I want to suggest that there is a third additional reason for the low level of real interest rates: fiscal austerity in the pursuit of a lower level of public debt. And I want to suggest that this extra reason interacts with the two reasons provided by Gourinchas and Rey.
164 See a recent paper by Laurence Summers and others for a sophisticated and helpful version of such an
analysis (Eggertsson, Mehrotra, Singh and Summers (2016)).

ECB Forum on Central Banking, June 2016 118
The shock of the global financial crisis in 2008 led to a reduction of interest rates at the end of that year, and to significant fiscal discretionary expansion at the London G20 summit of April 2009 – equal to about 2% of global GDP. But there had also been a very significant decision taken at the G20 summit in Washington at the end of 2008, when it was decided that policymakers would allow the automatic stabilizers to operate and so allow fiscal deficits to rise as activity fell and fiscal revenues collapsed. This decision was perhaps three or four times as important as the discretionary decision taken in April 2009 to positively stimulate GDP. Given the size of the deleveraging shock, these fiscal responses, both discretionary and automatic, were insufficient to prevent the zero bound for interest rates from being reached. But they were important in preventing an even larger downturn.
Nevertheless, at the G20 summit in Toronto in June 2010, it was decided that fiscal policy should cease to be expansionary and should begin to be concerned with reducing public sector deficits and preventing further rises in public debt. This decision – to cooperate in the pursuit of austerity – has had disastrous effects on the world economy (Vines (2016a)).
I have analysed the macroeconomic effects of this fiscal policy choice in a paper written with a colleague, Christopher Allsopp (Allsopp and Vines (2015)). Here is a brief summary of the argument which Allsopp and I present. We use a Tinbergen-Meade targets-and-instruments framework to think about what has happened.
During the Great Moderation, a single policy instrument – monetary policy – was used to manage aggregate demand in the pursuit of a single policy objective – the inflation rate. Such “one-target-one-instrument” macroeconomics succeeded well in what it was designed to do – manage aggregate demand so as to stabilise inflation, and, subject to that being achieved, to stabilise aggregate demand around its non-inflationary level. But with the addition of an objective for public debt, two objectives of macroeconomic policy became important: managing the level of public debt as well as managing aggregate demand. However, only one instrument of policy was available, fiscal policy, once the interest rate had reached its zero bound.165 This situation created a policy conflict, since one policy instrument cannot, in general, ensure that two targets are achieved. As a result, an attempt was made to invent an additional monetary policy instrument, namely quantitative easing, or QE. But a prisoner's dilemma situation quickly emerged between countries, with exchange rate warfare, and lower long-term rates worldwide, as a consequence.
In an open economy, QE not only increases aggregate demand by lowering long-term interest rates. It also depresses the exchange rate and so increases aggregate demand by diverting demand from abroad to the home country. The prisoner’s dilemma outcome has been one in which each country seeks to use fiscal consolidation to stabilise its level of public debt, whilst using QE as a compensating measure to boost aggregate demand, so as to replace the demand lost through its policy of austerity. The intention has been to create compensating increases in demand both through the effects of lower long-term interest rates and through an increase in net exports. But in fact the compensating effects 165 In normal times, during the Great Moderation, two instruments – both monetary policy and fiscal policy –
were used to stabilise both of the two objectives of inflation and public debt. But at the zero bound this ceased to be possible.

ECB Forum on Central Banking, June 2016 119
of the QE on aggregate demand, worldwide, have largely cancelled out across countries. These effects could only fail to have cancelled out if the QE – which can no longer divert demand from one country to another because all act together– were to significantly increase aggregate demand as a result of the lowering of long-term real interest rates. But this does not seem to have happened. As a result, the outcome of this fiscal-monetary policy mix, in all countries taken together, has been a Nash equilibrium, with lower global aggregate demand (caused by the fiscal austerity), with lower long-term global interest rates (caused by the QE), and with much less of an effect on stabilising the level of public debt than had been expected. Casting the discussion within a targets-and-instruments framework – in the way that I have done – enables one to see these outcomes very clearly.
This argument – that the policies of fiscal austerity have been at least partly responsible for the low level of global real interest rates – gains extra traction when we see how it interacts with the two reasons for the low level of global real interest rates put forward by Gourinchas and Rey, which I discussed earlier.
First of all, the conduct of fiscal policy in this manner – directed towards the stabilisation of public debt – has meant that there is no longer a policy in each country which is taking effective responsibility for the management of aggregate demand. During the Great Moderation there was a policy with that responsibility: monetary policy. However, once interest rates reached their zero bound this ceased to be the case. The level of aggregate demand which emerges in this situation in any one country is simply the Nash equilibrium of the contractionary game which I have just described. It is easy to see that such an unmanaged outcome might undermine the confidence of consumers and investors.
Secondly, this failure to manage the economy effectively has also been part of the reason for the deleveraging which has been undertaken by financial institutions, portfolio managers and consumers. During the Great Moderation, the kind of confidence which underpinned the high levels of consumption and investment during that period was partly based on the knowledge that the economy was being well managed. These high levels of consumption and investment led to high levels of consumer debt, and to large increases in the leverage of financial institutions. Such confidence that the economy is being well managed is no longer present. It seems that the absence of an effective policy framework in which to have confidence has contributed to the vulnerability of portfolio allocation decisions to large shifts in risk aversion. This has rendered the world economy much more vulnerable to the Triffin problem described earlier in these comments.
We can summarise this discussion by saying that all three reasons for the continuation of low levels of global real interest rates – and low levels of global aggregate demand – seem important. And they all seem to be interrelated.
As Mario Draghi said in his opening address to the Sintra conference, in these circumstances there is a need for international alignment of monetary policy, fiscal policy and structural reforms.166 Draghi did not explicitly describe the outcome, in the absence of such cooperation, as that of a prisoners’ dilemma. But the point – although implicit – was clear in what he said.
166 See http://www.ecb.europa.eu/press/key/date/2016/html/sp160628.en.html
ECB Forum on Central Banking, June 2016 120
The effects of any such cooperation in present circumstances would – in my judgement – necessarily involve a loosening of fiscal austerity. The analytical basis of my judgement rests on the targets-and-instruments/prisoners’-dilemma framework which I have just described.167 This is a judgement which appears to have been supported – albeit implicitly – by Mario Draghi in his talk. Until such a call for a loosening of fiscal austerity is heeded, it does seem likely that real interest rates, and global aggregate demand, will remain at low levels.
The “two-in-five policy” promoted by Australia in 2014, when Australia chaired the G20, was designed to push towards a loosening of fiscal austerity. This policy involved a collaborative effort to increase infrastructure investment, alongside the supply-side reforms advocated by the supporters of austerity, in order to raise global demand, and thus global growth. Calculations performed at the time suggested that the actions promised at the Brisbane summit in November 2014 might well increase the level of global output by 2% over a period of five years from 2013 to 2018; hence the “two-in-five” banner. Subsequent calculations have suggested that what has actually been done since that meeting has been significant (Vines (2015b)). The commitment established at Brisbane to this two-in-five policy framework was allowed to slip by Turkey when that country chaired the G20 in 2015. It should be re-emphasised by China (Vines (2016b)); the explicit mention of the Brisbane commitments in the communiqué from the July 2016 G20 leaders’ deputies meeting in Chengdu suggests that China has picked up the necessary baton.
5 Conclusion: are these ideas always relevant?
It is important not to be blown away by the wake-up call which is presented in this paper, and in Hélène Rey’s earlier work.
We must remember that floating exchange rates can move in ways which appear sensible, i.e. that exchange rates can move in the way in which they would move in an MFD world. And such exchange rate movements can, as part of an overall policy-making system, be sufficient to isolate a country from the global financial cycle. The isolation may not be complete, but such isolation may be achieved to a considerable extent. And of course there are other shocks as well from which a country will need protection. But such protection can also be achieved as well, again partly through exchange rate movements.
Australia is a spectacular example of a country which has achieved such isolation and protection. Australia has successfully used its floating exchange rate regime to make possible its independent monetary policy. And that monetary policy has steered Australia’s growth process through four successive decades. During this turbulent period the Australian economy has experienced four major macroeconomic shocks, one in each decade: the liberalisation of Australia’s external trade which began in 1984; the East Asian financial crisis which struck in 1997-08; the GFC in 2007-09; and the collapse of global
167 Of course any such loosening would need to be accompanied by a clear commitment to fiscal sustainability in
the longer term, something which is easier to talk about than to actually implement.

ECB Forum on Central Banking, June 2016 121
primary commodity prices in 2014-15. The policy outcomes have been remarkably successful.
After each one of these major negative shocks to aggregate demand, movements in the exchange rate played a major role in defending the country against the effects of the shock. In each case the exchange rate depreciated to a very significant extent, and thereby helped to maintain the growth process. But movements in the exchange rate did this only because they formed part of a coherent overall macroeconomic policy-making system.168 That system included the following three features.
(i) Monetary policy focused on targeting inflation, so that following a large currency depreciation the inflation rate nevertheless remained stable. This feature was important in 1997, and in 2007-2008, and was also important recently.
(ii) A degree of fiscal discipline was maintained which – compared with that in most other countries – was both rigorous and free from excessive political influence. This meant that the temporary effects of the shocks on the fiscal position did not lead to fiscal blowout and so to the imposition of risk premia constraining the recovery process. This feature has been important in the years since the GFC.
(iii) Financial regulation operated in a broadly satisfactory manner, so that, in particular, currency depreciation did not create a debt crisis due to the “original sin” of borrowing in foreign currency in an unhedged manner. This feature has also been important in the years since the GFC.
This has been overall a subtle and sophisticated policy system, and the outcomes have been remarkably successful. But the conclusion which should be drawn is that something as subtle and sophisticated as this is necessary – along with floating exchange rates – if an independent monetary policy is to be achieved. Australia’s experience should not be taken as somehow validating the conventional wisdom that countries can rely on protecting themselves from the global credit cycle merely by floating their exchange rates. The Australian case shows that isolation from the global financial cycle is possible. But it also shows that such isolation is difficult.
In conclusion, the features of international asset markets which give rise to the global financial cycle do seem important for most countries. Gourinchas and Rey have shown in their paper that these features are giving rise to a twenty-first-century Triffin problem. And they have also shown that these same features have significant implications for the problem of low world real interest rates. That is why this paper is important.
References
Allsopp, C. and Vines, D. (2015), “Monetary and fiscal policy in the Great Moderation and the Great Recession”, Oxford Review of Economic Policy, pp. 134-167.
168 For an extended discussion of the reasons why Australia has been able to do this, see Vines (2016c).

ECB Forum on Central Banking, June 2016 122
Eggertsson, G., Mehrotra, N., Singh, S. and Summers, L. (2016), “A contagious malady? Open economic dimensions of secular stagnation”, NBER Working Paper, No 22299.
Kouri, P. (1981), “Balance of payments and the foreign exchange market: A dynamic partial equilibrium model”, NBER Working Paper, No 644.
Meade, J. (1951), The Balance of Payments, London, Chatham House and Oxford University Press.
Rey, H. (2015), “Dilemma not trilemma: the global financial cycle and monetary policy independence”, NBER Working Paper, No 21162.
Rey, H. (2016), “International Channels of Transmission of Monetary Policy and the Mundellian Trilemma”, IMF Economic Review, forthcoming.
Smith, D. (2016), Trouble with the Trilemma: The Management of External Shocks in a Financially Integrated Economy, M.Phil thesis, Oxford University.
Swan, T. (1963), “Longer Run Problems of the Balance of Payments” in Arndt, H. and Corden, W. (eds.), The Australian Economy: a Volume of Readings, Melbourne, Cheshire Press, pp. 384-395. Reprinted in Caves, R. and Johnson, H. (eds.), Readings in International Economics (1968), Homewood, Irwin.
Temin, P. and Vines, D. (2013), The Leaderless Economy: Why the World Economic System Fell Apart and How to Fix It, Princeton, Princeton University Press.
Temin, P. and Vines, D. (2014), Keynes: Useful Economics for the World Economy, Cambridge, Mass. and London, MIT Press.
Vines, D. (2015a), “Impossible Macroeconomic Trinity: The Challenge to Economic Governance in the Eurozone”, Special Issue, Journal of European Integration, Vol. 37, No 7.
Vines, D. (2015b), “Cooperation between countries to ensure global economic growth: a role for the G20?”,13th Heinz Arndt Memorial Lecture, Australian National University, 17 September 2014, Asia Pacific Economic Literature, Vol. 29, Issue 1.
Vines, D. (2016a), “On Concerted Unilateralism: when international macroeconomic cooperation is helpful and when it is not”, in Bayoumi, Pickford and Subacchi (eds.) Managing Complexity: Economic Policy Cooperation after the Crisis, pp. 17-48, Washington, Brookings Institution.
Vines, D. (2016b), “Chinese leadership of macroeconomic policymaking in a multipolar world”, China Economic Review, forthcoming.
Vines, D. (2016c), “Individuals, Institutions, and Ideas: Macroeconomic Policymaking in Australia from Federation to 2020”, Harcourt Lecture, University of Adelaide, 29 September.
Vines, D. (2016d), “Fiscal Governance: How Can the Eurozone Get What It Needs?” Journal of Financial Regulation, Vol. 2, Issue 1.
Woodford, M. (2007), “Globalization and monetary control”, NBER Working Paper, No 13329.

ECB Forum on Central Banking, June 2016 123
The IMF’s power and constraints By Anne O. Krueger169
Barry Eichengreen has outdone himself in preparing a comprehensive and excellent presentation and assessment of the issues surrounding the functioning of the international monetary system.
I found myself strongly in agreement with almost all of his analysis and conclusions. But the role of a panelist is to elaborate on, or raise questions, about the subject, not simply to praise Barry. So I shall organize my remarks around two sets of related, but different, issues. The first pertains to how the system now functions with respect to the policies and macroeconomic/financial situations of individual countries. The second concerns the functioning of the system as a whole.
A well-functioning international monetary system needs two things: individual countries (and especially large ones) must be stable; and there need to be arrangements in place to address the consistency and stability of the system as a whole.
The International Monetary Fund (IMF) is the international institution tasked with these roles. Until the 1990s, the G7 (Canada, France, Germany, Italy, Japan, the United Kingdom and the United States) coordinated among themselves and worked (largely through the IMF) on the second issue. The IMF handled the first.
The IMF conducts regular surveillance of its member countries – larger ones on an annual cycle and some smaller ones less frequently unless problems are apparent. The surveillance reports are presented to the authorities during their preparation and there is naturally some “sanitizing” of the published documents. But, while these reports usually identify the appropriate issues, the IMF has no power to enforce changes and the degree to which the authorities heed the advice of the IMF is their decision. The IMF gains power only when a crisis arises either because IMF (and other) warnings went unheeded or because unforeseen shocks led to a crisis.
When crises do arise, the IMF’s analyses can be far more effective because the crisis-afflicted country normally finds itself with serious financing difficulties (either for the flow of imports, for its ability to borrow on international markets and/or to service and roll over its debt). At that point, the IMF’s “core competence” comes to the fore. According to the Articles of Agreement, the IMF cannot lend unless it is assured that the country will be able to meet its financial obligations going forward. That, in turn, generally requires macroeconomic projections of future public finances and government budgets, at least over the subsequent few years.
Of course, a crisis arises because of deficiencies with existing policies, and projections of future financing needs usually show that they will not be met unless policies are adjusted. Since build-ups of fiscal deficits are a major reason for crises (either because of inflation at fixed exchange rates or because of high levels of debt), the IMF staff and country officials 169 Johns Hopkins University.

ECB Forum on Central Banking, June 2016 124
work to develop a reasonable set of changes in macroeconomic and other policies (such as adjusting prices in public sector enterprises to reduce their deficits).
When financing options are limited, the authorities are usually in sufficient difficulty that they accept the “conditionality” associated with the program. In some cases, of course, policymakers fail to recognize the magnitude of their difficulties, but in those cases there is no IMF program until a later date. Venezuela comes to mind as a current case in point.
Until the 1990s, most crises in developing countries were “foreign exchange crises” and by the 1980s, rich countries were not confronted with situations in which they needed IMF support (although surveillance, of course, continued). Debt crises were not seen as a significant problem because most debt was to the official sectors, and the creditor countries in cooperation with each other and through the Paris Club could reschedule debt. At the same time, most developing countries adopted fixed exchange rates and hence the “foreign exchange crises” were the symptom of underlying problems.
To be sure, IMF programs were not perfect. In part, this was because the agreed-upon program was in some sense a minimal program that could be expected to succeed only if the underlying conditions were as assumed (and the world did not, for example, fall into recession) and the program was faithfully carried out.170 But in many instances, the country’s leaders were at best reluctant adherents to the agreed-upon program and often fell short in execution. One of the lessons the international community has learned is the importance of “ownership” if the program is to succeed. Many tranches of IMF funds have been delayed (and even programs cancelled) as earlier agreed-upon policy actions had not yet been undertaken.
Normally, with “foreign exchange crises” in the first half century of the Fund’s existence, exchange rate and fiscal adjustments could restore a country’s financing within a period of several years.
But once private lending to sovereigns (and businesses) denominated in foreign exchange mushroomed in the 1990s, the challenge of restoring sustainability was more daunting. In many instances, policy adjustments can restore macroeconomic and financial equilibrium and Fund financing can enable a country to regain access to markets.
In other cases, some degree of restructuring of debt is necessary. When that happens, the situation is more complicated as there are often significant delays in achieving appropriate policy adjustment and obtaining agreement with creditors to restructure debt.
These difficulties have sometimes led to much higher costs to the crisis-inflicted country than might have been incurred had a more rapid process for restructuring occurred. Nonetheless, in most cases countries have not been sufficiently systemic to affect the system as a whole and eventually the crisis was resolved and growth could resume.
At the present time, the international community is focused on Greek debt, despite the fact that private debt was restructured in 2012 (two years after the onset of the crisis). 170 Another important factor has been the political perspective of important creditor countries. In more than a
few instances, the IMF has been pressured to lend despite dubious prospects of success.

ECB Forum on Central Banking, June 2016 125
Obviously, Greece cannot service her existing debt unless growth resumes and it is questionable whether growth can resume without debt restructuring. The role of the IMF in the Greek crisis has been as part of the “troika” of the ECB, the eurozone countries, and the IMF. Greek membership in the eurozone has meant that devaluation was not an option. But, in addition, a challenge going forward is how a global institution such as the IMF can and should function in partnership with regional bodies.
Unless and until there is a significant change in a crisis-afflicted willingness to reform policies and the creditor nations are willing to witness prolonged crises when reforms do not appear sufficient, it is difficult to see how the IMF can do much more in cases of country crisis. When the country is part of a regional economic arrangement such as the eurozone, that presents still further challenges.
On the whole, however, it must be judged that the IMF has done a reasonably good job of diagnosing needed policy reforms and supporting them, given political constraints. There has been learning on the part of the IMF and the entire international community about crises and their resolution, and that will no doubt continue.
The second issue – finding a way to assess the coherence and stability of the international monetary system as a whole – is one on which it is easy to agree with Barry Eichengreen that current arrangements fall short. The problem is not new. Countries in current account or overall financial surplus have much weaker incentives for policy adjustment than do those in deficit. The problem was recognized by Keynes, and the Fund’s Articles do contain a “scarce currency clause” by which other Fund members could discriminate against a country in continuing surplus. But the clause has never been invoked and is ineffective.
The Fund has on occasion attempted to address the issue. A decade ago, it was widely recognized that the United States was incurring a large current account deficit, the United Kingdom a smaller one, and China, Japan, and the oil exporters large surpluses. The Fund convened meetings with the large deficit and surplus countries. There was no difficulty achieving agreement that adjustment was needed. But there was total disagreement as to which countries should undertake the adjustments, with the surplus countries believing that the deficit countries should adjust and with the deficit countries asserting that the surplus countries needed to take measures.
That initiative was followed by an effort of the G20 to have large countries present their macroeconomic and financial programs and projections to the IMF, which in turn was to use them to assess their consistency and the macroeconomic adjustments that were needed. This plan, known as the MAP (macroeconomic assessment plan) brought forth anodyne presentations and, to my knowledge, not a single adjustment of a policy parameter.
While Barry’s call for a World Central Bank is clearly warranted, I fear that it is not at all realistic – at least for the foreseeable future. Even if such an institution could be established, it is impossible to imagine the political pressures on it. One need only think of domestic pressures in almost all countries for tightening and or easing monetary policy to see the problem. Even within countries, central bank independence has become accepted to try to insulate the central bankers in those countries from political pressures. Primary
ECB Forum on Central Banking, June 2016 126
commodity-producing developing countries would almost certainly want easier monetary policies than would most industrial countries, and the determination of interest rates would surely be politically charged.
But even if a World Central Bank might function once in place, the only way it could be inaugurated would be through an international treaty similar to the Articles of Agreement (or amendments to the Articles). I find it impossible to imagine an effort to agree to such a treaty or amendment that would not result – if it could result in anything – in a seriously worse arrangement than that permitted by the IMF Articles.
Perhaps after several more severe international financial crises, world leaders will be willing to contemplate changes to the global system along the lines suggested by Barry. But in the present environment, the best that can be hoped for, I think, is incremental change to enable smoother adjustments within the existing framework.

ECB Forum on Central Banking, June 2016 127
International monetary challenges and responses By Maurice Obstfeld171
This short essay attempts to reconcile two perspectives on key international monetary challenges: a flow approach based on net saving and investment, and a stock approach based on gross asset and liabilities. These approaches provide different, though complementary, lenses on macroeconomic developments generally. But they are specifically relevant to international adjustment issues, as I have argued elsewhere (Obstfeld (2012)).
1 Complex interactions among shocks, current account balances, and exchange rates
From a historical perspective, as shown in Chart 1, it is clear that there was a buildup in global current account imbalances leading up to the Global Financial Crisis. The Global Financial Crisis triggered a sharp contraction in these global imbalances, but now, in more recent years, we see again a slight widening. Despite some switches in the current account position of oil exporters, which were traditionally surplus countries but now are registering deficits, global imbalances are expanding. Certainly China, Japan, as well as some countries in the euro zone (Germany and the Netherlands) are moving into larger surplus, while the United States is moving into a larger deficit. In this context, one question one could ask – a question that leads into a broader discussion of monetary issues in the next section – is: what will be the implications for exchange-rate adjustment?
Current account balances and exchange rate movements
An uncomfortable reality for international macroeconomists is that the raw data on current accounts and exchange rates show little that looks like the textbook prediction that current account surpluses will lead to an appreciation of the currency. For example, Chart 2 shows that the best case you can make for this association is probably for China;
171 Economic Counsellor and Director of the Research Department of the International Monetary Fund. I thank
Eugenio Cerutti for suggestions; all opinions and errors are mine alone.
Chart 1 Evolution of global current account imbalances
(percentage of world GDP)
Sources: IMF, World Economic Outlook; and IMF staff calculations.
-3
-2
-1
0
1
2
3
01 02 03 04 05 06 07 08 09 10 11 12 13 14 15 16P
United StatesChinaGermany/NetherlandsJapaneuro area (other)United Kingdom
surplus advanced economies (AEs)oil exporterscommoditiy-exporting AEs deficit emerging marketsrest of the worlddiscrepancy

ECB Forum on Central Banking, June 2016 128
but, of course, China has not had a floating exchange rate – much of the evolution in Chart 2 is driven by US dollar dynamics – and it is not subject to the same asset-market shocks as the other large countries that the figure includes. This problem has recently been highlighted in the press, where some journalistic accounts have claimed that current accounts and exchange rates are no longer linked. But I think that is the wrong conclusion to draw from these sorts of pictures.
Chart 2 REER and current account of selected economies, 2001-16
(REER as index1, average 2001-16 = 100; current account as percentage of GDP2, right-hand scale)
Sources: IMF, World Economic Outlook; IMF; Information Notice System; and IMF staff calculations. 1) Data run up to May 2016. 2) Data run until 2015.
In the IMF, we have produced some analysis that shows a link, in the sense that the demand curve for a country’s products still slopes downward with respect to real effective exchange rates (REER) (see the October 2015 World Economic Outlook, Chapter 3). Reproducing evidence from the IMF’s 2016 External Sector Report (IMF (2016)), Chart 3 shows, for 2015, a bivariate relationship between REER and exports quite consistent with the textbook view. But as a general matter, there are many shocks that can shift that demand curve, complicating the observed relation between exchange rates and current accounts.
-6
-4
-2
0
2
4
6
8
10
12
60
70
80
90
100
110
120
130
140
150Current account as % of GDP (right-hand scale)
REER
2001
2016
ChinaUnited Stateseuro areaJapanUnited Kingdom
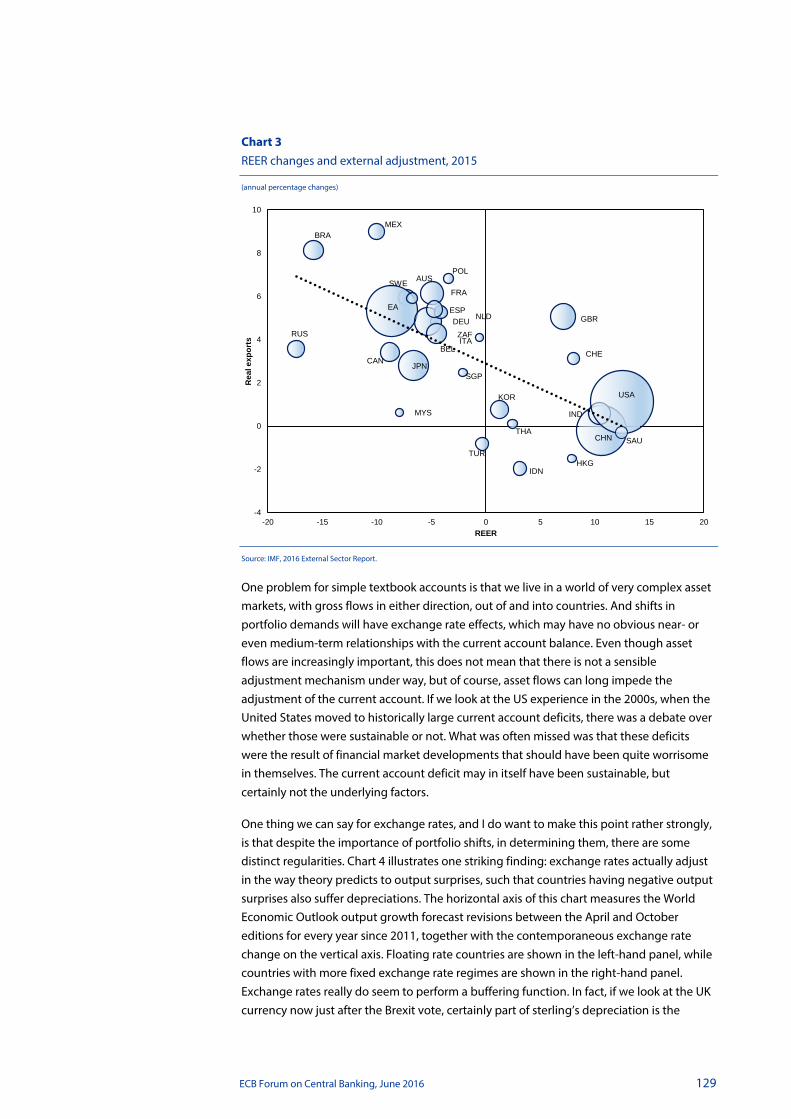
ECB Forum on Central Banking, June 2016 129
Chart 3 REER changes and external adjustment, 2015
(annual percentage changes)
Source: IMF, 2016 External Sector Report.
One problem for simple textbook accounts is that we live in a world of very complex asset markets, with gross flows in either direction, out of and into countries. And shifts in portfolio demands will have exchange rate effects, which may have no obvious near- or even medium-term relationships with the current account balance. Even though asset flows are increasingly important, this does not mean that there is not a sensible adjustment mechanism under way, but of course, asset flows can long impede the adjustment of the current account. If we look at the US experience in the 2000s, when the United States moved to historically large current account deficits, there was a debate over whether those were sustainable or not. What was often missed was that these deficits were the result of financial market developments that should have been quite worrisome in themselves. The current account deficit may in itself have been sustainable, but certainly not the underlying factors.
One thing we can say for exchange rates, and I do want to make this point rather strongly, is that despite the importance of portfolio shifts, in determining them, there are some distinct regularities. Chart 4 illustrates one striking finding: exchange rates actually adjust in the way theory predicts to output surprises, such that countries having negative output surprises also suffer depreciations. The horizontal axis of this chart measures the World Economic Outlook output growth forecast revisions between the April and October editions for every year since 2011, together with the contemporaneous exchange rate change on the vertical axis. Floating rate countries are shown in the left-hand panel, while countries with more fixed exchange rate regimes are shown in the right-hand panel. Exchange rates really do seem to perform a buffering function. In fact, if we look at the UK currency now just after the Brexit vote, certainly part of sterling’s depreciation is the
AUS
BEL
BRA
CAN
CHN
EA
FRA
DEU
HKG
IND
IDN
ITA
JPN
KOR
MYS
MEX
NLD
POL
RUS
SGP
ZAF
ESP
SWE
CHE
THA
TUR
GBR
USA
SAU
-4
-2
0
2
4
6
8
10
-20 -15 -10 -5 0 5 10 15 20
Rea
l exp
orts
REER

ECB Forum on Central Banking, June 2016 130
exchange rate’s adjustment to suddenly lower growth expectations. Many other things are going on as well – but if we imagine what the United Kingdom would look like the week after the Brexit vote were it attempting to defend a fixed exchange rate, we can appreciate the buffering role of floating rates.
Chart 4 Currency adjustments and growth forecast revisions in emerging markets1
Floating FX regimes Fixed FX regimes
(x-axis: revision in one-year ahead World Economic Outlook GDP growth forecast (percentage point difference); y-axis: change in NEER2 (percentage)
Sources: IMF, World Economic Outlook; IMF; Information Notice System; and IMF staff calculations. 1) 29 largest emerging market economies. 2) Positive change in NEER denotes appreciation.
Vulnerabilities and gross inflows
Let me come back to the issue of gross flows, because I think it has become a central one, not just for thinking about global financial stability, but for thinking about monetary policy as well. The net current account disguises massive two-way flows, a theme very much highlighted in the paper presented by Pierre-Olivier Gourinchas and Hélène Rey at this conference (Gourinchas and Rey (2016)), and it is also reflected in Chart 5 in the comparatively high variability in gross financial flows. Another way to proceed is to consult the stock data, such as the Lane and Milesi-Ferretti data shown in Chart 6. Here, we see the well-known patterns for advanced economies, particularly an explosion in gross external assets and liabilities relative to GDP, with a qualitatively similar albeit much less dramatic change for the emerging markets. It is here in these gross positions that the financial stability risks reside – much less so in the net current account balance. For example, when we look at the United Kingdom today and observe that it has a very large current account deficit, that is potentially worrisome – but perhaps less so than the absolute magnitudes on the liability side of its very large balance sheet, which amounts to several times GDP.
y = 3.3871x - 3.1039R² = 0.1718
-25
-20
-15
-10
-5
0
5
10
-3 -2 -1 0 1 2
201120122013
20142015
y = -0.0824x - 0.6387R² = 0.0002
-40
-30
-20
-10
0
10
20
-6 -4 -2 0 2 4
201120122013
20142015
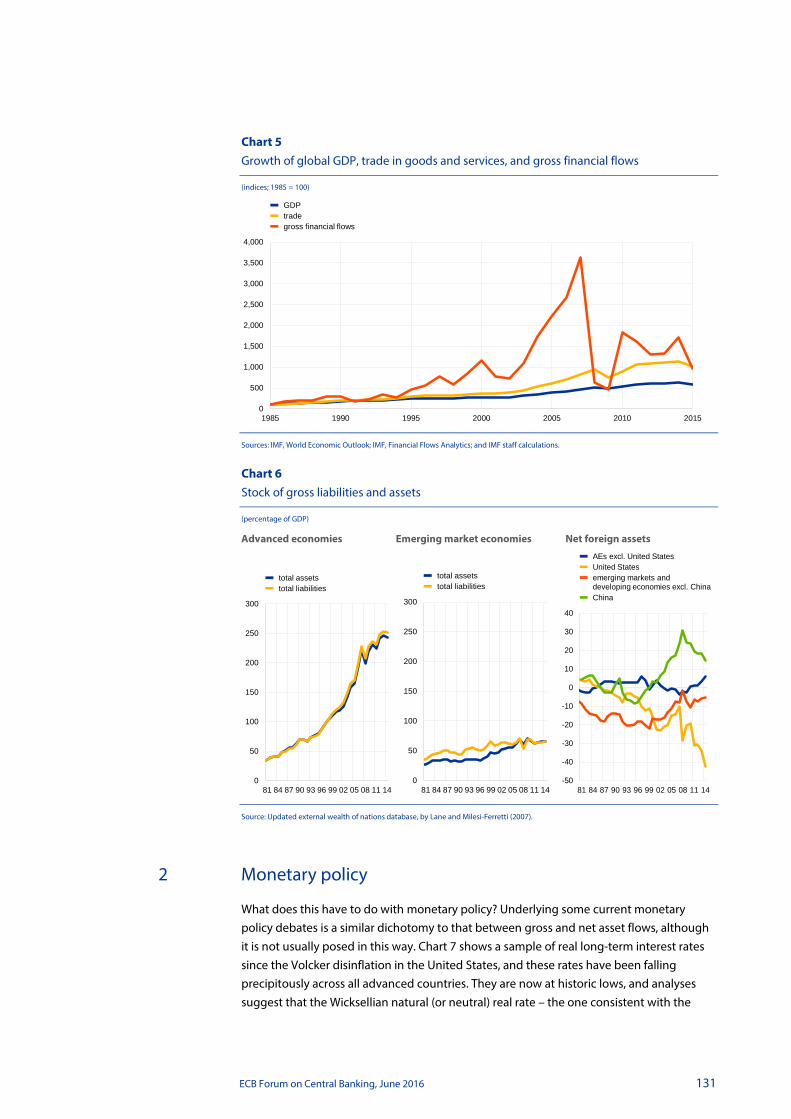
ECB Forum on Central Banking, June 2016 131
Chart 5 Growth of global GDP, trade in goods and services, and gross financial flows
(indices; 1985 = 100)
Sources: IMF, World Economic Outlook; IMF, Financial Flows Analytics; and IMF staff calculations.
Chart 6 Stock of gross liabilities and assets
(percentage of GDP)
Advanced economies Emerging market economies Net foreign assets
Source: Updated external wealth of nations database, by Lane and Milesi-Ferretti (2007).
2 Monetary policy
What does this have to do with monetary policy? Underlying some current monetary policy debates is a similar dichotomy to that between gross and net asset flows, although it is not usually posed in this way. Chart 7 shows a sample of real long-term interest rates since the Volcker disinflation in the United States, and these rates have been falling precipitously across all advanced countries. They are now at historic lows, and analyses suggest that the Wicksellian natural (or neutral) real rate – the one consistent with the
0
500
1,000
1,500
2,000
2,500
3,000
3,500
4,000
1985 1990 1995 2000 2005 2010 2015
GDPtradegross financial flows
0
50
100
150
200
250
300
81 84 87 90 93 96 99 02 05 08 11 14
total assetstotal liabilities
0
50
100
150
200
250
300
81 84 87 90 93 96 99 02 05 08 11 14
total assetstotal liabilities
-50
-40
-30
-20
-10
0
10
20
30
40
81 84 87 90 93 96 99 02 05 08 11 14
AEs excl. United StatesUnited Statesemerging markets and developing economies excl. ChinaChina

ECB Forum on Central Banking, June 2016 132
equality of global saving and investment at full employment – may be at a very low level persistently, heavily driving the monetary policy stances that a number of central banks have adopted. Potential explanations include the global ex ante excess of saving over investment, monetary policies themselves, uncertainty – the world is much more risky than before the Global Financial Crisis, along multiple dimensions – safe asset shortage, demographics, and low expectations of technological progress.
Chart 7 10-year real interest rate in advanced economies
(quarterly; percentages)
Sources: IMF, Global Data Source; Bloomberg L.P.; and Consensus Forecasts. Note: Calculated as nominal 10-year bond yields minus 10-year ahead CPI inflation forecast (Consensus Forecasts).
There is another story out there, which is that monetary policy drives global liquidity surges, particularly dollar liquidity, and the theory is buttressed by the notion that a lot of lending in the world is denominated in US dollars, even outside of the United States, where euro area banks play a key role intermediating dollar credit (see Chart 8).
-2
-1
0
1
2
3
4
5
6
7
8
90 92 94 96 98 00 02 04 06 08 10 12 14
interquartile range
United StatesGermany
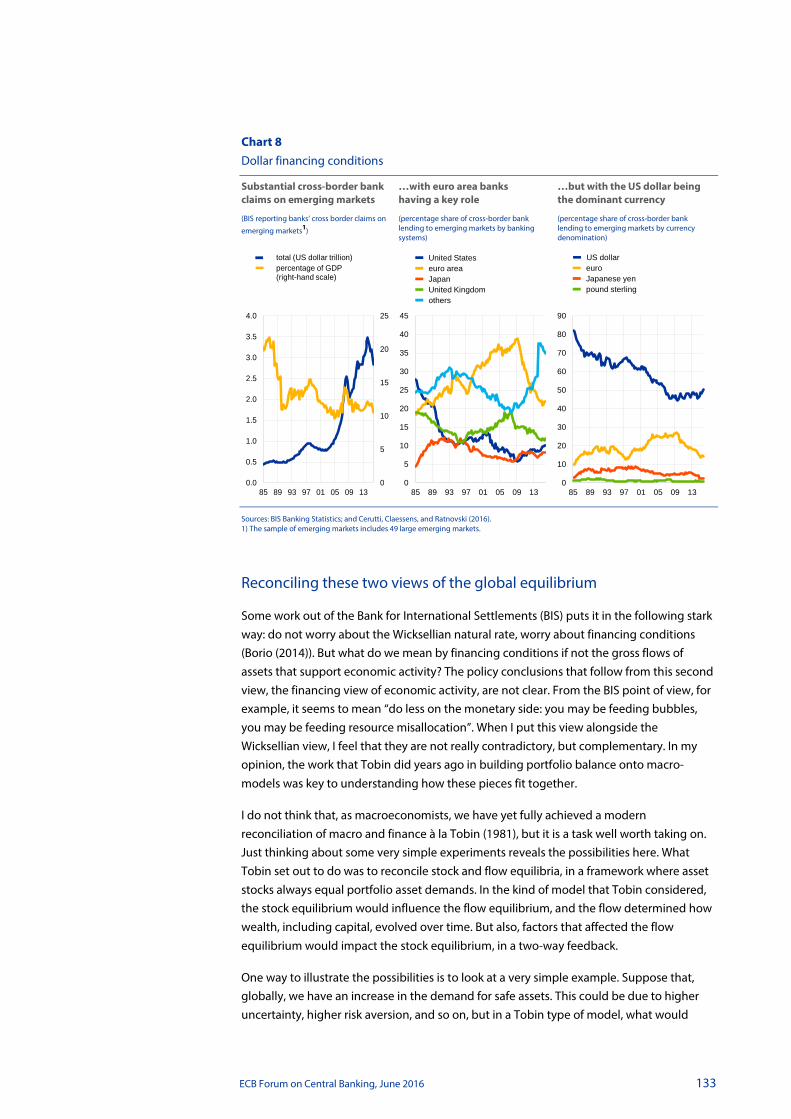
ECB Forum on Central Banking, June 2016 133
Chart 8 Dollar financing conditions
Substantial cross-border bank claims on emerging markets
…with euro area banks having a key role
…but with the US dollar being the dominant currency
(BIS reporting banks’ cross border claims on
emerging markets1) (percentage share of cross-border bank lending to emerging markets by banking systems)
(percentage share of cross-border bank lending to emerging markets by currency denomination)
Sources: BIS Banking Statistics; and Cerutti, Claessens, and Ratnovski (2016). 1) The sample of emerging markets includes 49 large emerging markets.
Reconciling these two views of the global equilibrium
Some work out of the Bank for International Settlements (BIS) puts it in the following stark way: do not worry about the Wicksellian natural rate, worry about financing conditions (Borio (2014)). But what do we mean by financing conditions if not the gross flows of assets that support economic activity? The policy conclusions that follow from this second view, the financing view of economic activity, are not clear. From the BIS point of view, for example, it seems to mean “do less on the monetary side: you may be feeding bubbles, you may be feeding resource misallocation”. When I put this view alongside the Wicksellian view, I feel that they are not really contradictory, but complementary. In my opinion, the work that Tobin did years ago in building portfolio balance onto macro-models was key to understanding how these pieces fit together.
I do not think that, as macroeconomists, we have yet fully achieved a modern reconciliation of macro and finance à la Tobin (1981), but it is a task well worth taking on. Just thinking about some very simple experiments reveals the possibilities here. What Tobin set out to do was to reconcile stock and flow equilibria, in a framework where asset stocks always equal portfolio asset demands. In the kind of model that Tobin considered, the stock equilibrium would influence the flow equilibrium, and the flow determined how wealth, including capital, evolved over time. But also, factors that affected the flow equilibrium would impact the stock equilibrium, in a two-way feedback.
One way to illustrate the possibilities is to look at a very simple example. Suppose that, globally, we have an increase in the demand for safe assets. This could be due to higher uncertainty, higher risk aversion, and so on, but in a Tobin type of model, what would
0
5
10
15
20
25
0.0
0.5
1.0
1.5
2.0
2.5
3.0
3.5
4.0
85 89 93 97 01 05 09 13
total (US dollar trillion)percentage of GDP(right-hand scale)
0
5
10
15
20
25
30
35
40
45
85 89 93 97 01 05 09 13
United Stateseuro areaJapanUnited Kingdomothers
0
10
20
30
40
50
60
70
80
90
85 89 93 97 01 05 09 13
US dollareuroJapanese yenpound sterling

ECB Forum on Central Banking, June 2016 134
happen? Well – Tobin’s q would fall, the risk-free rate of interest would fall, investment would fall, capital would fall over time (pulling down economic growth), the marginal product of capital would rise, and the risk-free rate would eventually partially recover as Tobin’s q recovered, but not completely. This is a world that, in broad outline if not in every detail, does not look too much different from where we are. If you look at measures of the excess return to capital, for example – what Hall (2016) calls the capital wedge, that is, capital earnings less the risk-free rate – these have risen. People ask why it is that with that wedge so high, investment is not higher. It could be because of a portfolio shift away from capital and a greater demand for risk-free assets in a riskier world.
3 Policies: more growth, more stability
This sort of world does indicate a policy agenda, one that addresses the lack of growth (namely, through a three-pronged approach that continues monetary support, while also deploying fiscal tools for supporting aggregate demand and well-sequenced structural reforms). But the policy agenda must also address financial stability concerns, as the BIS and others have warned. At the IMF, it is especially natural to worry about the global financial safety net as an integral part of the infrastructure of global financial stability. (See also Barry Eichengreen’s paper presented at this conference, Eichengreen (2016).) To make the latter more comprehensive, greater fiscal risk sharing is essential, not only within currency areas such as the euro zone, but even at the global level. Policymakers have not adequately faced up to that reality yet.
References
Borio, C. (2014), “The financial cycle and macroeconomics: What have we learnt?”, Journal of Banking and Finance, Vol. 45, pp. 182-198.
Cerutti, E., Claessens, S. and Ratnovski, L. (2016), “Global liquidity and cross-border bank flows”, presented at the 63rd Economic Policy panel meeting.
Eichengreen, B. (2016), “Global monetary order”, paper presented at the 2016 ECB Forum on Central Banking, Sintra, Portugal.
Gourinchas, P.-O. and Rey, H. (2016), “Real interest rates, imbalances and the curse of regional safe asset providers at the Zero Lower Bound”, paper presented at the 2016 ECB Forum on Central Banking, Sintra, Portugal.
Hall, R.E. (2016), “Macroeconomics of persistent slumps”, NBER Working Paper, No 22230, National Bureau of Economic Research, May.
International Monetary Fund (2015), “Exchange rates and trade flows: Disconnected?”, in World Economic Outlook: Adjusting to Lower Commodity Prices, October, pp. 105-142.
International Monetary Fund (2016), “2016 External sector report”, IMF policy paper, July.

ECB Forum on Central Banking, June 2016 135
Lane, P. and Milesi-Ferretti, G.M. (2007), “The external wealth of nations mark II: Revised and extended estimates of foreign assets and liabilities, 1970-2004”, Journal of International Economics, Vol. 73, pp. 223-250.
Obstfeld, M. (2012), “Does the current account still matter?”, American Economic Review, Papers and Proceedings, Vol. 102, pp. 1-23.
Tobin, J. (1981), “Money and finance in the macroeconomic process”, Nobel Memorial Lecture.

ECB Forum on Central Banking, June 2016 136
Three challenges facing emerging market monetary policymakers By Shang-Jin Wei172
I will speak about macroeconomic and monetary challenges from the perspective of emerging markets.
In the past, when we looked at global growth, focusing on the growth of advanced economies was perhaps enough since they were the bulk of the world economy anyway. Since 2001, however, China has become the world’s number one single country contributor to global growth. Indeed, China now accounts for about 35% of the world’s growth (see Chart 1). Since 2008, India has become the number two single country contributor to global growth, overtaking the United States. India now accounts for about 16% of world growth, higher than the United States’ 12% contribution. These calculations are based on purchasing power parity (PPP)-adjusted terms. If one does not make PPP adjustments, and use only market exchange rates, then the relative position between India and the United States will flip, i.e., the United States will be the number two contributor, and India will be number three. But China remains the largest single country contributor.
Chart 1 Contributions to world GDP growth
(percentages)
Sources: Asian Development Bank staff calculations from International Monetary Fund, World Economic Outlook April 2016 database.
Before we get into the macroeconomic policy challenges, let us first reflect on China’s growth slowdown in recent years. The slowdown is due to a combination of structural and transitory factors. One important structural factor is demographics: the absolute size of the
172 Chief Economist and Director General, Economic Research and Regional Cooperation Department, Asian
Development Bank. The views expressed in this chapter are those of the author and do not necessarily represent the views and policies of the Asian Development Bank or its Board of Governors, or of the governments they represent.
-40%
-30%
-20%
-10%
0%
10%
20%
30%
40%
1995 1997 1999 2001 2003 2005 2007 2009 2011 2013 2015
ChinaUnited StatesEuropean Union
JapanIndia

ECB Forum on Central Banking, June 2016 137
working age cohort has been declining since 2011. A second factor is rising wages and the standard convergence story. Precisely because the growth rate has been so high in the past, Chinese labor cost has increased very rapidly, overtaking many countries along the way so that, by now, Chinese labor cost is higher than that of India and Bangladesh, and most other developing countries. By necessity, it has to look for new ways to grow, something that is harder to do than growth based on low labor cost. Third, a change in the growth model with greater attention to environmental and social considerations is also bringing about a growth slowdown. Part of the change is in response to rising wages, and part of it is also due to government policies. These are the three most important structural factors.
There are also transitory factors causing the growth slowdown. Relatively weak global growth and a potentially overvalued real exchange rate of the Chinese renminbi have also contributed to the moderation in growth.
There are many challenges facing the economy, including high corporate sector debt, excess capacity in some of the sectors, and the possibility that undue pessimism is nonetheless becoming self-fulfilling.
In the second part of my remarks, I want to suggest three challenges that have implications for emerging market monetary policies. The first is aging. Aging used to be a problem or concern for developed countries, but has now become a problem for an increasing number of, although not all, emerging market countries. Second, many countries are simultaneously experiencing a producer price index (PPI) deflation, while still seeing moderately positive consumer price index (CPI) inflation. Third, changes in monetary policies of major, advanced countries could induce less than desirable policy changes in emerging markets.
1 Aging
In many countries, not only has the old dependence ratio dramatically increased in recent years but the workforce has also been shrinking in absolute size. The standard Taylor rule, which does not take into account demographic changes, could be too tight; that point was made by Fujita and Fujiwara (2015). It seems that aging is a relatively new phenomenon in emerging markets. Many central banks will now have to be prepared to make the switch to take into account the role of demographics in adjusting their monetary policies. Take the example of China, where we can see clearly the share of the 15–64 working age cohort starting to switch in 2014 and declining after 2014 (see Chart 2). If you look at the 15–59 cohort, the workforce size declined even earlier, just after 2011.
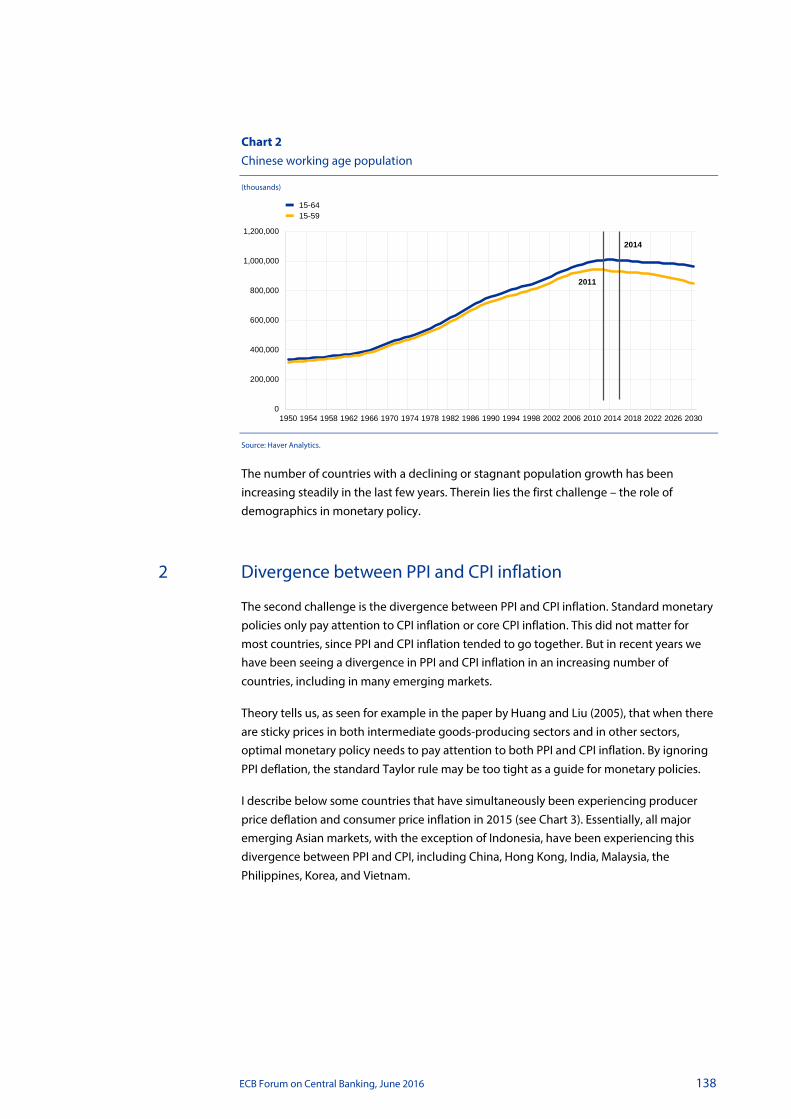
ECB Forum on Central Banking, June 2016 138
Chart 2 Chinese working age population
(thousands)
Source: Haver Analytics.
The number of countries with a declining or stagnant population growth has been increasing steadily in the last few years. Therein lies the first challenge – the role of demographics in monetary policy.
2 Divergence between PPI and CPI inflation
The second challenge is the divergence between PPI and CPI inflation. Standard monetary policies only pay attention to CPI inflation or core CPI inflation. This did not matter for most countries, since PPI and CPI inflation tended to go together. But in recent years we have been seeing a divergence in PPI and CPI inflation in an increasing number of countries, including in many emerging markets.
Theory tells us, as seen for example in the paper by Huang and Liu (2005), that when there are sticky prices in both intermediate goods-producing sectors and in other sectors, optimal monetary policy needs to pay attention to both PPI and CPI inflation. By ignoring PPI deflation, the standard Taylor rule may be too tight as a guide for monetary policies.
I describe below some countries that have simultaneously been experiencing producer price deflation and consumer price inflation in 2015 (see Chart 3). Essentially, all major emerging Asian markets, with the exception of Indonesia, have been experiencing this divergence between PPI and CPI, including China, Hong Kong, India, Malaysia, the Philippines, Korea, and Vietnam.
0
200,000
400,000
600,000
800,000
1,000,000
1,200,000
1950 1954 1958 1962 1966 1970 1974 1978 1982 1986 1990 1994 1998 2002 2006 2010 2014 2018 2022 2026 2030
2011
2014
15-6415-59

ECB Forum on Central Banking, June 2016 139
Chart 3 Producer price and consumer price inflation
(percentages)
a) producer prices
b) consumer prices
Source: CEIC Data Company.
This divergence of PPI and CPI inflation has also been a phenomenon observed in many advanced countries, including Japan, the euro zone, and the United States.
3 Changes in monetary policies of advanced countries
The third challenge is the choice of monetary policies in emerging markets when they face monetary policy changes in advanced countries that may not be optimal for emerging markets.
To be more precise, rich countries choose monetary policies in response to their own domestic needs, such as when dealing with the impact of Brexit, asset price bubbles, banking crises, or other financial crises. Emerging markets have to face the problem of whether they should import the policies of advanced countries or not.
-2 -1 0 1 2 3 4 5 6 7
China
Hong Kong, China
India
Indonesia
Malaysia
Philippines
Rep. of Korea
Singapore
Thailand
Vietnam
2015Dec-15
-12 -8 -4 0 4 8
China
Hong Kong, China
India
Indonesia
Malaysia
Philippines
Rep. of Korea
Singapore
Thailand
Vietnam
2015Dec-15
ECB Forum on Central Banking, June 2016 140
The traditional view that a flexible exchange rate regime can convey monetary policy autonomy has been challenged by the debate on the so-called trilemma versus dilemma. The trilemma view has been challenged in three ways: Calvo and Reinhart (2002) argue that developing countries often do not want to see a currency depreciation because of concerns about the domestic currency burden of foreign currency debt; Tong and Wei (2011) show that when it comes to studying the effects of global financial crises, particularly the spread of financial shocks to emerging markets, having a flexible exchange rate regime does not seem to help, but some form of capital control seems to be necessary; Rey (2015) shows that cross-border capital flows have strong contemporaneous correlations, with capital-flow patterns that are facing emerging market countries not seeming to depend on the nominal exchange rate regime.
The recent paper by Han and Wei (2016) suggests that perhaps there is a “2.5-lemma”. While a flexible exchange rate itself does not seem to convey much monetary policy autonomy, some form of capital control seems to be necessary. On the other hand, a combination of flexible exchange rate regime and capital control seems to provide the most buffer for emerging markets.
4 Summary
To summarize, emerging market economies face challenges in monetary policies, of which three are worth highlighting: (i) the newly emerging phenomenon of a declining workforce in many emerging markets; (ii) widespread PPI deflation and the divergence between the direction of producer prices and consumer prices; and (iii) dealing with involuntary imports of monetary policies from advanced countries.
References
Calvo, G.A. and Reinhart, C.M., (2002), “Fear of Floating”, The Quarterly Journal of Economics, Vol. 117, No 2, pp. 379-408.
Fujita, S. and Fujiwara, I., (2015), “Declining Trends in the Real Interest Rate and Inflation: Role of Aging”, Research Institute of Economy, Trade and Industry, Tokyo.
Han, X. and Wei, S.-J., (2016), “International Transmissions of Monetary Policy Shocks”, Asian Development Bank Working Paper.
Huang, K.X.D. and Liu, Z., (2005), “Inflation Targeting: What Inflation Rate to Target?”, Journal of Monetary Economics, Vol. 52, No 8, pp. 1435-1462.
Obstfeld, M., (2015), “Trilemmas and Tradeoffs: Living with Financial Globalization”, Central Banking, Analysis, and Economic Policies Book Series, Vol. 20, pp. 13-78.
Rey, H., (2015), “Dilemma Not Trilemma: The Global Financial Cycle and Monetary Policy Independence”, NBER Working Paper, No 21162, Cambridge, MA.

ECB Forum on Central Banking, June 2016 141
Tong, H. and Wei, S.-J., (2011), “The Composition Matters: Capital Inflows and Liquidity Crunch during a Global Economic Crisis”, Review of Financial Studies, Vol. 24, No 6, pp. 2023–2052.

ECB Forum on Central Banking, June 2016 142
Financial regulatory reform after the crisis: an assessment By Darrell Duffie173
Abstract
“You never want a serious crisis to go to waste.” – Rahm Emanuel, November 2008.
This report offers a brief assessment of the post-crisis regulatory reform of the financial system: the most sweeping re-regulation of banking and financial markets since the US “New Deal” reforms174 conducted during the Great Depression.
In the 21st century, finance permeates the global economy more deeply and intricately than ever before. The financial crisis of 2007-09 revealed powerful new variations of the notion of a “bank run”. As with the US reforms of the 1930s, governments have been energized by the heavy economic fallout of the crisis, especially given the revelations of socially excessive risk-taking and self-interested misbehavior. Commenters seethed over bailouts of wide swaths of the financial system, including banks, broker-dealers, a huge insurance firm, government-affiliated mortgage agencies, and money-market mutual funds. Staggering social costs were evident in lost output and employment. For example, within five quarters of the end of 2007, the real gross domestic product of the United States and the euro area each fell by about 4%, and were even further below their normal growth paths.175 The impact on Japan was even more severe. The euro area was then battered by a second wave of crisis arising from the exposure of its already weakened banking system to shaky sovereign debt and from worries over the future path of the eurozone.
Legislatures and finance ministers around the world empowered financial regulators to rehabilitate on a grand scale. The reform was well overdue. Many of the world’s largest financial services firms had learned how to take unsafe levels of risk by exploiting weak regulatory solvency tests, opaque derivatives and securitization markets, and flight-prone sources of short-term financing.
In the United States, the most toxic systemic financial firms were investment banks that relied heavily on run-prone wholesale short-term financing of their securities inventories. A large fraction of this funding was obtained from unstable money market mutual funds. 173 Graduate School of Business, Stanford University. My webpage provides related research and disclosure of
potential conflicts of interest. Because I serve on the board of directors of Moody’s Corporation, I do not cover credit rating agencies. I am extremely grateful for research assistance from Yang Song, conversations with Suresh Sundaresan and helpful comments from Viral Acharya, Jean-Edouard Colliard, Philipp Hartmann, Peter Hoffman, Nellie Liang, Sam Langfield, Mary Miller, Peter Nowicki, Paul Tucker, Joshua Younger, and an anonymous ECB commenter.
174 Spurred by popular outrage over conflicts of interest in the banking sector that were revealed by the Pecora Commission and over the ravages of the Great Depression, the US Congress enacted the Banking Act of 1933 (which included the Glass-Steagall Act), the Securities Act of 1933, and the Securities Exchange Act of 1934, transforming financial services in the United States for decades to come.
175 See Lane (2013).

ECB Forum on Central Banking, June 2016 143
A substantial amount of this money-fund liquidity was arranged in the overnight repo market, which was discovered by regulators to rely precariously on two US clearing banks for trillions of dollars of intraday credit. The core plumbing of American securities financing markets was a model of disrepair.
Leading up to the Great Financial Crisis of 2007-09, the biggest underlying sources of risk to the financial system were poorly monitored and excessive residential financing and weak peripheral European sovereign debt. Macroprudential regulation, however, is concerned with the resiliency of the financial system to shocks coming from almost any direction. In the words of Tucker (2014), “Overall, the test is whether the reforms can increase the resilience of the system as a whole, reduce contagion when trouble hits, and mitigate the pro-cyclicality of financial conditions.”
Governments have set their financial regulators on a course of significant reduction of the likelihood and severity of future such crises. They demand an end to the moral hazard of bailouts. Regulators have clearly received the message. The striking breadth and depth of the ongoing reform is evident in the 2015 progress report176 of the Financial Stability Board (FSB) to G20 leaders.
For each of the G20 nations, the FSB summarized progress within “four core elements” of financial-stability regulation:
1. making financial institutions more resilient;
2. ending “too-big-to-fail”;
3. making derivatives markets safer;
4. transforming shadow banking.
At this point, only the first of these core elements of the reform, “making financial institutions more resilient”, can be scored a clear success, although even here much more work remains to be done.
These resiliency reforms, particularly bank capital regulations, have caused some reduction in secondary market liquidity. While bid-ask spreads and most other standard liquidity metrics suggest that markets are about as liquid for small trades as they have been for a long time,177 liquidity is worse for block-sized trade demands. As a trade-off for significantly greater financial stability, this is a cost well worth bearing. Meanwhile, markets are continuing to slowly adapt to the reduction of balance sheet space being made available for market-making by bank-affiliated dealers. Even more stringent minimum requirements for capital relative to risk-weighted assets would, in my view, offer additional net social benefits.
176 See Financial Stability Board (2015b). 177 Liberty Street Economics Blog, a research blog series of the Federal Reserve Bank of New York has published an
extensive series of short notes on market liquidity during 2015-16. These notes provide an array of measures and analysis of market liquidity, including coverage in the corporate bond and treasury securities markets. The easiest point of access to these notes is the web page of a frequent co-author of these notes, Tobias Adrian.

ECB Forum on Central Banking, June 2016 144
I will suggest here, however, that the regulation known as the leverage ratio has caused a distortionary reduction in the incentives for banks to intermediate markets for safe assets, especially the government securities repo market, without apparent financial stability benefits. I explain this with a simple model based on the notion of “debt overhang” introduced by Myers (1977). I will suggest adjustments to the leverage ratio rule that would improve the liquidity of government securities markets and other low-risk high-importance markets, without sacrificing financial stability.
I will describe how the other three core elements of financial-stability reform, those involving “too big to fail”, derivatives markets, and shadow banking, are still well short of their goals in key areas. I will argue that the proposed single-point-of-entry method for the failure resolution of systemic financial firms is not yet ready for safe and successful deployment. A key success here, though, is that creditors of banks do appear to have gotten the message that in the future, their claims are much less likely to be bailed out. Derivatives reforms have forced huge amounts of swaps into central counterparties (CCPs), a major success in terms of collateralization and transparency in the swap market. As a result, however, CCPs are now themselves too big to fail. Effective operating plans and procedures for the failure resolution of CCPs have yet to be proposed. While the failure of a large CCP seems a remote possibility, this remoteness is difficult to verify because there is also no generally accepted regulatory framework for conducting CCP stress tests. This represents an undue lack of transparency. Reform of derivatives markets financial-stability regulation has mostly bypassed the market for foreign exchange derivatives involving the delivery of one currency for another, a huge and systemically important class. Data repositories for the swaps market have not come close to meeting their intended purposes. Here especially, the opportunities of time afforded by the impetus of a severe crisis have not been used well.
The biggest achievement in the area of shadow banking is the new set of rules governing money market mutual funds. Money funds of the constant-net-asset-value (CNAV) type can usually be redeemed at a constant value, despite fluctuations over time in the actual market value of their assets. Many investors therefore treat CNAV funds like bank deposits, and thus subject to a run whenever the redemption value of the funds could fall. This is exactly what happened on a massive scale in the United States when Lehman Brothers failed. In the United States, after fits and starts that tested the influence of the Financial Stability Oversight Council, the Securities and Exchange Commission (SEC) has effectively forced CNAV money funds to invest only in government assets. Europe’s regulatory reform of its money market funds has been delayed, but seems likely to follow the outlines of the US reforms.
The G20 financial reforms have a wide range of other financial-stability objectives listed by the Financial Stability Board (2015b).178 For reasons of brevity and focus, however, I will not take the opportunity to address financial-stability regulatory reforms in these other areas.
In addition to financial-stability regulation, legislatures decided that the time is ripe for improving the competitiveness and fairness of financial markets, and have asked regulators to enforce new price-transparency and trade-competition requirements.
178 See Financial Stability Board (2015b), page 6.
ECB Forum on Central Banking, June 2016 145
To the extent that financial-stability regulations have reduced the incentives for bank-affiliated dealers to make markets, regulations in support of competitive transparent all-to-all trading can mitigate losses in market liquidity. Some markets can become even more liquid once dealer intermediation of over-the-counter markets is supplanted with all-to-all anonymous trading venues, and once there is less fragmentation of trade across off-exchange multilateral platforms. Some of the fragmentation is due to lack of international regulatory coordination. I will suggest that there is plenty of room for more progress in this area.
The US Dodd-Frank competition rules are narrowly aimed at the swap market. Europe’s Markets in Financial Instruments Directive (MiFID II) and proposed MIFIR implementing regulations are more ambitious in scope than the US reforms, but are moving much more slowly. Implementation of the most important trade-competition rules has been pushed back to early 2018.
The costs of implementing and complying with regulation are among the trade-offs for achieving greater financial stability. For example, in 2013 (even before the full regime of new regulations was in place) the six largest US banks spent an estimated179 $70.2 billion on regulatory compliance, doubling the $34.7 billion they spent in 2007. Compliance requirements can accelerate or, potentially, decelerate overdue improvements in practices.180 The frictional cost of complying with post-crisis regulations is easily exceeded by the total social benefits, but is nevertheless a factor to be considered when designing specific requirements and supervisory regimes.
Delays in completing and implementing regulations (particularly in Europe) have been harmful, especially in the light of the costs to businesses of regulatory uncertainty. Examples include delays in clarifying the implementation of MiFID II, as mentioned, and the 2012 Liikanen framework for ring-fencing and proprietary-trading limits for banks. This is not, however, the time to call a general halt to reforms in order to mitigate further costs and uncertainty. Continuing to put the significant remaining pieces of the reform into place, expeditiously, will add importantly to financial stability and market efficiency.
Among the important contributors to post-crisis regulatory reform are the supra-national forums for regulatory standards setting, coordination, and peer review. Much has been accomplished, in particular, by the Financial Stability Board, the Basel Committee on Banking Supervision, the Committee on Payments and Market Infrastructures (CPMI), and the International Organization of Securities Commissions (IOSCO). It is hard to imagine that progress would have been nearly as far reaching as it has been without the coordination of standards and the peer comparisons afforded by these groups.
179 As reported by Kristen Glind and Emily Glazer, Wall Street Journal, 30 May 2016, based on estimates provided
by Federated Financial Analytics, Inc. 180 For example, an executive at a global systemically important financial institution (G-SIFI) broker-dealer sent
me the following unprompted private comment: “Due to ever-increasing requirements for documentation, ongoing monitoring, annual certifications, data lineage recording, etc., etc., etc., quant teams on the street are currently significantly hampered in any new development, spending instead their time on producing piles and piles of paper on legacy models that grow increasingly stale. New development means facing mandated model validation, audit, and regulatory reviews – something that can sometimes literally take years – so quant teams now mostly just give up, even when they know that models are in need of an overhaul … In fact, the trend is for quants to ‘dumb down’ the models as much as possible, to cut down on the bureaucratic overhead.”

ECB Forum on Central Banking, June 2016 146
Overall, the international financial regulatory reform movement has made large strides and still has a lot to accomplish. Progress has not been easy because of the sheer complexity of the financial system, competing private interests, and differing national objectives.
1 Making financial institutions more resilient
I begin with a discussion of progress with the first of the core reform elements – “making financial institutions more resilient”.
1.1 Capital and liquidity regulations
Thanks to the Basel III accords, the capital and liquidity cushions of the largest financial institutions are significantly higher than their pre-crisis levels. For example, the average Common Equity Tier 1 (CET1) capital ratios of the six largest US bank holding companies has increased from typical pre-crisis levels of 7% to 7.5% of risk-weighted assets to over 12% during 2015.181 While CET1 ratios are measured on a somewhat different basis in the European Union than in the United States, the European Banking Authority (2015a) reports182 that the 15 largest EU banks had improved their CET1 ratios from about 9.6% at the end of 2009 to about 12.3% by the end of the second quarter of 2015. Over the same span of time, as shown in Chart 1, the fraction of all EU banks with CET1 ratios below 9% dropped from 36% to zero.183
Chart 1 Improving the capital ratios of EU banks
Data source: European Banking Authority. Note: Fractions of European banks with CET1 ratios in the indicated ranges: less than 9% (blue), between 9% and 12% (orange) and more than 12% (red).
181 See page 21 of Federal Reserve Bank of New York Research and Statistics Group (2016). 182 See European Banking Authority (2015), page 8. 183 See European Banking Authority (2015), page 5.
0%
10%
20%
30%
40%
50%
60%
70%
80%
90%
100%
Q42009
Q12011
Q22011
Q32011
Q42011
Q12012
Q22012
Q32012
Q42012
Q12013
Q22013
Q32013
Q42013
Q12014
Q22014
Q32014
Q42014
Q12015
Q22015
<9%9-12%>12%

ECB Forum on Central Banking, June 2016 147
This is a major achievement, and further improvements are planned. Adoption and implementation of the Basel III accords continues to make progress across the 27 member jurisdictions, as tracked by the Basel Committee on Banking Supervision (2016).
In addition to conventional requirements governing capital relative to risk-weighted assets, Basel III includes a minimum “leverage ratio” of capital to total (not risk-weighted) assets.
Beyond increasing capital requirements, the balance sheet liquidity of large banks is now regulated to meet a minimum liquidity coverage ratio (LCR), designed to ensure that cash outflows that could plausibly occur within 30 days are fully covered by ready cash sources. The LCR could be counterproductive, however, if it is not relaxed in times of stress so as to allow banks to actually access the liquidity sources that LCR requires. To my knowledge, this concern has not yet been addressed. A companion Basel-III liquidity regulation, the net stable funding ratio184 (NSFR), designed to limit maturity transformation, remains to be implemented. Kashyap, Tsomocos, and Vardoulakis (2014) explain the beneficial effect of multiple capital and liquidity requirements, given the multiple modalities for bank failure.
Going further, the Fundamental review of the trading book conducted by the Basel Committee on Banking Supervision has now completely revamped the measurement of market risk and risk weights for market risk. The Basel Committee on Banking Supervision (2016) summarizes progress here as follows.
The deficiencies in the pre-crisis framework included an inadequate definition of the regulatory boundary between the banking book and trading book, which proved to be a key source of weakness in the design of the trading book regime. In addition, risk measurement methodologies were insufficiently robust. In particular, the models-based capital framework for market risk relied (and still relies) heavily on risk drivers determined by banks, which has not always led to sufficient capital for the banking system as a whole … Compared to the current framework, the revised market risk capital standard is likely to result in an approximate median (weighted average) increase of 22% (40%) in total market risk capital requirements (i.e. including securitisation and non-securitisation exposures within the scope of the market risk framework).
As a gauge of whether bank failures are as great a threat to market participants as they were before the implementation of resiliency reforms, Chart 2 shows the fraction of credit default swap (CDS) referencing banks, versus non-banks, among the 15 most referenced corporations in the CDS market. Since early 2012, this fraction has declined from about 50% to about 28%. Currently, only Deutsche Bank and Barclays are in the top 15.
184 See Basel Committee on Banking Supervision (2014b).

ECB Forum on Central Banking, June 2016 148
Chart 2 Banks are now less referenced by CDS, relative to non-banks
(y-axis: fraction of bank CDS in top-15 corporate CDS)
Data source: DTCC Trade Information Warehouse. Notes: Of the 15 corporations most referenced in the CDS market by net notional outstanding, this chart shows the fraction of the total of the net outstanding notional CDS positions of these 15 firms, period by period, that reference banks. The banks that appear in the top 15 in at least one period are Wells Fargo, Deutsche Bank, Morgan Stanley, Goldman Sachs, Unicredit, Barclays, and J.P. Morgan.
1.2 Unintended consequences of leverage regulations
There have nevertheless been some unintended adverse consequences of the new capital regulations. Most obvious among these, the “leverage ratio” requirement has impaired liquidity in the market for repurchase agreements backed by government securities, especially in the United States.
As explained by the Financial Policy Committee of the Bank of England (2014c), the leverage ratio rule is meant as a backstop for the risk-weighted-asset capital requirement, because regulatory risk measures may not vary sufficiently with the true riskiness of assets. This can be a consequence of “regulatory arbitrage”, as explained by Colliard (2014), Kiema and Jokivuolle (2014), and Begley, Purnanandam, and Zheng (2016). For example, in a sample of credit assets analyzed by the Basel Committee on Banking Supervision (2013b), the capital levels assigned by the most conservative banks were about 50% higher than those for the least conservative banks. The leverage ratio rule simply avoids the issue of risk measurement by assigning the same amount of required capital per unit of gross assets, regardless of the type of asset.
The US version of the leverage rule for the largest bank holding companies, known as the Supplementary Leverage Ratio (SLR), now requires these firms to have a minimum ratio of capital to total assets of 5%, regardless of the risk composition of their assets. (The bank subsidiaries of these holding companies must meet a 6% minimum leverage ratio.) Intermediation of low-risk assets is typically less profitable than intermediation of high-risk assets. Faced with the SLR, these largest US bank holding companies are cutting back significantly on the intermediation of some lower-risk assets. For example, the ratio of risk-weighted assets to total assets for these largest banks has grown since 2013 from 55% to
0%
10%
20%
30%
40%
50%
60%
Mar. 2012 Dec. 2012 May 2013 Dec. 2013 June 2014 Dec. 2014 June 2015 Dec. 2015 June 2016
ECB Forum on Central Banking, June 2016 149
about185 65%. Appendix 1 provides additional discussion of the distortions in asset composition of bank balance sheets caused by the SLR.
The SLR has especially impaired the market for government securities repo intermediation. Per unit of gross assets, repo intermediation of government securities has extremely low risk and low profit margins per unit of assets. This suggests that the economic force underlying this decline in repo intermediation is a variant of what Myers (1977) called “debt overhang”, explained as follows.
On a typical repo intermediation trade, a bank-affiliated dealer lends cash to a counterparty who secures the loan with bonds, say treasuries. (The trade is not a loan in a legal sense, but amounts in effect to a secured loan.) The treasuries received by the dealer are then usually financed by the dealer itself on another repo, typically at a lower financing rate. The dealer profits from the difference between the two repo rates. Absent capital requirements, this repo intermediation trade is almost self-financing because the dealer passes the cash from one counterparty to the other, and the treasuries in the opposite direction. If a counterparty fails, the position can be liquidated with very low risk to the dealer because it is almost fully secured or over-secured by cash or safe treasuries. This trade causes almost no increase in the risk of the dealer’s balance sheet. When required by the leverage rule to have significantly more capital for this trade despite the extremely low risk, the dealer’s creditors benefit from the improved safety of their claims. The legacy shareholders therefore must suffer from a transfer of market value to the creditors.
In effect, this debt overhang implies a “rental fee” for space on the dealer’s balance sheet, equal to the wealth transfer from shareholders to creditors for the use of that space. In order for a trade to benefit the dealer’s shareholders, the profit on the trade must exceed the rental fee for balance sheet space.
Typical pre-SLR bid-ask profit margins on government securities repo intermediation do not easily overcome the wealth transfer from shareholders to creditors once SLR is imposed. Large banks subject to SLR have therefore increased their bid-offer spreads in this market, driving down the volume of trade significantly.
The US “GCF” repo market is now experiencing significant SLR distortions, evidenced by the reluctance of bank-affiliated dealers to provide repo financing to non-bank dealers. GCF repo volumes have declined by about 30% since 2012.186 More alarmingly, the amount of cash financing obtained by non-bank-affiliated dealers in this market187 declined by about 80% from 2013 to the end of 2015. In the last two years, a proxy measure of the effective bid-ask spread for US government securities repo intermediation increased from under 4 basis points to about 17 basis points, as shown in Chart 3. This spread is the difference between the financing rates paid by non-bank-affiliated dealers in the GCF repo market, relative to the financing rates paid by bank-affiliated dealers in the tri-party repo market.
185 See page 24 of Federal Reserve Bank of New York Research and Statistics Group (2016). 186 See Adenbaum, Hubbs, Martin, and Selig (2016). 187 The relevant data are shown on Slide 39 of Martin (2016).

ECB Forum on Central Banking, June 2016 150
In the last quarter of 2015, the three-month treasury-secured repo rates paid by non-bank dealers were higher even than the three-month unsecured borrowing rates paid by banks (LIBOR). This represents a significant market distortion. It was unlikely to have been a coincidence that failures of some important standard “arbitrage” pricing relationships became more severe around the same time, with increasingly negative interest rate swap spreads and bigger violations of covered interest parity.188 While SLR is not the source of the demand pressures causing these pricing misalignments, it is the most likely culprit for the failure to arbitrage them. The SLR increases “rental cost” for the space on a bank’s balance sheet needed to arbitrage these distortions.
Chart 3 Spread between US GCF repo and tri-party overnight repo rates
(difference in repo rates (percentages). The excess of overnight GCF repo rates over overnight tri-party repo rates, averaged within quarters)
Data sources: Bloomberg and BNY-Mellon.
European repo markets have also suffered from a loss in liquidity.189 Although the largest European banks are subject to a less stringent 3% leverage ratio rule, what matters with respect to repo market liquidity is whether the requirement is estimated by a bank’s management to have a significant potential to become binding on its capital needs. Appendix 1 provides a simple model-based illustration of the order of magnitude of the debt overhang impact on European repo intermediation incentives, which amounts to roughly a doubling of the bid-ask spread in European government securities repo markets. I show that this spread impact is roughly twice the product of the minimum leverage ratio and the unsecured credit spread of large banks. Any distortions in Europe’s repo markets caused by the leverage ratio rule may therefore diminish once Europe’s largest bank-based securities intermediaries are much better capitalized. For now, according to data from the International Capital Markets Association (2016), the total volume of repo trade in Europe has been steady over the past four years, so the overall market impact of the distortions cannot be viewed as severe.
188 I am grateful to Professor Suresh Sundaresan of Columbia University for showing me his work, forthcoming,
including Klingler and Sundaresan (2016), on the increasingly severe breakdown in late 2015 of these arbitrage relationships.
189 See International Capital Market Association (2015).
0
0.02
0.04
0.06
0.08
0.1
0.12
0.14
0.16
0.18
Q12013
Q22013
Q32013
Q42013
Q12014
Q22014
Q32014
Q42014
Q12015
Q22015
Q32015
Q42015
Q12016

ECB Forum on Central Banking, June 2016 151
Based only on informal conversations, it seems plausible to me that some of the largest US and European banks have not done the analysis necessary to determine which of the various capital and liquidity regulations are likely to be binding under various balance sheet designs. Some banks might therefore be stifling their intermediation of low-profit high-asset activities more than a careful analysis of capital regulations would imply, out of caution over the potential adverse impact on shareholder returns.
The repo market is a crucial backbone for securities financing, rates trading, hedging and monetary policy transmission. Adding frictions to the government securities repo market is therefore harmful to market efficiency and the pass-through effectiveness of central bank monetary policy. Financial stability is also not improved by these repo-market distortions. In fact, modeling by Baranova, Zijun, and Noss (2016) suggests that a loss of liquidity associated with reduced intermediation of securities financing markets due to the leverage ratio rule may be exacerbated in times of market stress.
Rather than imposing leverage ratio rules that distort the intermediation of low-risk markets like those for government securities repo, it would be more effective to increase minimum capital requirements for banks by applying proportionately higher risk weights on all assets, or perhaps with a reasonable floor on the risk weights of all assets, including government securities. It is surely distortionary and against the interests of financial stability that government securities can be held in the non-trading accounts of banks with a risk weight of zero. If total risk-weighted capital requirements are high enough, then the leverage ratio rule would not be a significant consideration of banks when they choose how to allocate space on their balance sheets. Another option would be to redefine the measured amount of gross assets represented by government securities repo intermediation by recognizing the effect of netting when it is achieved safely within the same asset class. (The rules already permit some netting of repo positions with the same counterparty, but not across counterparties.)
Repo-market liquidity might alternatively be enhanced by greater use of direct repo trade platforms and all-to-all central counterparties, so that bank balance sheets are not so heavily used for intermediation. So far, however, the success that Europe has achieved in these infrastructure areas has not been matched in the United States, where the repo-market liquidity problems are most severe. Lack of progress with repo CCPs in the United States is also connected with financial stability concerns that I will raise under the topic of shadow banking.
Appendix 1 offers additional discussion of the effectiveness of the leverage ratio requirement. In my view, the unintended negative consequences of this rule are greater than its benefits, given the available regulatory alternatives for achieving equally high or higher capitalization of banks with less distortion in safe-asset intermediation.
1.3 Insulating conventional banking from capital markets activities
Various regulatory approaches have been launched to insulate the conventional lending and deposit-taking businesses of banks from large losses incurred in other lines of business, especially those involving capital markets.
ECB Forum on Central Banking, June 2016 152
For example, the Dodd-Frank Act includes a prohibition known as the “Volcker Rule” on proprietary trading by US banks, with exemptions for hedging, market-making, and various financial instruments such as foreign exchange and government securities. I have written skeptically of the attempt to draw a useful distinction between market-making and proprietary trading,190 where in fact there is no evident distinction. The potential unintended implications of enforcing the Volcker Rule are (i) a reduction in market-making by banks, causing some loss of market liquidity, at least in the near term; and (ii) eventually, increased market-making by firms that are less heavily regulated than banks, especially for minimum capital and liquidity requirements. So far, it is difficult to attribute any serious decline in market liquidity specifically to the Volcker Rule. And, so far, I cannot point to specific non-bank-affiliated market-makers that have become dangers to financial stability because of the Volcker Rule.
Europe has struggled with a wide range of formulations for how to limit proprietary trading by banks191 and how to insulate the capital supporting conventional “retail” banking from trading losses elsewhere in bank. The United Kingdom will allow banks to conduct proprietary trading, but will force banks to set aside capital that specifically protects their domestic conventional banking operations from potentially severe losses that could be incurred in their global banking and trading divisions. This is known as “ring fencing”. The originator of the ring-fencing concept, John Vickers, has publicly argued that the Bank of England, which enforces the rule, has not required sufficient levels of capital in each of the two “sides” of the bank.
Elsewhere in the European Union it has been difficult to find common ground across nations on how to implement some combination of the original ring-fencing and proprietary-trading limits proposed in the 2012 Liikanen Report.192 Quoting an influential commenter, Kay Swinburne, a British member of the EU assembly: “The long and fractious discussions on the issue of bank structural reform and the many views expressed [in Parliament and by EU Member States] show just how divisive this issue is.”193
Near the end of the 20th century the United States struggled with and eventually gave up its 1933 Glass-Steagall separation of commercial banking and investment banking. The challenges to this separation, as with the Volcker Rule, are (i) the difficulty of clearly distinguishing between closely overlapping financial services; and (ii) the loss of synergies between these activities. While allowing investment banking and conventional banking services within the same bank holding company (subject to the Volcker Rule), US rules place a significant brake on trade between the bank and the non-bank subsidiaries of the
190 See Duffie (2012a). 191 See European Commission (2014). In the EU’s proposal on structural reform measures, point (4) of Article 5
defines proprietary trading to be trading for the sole purpose of making a profit for own account, without any connection to client activity, through use of a specifically dedicated desk. This is in contrast with the definition of prohibited trading in Dodd-Frank Section 619 as “principally for the purpose of selling in the near term ... or otherwise with intent to resell in order to profit from short-term price movements”. Both the SLR and Dodd-Frank exempt government bonds. The United Kingdom will apply for derogation under the 2013 Financial Services Act. The EU provides scope for exemption of third-country banks with similar regimes, perhaps looking for mutual recognition with the United States. For more details and analysis, see Armour, Awrey, Davies, Enriques, Gordon, Mayer, and Payne (2016).
192 See European Union (2012). 193 See Ambra-Verlaine (2015).

ECB Forum on Central Banking, June 2016 153
same bank holding company. This brake, formed by Sections 23A and 23B of the Federal Reserve Act, has been tightened by the Dodd-Frank Act.
In summary, the approaches that have been tried in this arena are (i) ring-fencing; (ii) Volcker-style proprietary trading restrictions; (iii) complete Glass-Steagall separation; and (iv) intra-firm trading restrictions. These approaches can be (and have been) used in combination. Governments have struggled mightily over the choices among these alternatives. Compelling cost-benefit comparisons of these restrictions are treacherously difficult, and all of these measures require complex rules that are tricky to interpret and enforce.
1.4 Supervisory stress testing
Outside of the Basel III framework, capital requirements have been significantly buttressed in some jurisdictions by periodic supervisory stress tests. Large banks must demonstrate that they would remain adequately capitalized even after the losses arising from major adverse macroeconomic scenarios that are stipulated by regulators. The United States first deployed stress testing shortly after the onset of the Great Financial Crisis. Since then, its Comprehensive Capital Analysis and Review (CCAR) tests have become a regular and important component of the Fed’s regulation of bank resiliency. The European Banking Authority194 (EBA) and the European Central Bank (ECB) are now following suit with their own stress-testing regimes for Europe’s large banks. The EBA tests will cover banks in the European Union with assets in excess of 30 billion euros. The ECB tests, conducted under the Single Supervisory Mechanism, will cover the 130 largest banks in the euro area. Nouy (2016) outlines key differences between the CCAR and SSM approaches.
1.5 Ending too-big-to-fail
The phrase “too big to fail” refers to the threat to the real economy of a catastrophic failure of a financial firm. So long as that threat exists, a government could again face the need to choose between (i) allowing the failure to severely impair its real economy; and (ii) using taxpayer funds to re-capitalize the firm. The problem is worsened when the financial firm and its creditors are emboldened in their risk-taking by the perception that they are implicitly backstopped by taxpayers. Clearly, any such perception should be cured. Governments have therefore asked their regulators to be in a position to safely resolve a systemically important firm’s impending failure without deploying government capital.
1.6 Failure resolution with a single point of entry
An internationally agreed plan to reduce too-big-to-fail threats is the single-point-of-entry (SPOE) approach to failure resolution. At the threat of failure of a systemically important financial firm, a regulator is supposed to be able to administratively restructure the parent firm’s liabilities so as to allow the key operating subsidiaries to continue providing services 194 See European Banking Authority (2016).

ECB Forum on Central Banking, June 2016 154
to the economy without significant or damaging interruption.195 For this to be successful, three key necessary conditions are (i) the parent firm has enough general unsecured liabilities (not including critical operating liabilities such as deposits) that cancelling these “bail-in” liabilities, or converting them to equity, would leave an adequately capitalized firm; (ii) the failure-resolution process does not trigger the early termination of financial contracts on which the firm and its counterparties rely for stability; and (iii) decisive action by regulators.196
To be effective and at the same time mitigate inefficient defensive behavior by creditors, failure resolution should also have predictable outcomes. A case in point is the unpredictable discretion197 used in the resolution of Novo Banco in 2015. More predictable insolvency processes such as bankruptcy should be used whenever feasible. In the United States, Title I of the Dodd-Frank Act forces systemically important financial firms to show, with “living wills”, that they could also be safely resolved by bankruptcy. Under Dodd-Frank, bankruptcy is the preferred first alternative for resolving the insolvency of a systemically important financial firm. Administrative failure resolution is a last resort. Up until now, however, it has been difficult for some US SIFIs to provide “living wills” that are judged acceptable by their regulators.198
One of the key problems here is the exemption from bankruptcy of qualified financial contracts (QFCs) such as repos and swaps. Another potential impediment to bankruptcy resolution is the potential need for debtor-in-possession bankruptcy liquidity in amounts larger than might be available during a general financial crisis. In order to address these and other shortcomings of the current bankruptcy code when applied to systemically important financial firms, Jackson (2016) has proposed a new “Chapter 14” of the bankruptcy code.
1.7 The early termination of qualified financial contracts
Under normal circumstances, QFCs (including swaps, repos, securities lending agreements, foreign exchange derivatives, and clearing agreements) include terms that allow surviving counterparties to immediately terminate their contracts with failing counterparties in the event of insolvency proceedings such as a regulatory failure administration. When early termination is triggered, the surviving counterparties may apply the collateral they have received from their failing counterparty, exploit set-off rights against other obligations, and invoice the failed counterparty for any uncovered replacement costs, among other measures. For many of the world’s largest financial institutions, when undergoing a failure-resolution process, the early termination of any significant segment of its QFCs would be dangerous, if not devastating. The markets for assets related to the terminated contracts would also be heavily disrupted. The goal of
195 For an analysis of the framework, focusing especially on the European setting, see Center for Economic Policy
Studies Task Force (2016). 196 Tucker (2016) explains the importance of decisive action. 197 See Declercq and Van de Graaff (2016). 198 The Board of Governors of the Federal Reserve System and the Federal Deposit Insurance Corporation (2016)
identified numerous shortcomings and deficiencies in the 2015 failure plans of some US global systemically important financial institutions (G-SIFIs).

ECB Forum on Central Banking, June 2016 155
safe failure resolution would thus be thwarted unless early termination of QFCs can be controlled.
Under the Orderly Liquidation Authority of Dodd-Frank and under the EU Bank Recovery and Resolution Directive (BRRD), contractual early-termination triggers can be stayed by a failure administrative authority. The reach of these stays, however, does not generally extend across jurisdictions. Regulators have therefore asked major bank-affiliated dealers to voluntarily re-write some of their QFCs so as to include language that has an effect similar to that of a stay. These “voluntary stays” now cover a significant quantity of swap contracts under a protocol designed by the International Swaps and Derivatives Association (ISDA). This process of re-writing swap contracts to include failure-resolution stays is incomplete. Some buy-side firms are grappling with the decision of whether to agree to the protocol. In many cases, they are required to act with a fiduciary responsibility to their clients. When buy-side firms do agree to give up some of their early-termination rights, they may choose a specific jurisdictional setting for the failure resolution authority.199
Meanwhile, regulators are likely to encourage bank-affiliated dealers to introduce contractual stays on failure-resolution termination for other forms of QFCs, such as repos, foreign exchange derivatives, and securities lending agreements. In the United States, the Federal Reserve has requested comments on its proposal to require systemically important bank holding companies to arrange for contractual failure-resolution “stays” for their repos and securities lending agreements in major foreign jurisdictions.200 Centrally cleared QFCs would be exempted, which makes good sense given the potential for contagion of systemic risk when a central counterparty is delayed from closing out the positions of one or more large failing clearing members.201
Until the destabilizing impacts of the early termination of QFCs are treated more comprehensively, it is unlikely that a large systemic financial firm that is active in the relevant QFC markets could be safely resolved, even using the single-point-of-entry model.
1.8 Maintaining liquidity during failure resolution
The ability of a large financial firm to avoid a run during a failure-resolution process is largely an issue of confidence of creditors and other counterparties. In addition to the potential for early termination of QFCs, significant wholesale depositors and other short-term creditors would consider their options carefully. Relatively little could be gained by a policy of renewing their loans to the firm, and some of their assets could be lost. Many of the largest depositors are corporations, asset managers, and other entities that act as agents for investors or shareholders. These depositors have a legal fiduciary duty to protect the assets of their principals. These and other counterparties with the option to
199 See Managed Funds Association (2015). On 5 May 2016, ISDA announced its ISDA Resolution Stay
Jurisdictional Modular Protocol “designed to provide flexibility to allow adhering parties to choose which jurisdictional ‘modules’ to opt in to.”
200 See Board of Governors of the Federal Reserve System (2016). 201 See Braithwaite and Murphy (2016) and Duffie and Skeel (2015).

ECB Forum on Central Banking, June 2016 156
renew financing positions with the failing firm could easily take a wait-and-see attitude, gauging when it is safe enough to conclude new agreements with the bank. Even if the bank could quickly resume business in a diminished form, the resulting loss of credit provision or disruption to financial markets might be severe. The impact on the broader economy is difficult to predict, and would depend on the health of the rest of the financial system at the same time. This point is emphasized by Goodhart and Avgouleas (2014), who detail a host of other concerns about the SPOE model and provide a critical evaluation of the US and EU bail-in approaches. Once the risk of a large bank’s failure is manifest, there may be significant pressure on its government to bail it out.
The fact that banks are now subject to the liquidity coverage ratio (LCR) rule does not imply that a run will be averted. Rather, the goal of LCR is that the balance sheet of the financial institution can withstand such a run, perhaps however in a form that significantly limits the ability of the bank to continue providing much new credit to the general economy.
1.9 Credibility and moral hazard
As far as mitigating the moral hazard of too-big-to-fail, what matters is the confidence of market participants that resolution authorities will actually attempt to use their powers when failure is about to occur, absent a bailout. Ignatowski and Korte (2014) provide empirical evidence that, on average, those US banks that have become subject to the Orderly Liquidation Authority (OLA) have responded by reducing their riskiness, relative to banks that were already subject to Federal Deposit Insurance Corporation (FDIC) resolution. They find no significant response to OLA, however, in the risk-taking behavior of the largest banks.
A sign of some progress with too-big-to-fail is the ironic fact that, despite more stringent liquidity and capital rules, the CDS rates of the largest banks are much higher than they were before the Great Financial Crisis, as shown in Chart 4. Apparently, creditors are more convinced than before that banks may indeed be allowed to fail, and that senior unsecured long-term bonds (obligations that are both covered by CDS and subject to bail-in) will bear a disproportionate share of expected default losses, relative to deposits and other operating liabilities.
A further sign of the credibility of failure resolution is found in an event study, conducted by Adonis Antoniadis and Paolo Mistrulli of the ECB’s Financial Research Division, of the impact on European bank bond spreads of the 2013 failure resolution of Cypriot banks. Although agreement on the BRRD was reached only later in 2013, the intent of the BRRD was understood by the time of the Cyprus event. The results of this ECB study are reported by Hartmann (2015). The assumption underlying the study is that, before the BRRD, it was already credible that subordinated bondholders are unlikely to be paid in the event of a bank failure. If the Cyprus event showed that, in the future, the BRRD could and probably would be applied to bail in senior creditors, then bond investors should have increased their expectations of future losses on senior debt, relative to junior debt. Indeed, by two months after the Cyprus event, on average across French, German, Italian, and Spanish banks, the spread between junior and senior debt declined by about 50 basis points.
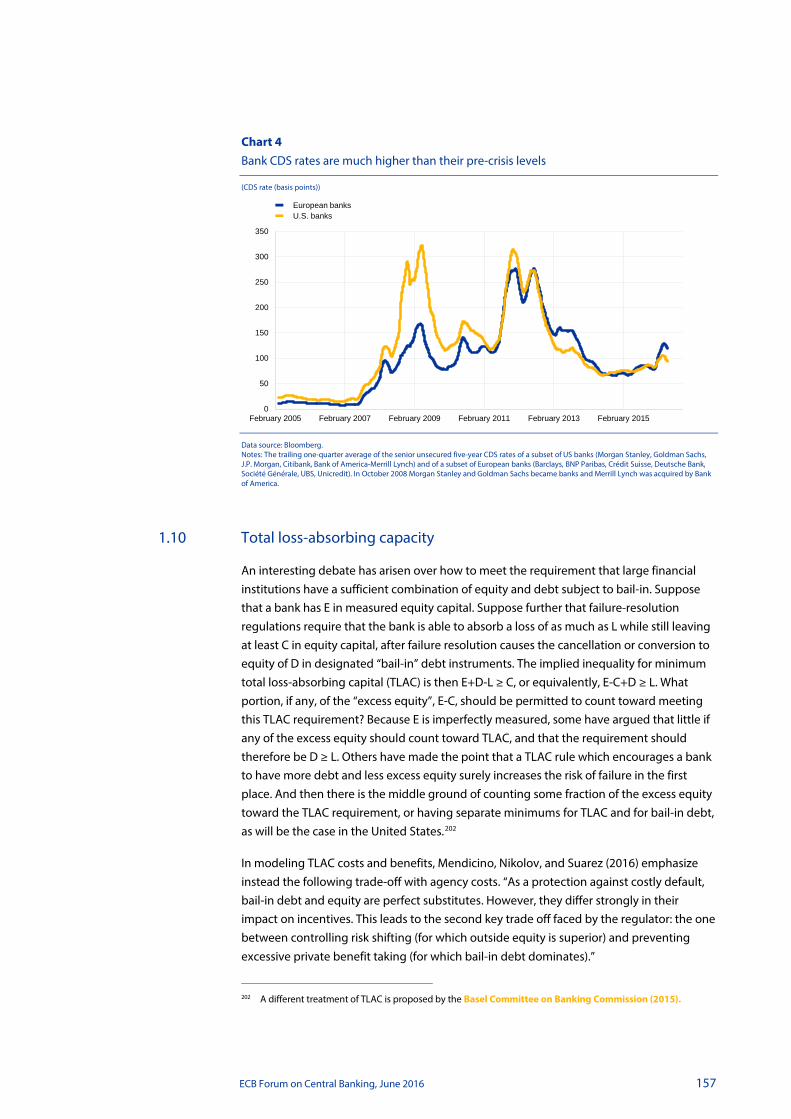
ECB Forum on Central Banking, June 2016 157
Chart 4 Bank CDS rates are much higher than their pre-crisis levels
(CDS rate (basis points))
Data source: Bloomberg. Notes: The trailing one-quarter average of the senior unsecured five-year CDS rates of a subset of US banks (Morgan Stanley, Goldman Sachs, J.P. Morgan, Citibank, Bank of America-Merrill Lynch) and of a subset of European banks (Barclays, BNP Paribas, Crédit Suisse, Deutsche Bank, Société Générale, UBS, Unicredit). In October 2008 Morgan Stanley and Goldman Sachs became banks and Merrill Lynch was acquired by Bank of America.
1.10 Total loss-absorbing capacity
An interesting debate has arisen over how to meet the requirement that large financial institutions have a sufficient combination of equity and debt subject to bail-in. Suppose that a bank has E in measured equity capital. Suppose further that failure-resolution regulations require that the bank is able to absorb a loss of as much as L while still leaving at least C in equity capital, after failure resolution causes the cancellation or conversion to equity of D in designated “bail-in” debt instruments. The implied inequality for minimum total loss-absorbing capital (TLAC) is then E+D-L ≥ C, or equivalently, E-C+D ≥ L. What portion, if any, of the “excess equity”, E-C, should be permitted to count toward meeting this TLAC requirement? Because E is imperfectly measured, some have argued that little if any of the excess equity should count toward TLAC, and that the requirement should therefore be D ≥ L. Others have made the point that a TLAC rule which encourages a bank to have more debt and less excess equity surely increases the risk of failure in the first place. And then there is the middle ground of counting some fraction of the excess equity toward the TLAC requirement, or having separate minimums for TLAC and for bail-in debt, as will be the case in the United States.202
In modeling TLAC costs and benefits, Mendicino, Nikolov, and Suarez (2016) emphasize instead the following trade-off with agency costs. “As a protection against costly default, bail-in debt and equity are perfect substitutes. However, they differ strongly in their impact on incentives. This leads to the second key trade off faced by the regulator: the one between controlling risk shifting (for which outside equity is superior) and preventing excessive private benefit taking (for which bail-in debt dominates).”
202 A different treatment of TLAC is proposed by the Basel Committee on Banking Commission (2015).
0
50
100
150
200
250
300
350
February 2005 February 2007 February 2009 February 2011 February 2013 February 2015
European banksU.S. banks
ECB Forum on Central Banking, June 2016 158
1.11 Failure-resolution readiness
While much progress has been made toward the goal of “ending too-big-to-fail”, I do not view current failure-resolution processes as ready for immediate successful deployment. Under plausible circumstances, if one of the world’s largest complex global financial firms were placed into administrative failure resolution today, I doubt that the firm (or its designated successor) would be able to quickly resume providing anything close to a normal level and range of financial services. In some cases, there could be a disastrous shock to markets. While much progress has been made toward meeting this worthy objective and mitigating the associated moral hazard, it is too early to declare victory over too-big-too-fail. Gracie (2016) outlines work that remains to be done.
1.12 Lending of last resort
In one major jurisdiction, the United States, the financial “reform” process has been used to remove the legal capacity of the central bank to provide lending of last resort (LOLR) to individual firms outside of the regulated banking system. The suggested benefit of this restriction is that non-banks could take undue advantage of the protection of this part of the bank “safety net”, a form of moral hazard. This gap in LOLR coverage includes the huge dealer affiliates of the largest globally systemically important bank holding companies. This restriction on the central bank could exacerbate a crisis, or even cause a financial crisis that need not have occurred. Given the lessons of 2007-08 about the dangers posed to the economy by non-bank financial firms, and in the light of the increasingly heavy dependence of developed market economies on market-based finance, this curtailment of lending of last resort was a significant step backward for financial stability.
1.13 Making derivatives markets safer
Reducing the systemic risk of derivatives markets is also a work in progress. In the United States, the majority of standard over-the-counter derivatives are now centrally cleared by regulated clearing houses.203 The European Market Infrastructure Regulation (EMIR) central clearing mandate is coming into force in Europe, beginning in June 2016 with certain types of interest rate swaps. (A significant fraction of new interest rate swaps were already being centrally cleared.204)
Central clearing improves the transparency of counterparty risk and should, in principle, reduce default contagion risk. The successful migration of a large fraction of swaps into clearing houses, known as central counterparties (CCPs), will be one of the most impressive accomplishments of the financial reform program.
203 See, for example, Powell (2015). According to ISDA SwapsInfo, for 2016 (until June), of new trades of the type
required to be cleared by US regulation, 82% of interest rate swaps and 82% of credit default swap index products are now centrally cleared in regulated CCPs. The Bank for International Settlements (2016) reports that, of the global CDS market, 34% are now centrally cleared.
204 See Abad, Aldasoro, Aymanns, D’Errico, Rousová, Hoffmann, Langfield, Neychev, and Roukny (2016).
ECB Forum on Central Banking, June 2016 159
I will also discuss slow progress with swap trade data repositories, some improvements in derivatives markets exposures, and the general weakness of regulations of the huge and systemically important market for deliverable foreign exchange derivatives.
1.14 Clearing house failure risk
A consequence of the big success in moving swaps into clearing houses is that the largest CCPs have themselves become too big to fail. These CCPs are now undergoing reviews of their default management and recovery plans regarding their compliance with the CPMI-IOSCO Principles for financial market infrastructures.205 Regulatory stress tests of the resiliency of CCPs are contemplated at the level of local market regulators, but there is not yet an agreed global framework for stress testing.206 In April 2016 ESMA published the results of its first annual CCP stress tests, based on its own stress criteria, and found207 that “the system of EU CCPs can overall be assessed as resilient to the stress scenarios used to model extreme but plausible market developments.”
Although statements of regulatory objectives for the failure resolution of CCPs are now generally in place,208 actionable plans and procedures for failure resolution have not yet been promulgated for comment, let alone put into place. This is contrary to the Key Attributes for financial market infrastructures set out by the Financial Stability Board (2014).209 The FSB Resolution Steering Group’s most recent survey of progress stated210 that “resolution frameworks for CCPs are not well developed. Systematic cross-border resolution planning processes are not yet in place for any of the largest CCPs although efforts are underway to establish such processes. The majority of respondents noted that their jurisdictions intend to develop or are still in the process of developing resolution regimes or policies for CCPs.” In the United States, at least to my knowledge, no official-sector entity has even announced that it will take steps toward preparing its CCP
205 See Committee on Payment and Settlement Systems, Board of the International Organization of Securities
Commissions (2012a, 2012b, 2014) and Risk Magazine (2016). The Committee on Payment and Settlement Systems is now officially named the Committee on Payments and Market Infrastructures (CPMI).
206 In an interview with Risk Magazine (2016), Benoît Cœuré, Chairman of the CPMI and member of the ECB’s Executive Board, stated: “I believe it would be helpful to enhance our capacity to identify and address financial vulnerabilities in CCPs at an early stage by complementing CCP in-house stress testing with a framework for supervisory CCP stress testing that can be conducted across jurisdictions. Supervisory stress testing can be a key building block of the macroprudential framework for CCPs if it accounts for the propagation of risk across CCPs as well as the spillover to, and spillback from, their clearing members.” Cœuré (2016) adds to these remarks by outlining five elements of the macro-prudential approach to CCPs being coordinated at the CPMI-IOSCO level: (i) identifying CCPs that are systemically relevant in more than one jurisdiction; (ii) ensuring robust recovery buffers; (iii) identifying and mitigating pro-cyclical margining practices; (iv) developing a framework for supervisory stress testing that can be conducted across jurisdictions; and (v) “understanding and assessing interdependencies between CCPs and their participants.”
207 See ESMA (2016). 208 See Committee on Payment and Settlement Systems, Board of the International Organization of Securities
Commissions (2014), European Union (2014), Financial Stability Board (2014), Financial Stability Board (2015c), and Her Majesty’s Treasury (2014).
209 According to Key Attribute 11.4, “Resolution authorities for an FMI should, in cooperation with the FMI’s oversight or supervisory authorities (where distinct from the resolution authority), develop resolution strategies and operational plans to facilitate the effective resolution of the FMI in a way that ensures continuity of the critical functions carried out by the FMI.”
210 See Financial Stability Board (2015d).
ECB Forum on Central Banking, June 2016 160
administrative failure-resolution plans and procedures. Legal experts do not even agree on the applicability to CCPs of the Dodd-Frank’s Orderly Liquidation Authority.211
Mandating the central clearing of a vast amount of derivatives long before having an operating plan for the administrative failure resolution of systemically important CCPs represents an important deficiency in the financial reform process.
1.15 Trade data repositories
Trade data repositories for derivatives have been set up and are now being populated with transactions data, but the resulting databases are not yet of much use for monitoring systemic risk. Slow progress in this area can probably be ascribed to (i) early regulatory uncertainty over how the data would be used effectively in practical financial stability applications; (ii) some lack of systemic perspective, in the sense of the critique of post-regulatory reform offered by Claessens and Kodres (2014); and (iii) weak international coordination.
There has not been a sufficiently clear distinction, in creating these vast new databases, between the two rather different classes of applications, which rely on two different types of data.
1. Bilateral outstanding counterparty exposures, by underlying asset class, before and after netting and collateral. Here, the greatest potential applications include monitoring risk flows through the network of key market participants, collateral usage, and counterparty risk mitigation practices, by asset type. Using data collected under the European Market Infrastructure Regulation (EMIR), Abad, Aldasoro, Aymanns, D’Errico, Rousová, Hoffmann, Langfield, Neychev, and Roukny (2016) illustrate the potential usefulness of swap data repositories in this application area.
2. Transactions. Here, the greatest potential applications include: (i) post-trade price transparency, for the purpose of improving market competition, an issue discussed later in this report; (ii) investigation of financial misconduct such as insider trading or market manipulation; and (iii) conducting studies of the efficiency and stability of markets, for example diagnosing the causes and effects of “flash crashes.”
Separate from the construction of jurisdiction-level derivatives trade data repositories, the G20 Data Gaps Initiative (DGI) has triggered the construction of a relatively comprehensive and unified international data “hub”, housed at the Bank for International Settlements. The Staff of the IMF and the FSB Secretariat (2015) explains how this data hub will include a unified, granular and relatively comprehensive financial-stability database, with a special focus on the soundness and exposures of global systemically important banks (G-SIBs). Phase 2 of the DGI, about to commence, will incorporate a focus on systemic inter-
211 See Lubben (2015) and Steigerwald and DeCarlo (2014).
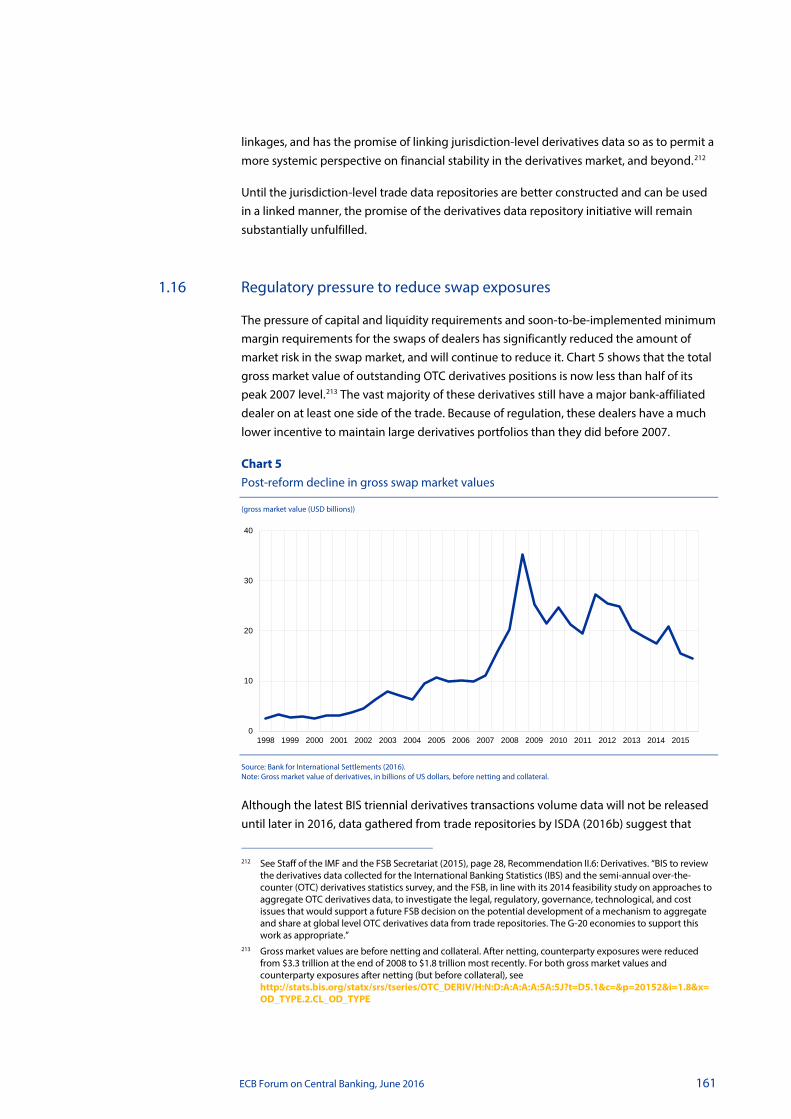
ECB Forum on Central Banking, June 2016 161
linkages, and has the promise of linking jurisdiction-level derivatives data so as to permit a more systemic perspective on financial stability in the derivatives market, and beyond.212
Until the jurisdiction-level trade data repositories are better constructed and can be used in a linked manner, the promise of the derivatives data repository initiative will remain substantially unfulfilled.
1.16 Regulatory pressure to reduce swap exposures
The pressure of capital and liquidity requirements and soon-to-be-implemented minimum margin requirements for the swaps of dealers has significantly reduced the amount of market risk in the swap market, and will continue to reduce it. Chart 5 shows that the total gross market value of outstanding OTC derivatives positions is now less than half of its peak 2007 level.213 The vast majority of these derivatives still have a major bank-affiliated dealer on at least one side of the trade. Because of regulation, these dealers have a much lower incentive to maintain large derivatives portfolios than they did before 2007.
Chart 5 Post-reform decline in gross swap market values
(gross market value (USD billions))
Source: Bank for International Settlements (2016). Note: Gross market value of derivatives, in billions of US dollars, before netting and collateral.
Although the latest BIS triennial derivatives transactions volume data will not be released until later in 2016, data gathered from trade repositories by ISDA (2016b) suggest that
212 See Staff of the IMF and the FSB Secretariat (2015), page 28, Recommendation II.6: Derivatives. “BIS to review
the derivatives data collected for the International Banking Statistics (IBS) and the semi-annual over-the-counter (OTC) derivatives statistics survey, and the FSB, in line with its 2014 feasibility study on approaches to aggregate OTC derivatives data, to investigate the legal, regulatory, governance, technological, and cost issues that would support a future FSB decision on the potential development of a mechanism to aggregate and share at global level OTC derivatives data from trade repositories. The G-20 economies to support this work as appropriate.”
213 Gross market values are before netting and collateral. After netting, counterparty exposures were reduced from $3.3 trillion at the end of 2008 to $1.8 trillion most recently. For both gross market values and counterparty exposures after netting (but before collateral), see http://stats.bis.org/statx/srs/tseries/OTC_DERIV/H:N:D:A:A:A:A:5A:5J?t=D5.1&c=&p=20152&i=1.8&x=OD_TYPE.2.CL_OD_TYPE
0
10
20
30
40
1998 1999 2000 2001 2002 2003 2004 2005 2006 2007 2008 2009 2010 2011 2012 2013 2014 2015
ECB Forum on Central Banking, June 2016 162
total swap transactions volumes have been relatively steady over the last several years, just as total gross market values have declined. This represents an important improvement in the efficiency of counterparty risk management and collateral use.
This improvement in exposure efficiency could potentially be ascribed somewhat to central clearing, which has the ability to reduce exposures through netting across many clearing members. Achieving a reduction in swap exposures through central clearing is effective, however, only if a sufficiently large fraction of swaps are centrally cleared and if clearing is concentrated in relatively few clearing houses, as shown by Duffie and Zhu (2012). Otherwise, central clearing can actually increase total swap exposures. Because of the lack of well-coordinated data repositories, we are still unable to tell how much central clearing has helped or hurt, overall, on this dimension.214 Recent work by Ghamami and Glasserman (2016), however, has cast some doubt on the capital and collateral efficiency of central clearing, to the extent that it has been implemented up to this point.
The greatest source of improvement in OTC derivatives exposure efficiency is clearly due to “trade compression”, by which redundant long and short positions involving multiple dealers are discovered via data sharing by dealers with special utilities. These compression utilities then algorithmically initiate trades that effectively cancel the redundant positions. By April 2016, the largest such service provider, TriOptima, reported215 that its compression service had effectively “torn up” a cumulative total of $784 trillion notional of redundant derivatives. ISDA (2015) shows the remarkable impact of compression activity on the amount of outstanding positions in the interest rate swap market, which accounts for most of the compression. Trade compression is a private initiative that was not directly promoted by regulation. Indirectly, however, the pressure of regulatory capital and margin requirements has surely been responsible for a substantial increase in beneficial trade compression.
1.17 Foreign exchange derivatives
“Deliverable” foreign exchange (forex) derivatives, those involving an exchange of one currency for another, represent as much systemic risk as any class of derivatives other than interest rate swaps. Nevertheless, deliverable forex derivatives remain only lightly regulated. The US Treasury Department exempted forex derivatives from key Dodd-Frank regulations involving margin, central clearing and platform trading. The explanations offered by the US Treasury for this exemption were based heavily on the notion that forex derivatives entail a small amount of counterparty risk. This suggestion is simply not correct, as I have documented.216 Changes in the market values of deliverable forex derivatives during their lifetimes represent a systemically large amount of counterparty risk, unless safely margined. The United States has no current or proposed regulation of these instruments for central clearing, initial margin, or variation margin. Data provided by the Foreign Exchange Committee (2016) show a monthly transactions volume of $8.5 trillion of forex derivatives, the majority of which are for maturities of greater than one
214 For the special case of the CDS market, this question is addressed by Duffie, Scheicher, and Vuillemey (2015). 215 See triReduce statistics. 216 See Duffie (2011).
ECB Forum on Central Banking, June 2016 163
month, and with a high degree of concentration in individual currency pairs, especially euros versus US dollars. Forex derivatives involving the US dollar account for about half of all trade. In Europe, EMIR has not designated deliverable forex derivatives for central clearing or initial margins, but will require the exchange of variation margin,217 a big improvement over the stance of US regulations.
Deliverable forex derivatives are more difficult to regulate than conventional derivatives because they involve the exchange of two actual currencies. This requires international coordination, which has been lacking,218 or raises “extra-territoriality” concerns. Forex derivatives are also operationally more costly to regulate, again because of the need to handle different currencies. Meanwhile, forex derivatives markets represent a major source of systemic risk that is significantly under-regulated.
1.18 Transforming shadow banking
A financial stability transformation of shadow banking is hampered by the complexity of non-bank financial intermediation and by the patchwork quilt of prudential regulatory coverage of the non-bank financial sector. There is significant variation in shadow banking business activities and regulatory frameworks across jurisdictions, and even within some key jurisdictions such as China and the United States.
The most recent Peer Review Report on shadow banking provided by the Financial Stability Board (2016) states that: “Few authorities ... seem to have a systematic process involving all relevant domestic authorities to ensure that the regulatory perimeter encompasses non-bank financial entities where necessary to ensure financial stability ... or the ability to collect sufficiently detailed information from entities that they do not already supervise.” Sections 2.2 and 2.3 of this Peer Review provide a useful summary of concerns in this area.
Designing an effective regulatory framework for shadow banking relies on setting clear boundaries for the activities to be regulated. The Financial Stability Board (2015) sets out five classes of shadow banking entity:
1. entities susceptible to runs, such as certain mutual funds, credit hedge funds and real-estate funds;
2. non-bank lenders dependent on short-term funding, such as finance companies, leasing companies, factoring companies and consumer-credit companies;
3. market intermediaries dependent on short-term funding or on the secured funding of client assets, such as broker-dealers;
4. companies facilitating credit creation, such as credit insurance companies, financial guarantors and monoline insurers;
217 MacKenzie (2016) explains that forex derivatives may actually be subject to variation margin requirements
before other forms of derivatives covered under MiFID II. 218 See Amir-Mokri, Brandt, Donley, and Young (2015).

ECB Forum on Central Banking, June 2016 164
5. securitisation-based intermediaries.
Most of these types of entity use their balance sheets to offer credit, like a bank, and are subject to insolvency failure risk through maturity transformation. Mutual funds, however, are different. They are agent-based investors in capital markets. The main systemic risks that mutual funds pose are the heavy price impacts that can be caused in underlying asset markets by rapid investor redemptions.219 Mutual funds probably deserve additional liquidity regulation and prudential supervision by securities markets regulators, but I doubt they should be regulated as members of the world of “shadow banking”.
The exception is the special case of money market mutual funds, especially those of the constant net asset value (CNAV) type, whose shares can be redeemed in most cases at a constant value, despite fluctuations over time in the actual market value of their assets. Many investors treat CNAV funds like bank deposits. This implies that CNAV funds are subject to a run whenever the redemption value of any large fund could fall. Uncertainty about the actual position of other funds would likely cause redemptions to be widespread across funds. This is exactly what happened on a massive scale in the United States when Lehman Brothers failed. To stop the run, the Treasury Department was forced to offer a guarantee to all money funds. Failing that, broker-dealers who relied for short-term financing on money funds would have themselves required massive emergency alternative funding. Global reform of CNAV money funds continues.220
In the United States, after fits and starts by the Securities and Exchange Commission (SEC) and some arm-twisting of the SEC by the Financial Stability Oversight Council, significant progress has finally been made in getting CNAV money market mutual funds to rely less heavily on non-government assets. This has been done by forcing prime funds (which are allowed to invest in a range of non-government assets) to discontinue CNAV accounting. As a consequence, investors and fund managers are migrating from prime funds to government-only funds.
Europe’s regulatory reform of its money market funds has been delayed. In May 2016 the European Council proposed a “Presidency compromise”, that, if adopted, would probably lead the European money fund industry to eventually look much like that of the United States.221
Hedge funds, private equity firms and non-bank-affiliated broker-dealers have increased their credit intermediation since the crisis, probably as a result of heavier banking regulation. The failures or near failures of most of the major US investment banks in 2008 spurred the surviving investment banks to become parts of bank holding companies, thus subject to the much tighter regulation applied to bank-affiliated broker-dealers. That
219 See Zeng (2016). Methods for treating this problem include “swing pricing”. 220 For a peer review of the progress of money fund reform, see Board of the International Organization of
Securities Commissions (2015). 221 The Council of the European Union Presidency compromise states “existing Constant Net Asset Value MMFs
(CNAV MMFs) should, 24 months from the date of the entry into force of this Regulation, only operate in the Union as either a CNAV MMF that invests in public debt instruments or as a Low Volatility Net Asset Value MMF (LNAV MMF). Alternatively, existing CNAV MMFs would be able to choose to operate as variable net asset value MMFs (VNAV MMFs).” See General Secretariat of the Council, Proposal for a REGULATION OF THE EUROPEAN PARLIAMENT AND OF THE COUNCIL on money market funds - Presidency compromise, 10 May 2016.

ECB Forum on Central Banking, June 2016 165
opens the door for the entry of large broker-dealers that would not be subject to heavy bank-based regulation. So far, however, there are no extremely large broker-dealers that are not affiliated with banks. As for hedge funds, the effective failure of Long-Term Capital Management in 1998 amply demonstrated the potential for large hedge funds to threaten financial stability through fire sales of their assets and through contagion to bank-based prime brokers and creditors. The systemic risks posed by the unwinding of extremely large hedge funds should be carefully watched and controlled. I don’t see much regulatory action in this specific area.
While there is a generally emerging view that regulation in the shadow-banking world should focus on activities rather than entities, an activity-based approach is not a reliable substitute for prudential regulation and supervision at the entity level, especially for entities that are large, complex, or conduct a significant amount of financial intermediation (of any kind, whether shadow banking or other), including large hedge funds, non-bank-affiliated broker-dealers, and mutual funds (including exchange-traded funds).
While progress has been made, the infrastructure of the United States securities financing markets is still not safe and sound. The biggest risk is that of a fire sale of securities in the event of the inability of a major broker-dealer to roll over its securities financing under repurchase agreements. As I have mentioned, the Federal Reserve no longer has the legal capacity to act as a lender of last resort to an individual broker-dealer, no matter how systemic. While the intraday risk that such a failure poses for the two large tri-party-repo clearing banks has been dramatically reduced, the United States still has no broad repo central counterparty with the liquidity resources necessary to prevent such a fire sale. In this case, the Fed does have the legal right to act as a lender of last resort, but has no policy that it would do so. The Bank of England, on the other hand, has stated that it would be a lender of last resort to key financial market infrastructure.
As emphasized by Baklanova, Copeland, and McCaughrin (2016), there is a need for more comprehensive monitoring of all securities financing transactions, including securities lending agreements.
1.19 Improving trade competition
The second central aim of the regulatory reform is to improve the competitiveness of financial markets, with a focus on off-exchange trading. The legacy structure of over-the-counter (OTC) markets has represented an inefficiently low degree of competition, as I will explain.
To the extent that financial stability regulations have reduced the incentives for bank-affiliated dealers to make markets, regulations in support of price transparency and competitive trading venues can mitigate losses in market liquidity. Some markets could become even more liquid once dealer intermediation of OTC markets is supplanted with more all-to-all anonymous trade competition.
Here, the biggest pre-reform deficiencies were related to price transparency and direct competitive bidding for trades, both of which aid price discovery and the ability of

ECB Forum on Central Banking, June 2016 166
investors to conduct effective low-cost comparison shopping. The result should be deeper and more liquid markets, lower execution costs, and better allocative efficiency. Appendix 2 explains why predominantly bilateral trade is uncompetitive and inefficient.
Beginning in 2003, the United States had already brought post-trade price transparency into its corporate and municipal bond markets with its TRACE initiative. The Dodd-Frank Act has instead aimed at the swap market. Standardized swaps have been designated for immediate and public transactions reporting and for trade on multilateral trading facilities (MTFs), known in US regulation as swap execution facilities (SEFs). Japan has followed a course similar to that of the United States, and has achieved roughly the same level of implementation.
Europe’s Markets in Financial Instruments Directive (MiFID II) and proposed MIFIR implementing regulations are more ambitious in scope than US trade-competition reforms, but are moving more slowly. Some important regulations are still being designed. Implementation of some of the most important rules, including mandates for trade on MTFs, has been repeatedly delayed, and at this point is not scheduled until early 2018. Europe’s MiFID proposal covers a wider set of instruments, including corporate bonds, and seems likely to have a broader and more complex set of rules and exemptions.
At least until recently, a lack of coordination between US and EU authorities has been an unfortunate impediment to reform. The U.S. Commodity Futures Trading Commission (CFTC) began quickly,222 but laid out aggressively extra-territorial rules that seemed to delay and hamper cooperation. The most contentious issues between the United States and EU have been related to mutual recognition of CCPs and multilateral trading facilities. As noted by IOSCO (2015), market participants strongly support cross-border recognition of trading facilities and CCPs, given the alternative of heavy costs of market fragmentation. As I will explain, execution costs are lower if more market participants compete on the same platform. Further, as modeled by Duffie and Zhu (2012), multilateral netting at fewer CCPs reduces counterparty exposures and collateral requirements. Recently, the United States and EU have been making more progress with mutual recognition.
1.20 Mandates for trade on exchanges and trade platforms
In the United States and Japan, significant steps have been made toward pre-trade price transparency and competitive swap trading, especially through the migration of over-the-counter trade toward exchanges and multilateral trade facilities (MTFs). Until new regulations forced some trading onto multilateral trading facilities, most OTC trade was typically conducted by private bilateral negotiation between two dealers, or between a
222 In describing its implementation of Dodd-Frank reforms, the CFTC (2013) wrote: “One of the most important
goals of the Dodd-Frank Act is to bring transparency to the opaque OTC swaps market. It is generally accepted that when markets are open and transparent, prices are more competitive and markets are more efficient. The legislative history of the Dodd-Frank Act indicates that Congress viewed exchange trading as a mechanism to “provide pre- and post-trade transparency for end users, market participants, and regulators.” As such, exchange trading was intended as “a price transparency mechanism” that complements Title VII’s separate central clearing requirement to mitigate counterparty risk. Additionally, legislative history reveals a Congressional expectation that, over time, exchange trading of swaps would reduce transaction costs, enhance market efficiency, and counter the ability of dealers to extract economic rents from higher bid/ask spreads at the expense of other market participants.”

ECB Forum on Central Banking, June 2016 167
“buy-side” firm and a dealer. Now, more than two-thirds of new trades in standardized interest rate swap and credit default swap index trading in the United States is conducted on MTFs.
Buy-side firms typically obtain their positions on MTFs at which more than one dealer responds to requests for quotes (RFQ). A significant fraction of inter-dealer trade is conducted on MTFs that use a central limit order book. The result is sometimes called a “two-tiered” market. In terms of improving competition and lowering trading costs to buy-side market participants, the reforms fall short by not bringing all wholesale market participants, including dealers and buy-side firms, together onto common trade venues using “all-to-all” anonymous central limit order books.
On an all-to-all central limit order book223 (CLOB), the best price quotes on the limit order book are transparent to all market participants and are simultaneously executable. For example, a buyer can choose the lowest of all of the simultaneously available quoted prices. This is the essence of effective pre-trade price transparency. Moreover, on an all-to-all CLOB, a buy-side firm has the option to supply quotes to other market participants, thus offsetting some of its execution costs with the ability to both make and take quotes. Setting up CLOB venues is justified when trading activity is sufficiently broadly spread and frequent to generate attention to trading opportunities by liquidity providers and to provide sufficient fee income to the venue operator.
Unfortunately, even after the implementation of Dodd-Frank, buy-side firms tend to avoid trading swaps on existing CLOB platforms. An important impediment here is the practice known as “name give-up”, by which the identity of the buy-side firm must be “given up” to whichever firm is allocated its trade. This leaves a buy-side firm with little control over leakage of information about its trading intentions, as explained by the Managed Funds Association (2015a). This means that buy-side firms are effectively encouraged to trade on RFQ-based MTFs. The average trading costs of buy-side firms are therefore higher than would be the case without the practice of name give-up.
Another important loss of market competition arises from the fragmentation of trade across many different trade platforms. Well-established economic theory implies that markets are more efficient and investors receive better pricing when more market participants compete for trade at the same venue. Most obviously, from the viewpoint of a quote seeker, the best price from among a small set of bidders is not as attractive as the best price available from an enlarged set of bidders. This is true even if the bids do not depend strategically on the size of the bidding population. For example, for a would-be seller of a financial asset, the highest of the first five prices drawn from a given pool of potential bid prices is not as high as the highest of the first 50 bid prices. Strategic competition among bidders further improves the best price available to the quote seeker. That is, a given bidder will compensate for an increase in the population of competing 223 The dominant trading mechanism of modern derivatives and securities exchanges is the central limit order
book, a form of auction market in which any exchange participant can anonymously place orders to buy or to sell. An order to buy typically specifies both a quantity and a “bid”, which is the price at which the order submitter is willing to buy up to the specified quantity from any exchange participant. A sell order, similarly, specifies a quantity for sale and an offer price, executable by any exchange participant. A trade is executed whenever a buy order and a sell order “cross”, meaning that the bid price is at least as high as the offer price. A “market order” is a request to trade at the best available standing limit order. For example, a market order to buy is executed at the lowest-price limit orders to sell that are already on the limit order book.
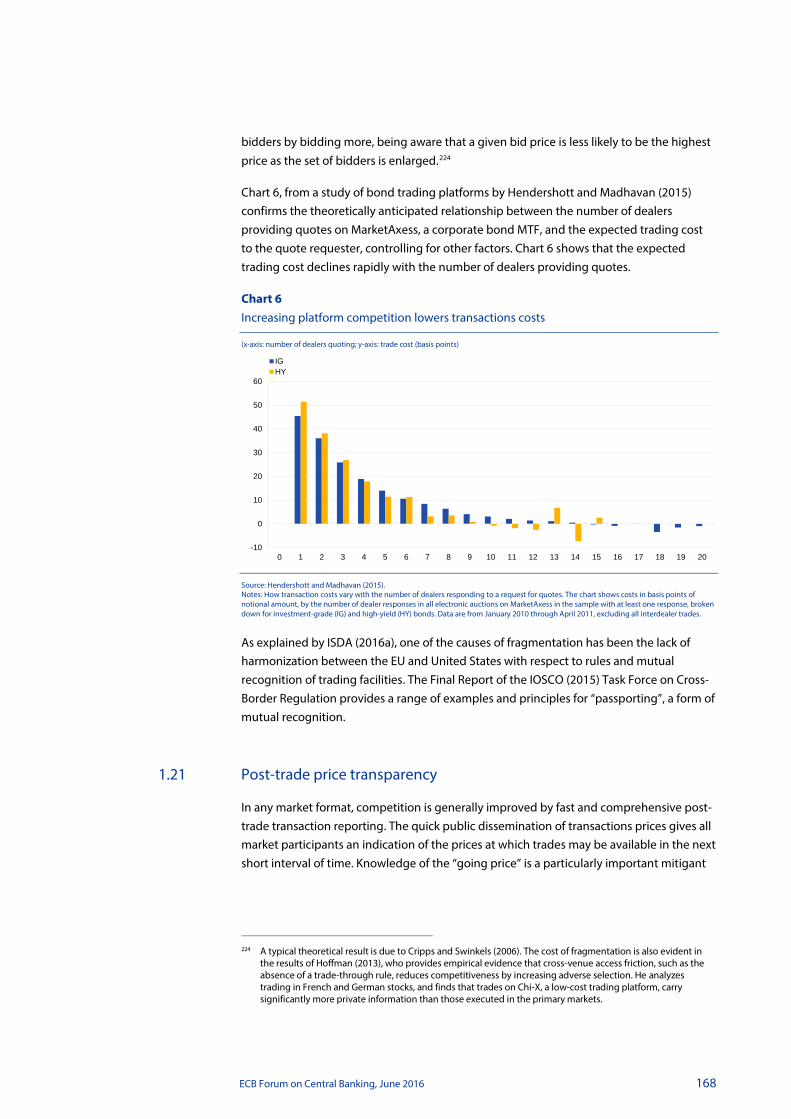
ECB Forum on Central Banking, June 2016 168
bidders by bidding more, being aware that a given bid price is less likely to be the highest price as the set of bidders is enlarged.224
Chart 6, from a study of bond trading platforms by Hendershott and Madhavan (2015) confirms the theoretically anticipated relationship between the number of dealers providing quotes on MarketAxess, a corporate bond MTF, and the expected trading cost to the quote requester, controlling for other factors. Chart 6 shows that the expected trading cost declines rapidly with the number of dealers providing quotes.
Chart 6 Increasing platform competition lowers transactions costs
(x-axis: number of dealers quoting; y-axis: trade cost (basis points)
Source: Hendershott and Madhavan (2015). Notes: How transaction costs vary with the number of dealers responding to a request for quotes. The chart shows costs in basis points of notional amount, by the number of dealer responses in all electronic auctions on MarketAxess in the sample with at least one response, broken down for investment-grade (IG) and high-yield (HY) bonds. Data are from January 2010 through April 2011, excluding all interdealer trades.
As explained by ISDA (2016a), one of the causes of fragmentation has been the lack of harmonization between the EU and United States with respect to rules and mutual recognition of trading facilities. The Final Report of the IOSCO (2015) Task Force on Cross-Border Regulation provides a range of examples and principles for “passporting”, a form of mutual recognition.
1.21 Post-trade price transparency
In any market format, competition is generally improved by fast and comprehensive post-trade transaction reporting. The quick public dissemination of transactions prices gives all market participants an indication of the prices at which trades may be available in the next short interval of time. Knowledge of the “going price” is a particularly important mitigant
224 A typical theoretical result is due to Cripps and Swinkels (2006). The cost of fragmentation is also evident in
the results of Hoffman (2013), who provides empirical evidence that cross-venue access friction, such as the absence of a trade-through rule, reduces competitiveness by increasing adverse selection. He analyzes trading in French and German stocks, and finds that trades on Chi-X, a low-cost trading platform, carry significantly more private information than those executed in the primary markets.
-10
0
10
20
30
40
50
60
0 1 2 3 4 5 6 7 8 9 10 11 12 13 14 15 16 17 18 19 20
IGHY

ECB Forum on Central Banking, June 2016 169
of the bargaining disadvantage of buy-side market participants, who generally have much fewer direct observations of trading encounters than do dealers.225
Post-trade transaction reporting also allows buy-side investors to monitor and discipline the execution quality of their past trades by comparing the prices that they obtained from a dealer with the prices that were obtained for other trades conducted elsewhere in the market at around the same time. A dealer, aware of being monitored in this fashion through post-trade price dissemination, and at risk of losing reputation and repeat business over poor execution prices, will provide somewhat better pricing to its customer.
Post-trade price transparency was mandated for the US corporate bond market beginning in 2002, in the form of the Transaction Reporting and Compliance Engine (TRACE). This eventually led to the public reporting of trade prices for essentially all US corporate bonds and some other fixed-income instruments. TRACE has lowered bid-ask spreads in most of the segments of the bond markets that it covers, although the impact on market liquidity has not been uniformly positive, as explained in Appendix 3, which summarizes the empirical evidence on the impact of TRACE.
Until post-trade transactions reporting is more effectively amplified by the full implementation of MiFID, buy-side participants in Europe’s OTC markets will not have effective post-trade price transparency.
2 Appendices
2.1 SLR and intermediation distortions
Regulators are now requiring that a large bank’s capital must exceed a given fraction of the bank’s total quantity of assets, irrespective of their riskiness. This “leverage requirement” is simpler than the conventional risk-weighted-asset (RWA) capital requirement, which calls for capital levels that depend on the average risk profile of the bank’s asset portfolio. Conventional RWA capital rules had not worked well leading up to the Great Financial Crisis because the risks of some assets were badly understated. That’s not so surprising for those assets whose riskiness is measured by banks themselves. Banks typically prefer lower capital levels than regulators would judge sufficient, and thus have a moral hazard to understate risks. Regulators, for their part, assign relatively undifferentiated and unrealistically low risk weights to sovereign debt.
Putting aside these incentive problems in setting risk weights, the risks are often difficult to estimate. The simplicity of the new leverage requirement, which treats all assets as 225 The SEC (2010) described the degree of price transparency for single-name CDS, which it calls “security-based
swaps” (SBS), by writing: “By reducing information asymmetries, post-trade transparency has the potential to lower transaction costs, improve confidence in the market, encourage participation by a larger number of market participants, and increase liquidity in the SBS market. The current market is opaque. Market participants, even dealers, lack an effective mechanism to learn the prices at which other market participants transact. In the absence of post-trade transparency, market participants do not know whether the prices they are paying or would pay are higher or lower than what others are paying for the same SBS instruments. Currently, market participants resort to “screen-scraping” e-mails containing indicative quotation information to develop a sense of the market.”
ECB Forum on Central Banking, June 2016 170
though equally risky, has thus promoted its heavy use in new capital rules, to the point that the balance sheet management of some of the largest banks seems to be determined in significant part by these new gross leverage requirements. This has implied a shift by some large banks away from low-risk low-profit intermediation, consistent with modeling by Kiema and Jokivuolle (2014).
Models in which both banks and regulators are averse to risk-taking by banks, developed by Kim and Santomero (1988), Rochet (2008), and Glasserman and Kang (2014), show that “flattening” regulatory risk weights across asset classes, relative to actual risks, could inefficiently distort risk-taking by banks, causing them to shift from low-risk assets to high-risk assets. This is not a surprise. Kiema and Jokivuolle (2014) also show that the leverage ratio rule can reduce financial stability by causing more banks to be jointly vulnerable to similar high-risk assets, unless the minimum leverage ratio pushes capital levels much higher.
Debt overhang may be an even greater source of distortion in intermediation incentives under the supplementary leverage ratio. Debt overhang, a concept attributable to Myers (1977), refers to the incentive of a firm to avoid positive-net-present-value investments when the additional capital required for the investment causes a sufficiently large transfer in value from shareholders to creditors, due to a safer balance sheet. When a bank issues equity in order to meet a high regulatory capital requirement for a low-risk position, thus making its balance sheet safer, bank creditors benefit from a transfer of wealth through the increased safety of their debt claims. For such an intermediation trade to be economically viable, its mark-to-market profit must exceed the associated wealth transfer to creditors, as modeled by Andersen, Duffie, and Song (2016). Debt overhang is smaller for more highly capitalized banks, therefore giving them an important advantage in competing for trades.
A natural reformation of risk-weighted capital requirements would make some differentiation across asset classes based on risk, but be conservative. An improved approach would recognize that, other things equal, banks are likely to invest more heavily in assets with lower risk weights. Even for an asset class that is fairly judged to be quite safe, concentrated investment increases the likelihood, given a bank failure, that this asset class is responsible for much of the loss. So, the lowest risk weights should not be as low as they are today. Moreover, as a bank’s investments become more concentrated in a given asset class, the associated risk weights for that asset class should go up. The same principle applies on a systemic basis. As investments by banks, in aggregate, become more concentrated in a given asset class, risk weights for that asset class should rise.
Further, assets whose risks are difficult to judge should be assigned higher risk weights. If an extreme-scenario loss is heavily model dependent, and if we are uncertain about which model to use, one should apply a model that is likely to be relevant contingent on the event of a large loss. When in doubt regulators should be more conservative.
I now offer a simplified illustration of the debt-overhang impact of the SLR on the incentive of a bank to conduct a repo intermediation.226
226 This example is related to the modeling of funding value adjustments by Andersen, Duffie, and Song (2016).

ECB Forum on Central Banking, June 2016 171
Consider a bank acting as a securities dealer, possibly through an affiliate subject to consolidated capital requirements under the Basel G-SIB standards. For simplicity, suppose that the SLR is binding for this bank, so that it must have at least C in additional capital for each additional unit of measured assets, regardless of the asset risk. On a candidate repo trade, the bank would initially receive from its counterparty German government bonds (Bunds) with a market value of 1+H, in exchange for 1 in cash, where H is a “haircut” designed to protect the bank from counterparty failure. At maturity in one day, the bank returns the Bunds to the counterparty in exchange for 1+R, where R is the repo rate, measured for simplicity on a per-day (rather than annualized) basis. The repo rate R exceeds the bank’s cost of funding by some rate spread G. In this case, the bank can obtain funding in the repo market by using the same Bunds as collateral.
Repos are exempt from stays at counterparty failure, so the bank could suffer an unexpected loss on this trade only if, within a day, both of two unusual events happen: (i) the counterparty defaults; and (ii) the value of the Bunds drops by more than the haircut H. In practice, this combined outcome is so unlikely that an event of this type has not been reported since the 1982 failure of Drysdale Government Securities, when counterparties had mistaken their haircut assignments.227 So, in the absence of capital requirements, because this trade is nearly risk-free, it has essentially no effect on the market values of the bank’s debt and equity, other than the intermediation gain of G, which we can assume for simplicity is paid to equity as a distribution. Because the SLR is binding, however, the bank must have approximately C in additional equity in order to conduct this trade. A simple way for the bank to arrange this additional equity is to retire approximately C worth of unsecured debt, funded by an equity issuance of the same amount. In practice, the bank would not conduct an equity issuance for each repo trade. Instead, it would have a policy for how much repo it wishes to conduct on a normal on-going basis, and adjust its capital structure so as to meet its capital requirements, with some buffer designed to conservatively avoid compliance problems.
In our simple example, the remaining legacy unsecured creditors benefit to the extent that the retired debt no longer claims a share of the recovery value of the bank’s assets in the event that the bank defaults. Instead, that default-contingent recovery claim is absorbed by the remaining unsecured creditors. The market value of this additional default-contingent debt recovery claim, per unit of retired debt, is the difference D between the market value of a default-free debt claim and the market value of an unsecured debt claim on the bank. This difference D is therefore equal to the credit spread S of the bank’s unsecured debt. Because C units of debt were retired, the net gain in value to the legacy debt is therefore CS. Given that the balance sheet of the bank is otherwise unchanged, the shareholders’ net gain is the funding spread G on the repo trade, less the wealth transfer of CS to legacy unsecured creditors. Thus, the incremental impact of the capital requirement on the bank’s incentive to conduct the repo is equal to CS.
For illustration, consider an SLR of 3% (the current European minimum regulatory leverage ratio for the largest EU banks) and a typical annualized bank credit spread of 100 basis
227 Garbade (2006) describes the failure of Drysdale Government Securities in 1982, and explains that losses
suffered by repo counterparties were caused by haircuts that did not correct for accrued interest. Garbade goes on to show how contracting practices have changed to prevent such occurrences.

ECB Forum on Central Banking, June 2016 172
points.228 The bank must therefore lower its bid and raise its offer for Bund repo intermediation by CS = 3 basis points each in order to compensate shareholders for the effect of SLR,229 for a total impact on the bid-offer spread of 6 basis points (bp). According to the ICMA European Repo Council (2015): “Historically, for short-dated liquid repo markets, typical bid-ask spreads would be less than 5bp, and possibly only 1-2bp.” So, the impact of the SLR on repo intermediation incentives is bigger than the entire pre-SLR bid-ask spread.
The International Capital Markets Association (ICMA) European Repo Council (2015) states that the leverage ratio rule is a major friction in the provision of repo intermediation by European banks. In terms of the impact of the SLR on repo market liquidity, however, Europe has the benefit over the United States of (i) a lower SLR; (ii) an active direct repo electronic platform trading market; and (iii) some broad-market central clearing of repos. I have already described the dramatic reduction in volume and enormous increase in bid-ask spread in the US government securities repo market since the imposition of the 5% SLR on the largest US bank-affiliated broker-dealers.
As for the actual total quantity of repos conducted in Europe (whether by EU or non-EU banks), the latest survey of the EU repo market by the International Capital Markets Association (2016) shows little change in volume over the four-year period ending December 2015. Bucalossi and Scalia (2016) estimate little adverse impact of the leverage ratio rule on European repo market activity.
The direct repo market accounts for over half of all European repo trade.230 However, most European repo intermediation, even on direct repo platforms, is done by banks. The market may someday evolve to one in which non-bank participants could offer significant direct repo intermediation, thus returning some liquidity to the market. Europe’s CCP advantage should allow some European banks to net some of their long and short positions so as to reduce their measured repo assets.231 That is, a bank doing matched-book repo intermediation with counterparties on both sides that clear through the same CCP can reduce its asset position by netting its long and short positions at the CCP, thus reduce its regulatory capital requirement for conducting repo intermediation, and therefore narrow its required bid-offer spread. As I have mentioned, the initiatives to begin a broad market repo CCP in the United States have not yet succeeded.
2.2 Why bilateral trade is often inefficient
In an opaque bilateral over-the-counter (OTC) market, two buy-side firms are rarely, if ever, able to identify each other as beneficial direct trade counterparties. Almost invariably, a
228 From Bloomberg data, as shown in Chart 4, the average of the CDS rates of global banks during 2016 is about
100 basis points. The CDS rate for Deutsche Bank during 2016 has averaged approximately 150 basis points, see Bloomberg.
229 Under Basel II rules, risk weights on repo were typically 20%, or one-fifth of the effect of a binding SLR risk weight of 100%.
230 See ICMA, Mapping the interdealer European repo market. 231 The benefits of repo CCP in the Eurex Repo General Collateral Pooling (GCP) market are documented by
Ebner, Fecht, and Schulz (2016). According to the survey conducted by ICMA (2016), roughly one-fifth of European repo trade is centrally cleared.

ECB Forum on Central Banking, June 2016 173
buy-side firm has no reasonable option but to trade with a dealer. In order to conduct a trade in the bilateral OTC market, a representative of a buy-side firm would typically contact a dealer’s trading desk and ask for bid and offer quotes. The quotes are good only when offered, and only for trade sizes up to a conventional notional quantity that can depend on the type of product. The buy-side representative can either agree immediately to trade at the dealer’s bid or offer, or can decline. If the buy-side firm agrees, then an increase in the notional quantity may also be negotiated. The dealer may agree to increase the notional quantity of the trade at the same price terms or may demand additional price compensation for increasing the size of the trade.
This “bilateral” (one-on-one) trade negotiation places a buy-side firm at a substantial bargaining disadvantage to a dealer. A buy-side firm rarely has as much information as the dealer concerning the “going price” for the specific product. Thus, when offered given price terms by a dealer, a buy-side firm cannot be confident whether the dealer’s quotes are near the best available quotes in the market. The buy-side firm does not know, moreover, which dealers are likely to provide the best quotes for the trade in question.
As opposed to a dealer, a buy-side firm seeking to sell cannot obtain better pricing by trading directly with another buy-side firm that has a natural motive to buy, and vice versa. Moreover, a buy-side firm cannot force two or more dealers to compete effectively against each other for the trade because of the bilateral nature of the bargaining encounter. I will now elaborate on this last point.
A buy-side firm has the option to reject the price terms quoted by the dealer with whom it is negotiating, and search for better terms from another dealer. But the buy-side firm must negotiate with dealers sequentially, that is, one at a time. The buy-side firm cannot choose the best from among various different dealers’ simultaneously executable quotes. The mere fact that a buy-side investor can eventually request quotes from different dealers does not in itself cause dealers to compete aggressively with each other in order to win the investor’s trade. In this setting of one-on-one negotiation, a buy-side market participant has no ability to force dealers to compete directly with each other. When facing a buy-side customer, each dealer holds a degree of monopoly power over its buy-side customer because the customer has no ability to pick the best of many simultaneously executable price quotes.232
In some cases, a buy-side firm would contact one or more dealers only to discover that the quoted prices are not sufficiently attractive, and would decline to trade at all. Because of the low degree of competition in the OTC market, the buy-side firm may have missed the opportunity to make a beneficial trade that might have been available at sufficiently attractive price terms in a more competitive market, such as that provided by an exchange. Missed opportunities for beneficial trade represent an additional cost of an opaque OTC market.
When providing quotes in the OTC market, a dealer provides bid and ask prices that trade off the impact of widening the quoted bid-ask spread on (i) the profit that would result from agreement by the buy-side firm; and (ii) the probability of agreement. Widening the
232 See Zhu (2012) and Duffie, Dworczak, and Zhu (2015), who model the impact on allocative efficiency.

ECB Forum on Central Banking, June 2016 174
bid-ask spread increases the former and reduces the latter, because a wider quote increases the incentive of the buy-side firm to search for more favorable terms from another dealer (or to simply decline to trade). If the dealer perceives that the buy-side firm does not have an attractive “outside option” to search for other quotes, the dealer can widen its bid-ask spread accordingly. In a dealer-dominated opaque OTC market, the buy-side firm’s outside option is a costly delay to find another suitable dealer, followed by another negotiation with a new dealer who has a bargaining position of similar strength to that of the first dealer contacted. There is no opportunity to get the two dealers (or more than two dealers) to bid directly against each other. The poor outside options available to buy-side firms in an opaque market therefore imply wider bid-ask spreads than would be available on an exchange. This discourages some trade, and the associated gains from trade are lost, a reduction in welfare.
2.3 TRACE price transparency
A significant experiment with post-trade price transparency was the introduction, mandated by the SEC beginning in 2002, of the Transaction Reporting and Compliance Engine (TRACE), which eventually led to the public reporting of trade prices for essentially all US corporate bonds and certain other fixed-income instruments. This appendix summarizes the empirical evidence of the impact of TRACE post-trade price transparency on the liquidity and competitiveness of US corporate bond trading.
Bessembinder and Maxwell (2008) reported that: “The introduction of transaction price reporting for corporate bond trades through the TRACE system in 2002 comprised a major shock to this previously opaque market. Investors have benefited from the increased transparency through substantial reductions in the bid-ask spreads that they pay to bond dealers to complete trades. Conversely, bond dealers have experienced reductions in employment and compensation, and dealers’ trading activities have moved toward alternate securities, including syndicated bank loans and credit default swaps. The primary complaint against TRACE, which is heard both from dealer firms and from their customers (the bond traders at investment houses and insurance companies), is that trading is more difficult as dealers are reluctant to carry inventory and no longer share the results of their research. In essence, the cost of trading corporate bonds decreased, but so did the quality and quantity of the services formerly provided by bond dealers.”
Bessembinder, Maxwell, and Venkataraman (2006) found that with the introduction of TRACE, trade execution costs fell by about 50% for those bonds whose transactions were covered by TRACE. They also found a spillover effect: even for bonds not covered at that time by TRACE, transactions costs dropped by 20%. The authors speculate that publishing the prices of TRACE-eligible bonds provided additional information on the fair market values of bonds not eligible for TRACE reporting.
Harris and Piwowar (2007) also find that TRACE reduced transactions costs. Goldstein, Hotchkiss, and Sirri (2007), however, find that less frequently traded bonds and very large trades showed no significant reduction in bid-ask spread with the introduction of public transaction reporting under TRACE. Moreover, Goldstein, Hotchkiss, and Sirri (2007) and Asquith, Covert, and Parath (2014) do not find that TRACE increased trading activity.

ECB Forum on Central Banking, June 2016 175
Indeed, Asquith, Covert, and Parath (2014) found that TRACE reduced trading activity significantly for high-yield bonds. A reasonable interpretation is that, with the reduced profitability of market-making caused by greater price transparency, dealers had a reduced incentive to make markets, especially in thinly traded bonds.
Bessembinder and Maxwell (2008) note the dramatic increase in corporate bond trading volume on the electronic platform – MarketAxess – that followed the introduction of TRACE, saying: “We believe that TRACE improved the viability of the electronic market. In the presence of information asymmetries, less-informed traders will often be dissuaded from participating in a limit order market, knowing that their orders will tend to be ‘picked off’ by better-informed traders if the price is too aggressive, but left to languish if not aggressive enough. TRACE likely increased traders’ willingness to submit electronic limit orders by allowing traders to choose limit prices with enhanced knowledge of market conditions.”
While bid-ask spread is often a useful measure of trading costs, Asquith, Covert, and Parath (2014) focus on intraday price dispersion. The relevance of this measure is motivated by the idea that, in an opaque OTC market, the same bond, on the same day, can be traded by dealers at much different prices with some customers than with other customers, even if there has been no significant new fundamental information on the bond’s quality during the day. Asquith, Covert, and Parath (2014) show that the intraday dispersion of prices for riskier corporate bonds was reduced on average by over 40% with the introduction of TRACE post-trade price transparency for those bonds. This represents a dramatic reduction in effective trading costs for those buy-side investors who, without TRACE transparency, had been paying far higher trading costs than other (presumably more sophisticated and better informed) market participants.
References
Abad, Jorge, Aldasoro, Iñaki, Aymanns, Christoph, D’Errico, Marco, Fache Rousová, Linda, Hoffmann, Peter, Langfield, Sam, Neychev, Martin and Roukny, Tarik (2016), “Shedding light on dark markets: First insights from the new EU-wide OTC derivatives dataset”, European Systemic Risk Board, No 11, Occasional Paper Series, September.
Adenbaum, Jacob, Hubbs, David, Martin, Antoine and Selig, Ira (2016), “What’s Up with GCF Repo?”, Liberty Street Economics, Federal Reserve Bank of New York, 2 May.
Ambra-Verlaine, Julia (2015), EU Separation Bill Stalls as UK Builds Vickers Fence, Bloomberg, October.
Amir-Mokri, Cyrus, Brandt, Patrick, Donley, Maureen and Young, Mark (2015), Reconciling Regulatory Requirements in Cross-Border Derivatives Takes Center Stage, Skadden, January.
Andersen, Leif B.G., Duffie, Darrell and Song, Yang (2016), “Funding Value Adjustments”, Working paper, Graduate School of Business, Stanford University.

ECB Forum on Central Banking, June 2016 176
Armour, John, Awrey, Dan, Davies, Paul, Enriques, Luca, Gordon, Jeffrey N., Mayer, Colin and Payne, Jennifer (2016), Principles of Financial Regulation, forthcoming, Oxford University Press.
Asquith, Paul, Covert, Thomas and Pathak, Parag (2013), “The Effect of Mandatory Transparency in Financial Market Design: Evidence from the Corporate Bond Market”, MIT Working paper, September.
Baklanova, Viktoria, Copeland, Adam and McCaughrin, Rebecca (2015), “Reference Guide to U.S. Repo and Securities Lending Markets”, Office of Financial Research Working Paper, September.
Bank of England (2014a), The Bank of England’s Sterling Monetary Framework, November (also known as “The Red Book”).
Bank of England (2014b), “The Bank of England’s Supervision of Financial Market Infrastructures”, in Bank of England Annual Report, March.
Bank of England (2014c), The Financial Policy Committee’s Review of the Leverage Ratio, October.
Bank for International Settlements (2016), Statistical Release, OTC Derivatives Statistics at End-December 2015, Monetary and Economic Department, May.
Baranova, Yuliya, Liu, Zijun and Noss, Joseph (2016), “The Role of Collateral in Supporting Liquidity”, Working paper, Bank of England.
Basel Committee on Banking Supervision (2013a), Basel III: The Liquidity Coverage Ratio and Liquidity Risk Monitoring Tools, Bank for International Settlements, January.
Basel Committee on Banking Supervision (2013b), RCAP — Analysis of Risk-Weighted Assets for Credit Risk in the Banking Book, July.
Basel Committee on Banking Supervision (2014a), Basel III Leverage Ratio Framework and Disclosure Requirements, Bank for International Settlements, January.
Basel Committee on Banking Supervision (2014b), Basel III: The Net Stable Funding Ratio, Bank for International Settlements, October.
Basel Committee on Banking Supervision (2015), Consultative Document: TLAC Holdings, Bank for International Settlements, November.
Basel Committee on Banking Supervision (2016a), Explanatory Note on the Revised Minimum Capital Requirements for Market Risk, Bank for International Settlements, January.
Basel Committee on Banking Supervision (2016b), Tenth Progress Report on Adoption of the Basel Regulatory Framework, Bank for International Settlements, April.
Begley, Taylor, Purnanandam, Amiyatosh and Zheng, Kuncheng (2016), “The Strategic Under-Reporting of Bank Risk”, Working paper, London Business School, March.

ECB Forum on Central Banking, June 2016 177
Bessembinder, Hendrik and Maxwell, William (2008), “Markets: Transparency and the Corporate Bond Market”, Journal of Economic Perspectives, Volume 22, No 2, Spring, pp. 217-234.
Bessembinder, Hendrik, Maxwell, William and Venkataraman, Kumar (2006), “Market Transparency, Liquidity Externalities, and Institutional Trading Costs in Corporate Bonds”, Journal of Financial Economics, Volume 82, pp. 251-288.
Board of Governors of the Federal Reserve System (2016), Notice of Proposed Rulemaking: Restrictions on Qualified Financial Contracts of Systemically Important U.S. Banking Organizations and the U.S. Operations of Systemically Important Foreign Banking Organizations; Revisions to the Definition of Qualifying Master Netting Agreement and Related Definitions, Federal Reserve System, Washington, D.C., May.
Board of Governors of the Federal Reserve System and the Federal Deposit Insurance Corporation (2016), Resolution Plan Assessment Framework and Firm Determinations (2016), Washington D.C., April.
Board of the International Organization of Securities Commissions (2015), Peer Review of Regulation of Money Market Funds: Final Report, FR19/2015, September.
Braithwaite, Jo and Murphy, David (2016), “Got to be Certain: The Legal Framework for CCP Default Management Processes”, Financial Stability Paper, No 37, Bank of England, May.
Bucalossi, Analisa and Scalia, Antonio (2016), “Leverage Ratio, Central Bank Operations and Repo Market”, Questioni di Economia e Finanza, Occasional Paper, No 347, July.
Center for Economic Policy Studies Task Force (2016), “European Bank Resolution: Making it Work”, Interim Report of the CEPS Task Force on Implementing Financial Sector Resolution, January.
CFTC (2013), Final Rule, Core Principles and Other Requirements for Swap Execution Facilities, 78 Register 33476, 33553-54, June.
Claessens, Stign and Kodres, Laura (2014), “The Regulatory Responses to the Global Financial Crisis: Some Uncomfortable Questions”, International Monetary Fund Working Paper, WP14/46, March.
The Clearinghouse and ISDA (2016), Considerations for CCP Resolution, New York, May.
Cœuré, Benoît (2016), “Towards a Macroprudential Framework for Central Counterparties”, Introductory Remarks at the ESRB International Conference on Macroprudential Margins and Haircuts, Frankfurt am Main, 6 June.
Colliard, Jean-Edouard (2014), “Strategic Selection of Risk Models and Bank Capital Regulation”, Working Paper Series, European Central Bank, HEC Paris, August.
Committee on Payment and Settlement Systems, Board of the International Organization of Securities Commissions (2012a), Principles for financial market infrastructures, Bank for International Settlements, April 2012.
ECB Forum on Central Banking, June 2016 178
Committee on Payment and Settlement Systems, Board of the International Organization of Securities Commissions (2012b), Recovery and Resolution of Financial Market Infrastructures, Consultative Report, July. Comments at http://www.bis.org/publ/cpss103/comments.htm
Committee on Payment and Settlement Systems, Board of the International Organization of Securities Commissions (2014), Recovery of Financial Market Infrastructures, Consultative Report, October.
Cripps, Martin W. and Swinkels, Jeroen M. (2006), “Efficiency of Large Double Auctions”, Econometrica, Volume 74, pp. 47-92.
Davies, Geoffrey and Dobler, Marc (2011), “Bank Resolution and Safeguarding the Creditors Left Behind”, Research and Analysis, Bank of England Quarterly Bulletin, Q3 2011, pp. 213-223.
Declercq, Peter and Van de Graaff, Sonya (2016), Looks Like Another Test Case For EU Bank Resolution Law, Law 360, February.
Duffie, Darrell (2011), “On the Clearing of Foreign Exchange Derivatives”, a Response to the Request for Comments Stated in the April 2011 Proposed Ruling of the U.S. Treasury, Determination of Foreign Exchange Swaps and Foreign Exchange Forwards Under the Commodity Exchange Act, Graduate School of Business, Stanford University, May.
Duffie, Darrell (2012a), “Market Making Under the Proposed Volcker Rule”, a Report to the Securities Industry and Financial Markets Association and a Submission to the Office of the Comptroller of the Currency, the Board of Governors of the Federal Reserve System, the Federal Deposit Insurance Corporation, and the Securities and Exchange Commission, Graduate School of Business, Stanford University, January.
Duffie, Darrell (2012b), Dark Markets: Asset Pricing and Information Transmission in Over-the-Counter Markets, Princeton University Press.
Duffie, Darrell (2016), “Resolution of Failing Central Counterparties”, in Making Failure Feasible: How Bankruptcy Reform Can End 'Too Big To Fail', Scott, Kenneth and Taylor, John E. (eds.), Hoover Institution Press.
Duffie, Darrell, Dworczak, Piotr and Zhu, Haoxiang (2015), “Benchmarks in Search Markets”, Working paper, Graduate School of Business, Stanford University, November.
Duffie, Darrell, Scheicher, Martin and Vuillemey, Guillaume (2015), “Central Clearing and Collateral Demand”, Journal of Financial Economics, Volume 116, pp. 237-256.
Duffie, Darrell and Skeel, David (2012), “A Dialogue on the Costs and Benefits of Automatic Stays for Derivatives and Repurchase Agreements”, in Bankruptcy Not Bailout: A Special Chapter 14, Scott, Kenneth E. and Taylor, John B. (eds.), Hoover Institution Press.
Duffie, Darrell and Zhu, Haoxiang (2011), “Does a Central Clearing Counterparty Reduce Counterparty Risk?”, Review of Asset Pricing Studies, Volume 1, pp. 74-95.

ECB Forum on Central Banking, June 2016 179
ESMA (2016), ESMA Publishes Results of EU Central Counterparties Stress Test, European Securities and Markets Authority, ESMA/2016/664, April.
Ebner, Andre, Fecht, Falko and Schulz, Alexander (2016), “How Central is Central Counterparty Clearing? A Deep Dive into a European Repo Market During the Crisis”, Discussion Paper, No 14/2016, Deutsche Bundesbank, June.
Edwards, Amy, Harris, Lawrence and Piwowar, Michael (2007), “Corporate Bond Transaction Costs and Transparency”, Journal of Finance, Volume 62, pp. 1421-1451.
Elliott, David (2013), “Central Counterparty Loss-Allocation Rules”, Bank of England, Financial Stability Paper, No 20, April.
European Banking Authority (2012), Report on Risks and Vulnerabilities of the European Banking System, London, July.
European Banking Authority (2015a), Risk dashboard – data as of Q3 2015, London, September.
European Banking Authority (2015b), EU-Wide Stress Test 2016: Draft Methodological Note, London, November.
European Commission (2012), Consultation on a possible recovery and resolution framework for financial institutions other than banks, Directorate General Internal Markets and Services.
European Securities and Markets Authority (2012), Draft technical standards under the Regulation (EU) No 648/2012 of the European Parliament and of the Council of 4 July 2012 on OTC derivatives, CCPs and trade repositories, Final Report, ESMA/2012/600, September.
European Commission (2014), Proposal for a regulation of the European Parliament and of the Council on structural measures improving the resilience of EU credit institutions, Brussels, January.
European Union (2012a), High-level expert group on reforming the structure of the EU banking sector, chaired by Erkki Liikanen, Final Report, Brussels, October.
European Union (2012b), Regulation (EU) No 648/2012 of the European Parliament and of the Council of 4 July 2012 on OTC derivatives, central counterparties and trade repositories, (OJ L 201, 27.7.2012, pp. 1-59).
European Union (2014), Directive 2014/59/EU of the European Parliament and of the Council of 15 May 2014 establishing a framework for the recovery and resolution of credit institutions and investment firms, (OJ L173, 12.6.2014, pp. 190-348).
Federal Reserve Bank of New York Research and Statistics Group (2016), Quarterly Trends for Consolidated U.S. Banking Organizations, Fourth Quarter, 2015.
ECB Forum on Central Banking, June 2016 180
Financial Stability Board (2013), Strengthening Oversight and Regulation of Shadow Banking: Policy Framework for Addressing Shadow Banking Risks in Securities Lending and Repos, Basel, August.
Financial Stability Board (2014), Key Attributes of Effective Resolution Regimes for Financial Institutions, Basel, October.
Financial Stability Board (2015a), Global Shadow Banking Monitoring Report 2015, Basel, November.
Financial Stability Board (2015b), Implementation and Effects of the G20 Financial Regulatory Reforms, Report of the Financial Stability Board to G20 Leaders, Basel, November.
Financial Stability Board (2015c), 2015 CCP Workplan, Chairs of the FSB, SRC, FSB ReSG, BCBS, CPMI, and IOSCO, April.
Financial Stability Board (2015d), Progress Report on the CCP Workplan, September.
Financial Stability Board (2016), Thematic Review on the Implementation of the FSB Policy Framework for Shadow Banking Entities, Peer Review Report, Basel, May.
Foreign Exchange Committee (2016), Semi-Annual Foreign Exchange Volume Survey, Federal Reserve Bank of New York, October.
G20 (2009), Pittsburgh Declaration.
Garbade, Kenneth (2006), “The Evolution of Repo Contracting Conventions in the 1980s”, FRBNY Economic Policy Review, Federal Reserve Bank of New York, May.
Ghamami, Samim and Glasserman, Paul (2016), “Does OTC Derivatives Reform Incentivize Central Clearing?”, Working Paper, Federal Reserve Board, May.
Glasserman, Paul and Kang, Wanmo (2014), “Design of Risk Weights”, Office of Financial Research (OFR) Working Paper, August.
Goldstein, Michael A., Hotchkiss, Edith S. and Sirri, Erik R. (2007), “Transparency and Liquidity: A Controlled Experiment on Corporate Bonds”, Review of Financial Studies, Volume 20, pp. 235-273.
Goodhart, Charles and Avgouleas, Emilios (2014), “A Critical Evaluation of Bail-in as a Bank Recapitalisation Mechanism”, in Allen, F., Carletti, E. and Gray, J. (eds.), Bearing the Losses from Bank and Sovereign Default in the Eurozone, Philadelphia, PA: Wharton Financial Institutions Center, pp. 65-97.
Gracie, Andrew (2016), Ending Too Big to Fail: Getting the Job Done, Speech at Deloitte, London, Bank of England.
Hartmann, Philipp (2015), “Financial Reform in Transition”, in The New International Financial System: Analyzing the Cumulative Impact of Regulatory Reform, Evanoff, Douglas, Haldane, Andrew and Kaufman, George (eds.), World Scientific Press.

ECB Forum on Central Banking, June 2016 181
Hameedu, Shahul and Jaleena, A. (2015) “A Study on OTC Derivatives Market Reforms in India”, International Journal of Current Research and Academic Review, Volume 3, 114-127.
Hendershott, Terrence and Madhavan, Ananth (2015), “Click or Call? Auction versus Search in the Over-the-Counter Market”, Journal of Finance, Volume 70, pp. 419-447.
Her Majesty’s Treasury (2014), Secondary Legislation for Non-Bank Resolution Regimes, Consultation Outcome, June.
Hoffmann, Peter (2013), “Adverse Selection, Market Access and Inter-Market Competition”, Working Paper Series, No 1515, European Central Bank, March.
ICMA European Repo Council (2015), Perspectives from the Eye of the Storm: The Current State and Future Evolution of the European Repo Market, An initiative of the ICMA European Repo Council, November.
IOSCO (2015), Task Force on Cross Border Regulation (Final Report), September.
ICMA European Repo Council (2015), Perspectives from the Eye of the Storm: The Current State and Future Evolution of the European Repo Market, ICMA, November.
ISDA (2013), CCP Loss Allocation at the End of the Waterfall, August.
ISDA (2015), The Impact of Compression on the Interest Rate Derivatives Market, Research Note, July.
ISDA (2016a), Principles for US/EU Trading Platform Recognition, ISDA, February.
ISDA (2016a), SwapsInfo First Quarter 2016 Review, June.
Ignatowski, Magdalena and Korte, Josef (2014), “Wishful Thinking or Effective Threat? Tightening Bank Resolution Regimes and Bank Risk-Taking”, Journal of Financial Stability, Volume 15, pp. 264-281.
International Capital Markets Association (2016), European Repo Market Survey Number 30, conducted December 2015, February.
J.P. Morgan Chase & Company (2014), What is the Resolution Plan for CCPs?, Office of Regulatory Affairs, September.
Jackson, Thomas H. (2016), “Building on Bankruptcy: A Revised Chapter 14 Proposal for the Recapitalization, Reorganization, or Liquidation of Large Financial Institutions”, in Jackson, Thomas H., Scott, Kenneth E. and Taylor, John B. (eds.), Making Failure Feasible, Hoover Institution Press, Stanford.
Kiema, Ilkka and Jokivuolle, Esa (2014), “Does a Leverage Ratio Requirement Increase Bank Stability?”, Journal of Banking and Finance, Volume 39, pp. 240-254.
Kashyap, Anil, Tsomocos, Dimitrios and Vardoulakis, Alexandros (2014), “How does Macroprudential Regulation Change Bank Credit Supply?”, NBER Working Paper, 20165, University of Chicago, May.

ECB Forum on Central Banking, June 2016 182
Kim, Daesik and Santomero, Anthony (1988), “Risk in Banking and Capital Regulation”, Journal of Finance, Volume 43, pp. 1219-1233.
Klingler, Sven and Sundaresan, Suresh (2016), “An Explanation of Negative Swap Spreads”, Preliminary working paper, Copenhagen Business School and Columbia University, April.
LCH Clearnet Group (2015a), Consolidated Financial Statements for the Year Ended 31 December 2014.
LCH Clearnet (2015b), CCP Risk Management, Recovery, and Resolution, LCH Clearnet White Paper.
Lane, Tim (2013), Financial Stability in One Country, Bank of Canada, Weatherhead Center for International Affairs, Harvard University, Cambridge, Massachusetts, February.
Lubben, Stephen J. (2015), “Failure of the Clearinghouse: Dodd-Frank’s Fatal Flaw”, Virginia Law Review, Volume 10, Number 1, pp. 127-160.
Mackenzie, Robert (2016), Banks Fear Early Rollout of EU Margin Rules for Forex Forwards, Risk.net, June.
Martin, Antoine (2016), “Reform, Regulation, and Changes in the U.S. Repo Market”, Presentation, Federal Reserve Bank of New York, April.
Managed Funds Association (2015a), “Why Eliminating Post-Trade Name Disclosure Will Improve the Swaps Market”, MFA Position Paper, March.
Managed Funds Association (2015b), Too Big to Default: Policy and Legal Perspectives on Current Bank Regulator Initiatives to Restrict End-Users’ Default Rights Against Big Banks, White Paper, September.
Mendicino, Caterina, Nikolov, Kalin and Suarez, Javier (2016), “Equity Versus Bail-in Debt in Banking: An Agency Perspective”, Working Paper, April.
Myers, Stewart (1977), “Determinants of Corporate Borrowing”, Journal of Financial Economics, Volume 5, pp. 147-175.
Nouy, Danièle (2016), Letter to Mr. Enrique Calvet Chambon, Member of the European Parliament, Supervisory Board, European Central Bank, 4 April.
Powell, Jerome (2015), Speech at The Clearing House Annual Conference, New York, November 17, 2015, Board of Governors of the Federal Reserve System.
Risk Magazine (2016), Interview with Benoît Cœuré, Member of the Executive Board of the ECB and Chairman of the Committee on Payments and Market Infrastructures (CPMI), conducted by Cécile Sourbes on 10 May and published on 19 May 2016.
Rochet, Jean-Charles (2008), Why Are There So Many Banking Crises? The Politics and Policy of Bank Regulation, Princeton University Press, Princeton, New Jersey.
ECB Forum on Central Banking, June 2016 183
Securities and Exchange Commission (2010), “Regulation SBSR—Reporting and Dissemination of Security-Based Swap Information”, 75 Federal Register 75208, 75224, December.
Skeel, David (2016), “Financing Systemically Important Financial Institutions in Bankruptcy”, in Making Failure Feasible, Jackson, Thomas H., Scott, Kenneth E. and Taylor, John B. (eds.), Hoover Institution Press, Stanford.
Staff of the IMF and the FSB Secretariat (2015), Sixth Progress Report on the Implementation of the G-20 Data Gaps Initiative, Financial Stability Board and International Monetary Fund, September.
Steigerwald, Robert and DeCarlo, David (2014), “Resolving Central Counterparties after Dodd-Frank: Are CCPs Eligible for `Orderly Liquidation’?” unpublished working paper, Federal Reserve Bank of Chicago, November.
Tucker, Paul (2014), Regulatory Reform, Stability, and Central Banking, Hutchins Center on Fiscal and Monetary Policy at Brookings Institution, January.
Tucker, Paul (2016), Reform as a Precondition for Competition and Innovation, Finance Watch Conference, Brussels, June.
Zeng, Yao (2016), “A Dynamic Theory of Mutual Fund Runs and Liquidity Management”, Working paper, Harvard University.
Zhu, Haoxiang (2012), “Finding a Good Price in Opaque Over-the-Counter Markets”, Review of Financial Studies, Volume 25, pp. 1255-1285.
ECB Forum on Central Banking, June 2016 184
Comment on “Financial regulatory reform after the crisis: an assessment” by Darrell Duffie By Charles Goodhart233
In life, there are both sins of commission and sins of omission. “Lord, forgive us, for we have done those things that we ought not to have done, and we have not done those things that we ought to have done.” In his excellent paper on the post-crisis regulatory reform, Darrell Duffie (2016) has focused, perfectly naturally, on assessing the four core elements of what the regulatory authorities have tried to do, i.e. have there been sins of commission? With one minor exception which I shall come to later, I broadly share his judgements. Anyhow Darrell is the world’s leading academic expert on the structure and working of derivatives and money markets, and on these topics I sit at his feet.
But what neither he nor Stijn Claessen (2016) focuses on are those areas of regulatory relevance that the authorities have refrained from touching, but should have, i.e. sins of omission.
The first of these is the treatment of housing finance. In his Executive Summary, Darrell states that “the biggest underlying sources of risk to the financial system were [first] poorly monitored and excessive residential financing”, while Stijn adds that “A big item here is the amount and form of housing finance given, besides its large role in booms and busts, its limited productive impact”. And, as Mian and Sufi have documented in a recent NBER Working Paper, it is the collapse of house prices that cause first-order real distress in financially driven downturns.
So, the form and amount, and regulation, of housing finance is a big issue. What has been done to tame the boom and bust cycle of credit-financed real estate? Not much at all. There has been some sporadic, not comprehensive, increase in the allocation of macroprudential powers to some, but not all, central banks. But I rather doubt if these will be applied strongly enough to work effectively. It is not only Brainard caution; if you do not have a clear appreciation of the effects of your instrument, do it gently. It is also that any attempts to rein in a housing boom are likely to be politically and publicly contentious – think back to the context of 2005-06. And the measures to be deployed may well be only partially effective. Governor Mark Carney takes pride in having raised core Tier 1 equity in the United Kingdom by a factor of ten times, but believes, I think, that this has had only a small effect in reducing bank lending. If so, how can a rise in bank capital ratios against mortgage lending, of a small fraction of that percentage, be expected to have any significant effect on such lending at a time of confident optimism about future rising house prices?
233 London School of Economics.

ECB Forum on Central Banking, June 2016 185
I have lived through three major financial crises in the United Kingdom: the fringe bank crisis in 1973-74, the Exchange Rate Mechanism (ERM) crisis in 1991-92 and the Great Financial Crisis in 2008-09. All have involved at their heart a real estate – commercial and residential – bubble and bust. You will notice that each of these was 17 years apart. Using the long-hallowed econometric assumption that the future will be exactly like the past, this leads me to warn you, of course with much confidence, to pencil in 2025 as the date of the next financial crisis!
It is not as if there have been no proposals for structural reform in housing finance: the wider adoption of Danish-style covered bonds, or the proposal of Mian and Sufi for shared-responsibility mortgages, come to mind. But rather than attempting to improve the structure of housing finance, it still remains privileged, as for example in the net stable funding ratio where “unencumbered residential mortgages with a residual maturity of one year or more and with a risk weight of less than or equal to 35% under the Standardised Approach” get a required stable funding (RSF) ratio of 65% (Basel Committee on Banking Supervision (2014), p. 11). For another indication of inertia, consider the failure to work out what best to do with Fannie and Freddie in the United States.
If we had to give a date, a turning point, to the occasion that shifted us from a relatively stable to a relatively unstable system of housing finance, it is, I would propose, the switch from a system in which mortgage finance was provided by a group of dedicated mutual specialist and conservative institutions, such as building societies and savings and loan associations, financed almost entirely by sticky personal deposits, to mortgage finance provided by limited liability, profit-maximising banks and shadow banks, financed not only at the margin, but often quite largely, by informed, uninsured, wholesale deposits.
And this brings me to my second point, which is the unwillingness of the regulatory authorities to intervene in matters of governance and remuneration. It has been a matter of surprise to me that the authorities are prepared to impose detailed requirements on banks’ capital, liquid asset holdings, risk management procedures, etc. but refrain from interfering in those matters, governance and remuneration, that more fundamentally influence personal incentives, and hence business decisions.
Oceans of ink have been used to examine and deplore the incentive and moral hazard effect of deposit insurance, whereas much less attention has been paid to the more powerful and similar implications of limited liability, especially on those in a position to influence a bank’s decision, and in situations with a debt overhang.
Now that bail-inable bank creditors face a risk of being switched into being equity holders, willy-nilly, and not at a time or under conditions of their own choosing, should they not also be given a larger say, and vote, on the direction of the bank’s management? My own worry is that the proposed system of bank bail-in may not survive a widespread systemic crisis because of its likely adverse effects on financial markets generally, of which events earlier in January 2016 gave us a brief foretaste.
Bail-out has been the best method of stopping a financial disaster, and hence the best possible use of taxpayer money. But this is now prevented by a political and public backlash. Did the politicians and public really want their financial institutions shuttered? Was the fury directed not so much at the salvation of the banks, but rather at the rescue of

ECB Forum on Central Banking, June 2016 186
the individual bankers? Perhaps what we should aspire to is a return of all the SIFIs234 to a condition of partnership, where the executive decision-makers, the partners, have in effect unlimited liability. So that if a bank has to be bailed out, the partners should pay up all they have. Claw-back was a step in the right direction, but only a small step where the distance yet to travel is much greater.
Can I suggest that the main problems of financial stability may lie in governance and incentives rather than in the details of capital and liquidity requirements.
But, finally, I want to comment on one aspect of Darrell’s masterful paper. He notes, quoting the Bank of England’s Financial Policy Committee, that “the leverage-ratio rule is meant as a backstop for the risk-weighted-asset capital requirement because regulatory risk measures may not vary sufficiently with the true riskiness of assets”. True, but I think that the case for applying a leverage ratio goes further than this. As Charlie Calomiris and others have shown, e.g. Calomiris and Herring (2011), the prior leverage ratio was a reasonable predictor of failures in 2008-09, whereas the prior RWA ratio had no predictive ability at all. Moreover, the basic leverage ratio is, in some respects and in principle, simple, whereas the RWA ratio is both complex and subject to politically inspired capture, not least by the housing lobby.
While it is certainly the case, as Darrell argues, that a leverage ratio discriminates against low-profit high-asset activities, with certain adverse consequences for the liquidity of some key money markets, such as the US GCF235 repo market, I would not want to respond to that concern by reinserting some risk-weightings into the leverage ratio by the backdoor.
Where the leverage ratio calculation is, in any case, anything but simple lies in its allowance for netting offsetting positions. Of Darrell’s various proposals for dealing with this issue, my own preference would be for a much more liberal and constructive approach to netting allowances in this and similar markets.
References
Basel Committee on Banking Supervision (2014), Basel III: the net stable funding ratio, Bank for International Settlements, October.
Calomiris, C.W. and Herring, R.J. (2011), “Why and How to Design a Contingent Convertible Debt Requirement”, available at SSRN, April 19.
Claessens, S. (2016), “Regulation and structural change in financial systems”, paper presented at the 2016 ECB Forum on Central Banking, Session 2: Financial regulatory challenges, Sintra, 29 June.
234 Systemically important financial institutions. 235 General collateral finance.

ECB Forum on Central Banking, June 2016 187
Duffie, D. (2016), “Financial regulatory reform after the crisis: an assessment”, paper presented at the 2016 ECB Forum on Central Banking, Session 2: Financial regulatory challenges, Sintra, 29 June.
Mian, A. and Sufi, A. (2016), “Who Bears the Cost of Recessions? The Role of House Prices and Household Debt”, NBER Working Paper, No 22257, May.

ECB Forum on Central Banking, June 2016 188
Regulation and structural change in financial systems236 By Stijn Claessens237
Abstract
Financial systems have undergone many changes over the past few decades due to real economic developments, advances in technology, globalization, shifts in regulatory paradigms, and the global financial crisis. As systems change, notably in information processing, trading, and interactions between banks and markets, the nature of market failures and sources of systemic risks alter. Longer-run regulatory trends, however, do not sufficiently acknowledge these shifts nor necessarily encourage types of financial systems (“financial structures”) that best serve economies in the medium term. To rebalance, the paper highlights the need in many countries for more non-bank forms of financing, notably equity markets, and calls for extending macroprudential policies’ reach to non-banks and ensuring more systemic oversight of non-bank markets, while revisiting the tendency to adopt bank-type regulations for non-bank activities.
1 Introduction
The main question this paper addresses is how to best adapt financial regulation and supervisory approaches to changes in real economies and financial systems. Changes in real economies arise from market forces, including real globalization (trade and investment), shifts in the sources of productivity and growth, and longer-run (demographic) trends. Changes in financial services provision relate to advances in technology, and continued financial innovation and globalization. Any adaption of regulation in the light of these changes should consider its longer-run trend, notably a move away from structure and conduct requirements, and towards emphasizing capital adequacy and fair value accounting, combined with public disclosure, as incentive and
236 I would like to thank Tobias Adrian, Thorsten Beck, Arnoud Boot, Mark Carey, Asli Demirgüç-Kunt, Philipp
Hartmann, Daniela Klingebiel, Nellie Liang, Stan Maes, David Marques-Ibanez, Arun Muralidhar, Zoltan Pozsar, Lev Ratnovski, Sunil Sharma, Manmohan Singh, an anonymous reviewer, the discussant, Hyun Shin, and conference participants for comments, Nicholas Coleman for extensive help with the estimations, and Michael Donnelly for excellent research assistance. I have also benefited from discussions with many colleagues at the Federal Reserve Board and others. Views expressed in this paper are those of the author and should not be attributed to the Board of Governors of the Federal Reserve System or any other institution.
237 Federal Reserve Board, University of Amsterdam, and CEPR.

ECB Forum on Central Banking, June 2016 189
disciplining tools. And it should consider the nature of finance, which adapts not only to real and financial developments, but also to regulations.238
Obviously, addressing the question requires an objective. Most important are economic growth and financial stability, but one could also include access to financing for special groups (e.g. SMEs, housing), or broader (welfare) goals, including on inequality. The growth and stability objectives can overlap, but also conflict. And there surely is no clearly defined optimal, which in any case would vary by country (and preferably its society opines on it). Acknowledging that firm objectives are fraught with room for errors, analyzing longer-term patterns is challenging, many relationships are tenuous, and besides regulations, supervisory and regulatory approaches, legal and other formal rules, as well as taxation matter, the premise of the paper nevertheless is that by altering regulations, one can improve on growth and financial stability outcomes.
Research has analyzed the role of regulation in part through the lens of financial structure, that is, the mix of forms and types of services being provided (e.g. banks vs. markets, the size of shadow banking).239 Financial structure was for some time considered to be of little relevance, also as countries at similar levels of development have very different structures. Advances in technology, the greater availability and use of hard information, and more internationalized financial systems, however, have enhanced the scope for and increased the benefits of market-based intermediation and its complementarities with banking. And indeed market-based intermediation has grown faster than bank-based, notably in advanced countries. Also, as (per capita) income increases, countries’ financial structures tend to move towards non-bank financing. Importantly, new literature and analyses consistently show that, as countries develop, the marginal contribution of banks to economic growth declines, while that of capital markets increases, notably as equity markets are better at promoting innovation and productivity, and financing new sources of growth.
While more market-based financing can be beneficial, especially for those (advanced) countries currently facing low growth, at the same time, as also shown by the global financial crisis (GFC), it can introduce new risks. More use of technology and a greater range of actors can increase the tendency for short-term, more transaction-oriented financing and collateralized trading, and reduce the willingness of market participants to invest in relationship, monitoring and governance roles (as they expect to be less able to recover the associated (upfront) costs). While from the supply-side, complementarities
238 Although the global financial crisis (GFC) and its aftermath have led to many changes, including large-scale
government interventions and many new regulations, these, while obviously important, are not much analyzed here (see Duffie’s paper in this volume for an assessment), although they are neither necessarily taken for granted. Obviously, one can call more regulations and increased supervision a structural trend, but that would make the topic to some degree moot. Furthermore, although societies’ risk-return preferences have shifted since the GFC, regulatory and political economy cycles can reverse (Aizenman (2009); Dagher (2016)). Having said this, I assume the new regulations and stronger enforcement to largely prevail, notably the greater emphasis on system-wide oversight, macroprudential policies, and reducing too big to fail problems and the adverse effects of interconnections. The paper also assumes a sensible approach to crisis management and restructuring, including reducing non-performing loans, restructuring weak banks, and a rationalizing of banking systems burdened by (too many) banks with low cost efficiencies.
239 Other structure aspects include the source and destination of financing (e.g. housing vs. corporate sector), and industrial organization aspects (e.g. ownership structures, concentration, and interdependencies). The paper does not review most of these dimensions, including how they evolve, which factors – including regulations – may be driving differences, and the potential effects on growth and financial stability. Much has been written on these issues and only key relevant findings will be highlighted.

ECB Forum on Central Banking, June 2016 190
between banks and markets have arguably increased, data suggest that their economic growth benefits have declined over time. As financial services industries change, market failures also alter, with concerns including, besides systemic (solvency) risks in banks, a greater scope for externalities in financial markets. And as systems become more diverse, nationally and internationally, having coherent regulation and supervision becomes more challenging.
How best to balance growth objectives and risk concerns depends importantly on both specific regulations and institutional structures for systemic oversight. The broad regulatory pattern over past decades has been to move away from structure and conduct rules, leaving few or no entry barriers and limitations on products. In its place has come self-regulation – based on fair value (“mark to market”) valuation and accounting, disclosure and related market-based discipline, accompanied by capital-based (prudential) regulation. Many elements of this paradigm, used to strengthen banking systems in recent years, are now being applied to other investor classes, including money-market funds (MMFs) and institutional investors, such as insurance corporations and pension funds. Complementary measures are being put in place to ensure that market-based financing does not benefit from (implicit) backstops from the regular banking system.
While current approaches try to address risks in banking systems and reduce the scope for regulatory arbitrage, the paper argues that they can ignore other market failures which can also lead to systemic risks. Notably, a homogenization of business models makes for less overall diversity, creates more scope for perverse strategic complementarities, and reduces incentives for productive innovation. As such, a revised approach to non-bank forms of intermediation is needed. It will be important to implement macroprudential policies specific to the market failures and systemic risks that can arise in market-based financing. Complementary analyses need to take a broad view of regulations and supervisory actions, including both financial and economic outcomes, and examine the interactions between and across institutions, markets, participants, and jurisdictions, and across types of risks. A related need is to consider more explicitly the productivity of what is being financed and how, and the demand for specific financial assets. For many countries, this means to limit and better structure real estate financing, given its pernicious effects on financial stability (and limited impact on economic growth), and to more explicitly respond to the large demand for safe assets – related to demographical shifts, the declining price of investment, and savings gluts. Most importantly, since systems evolve and adapt, and as rules are hard to design preemptively, the paper argues that the key priority is for greater system-wide surveillance, in particular of securities and other non-bank markets. This implies in turn that many countries need to reform their regulatory governance to clarify responsibilities, and to allow for and incentivize appropriate interventions as systemic risks emerge.
The topic is of interest to most countries as they continue to adopt new regulations and, to some degree, (re-)calibrate existing ones. While the paper does not review current regulatory approaches and progress in detail, it notes that these have largely focused on banking system stability. Less thought has been given to what regulation is best for achieving economic growth and overall financial stability. The topic is arguably of special interest to the EU, and notably the euro area, given its low economic growth, and still
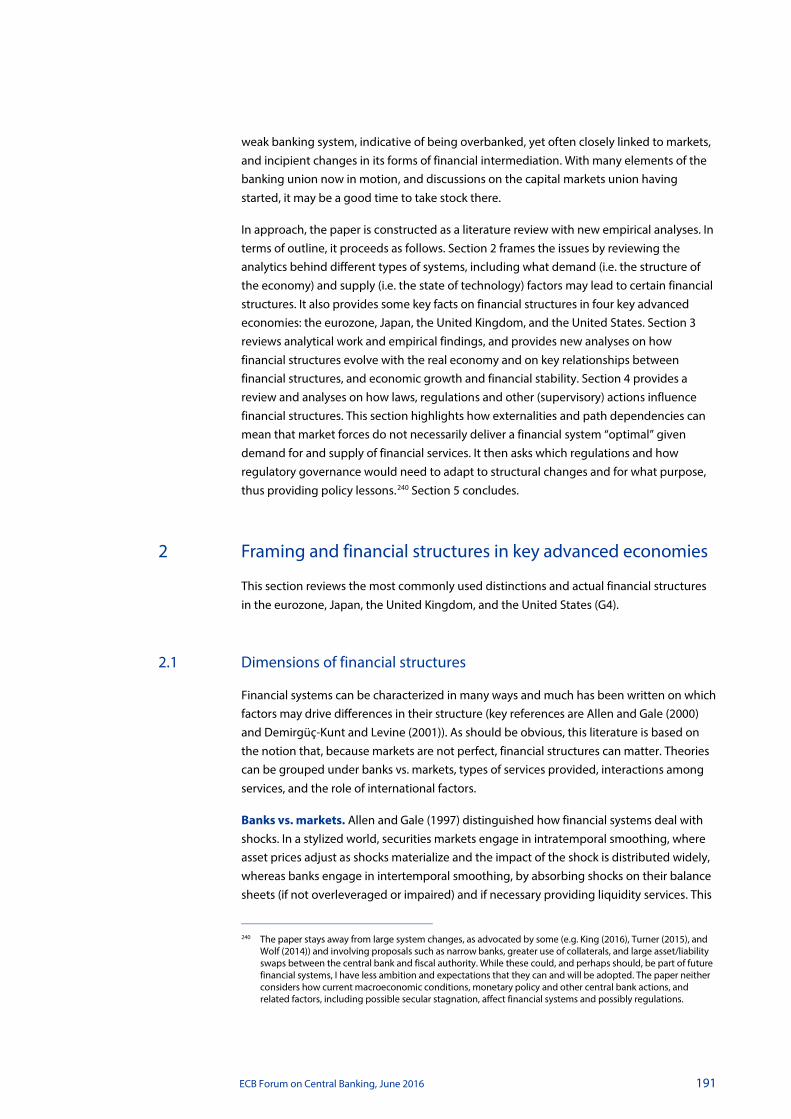
ECB Forum on Central Banking, June 2016 191
weak banking system, indicative of being overbanked, yet often closely linked to markets, and incipient changes in its forms of financial intermediation. With many elements of the banking union now in motion, and discussions on the capital markets union having started, it may be a good time to take stock there.
In approach, the paper is constructed as a literature review with new empirical analyses. In terms of outline, it proceeds as follows. Section 2 frames the issues by reviewing the analytics behind different types of systems, including what demand (i.e. the structure of the economy) and supply (i.e. the state of technology) factors may lead to certain financial structures. It also provides some key facts on financial structures in four key advanced economies: the eurozone, Japan, the United Kingdom, and the United States. Section 3 reviews analytical work and empirical findings, and provides new analyses on how financial structures evolve with the real economy and on key relationships between financial structures, and economic growth and financial stability. Section 4 provides a review and analyses on how laws, regulations and other (supervisory) actions influence financial structures. This section highlights how externalities and path dependencies can mean that market forces do not necessarily deliver a financial system “optimal” given demand for and supply of financial services. It then asks which regulations and how regulatory governance would need to adapt to structural changes and for what purpose, thus providing policy lessons.240 Section 5 concludes.
2 Framing and financial structures in key advanced economies
This section reviews the most commonly used distinctions and actual financial structures in the eurozone, Japan, the United Kingdom, and the United States (G4).
Dimensions of financial structures 2.1
Financial systems can be characterized in many ways and much has been written on which factors may drive differences in their structure (key references are Allen and Gale (2000) and Demirgüç-Kunt and Levine (2001)). As should be obvious, this literature is based on the notion that, because markets are not perfect, financial structures can matter. Theories can be grouped under banks vs. markets, types of services provided, interactions among services, and the role of international factors.
Banks vs. markets. Allen and Gale (1997) distinguished how financial systems deal with shocks. In a stylized world, securities markets engage in intratemporal smoothing, where asset prices adjust as shocks materialize and the impact of the shock is distributed widely, whereas banks engage in intertemporal smoothing, by absorbing shocks on their balance sheets (if not overleveraged or impaired) and if necessary providing liquidity services. This
240 The paper stays away from large system changes, as advocated by some (e.g. King (2016), Turner (2015), and
Wolf (2014)) and involving proposals such as narrow banks, greater use of collaterals, and large asset/liability swaps between the central bank and fiscal authority. While these could, and perhaps should, be part of future financial systems, I have less ambition and expectations that they can and will be adopted. The paper neither considers how current macroeconomic conditions, monetary policy and other central bank actions, and related factors, including possible secular stagnation, affect financial systems and possibly regulations.

ECB Forum on Central Banking, June 2016 192
classification overlaps to some degree with the distinction relationship vs. arms-length intermediation, and why securities markets, and equity markets in particular, are good at aggregating information into one asset price (Allen (1993)). Another difference is between universal banking and specialized banking, e.g. commercial and investment banking separated. While these three differences need not exactly overlap, much of the literature considers bank-orientation, relationship-based and universal banking on the one hand, and market-orientation, arms-length lending and specialized banking on the other. Similarly, the relative importance of bank intermediated funds, i.e. credit to the non-financial sector, vs. capital markets, i.e. its capitalization, with the latter typically covering equity and sometimes also bond markets, are used to classify financial systems.241
Type of financial services. Another way of classifying systems is by the mix of financial functions and services being provided (e.g. Merton and Bodie (1995); Levine (2005)). Systems can, say, largely be involved in payments or transferring resources over time. This classification comes closer to considering the type and degree of financial frictions, individual and collective, that specific services try to overcome or reduce. Many such frictions exist: information asymmetry, principal agent, adverse selection, hold-up, enforcement or other problems intermediaries and markets face in providing financial services. This approach often frames financial services provision as a corporate finance or contracting problem, suggesting, given also the types of (idiosyncratic) shocks, what specific security, e.g. debt or equity, is best suited to overcome a specific friction (e.g. Stulz (2000); Tirole (2006)). In principle, this “optimal security design” view calls for classifying countries by the type and severity of frictions prevalent as financial structures are to some degree their manifestations (see Dabla-Norris et al. (2015) for related modeling).
Interactions among financial services. In practice, classifications based on institutional form, service or friction are challenging. A specific form can provide multiple services and, conversely, different forms can provide the same service or overcome the same friction. The economics of supplying services, where there can be both competition and complementarity between various forms at the product, institution and system level (Adrian and Shin (2010); Boot and Thakor (2014), review) then also become important. For example, bank loans and bond financing can compete, as when they both provide external financing, but also complement, as when firms optimally use a mix of instruments to overcome contracting and governance frictions. At the institution level, given economies of scope, some bundles of services may be provided cheaper compared to individual provision. At the system level, complementarities can be on the liability side, as when the development of capital markets directly matters for banks by reducing the cost of equity and debt for banks, especially relevant today as repo markets are important for funding. On the asset side, a complementarity is securitization where banks are involved in underwriting and help overcome information asymmetries, but then need capital markets. And there are many indirect channels, as when asset prices affect collateral values and facilitate bank financing (e.g. house prices and mortgages).
241 Further, more refined classifications can be made of course, such as regarding the importance of specific types
of non-bank financial institutions, e.g. leasing and factoring companies, or the importance of pension, insurance, and other institutional investors. And more recently emphasis has been on shadow banking, a subset of non-banks.

ECB Forum on Central Banking, June 2016 193
While not new, these interactions and complementarities have been increasing.242 Greater use of information technology increases the economies of scope at the institution level – as data can be used more easily for multiple products. It allows for greater separation in and increases the use of (value-added) chains, makes claims more tradeable, reduces information asymmetries, and lowers switching costs for wholesale (and retail) customers. This is reflected in the growing use by banks of secured and shorter-term type funding, and larger involvement in capital markets. Technological advances also encourage banks to use franchise value from ongoing (relationship-based) activities to engage in capital market activities and scale up their returns, albeit with greater risk profiles (Boot and Ratnovski (2016)). Many banks, large ones especially, are no longer the text-book ones that take household deposits and on-lend these to corporations, but rather manage risks in various markets, domestic and international, trading claims and arbitraging across markets, all using their competitive advantage. As Shin (2009a, p. 110) puts it, “ ... in a modern market-based financial system, banking and capital market conditions should not be viewed in isolation.”
Advances also allow for more specialization, making vertical and other forms of integration less desirable, thereby affecting markets and structures.243 More recently, fintech, defined here as financial service provision by non-financial corporations, is starting to affect services such as small scale payments and lending (World Economic Forum (2015)). While promising higher productivity, lower costs, and better access to services, as new providers engage in “cream skimming”, it also alters the interactions between banks and other markets (see Banque de France (2016) for a collection of articles, and World Economic Forum (2016) for industry views on the implications of fintech). All these shifts blur the distinction between types of provider, function, and friction.244 More generally, as the financial sector is very much in flux (Boot (2014)), many classifications, like the dichotomy banks vs. markets, are increasingly less relevant.
Internationalization. The international context can alter how one views financial structures, say if a country disproportionally exports or imports certain services. Before the GFC, and still today, many European countries export(ed) banking services on a large scale. Key financial centers like the United Kingdom provide many capital market services for other countries, and France, Ireland and Luxembourg have large regional roles in mutual fund services. While these centers make Europe overall somewhat less bank-based, there are still home biases, as in the assets held by households (deposits locally). Even in 242 See De la Torre, Feyen and Ize (2013) for a review and related analyses. Modeling (e.g. Song and Thakor (2013))
shows that there can not only be co-evolution between bank and market financing, but also competition and complementarity at the system level, which can change over time, notably due to political interventions that are more skewed towards the banking system.
243 Changes in technology and related productivity shifts can alter competitive structures when they make for fewer institutions with the scale to defer the high (fixed) investments, but then needing to operate in both banking and capital markets. Effects can manifest themselves in very general, e.g. overall market concentration, and specific ways, e.g. new trading systems owned by a few players.
244 Another aspect is the need for coordination in an economy. When less developed, large banks may play a coordinating role in industrialization, as often claimed for Germany. And overcoming collective market failures obviously matters for securities markets. Also important can be the balance between large and small banks, as small banks may finance small firms with greater labor intensity, while “too many” transaction banks can be harmful due to cream-skimming. The ownership of financial institutions, e.g. foreign vs. domestic banks, state-owned vs. private, obviously matters, including regarding the role of the state in resource allocation. Another dimension is concentration, including size of banks, and related too big to fail and systemic risk. The (global) industrial organization of investment banking may matter for capital markets (Goodhart and Schoenmaker (2016)). I defer all these issues.
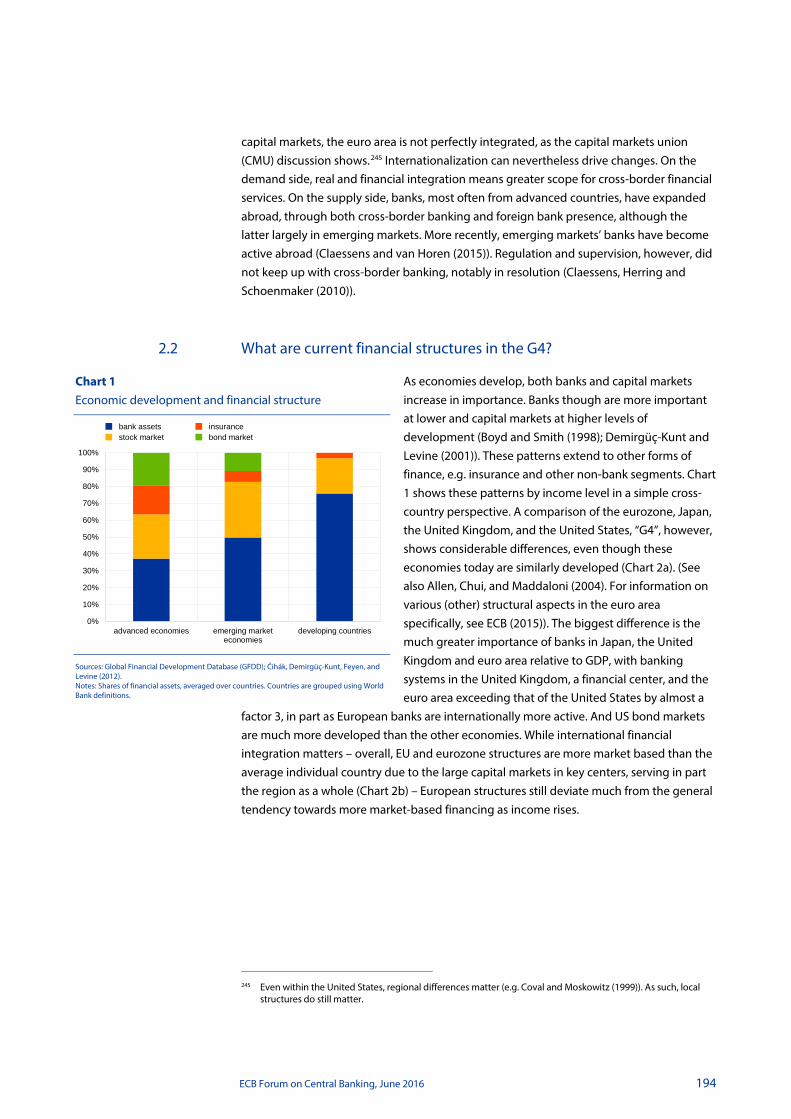
ECB Forum on Central Banking, June 2016 194
capital markets, the euro area is not perfectly integrated, as the capital markets union (CMU) discussion shows.245 Internationalization can nevertheless drive changes. On the demand side, real and financial integration means greater scope for cross-border financial services. On the supply side, banks, most often from advanced countries, have expanded abroad, through both cross-border banking and foreign bank presence, although the latter largely in emerging markets. More recently, emerging markets’ banks have become active abroad (Claessens and van Horen (2015)). Regulation and supervision, however, did not keep up with cross-border banking, notably in resolution (Claessens, Herring and Schoenmaker (2010)).
What are current financial structures in the G4? 2.2
As economies develop, both banks and capital markets increase in importance. Banks though are more important at lower and capital markets at higher levels of development (Boyd and Smith (1998); Demirgüç-Kunt and Levine (2001)). These patterns extend to other forms of finance, e.g. insurance and other non-bank segments. Chart 1 shows these patterns by income level in a simple cross-country perspective. A comparison of the eurozone, Japan, the United Kingdom, and the United States, “G4”, however, shows considerable differences, even though these economies today are similarly developed (Chart 2a). (See also Allen, Chui, and Maddaloni (2004). For information on various (other) structural aspects in the euro area specifically, see ECB (2015)). The biggest difference is the much greater importance of banks in Japan, the United Kingdom and euro area relative to GDP, with banking systems in the United Kingdom, a financial center, and the euro area exceeding that of the United States by almost a
factor 3, in part as European banks are internationally more active. And US bond markets are much more developed than the other economies. While international financial integration matters – overall, EU and eurozone structures are more market based than the average individual country due to the large capital markets in key centers, serving in part the region as a whole (Chart 2b) – European structures still deviate much from the general tendency towards more market-based financing as income rises.
245 Even within the United States, regional differences matter (e.g. Coval and Moskowitz (1999)). As such, local
structures do still matter.
Chart 1 Economic development and financial structure
Sources: Global Financial Development Database (GFDD); Čihák, Demirgüç-Kunt, Feyen, and Levine (2012). Notes: Shares of financial assets, averaged over countries. Countries are grouped using World Bank definitions.
0%
10%
20%
30%
40%
50%
60%
70%
80%
90%
100%
advanced economies emerging marketeconomies
developing countries
bank assetsstock market
insurancebond market

ECB Forum on Central Banking, June 2016 195
Chart 2a Financial structures in the G4 (euro area, Japan, United Kingdom, and United States)
(financial assets/GDP, percentages)
Chart 2b Financial structures in Europe: country averages vs. weighted averages
(percent of total financial development)
Source: Global Financial Development Database (GFDD); Čihák, Demirgüç-Kunt, Feyen, and Levine (2012). Note: Weighted averages depict the ratios for whole group.
Reflecting the factors highlighted, financial structures have changed over the last few decades. The share of market-based financing, including shadow banking, had been increasing before the crisis in all the G4 countries (Charts 3a-b). Another major shift has been in what is being financed. While trade and government finance was the mainstay lending activity of commercial banks for centuries, starting in the early 20th century banks became more important for financing of corporate investment. And after the mid-20th century, the financing of households, mortgages, and consumer credit sharply increased.246 Today, small differences exist among the G4 in destinations (Charts 3c-d). Still, the corporate sector gets more credit in the euro area and Japan, and the household 246 Jorda, Schularick, and Taylor (2016) show that for 17 currently advanced countries household financing was
only some 30% of bank lending in 1900, but grew to some 60% in 2012. See also Cerutti, Dagher, and Dell'Ariccia (2015) for country comparisons.
0
50
100
150
200
250
300
350
400
450
2007 most recentyear
2007 most recentyear
2007 most recentyear
2007 most recentyear
euro area Japan United Kingdom United States
bank assets / GDP (%)stockmarket cap / GDP (%)
insurance assets / GDP (%)bond market cap / GDP (%)
0%
10%
20%
30%
40%
50%
60%
70%
80%
90%
100%
simple average weighted average simple average weighted average
euro area European Union
bank assetsstockmarket cap
insurance assetsbond market cap

ECB Forum on Central Banking, June 2016 196
sector more in the United Kingdom and United States, even though less so since the GFC. Another trend is that the generation and management of savings has moved from households to corporations and institutional investors, among others due to lower capital intensities (Doettling and Perotti (2016)), and better technology for managing (surplus) funds. As savings patterns have changed, combined with greater intra-financial system demand for collateralized financing, the demand for safe assets has changed, leading to supply responses, including the rise of shadow banking (Claessens et al. (2012); Pozsar, (2011, 2015)).
Chart 3 Shadow banking, and corporate and household credit
a) Shadow banking b) Shadow banking
(percent of GDP) (percent of banking assets)
c) Corporate credit d) Household credit
(percent of GDP) (percent of GDP)
Sources: FSB (2015a); IMF (2014); and BIS “Credit to the non-financial sector” series.
The GFC interrupted these trends in some ways, but also spurred them on in other ways. It led to a sharp reduction in securitization, notably in the United States, and savings shifted toward banks and, in the United States, away from MMFs. Banks, under market and regulatory pressures, shrunk lending activities and increased investments in safe assets, in part driven by new regulations (and sometimes perverse sovereign-bank links). A while before the GFC, the demand for safe, short-term assets was in large part met by privately-
0.0
0.5
1.0
1.5
2.0
2.5
3.0
3.5
4.0
2002 2003 2004 2005 2006 2007 2008 2009 2010 2011 2012 2013 2014
euro areaUnited Kingdom
United StatesJapan
0.0
0.2
0.4
0.6
0.8
1.0
1.2
1.4
1.6
1.8
2002 2003 2004 2005 2006 2007 2008 2009 2010 2011 2012 2013 2014
euro areaUnited Kingdom
United StatesJapan
0.0
0.2
0.4
0.6
0.8
1.0
1.2
2002 2003 2004 2005 2006 2007 2008 2009 2010 2011 2012 2013 2014
euro areaUnited Kingdom
United StatesJapan
0.0
0.2
0.4
0.6
0.8
1.0
1.2
2002 2003 2004 2005 2006 2007 2008 2009 2010 2011 2012 2013 2014
euro areaUnited Kingdom
United StatesJapan
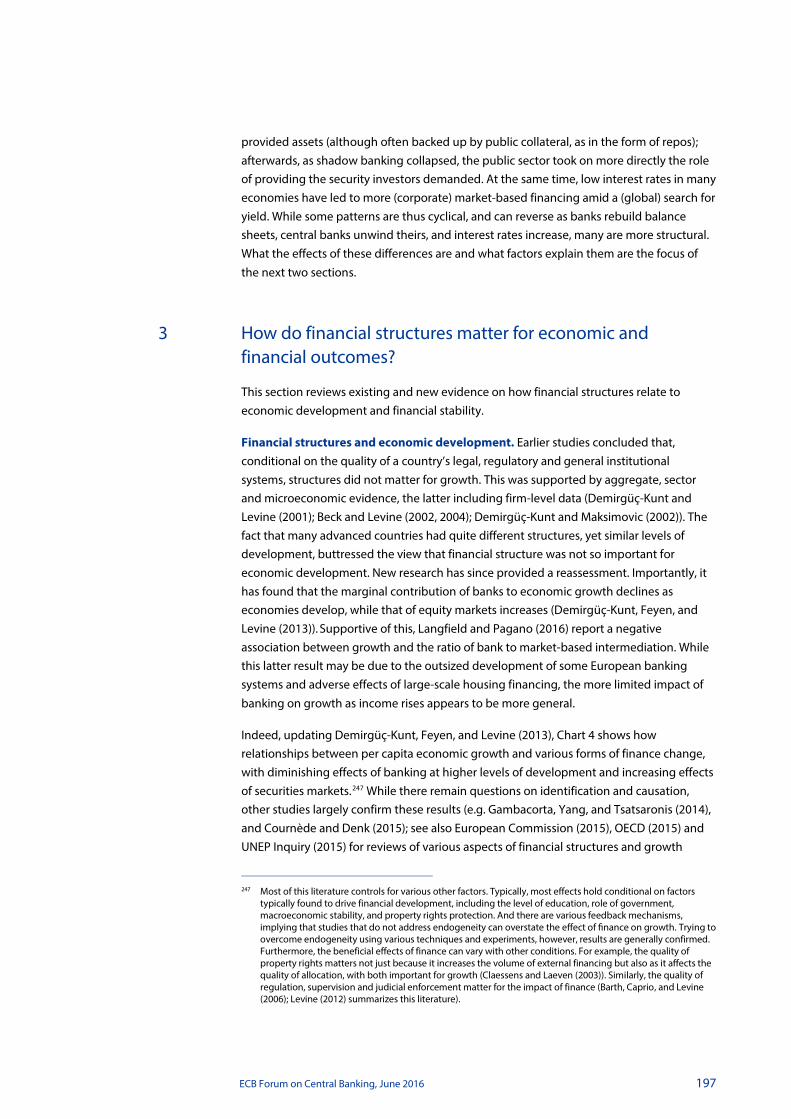
ECB Forum on Central Banking, June 2016 197
provided assets (although often backed up by public collateral, as in the form of repos); afterwards, as shadow banking collapsed, the public sector took on more directly the role of providing the security investors demanded. At the same time, low interest rates in many economies have led to more (corporate) market-based financing amid a (global) search for yield. While some patterns are thus cyclical, and can reverse as banks rebuild balance sheets, central banks unwind theirs, and interest rates increase, many are more structural. What the effects of these differences are and what factors explain them are the focus of the next two sections.
3 How do financial structures matter for economic and financial outcomes?
This section reviews existing and new evidence on how financial structures relate to economic development and financial stability.
Financial structures and economic development. Earlier studies concluded that, conditional on the quality of a country’s legal, regulatory and general institutional systems, structures did not matter for growth. This was supported by aggregate, sector and microeconomic evidence, the latter including firm-level data (Demirgüç-Kunt and Levine (2001); Beck and Levine (2002, 2004); Demirgüç-Kunt and Maksimovic (2002)). The fact that many advanced countries had quite different structures, yet similar levels of development, buttressed the view that financial structure was not so important for economic development. New research has since provided a reassessment. Importantly, it has found that the marginal contribution of banks to economic growth declines as economies develop, while that of equity markets increases (Demirgüç-Kunt, Feyen, and Levine (2013)). Supportive of this, Langfield and Pagano (2016) report a negative association between growth and the ratio of bank to market-based intermediation. While this latter result may be due to the outsized development of some European banking systems and adverse effects of large-scale housing financing, the more limited impact of banking on growth as income rises appears to be more general.
Indeed, updating Demirgüç-Kunt, Feyen, and Levine (2013), Chart 4 shows how relationships between per capita economic growth and various forms of finance change, with diminishing effects of banking at higher levels of development and increasing effects of securities markets.247 While there remain questions on identification and causation, other studies largely confirm these results (e.g. Gambacorta, Yang, and Tsatsaronis (2014), and Cournède and Denk (2015); see also European Commission (2015), OECD (2015) and UNEP Inquiry (2015) for reviews of various aspects of financial structures and growth
247 Most of this literature controls for various other factors. Typically, most effects hold conditional on factors
typically found to drive financial development, including the level of education, role of government, macroeconomic stability, and property rights protection. And there are various feedback mechanisms, implying that studies that do not address endogeneity can overstate the effect of finance on growth. Trying to overcome endogeneity using various techniques and experiments, however, results are generally confirmed. Furthermore, the beneficial effects of finance can vary with other conditions. For example, the quality of property rights matters not just because it increases the volume of external financing but also as it affects the quality of allocation, with both important for growth (Claessens and Laeven (2003)). Similarly, the quality of regulation, supervision and judicial enforcement matter for the impact of finance (Barth, Caprio, and Levine (2006); Levine (2012) summarizes this literature).
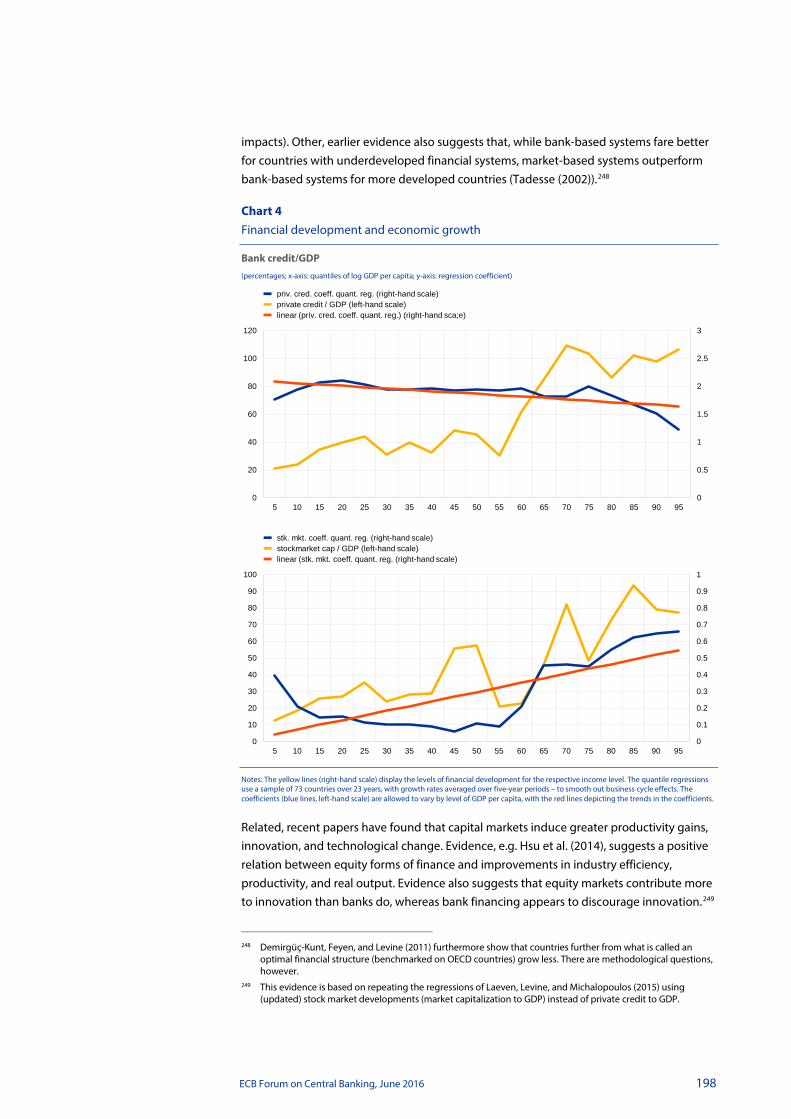
ECB Forum on Central Banking, June 2016 198
impacts). Other, earlier evidence also suggests that, while bank-based systems fare better for countries with underdeveloped financial systems, market-based systems outperform bank-based systems for more developed countries (Tadesse (2002)).248
Chart 4 Financial development and economic growth
Bank credit/GDP
(percentages; x-axis: quantiles of log GDP per capita; y-axis: regression coefficient)
Notes: The yellow lines (right-hand scale) display the levels of financial development for the respective income level. The quantile regressions use a sample of 73 countries over 23 years, with growth rates averaged over five-year periods – to smooth out business cycle effects. The coefficients (blue lines, left-hand scale) are allowed to vary by level of GDP per capita, with the red lines depicting the trends in the coefficients.
Related, recent papers have found that capital markets induce greater productivity gains, innovation, and technological change. Evidence, e.g. Hsu et al. (2014), suggests a positive relation between equity forms of finance and improvements in industry efficiency, productivity, and real output. Evidence also suggests that equity markets contribute more to innovation than banks do, whereas bank financing appears to discourage innovation.249
248 Demirgüç-Kunt, Feyen, and Levine (2011) furthermore show that countries further from what is called an
optimal financial structure (benchmarked on OECD countries) grow less. There are methodological questions, however.
249 This evidence is based on repeating the regressions of Laeven, Levine, and Michalopoulos (2015) using (updated) stock market developments (market capitalization to GDP) instead of private credit to GDP.
0
0.5
1
1.5
2
2.5
3
0
20
40
60
80
100
120
5 10 15 20 25 30 35 40 45 50 55 60 65 70 75 80 85 90 95
priv. cred. coeff. quant. reg. (right-hand scale)private credit / GDP (left-hand scale)linear (priv. cred. coeff. quant. reg.) (right-hand sca;e)
0
0.1
0.2
0.3
0.4
0.5
0.6
0.7
0.8
0.9
1
0
10
20
30
40
50
60
70
80
90
100
5 10 15 20 25 30 35 40 45 50 55 60 65 70 75 80 85 90 95
stk. mkt. coeff. quant. reg. (right-hand scale)stockmarket cap / GDP (left-hand scale)linear (stk. mkt. coeff. quant. reg. (right-hand scale)
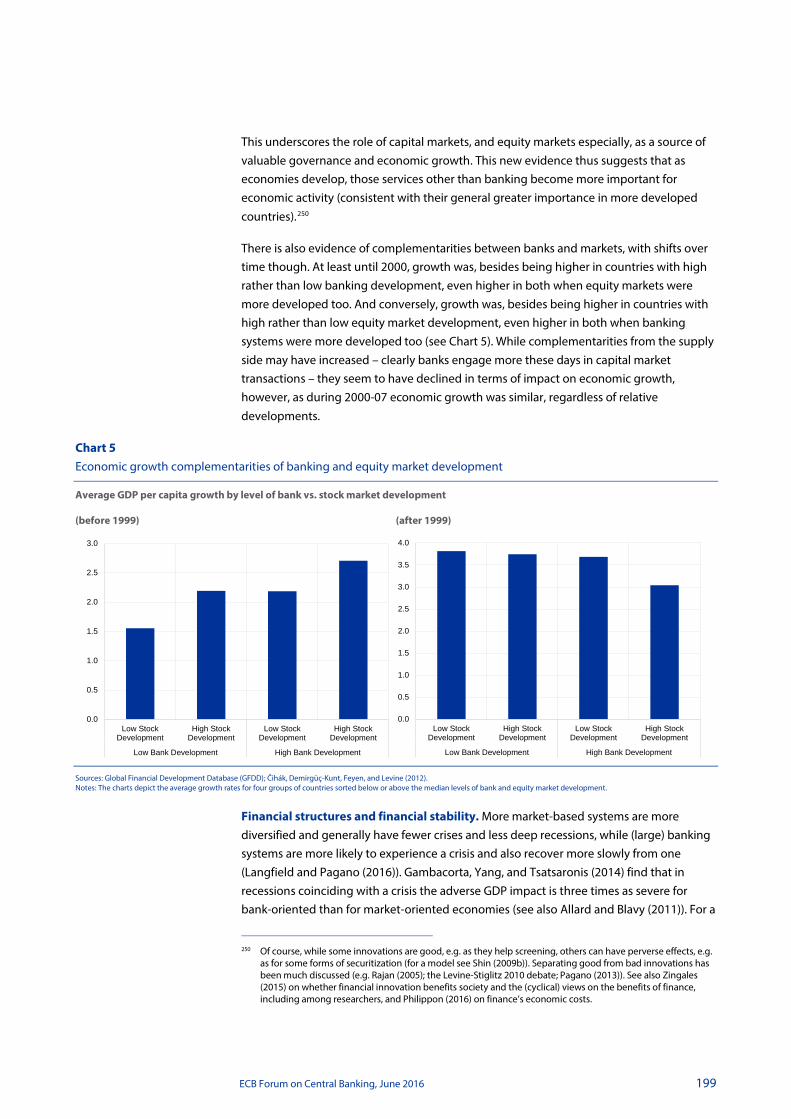
ECB Forum on Central Banking, June 2016 199
This underscores the role of capital markets, and equity markets especially, as a source of valuable governance and economic growth. This new evidence thus suggests that as economies develop, those services other than banking become more important for economic activity (consistent with their general greater importance in more developed countries).250
There is also evidence of complementarities between banks and markets, with shifts over time though. At least until 2000, growth was, besides being higher in countries with high rather than low banking development, even higher in both when equity markets were more developed too. And conversely, growth was, besides being higher in countries with high rather than low equity market development, even higher in both when banking systems were more developed too (see Chart 5). While complementarities from the supply side may have increased – clearly banks engage more these days in capital market transactions – they seem to have declined in terms of impact on economic growth, however, as during 2000-07 economic growth was similar, regardless of relative developments.
Chart 5 Economic growth complementarities of banking and equity market development
Average GDP per capita growth by level of bank vs. stock market development (before 1999) (after 1999)
Sources: Global Financial Development Database (GFDD); Čihák, Demirgüç-Kunt, Feyen, and Levine (2012). Notes: The charts depict the average growth rates for four groups of countries sorted below or above the median levels of bank and equity market development.
Financial structures and financial stability. More market-based systems are more diversified and generally have fewer crises and less deep recessions, while (large) banking systems are more likely to experience a crisis and also recover more slowly from one (Langfield and Pagano (2016)). Gambacorta, Yang, and Tsatsaronis (2014) find that in recessions coinciding with a crisis the adverse GDP impact is three times as severe for bank-oriented than for market-oriented economies (see also Allard and Blavy (2011)). For a
250 Of course, while some innovations are good, e.g. as they help screening, others can have perverse effects, e.g.
as for some forms of securitization (for a model see Shin (2009b)). Separating good from bad innovations has been much discussed (e.g. Rajan (2005); the Levine-Stiglitz 2010 debate; Pagano (2013)). See also Zingales (2015) on whether financial innovation benefits society and the (cyclical) views on the benefits of finance, including among researchers, and Philippon (2016) on finance’s economic costs.
0.0
0.5
1.0
1.5
2.0
2.5
3.0
Low StockDevelopment
High StockDevelopment
Low StockDevelopment
High StockDevelopment
Low Bank Development High Bank Development
0.0
0.5
1.0
1.5
2.0
2.5
3.0
3.5
4.0
Low StockDevelopment
High StockDevelopment
Low StockDevelopment
High StockDevelopment
Low Bank Development High Bank Development

ECB Forum on Central Banking, June 2016 200
large sample of business and financial cycles, using the approach of Claessens et al. (2012) with updated data, the cumulative loss of recessions associated with credit crunches is much larger in bank-based than in market-based systems (see Chart 6). The converse is not true, however, in that equity busts are not worse in market-based systems. The “spare tire” theory, where recovery from a crisis is faster with a more diversified system, has also been confirmed.251 While some of these findings may reflect financial as much as political economy effects, related to the willingness and speed of restructuring, the general pattern tends to stand.
Chart 6 Financial downturns and recessions: bank vs. market-based systems
Recessions with severe credit crunches Recessions with severe equity busts
(quarters; percent of GDP) (quarters; percent of GDP)
Source: Based on Claessens et al. (2016), forthcoming. Notes: Duration for recessions (left-hand scale) is the number of quarters between peak and trough. Cumulative loss (right-hand scale) combines information about the duration and amplitude to measure the overall cost of a recession and is expressed in percent of GDP. Sample: 24 advanced countries. A country is classified as market based if its equity market capitalization to GDP ratio is greater than the sample average. Market-based: Australia, Canada, Finland, Iceland, Japan, Luxembourg, Netherlands, Spain, Sweden, Switzerland, United Kingdom, and the United States. Bank-based: Austria, Belgium, Cyprus, Denmark, France, Germany, Greece, Ireland, Italy, New Zealand, Norway, and Portugal.
While crises have been much studied (e.g. Claessens et al. (2014)), and the adverse effects of credit booms associated with house price increases are now well accepted (e.g. Jorda, Schularick, and Taylor (2016); Cerutti, Dagher, and Dell’Ariccia (2015)), few studies relate financial stability to the relative importance of specific financial functions.252 While microprudentially, limits to maturity transformation are well appreciated, how systemic maturity transformation can drive financial instability was little acknowledged until the GFC (except perhaps for foreign exchange-related mismatches). Hahm, Shim, and Shin (2013) show, however, that the degree of wholesale funding can predict financial crises. More generally, many have argued that the GFC was in large part due to the “run” on short-term, wholesale funding structures, including repos and other securities market-financings. Indeed, related to the instability of privately-produced safe assets (Gorton
251 Levine et al. (2016) however shows that in terms of firms’ access to financing, the effect depends importantly
on the type of legal system, i.e. how well protected shareholders’ rights are, and less on a country’s financial structure, i.e. how well developed stock markets are before a crisis.
252 Financial systems’ industrial organization – as in the degree of contestability, (banking system) concentration and ownership structures – has also been found to matter for financial stability. Again, I do not review these structural aspects.
0
2
4
6
8
10
12
14
16
duration,bank based
duration,market based
cumulative loss,bank based
cumulative loss,market based
0
1
2
3
4
5
6
duration,bank based
duration,market based
cumulative loss,bank based
cumulative loss,market based

ECB Forum on Central Banking, June 2016 201
(2016)), Shin (2013) argues that liability-based measures can be good, timely predictors of crises.
Financial structures and pro-cyclicality. While more market-based systems can provide many benefits – in terms of reducing the likelihood of a crisis and recovering faster and stronger from a crisis – such systems may lead to more short-term volatility, consistent with the fact that they rely more on intratemporal forms of smoothing. This is not limited to higher asset price volatility, but extends itself to greater sensitivity and pro-cyclicality of banks’ balance sheets, and related overall leverage, financing, and funding conditions in these systems. Indeed, analyses (Adrian and Shin (2008, 2014)) show that US investment banks increase their leverage at times when asset prices are high, and thus create pro-cyclicality in financial conditions, whereas the behavior of leverage of US non-financial corporations and households is counter-cyclical and of commercial banks acyclical. Consistent with this, market-based financial systems are found to be associated with greater short-run volatility in bank leverage than bank-based systems (IMF (2006); see also Kalemli-Ozcan, Sørensen, and Yesiltas (2012) for a cross-country analysis of leverage and asset growth).
Building on this work, Chart 7 shows differences in how close changes in financial leverage are associated with changes in assets for those global systemically important banks (G-SIBs) located in market vs. in bank-based financial systems. Specifically, regression results (Table 1) show that the slope is 0.176 higher for G-SIBs headquartered in market-based systems than in bank-systems, confirming the greater balance sheet sensitivity of such banks to changes in capitalization. Combined with their generally larger off-balance-sheet activities, this may also make it more difficult to assess such banks.253 More generally, as market-based intermediation increases, so will likely asset price volatility. And greater use of technology, including by fintech, can also come, besides with its own risks (Lo (2016)), with greater price volatility as pricing get more marginalized.254
253 Supportive evidence comes from the fact that financial conglomerates that engage in multiple activities trade
at a discount relative to if they were broken up in similar, but stand-alone intermediaries (Laeven and Levine (2007)).
254 There is an analogue to ongoing changes in power generation and distribution, where the no-peak marginal provider may be solar-generated. While providers, and users, get benefits, existing utilities still need to have spare capacity to provide at peak, yet by regulation may need to buy the extra generated electricity at the average price. (Another comparison is moving from public to private delivery of postal or transport services, with issues of services for remote areas at a common price.) Such changes can mean more volatility in prices, as they are set by the marginal provider and user (“Uber” pricing model), yet leave a “quantity” problem. Similarly, if services are being provided by fintech, the question arises of who will pay for the infrastructure at peak or turmoil times. Fintech can also reduce the franchise values of existing institutions, thereby raising challenges for fixed-costs recovery and creating “stranded assets”.

ECB Forum on Central Banking, June 2016 202
Chart 7 G-SIBs’ leverage growth vs. asset growth
Table 1 Regression of G-SIBs’ asset and leverage growth: bank-based vs. market-based
(1) (2) (3) (4) (5) (6)
Local Currency Asset Growth (%)
Leverage Growth (%) 0.342*** 0.295*** 0.273*** 0.275*** 0.241*** 0.182**
(6.04) (5.59) (4.91) (3.55) (3.37) (2.32)
Market-based Economy 0.272 0.0767 -3.892***
(0.25) (0.07) (-4.87)
Market X Leverage Growth 0.139 0.110 0.176*
(1.25) (1.13) (1.76)
Fixed Effects:
Year
Bank
Observations 405 405 405 405 405 405
Note: Robust standard errors clustered at the bank level. T-statistics in parentheses. * p<0.10, ** p<0.05, *** p<0.01. Source: Bankscope. Notes: Countries are classified as bank-based (China, France, Germany, Italy, Japan, Netherlands, and Spain) or market-based (Sweden, Switzerland, United Kingdom, and the United States).
-20
-10
010
2030
Ass
et G
row
th -
Infla
tion
(% c
hang
e)
-20 -10 0 10 20 30Leverage Growth (% change)
Bank-based Economies Market-based EconomiesFitted values Fitted values
Source: Bankscope
G-SIBsLeverage Growth vs. Asset Growth
ECB Forum on Central Banking, June 2016 203
4 What is the role of regulation in financial structures?
This section reviews the literature on factors and regulations affecting financial structures, discusses regulatory trends and current reforms, and concludes with regulatory changes that can steer financial structures and improve on economic and financial stability outcomes.255
General drivers 4.1
Many of the drivers of financial development have been identified (see Beck and Levine (2005), and Philippon and Reshef (2013), for reviews).256 While less analyzed, drivers of financial structures are in general similar, but with different weights (De La Torre, Feyen, and Ize (2013)). Endowments can matter as countries with comparative advantage in capital-intensive sectors rely more on bank financing, as it depends more on the security of tangible investment, while countries relying more on intangibles for growth use more market-based financing. Macroeconomic stability matters more for banking than for equity markets, not surprising given the adverse effects of inflation for nominal contracts. Although less emphasized, forms of taxation can drive choices among services, in supply and demand, with debt financing typically favored.
Respective property rights – creditor or minority rights – and their enforcement matter for the development of both, as shown in Charts 8a and 8b. Related, capital markets depend on the quality of corporate governance and other gatekeepers, such as accounting and rating agencies. Most of this is well recognized, albeit with various caveats.257 Less noticed is that equity market and capital market development more generally is more sensitive to
255 Although recent research has recognized financial structures to be important, it is often overlooked for a
number of related reasons: one, regulation often responds to crises and aims to prevent their recurrence, but is not necessarily designed from first principles; two, the effects of structure play out over the long term, beyond the typical horizons of policymakers and legislators; three, structures are affected by and to a significant degree endogenous to many aspects other than regulation, notably to what is happening in the real economy and how services can be provided, e.g. the state of technology; and four, too little is known on how structures matter and what changes them so as to guide policy precisely. While this makes for some trepidation, I argue more is known than what appears to be reflected in day-to-day, regulatory decision-making. And even if not perfectly clear whether and how one can adapt systems “optimally” to structural changes by regulatory and other actions, some principles apply.
256 General economic development, endowments and macroeconomic stability have been found to affect financial development. The law and finance literature highlights the important roles of basic property rights and specific laws – collateral, bankruptcy, and minority rights, all backed up by proper judicial enforcement. Much of this reflects the difference between common and civil laws, which also affects economic development (Beck (2012) reviews). A common law system, besides having stronger property rights, adapts more easily, related to broader issues of political economy and democracy, but also importantly shows fewer path dependencies.
257 As for many aspects of finance, the causal links are not always obvious as there are many feedback loops. For example, bankruptcy rules are considered by some legal scholars to be endogenous to the importance of banks. More generally, there are many endogenous, path-dependent, and non-linear relationships (see further Beck (2012)).

ECB Forum on Central Banking, June 2016 204
the quality of its property rights than the credit market is to its (Charts 8a vs. 8b).258 As such, the limited capital market development in many countries, including private equity, venture capital, and angel financing, is explained by the poor presence and enforcement of specific property rights. And, given greater economies of scale, the lack of harmonization of rules will set smaller markets back.
Chart 8b Equity market development and minority rights
Equity rights index
(stockmarket cap/GDP; percentages)
Source: Claessens (2006), updated with data from WDI-GDF (2011) and Djankov et al. (2008b). Notes: The charts depict countries sorted into four quartiles depending on the strength of their property rights (creditor rights or shareholder rights), adjusted for the extent to which the rule of law is enforced in the country. The creditor rights index, first developed by La Porta et al. (1998), is the summation of four dummy variables, with 4 the highest possible score. The equity rights index is the summation of five dummy variables, with 5 the highest possible score. The rule of law is a measure of the judicial efficiency and integrity of the legal environment, as first reported by La Porta et al. (1998).
While the influence of endowments and (enforcement of) property rights is most profound, regulations do affect financial structures.259 Indeed, using the Abiad and Mody (2005) measures, Langfield and Pagano (2016) find evidence that segment-specific liberalizations affect the development of banking vs. equity markets. A very important factor is the safety net provided to banks and related moral hazard. Clearly, until recently at least, banks in many countries were at little risk of being closed or liquidated when they ran into solvency issues, whereas at least the smaller banks in the United States, a market-based country, did face this threat. While the safety net explanation is not specific, an additional reason important in Europe before the crisis was the push for national champions in light of the Single Market and the euro. Together with political economy
258 Simple regressions show that equity markets are more sensitive with respect to protection of minority rights
compared with credit markets to creditor rights, whereas credit markets are more sensitive compared with equity markets to the rule of law. This is consistent with claims traded in anonymous markets depending to a greater degree on the quality of relevant property rights and regulatory and judicial systems than claims issued by institutions such as banks, where the institutions themselves provide some credibility and enforcement. At the same time, credit markets require protection against expropriation by the state, which depends on the overall rule of law. These findings are consistent with De La Torre, Feyen, and Ize (2013) and Acemoglu and Johnson (2005). The latter finds that (vertical) property rights, protecting against interference by the state, have large effects on general financial development, but (horizontal) contracting ones, allowing agents to contract reliably, only matter for stock markets.
259 Effects are in part less clear as regulations are more endogenous and more easily change or get circumvented. Also, depending on mandates and governance, regulators can help or hinder the development of alternative markets, e.g. bank regulatory agencies may not “allow” for some forms of market-based financing.
0
0.1
0.2
0.3
0.4
0.5
0.6
0.7
lowest quartile second quartile third quartile highest quartile
Chart 8a Banking development and creditor rights
Creditor rights index
(private credit/GDP; percentages)
0
0.1
0.2
0.3
0.4
0.5
0.6
0.7
0.8
0.9
lowest quartile second quartile third quartile highest quartile

ECB Forum on Central Banking, June 2016 205
factors (e.g. Calomiris and Haber (2014)) and perverse bank-sovereign links, these preferences biased financial structures in Europe and many other countries towards banks, including through (quicker) adoption of Basel II. Together these factors allowed for and encouraged a rapid bank asset expansion in Europe over the decades before the GFC, much more so than elsewhere (see further Pagano et al. (2015)). As a related point, this meant a “crowding out” of various non-bank markets and less financial system diversity.
International financial integration and the mix of domestic and foreign institutions matter in various ways. Clearly, securities markets are by nature more international, given economies of scale and related ease to trade across borders, than banking markets. Internationalization can encourage harmonization of rules and supervision, and, importantly, help reduce the influence of vested interests (Rajan and Zingales, (2003a)). The EU banking union, and especially European banking supervision, also show some of the benefits of centralization. Yet, internationalization does not always support reforms. As documented by ECB (2013) and Claessens and Van Horen (2015), prior to the GFC, advanced countries’ banks, including in the eurozone, interacted with each other largely through cross-border banking and much less through local foreign bank (brick and mortar) affiliates, making for less local impact and risk-sharing. By contrast, these same banks were active through foreign bank presence elsewhere. While increased globalization and financial conglomerates spanning multiple markets thus reduce the importance of local financial structures, and create common trends and reform pressures, there remain differences in structures and their impacts.
Lastly, it is important to keep in mind that drivers of financial structures can be idiosyncratic, with path dependencies to play a large role. This is clear from key (current) advanced countries, whose structures differ, as noted, in multiple ways, but not due to factors such as level of development, macroeconomic stability, or enforcement of overall property rights, which are and have been very comparable. Rather, the literature has highlighted certain specific regulations and laws (Fohlin (2016) provides some examples).260
Broad regulatory trends 4.2
While one should be hesitant on how specific regulations may lead to changes, broad regulatory trends over the past decades have (implicitly) led to certain, though not necessarily “optimal” structures. In part in response to technological advances and increased diversity and aiming to achieve more market-oriented systems, there have been moves away from structure and conduct rules, with few or no entry barriers and limitations on financial products and services left (Table 2). This general removal is well known and documented (e.g. Abiad, Detragiache, and Mody (2010)). In its place has come a greater emphasis on self-regulation, with more disclosure and related market-based 260 For example, a tax ruling exempted some shares deposited with banks in Germany from dividend taxes. This
encouraged individuals to deposit shares with banks and helped, in turn, banks to exercise proxy votes in shareholder meetings of non-financial corporations, thereby supporting the universal banking model. Another example is the rise of the MMFs in the United States which was in part due to interest rate controls (regulation Q) in the 1970s, yet their existence is maintained. Other examples of path dependencies include the nature of pension funds (defined contribution vs. defined benefit) related in part to the tax treatment of various savings instruments.
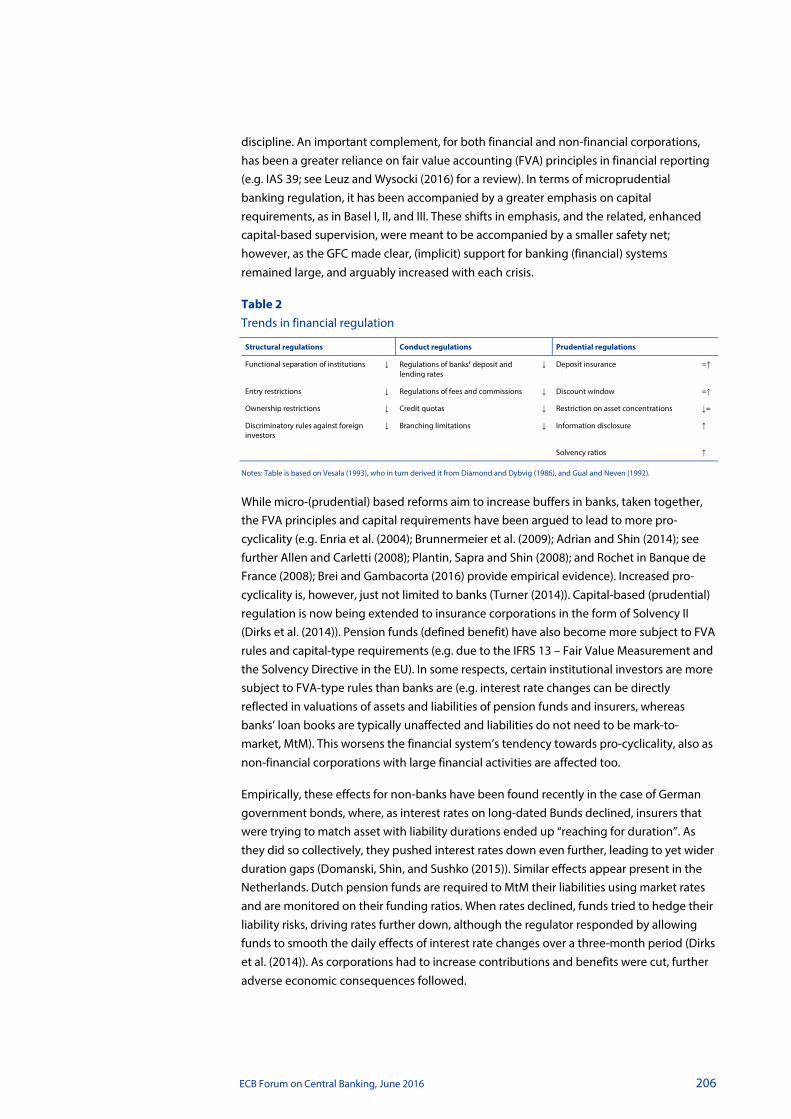
ECB Forum on Central Banking, June 2016 206
discipline. An important complement, for both financial and non-financial corporations, has been a greater reliance on fair value accounting (FVA) principles in financial reporting (e.g. IAS 39; see Leuz and Wysocki (2016) for a review). In terms of microprudential banking regulation, it has been accompanied by a greater emphasis on capital requirements, as in Basel I, II, and III. These shifts in emphasis, and the related, enhanced capital-based supervision, were meant to be accompanied by a smaller safety net; however, as the GFC made clear, (implicit) support for banking (financial) systems remained large, and arguably increased with each crisis.
Table 2 Trends in financial regulation
Structural regulations Conduct regulations Prudential regulations
Functional separation of institutions ↓ Regulations of banks’ deposit and lending rates
↓ Deposit insurance =↑
Entry restrictions ↓ Regulations of fees and commissions ↓ Discount window =↑
Ownership restrictions ↓ Credit quotas ↓ Restriction on asset concentrations ↓=
Discriminatory rules against foreign investors
↓ Branching limitations ↓ Information disclosure ↑
Solvency ratios ↑
Notes: Table is based on Vesala (1993), who in turn derived it from Diamond and Dybvig (1986), and Gual and Neven (1992).
While micro-(prudential) based reforms aim to increase buffers in banks, taken together, the FVA principles and capital requirements have been argued to lead to more pro-cyclicality (e.g. Enria et al. (2004); Brunnermeier et al. (2009); Adrian and Shin (2014); see further Allen and Carletti (2008); Plantin, Sapra and Shin (2008); and Rochet in Banque de France (2008); Brei and Gambacorta (2016) provide empirical evidence). Increased pro-cyclicality is, however, just not limited to banks (Turner (2014)). Capital-based (prudential) regulation is now being extended to insurance corporations in the form of Solvency II (Dirks et al. (2014)). Pension funds (defined benefit) have also become more subject to FVA rules and capital-type requirements (e.g. due to the IFRS 13 – Fair Value Measurement and the Solvency Directive in the EU). In some respects, certain institutional investors are more subject to FVA-type rules than banks are (e.g. interest rate changes can be directly reflected in valuations of assets and liabilities of pension funds and insurers, whereas banks’ loan books are typically unaffected and liabilities do not need to be mark-to-market, MtM). This worsens the financial system’s tendency towards pro-cyclicality, also as non-financial corporations with large financial activities are affected too.
Empirically, these effects for non-banks have been found recently in the case of German government bonds, where, as interest rates on long-dated Bunds declined, insurers that were trying to match asset with liability durations ended up “reaching for duration”. As they did so collectively, they pushed interest rates down even further, leading to yet wider duration gaps (Domanski, Shin, and Sushko (2015)). Similar effects appear present in the Netherlands. Dutch pension funds are required to MtM their liabilities using market rates and are monitored on their funding ratios. When rates declined, funds tried to hedge their liability risks, driving rates further down, although the regulator responded by allowing funds to smooth the daily effects of interest rate changes over a three-month period (Dirks et al. (2014)). As corporations had to increase contributions and benefits were cut, further adverse economic consequences followed.
ECB Forum on Central Banking, June 2016 207
Regulatory trends extend many of these changes to other financial system segments (FSB (2015c)), which have also grown post-crisis (FSB (2015a)). For mutual funds, enhanced requirements have been adopted for MtM and FVA reporting, for more disclosures of net asset values (NAV), for minimum cash balances, and sometimes for capital akin to banks. Although harder to calibrate and fine-tune, such bank-type rules are also being considered for other forms of market-based financing, such as open-end, collective schemes and hedge funds. To reduce the risks of runs and market disruptions, redemptions may be restricted through various tools (fees, gates, suspensions, and requirements for payments in kind). And at the financial activity (instrument) level, minimum margin and haircut requirements akin to capital and leverage requirements are being considered, besides at the bank-to-non-bank level (i.e. securities financing transactions), at the non-bank-to-non-bank level to limit the build-up of leverage (FSB (2015c)).
While there are many investor, consumer protection and microprudential benefits of extending these and other measures to these (growing) segments, on their own, many can increase pro-cyclicality and possibly lead to financial stability risks. Put differently, also to the extent that problems in banking systems are related to the regulatory model used, exporting this model to other, very different parts of the financial system is not necessarily optimal. Using the same approach would reduce financial system diversity (for a model, see Malherbe and Wagner (2016)). It would furthermore undermine the comparative risk-taking advantage of specific investors. Insurance corporations, for example, should by nature be good at classifying assets by risk and provisioning for potential losses over long cycles, using both data and qualitative insights. By encouraging quantitative, “Value at Risk”, and similar modeling that rely heavily on short periods of data, this advantage of rating “through the long cycle” is lost. Also, such models are likely to encourage certain asset allocations, notably more fixed-income, leading to perverse asset liability management effects (e.g. Merton and Muralidhar (2015)) and possibly reducing the supply of long-term equity financing. Furthermore, trying to regulate every aspect of finance may end up in ever greater regulatory and financial complexity, an “arms-race” which regulators will likely lose (Haldane and Madouros (2012)). As such, current (planned) reforms may neither decrease the volatility of market-based finance nor reduce overall systemic risk.
Recent regulatory trends and reversals 4.3
There have been many regulatory reforms recently (FSB (2015b), reports on reforms; Claessens and Kodres (2016), review in general; Beck, Carletti, and Goldstein (2016), Europe specifically). Although many have not yet been tested, reforms primarily aim at stronger banking systems with higher capital buffers. Importantly, reforms do not fundamentally challenge the self-regulation and market discipline paradigm and few reverse regulatory trends. Structural measures proposed, and adopted in some cases, include those of Vickers, Volcker, and Liikanen. These rules, although difficult to implement and coordinate internationally and costly for financial institutions, can have direct financial stability benefits (see Gambacorta and van Rixtel (2013)). Other structural measures are for derivatives to be moved to exchanges and conducted through central counterparties (CCPs). At the same time, such moves can create new too big to fail
ECB Forum on Central Banking, June 2016 208
institutions and need not reduce overall systemic risks (e.g. in the case of adverse selection; Glasserman and Ghamami (2016); see further Singh (2014)). Other, “conduct”-type measures adopted or proposed are the liquidity coverage (LCR) and net stable funding ratios (NSFR), meant to complement Basel III capital adequacy requirements. They can, however, make banks more akin to narrow banking and tie up scarce collateral. In terms of shadow banking, reforms have limited the scope for regulatory arbitrage and increased the costs for banks’ securities financing, and thus reduced “puts” from the regular banking system. But some of these measures, besides being hard to calibrate, fine-tune, and implement, challenge how far one wants to draw the regulatory perimeter.
The most important “conduct” reversal has been the application of macroprudential policies to banks (Claessens (2015), reviews). They can be powerful as they directly affect (aggregate or sectoral) financing, and thereby reduce the incidence of booms and busts, notably in housing markets. Macroprudential policies as applied to banking are, however, still at an early stage, with many questions about adaptations to circumstances, and interactions with other policies.261 They impose costs on financial intermediation and the real economy. They also mean governments directly interfere in resource allocation, raising questions on how best to address regulatory governance and political economy issues, including in balancing rules and discretion, and on institutional design, including intraregional (e.g. see Hartmann (2015), for real estate markets in Europe). And while they can reduce credit growth, such policies can lead to spillovers to other parts of the financial system and internationally. Some research (e.g. Cizel et al. (2015)) documents that these policies are accompanied by increases in non-bank credit, with effects particularly strong for quantity-based measures, and stronger in advanced economies than in emerging markets. Cerutti, Claessens, and Laeven (2016) report evidence of more evasion in more developed markets and policies leading to more cross-border banking flows. Evidence collected under the International Banking Research Network similarly shows both leakages and (unintended) spillovers across systems (Buch and Goldberg (2015, 2016)).
As such, more data and research on the effects, risks, and calibrations of macroprudential policies are needed. This applies even more so regarding macroprudential policies for non-banks, often referred to as shadow banking, which is rapidly evolving, in part due to low interest rates in many countries. Since it varies a great deal across countries, analyzing shadow banking’s proper origins calls for a conceptual definition. Claessens and Ratnovski (2015) define shadow banking as “all financial activities, except traditional banking, which rely on a private or public backstop to operate” (for other definitions, see IMF (2014), App. 2.1). This backstop can come from financial institutions, the state or central bank, and through regulations, with the priority granted to qualified financial contracts, QFCs, one such form (Duffie and Skeel (2012)).262
This definition makes clear that many forms of finance sometimes lumped with shadow banking – leasing, factoring, insurance, hedge funds – do not belong to it unless they have
261 Most complications arise from interactions with monetary and microprudential policies. Wagner (2014)
provides examples of how in banking some counter-cyclical macroprudential policies can perversely affect microeconomic behavior, with possible adverse financial stability implications. He also discusses how to best adapt policies.
262 Reforms have been proposed for treating some QFCs differently, including adding them for a short period to an automatic stay.
ECB Forum on Central Banking, June 2016 209
a backstop (and as such these forms of financing do not deserve the negative connotation associated with shadow banking). And it shows that shadow banking cannot grow without bounds, as backstops are finite. At the same time, it acknowledges that many activities – wealth management products, lending by bank-affiliated finance companies, crowd-funding schemes and sometime mutual funds – can only operate with explicit or implicit backstops. As such, it makes clear that many of the shadow banking activities prior to the GFC that led to instability – and some still ongoing – are forms of regulatory arbitrage, with banks or the state providing too generous support. While recent efforts in many countries have reduced the scope for backstops from the regular banking system, including through greater transparency and limits and requirements on securities financing transactions (FSB (2015c)), regulations and supervisory oversight still have to address many of the systemic risks arising from shadow banking activities and entities involved themselves (Claessens et al. (2012)).
Areas for further reform of regulation, tools and approaches 4.4
Regulations should be adapted in the light of structural real and financial sector changes to achieve better outcomes. On the supply side, by forsaking structure and conduct rules, and emphasizing disclosure and capital-based regulations, regulatory trends have encouraged more pro-cyclical systems. While there are some reversals, including through recently adopted microprudential and macroprudential policies, steps are still too timid. There is a particular need to revisit regulatory approaches to non-bank financing, which cannot rely solely on market discipline – based on disclosure, capital, and fair value accounting and reporting – and be “clones” of bank-type regulatory models. Macroprudential policies need to be extended to non-bank financial activities, including using state-contingent policies, akin to counter-cyclical capital buffers. Pro-cyclicality induced by FVA and reporting, risk management tools, and compensation schemes, needs to be reduced by adopting more “through-the-cycle” approaches (see further Claessens and Kodres (2016)). As risks arise in unexpected ways, some discretion will be unavoidable, which may include a “third supervisory pillar” for capital market-related institutions, to allow for tailored requirements, although in line with pre-determined principles. And supervisory agencies need to be willing to designate non-bank financial institutions and activities systemic, and require macroprudential “add-ons” for institutions and activities.
Besides specific reforms – many going beyond what is in place or under way – there are implications in terms of tools and approaches. Clearly, there is a need to consider regulatory changes in a more general equilibrium context, both static and dynamic. From a static perspective, this means considering the costs and benefits of various regulatory policies, and considering whether specific goals can be achieved more efficiently. Dynamically, this requires asking more explicitly what (changes to) rules might do to the incentives of agents involved, including all types of financial institution and market stakeholders, and how their incentives may evolve. Analyses need to be holistic – examining interactions between and across institutions, markets, participants, and jurisdictions, and across types of risks (e.g. market, credit, liquidity, and operational). And they need to actively anticipate the side effects of regulations or actions, both within and across jurisdictions, so as to help avoid unintended, but perhaps predictable consequences.

ECB Forum on Central Banking, June 2016 210
In terms of approaches, since the regulatory perimeter is getting very large and supervisory resources remain limited, regulations at microprudential and macroprudential levels have to develop more synergies between market and regulatory disciplines. Clearly, market discipline has its limits, as the GFC revealed, and regardless requires certain preconditions, including a limited safety net. Nevertheless, many data and disclosure enhancements are still to be made, including with regard to banking system data (e.g. Gandrud, Hallerberg, and Veron (2016) find limited improvements in the EU). Although non-bank financial intermediation already relies much on market signals, there are ways to enhance and use these in more synergetic ways, including for supervision. Obviously, microprudential supervisors can and do benefit from market signals, and, in principle, total loss-absorbing capacity (TLAC) and bail-in requirements aim to enhance market discipline. And the microprudential case for using such signals to discipline bank regulators has been convincingly made. But market and regulatory discipline symbioses can be increased everywhere.
By its motivation and design, the macroprudential policy function already takes clues from (aggregate) bank behavior as to when and how to invoke rules, as in the systemic surcharge and the counter-cyclical buffer. This can be further improved through enhanced reporting requirements, allowing for better data, analyses, and signals that are macroprudentially useful. As the degrees of issuance of “private” money and use of pledged collateral can be harbors of systemic risk, they can be better tracked. The various senior lending and credit officers’ surveys are examples of useful qualitative information that can be expanded upon, e.g. by asking asset managers (conditional) questions. A more formal systemic risk measurement tool is the liquidity mismatch index proposed by Brunnermeier, Gorton, and Krishnamurthy (2014). (Other examples are in Brunnermeier and Krishnamurthy (2014), and the survey by Bisias, Flood, Lo, and Valavanis (2012).)
The case where the macroprudential policymaker takes clues from asset prices and financial markets (e.g. to detect “excess” supply or demand) needs more thought. Clearly, market discipline can be perverse, as in the paradox that asset prices are most elevated, and spreads and volatility lowest, when risks are high. As market-based finance grows, it is more likely that macroprudential (and microprudential) agencies are wrong-footed as asset prices and fundamentals do not align. As such, how to get better macroprudential relevant signals from asset prices and markets needs more thought. One proposal is to auction off systemic risk rights or insurance (see Kashyap and Stein (2004), for a case for “cap and trade” regulation for banks; and Stein (2012), for the rights to issue money when there are externalities). But others are needed.
The ongoing changes in financial systems and structures globally require, besides proactive and more holistic regulations, also more adaptive oversight, including a more hands-on approach to market-based financing. As recent experiences show, systemic risk in today’s financial systems arises endogenously and cannot be fully captured by metrics that are static or backward looking. Complementary to market discipline (supported by better and more publicly disclosed data), system-wide financial stability reports and stress tests (to cover bank and market-based financial activities, include direct and indirect feedback effects, and assess solvency and liquidity risks) are needed to assess risks and guide interventions. For example, with enough data, one can assess risks of fire-sales through spillovers between mutual funds (see further Constâncio (2016), for

ECB Forum on Central Banking, June 2016 211
macroprudential stress tests, including those applicable to shadow banking). Since one can and should not aim for full regulatory predictability, it will be necessary to define the toolkit of interventions and its governance using key, high-level principles, rather than very detailed rules. At the same time, regulatory “sandboxes” can be used for new developments, e.g. fintech.
How to best conduct this oversight, national, regional and global, is an issue of regulatory governance: what kind of objectives, accountability, resources, and powers does one assign to which relevant regulatory and supervisory agencies so that they can best respond to changes (Barth et al. (2012)). This also applies to most market-based financing, notably those associated with shadow banking. Improvements will have to include greater mandates for regulators, allowing for more oversight, and requiring securities markets’ regulators to consider systemic aspects. In many countries, this will mean revisiting (intra-)regulatory structures and in general assuring more cooperation between agencies, including across countries, notably for those financially integrated (e.g. in the EU and eurozone, using the European Systemic Risk Board (ESRB), the Single Supervisory Mechanism (SSM) and other mechanisms).
5 Final observations and caveats
Changes in financial systems require revisiting regulatory approaches. Evidence presented, and more general corporate finance and other research, suggest a need in many advanced countries for much greater capital market development to support new sources of growth and innovation. As future economic growth will require greater investments in intangibles and less in fixed investment, more equity financing is especially needed. For some countries, notably civil law, bank-based systems, this means fundamental reforms. It can be helped by deeper financial integration, including through initiatives such as the capital markets union, although this does not mean a standard approach, especially if rules are of a low common denominator. It is also crucial to improve those market parts that did not function well before the GFC, e.g. securitization.
Besides encouraging equity financing, at times the productivity of what is being “financed” – new investments, existing assets, consumption, or intra-financial system exposures – can be investigated. A big issue here is the amount and form of housing finance given, besides its large role in booms and busts, its limited productive impact (Beck et al. (2012); Cournede and Denk (2014)). Besides stricter macroprudential policies, the demand for and supply of real estate financing need to be better matched. While institutional investors’ supply of funds matches liquidity and maturity risks, current rules do not always encourage this safely and without subsidies. Another issue will be addressing the demand for safe assets in less risky ways, including by (more) explicitly supplying short-term government bills in response to private demand (Pozsar (2011)). Both reflect the more general point that policymakers have some role in measuring and tracking the productivity of what is financed (Bank of England (2016)) and the demand for specific forms of finance.
These recommendations come with many assumptions and caveats. They assume a sensible approach to post-crisis restructuring in many advanced countries, including
ECB Forum on Central Banking, June 2016 212
policymakers to reduce quickly the stock of non-performing loans, close weak banks, and rationalize overbanked systems burdened with poor cost efficiencies. Recommendations neither entertain large-scale “redesigns”, e.g. of money issuance, banking charters and the like. They acknowledge that many drivers are not easy to change: the financial system, including its structure, is determined by many factors, including a country’s legal system(s), property rights, taxation as well as overall ownership structure, degree of inequality, and social compact, as in the emphasis on home ownership, specific forms of providing social security, and related political economy (Rajan and Zingales (2003b)).263
And many – the designs of bankruptcy and corporate law, the efficiency of its judicial system, and the tax code – are outside the purview of the financial regulator. At the same time, financial systems easily adapt to many aspects, including regulations. As such, it is hard to target an “optimal” financial system. Rather, most often regulations will be about trying to avoid dark corners and not to do harm – including by mostly not interfering with market allocations, than trying to fine tune systems. Indeed, it is now well understood that the biggest issue is to reduce the distortion from an (implicit) safety net and related moral hazard. And supervisory actions will often be about responding to financial turmoil, and using proper crisis management and resolution tools, than about preventing every crisis.
The paper also comes with some trepidation. Markets do not deliver first-best outcomes. But neither do governments, central banks, or regulatory agencies. While there are market failures, bureaucrats thus can and should not control financial systems. This is the more so as knowledge is lacking: what exactly are the externalities? What is the role for cognitive biases? Many partial effects are not well known, e.g. how much competition is optimal? And, conceptually and empirically, a general equilibrium approach to regulation, including various endogeneities and feedback effects, is far off. As such, both the Lucas critique – general equilibrium effects are hard to assess – and Goodhart’s law – evasion occurs when something is being targeted – very much apply. Can one thus really do better? Larry Summers, paraphrasing Churchill’s comment on democracy, once stated that: “Capitalism is the worst form of economics – except for all the others that have been tried.” Applied to financial architecture and regulation, this may mean that open, transparent, diverse, and contestable financial systems, while not perfect, are the best to aim for.
References
Abiad, Abul, Detragiache, Enrica and Tressel, Thierry (2010), “A new database of financial reforms”, IMF Staff Papers, 57(2), pp. 281-302.
Abiad, Abul and Mody, Ashoka (2005), “Financial Reform: What Shakes It? What Shapes It?”, American Economic Review, 95(1), pp. 66-88.
Acemoglu, Daron and Johnson, Simon (2005), “Unbundling institutions”, Journal of Political Economy, 113(5), pp. 949-995.
263 For example, demand for finance can arise in part because some activities previously provided publicly are
privatized (e.g. social security, infrastructure, insurance). More generally, demand for finance arises from decisions in many social and economic areas.

ECB Forum on Central Banking, June 2016 213
Adrian, Tobias and Shin, Hyun Song (2008), “Financial Intermediaries, Financial Stability, and Monetary Policy”, in Federal Reserve Bank of Kansas City’s 2008 Economic Policy Symposium Proceedings, Jackson Hole, pp. 287-334.
Adrian, Tobias and Shin, Hyun Song (2010), “The Changing Nature of Financial Intermediation and the Financial Crisis of 2007–2009”, Annual Review of Economics, 2, pp. 603-18.
Adrian, Tobias and Shin, Hyun Song (2014), “Procyclical Leverage and Value-at-Risk”, Review of Financial Studies, 27(2), pp. 373-403.
Aizenman, Joshua (2009), “Financial Crisis and the Paradox of Under- and Over-Regulation”, NBER Working Paper, No 15018.
Allard, Julien and Blavy, Rodolphe (2011), “Market Phoenixes and Banking Ducks: Are Recoveries Faster in Market-Based Economies?”, IMF Working Paper, WP 11/213.
Allen, Franklin (1993), “Stock markets and resource allocation”, in Mayer, C. and Vives, X. (eds.), Capital Markets and Financial Intermediation, Cambridge University Press, Cambridge, United Kingdom.
Allen, Franklin and Carletti, Elena (2008), “Should financial institutions mark-to-market?”, in Banque de France, Financial Stability Review, 12, October.
Allen, Franklin, Chui, Michael K.F. and Maddaloni, Angela (2004), “Financial Systems in Europe, the USA, and ASIA”, Oxford Review of Economic Policy, 20(4): pp. 490-508.
Allen, Franklin and Gale, Douglas (1997), “Financial Markets, Intermediaries, and Intertemporal Smoothing”, Journal of Political Economy, 105(3), pp. 523-46.
Allen, Franklin and Gale, Douglas (2000), Comparing Financial Systems, MIT Press, Massachusetts.
Bank for International Settlements, “Credit to the non-financial sector” series, available on the BIS website at http://www.bis.org/statistics/totcredit.htm
Bank of England (2016), “Understanding and measuring finance for productive investment”, A Discussion Paper, April.
Banque de France (2008), “Valuation and Financial Stability”, Financial Stability Review, October.
Banque de France (2016), “Financial Stability in the Digital Era”, Financial Stability Review, April.
Barth, James R., Caprio, Gerard and Levine, Ross (2006), Rethinking Bank Regulation: Till Angels Govern, Cambridge University Press.
Barth, James R., Caprio, Gerard and Levine, Ross, (2012), Guardians of Finance, MIT Press, Massachusetts.

ECB Forum on Central Banking, June 2016 214
Beck, Thorsten (2012), “Legal Institutions and Economic Development”, Chapter 2, in Mueller, Dennis C. (ed.), Oxford Handbook of Capitalism, Oxford University Press, pp. 38-77.
Beck, Thorsten, Buyukkarabacak, Berrak, Rioja, Felix K. and Valev, Neven T. (2012), “Who Gets the Credit? And Does It Matter? Household vs. Firm Lending Across Countries”, The B.E. Journal of Macroeconomics, 12(1), Article 2, pp. 1-44.
Beck, Thorsten, Carletti, Elena and Goldstein, Itay (2015), “Financial Regulation in Europe: Foundations and Challenges”, CEPR Discussion Paper, 11147.
Beck, Thorsten and Levine, Ross (2002), “Industry Growth and Capital Accumulation: Does Having a Market- or Bank-based System Matter?”, Journal of Financial Economics, 64, pp. 147-180.
Beck, Thorsten and Levine, Ross (2004), “Stock markets, banks, and growth: Panel evidence”, Journal of Banking and Finance, 28(3), pp. 423-442.
Beck, Thorsten and Levine, Ross (2005), “Legal Institutions and Financial Development”, Chapter 11, in Menard, Claude and Shirley, Mary M. (eds.), Handbook for New Institutional Economics, Norwell MA, Kluwer Academic Publishers, pp. 251-278.
Bisias, Dimitrios, Flood, Mark, Lo, Andrew W. and Valavanis, Stavros (2012), “A Survey of Systemic Risk Analytics”, Annual Review of Financial Economics, 4, pp. 255-296.
Boot, Arnoud (2014), “Financial Sector in Flux”, Journal of Money, Credit and Banking, 46(1), pp. 129-135.
Boot, Arnoud and Ratnovski, Lev (2016), “Banking and Trading”, Review of Finance, pp. 1-28.
Boot, Arnoud and Thakor, Anjan (2014), “Commercial Banking and Shadow Banking: The Accelerating Integration of Banks and Markets and its Implications for Regulation”, in Berger, Allen, Mollyneux, Phil and Wilson, John S. (eds.), Oxford Handbook of Banking, Oxford University Press, 2nd edition.
Boyd, John H. and Smith, B.D. (1998), “The Evolution of Debt and Equity Markets in Economic Development”, Economic Theory, 12, pp. 519-560.
Brei, Michael and Gambacorta, Leonardo (2016), “Are bank capital ratios pro-cyclical? New evidence and perspectives”, Economic Policy, 31(86), pp. 357-403.
Brunnermeier, Marcus K., Goodhart, Charles, Crockett, Andrew, Persaud, Avinash, Shin, Hyun Song (2009), “The Fundamental Principles of Financial Regulation”, Geneva Report on World Economy, 11, CEPR/ICMBS.
Brunnermeier, Marcus, Gorton, Gary and Krishnamurthy, Arvind (2014), “Liquidity Mismatch Measurement”, in Brunnermeier, M.K. and Krishnamurthy, A. (eds.), Risk Topography: Systemic Risk and Macro Modeling, Chicago, Illinois, NBER/University of Chicago Press.

ECB Forum on Central Banking, June 2016 215
Brunnermeier, Markus K. and Krishnamurthy, Arvind (eds.) (2014), Risk Topography: Systemic Risk and Macro Modeling, NBER/University of Chicago Press.
Buch, Claudia, M. and Goldberg, Linda S. (2015), “International Banking and Liquidity Risk Transmission: Lessons from Across Countries”, IMF Economic Review, 63(3), pp. 377-410.
Buch, Claudia, M and Goldberg, Linda S. (2016), “Cross-Border Prudential Policy Spillovers: How Much? How Important? Evidence from the International Banking Research Network”, mimeo, Deutsche Bundesbank and Federal Reserve Bank of New York.
Calomiris, Charles W. and Haber, Stephen (2014), Fragile by Design: The Political Origins of Banking Crises and Scarce Credit, Princeton University Press.
Cerutti, Eugenio, Claessens, Stijn and Laeven, Luc (2016), “The Use and Effectiveness of Macroprudential Policies: New Evidence”, Journal of Financial Stability, pp. 1-26.
Cerutti, Eugenio, Dagher, Jihad and Dell’Ariccia, Giovanni (2015), “Housing Finance and Real-Estate Booms: A Cross-Country Perspective”, Staff Discussion Note, IMF 15/12.
Čihák, Martin, Demirgüç-Kunt, Asli, Feyen, Erik and Levine, Ross (2012), “Benchmarking Financial Systems Around the World”, World Bank Policy Research Working Paper, No 6175.
Cizel, Janko, Frost, Jon, Houben, Aerdt and Wierts, Peter (2016), “Effective Macroprudential Policy: Cross-Sector Substitution from Price and Quantity Measures”, IMF Working Paper, 16/94.
Claessens, Stijn (2006), “Corporate Governance and Development”, World Bank Research Observer, 21:1, pp. 91-122.
Claessens, Stijn (2015), “An Overview of Macroprudential Policy Tools”, Annual Review of Financial Economics, 7, pp. 397-422.
Claessens, Stijn, Herring, Richard J. and Schoenmaker, Dirk (2010), A Safer World Financial System: Improving the Resolution of Systemic Institutions, Geneva Report on World Economy, 12, CEPR-ICMBS.
Claessens, Stijn and van Horen, Neeltje (2015), “The Impact of the Global Financial Crisis on Banking Globalization”, IMF Economic Review, 63(4), pp. 868-918.
Claessens, Stijn and Kodres, Laura (2016), “The Regulatory Responses to the Global Financial Crisis: Some Uncomfortable Questions”, IMF Working Paper, 14/46, forthcoming in Balleisen, Edward, Bennear, Lori, Krawiec, Kim and Wiener, Jonathan (eds.), Policy Shock: Regulatory Responses to Oil Spills, Nuclear Accidents, and Financial Meltdowns, Cambridge University Press.
Claessens, Stijn, Kose, M. Ayhan, Laeven, Luc and Valencia, Fabián (2014), Financial Crises: Causes, Consequences, and Policy Responses, IMF, Washington, D.C.
Claessens, Stijn, Kose, M.A. and Terrones, Marco F. (2012), “How do Business and Financial Cycles Interact?”, Journal of International Economics, 87(1), pp. 178-190.

ECB Forum on Central Banking, June 2016 216
Claessens, Stijn, Kose, M.A., Ozturk, Ezgi and Terrones, Marco F. (2016), Business and financial cycles database, forthcoming, Federal Reserve Board, World Bank, IMF.
Claessens, Stijn and Laeven, Luc (2003), “Financial Development, Property Rights, and Growth”, Journal of Finance, 58 (6), pp. 2401-2436.
Claessens, Stijn and Ratnovski, Lev (2015), “What is Shadow Banking?” in Claessens, Stijn, Evanoff, Douglas, Laeven, Luc and Kaufman, George (eds.), “Shadow Banking within and across National Borders” , World Scientific Studies in International Economics, Vol. 40, New Jersey: Pte. Ltd, pp. 405-412.
Claessens, Stijn, Ratnovski, Lev, Singh, Manmohan and Pozsar, Zoltan (2012), “Shadow Banking: Economics and Policy”, Staff Discussion Note, 12/12, IMF, Washington, D.C.
Constâncio, Vítor (2016), “Principles of Macroprudential Policy”, Speech at the ECB-IMF Conference on Macroprudential Policy, Frankfurt am Main, 26 April.
Cournède, Boris and Denk, Oliver (2015), “Finance and economic growth in OECD and G20 countries”, OECD Economics Department Working Paper, No 1223.
Coval, Joshua D. and Moskowitz, Tobias J. (1999), “‘Home Bias at Home: Local Equity Preference in Domestic Portfolios”, Journal of Finance, 54. pp. 2045-2074.
Dabla-Norris, Era, Ji, Yan, Townsend, Robert and Unsal, D. Filiz (2015), “Identifying Constraints to Financial Inclusion and Their Impact on GDP and Inequality: A Structural Framework for Policy”, IMF Working Paper, 15/22.
Dagher, Jihad (2016), “Regulatory Cycles: Revisiting the Political Economy of Financial Crises”, mimeo, IMF.
De La Torre, Augusto, Feyen, Erik and Ize, Alain (2013), “Financial Development: Structure and Dynamics”, World Bank Economic Review, 27, pp. 514-541.
Demirgüç-Kunt, Asli, Feyen, Erik and Levine, Ross (2011), “Optimal Financial Structures and Development: The evolving importance of banks and markets”, World Bank Working Paper, 5805.
Demirgüç-Kunt, Asli, Feyen, Erik and Levine, Ross (2013), “The Evolving Importance of Banks and Securities Markets”, World Bank Economic Review, 27, pp. 476-490.
Demirgüç-Kunt, Asli and Levine, Ross (2001), Financial Structure and Economic Growth, A Cross-Country Comparison of Banks, Markets, and Development, Cambridge, MA: MIT Press.
Demirgüç-Kunt, Asli and Maksimovic, Vojislav (2002), “Funding Growth in Bank-based and Market-based Financial Systems: Evidence from Firm Level Data”, Journal of Financial Economics, 65, pp. 337-363.
Diamond, Douglas W. and Dybvig, Philip H. (1986), “Banking Theory, Deposit Insurance, and Bank Regulation”, The Journal of Business, 59(1), pp. 55-68.
Dirks, Marlou, de Vries, Casper and van der Lecq, Fieke (2014), “Macroprudential policy: the neglected sectors”, in Schoenmaker, D. (ed.), Macroprudentialism, CEPR, pp. 71-83, London.
ECB Forum on Central Banking, June 2016 217
Djankov, Simeon, La Porta, Rafael, Lopez-de-Silanes, Florencio and Shleifer, Andrei (2008), “The law and economics of self-dealing”, Journal of Financial Economics, 88, pp. 430-465.
Doettling, Robin and Perotti, Enrico (2016), “Secular Trends under Technological Change”, mimeo, University of Amsterdam.
Domanski, Dietrich, Shin, Hyun Song and Sushko, Vladyslav (2015), “The hunt for yield: not waving but drowning?”, BIS Working Papers, 519.
Duffie, Darrell (2016), “Financial Regulatory Reform After the Crisis: An Assessment”, in this volume.
Duffie, Darrell and Skeel, David A. Jr. (2012), “A Dialogue on the Costs and Benefits of Automatic Stays for Derivatives and Repurchase Agreements”, Faculty Scholarship Paper, 386, University of Pennsylvania, and Stanford University.
Enria, Andrea, Cappiello, Lorenzo, Dierick, Frank, Sergio, Grittini, Haralambous, Andrew, Maddaloni, Angela, Molitor, Philippe, Pires, Fatima and Poloni, Paolo (2004), “Fair value accounting and financial stability”, ECB Occasional Papers, No 13.
European Central Bank (2013), “Report on Banking Structures”, November, Frankfurt.
European Central Bank (2015), “Report on Banking Structures”, October, Frankfurt.
European Commission (2015), Commission Staff Working Document, Economic Analysis Accompanying the document: Action Plan on Building a Capital Markets Union, Brussels, September 30.
Financial Stability Board (2015a), FSB Shadow Banking Monitoring Report, October.
Financial Stability Board (2015b), Implementation and Effects of the G20 Financial Regulatory Reforms, Report of the Financial Stability Board to the G20 Leaders, 9 November.
Financial Stability Board (2015c), Transforming Shadow Banking into Resilient Market-based Finance: An Overview of Progress, 12 November.
Fohlin, Caroline (2016), “Financial Systems and Economic Development in Historical Perspective”, in Diebolt, Claude and Haupert, Michael, Handbook of Cliometrics, Springer Verlag, pp. 393-430.
Gambacorta, Leonardo and Van Rixtel, Adrian (2013), “Structural bank regulation initiatives: approaches and implications”, BIS Working Papers, 412, Bank for International Settlements.
Gambacorta, Leonardo, Yang, Jing and Tsatsaronis, Kostas (2014), “Financial structure and growth”, BIS Quarterly Review, March, pp. 21-35.
Gandrud, Christian, Hallerberg, Mark and Veron, Nicolas (2016), The European Union Continues to Lag on Banking Supervisory Transparency, Bruegel and Peterson Institute.
Glasserman, Paul, and Ghamami, Samim (2016), Does the OTC derivatives reform incentivize central clearing?, mimeo, New York and Columbia University.
ECB Forum on Central Banking, June 2016 218
Goodhart, Charles and Schoenmaker, Dirk (2016), “The Unites States Dominates Global Investment Banking: Does it Matter for Europe?”, Bruegel Policy Brief, 2016/06.
Gorton, Gary (2016), “The History and Economics of Safe Assets”, NBER Working Paper, No 22210.
Gual, Jordi and Neven, Damien J. (1992), “Deregulation of the European Banking Industry (1980-1991)”, CEPR Discussion Papers, 703.
Hahm, Joon-Ho, Shin, Hyun Song and Shim, Kwanho (2013), “Non-Core Bank Liabilities and Financial Vulnerability”, Journal of Money, Credit and Banking, 45(S1), pp. 3-36.
Haldane, Andrew and Madouros, Vasileios (2012), “The dog and the frisbee”, in the Federal Reserve Bank of Kansas City’s 36th Economic Policy Symposium Proceedings, The changing policy landscape, Jackson Hole.
Hartmann, Philipp (2014), “Real Estate Markets and Macroprudential Policy in Europe”, Journal of Money, Credit and Banking, Suppl. 47(1), pp. 69-80.
Hsu, Po-Hsuan, Tian, Xuan and Xu, Yan (2014), “Financial development and innovation: Cross-country evidence”, Journal of Financial Economics, 112(1), pp. 116-135.
IMF (2006), “How do financial systems affect economic cycles?”, Chapter 4, World Economic Outlook, Washington, D.C.
IMF (2014), “Shadow Banking Around The Globe: How Large, And How Risky?” Chapter 2, Global Financial Stability Report, Washington, D.C.
Jordà, Òscar, Schularick, Moritz and Taylor, Alan M. (2016), “The great mortgaging: housing finance, crises and business cycles”, Economic Policy, 31(85), pp. 107-152.
Kalemli-Ozcan, Sebnem, Sørensen, Bent and Yesiltas, Sevcan (2012), “Leverage Across Firms, Banks, and Countries”, Journal of International Economics, 88(2), pp. 84-298.
Kashyap, Anil K. and Stein, Jeremy C. (2004), “Cyclical Implications of the Basel-II Capital Standards”, Economic Perspectives, Federal Reserve Bank of Chicago, 28, Q1, pp. 18-31.
King, Mervyn (2016), The End of Alchemy: Money, Banking and the Future of the Global Economy, W.W. Norton/Little, Brown.
La Porta, Rafael, Lopez-de-Silanes, Florencio, Shleifer, Andrei and Vishny, Robert W. (1998), “Law and finance”, Journal of Political Economy, 106, pp. 1113-1155.
Laeven, Luc and Levine, Ross (2007), “Is there a Diversification Discount in Financial Conglomerates?”, Journal of Financial Economics, 85(2), pp. 331-367.
Laeven, Luc, Levine, Ross and Michalopoulos, Stelios (2015), “Financial Innovation and Endogenous Growth”, Journal of Financial Intermediation, 24, pp. 1-24.
Langfield, Sam and Pagano, Marco (2016), “Bank bias in Europe: effects on systemic risk and growth”, Economic Policy, 31(85), pp. 51-106.
ECB Forum on Central Banking, June 2016 219
Leuz, Christian and Wysocki, Peter (2016), “The Economics of Disclosure and Financial Reporting Regulation: Evidence and Suggestions for Future Research”, ECGI Law Working Paper, No 306/2016.
Levine, Ross (2005), “Finance and growth: Theory and evidence”, in Durlauf, P. (ed.), Handbook of Economic Growth, Amsterdam, Elsevier, Chapter 12, Vol. 1, pp. 865-934.
Levine, Ross (2012), “Regulating Finance and Regulators to Promote Growth”, in Federal Reserve Bank of Kansas City’s Economic Policy Symposium, Achieving Maximum Long-Run Growth, pp. 271-310.
Levine, Ross, Lin, Chen and Xie, Wensi (2016), “Spare Tire? Stock Markets, Banking Crises, and Economic Recoveries”, Journal of Financial Economics, forthcoming.
Levine, Ross and Stiglitz, Joseph E. (2010), “Financial Innovation: For the Motion that Financial Innovation Boosts Economic Growth”, The Economist, February 23 - March 3.
Lo, Andrew (2016), “Moore's Law vs. Murphy's Law in the financial system: who's winning?”, BIS Working Paper, WP 564.
Malherbe, Frederic and Wagner, Wolf (2016), Heterogeneous Regulation of Financial Institutions, mimeo, London Business School and Erasmus University.
Merton, Robert C. and Bodie, Zvi (1995), “A Conceptual Framework for Analyzing the Financial Environment”, in Crane, D.B. et al. (eds.), The Global Financial System: A Functional Perspective, Boston, MA, Harvard Business School Press, pp. 3-32.
Merton, Robert C. and Muralidhar, Arun (2015), “Monetary policy: It's all relative”, Pensions and Investments.
OECD (2015), “How to restore a healthy financial sector that supports long-lasting, inclusive growth?”, Economics Department Policy Note, No 27, June.
Pagano, Marco (2013), “Finance: Economic Lifeblood or Toxin?”, in Acharya, V., Beck, T., Evanoff, D., Kaufman, G. and Portes, R. (eds.), The Social Value of the Financial Sector: Too Big to Fail or Just too Big?, World Scientific Publishing Co. Pte. Ltd, New Jersey, pp. 109-146.
Pagano, Marco, Langfield, Sam, Acharya, Viral, Boot, Arnoud, Brunnermeier, Marcus, Buch, Claudia, Hellwig, Martin, Sapir, André and van den Burg, Ieke (2014), “Is Europe overbanked?”, Report No 4 of the European Systemic Risk Board’s (ESRB) Advisory Scientific Committee.
Philippon, Thomas (2016), “Has the U.S. Finance Industry Become Less Efficient? On the Theory and Measurement of Financial Intermediation”, American Economic Review, 105(4), pp. 1408-38.
Philippon, Thomas and Reshef, Ariell (2013), “An International Look at the Growth of Modern Finance”, Journal of Economic Perspectives, 27(2), pp. 73-96.
Plantin, Guillaume, Sapra, Haresh and Shin, Hyun Song (2008), “Fair Value Reporting Standards and Market Volatility”, Banque De France, Financial Stability Review, 12, October.

ECB Forum on Central Banking, June 2016 220
Pozsar, Zoltan (2011), “Institutional Cash Pools and the Triffin Dilemma of the U.S. Banking System”, IMF Working Paper, WP 11/190.
Pozsar, Zoltan (2015), “A Macro View of Shadow Banking: Levered Betas and Wholesale Funding in the Context of Secular Stagnation”, mimeo, http://ftalphaville.ft.com/files/2015/07/Pozsar-A-Macro-View-of-Shadow-Banking-Levered-Betas-and-Wholesale-Funding-in-the-Context-of-Secular-Stagnation.pdf
Rajan, Raghuram G. (2005), “Has Financial Development Made the World Riskier?”, in Federal Reserve Bank of Kansas City’s Economic Policy Symposium Proceedings, The Greenspan Era: Lessons for the Future, Jackson Hole, pp. 313-369.
Rajan, Raghuram G. and Zingales, Luigi (2003a), “The great reversals: the politics of financial development in the twentieth century”, Journal of Financial Economics, 69(1), pp. 5-50.
Rajan, Raghuram G. and Zingales, Luigi (2003b), Saving Capitalism from the Capitalists, Random House, New York.
Rochet, Jean-Charles (2008), “Procyclicality of financial systems: is there a need to modify current accounting and regulatory rules?”, Banque de France, Financial Stability Review, 12, October, pp. 95-99.
Shin, Hyun S. (2009a), “Reflections on Northern Rock: The Bank Run that Heralded the Global Financial Crisis”, Journal of Economic Perspectives, 23, pp. 101-19.
Shin, Hyun S. (2009b), “Securitisation and financial stability”, The Economic Journal, 119, pp. 309-332.
Shin, Hyun S. (2013), “Procyclicality and the Search for Early Warning Indicators”, IMF Working Paper, WP 13/258 (also in Claessens et al. (2014)).
Singh, Manmohan (2014), “Limiting Taxpayer “Puts”—An Example from Central Counterparties”, IMF Working Paper, WP 14/203.
Song, Fenghua and Thakor, Anjan (2013), “Notes on Financial System Development and Political Intervention”, World Bank Economic Review, 27, pp. 491-513.
Stein, Jeremy C. (2012), “Monetary Policy as Financial-Stability Regulation”, Quarterly Journal of Economics, 127 (1), pp. 57-95.
Stulz, René (2000), “Financial Structure, Corporate Finance and Economic Growth”, International Review of Finance, 1(1), pp. 11-38.
Tadesse, Solomon (2002), “Financial Architecture and Economic Performance: International Evidence”, Journal of Financial Intermediation, 11, pp. 429-454.
Tirole, Jean (2006), The Theory of Corporate Finance, Princeton University Press.
Turner, Adair (2015), Between Debt and the Devil: Money, Credit, and Fixing Global Finance, Princeton University Press.

ECB Forum on Central Banking, June 2016 221
Turner, Philip (2014), “Is the long-term interest rate a policy victim, a policy variable or a policy lodestar?”, in Chadha, Jagjit S., Durré, Alain C.J., Joyce, Michael A.S. and Sarno, Lucio (eds.), Developments in Macro-Finance Yield Curve Modeling, Cambridge University Press.
UNEP Inquiry (2015), “Effects of Financial System Size and Structure on the Real Economy: What do we know and what do we not know?”, Inquiry Working Paper 15/10.
Vesala, Jukka (1993), “Retail Banking in European Financial Integration”, Suomen Pankki – Finlands Bank, Working Paper.
Wagner, Wolf B. (2014), “Unintended consequences of macroprudential policies”, in Schoenmaker, Dirk (ed.), Macroprudentialism, London: CEPR Press, pp. 105-113.
Wolf, Martin (2014), The Shifts and The Shocks: What We’ve Learned – and Have Still to Learn – From the Financial Crisis, Penguin Press, United Kingdom.
World Economic Forum (2015), “The Future of Financial Services: How disruptive innovations are reshaping the way financial services are structured, provisioned and consumed”, An Industry Project of the Financial Services Community, prepared in collaboration with Deloitte, June.
World Economic Forum (2016), The Role of Financial Services in Society: Understanding the impact of technology-enabled innovation on financial stability, prepared with Oliver Wyman.
Zingales, Luigi (2015), “Does Finance Benefit Society?”, Presidential Address American Finance Association, Journal of Finance, 60(4), pp. 1327-63.

ECB Forum on Central Banking, June 2016 222
Comment on “Regulation and structural change in financial systems” by Stijn Claessens By Hyun Song Shin264
1 Introduction
Stijn Claessens has written a characteristically lucid paper. It covers much ground, and yet is written as a compact and accessible survey of the core issues in financial systems from the perspective of financial stability.
The paper has two key messages. The first is that financial structure matters for efficiency and risk; the second is that, as such, regulation should take account of financial structure. Under this rubric, Stijn goes on to lay out a number of key distinctions that can guide our thinking.
One key distinction highlighted in the paper is that between financial systems reliant on banks and financial systems that make greater use of markets. At first sight, there are two apparently contradictory perspectives on the role of market-based finance and its relationship to the banking system. The first is a benign view of market finance as a “spare tire” that can be brought into service when the banking sector is impaired, and thereby cushion shocks to the real economy from the fluctuations of bank-based lending. By contrast, the second perspective paints the market-based system more as an amplifier of pro-cyclicality. The idea is that markets play the role of the enabler that amplifies the tendency toward greater pro-cyclicality of bank lending itself, through the use of wholesale funding.
There is evidence to back up both views. The key message to take away from Stijn’s paper is that the apparent tension between the two perspectives is only apparent, and can be reconciled. The key is to distinguish the market finance that is channelled directly to ultimate borrowers through the bond market, and the market finance that funds the credit that is intermediated through the banking sector. The direct credit through the bond market does indeed serve as a “spare tire”, but market-based finance of the banking sector can amplify the fluctuations in financial conditions. In this sense, there are two faces to market-based finance, and they are worth exploring separately.
264 Bank for International Settlements.
ECB Forum on Central Banking, June 2016 223
2 Market finance
2.1 Market finance as a spare “tire”
The “spare tire” view of market-based finance is borne out in the data on aggregate lending to the US non-financial corporate business sector based on the Federal Reserve’s Flow of Funds data (see, for example, Adrian, Colla and Shin (2013)). The data from the Flow of Funds show that bank loans to the US non-financial corporate business sector display the characteristic pro-cyclical pattern where growth is strong during periods when the economy does well, but bank lending contracts during and in the immediate aftermath of recessions.
By contrast, bond financing to the non-financial corporate sector displays a much less pro-cyclical pattern. Growth rates very rarely turn negative. More to the point, bond financing increases during periods when loans are contracting in the aftermath of crises. This pattern of bond-financing taking up the slack when loans decline was especially evident during the 2008 crisis. In other words, there is evidence that, in terms of quantities, bond financing and loan financing are negatively related during times of contracting loans. In the three recessionary periods in the United States since 1990 (namely 1990-01, 2001 and 2008-09), loans declined but corporate bond issuance rose to make up some of the gap. Indeed, Adrian, Colla and Shin (2013) show that for the two earlier recessions in the United States (in 1990-01 and 2001), there was no overall decline in credit to the non-financial corporate sector, as the fall in bank lending was more than made up by the increase in bond financing.
However, spreads rose sharply during the 2008 crisis. In terms of the cost of credit, the lending spreads are positive correlated between bank and bond finance, and the cost of credit increases both for loans and for bonds. The interpretation is that when the supply of credit by banks shrinks, borrowers are “thrown on” to the bond market, and the demand for bond finance surges. It is the increase in the demand for bond finance which explains the conjunction of the increase in bond issuance and the sharp increase in spreads.
2.2 Market finance as an amplifier
A rough, but useful distinction when discussing the pro-cyclicality of banking is that between the core and non-core liabilities of the banking sector. The exact definition will depend on the context, but roughly speaking, the core liabilities of a bank are the categories of funding for the bank that it draws on during normal times. For a banking system that is primarily financed by deposits of households and small businesses, one way to make operational this concept would be in terms of the domestically sourced deposit funding from households and non-financial firms. Of course, what counts as core funding will depend on the context and the financial system.
During periods when bank lending is growing rapidly, the core funding available to the banking sector is likely to be insufficient to finance the rapid growth in new lending. This is because retail deposits grow in line with the aggregate wealth of the household sector. In
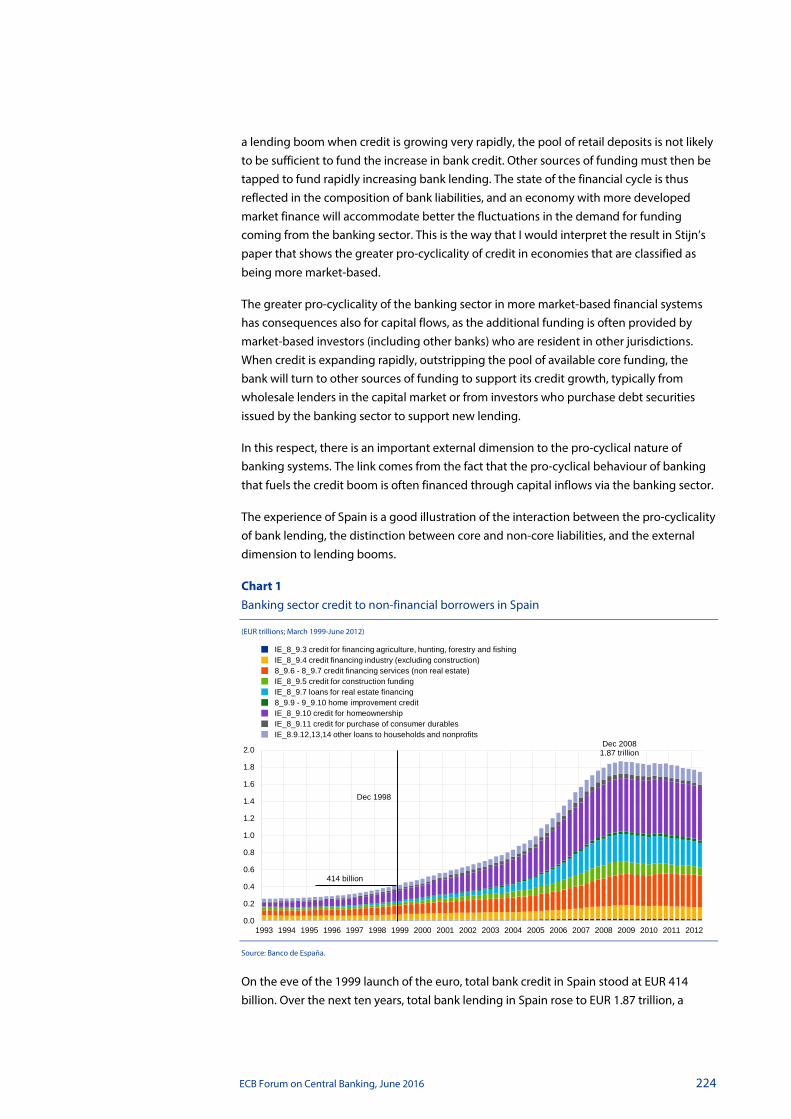
ECB Forum on Central Banking, June 2016 224
a lending boom when credit is growing very rapidly, the pool of retail deposits is not likely to be sufficient to fund the increase in bank credit. Other sources of funding must then be tapped to fund rapidly increasing bank lending. The state of the financial cycle is thus reflected in the composition of bank liabilities, and an economy with more developed market finance will accommodate better the fluctuations in the demand for funding coming from the banking sector. This is the way that I would interpret the result in Stijn’s paper that shows the greater pro-cyclicality of credit in economies that are classified as being more market-based.
The greater pro-cyclicality of the banking sector in more market-based financial systems has consequences also for capital flows, as the additional funding is often provided by market-based investors (including other banks) who are resident in other jurisdictions. When credit is expanding rapidly, outstripping the pool of available core funding, the bank will turn to other sources of funding to support its credit growth, typically from wholesale lenders in the capital market or from investors who purchase debt securities issued by the banking sector to support new lending.
In this respect, there is an important external dimension to the pro-cyclical nature of banking systems. The link comes from the fact that the pro-cyclical behaviour of banking that fuels the credit boom is often financed through capital inflows via the banking sector.
The experience of Spain is a good illustration of the interaction between the pro-cyclicality of bank lending, the distinction between core and non-core liabilities, and the external dimension to lending booms.
Chart 1 Banking sector credit to non-financial borrowers in Spain
(EUR trillions; March 1999-June 2012)
Source: Banco de España.
On the eve of the 1999 launch of the euro, total bank credit in Spain stood at EUR 414 billion. Over the next ten years, total bank lending in Spain rose to EUR 1.87 trillion, a
0.0
0.2
0.4
0.6
0.8
1.0
1.2
1.4
1.6
1.8
2.0
1993 1994 1995 1996 1997 1998 1999 2000 2001 2002 2003 2004 2005 2006 2007 2008 2009 2010 2011 2012
Dec 1998
414 billion
Dec 20081.87 trillion
IE_8_9.3 credit for financing agriculture, hunting, forestry and fishingIE_8_9.4 credit financing industry (excluding construction)8_9.6 - 8_9.7 credit financing services (non real estate)IE_8_9.5 credit for construction fundingIE_8_9.7 loans for real estate financing8_9.9 - 9_9.10 home improvement creditIE_8_9.10 credit for homeownershipIE_8_9.11 credit for purchase of consumer durablesIE_8.9.12,13,14 other loans to households and nonprofits
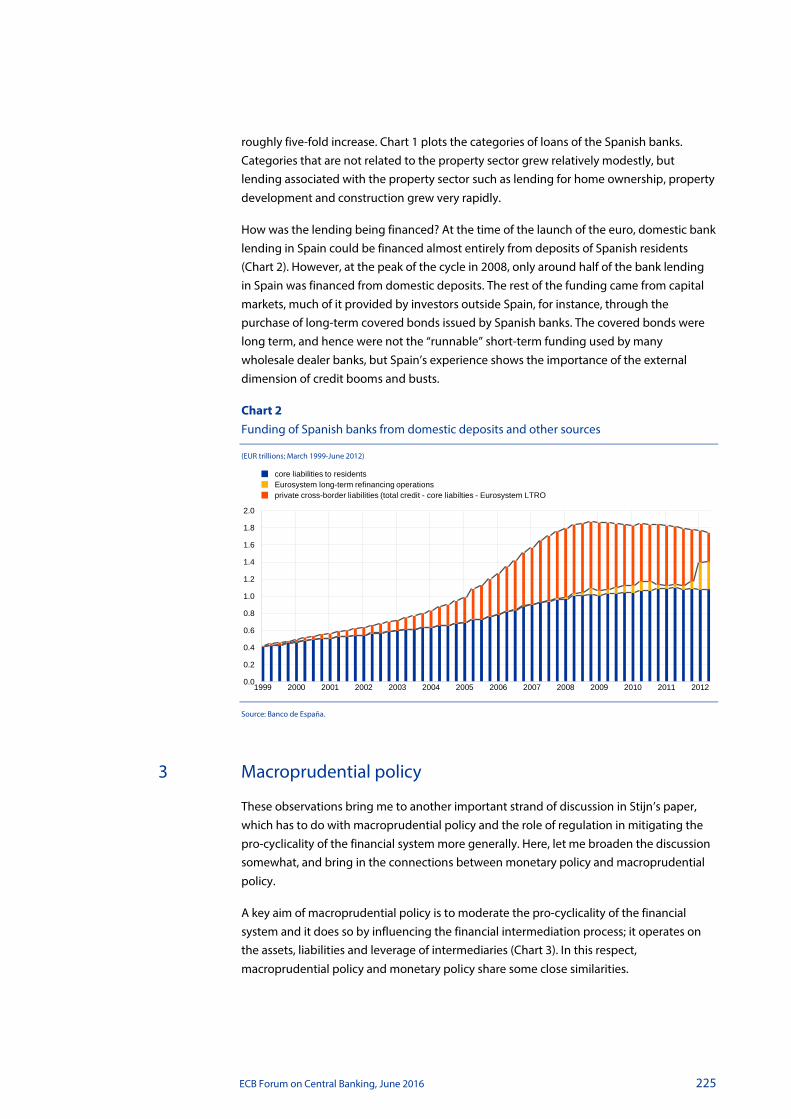
ECB Forum on Central Banking, June 2016 225
roughly five-fold increase. Chart 1 plots the categories of loans of the Spanish banks. Categories that are not related to the property sector grew relatively modestly, but lending associated with the property sector such as lending for home ownership, property development and construction grew very rapidly.
How was the lending being financed? At the time of the launch of the euro, domestic bank lending in Spain could be financed almost entirely from deposits of Spanish residents (Chart 2). However, at the peak of the cycle in 2008, only around half of the bank lending in Spain was financed from domestic deposits. The rest of the funding came from capital markets, much of it provided by investors outside Spain, for instance, through the purchase of long-term covered bonds issued by Spanish banks. The covered bonds were long term, and hence were not the “runnable” short-term funding used by many wholesale dealer banks, but Spain’s experience shows the importance of the external dimension of credit booms and busts.
Chart 2 Funding of Spanish banks from domestic deposits and other sources
(EUR trillions; March 1999-June 2012)
Source: Banco de España.
3 Macroprudential policy
These observations bring me to another important strand of discussion in Stijn’s paper, which has to do with macroprudential policy and the role of regulation in mitigating the pro-cyclicality of the financial system more generally. Here, let me broaden the discussion somewhat, and bring in the connections between monetary policy and macroprudential policy.
A key aim of macroprudential policy is to moderate the pro-cyclicality of the financial system and it does so by influencing the financial intermediation process; it operates on the assets, liabilities and leverage of intermediaries (Chart 3). In this respect, macroprudential policy and monetary policy share some close similarities.
0.0
0.2
0.4
0.6
0.8
1.0
1.2
1.4
1.6
1.8
2.0
1999 2000 2001 2002 2003 2004 2005 2006 2007 2008 2009 2010 2011 2012
core liabilities to residentsEurosystem long-term refinancing operationsprivate cross-border liabilities (total credit - core liabilties - Eurosystem LTRO

ECB Forum on Central Banking, June 2016 226
Chart 3 Comparison of macroprudential policy with monetary policy
Source: 85th BIS Annual Report, Graph IV.A.
For instance, both policies affect the demand for credit by reallocating spending over time, by either postponing spending (i.e. by inducing consumers and firms to borrow less) or bringing forward spending (i.e. by inducing them to borrow more). Both policies affect the supply of credit by influencing the leverage decision of the intermediary, and both influence the funding cost of the intermediary.
However, there are two important differences between monetary policy and macroprudential policy. The first difference is that macroprudential policy is aimed at specific sectors or practices. In some respects, macroprudential policy harks back to the directed credit policies used by many advanced economies up to the 1970s, although these were used to channel credit to favoured sectors, as well as to constrain credit. The name is different, but the policies are similar. In many cases, it is old wine in new bottles. By contrast, monetary policy influences risk-taking more broadly, both within the domestic financial system but also across borders, and is harder to circumvent.
On the other hand, the broader impact of monetary policy cuts both ways; domestic monetary policy can sometimes be constrained by external conditions. In other cases, such as countries in the euro area, monetary policy could not be used to address conditions that apply only locally. This is the second difference between monetary policy and macroprudential policy. It is when external conditions constrain monetary policy, or when monetary policy is ruled out owing to institutional constraints, that macroprudential policy comes into its own. For the banking sector, policies aimed at dampening pro-cyclicality would be key.
Are monetary policy and macroprudential policy effective only when they tighten at the same time, or it is possible to tighten one but loosen the other? In other words, must the two policies pull in the same direction (be used as complements), or can they pull in opposite directions (be used as substitutes)?
Some recent discussions of macroprudential policies treat the two as being substitutes; monetary policy is loosened and macroprudential policy is invoked to deal with the financial stability implications of looser monetary policy. However, when they pull in opposite directions, households and firms are being told simultaneously to borrow more

ECB Forum on Central Banking, June 2016 227
and borrow less. There is some tension between the two sets of policies. Recent research, including many papers written by Stijn himself with International Monetary Fund (IMF) co-authors, suggests that both monetary and macroprudential policies have some effect in constraining credit growth, and that the two tend to be complements, not substitutes, although results vary by type of shock.265 In a Bank for International Settlements (BIS) study on how macroprudential tools are actually deployed, we find that macroprudential policies and monetary policy often pull in the same direction, in the sense that the strengthening of macroprudential tools tends to go hand in hand with tightening of monetary policy.266 This is an empirical statement of how the two policies are used in conjunction rather than a normative statement of whether they ought to be, but the actions of policymakers suggest that they consider the two sets of policies to be complements, not substitutes.
4 External dimension of pro-cyclicality
Discussions of macroprudential policies often revolve around emerging market economies, but as we saw in the case of Spain, many of the same issues arise in the context of advanced economies, also.
The recent experience of Sweden is worthy of note in this context. Bank credit growth has been buoyant in Sweden in recent months, in spite of negative policy rates that have been cited in other economies as a potential drag on bank profitability. One possible reason for this may be that Swedish banks are not so reliant on deposit funding.
Additionally, Swedish banks are sensitive to monetary developments in the euro area, especially to the slope of the euro yield curve. In recent months, Swedish banks have taken advantage of low long-term borrowing rates in euro, and have issued euro-denominated bonds of increasingly longer maturity. The banks then swap the euro for Swedish krona in the capital market, meaning that they borrow Swedish krona by pledging the borrowed euro funds as collateral. Having borrowed the Swedish krona, they lend it out to domestic borrowers in Sweden.267
Chart 4 shows the gross issuance of euro-denominated bonds by banks. The left-hand panel shows the issuance activity of euro area banks, and the right-hand panel shows the issuance activity of Swedish banks. The size of the bubble indicates the relative size of gross issuance amounts over time, while the height of the bubbles indicates the average maturity of the gross issuance. Euro area banks have been issuing far less in notional amounts after the crisis than before, although the maturity is higher than before the crisis. For Swedish banks, their issuance activity is not much smaller now compared to before the crisis, and the maturity has also increased.
265 See International Monetary Fund (2013); see also Cerrutti, Claessens and Laeven (2015); Kuttner and Shim
(2013); and Akinci and Olmstead-Rumsey (2015). 266 As discussed in Bruno, Shim and Shin (2015). 267 See Hilander (2014).

ECB Forum on Central Banking, June 2016 228
Chart 4 Gross issuance of euro-denominated debt securities
(maturity in years; EUR billions)
Euro area Sweden
Source: BIS debt securities statistics. Notes: Size of the bubble indicates the relative gross issuance amount in billions of euro. Height of the bubble indicates weighted average maturity in years.
One indication of the banks’ currency swap activity is the so-called cross-currency basis between the Swedish krona and the euro. This refers to the difference between the interest rate on the euro implied by the cross-currency swap versus what banks have to pay to borrow euro in the open market. The cross-currency basis for the Swedish krona versus the euro has been positive, meaning that the euro interest rate implied by the cross-currency swap is lower than the euro interbank rate. Another way of saying this is that there is an “abundance” of euro in Sweden from sellers who wish to borrow Swedish krona by pledging euro as collateral. Only a few other currencies have this feature, and most of them are countries where the banks issue long-term bonds in international currencies to fund domestic lending. Australia is a good example vis-à-vis the US dollar, and Norway is another, vis-à-vis the euro.
Additionally, when external conditions enter into funding conditions, the role of the exchange rate cannot be neglected in discussions of financial stability. As well as the usual impact of the exchange rate on the trade balance, there is an additional “risk-taking channel” of exchange rates that operate through financial conditions.
Chart 5 shows how the euro exchange rate affects cross-border lending to banks in Sweden. The top panel shows the relationship between the euro-denominated cross-border borrowing of banks in Sweden and the euro exchange rate. It shows that banks in Sweden tend to draw on more euro-denominated funding from outside Sweden when the euro is weak. This negative relationship between the euro exchange rate and cross-border flows is a fairly recent phenomenon, as is shown by the coefficients on the 20-quarter rolling regressions in the bottom panel. In this sense, Sweden’s buoyant credit growth may be related as much to monetary developments in the euro area as to domestic circumstances.
1,329.68
1,326.37
627.28
415.35
530.25
415.98431.40
350.37217.77
233.14240.23
0.0
1.0
2.0
3.0
4.0
5.0
6.0
7.0
2002 2004 2006 2008 2010 2012 2014 2016
11.78
15.7612.86
16.4821.12
12.19
7.94
17.49
6.53
7.09
8.33
0.0
1.0
2.0
3.0
4.0
5.0
6.0
7.0
2002 2004 2006 2008 2010 2012 2014 2016
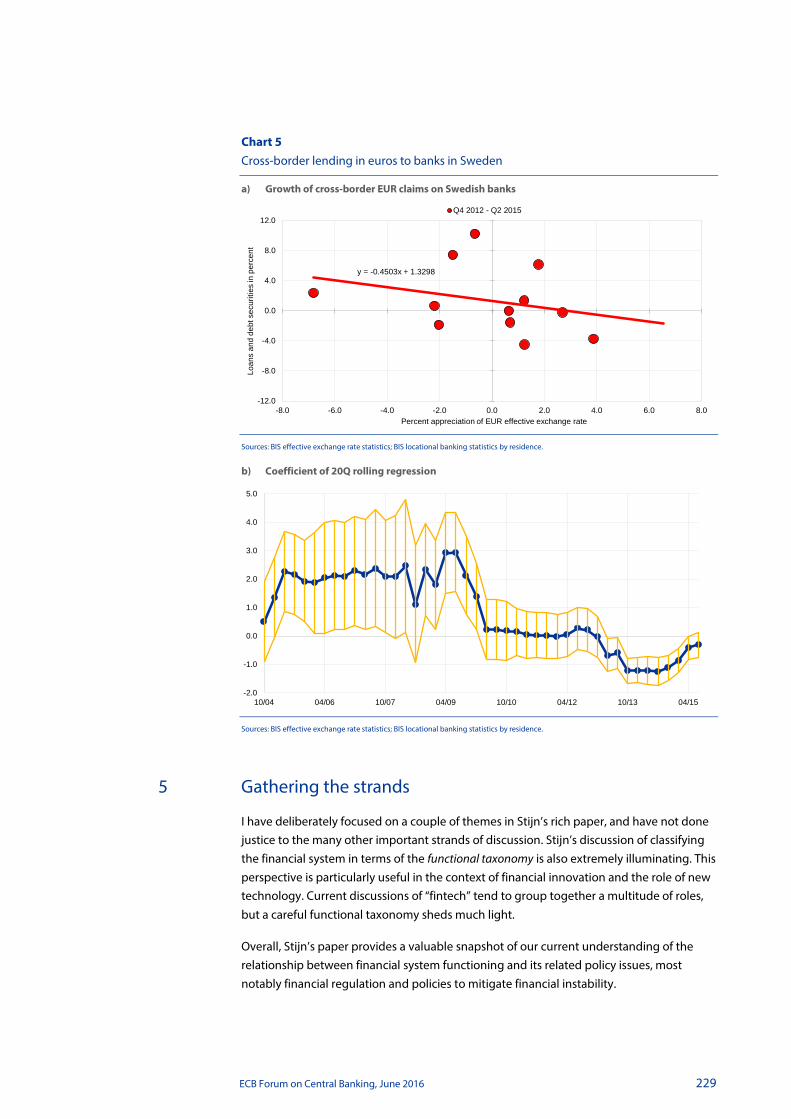
ECB Forum on Central Banking, June 2016 229
Chart 5 Cross-border lending in euros to banks in Sweden
a) Growth of cross-border EUR claims on Swedish banks
Sources: BIS effective exchange rate statistics; BIS locational banking statistics by residence.
b) Coefficient of 20Q rolling regression
Sources: BIS effective exchange rate statistics; BIS locational banking statistics by residence.
5 Gathering the strands
I have deliberately focused on a couple of themes in Stijn’s rich paper, and have not done justice to the many other important strands of discussion. Stijn’s discussion of classifying the financial system in terms of the functional taxonomy is also extremely illuminating. This perspective is particularly useful in the context of financial innovation and the role of new technology. Current discussions of “fintech” tend to group together a multitude of roles, but a careful functional taxonomy sheds much light.
Overall, Stijn’s paper provides a valuable snapshot of our current understanding of the relationship between financial system functioning and its related policy issues, most notably financial regulation and policies to mitigate financial instability.
y = -0.4503x + 1.3298
-12.0
-8.0
-4.0
0.0
4.0
8.0
12.0
-8.0 -6.0 -4.0 -2.0 0.0 2.0 4.0 6.0 8.0
Loan
s an
d de
bt s
ecur
ities
in p
erce
nt
Percent appreciation of EUR effective exchange rate
Q4 2012 - Q2 2015
-2.0
-1.0
0.0
1.0
2.0
3.0
4.0
5.0
10/04 04/06 10/07 04/09 10/10 04/12 10/13 04/15

ECB Forum on Central Banking, June 2016 230
In my discussion, my aim has been to highlight the two-sided nature of market finance, both as a stabiliser as well as an amplifier of pro-cyclicality. In this context, I have emphasised the external dimension of the transmission of financial conditions.
Macroprudential policies have their limits, but they will turn out to be an important component of the overall toolkit, especially when monetary policy is constrained either by institutional design or by external conditions.
References
Adrian, Tobias, Colla, Paolo and Shin, Hyun Song (2013), “Which financial frictions? Parsing the evidence from the global financial crisis”, NBER Macroeconomics Annual, Vol. 27, pp. 159-214.
Akinci, O. and Olmstead-Rumsey, J. (2015), “How effective are macroprudential policies? An empirical investigation”, Federal Reserve International Financial Discussion paper, No 1136, May.
Bruno, V., Shim, I. and Shin, H.S. (2015), “Comparative assessment of macroprudential policies”, Journal of Financial Stability.
Cerutti, E., Claessens, S. and Laeven, L. (2015), “Macroprudential policies: analysing a new database”, paper presented at the DNB-EBC conference on Macroprudential regulation: from theory to implementation on 29-30 January 2015, Amsterdam.
Hilander, I. (2014), “Short-term funding in foreign currency by major Swedish banks and their use of the short-term currency swap market”, Sveriges Riksbank Economic Review, No 1, pp 1-23.
International Monetary Fund (2013), “The interaction of monetary and macroprudential policies”, Washington, January, http://www.imf.org/external/np/pp/eng/2013/012913.pdf
Kuttner, K. and Shim, I. (2013), “Can non-interest rate policies stabilise housing markets? Evidence from a panel of 57 economies”, BIS Working Paper, No 433, November.
ECB Forum on Central Banking, June 2016 231
Financial regulatory reform268 By Claudia M. Buch, Esteban Prieto and Benjamin Weigert269
Many of the financial regulatory reforms that were launched after the financial crisis entered into uncharted territory, giving rise to a number of questions. How, for instance, do financial structures and regulatory reforms interact? What are the cross-border effects of regulatory reforms? How can the micro- and macro-levels be linked to analyze the overall effects of reforms? And how can we ensure that there is a balance between different policy goals? This note argues that answering these questions requires a structured process of policy evaluation. Often, rigorous testing of reforms ex ante has not been feasible. Evaluation ex post and causal impact assessments are thus needed.
1 A stylized evaluation process
Policy evaluation faces many challenges, and these are not different in the realm of financial regulatory policy than they are in many other policy areas such as monetary policy or labor market policies. These challenges include linking reforms to intended and unintended outcomes, understanding the linkages between different reform elements, and linking micro-level adjustment to the overall, general equilibrium effects of reforms. In order to identify the effects of reforms, these effects have to be causally identified.
Most of the studies assessing the effects of financial regulatory policies that are currently available do not meet strict criteria for causal impact assessments. Randomized field trials are considered to be the “gold standard” of policy evaluation, but they cannot be applied to most financial sector reforms. In most plausible real world settings, quasi-experimental setups have to be exploited, and different pieces of empirical work have to be combined to obtain a full picture of reform effects. What is needed in any case is a structured process of evaluation which involves the following steps:270
Step 1: Specify the objectives of reforms
This may seem like an obvious point. But experience tells us that defining the objectives of reforms – to be used as a benchmark against which progress can be judged – is often difficult. To take the example of Basel III, the Basel Committee on Banking Supervision (BCBS) states that “Basel III … measures aim to: improve the banking sector’s ability to absorb shocks arising from financial and economic stress …; improve risk management and governance; [and] strengthen banks’ transparency and disclosures”.271 These are specific objectives against which the effectiveness of the Basel III reforms can be assessed. Yet, ultimately, we care about financial sector reforms because of their contribution to the
268 This paper is the shortened version of Buch, Prieto and Weigert (2016). It reflects the views of the authors and
not necessarily those of the Deutsche Bundesbank. 269 Deutsche Bundesbank. 270 On the discussion of cost-benefit analysis in the context of financial sector reforms, see also Cochrane (2014)
and Posner and Weyl (2014). 271 See BCBS, “Strengthening the resilience of the banking sector – consultative document” (2009).
ECB Forum on Central Banking, June 2016 232
stability of the global financial system, the orderly functioning of markets, the cost/availability of financing, and economic growth. These are high-level objectives that may not lend themselves easily to empirical analyses.
Step 2: Define intermediate targets
Because the objectives of reforms are not easily measurable, intermediate targets are needed. Whether reforms are truly effective can be ascertained only over a longer period of time that includes a full financial cycle over which the system is tested. In the interim, one has to rely on a range of intermediate variables to monitor. For more narrowly defined policy objectives, this includes measures of risk-based capital, liquidity and leverage, evidence of improved bank governance, risk management, or reporting practices. For broader objectives, one can use standard indicators of financial system resilience, the cost/level of financing, or market liquidity. But there will certainly not be a single metric such as bank profitability that suffices.
Step 3: Calibration of instruments and ex ante impact assessment
Given policy objectives and intermediate targets to be monitored, instruments need to be calibrated to meet those objectives. This requires an ex ante impact assessment. The broader the policy objective, the more difficult it will be to deal with the challenges discussed above, in particular attribution and aggregation issues.
Step 4: Ex post impact assessment
In a final step, once instruments have been applied and once the effects have been observed for a sufficient period of time, the impact of reforms can be assessed ex post.
Importantly, there is no and there will not be one “ideal” or preferred model for policy evaluation.272 Instead, assessing the effects of different reform elements, in different financial market segments and against the background of different policy goals, requires using different empirical and theoretical models.
Both ex ante and ex post impact assessments need to be embedded into a framework that takes the structure of the financial system into account. Taking a system-wide perspective is important because the resilience of different types of financial systems depends on the type of crisis. Gambacorta et al. (2014) shows that, during “normal” downturns, bank-based systems are more resilient than market-based systems. During recessions and downturns, however, which occur during systemic financial crises, market-based systems tend to be more resilient. Claessens (2016) emphasizes that financial structures evolve endogenously and shape the response to the financial system to regulatory reforms. These responses play out only over a long-term time horizon. Yet there is only limited knowledge on how financial structures affect the response of the financial system to regulatory changes.
Policy assessments that do not meet the above criteria are likely to deliver misleading results. Two examples can show this.
272 For a similar reasoning, see Rodrik (2015).

ECB Forum on Central Banking, June 2016 233
2 Example 1: Deleveraging and capitalization across countries
One main goal of post-crisis regulatory reforms is to increase the share of equity capital in the funding structure of banks and in financing the economy more broadly. In fact, risk-weighted capital ratios of the European banking system increased in the years after the financial crisis from 10.4% to 13.3%, from 2009 to 2014 (see Chart 1).
Chart 1 Bank capital in Europe
(percentage)
Source: Data on total assets, risk-weighted total assets and Tier 1 capital are taken from the ECB’s Statistical Data Warehouse. Notes: This chart shows the ratio of Tier 1 bank capital relative to risk-weighted total assets (yellow line) and the ratio of Tier 1 bank capital to unweighted total assets (blue line) of banks in the European Union. The ratios have been calculated by the authors.
Not all of the additional capital was raised on markets. Banks have substantially relied on retained earnings to increase their level of capital (55% of the fully phased-in Common Equity Tier 1 capital for the 91 largest banks compared with 39% of paid-in capital). Fiscal funds have also been used to recapitalize banks, which is one reason why the share of government debt to GDP in the euro area increased by 4.9 percentage points by the end of 2014.
The increase in the (risk-weighted) capitalization of banks is no reason to be fully complacent for the following reasons.
First, for European banks, bank capital relative to total assets has increased only modestly from 4.5% in 2009 to 5.3% in 2014 (see Chart 1). Much of the increase in bank capitalization came through shifts in the structure of portfolios towards assets with lower risk weights rather than outright deleveraging or an increase in core capital. For the euro area, the cumulated reduction in risk-weighted assets amounts to 14.3% (2009-14). But (unweighted) assets contracted by only 4.6% cumulatively (see Chart 2).
0
2
4
6
8
10
12
14
16
2009 2010 2011 2012 2013 2014
Tier 1 capital to (unweighted) total assetsTier 1 capital to (risk-weighted) total assets
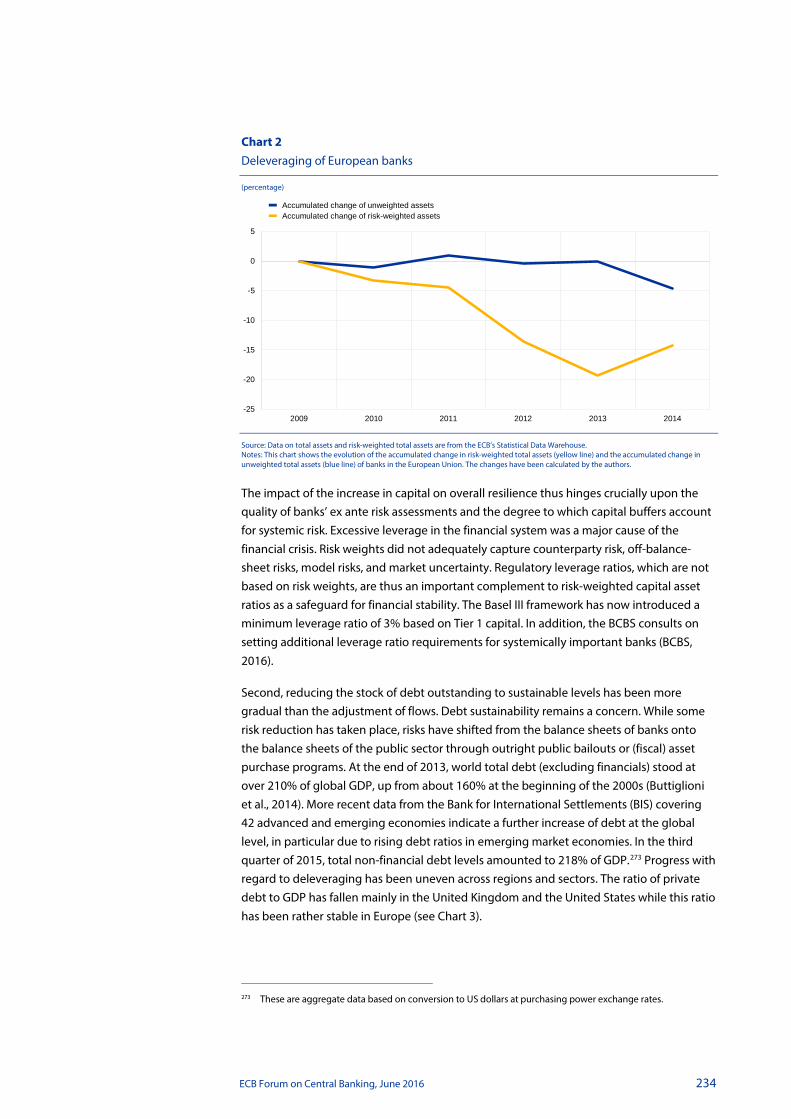
ECB Forum on Central Banking, June 2016 234
Chart 2 Deleveraging of European banks
(percentage)
Source: Data on total assets and risk-weighted total assets are from the ECB’s Statistical Data Warehouse. Notes: This chart shows the evolution of the accumulated change in risk-weighted total assets (yellow line) and the accumulated change in unweighted total assets (blue line) of banks in the European Union. The changes have been calculated by the authors.
The impact of the increase in capital on overall resilience thus hinges crucially upon the quality of banks’ ex ante risk assessments and the degree to which capital buffers account for systemic risk. Excessive leverage in the financial system was a major cause of the financial crisis. Risk weights did not adequately capture counterparty risk, off-balance-sheet risks, model risks, and market uncertainty. Regulatory leverage ratios, which are not based on risk weights, are thus an important complement to risk-weighted capital asset ratios as a safeguard for financial stability. The Basel III framework has now introduced a minimum leverage ratio of 3% based on Tier 1 capital. In addition, the BCBS consults on setting additional leverage ratio requirements for systemically important banks (BCBS, 2016).
Second, reducing the stock of debt outstanding to sustainable levels has been more gradual than the adjustment of flows. Debt sustainability remains a concern. While some risk reduction has taken place, risks have shifted from the balance sheets of banks onto the balance sheets of the public sector through outright public bailouts or (fiscal) asset purchase programs. At the end of 2013, world total debt (excluding financials) stood at over 210% of global GDP, up from about 160% at the beginning of the 2000s (Buttiglioni et al., 2014). More recent data from the Bank for International Settlements (BIS) covering 42 advanced and emerging economies indicate a further increase of debt at the global level, in particular due to rising debt ratios in emerging market economies. In the third quarter of 2015, total non-financial debt levels amounted to 218% of GDP.273 Progress with regard to deleveraging has been uneven across regions and sectors. The ratio of private debt to GDP has fallen mainly in the United Kingdom and the United States while this ratio has been rather stable in Europe (see Chart 3).
273 These are aggregate data based on conversion to US dollars at purchasing power exchange rates.
-25
-20
-15
-10
-5
0
5
2009 2010 2011 2012 2013 2014
Accumulated change of unweighted assetsAccumulated change of risk-weighted assets

ECB Forum on Central Banking, June 2016 235
Chart 3 Private sector deleveraging
(ratio of private non-financial sector debt to GDP)
Source: Data are taken from the dataset provided by the BIS on credit to the non-financial sector. Note: This chart shows the evolution of the ratio of private non-financial sector debt to GDP for the euro area (red line), the United Kingdom (blue line) and the United States (yellow line).
Market exit of financial institutions (and the associated write-down of debt) is the most drastic form of stock adjustment. Yet some elements of financial sector reforms, notably the establishment of regimes for the restructuring and resolution of financial institutions, are only now taking effect. In Europe, the Bank Recovery and Resolution Directive (BRRD) only came into effect in January 2016. At the global level, the requirement for systemically important financial institutions to refinance their assets with a sufficient amount of debt that can be bailed in (Total Loss Absorbing Capacity, or TLAC) will be phased in from the year 2019 onwards.
Third, maintaining adequate levels of bank capital thus remains an issue in countries with weak macroeconomic fundamentals and/or with high levels of legacy assets in the form of non-performing loans. These problems weigh on profitability, which in turn lowers the ability of banks to raise new capital or – in the case of losses – reduces the capital of the banks. Weakly capitalized banks, in turn, can be an important constraining factor for real sector dynamics.
To what extent are trends in bank lending and deleveraging linked to regulatory reforms? A recent initiative of the International Banking Research Network (IBRN) looks into the drivers of lending patterns across global banks and the impact of regulation. The IBRN was founded in 2012 in order to improve our understanding of the drivers of (cross-border) bank lending, the role of international banks, and policy spillovers. It brings together central bank researchers from more than 20 national central banks, the BIS, the IMF, and the ECB. It coordinates common research, using micro-data on global banks. Buch and Goldberg (2016) provide a meta-analysis of 15 country studies on spillover effects of regulatory policies into lending. This work shows that cross-border effects of macroprudential tools differ significantly across countries, institutions, and policy instruments. Lending response to capital requirements, exposure limits, loan-to-value caps, and reserve requirements depends on the strength of banks’ balance sheets. Spillovers through affiliates of foreign banks are more frequent than those through
95
100
105
110
115
120
125
2004 2005 2006 2007 2008 2009 2010 2011 2012 2013 2014 2015
United KingdomUnited Stateseuro area

ECB Forum on Central Banking, June 2016 236
domestic banks. Policy assessments that ignore the significant heterogeneity in bank lending responses to regulatory changes might thus provide incomplete or even misleading information.
3 Example 2: Bank profitability and financial stability
A second example showing the importance of a careful analysis of financial sector reforms in a structural model is the recent discussion on bank profitability. Bank profitability dropped sharply after the financial crisis and has hardly recovered ever since. Current returns on asset and on equity in the banking sector are low compared with the pre-crisis values (see Chart 4).
Chart 4 Return on equity
(ratio of net income to bank capital)
Sources: Data for the euro area and Germany are taken from the Financial Soundness Indicator Database of the IMF. Data for the United States are taken from Federal Reserve Economic Data (FRED), Federal Reserve Bank of St Louis. Note: This chart shows the evolution of the ratio of net income to bank capital for the euro area (blue line), Germany (yellow line), and the United States (red line).
Generally, bank profitability is affected by regulation, monetary policy, the demand (and supply) for bank credit, the growth prospects of the real economy, and by bank-level factors. Among these, the combined effect of regulatory factors on bank profitability is not clear-cut. Overall, lower bank profitability may be consistent with a better capitalized, less risky and more resilient banking system. The reforms increased the level of capital, causing measured profitability to decrease. Banks’ incentives to take risk may also weaken if levels of equity increase. The result would be lower risk premia. Moreover, subsidies for banks considered too big to fail and implicit guarantees for national banking sectors may have lifted pre-crisis measures of profitability.274 To the extent that business models of banks have been profitable because borrowing costs were implicitly subsidized through too-big-to-fail guarantees, bank profitability has declined. The reduction in bank profitability
274 See Siegert and Willison (2015) for an overview of empirical approaches on how to estimate the too-big-to-fail
subsidy for (large) banks.
-5
0
5
10
15
20
2005 2006 2007 2008 2009 2010 2011 2012 2013 2014 2015
RoE, euro areaRoE, GermanyRoE, United States
ECB Forum on Central Banking, June 2016 237
resulting from reforms that addressed distortions such as implicit guarantees may thus be an intended consequence of reforms.
Recent evidence shows that regulatory reforms have an ambiguous effect on bank profitability, that (expansionary) monetary policy may increase or decrease bank profitability, and that structural factors are important (Buch et al., 2014; Fischer et al., 2014; ECB, 2015; and von Borstel et al., 2016). All of these drivers of bank profitability may vary across countries and time, thus limiting the use of bank profitability as a metric for assessing the stance of the financial system and its resilience.
Irrespective of the drivers of bank profitability, the question arises whether (low) profitability may incentivize bank risk taking and whether this may give rise to systemic risks. Careful inspection shows that the effect of bank competition on bank risk taking is non-linear (Martinez-Miera and Repullo, 2010): increasing competition in banking first reduces and then increases bank risk taking. The idea is as follows: in monopolistic markets, more intense competition results in lower lending rates, which in turn lower the risk of bankruptcy for bank borrowers (because they have an incentive to choose safer investments). This effect reduces the risk on banks. However, if the level of competition is high, this risk-reducing effect of lower interest rates is offset by a lower income from performing loans. This reduces the buffer against loan losses and makes banks more risky. The impact of an increase in competition on bank risk, therefore, depends on the degree of competition.
Overall, the empirical evidence is inconclusive with regard to the actual drivers of bank profitability as well as the link between profitability (and market power) and risk taking incentives (Buch et al., 2013; Kick and Prieto, 2015). This questions the reliability of bank profitability as an early warning indicator of financial stress.
Empirically, Navajas and Thegeya (2013) investigate the link between the return on equity (RoE) of banks and the probability of financial crises. They find a positive coefficient on lagged bank profitability and a negative coefficient on current bank profitability when explaining the probability of a crisis occurring. Čihák and Schaeck (2007), in contrast, find a negative sign for the coefficient on the contemporaneous and the lag of RoE. They argue that a deterioration in bank profitability can serve as an indicator for systemic banking crises.
4 Summing up
Since the onset of the global financial crisis, progress has been made with regard to the strengthening of the financial system and the regulatory (and institutional) framework. Given the broadness of the reform agenda and the short period of time that has passed since many new reform elements have been implemented, it is too early to assess the full impact of the reforms. At the same time, the financial system will continue to be challenged and its resilience will be tested. Reviewing the reform agenda and assessing the resilience of the system should take the following aspects into account:

ECB Forum on Central Banking, June 2016 238
1. Increasing the resilience of banks through higher capital requirements has been one focus of post-crisis regulatory reform. Financial institutions are thus better equipped to deal with stress on financial markets and to activate private sector risk buffers. Yet, it should not be overlooked that overall leverage of the economy is high, that stock adjustment has been slow, and that the adequacy of capital buffers needs to be assessed against the stability of the overall financial system. Judging the stability of the financial system by indicators such as the profitability of banks can be misleading. Some of the trends in the data can in fact be intended consequences of reforms, and the links between profitability (or market power) and financial stability are not clear-cut.
2. Credible application of the new rules is crucial, in particular as regards the recovery and (potential) resolution of systemically important banks. Dealing with a high stock of legacy assets requires mechanisms for the restructuring and resolution of systemically important financial institutions. These new rules are now becoming effective in Europe, and markets will have to re-price risk as implicit guarantees are being withdrawn. This re-pricing of risks is part of the transition to a more resilient financial system and should not, however, be taken as a signal to delay implementation of the new principles. To the contrary, delays may invite speculation about public bailouts, create additional political uncertainty and – ultimately – further destabilize markets. This holds also because the level of public debt has increased in the aftermath of the crisis. Attempts to bail out financial institutions may raise concerns about the sustainability of public debt.275 Fixing any flaws in the new regimes for bail-in should thus be aimed at streamlining existing procedures in order to strengthen rather than weaken the agreed principles.
3. Impact assessments need to follow clear and well-defined rules. The new micro- and macroprudential rules as well as rules for the restructuring and resolution of systemically important banks are largely untested. Therefore, a structured impact assessment is needed to evaluate the efficiency, the effectiveness, and potential side effects of these reforms. Any impact assessment makes sense only if it may eventually lead to a re-calibration of policy instruments. Such re-calibration, however, should neither contribute to uncertainty about the regulatory agenda nor should it open the doors for a watering down of regulations or to compromise on resilience. Therefore, a structured policy framework is needed which specifies, inter alia, the timing of impact assessments and key methodological elements.
4. Structural reforms are needed, both inside and outside the financial sector. Within the financial sector, adjustment to a more sustainable financial system will require an adjustment of business models, which may necessitate adjustment along the extensive margin. However, the health of the financial sector ultimately reflects the health of the real economy. Financial sector reforms cannot succeed without accompanying reforms that strengthen the productivity of the real economy, which feed into sustained profitability of banks and other financial institutions.
275 On the link between sovereign risk and stability of the banking system, see Farhi and Tirole (2016).
ECB Forum on Central Banking, June 2016 239
References
Buch, C., Eickmeier, S. and Prieto, E. (2014), “Macroeconomic factors and micro-level bank behavior”, Journal of Money, Credit and Banking, Vol. 46, pp. 715-751.
Buch, C.M. and Goldberg, L. (2016), “Cross-Border Regulatory Spillovers: How Much? How Important? A project of the International Banking Research Network”, Deutsche Bundesbank and Federal Reserve Bank of New York, mimeo.
Buch, C.M., Koch, C.T. and Koetter, M. (2013), “Do banks benefit from internationalization? Revisiting the market power-risk nexus”, Review of Finance, Vol. 17, pp. 1401-1435.
Buch, C.M., Prieto, E. and Weigert, B. (2016), “Regulatory Reform at the Crossroads. From Implementation to Impact Assessment”, Deutsche Bundesbank, mimeo.
Buttiglioni, L., Lane, P.R., Reichlin, L. and Reinhart, V. (2014), “Deleveraging? What Deleveraging?”, Geneva Reports on the World Economy 16, International Center for Monetary and Banking Studies and CEPR, September.
Čihák, M., and Schaeck, K. (2007), “Banking competition and capital ratios”, IMF Working Paper, No 07/216, Washington DC.
Claessens, S. (2016), “Regulation and structural change in financial systems”, paper presented at the 2016 ECB Forum on Central Banking, Sintra.
Cochrane, J.H. (2014), “Challenges for Cost-Benefit Analysis of Financial Regulation”, Journal of Legal Studies, Vol. 43.
European Central Bank (2015), Financial Stability Review – Special features B: Bank profitability challenges in euro area banks: the role of cyclical and structural factors, Frankfurt am Main, May.
Farhi, E., and Tirole, J. (2016), “Deadly Embrace: Sovereign and Financial Balance Sheets Doom Loops”, NBER Working Paper, No 21843, Cambridge, MA.
Fischer, M., Hainz, C., Rocholl, J. and Steffen, S. (2014), “Government guarantees and bank risk taking incentives”, ESMT Research Working Papers, ESMT-14-02, Berlin.
Gambacorta, L., Yang, J. and Tsatsaronis, K. (2014), Financial structure and growth, Bank for International Settlements, Basel.
Hellwig, M. (1998), “Banks, Markets, and the Allocation of Risks in an Economy”, Journal of Institutional and Theoretical Economics, Vol. 154.
Kick, T. and Prieto, E. (2015), “Bank Risk and Competition: Evidence from Regional Banking Markets”, Review of Finance, Vol. 19, pp. 1185-1222.
Martinez-Miera, D. and Repullo, R. (2010), “Does Competition Reduce the Risk of Bank Failure?”, Review of Financial Studies, Vol. 23, pp. 3638-3664.
Navajas, C.M. and Thegeya, A. (2013), “Financial Soundness Indicators and Banking Crises”, IMF Working Paper, No 13/263, Washington DC.

ECB Forum on Central Banking, June 2016 240
Posner, E.A. and Weyl, E.G. (2014), “Cost-Benefit Paradigms in Financial Regulation”, Working Paper, University of Chicago.
Rodrik, D. (2015), Economics Rules: The Rights and Wrongs of the Dismal Science, W.W. Norton & Company.
Siegert, C. and M. Willison (2015), “Estimating the extent of the ‘too big to fail’ problem – a review of existing approaches”, Bank of England, Financial Stability Paper, No 32, London.
von Borstel, J., Eickmeier, S. and Krippner, L. (2016), “The interest rate pass-through in the euro area during the sovereign debt crisis”, Journal of International Money and Finance, Vol. 68, pp. 386-402.

ECB Forum on Central Banking, June 2016 241
Regulators should take a holistic view of the impact of radical uncertainties on the finance industry By Andrew Sheng276
I want to thank Vítor Constâncio, Vice-President of the European Central Bank, for his kind invitation to join this prestigious event. It is wonderful to be amongst old friends and meet many new friends. Coming from Asia and having recently been pre-occupied with thinking through what the problems are of shadow banking in China277 forced me to think through some of the issues that China is transitioning that have relevance to the issues of financial system change globally and their implications on financial regulations.
First, the views that I present today do not represent the views of the CBRC278, CSRC279 or any institutions that I am associated with. The difference between Asians and Westerners is that we Asians always start with an apology. So if there is anything that I criticize or appear to criticize today, let me apologize in advance.
Second, as someone who studied in England, I learnt how to praise everybody first, before you cut the argument down to size.
So let me first praise what has been achieved in financial regulation today. I think regulation has succeeded very well in raising higher capital ratios, defining liquidity standards and pushing overall leverage ratio and total loss-absorbing capacity (TLAC). There are some useful corporate governance changes, and I totally agree with Charles Goodhart280 that there is now greater attention on conduct. It used to be said that Asian regulators over-regulate and under-enforce, but this time the enforcement is mostly on anti-money laundering sanctions, etc., which are breaches of the law, but geopolitical in nature. Now that banks are beginning to trade with Iran, and Iran is becoming a geopolitical ally, the question is: can we get a discount back? On these issues (of sanctioning for conduct of the financial sector), we need to be very clear what the objectives and outcomes are and should be.
Stanford Professor Darrell Duffie has done a very good job in his paper281 and presentation of highlighting where the flaws lie in regulatory outcomes. Furthermore, the previous panel had a highly constructive discussion on this.
276 Fung Global Institute. 277 Andrew Sheng and Ng Chow Soon (2016), Shadow Banking in China: An Opportunity for Financial Reform,
London, John Wiley. 278 China Banking Regulatory Commission. 279 China Securities Regulatory Commission. 280 Professor Emeritus, London School of Economics. 281 Darrell Duffie (2016), “Financial Regulatory Reform After the Crisis: An Assessment”, Standford University,
Post-conference version: 2016 ECB Forum on Central Banking, Sintra, June 2016.
ECB Forum on Central Banking, June 2016 242
I want to make several key points. The first one is that, based on current regulatory duties and responsibilities, I for one would never want to be in a bank and never want to be an independent non-executive director, because everything I do, I would have to check the regulations first. If I, who had a very minor hand in Basel II and of course the IOSCO principles282, have difficulty understanding the current regulations, can you imagine if some people have problems with understanding these complex regulations? I read some of the consultation papers: by the time you have cross-checked subsection 3, referenced to Article 1, referenced to certain risk models, referenced to parts of the Dodd-Frank Act that have not yet been written, it is not surprising that one needs full-time lawyers to explain to bank staff how to implement the regulations. Given that much of the regulations are still evolving in the advanced economies, how should emerging market regulators write their regulations and formulate their complex financial policies going forward?
The result is what has happened in the financial industry. I am sorry to have to say this but when bankers are being micro-managed almost by regulation (that is how they feel, I am not saying that they are), plus with huge sanctions if they get it wrong, they will move into asset management, Fintech and startups where they will not be regulated in the same way. If that happens, then where is the banking industry going to get the talent to take the industry forward? The danger of excessive sanctions is that you are shooting the survivors of the last financial crisis. The guys who caused the crisis are retired somewhere in some very nice place with all their bonuses. None of them went to jail. The incentive structure for the banking industry arising from the current sanctions is an issue that we need to be very careful about.
The second issue is about operational risk.
Any of you who have implemented IT systems would know this: to get very complex IT systems to work together, you need to understand and embed very complex rules, standards and processes into the IT system. Without clarity in these regulations, standards and processes, the IT system on which compliance, risk and cost controls are managed will not work well. Which is why every stress test and examination of any bank will find that they do not have integrated information systems. As the European system stress test found out, each bank has 40 to 50 different risk models in their system and they suffer from what we call pilot dial stress. What does this mean? When the pilot sits in a cockpit with 40 to 50 dials, he is looking at the dials, but not looking to see where the plane is heading. In other words, when you impose so many risk models and regulatory requirements into the system, the CEO is not concentrating on the business model risk. Charles Goodhart and Hyun Song Shin283 have stressed this in the earlier panels and I want to echo this critical issue.
In essence, complex operational risks arising from complex regulations and other factors are causing a failure of the current business models of finance – finance is increasingly becoming too complex to manage.
282 As former Chairman of the Technical Committee of IOSCO, 2013-15. 283 Economic Adviser and Head of Research, Bank for International Settlements.

ECB Forum on Central Banking, June 2016 243
We have actually moved into an age of uncertainty, something that was raised by former Bank of England Governor Mervyn King’s latest book284. If we did not understand money and finance, it is because we completely put risk models as measurable volatilities when the biggest risk is uncertainty. The risk models are too numerous and too flawed: they cannot cope with radical uncertainty arising from changing geopolitics and other inter-related factors. Brexit is geopolitics, as is the South China Sea, North Korea, etc. All these, together with disruptive technology, climate change, unconventional monetary policy and social inequities, are changing the context in which banking operates.
At the same time, we are worried about secular deflation. Why are we worried about the United States raising interest rates? If interest rates are now to be raised following a situation of having near-zero interest rates, asset bubbles will deflate and if real estate bubbles deflate, then the banking system will truly suffer. The reason is simple – banks have, say, 8% to 10% of capital, with bank assets around 60% to 100% of GDP. So with bank capital at roughly 5% to 10% of GDP, increments of another 1% to 4% of risk-based capital will not be sufficient to cushion a fall in the real estate sector, which is roughly 250% of GDP. A 15% fall in real estate prices will have a wealth loss equivalent to a shock of 37.5% of GDP, so even 15% of capital may not be enough to cushion such a shock. There is no point in getting rid of too big to fail – when real estate suffers such a shock, all banks become too big to fail.
Having made these controversial statements, let me now go back to Stijn Claessen’s285 paper286, which I truly admire for its thoughtful analysis.
I want to step back a little bit on the structure of financial systems, because finance to me is a derivative of the real economy. It has a very complex interaction with the real sector and if you do not understand how the real economy is changing, you would not understand how finance is changing, because finance is supposed to serve the real sector. The global financial crisis showed that it was not serving the real sector. In fact the real sector paid for the mistakes of finance.
In looking at the Chinese financial system reforms, particularly on problems arising from shadow banking, I suddenly realized that China is moving at breakneck speed into a new service-driven knowledge economy, in which creative destruction is happening. If that is the case, and if we do not understand how the real sector economy is being transformed, then how can we fix the old finance model?
Let me explain this as simply as possible.
Andy Haldane287 and others have all observed that finance functions as networks. If the real economy and finance are networks, then we have moved from a hardware economy in the 20th century towards a software economy in the 21st century, where the value of
284 Mervyn King (2016), The End of Alchemy: Money, Banking and the Future of the Global Economy, London, Little
Brown. 285 Senior Adviser, Board of Governors of the Federal Reserve System and a former colleague at the World Bank. 286 Stijn Claessens (2016), “Regulation and Structural Change in Financial Systems”, 2016 ECB Forum on
Central Banking, Sintra, June 2016. 287 Andrew Haldane (2016), “Finance Version 2.0?”, Joint Bank of England/London Business School Conference
on “Is there an industrial revolution in financial services?”, 7 March 2016.
ECB Forum on Central Banking, June 2016 244
software networks is priced higher than hardware networks. Roads, railways, airlines, shipping, etc., are all examples of hardware networks. Then, on top of all that, we built the telephone or telecommunication networks (Telcos). Recently I went to Spain and we looked at the business model of a Telco. I realized that a Telco is actually a bank, because the Telco has customers and deposit accounts linked to its network. The only thing that stops a Telco from becoming a bank (to transfer value between customer accounts etc.) is regulation. The Telco realized that the banks and Fintech companies operate on its telecommunication platform, because they move all the financial and payment information through the Telco network, essentially eating its lunch or business revenue model. An example is the rise of WhatsApp and WeChat, which provide free messaging, but use the Telco networks for internet. The Telco cannot move into banking and other services because of regulation.
However, if you think through what is happening, you suddenly realize that the rise of Alibaba and Amazon has actually led them to also be eating the bankers’ lunch. I use the word Fintech broadly to include these internet giants, and not the small startups that are important for innovation, but that do not have the scale to compete as yet. By Fintech, I mean the Googles, the Amazons and the Facebooks of this world. They all aim to have a billion or more customers each. The only thing that stopped Amazon and all of them moving into finance is regulation. In China, the regulators did not stop Alibaba moving into the finance area. This created what is now known as multi-sided platforms.
As it serves multi-sided markets from one software platform, Alibaba has become an ecosystem that straddles production, distribution, logistics, and, incidentally, finance. The future consumer will be using all activities of buying, selling, reading, trading, investing, and paying by mobile phone or voice-activated remote. If we’re worried about Alibaba, then just be aware that there is a company called Tencent, which did not exist 18 years ago but which today has 697 million customers and a market capitalization larger or equal to the size of ICBC, which is the largest bank in the world. Tencent has a market value and a WeChat customer base larger than ICBC and ten times that of the largest bank in Germany. These guys are eating the bankers’ lunch.
When retailers complain that Amazon is eating their lunch, bankers and financiers should be worried. The range, scope and scale of Amazon-type services to the client is amazing, because these multi-sided platforms can offer their customer a life-time supply of goods and services, which the finance sector has not been able to exploit because of regulation. They have a holistic, 360 degree knowledge of their customer, whereas finance remains a one-sided market, with partial understanding of customer needs. Even with universal banking, banks offer only one side of customer requirements – the finance side. Amazon, for example, can offer 1.8 million women’s dresses of different designs and sizes on their website. The largest Walmart mall would be lucky to house 10,000 types, with huge costs on inventory and real estate. All that Walmart or multi-sided markets have to do is offer substantial discounts on customer purchases with them to beat bank deposit or asset management because the yield on retail deposits is near zero. Technology is changing the delivery of goods and services in ways that we do not, as yet, fully understand.
Let me come to a basic conclusion.
ECB Forum on Central Banking, June 2016 245
I recently talked to some global bankers in Singapore, and I apologize for my direct summing up, which was as follows: I said, “zero interest rates are taking away your lunch; financial regulation is squeezing your lunch; Fintech is eating your lunch and some of you are still out at lunch. The only reason you are out at lunch is that you are protected by the current regulations”.
If the bankers’ business model is broken, then what is regulation doing? Has the regulation been far-sighted enough to see where we are moving?
Very simply, there are five inter-related radical uncertainties that are changing the “normal” in financial business and its regulation.
First is geopolitics, of which Brexit is one example of how it could change the direction of Europe and global political developments.
Second, the zero interest rate is compressing not just the business model of banks, but also insurance and pension companies and fund managers. Who wants to pay a fund manager or a bank 1% to 1.5% in asset management fees when the expected return on unleveraged assets is zero? The only way a fund manager can earn better than 1% per annum is to undertake leveraged risk on behalf of their clients. When my private banker tells me he can lend me five times my US dollar deposit in order to get a 4% return on dollars, I just think that this business model must be seriously broken. They have transferred all market risks to the customer.
The third radical uncertainty is the unintended consequences of deleveraging. The policy direction of regulations on higher capital and liquidity are right, but the timing of the cumulative effect of such regulation is procyclical. Taken together with the impact of tougher sanctions on any regulatory breach, banks and financial intermediaries are becoming risk-adverse and not lending to fund real activities.
The fourth uncertainty is disruptive technology, which, as explained earlier – including the arrival of Blockchain – is making traditional business models obsolete. Traditional banks have cost income ratios of 50% or more, whereas Fintech companies have less labor, less real estate and hardware, and cost ratios of less than 20%. Small wonder, then, that bank shares have been priced accordingly.
Fifth, creative destruction is happening with a speed that we have difficulty comprehending. If we go back to the system model of tiered networks, what is happening is that value is being created at the top tier of the software knowledge economy, but the creative destruction is happening at the hardware level. If you imagine a very simple model in which the whole economy moves over to the new economy, the value destruction of the old economy is a loss which we have not yet recognized, such as lost jobs, excess capacity, obsolete inventory and production facilities (not forgetting pollution costs). Governments face a major policy dilemma because they are not able to tax the winners to pay for these creative destruction losses. These losses will surface faster as the global economy slows further with deflation.
We tend to treat individual uncertainties as if there is a single policy solution or tool for each. The system is actually facing the cumulative interaction effects of each uncertainty that adds up to a seriously broken or flawed business model for traditional banking, in

ECB Forum on Central Banking, June 2016 246
addition to a flawed policy model for financial regulation and central banking. Pre-crisis, we were worried about inflation and too much bank profits from excess leverage. Post-crisis, reflation is much tougher than we expected, so that in the face of complex uncertainties, old tools may not only have little curative effects but may even exacerbate the current challenges.
We may need to use new tools for new challenges, but the oldest “new tool” may be simply to back off and give the industry some breathing space to adjust. The market cannot rely on regulators and central banks to step in to deal with all their problems. The markets need time to adjust and adapt themselves to new conditions.
Hence, what are the major parameters to frame these new challenges? As I said, we have moved from an age of risk (measured volatilities) to an age of radical uncertainty (where we have to accept that there are unknowns). Some sacred cows need to be re-examined.
Of course increasing capital is very important. Essentially, our current risk models basically assume that our present regulated banking system is able to cope with a two standard deviation move in markets. However, even in the deepest and most liquid of markets, we have recently witnessed five plus standard deviations market movements. Consequently, should we be so surprised that central banks have moved from being lenders of last resort to also being market-makers of almost first resort?
The second conventional wisdom is what do we really mean by a level-playing field? Many of you would know Katharina Pistor’s admirable work on the legal theory of finance.288 In essence, instead of being equal, finance is a highly hierarchical system of legal contracts that end up with concentrated winner-take-all situations. In many countries, the top five banks account for 70% of the business. The top three global news networks provide most of the information and market analyses on which we make market decisions. The top three internet websites account for 90% of web searches. Just like networks, hubs and links are becoming hierarchical. The more hierarchical, the more concentrated and, systemically, the more fragile they are. They become too big to fail i.e. they are not level playing fields for the small, uninformed mass customer bases with limited market access.
Third what is fair value when the discount rate is zero and negative? We are in a contorted situation where the common risk management and market valuation models cannot deal with these unprecedented situations. If and when another mid-sized financial crisis occurs – as Hélène Rey289 and Pierre-Olivier Gourinchas290 have argued – and when there is flight into regional safe assets, countries will defend themselves with negative interest rates in order to combat what they consider to be excessive revaluation of their exchange rates.
Actually I am less worried about the negative real interest rates of high quality bonds in the advanced markets, but capital flight from the emerging markets has caused the risk spread of emerging markets and non-investment class debt paper to widen sharply, thus depressing market activities in the emerging markets even more. The overshooting of
288 Katharina Pistor (2013), “A Legal Theory of Finance”, Columbia Public Law Research Paper, No 13-348. 289 Professor, London Business School. 290 Professor, University of California at Berkeley.

ECB Forum on Central Banking, June 2016 247
exchange rates from very unusual levels of advanced country interest rates will have a further deflationary impact on the global economy.
I experienced this impact in Hong Kong before and during the Asian financial crisis.
If you suppress the price of real estate by providing public housing at below-market prices, are you surprised that private housing prices shoot up ludicrously because you are not addressing the supply response? In the same way, when the interest rate for risk-free sovereign debt is now zero or negative, then the risk spread of emerging markets rises, and higher real interest rates for emerging markets will deflate their economies and cause more deflation in global aggregate demand.
I am not blaming anybody because this is a systemic problem – a mindset issue in a context that is moving very rapidly in unpredictable ways. As Claudio Borio and others have argued, this is a systemic issue where not only finance, but also incentives in the real sector that are built into the system and that are shaping the mindset have moved collectively into a new normal of abnormality. As financial regulators and central bankers, are we thinking only at the margin with a pretense of perfection? Are we pushing the complexity envelop even more, rather than stepping back and asking whether we are headed in the right direction? Certainly, the business model of banking is facing huge problems.
To finish, I agree with Mario Draghi291 when he says we cannot harmonize all these demands from different levels and quarters. We may have difficulty coordinating, but at least we should try to align ourselves on where our common interests are. Our common interest is the risk that, without intending to do so, collectively we are pushing the system towards greater fragility. The chances of the world sliding towards global secular deflation are increasing, with consequences for financial sector stability.
To sum up, I want to propose a variation of Minsky’s dictum, which states that stability creates instability. I learnt this from one of the smartest bankers in Asia, who recently stepped down from banking. She observed that financial regulation may be creating more macro-uncertainty by trying to manage micro-risks more and more. In other words, the more the state intervenes in micro-guidance, the more the market does not know how to rebalance. This is a variant of Minsky’s dictum that managing stability may be counterproductive in that it generates system instability.
There is an old Chinese saying that if you want to do anything right, you must align the timing, the resources and human unity. We really need to align the incentives between central banks, regulators and the industry to accept that we may not be able to implement all the reforms in the timetable that we want, because the economic cycle is now downward. We need to give priority to what we need to do quickly: that is, to fix the business models of an industry that is changing very rapidly. Therefore, in a situation where bankers are now feeling demoralized, how do we talk to them as equals, as partners in order to move ahead and concentrate on how to macro-manage, rather than micro-manage, the emerging uncertainty, which may be the only solution to go?
291 President, European Central Bank.

ECB Forum on Central Banking, June 2016 248
I am sorry if I seem to be lecturing too much to all you wise people, but then I apologized earlier and I apologize again for making these observations on the current industry and financial regulatory challenges.
References
Andrew Haldane (2016), “Finance Version 2.0?”, Joint Bank of England/London Business School Conference on “Is there an industrial revolution in financial services?”, 7 March 2016.
Andrew Sheng and Ng Chow Soon (2016), Shadow Banking in China: An Opportunity for Financial Reform, London, John Wiley.
Darrell Duffie (2016), “Financial Regulatory Reform After the Crisis: An Assessment”, Stanford University, Post-conference version: 2016 ECB Forum on Central Banking, Sintra, June 2016.
Katharina Pistor (2013), “A Legal Theory of Finance”, Columbia Public Law Research Paper, No 13-348.
Mervyn King (2016), The End of Alchemy: Money, Banking and the Future of the Global Economy, London, Little Brown.
Stijn Claessens (2016), “Regulation and Structural Change in Financial Systems”, 2016 ECB Forum on Central Banking, Sintra, June 2016.
ECB Forum on Central Banking, June 2016 249
Beyond financial system resilience – the need for a new regulatory philosophy By Adair Turner292
I want to focus primarily on some thoughts provoked by Stijn Claessens’ paper and in particular by his focus on what financial systems do vis-à-vis the real economy and what functions they perform. I also want to suggest that while regulatory reform since the crisis has made quite a lot of progress in making the financial system itself more resilient, we have not yet addressed the fundamental issue of how much real economy debt the financial system helps generate and what types of debt.
My remarks will overlap to some extent with what Charles Goodhart said earlier but with a slight difference. Charles started his remarks with the words from the Confession from the English Book of Common Prayer: “We have left undone those things which we ought to have done; and we have done those things which we ought not to have done.” I happen to agree with the first part of that statement, but not the second. I think, broadly speaking, that the things we have done were the right ones. But there are other things we should do as well.
I am actually fairly confident that the financial system is significantly more resilient than it was before 2008. That reflects the major progress on bank capital and liquidity which Darrell Duffie describes in his paper; and it reflects the significant process that Darrell also described in the arena of derivatives counter-party clearing. And while I agree with Darrell that central clearing creates a potential single point of failure, I think the fact that we have concentrated derivatives clearing in those single points gives us the capacity to set the appropriate capital and margin requirements to address the risks which a single point of failure introduces.
As for shadow banking, while we must always be alert to the dangers created by a continually mutating and innovating financial system, and while there are some developments in asset management practices which we must monitor very carefully – as the BIS has pointed out – I think we should also recognise that in several ways in the advanced economies, though definitively not in China, the specific forms of shadow banking which created major risks before 2008 have significantly declined in importance.
As we have more tightly regulated the banks, there has been some shift of credit provision to non-bank channels. But that has primarily reflected the growth of a form of non-bank credit intermediation – the issue of single name corporate bonds by large corporates – which existed long before the financial innovations of shadow banking and which in principle could be a stable form of credit intermediation. And conversely, we have seen a dramatic decline in the role of the sort of complex shadow bank activities which proliferated before 2008 – the complex structured credit securities, the alphabet soup of CDOs and CDO squareds, etc. distributed via complex and opaque distribution chains
292 Institute for New Economic Thinking.

ECB Forum on Central Banking, June 2016 250
passing through SIVs and the ABCP market, money market mutual funds and through repo markets in non-standard securities.293
A lot of the institutions, contracts and activities most implicated in the origins of the 2008 crisis have largely disappeared from the system. So while we must never be complacent – since new forms of risk will continually emerge – for now I think the financial system is much more resilient than it was before the crisis. Ahead of the Brexit vote I was asked by several international journalists “if there is Brexit, will there be a Lehman’s moment?” And I replied that if by a “Lehman’s moment” they meant a dynamic in which one event triggers another in a self-reinforcing domino cycle within the guts of the financial system itself, I could confidently answer “No”. Brexit was never going to produce another “Lehman’s moment” because we have made the financial system itself far more resilient.
But the global economy is not in good shape. It is suffering from inadequate demand and inadequately high inflation. And the fundamental reason is that before the crisis the private financial system created excessive private leverage, with private credit to GDP growing from 50% in 1950 to 170% by 2007.
That left us in a situation where, post crisis, the leverage has not gone away but instead simply moved around the global economy: from the private sector to the public sector, or from the advanced economies to the Chinese economy; but with total global debt to GDP now higher than ever.
Before the crisis, as Stijn Claessens says, the predominant academic attitude to that growing private leverage was that it was one element of beneficial financial deepening, with several empirical studies seeming to show positive correlations between private credit to GDP and economic growth. Any concerns therefore tended to be focused on those emerging economies where it seemed there was a reasonable argument that private credit to GDP was too low.
As Stijn points out, this positive assessment was built on an assumption, and I quote from his paper, that “financial intermediation is about deposits and other funds being raised from households and then channelled to the corporate sector”.294 And if you look at economic textbooks and, until recently, most academic papers, that was indeed our standard model description of what the financial system does: it takes deposits from the household sector and extends loans to businesses and entrepreneurs, thus allocating credit between alternative capital investment projects.
But as a description of what banks do in advanced economies, this belongs on the same shelf in the bookshop as Harry Potter: it is a largely fictional account. For, as Jordà, Schularick and Taylor have put it, “that standard textbook function of bank credit intermediation constitutes only a minor share of the business of banking today”. Instead the vast majority of bank lending, and of capital market lending in the United States, is devoted to real estate; and a large proportion of that real estate lending in turn does not actually finance new capital investment in new housing or commercial real estate, but a
293 Collateralised debt obligations (CDOs), structured investment vehicles (SIVs) and asset-backed commercial
paper (ABCP). 294 Version of Mr Claessens’ paper available at the time of the conference.
ECB Forum on Central Banking, June 2016 251
competition between people or firms for the ownership of real estate assets that already exist.
And it is that reality which, I believe, lies behind the emerging empirical findings to which Stijn’s paper refers.
• The findings from Cecchetti and Kharroubi, and from the OECD last June, that there is not a linear and limitless positive relationship between private credit to GDP and growth but some sort of inverse “U” function: a range over which there is a positive relationship, and then a turning point and a negative part of the function.
• And the findings from several studies that the impact of increasing debt depends crucially on its specific nature; so that while an expansion of iconic textbook “private credit to fund capital investment” may be beneficial, a high level of housing finance may in some cases be harmful. A finding which I suspect actually tells us that the key issue is real estate – with empirical studies often focusing on housing finance because the availability of data makes analysis easy but with the findings also probably valid for commercial real estate.
• And with the harmful effects of excessive real estate lending arising both from the strong tendency of debt-financed real estate booms to produce serious misallocation of capital – a point which Claudio Borio and others have made in papers at the BIS – and from the pure debt overhang effect which Atif Mian and Amir Sufi have described, an overhang effect which could result from debt-financed housing booms and busts even if there were actually no new construction at all but simply a boom in the price of already existing assets.
So I believe that our best understanding of the economic impact of financial deepening in general, and in particular of rising private leverage, is now quite different than before the crisis. There can be too much private leverage, and different forms of debt perform different economic functions with different implications for growth and macro-stability. But our financial regulation agenda has not caught up with those emerging findings, focusing until now on the narrower issue of how to make the financial system itself more resilient.
Thus for instance, if you look at the guidelines for the application of the Basel III countercyclical capital buffer, it says we should apply that buffer if credit growth is progressing faster than its past historic trend. But the implication is that if credit growth was proceeding at 10% per annum and had always been proceeding at 10% per annum, continued future growth of 10% per annum would be perfectly OK even if nominal GDP was growing at 5% per annum. But, if debt grows continually faster than nominal GDP, that will inevitably produce a relentless rise in leverage which will eventually produce a crisis, in turn leaving us in today’s predicament with a severe debt overhang problem.
Our biggest macroeconomic problem today is how to escape the debt overhang trap in which we are already stuck. And I have made elsewhere some radical proposals on what we should do about that problem – including breaking the taboo against permanent money finance. But I will focus today on what we should do in future to ensure we do not create too much debt in the first place. I will argue that we must put in place an approach

ECB Forum on Central Banking, June 2016 252
to macroprudential regulation – combined if possible with the sort of tax changes which Barry Eichengreen referred to – which quite explicitly seeks to limit the total amount of leverage within the economy.
That would imply imposing much higher bank capital requirements than those introduced so far. Charles Goodhart earlier quoted Mark Carney expressing confidence that higher bank capital requirements have not so far produced a reduced credit supply to the real economy, with the implication that this is a good result. So let me be absolutely clear: by contrast I think our overt aim should be a less leveraged real economy.
But I also suggest that we should quite explicitly seek to produce a different allocation of credit between broad economic sectors than that which free market banking systems, focusing on private profit maximisation, will quite rationally choose. And that implies in turn that the fundamental philosophy of the Basel II and Basel III internal ratings approach to setting risk capital weights is based on a profound intellectual mistake.
That approach assumes that risk is best managed by requiring banks themselves to assess the probability of default, the loss given default and therefore the risk of loss which they privately face. But there is, I believe, a massive externality problem here, a profound disconnect between what seems to be and what indeed is rational for the private banks themselves, and what is optimal for the whole economy.
As Stijn references, there is an emerging body of evidence that too much housing finance is harmful; and I suspect that the more general point is that too much real estate finance can be harmful. And there are many studies, for instance by Claudio Borio, which have pointed out that real estate credit and asset price cycles are not just part of the story of financial and macro-stability in the modern economy, but again and again pretty much all of the story.
But seen from the private perspective, real estate lending – a secured claim against an asset which has multiple alternative users – does not just seem the lowest risk thing to do but is often actually post facto the lowest risk thing to have done, even if that lending has produced macroeconomic instability.
In the United Kingdom, through this latest cycle, losses on UK bank loans for residential mortgages have been incredibly low. And almost no one has lost money from investing in a UK retail mortgage-backed security. But the boom and then bust in real estate credit and property prices still played a major role in driving the United Kingdom into recession.
Our central problem is indeed that real estate lending, in particular residential but sometimes also commercial, can be low risk for the banks and even for the banking system in aggregate even while being severely harmful for the macroeconomy as a result of the debt overhang and balance sheet recession effects which Richard Koo described for corporate Japan and which Mian and Sufi described for American households.
In Mian and Sufi’s model, and in Richard Koo’s, the macroeconomic harm of a debt overhang derives as much from the borrowers who do pay back their debts but who in order to do so cut investment and consumption, as from those borrowers who actually default and thus impose losses on the banking system. And it is indeed theoretically possible to describe a model in which excessive debt extended against existing real estate
ECB Forum on Central Banking, June 2016 253
could produce severe economic harm without producing a single loss on any bank loan or a single loss on any traded credit security.
The solvency of individual banks, and even the resilience of the total financial system, is therefore in itself an insufficient objective for macroprudential policy. And socially optimal risk capital weights will never be chosen by banks focused – even if quite rationally – on the risks that they privately face.
What might this imply for specific policy? It says that we should not leave the setting of risk weights for real estate lending to private assessments of risk. Instead, for instance, we should set a minimum capital weight for residential mortgages of, say, 50%, with modelling used to determine whether higher risk weights are required for more risky than average loans. And, again for instance, we should impose a minimum capital weight for commercial real estate lending of 100% or higher, thus increasing risk weights for real estate lending significantly compared with those which apply to the textbook form of bank lending, i.e. lending for capital investments in the real economy.
These figures are of course only illustrative; and apart from risk weights there are also other important regulatory levers which Charles Goodhart described, such as the treatment of mortgages under the net stable funding ratio. And there is a good case for imposing constraints on borrowers as well as lenders through, for instance, loan-to-value limits of the sort which Hyun Song Shin has mentioned.
But my specific examples are intended to illustrate an important philosophical shift: we need to focus not just on how to make individual banks, or even the whole financial system, more resilient; we need to focus also on how much debt the financial system produces and what type of debt.