the future of remote sensing from space: civilian
TRANSCRIPT

The Future of Remote Sensing From Space:Civilian Satellite Systems and Applications
July 1993
OTA-ISC-558NTIS order #PB93-231322
GPO stock #052-003-01333-9

Recommended Citation:
U.S. Congress, Office of Technology Assessment, The Future of RemoteSensing From Space: Civilian Satellite Systems and Applications,OTA-ISC-558 (Washington, DC: U.S. Government Printing Office, July1993).
Foreword
o ver the past decade, the United States and other countries have increasinglyturned to satellite remote sensing to gather data about the state of Earth’satmosphere, land, and oceans. Satellite systems provide the vantage point andcoverage necessary to study our planet as an integrated, interactive physical and
biological system. In particular, the data they provide, combined with data from surfaceand aircraft-based instruments, should help scientists monitor, understand, andultimately predict the long term effects of global change.
This report, the first of three in a broad OTA assessment of Earth observationsystems, examines issues related to the development and operation of publicly fundedU.S. and foreign civilian remote sensing systems. It also explores the military andintelligence use of data gathered by civilian satellites. In addition, the report examinesthe outlook for privately funded and operated remote sensing systems.
Despite the established utility of remote sensing technology in a wide variety ofapplications, the state of the U.S. economy and the burden of an increasing Federaldeficit will force NASA, NOAA, and DoD to seek ways to reduce the costs of remotesensing systems. This report observes that maximizing the return on the U.S. investmentin satellite remote sensing will require the Federal Government to develop a flexible,long-term interagency plan that would guarantee the routine collection of high-qualitymeasurements of the atmosphere, oceans, and land over decades. Such a plan wouldassign the part each agency plays in gathering data on global change, includingscientifically critical observations from aircraft- and ground-based platforms, as well asfrom space-based platforms. It would also develop appropriate mechanisms forarchiving, integrating, and distributing data form many different sources for research andother purposes. Finally, it would assign to the private sector increasing responsibility forcollecting and archiving remotely sensed data.
In undertaking this effort, OTA sought the contributions of a wide spectrum ofknowledgeable individuals and organizations. Some provided information; othersreviewed drafts. OTA gratefully acknowledges their contributions of time andintellectual effort. OTA also appreciates the help and cooperation of officials withNASA, NOAA, DOE, and DoD. As with all OTA reports, the content of this report isthe sole responsibility of the Office of Technology Assessment and does not necessarilyrepresent the views of our advisors or reviewers.
Roger C. Herdman, Director
iii

Advisory PanelRodney NicholsChairChief Executive OfficerNew York Academy of Sciences
James G. AndersonProfessorDepartment of Chemistry and Earth
and Planetary SciencesHarvard University
D. James Baker1
DirectorJoint Oceanographic Institutions, Inc.
William BrownPresidentERIM Corp.
Ronald BrunnerProfessorCenter for Public Policy ResearchUniversity of Colorado
Joanne GabrynowiczAssociate ProfessorDepartment of Space StudiesUniversity of North Dakota
Alexander F.H. GoetzDirectorCenter for the Study of Earth from
SpaceUniversity of Colorado
David GoodenoughChief Research ScientistPacific Forestry CenterCanada
Donald LathamCorporate DirectorLoral Corp.
Cecil E. LeithPhysicistLawrence Livermore National
Laboratory
John H. McElroyDean of EngineeringThe University of Texas atArlington
Molly MacauleyFellowResources for the Future
Earl MerrittVice President, ResearchEarthsat Corp.
I Until May 1993,
Alan MillerDirectorThe Center for Global ChangeUniversity of Maryland
Raymond E. MillerProfessorDepartment of Computer ScienceUniversity of Maryland
Kenneth PedersenResearch Professor of International
AffairsSchool of Foreign ServiceGeorgetown University
David T. SandwellGeological Resources DivisionScripps Institute of Oceanography
Dorm WalkletPresidentTerraNOVA International
Albert WheelonConsultant
NOTE: OTA appreciates and is grateful for the valuable assistance and thoughtful critiques provided by the advisory panel members. The Paneldoes not, however, necessarily approve, disapprove, or endorse this report. OTA assumes full responsibility for the report and the accuracyof its contents.
iv

Peter Blair Ray A. WilliamsonAssistant Director, OTA Energy, Project DirectorMaterials, and InternationalSecurity Division Arthur Charo
Alan Shaw Brian McCue
Preject StaffCONTRACTORS
Paul Bowersox
Leonard David
Ronald M. KonkelInternational Security andCommerce Program Manager Stephen Wooley
ADMINISTRATIVE STAFF
Jacqueline R. BoykinOffice Administrator
Louise StaleyAdministrative Secretary
Madeline GrossContractor

workshop Participants
THE FUTURE OF REMOTE SENSING FROM SPACE WORKSHOP, APRIL 21,1992
Ray A. WilliamsonChairOffice of Technology
Assessment
Bruce BarkstromERBE Experiment ScientistNASA—Langley Research
Center
Francis P. BrethertonDirectorSpace Science and Engineering
CenterUniversity of Wisconsin
Donald CobbDivision Group LeaderSpace Science and TechnologyLos Alamos National Laboratory
Lee DemitryProgram ManagerAdvanced Research Project
Agency
Jeffrey DozierProfessorCenter for Remote Sensing and
Advanced OpticsUniversity of California at Santa
Barbara
Diane EvansManager for Earth Sciences
ProgramsJet Propulsion Laboratory
James HansenDirectorNASA-Goddard Institute for
Space Studies
John S. LangfordPresidentAurora Flight Sciences Corp.
Keith LyonSeaStar Program ManagerOrbital Sciences Corp.
Earl MerrittVice President, ResearchEarthsat Corp.
Ari PatrinosDirector, Environmental
Sciences DivisionU.S. Department of Energy
John C. PetheramManager, Space Systems programsGE Astro-Space Division
Stanley R. SchneiderLandsat Program ManagerNASA Headquarters
Carl SchuelerManagerAdvanced Development ProgramsHughes Santa Barbara Research
Center
John Vitko, Jr.Manager Global Climate ChangeSandia National Laboratories
Matthew R. WillardConsultant
vi

POTENTIAL MILITARY USES OF CIVILIAN SATELLITES WORKSHOP, JULY 8,1992
Ray A. WilliamsonChairOffice of Technology
Assessment
James R. BlackwellDirectorInternational Security DivisionMeridian Corp.
Kenneth DaughertyChief ScientistDefense Mapping Agency
William KennedyHughes STX
Michael KreponPresidentHenry L. Stirnson Center
Donald LathamCorporate DirectorLoral Corp.
John G. ThunenManager, Special ProjectsHughes-Santa Barbara Research
Center
Peter ZimmermanSenior FellowCenter for Strategic and
International Studies
John HudsonSystems OfficerDefense Intelligence Agency
vii

AcknowledgmentsThis report has benefited from the advice of many individuals. In addition to members of the Advisory Panel andthe workshop, OTA especially would like to thank the following individuals for their assistance and support. Theviews expressed in this paper, however, are the sole responsibility of the Office of Technology Assessment.
Stephen W. AltesAurora Flight Sciences Corp.
Donald ArtisU.S. Army TopographicEngineering Center
Arthur Boot hNational Oceanic and Atmospheric
Administration
Andrew BoyeSandia National Laboratories
Dino BrugioniFredericksburg, VA
Dixon ButlerNational Aeronautics and Space
Administration
Barbara CherryNational Aeronautics and Space
Administration
Thomas CreminsNational Aeronautics and Space
Administration
William CrockerU.S. General Accounting Office
Brian D. DaileyLockheed Missiles & Space Co.,
Inc.
. . .VIII
John DuttonPennsylvania State University
H. Frank EdenMartin Marietta Astro Space
Richard EisermanU.S. General Accounting Office
Charles ElachiJet Propulsion Laboratory
Bernard P. EleroMartin Marietta Astro Space
Douglas B. GerullWorldView Imaging Corp.
Louis GombergHughes Space and Communications
Group
Ken HadeenNOAA National Climatic Data
Center
Michael HallNational Oceanic and Atmospheric
Administration
Stephen HarperEOSAT Corp.
Fred HendersonGeosat Committee Inc.
W. John HusseyNational Oceanic and Atmospheric
Administration
Bhupendra JasaniKing’s College
Ma]. Frank Kelly, USAFDepartment of Defense
Mary Dee KerwinNational Aeronautics and Space
Administration
Jack KoeppenNational Oceanic and Atmospheric
Administration
Russell KofflerFort Washington, MD
John S. LangfordAurora Flight Sciences Corp.
Donald LightU.S. Geological Survey
Keith Lyonorbital Sciences Corp.
John MacDonaldMacDonald Dettwiler
Jeffrey MarqueseInstitute for Defense Analyses
Thomas MeyerLos Alamos National Laboratory
Aram MikaHughes Santa Barbara Research
Center
David MooreCongressional Budget Office
Stanley MorainTechnology Application CenterUniversity of New Mexico
Richard MroczynskiEOSAT Corp.
Firouz Michael NaderiJet Propulsion Laboratory
Douglas NamianNational Oceanic and Atmospheric
Administration
Pat NashNational Aeronautics and Space
Administration
Ted G. NanzSPOT Image Corp.
Clark NelsonSPOT Image Corp.
Scott PaceThe Rand Corp.
Carl ReberNASA Goddard Space Flight
Center
Sally RideCalifornia Space InstituteUniversity of California,
San Diego
Thomas SeverJohn C. Stennis Space Center
Lisa ShafferNational Aeronautics and Space
Administration
Kathyrn SullivanNational Oceanic and Atmospheric
Administration
Shelby TilfordNational Aeronautics and Space
Administration
Milton C. TrichelERIM
Paul F. UhlirNational Academy of Sciences
Pat VietsNational Oceanic and Atmospheric
Administration
Wulf Von KriesMST Aerospace GMbH
Allen H. WatkinsU.S. Geological Survey
Daniel WoodsNational Aeronautics and Space
Administration
Makoto Yokota
ix

Plate Descriptions
PLATE 1. Eye of Hurricane Andrew Approaching the Louisiana Coast
This image of Hurricane Andrew was taken Aug. 26, 1992, just as the eye of the storm was moving ashore. The NOAA GOES-7 image showsbands of intense rain and the spiral “arms” of the storm.SOURCE: NOAA NESDIS. Used with permission.
PLATE 2. Late Start of the 1993 Growing Season in the United States
The vegetation index, an indicator derived using data from the Advanced Very High Resolution Radiometer (AVHRR) flown on the NOAApolar-orbiting operational environmental satellites, was used to detect the beginning and progress of the 1993 growing season in the UnitedStates. The accompanying image compares values of the Normalized Difference Vegetation Index (NDVI) for mid-May in 6 consecutive years,1988-1993.
This image shows that the development of vegetation in mid-May 1993 is below the other 5 years. In the southeastern United States andCalifornia the area with well-developed vegetation in 1993 (NDVI between 0.1 and 0.3, yellow and light green colors) is much smaller thanfor any other of the 5 years. Also, very few areas show well-developed vegetation (NDVI above 0.3, dark green color) in May 1993. In therest of the United States the area with low NDVI values (between 0.005 and 0.1, red and brown colors) in 1993 is much larger than in the other5 years. Interestingly, a much larger area with underdeveloped vegetation (NDVI below 0.05, gray color) is observed this year compared with1988-1992.
Similar images from April show that late development of vegetation in 1993 has been observed since the beginning of the usual growingseason. The current vegetation state is approximately 3 to 5 weeks behind the 1988-92 average for the entire United States. The exceptionsare southern Florida, California, and Texas, where end-of-April vegetation development was normal or ahead of normal. By mid-May nearly35 percent of the U.S. area was more than 4 weeks behind.SOURCE: NOAA/NESDIS, Satellite Research Laboratory. Used with permission.
PLATE 3. Vegetation Index
NOAA satellites monitor the greenness in vegetation. This Vegetation Index image shows abundant (dark green) vegetation across the Amazonof South America, while lack of vegetation (black areas) is seen across the Sahara Desert in northern Africa.SOURCE: NOAA/NESDIS. Used with permission.
PLATE 4. Landsat Image of the Olympic Peninsula, Washington
The Earth Observation Satellite Co. (EOSAT) generated this image from data acquired on July 21, 1988, from the LandSat 5 satellite (ThematicMapper bands 4,5,1 (RGB)). The permanent snowcap appears lavender; dark red distinguishes old forest growth from new (light red and cyan).Seattle’s metropolitan area appears east of Puget Sound.SOURCE: Photograph courtesy of EOSAT. Used with permission.
PLATE 5. Sea-Surface Temperature
NOAA satellites provides a detailed view of sea surface temperatures for use by the shipping and fishing industry. The dark red indicates theGulf Stream while the green and blue shades indicate the cooler coastal waters.SOURCE: NOAA/NESDIS. Used with permission.
PLATE 6. Tidal Effects in Morecambe BayThis multitemporal image from the ERS-1 satellite’s synthetic aperture radar shows Morecambe Bay (just north of Blackpool, UK).Highlighted in magenta are the vast expanses of sandbanks and mud flats within the Bay that are covered by the sea at high tide (Aug. 7, 1992)and exposed at low tide (Aug. 1 and 13). The patterns within these areas reflect the various rises, dips and drainage channels that cross the sandand mud at low tide. The tidal effect can be observed to extend several kilometers inland up the numerous river courses.SOURCE: European Space Agency. Used with permission.

PLATE 7. Deforestation in Brazil
This false-color, ERS-1 synthetic aperture radar image shows the Teles Pires river in Brazil (Mato Grosso State) and tropical rain forests thathave been partially cut down. A regular pattern of deforestation is clearly visible, with some rectangular patches of destroyed forest extendingover areas as large as 20 square kilometers. Since tropical forests are often obscured by clouds, the radar on ERS- 1 is well-suited to imagingareas near the equator.SOURCE: European Space Agency. Used with permission.
PLATE 8. Changes in the Central Pacific Ocean
This series of three panels shows monthly sea level changes in the central Pacific Ocean as observed by the TOPEX/Poseidon satellite fromNovember 1992 to January 1993. The area shown in red is the region where sea level is more than 15 centimeters (6 inches) greater than normal.In the series of panels, the eastward movement of an area of high sea level is clearly visible. Such movement represents the release of vastamounts of heat energy stored in a so-called ‘‘Warm Pool’ region of the western equatorial Pacific. When it impinges on the coast of SouthAmerica, such a current may become known as an El Nino event; past El Nino events have resulted in devastation of Peruvian fisheries,increased rainfall amounts across the southern United States and world-wide disturbances in weather patterns that have caused severe economiclosses. These images were produced from TOPEX/Poseidon altimetry data by the Ocean Monitoring and Prediction Systems Section of theU.S. Naval Research Laboratory. TOPEX/Poseidon is a joint project of NASA and the French space agency, Centre National d’Etudes Spatiales(CNES).SOURCE: Public Information Office, Jet Propulsion Laboratory, California Institute of Technology, National Aeronautics and Space Administration,Pasadena, California. Used with permission.
PLATE 9. Ozone Depletion
Data from NOAA’s Polar-Orbiting TOVS (Tiros Operational Vertical Sounder) is used to display the rapid decline in protective stratosphericozone over Antarctica during the past dozen years. The growing black spot represents the lowest total ozone values,SOURCE: NOAA, NESDIS. Used with permission.
PLATE 10. Kharg Island
By tinting the 1986 image of Kharg Island, Iran one color, and the 1987 image another, and then combining the images, analysts were ableto highlight changes on the island. Objects present in the first image but not in the second appear in blue, while objects present in the secondimage but not in the first, such as the circular antiaircraft battery on the small island to the North appear yellow.SOURCE: 1993 CNES, Provided by SPOT Image Corp., Reston, VA. Reprinted with permission.
PLATES 11 and 12, Civilian Satellites and Verification
In the first image, the Vetrino missile operating base in 1988 is shown. Overlay of the site diagram from the INF treaty shows a reasonablygood fit with observed and treaty data. Nevertheless, some differences can be identified; for example, atA the road turns in a different direction,at B some new construction has taken place by 1988, and at C, the structure is not indicated in the treaty.
The second image shows an enlarged section from an image of the Polotsk missile operating base. Overlay of the site diagram from theINF treaty is not a good fit in this case. For example, the orientation of a building at A is different in the image from that indicated in the treaty;the road at B cannot be seen in the image and the perimeter fence (C)is very different. Also, considerable difference exists between the structureat D and the road leading in or out of the facitity.SOURCE: Bhupendra Jasani, CNES/SPOT; images processed at RAE, Farnborough, UK. Reprinted with permission.
xi

contents
1 Introduction 1What is Remote Sensing from Space? 5Remote Sensing Applications 6
2 Remote Sensing and the U.S. Future in Space 11The Changing Context of Satellite Remote Sensing 11NOAA’s Environmental Earth Observations 14Defense Meteorological Satellite Program 15NASA’s Mission to Planet Earth 16NASA’s Remote Sensing Budget 18NOAA’s Remote Sensing Budget 23The Costs and Benefits of Satellite Remote Sensing 24Data Continuity, Long-Term Research, and
Resource Management 25Developing and Executing a Strategic Plan for
Space-Based Remote Sensing 26
3 Weather and Climate Observations 33NOAA’s Operational Environmental Satellite Programs 34Defense Meteorological Satellite Program 43Non-U.S. Environmental Satellite Systems 44
4 Surface Remote Sensing 47The Landsat Program 48Non-U.S. Land Remote Sensing Systems 52Ocean Sensing and the Ice Caps 54Major Existing or Planned Ocean and Ice
Remote Sensing Satellites 57
5 Global Change Research 63The U.S. Global Change Research Program 63NASA’s Mission to Planet Earth 65Structuring a Robust, Responsive, Global Change
Research Program 72
6 Military Uses of Civilian Remotely Sensed Data 81
7 The Role of the Private Sector 85

8 International Cooperation and Competition 89Increased International Cooperation in Earth Monitoring
and Global Change Research 89International Cooperation and Surface Remote Sensing 91Maintaining a U.S. Competitive Position in Remote Sensing 92
APPENDIXES
A Research and the Earth Observing System 95
B The Future of Earth Remote SensingTechnologies 109
C Military Uses of Civilian Remote Sensing Data 145
D Non-U.S. Earth Observation Satellite Programs 167
E Glossary of Acronyms 189
INDEX 193
xiv

Introduction
s ince the first civilian remote sensing satellite waslaunched in 1960, the United States has come increas-ingly to rely on space-based remote sensing to serve awide variety of needs for data about the atmosphere,
land, and oceans (table l-l). Other nations have followed theU.S. lead. The vantage point of space offers a broadscale view ofEarth, with repetitive coverage unaffected by political bounda-ries. Recent advances in sensors, telecommunications, andcomputers have made possible the development and operation ofadvanced satellite systems (figure 1-1) that deliver vital informa-tion about our planet to Earth-bound users.
Many Federal agencies, including the Department of Defense(DoD), use remotely sensed data to carry out their legislativelymandated programs to protect and assist U.S. citizens and toreserve and manage U.S. resources. For making routine observa-tions of weather and climate, the National Oceanic and Atmos-pheric Administration (NOAA) operates two environmentalsatellite systems. DoD also operates a system of environmentalsatellites. 1 The scientific satellites and instruments of theNational Aeronautics and Space Administration (NASA) probeEarth’s environment for scientific research. Future NASAscientific satellites will include NASA’s Earth ObservingSystem (EOS), a series of sophisticated, low-orbit satellites togather global environmental data and assist in assessing globalenvironmental change. DoD and NASA now jointly manage theLandsat program, which provides highly useful images of theland and coastal waters.
I
1
1 This report is not concerned with any satellite system built exclusively for nationalsecurity purposes, except for the Defense Meteorological Satellite Program. Data fromDMSP are made available to civilian users through NOAA.
2 I Remote Sensing From Space
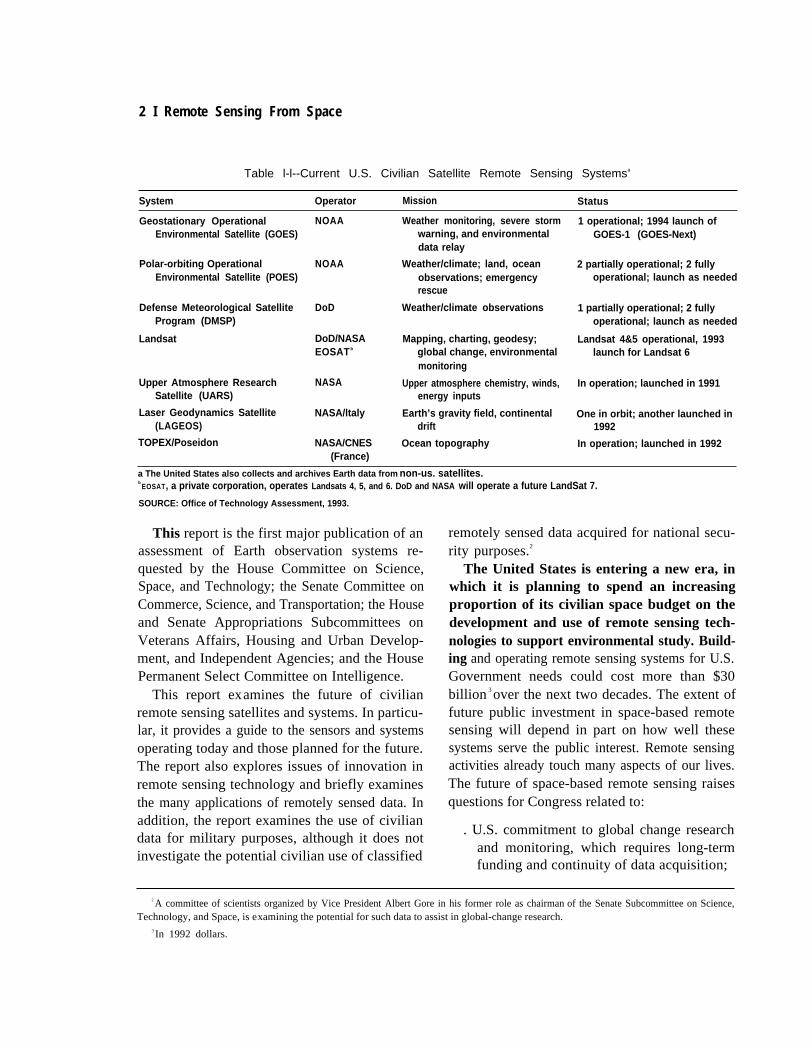
Table l-l--Current U.S. Civilian Satellite Remote Sensing Systemsa
System Operator Mission Status
Geostationary OperationalEnvironmental Satellite (GOES)
Polar-orbiting OperationalEnvironmental Satellite (POES)
Defense Meteorological SatelliteProgram (DMSP)
Landsat
Upper Atmosphere ResearchSatellite (UARS)
Laser Geodynamics Satellite(LAGEOS)
TOPEX/Poseidon
NOAA
NOAA
DoD
DoD/NASAEOSAT b
NASA
NASA/ltaly
NASA/CNES(France)
Weather monitoring, severe stormwarning, and environmentaldata relay
Weather/climate; land, oceanobservations; emergencyrescue
Weather/climate observations
Mapping, charting, geodesy;global change, environmentalmonitoring
Upper atmosphere chemistry, winds,energy inputs
Earth’s gravity field, continentaldrift
Ocean topography
1 operational; 1994 launch ofGOES-1 (GOES-Next)
2 partially operational; 2 fullyoperational; launch as needed
1 partially operational; 2 fullyoperational; launch as needed
Landsat 4&5 operational, 1993launch for Landsat 6
In operation; launched in 1991
One in orbit; another launched in1992
In operation; launched in 1992
a The United States also collects and archives Earth data from non-us. satellites.b EOSAT, a private corporation, operates Landsats 4, 5, and 6. DoD and NASA will operate a future LandSat 7.
SOURCE: Office of Technology Assessment, 1993.
This report is the first major publication of anassessment of Earth observation systems re-quested by the House Committee on Science,Space, and Technology; the Senate Committee onCommerce, Science, and Transportation; the Houseand Senate Appropriations Subcommittees onVeterans Affairs, Housing and Urban Develop-ment, and Independent Agencies; and the HousePermanent Select Committee on Intelligence.
This report examines the future of civilianremote sensing satellites and systems. In particu-lar, it provides a guide to the sensors and systemsoperating today and those planned for the future.The report also explores issues of innovation inremote sensing technology and briefly examinesthe many applications of remotely sensed data. Inaddition, the report examines the use of civiliandata for military purposes, although it does notinvestigate the potential civilian use of classified
remotely sensed data acquired for national secu-rity purposes.2
The United States is entering a new era, inwhich it is planning to spend an increasingproportion of its civilian space budget on thedevelopment and use of remote sensing tech-nologies to support environmental study. Build-ing and operating remote sensing systems for U.S.Government needs could cost more than $30billion 3 over the next two decades. The extent offuture public investment in space-based remotesensing will depend in part on how well thesesystems serve the public interest. Remote sensingactivities already touch many aspects of our lives.The future of space-based remote sensing raisesquestions for Congress related to:
. U.S. commitment to global change researchand monitoring, which requires long-termfunding and continuity of data acquisition;
2 A committee of scientists organized by Vice President Albert Gore in his former role as chairman of the Senate Subcommittee on Science,Technology, and Space, is examining the potential for such data to assist in global-change research.
3 In 1992 dollars.

Chapter I—Introduction l3
GOES-W(USA)1 12“W
Figure l-l—Existing Earth Monitoring Satellites
Geosynchronous weather satellites
METEOR (RUSSIA)
\
that are in either geosynchronous or polar/near-polar orbits.SOURCE: Office of Technology Assessment, 1993.
. the role of U.S. industry as partners insupplying sensors, satellites, ground sys-tems, and advanced data products;
. America’s competitive position in advancedtechnology; and
● U.S. interest in using international coopera-tive mechanisms to further U.S. economic,foreign policy, and scientific goals.
These items of public policy intersect withquestions concerning the overall structure andfocus of the U.S. space program, and the scale ofpublic spending on space activities. Thus, Con-gress will have to decide:
●
●
●
●
The total spending for space, as well as theallocations for major programs such as Earthscience from space, space science, spaceshuttle, and the space station;The role of remote sensing in the spaceprogram;The role of satellite remote sensing in U.S.global change research; andCongress’ role in assisting U.S. industry tomaintain U.S. competitiveness in satelliteremote sensing and related industries.
Existing and planned satellite systems raiseissues of utility, cost effectiveness, and technol-ogy readiness. The United States pioneered the

4 I Remote Sensing From Space
Box l-A-Report Appendixes
Appendix A: Global Change Research From Satellites outlines the U.S. Global Change Research Programand examines the use of space-based remote sensing for assessing the long-term effects of global change. Inparticular, it examines the roles played by NASA’s Earth Observing System, NOM’s envirormental satellites, andforeign systems.
This report examines the issues raised by the development of new remote sensing technologies in AppendixB: The Future of Remote Sensing Technologies. In particular, the appendix summarizes the state-of-the-art intechnology development and explores the issues raised by innovation in sensor and spacecraft design. it alsosummarizes the characteristics of planned instruments that were deferred during the 1991 and 1992 restructuringof EOS.
The Gulf War provided a clear lesson in the utility of data from civilian systems for certain military uses. Morethe war, no accurate, high quality maps of Kuwait and the Gulf area existed. Hence, U.S. military planners hadto depend in part on maps generated from remotely sensed images acquired from Landsat and the French SPOTsatellite for planning and executing allied maneuvers. Appendix C: Military Uses of Civilian Sensing Satellitesexplores the technical and policy issues regarding the military use of data from civilian systems.
Appendix D): Infernational Remote Sensing Efforts summarizes non-U.S. satellite systems and some of theinternational cooperative programs.SOURCE: Office of Technology Assessment, 1993.
use of space-based remote sensing in the 1960s By the early 21st century, U.S. and foreignand 1970s; today the governments of severalother countries and the European Space Agency(ESA) also operate highly sophisticated environ-mental remote sensing systems for a variety ofapplications (figure l-l). For the future, othernations are planning additional remote sensingsatellites that will both complement, and competewith, U.S. systems. These circumstances presenta formidable challenge to the United States.
Satellite remote sensing is a major source ofdata for global change research as well as weatherforecasting and other applications. Data fromthese systems must be integrated with a widevariety of data gathered by sensors on aircraft,land, and ocean-based facilities to generate usefulinformation. This report explores how satelliteremote sensing fits in with these other systems. Italso addresses U.S. policy toward the remotesensing industry. Detailed discussion of many ofthis report’s findings may be found in theappendixes (box l-A).
remote sensing systems will generate prodigiousamounts of data in a variety of formats. Usingthese data will require adequate storage and theability to manage, organize, sort, distribute, andmanipulate data at unprecedented speeds. NASA,NOAA, and DoD are responsible for developingand operating the data gathering systems, yetother government agencies and many privatesector entities will also use the data for a varietyof ongoing research and applications programs. Afuture report in this assessment, expected forrelease in late 1993, will examine issues con-nected with data analysis, organization, anddistribution.
The distribution and sales of data form Landsatand other land remote sensing systems raiseissues of public versus private goods, appropriateprice of data, and relations with foreign datacustomers. These issues are discussed in a back-ground paper, Remotely Sensed Data From Space:

Chapter I–Introduction l5
Thermalinfrared
ShortwaveInfrared
Near 10 pmInfrared
2-3 pm AVlslble
0.8-1 pm \
?
b.45- 0.8 pm
A~by
~
\, h ‘\h ~ “\ l! \ \ ‘\
\ \ \ Cloud
Sensors View Earth
Radar microwave
SOURCE: Japan Resources Observation System Organization, JERS-I Program Description; Office of Technology Assessment, 1993.
Distribution, Pricing, and Applications, which a distance. The term was coined in the early 1960swas released by OTA in July 1992.4 when data delivered by airborne sensors other
than photographic cameras began to find broadWHAT IS REMOTE SENSING application in the scientific and resource manage-FROM SPACE? ment communities. Remote sensing instruments
Remote sensing is the process of observing, measure electromagnetic radiation emitted ormeasuring, and recording objects or events from reflected by an object (figure 1-2) and either
4U.S. Congress, Office of Technology Assessment, Remotely Sensed Data from Space: Distribution, Pricing, and Applications(Washington, DC: Office of Technology Assessment, International Security and Commerce Program July 1992).
6 I Remote Sensing From Space
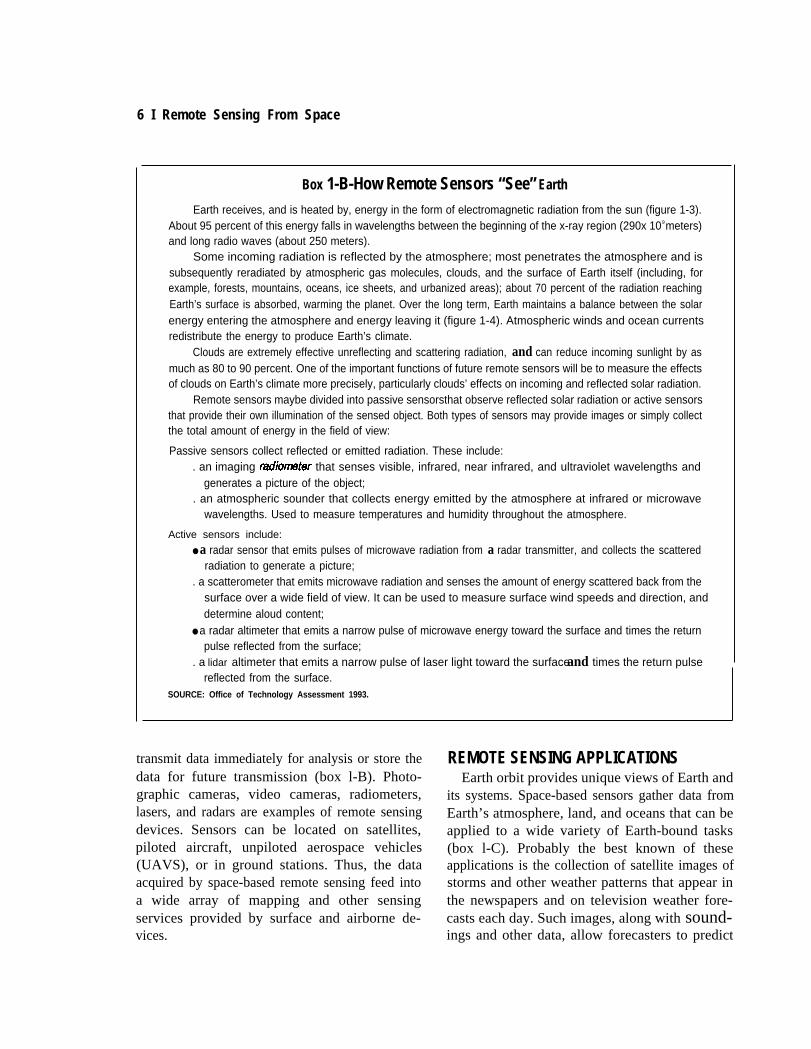
Box 1-B-How Remote Sensors “See” Earth
Earth receives, and is heated by, energy in the form of electromagnetic radiation from the sun (figure 1-3).About 95 percent of this energy falls in wavelengths between the beginning of the x-ray region (290x 109 meters)and long radio waves (about 250 meters).
Some incoming radiation is reflected by the atmosphere; most penetrates the atmosphere and issubsequently reradiated by atmospheric gas molecules, clouds, and the surface of Earth itself (including, forexample, forests, mountains, oceans, ice sheets, and urbanized areas); about 70 percent of the radiation reachingEarth’s surface is absorbed, warming the planet. Over the long term, Earth maintains a balance between the solarenergy entering the atmosphere and energy leaving it (figure 1-4). Atmospheric winds and ocean currentsredistribute the energy to produce Earth’s climate.
Clouds are extremely effective unreflecting and scattering radiation, and can reduce incoming sunlight by asmuch as 80 to 90 percent. One of the important functions of future remote sensors will be to measure the effectsof clouds on Earth’s climate more precisely, particularly clouds’ effects on incoming and reflected solar radiation.
Remote sensors maybe divided into passive sensorsthat observe reflected solar radiation or active sensorsthat provide their own illumination of the sensed object. Both types of sensors may provide images or simply collectthe total amount of energy in the field of view:
Passive sensors collect reflected or emitted radiation. These include:. an imaging radiometer that senses visible, infrared, near infrared, and ultraviolet wavelengths and
generates a picture of the object;. an atmospheric sounder that collects energy emitted by the atmosphere at infrared or microwave
wavelengths. Used to measure temperatures and humidity throughout the atmosphere.
Active sensors include:
● a radar sensor that emits pulses of microwave radiation from a radar transmitter, and collects the scatteredradiation to generate a picture;
. a scatterometer that emits microwave radiation and senses the amount of energy scattered back from thesurface over a wide field of view. It can be used to measure surface wind speeds and direction, anddetermine aloud content;
● a radar altimeter that emits a narrow pulse of microwave energy toward the surface and times the returnpulse reflected from the surface;
. a lidar altimeter that emits a narrow pulse of laser light toward the surface and times the return pulsereflected from the surface.
SOURCE: Office of Technology Assessment 1993.
transmit data immediately for analysis or store the REMOTE SENSING APPLICATIONSdata for future transmission (box l-B). Photo- Earth orbit provides unique views of Earth andgraphic cameras, video cameras, radiometers,lasers, and radars are examples of remote sensingdevices. Sensors can be located on satellites,piloted aircraft, unpiloted aerospace vehicles(UAVS), or in ground stations. Thus, the dataacquired by space-based remote sensing feed intoa wide array of mapping and other sensingservices provided by surface and airborne de-vices.
its systems. Space-based sensors gather data fromEarth’s atmosphere, land, and oceans that can beapplied to a wide variety of Earth-bound tasks(box l-C). Probably the best known of theseapplications is the collection of satellite images ofstorms and other weather patterns that appear inthe newspapers and on television weather fore-casts each day. Such images, along with sound-ings and other data, allow forecasters to predict

Chapter I—Introduction l7
Figure l-3—incoming, Reflected, and Scattered Solar Radiation
. ....
200
0
..—.
IL Top of the atmosphere
Scattered energy
I
This figure shows the shortwave radiation spectrum for the top of the atmosphere, and as depleted by passing through theatmosphere (in the absence of clouds). Most of the energy that is reflected, absorbed or scattered by the Earth’s atmosphere isvisible or short-wave infrared energy (from.4 micron to 4 microns). In the thermal infra-red, most attenuation is by absorption. Shortwavelength radiation is reflected by clouds, water vapor, aerosols and air; scattered by air molecules smaller than radiationwavelengths; and absorbed by ozone in shorter wavelengths (<O.3 micron), and water vapor at the longer visible wavelengths(>1.0 micron).
SOURCE: Andrew M. Carleton, Satellite Remote Sensing in Climatology, CRC Press, 1991, pp. 44-45.
the paths of severe storms as they develop, and topresent dramatic, graphic evidence to the public.When large storms head toward populated areas,such as happened after Hurricane Andrew devel-oped in August 1992 (plate 1), consecutivesatellite images, combined with other meteorologi-cal data, coastal topography, and historical re-cords, provide the basis on which to predict
probable trajectories and to issue advance warn-ing about areas of danger. 5 U.S. and foreignenvironmental satellites also provide valuabledata on atmospheric temperature, humidity, andwinds on a global scale.
Government agencies with the responsibility ofmanaging large tracts of land, or of providinginformation regarding land conditions, make use
5 Thousands of people evacuated south Florida and low lying areas near New Orleans before the September 1992 Hurricane Andrew struckland.

8 I Remote Sensing From Space
Figure 1-4-Earth’s Radiation Budget
Earth’s radiation budget is the balance between incoming solar radiation and outgoing radiation. Small changes in this balance couldhave significant ramifications for Earth’s climate. Incoming solar radiation is partially reflected by the atmosphere and surface(30%).The Earth reemits absorbed energy at longer, infrared wavelengths. Some of this energy Is trapped by natural and anthropogenicatmospheric gases-the greenhouse effect.SOURCE: Japan Resources Observation System Organization, Office of Technology Assessment, 1993.
of data from the Landsat or the French SPOTseries of land remote sensing satellites (table 1-2).They also use data from the NOAA AdvancedVery High Resolution Radiometer (AVHRR) tocreate vegetation maps (plate 2)0 Commercialdata users with interests in agriculture and for-estry, land use and mapping, geological mappingand exploration, and many other industrial sectorsalso use data acquired from the land remotesensing satellite systems.6
Data gathered by recently launched foreignsynthetic aperture radar instruments on Europeanand Japanese satellites provide information con-cerning ocean currents, sea state, sea ice, andocean pollution for both governmental and com-mercial applications. U.S. satellites have madesignificant contributions to the science of radarsensing and the measurement of Earth’s preciseshape.7 The U.S./French TOPEX/Poseidon satel-lite, launched in 1992, will provide measurements
6 The city of Chicago also used LandSat and SPOT data in the aftermath of flooding in its underground tunnels in early 1992.7 I.e., Earth’s geoid.

—
Chapter I–Introduction l9
Box l-C-The Use of Satellite Remote SensingRemote sensing from space provides Scientific, industrial, civil governmental, military, and individual users
with the capacity to gather data for a variety of useful tasks:
1. simultaneously observe key elements of vast, interactive Earth systems (e.g., clouds and ocean plantgrowth);
2. monitor clouds, atmospheric temperature, rainfall, wind speed, and direction;3. monitor ocean surface temperature and ocean currents;4. track anthropogenic and natural changes to environment and climate;5. view remote or difficult terrain;6. provide synoptic views of large portions of Earth’s surface, unaffected by political boundaries;7. allow repetitive coverage over comparable viewing conditions;8. determine Earth’s gravity and magnetic fields;9. identify unique geologic features;
10. perform terrain analysis and measure moisture levels in soil and plants;11. provide signals suitable for digital or optical storage and subsequent computer manipulation into
imagery; and12. give potential for selecting combinations of spectral bands for identifying and analyzing surface
features.
In addition, data from space provide the following advantages:
1. Convenient hsitoric record, stored on optical or magnetic media and photographs: each data record,when properly calibrated with in situ data, establishes a baseline of critical importance in recognizing theinevitable environmental and other changes that occur.
2. Tool for inventory and assessment: satellite images can be used whenever a major natural ortechnological disaster strikes and massive breakdowns of communication, transportation, public safety,and health facilities prevent the use of normal means of inventory and assessment.
3. Predictive tool:property interpreted data used with models can be used to predict the onset of naturaland technological disasters.
4. P/arming and management ted: data can be used for a variety of planning and managementpurposes.
SOURCE: Office of Technology Assessment, 1993.
of global ocean topography and ocean circulation When properly archived and made available to(plate 8). the research community, these data can result in
All of the preceding satellite types also gener- information useful for modeling the effects ofate data vital to understanding global change. climate and environmental change.

10 I Remote Sensing From Space
Table 1-2--Summary of Land Remote Sensing Applications
Agriculture Environmental managementCrop inventory Water quality assessment and planningIrrigated crop inventory Environmental and pollution analysisNoxious weeds assessment Coastal zone managementCrop yield prediction Surface mine inventory and monitoringGrove surveys Wetlands mappingAssessment of flood damage Lake water qualityDisease/drought monitoring Shoreline delineation
Forestry and rangelandOil and gas lease sales
Productivity assessmentResouroe inventoryDredge and fill permits
Identification of crops, timber and rangeForest habitat assessment
Marsh salinization
Wildlife range assessment Water resourcesFire potential/damage assessment Planning and management
Surface water inventoryDefense Flood control and darnage assessment
Mapping, charting, and GeodesyTerrain analysis
Snow/ice cover monitoring
Limited reconnaissanceIrrigation demand estimatesMonitor runoff and pollution
Land cover analysis Water circulation, turbidity, and sediment
Land resource management Lake eutrophication survey
Land cover inventory Soil salinity
Comprehensive planning Ground water location
Corridor analysisFacility siting
Geological mapping
Flood plain delineationLineament mapping
Lake shore managementMapping/identification of rock typesMineral surveys
Fish and wildlife Siting/surveying for public/private facilities
Wildlife habitat inventory Radioactive waste storage
Wetlands location, monitoring, and analysisVegetation classification
Land use and planning
Precipitation/snow pack monitoringGrowth trends and analysisLand use planning
Salt exposure CartographyLand capacity assessmentSolid waste management
SOURCE: Office of Technology Assessment, 1993.

RemoteSensingand the
U.S. Futurein Space 2.
C ivilian satellite remote sensing has demonstrated itsutility to a variety of users. Its future will depend on howwell the systems meet the needs of data users for:
. monitoring the global environment;
. long-term global change research and assessment;
. monitoring and managing renewable and nonrenewableresources;
● mapping, charting, and geodesy; and. national security purposes.
The future of satellite remote sensing will also be closely tiedto the overall direction and strategy of the U.S. civilian andmilitary space programs, which are changing in response tobroadening U.S. political and economic agendas. The NationalOceanic and Atmospheric Administration (NOAA), NationalAeronautics and Space Administration (NASA), Department ofDefense (DoD), and the Departments of Interior (DOI), Agri-culture (DOA), and Energy (DOE), maintain substantial exper-tise in remote sensing. The diversity of remote sensingapplications in government and the private sector, and thepotential conflict between public and private goods greatlycomplicate the task of establishing a coherent focus forspace-based remote sensing programs.
THE CHANGING CONTEXT OF SATELLITEREMOTE SENSING
For the past several years, representatives from government,industry, and academia have engaged in a vigorous debate over
11
12 I Remote Sensing From Space
the future of America’s civilian space program. l
This debate, spurred in part by the end of the ColdWar and other dramatic changes in the world’spolitical, economic, and environmental fabric,has reaffirmed the fundamental tenets of U.S.civilian space policy, first articulated in theNational Aeronautics and Space Act of 1958.Participants in this debate have generally agreedthat publicly supported U.S. space activitiesshould:
●
●
●
●
●
demonstrate international leadership in spacescience, technology, and engineering;contribute to economic growth;enhance national security;support the pursuit of knowledge; andpromote international cooperation in sci-ence.2
Policymakers further agree that U.S. space activi-ties should:
. include consideration of commercial con-tent; 3 and
. support research on environmental concerns,including the U.S. Global Change ResearchProgram.4
In addition, policymakers have generally sup-ported the four major program elements of U.S.civilian space efforts-space science, environ-mental observations conducted from space, main-taining a piloted space transportation program,and developing a permanent human presence inspace. However, policymakers continue to de-bate, primarily through the budget and appropria-tions processes, how much to invest in space
activities relative to other federally funded activi-ties, and what weight to give each element of theU.S. space program.5 The yearly distribution ofpriorities within the overall civilian space budgetwill have a marked effect on how much benefitthe United States will derive from remote sensingactivities.
For most of the first three decades of the U.S.space program, weather monitoring and militaryreconnaissance have exerted the primary influ-ences on remote sensing planning and applica-tions. More recently, worldwide concern over thedegradation of local environments and the in-creasing threat of harmful global change fromanthropogenic causes have begun to influence thedirection of the U.S. space program. Scientistsdisagree over the magnitude of potential globalchange, its possible consequences, and how tomitigate them. Yet they do agree that futureenvironmental changes could affect the globalquality of life and threaten social structure andeconomic viability. Because adaptation to, andremediation of, environmental change could beexpensive, predicting the extent and dynamics ofchange is potentially very important. Scientistsface two major impediments in attempting tounderstand whether harmful global change isoccurring and, if so, how to mitigate its effects:large uncertainties in existing climate and envi-ronmental models, and large gaps in the data thatsupport these predictive models. Hence, theUnited States has decided to increase the fundingallocated to characterizing and understanding theprocesses of global environmental change.
1 See, for example: Vice President’s Space Policy Advisory Board, A Post Cold War Assessment of U.S. Space Policy (Washi.ngtom DC:The Wbite House, December 1990); Advisory Committee on the Future of the U.S. Space Program, Report of the Advisory Com”ttee on theFuture of the U.S. Space Program @%shingtom DC: U.S. Government Printing OffIce, December 1990).
2 The National Aeronautics and Space Act of 1958 (Public Law 85-568), Sec. 102.31986 amendment to the National Aeronautics and Space Act of 1958; A Post Cold War Assessment of U.S. Space Policy, op. cit.; Repon
of the Advisory Committee on the Future of the U.S. Space Program, op. cit.
4 A post cold warAsses~nt Of U.S. Space Policy; op. cit.; Report of the Advisory Cow”tree on the Future of the U.S. Space program,
op. cit.5 Note, for example, that funding for space station Freedom has survived three major attempts within Congress to te rminate it. Opponents
of the space station have vowed to continue their efforts to terminate the space station program in the 103d Congress.

Chapter 2—Remote Sensing and the U.S. Future in Space I 13
0
Figure 2-1—1992 and 1993 U.S. Global Change Research Program Budgets, by Agency
Department of Agriculture.
SOURCE: U.S. Global Change Research Program.
Several Federal agencies are involved in gath-ering global change data and/or analyzing them toprovide environmental information. The U.S.Global Change Research Program (USGCRP)was organized to coordinate the Federal globalchange research effort and give it focus anddirection. The interagency Committee on Earthand Environmental Science (CEES) oversees thedevelopment and implementation of USGCRP.6
CEES was established to advise and assist theFederal Coordinating Council for Science, Engi-neering Sciences, and Technology (FCCSET)within the White House Office of Science andTechnology Policy. For fiscal year 1993, Con-gress appropriated $1.327 billion among Federalagencies for global change research (figure 2-1).7NASA’s spending on global change researchequals about 69 percent of this total. Thus, inbudget terms, NASA has become the de factolead agency for global change research. In largepart this follows from the fact that space systemsare inherently costly to build, launch, and operate.
Because space-based remote sensing offers abroad scale, synoptic view and the potential tocreate consecutive, consistent, well-calibrateddata sets, it provides a powerful means ofgathering data essential to understanding globalenvironmental change. Space-based remote sens-ing also contributes substantially to generalprogress in the Earth sciences necessary to modelenvironmental processes and interpret observedenvironmental changes. However, sensors basedon satellite platforms have significant limitationsof spatial resolution, flexibility, and timeliness.For many important global change researchquestions, sensors mounted on airborne platformsand surface facilities provide data much moreeffectively or efficiently (see app. B). Thus, thespace component is only one aspect of theseactivities, and must be planned in conjunctionwith the other components as an integrated datacollection system.
6 Through its Subcommittee on Global Change Research.7 The President’s Budget called for devoting $1.372 billion to global change research programs. The appropriated level for fiscal year 1992
W&i $1.11 billion.

14 I Remote Sensing From Space
NOAA’S ENVIRONMENTALEARTH OBSERVATIONS
NOAA’s operational meteorological satellitesystems, managed by the National EnvironmentalSatellite, Data and Information Service(NESDIS), consist of the Geostationary Opera-tional Environmental Satellites (GOES—figure2-2) and the Polar-orbiting operational Environ-mental Satellite (POES), also referred to as theTelevision InfaredObserving Satellites (or TIROS—see figure 2-3). GOES satellites, which orbit atgeostationary altitudes,8 provide both visible-light and infrared images of cloud patterns, aswell as “soundings,” or indirect measurements,of the temperature and humidity throughout theatmosphere. NOAA has been operating GOESsatellites since 1974. Data from these spacecraftprovide input for the forecasting responsibilitiesof the National Weather Service, which is alsopart of NOAA. Among other applications, theGOES data provide advance warning of emergingsevere weather, as well as storm monitoring.
The POES satellites, which circle Earth in lowpolar orbits,9 provide continuous, global coverageof the state of the atmosphere, including elementsof the weather such as atmospheric temperature,humidity, cloud cover, and ozone concentration;surface data such as sea ice and sea surfacetemperature, and snow and ice coverage; andEarth’s energy budget. The National WeatherService also uses these satellite data to create itsdaily weather forecasts.
Data from both satellite systems also contrib-ute to the long-term record of weather andclimate, maintained by NOAA in its archives.10
The data that NOAA has already collected and
Figure 2-2—The Geostationary OperationalEnvironmental Satellite
1
S band biconeomni antenna
S band high
V A S \ e-sunshal er
r
— Radialthruster
X-ray_sensor
‘- Earthsensors
HEPA
archived constitute an important resource for thestudy of global change. NOAA and NASA havebegun to assemble data sets from these archivesfor use in global change research projects. How-ever, the data are also limited because the satelliteinstruments are not calibrated to the level requiredfor detecting subtle changes in global climate, orminute environmental responses to climatechange. If future sensors aboard NOAA’s satel-lites were to incorporate better calibration tech-niques, they could make more substantial contri-butions to global change research. If Congressbelieves it is important to improve the utility ofdata gathered from the NOAA sensors for
8 Oeostationary orbit is a special case of the geosynchronous orbi~ in which satellites orbit at the same rate as any point on Earth’s equator.A geostationary satellite appears to maintain the same position above the equator throughout a 24-hour cycle, and is therefore able to monitorweather conditions within its field of view on a continuous basis.
s Satellites in polar orbit circle in orbits that pass over the poles. They are therefore capable of gathering data from the entire surface as theEarth spins on its axis. The revisit period of these satellites depends on the altitude at which they orbit and the field of view of the sensinginstrument.
10 me pm NOAA WCMWS are Natiod Climatic Data Center, Asheville, NC; National Oceanographic Data Center, Washingto% DC;
and National Geophysical Data Center, Boulder, CO.

Chapter 2—Remote Sensing and the U.S. Future in Space I 15
HI
Figure 2-3-NOAA-9, One of the Polar-Orbiting Operational Satellite Series
SOURCE: Martin Marietta Astro Space.
global change research it may wish to directNOAA to plan for sensors with more sensitivecalibration. Because improved calibration wouldrequire moderate additional cost, Congresswould also need to increase NOAA’s budgetfor satellite procurement and operation.
The term ‘‘operational’ applied to NOAA’ssatellite systems refers primarily to the way inwhich they are managed. Such systems have alarge established base of users who depend on theregular, routine delivery of data in standardformats. Significant changes in data format or inthe types of data delivered can mean greatexpense for these users. Gaps or loss of continuityin the delivery of data may also have a substantialnegative economic impact. Research satellitesystems, on the other hand, generally haveshort-term (3 to 5 years) commitments fromagencies, and have a much smaller base of users.Because these users may also directly contributeto instrument design, they are more able to adjustto major changes in data format.
DEFENSE METEOROLOGICALSATELLITE PROGRAM
The Air Force Space Command operates theDefense Meteorological Satellite Program (DMSP—figure 2-4), to support DoD’s special needs forweather data. DMSP employs a satellite platformvery similar to the NOAA POES system, andoperates in near-polar orbit, but carries somewhatdifferent instruments.
Critics of the policy of maintaining g separatepolar orbiting systems argue that the UnitedStates cannot afford both systems.11 DoD andNOAA counter that each satellite system serves aunique mission. The NOAA satellites routinelyprovide data to thousands of U.S. and interna-tional users. DMSP serves a variety of specializedmilitary needs and provides valuable microwavedata to the civilian community. Previous attemptsto consolidate the two systems have resulted inincreased sharing of data and other economies.However, because of the different requirements
11 us. conpe~~, (j~n,-~~ ~com~g Office, NS1~ 87.107, U, S. weather Satellites: AchiO,ing Economies of Scale @’&$hh@OU, ~:
U.S. Government I%nting Office, 1987).

16 I Remote Sensing From Space
for data from the two existing systems, suchefforts have not led to an integrated system.
Congress may wish to revisit the question ofthe possible consolidation of DMSP and theNOAA polar orbiting system as it searches forways to reduce the Federal deficit. Such a studyshould look for innovative ways for NOAA andDoD to work in partnership to carry out the basemissions of both agencies.
NASA’S MISSION TO PLANET EARTHIn conjunction with its international partners,
the United States plans a program of civilianEarth observations to provide, by the early yearsof the next century, the comprehensive collectionof data on resources, weather, and natural andhuman-induced physical and chemical changeson land, in the atmosphere, and in the oceans.These programs are unprecedented in both theirscope and their cost.
NASA’s Earth Observing System (EOS) ofsatellites is the centerpiece of NASA’s Mission toPlanet Earth. It is being designed to providecontinuous high-quality data over 15 years12 thatcan be related to the scientific study of:
1.2.3.4.
5.
6.
large-scale transport of water vapor;precipitation;ocean circulation and productivity;sources and sinks of greenhouse gases(gases such as carbon dioxide and methanethat contribute to greenhouse warming) andtheir transformations, with emphasis on thecarbon cycle;changes in land use, land cover, and thehydrology and ecology of the land surface;glacier and polar ice sheets and their rela-tionship to sea-level;
‘7.
8.
ozone and its relationship to climate and thebiosphere; andthe role of volcanic activity in climatechange.
EOS planners expect these data to assist inunderstanding and monitoring the physical, chem-ical, and biological processes of global change,predicting the future behavior of Earth systems,and assessing how to react to global change.
Measurements of these global change proc-esses can be divided into two types:13
1.
2.
Long-term monitoring-to determine if cli-mate is changing, to distinguish anthropo-genic from naturally induced climatechange, and to determine global radiativeforcings and feedback.‘‘Process” studies-detailed analysis of thephysics, chemistry, and biology that governprocesses ranging from the formation of theAntarctic ozone hole to the gradual migra-tion of tree species.
Some scientists have raised concerns over 1)whether the EOS program as currently configuredis optimally designed to perform these differentmissions, 2) whether the EOS program willaddress the most pressing scientific and policy-relevant questions, and 3) whether important dataon issues such as global warning will be availablesoon enough to assist policymakers. EOS pro-gram officials point to repeated and extensivereviews by interdisciplinary panels in the selec-tion of instruments and instrument platforms asevidence that their program is properly focused.The central role of the EOS program has resultedin a USGCRP budget that is heavily weightedtoward satellite-based measurements. As a result,some researchers express concern that:
12 To achieve 15.yw&ti sets, EOS ‘AM’ and “PM’ platforms would be flown 3 times (the 130111i.Wd lifetime Of theSephM’fOrTJ3S k 5 YWS).
Scientists expect that 15 years will be long enough to obseme the effects of climate change caused by the sunspot cycle (1 1 years), several ElNines, and eruptions of several major volcanoes. This period would be sufilcient to observe the effects of large-scale changes such asdeforestation. Scientists are less certain whether it will be possible to distinguish the effects of greenhouse gases on Earth’s temperature frombackground fhlCtlMtiOllS.
13 see ~p. B for more detaik of the distinction between theSe hVO typeS of ~~.

— .
Chapter 2—Remote Sensing and the U.S. Future in Space I 17
Figure 2-4-A Defense Meteorological Satellite DOE, DoD, and other relevant departments
These satellites are similar to the NOAA satellite shown infigure 2-3, although the sensor suite is somewhat different.
SOURCE: Department of Defense.
1.
2.
The limitations of satellite-based platformswill prevent process-oriented studies frombeing performed at the level of detail that isrequired to address the most pressing scien-tific questions;Continuous long-term (decadal time-scale)monitoring is at risk, because of the high-cost, long lead times, and intermittentoperations that have historically character-ized the design, launch, and operation ofmulti-instrument research satellites.
According to those holding these views, a morebalanced EOS program would provide greatersupport for small satellites, and a more balancedUSGCRP program might include greater supportfor groundbased measurement programs, includ-ing ocean measurement systems, and alternativesensor platforms, such as long-duration, high-altitude UAVS. Greater support for comple-mentary non-space-based elements of theUSGCRP could be provided either by redirec-tion of already tight NASA budgets, or fromgreater support for the USGCRP from the
direct each agency to provide explicit supportfor data that would complement the datagathered by satellite. This may require a few tensof millions of dollars of additional fundingannually between now and the end of the century.Such additional funds would be quite smallcompared to the $8 billion EOS program, butwould vastly enhance the value of the data fromthe EOS satellites.
Redirecting funds from within the EOS pro-gram would be extremely difficult because theprogram has already experienced two significantreductions of scope since Congress approved it asanew start in fiscal year 1991. At the time, NASAhad estimated it would need about $17 billionbetween 1991 and 2000 to complete the firstphase of its EOS plans. Concerns over NASA’splans to rely on a few extremely large, expensivesatellite platforms,14 and funding uncertainties,caused Congress in the fiscal year 1992 appropri-ations bill to instruct NASA to plan on receivingonly $11 billion during the first phase of EOS.15
Although this restructuring led to the cancellationof some instruments and a deferral of others, itgenerally resulted in a lower risk science programthat is more heavily focused on climate change.When, during 1992, the magnitude of likelyfuture constraints on the Federal budget becameclear, Congress further reduced planned spendingfor the frost phase of EOS to $8 billion. Thecongressional action was consistent with aninternal NASA effort to reduce the costs of itsmajor programs by about 30 percent. This secondreduction of scope has led NASA to canceladditional instruments, increase reliance on for-eign partners to gather needed global change data,cut the number of initial data products, and reduceprogram reserves. Reduction of reserves forinstrument design and construction will increase
14 ~epo~ of the Ea~h ob~em[ng System (EO,$) E~g~neen’ng Review co~’ftee, ~w~d Friem~ cm= September 1991.
15 See ch. 5, Global @nge Resea.rc~ for a more detailed account of theSe COngreSSiOrIid ftCtiOm.

18 I Remote Sensing From Space
SOURCE: NASA, NOAA, DoD.
the risk that the EOS instruments will not achievetheir planned capability. Further reductions infunding for the EOS program are likely toconstrain EOS scientists and sharply reducetheir flexibility to follow the most importantglobal change science objectives.
Because NASA expects to operate the EOSsatellites and its EOS Data and InformationSystem (EOSDIS) for at least 15 years after thelaunch of the second major satellite in 2000, theprogram will necessarily take on the characteris-tics of what has been called an “operationalprogram” —sustained, routine acquisition of datathat must be routinely available to researchers andother users on a timely basis. In order to achievemaximum effectiveness, NASA’s EOS pro-gram must be organized and operated withgreat attention to the regular, timely deliveryof data.
Between now and the end of the century,when the first EOS satellites begin to transmitdata to Earth, NASA scientists will rely on aseries of Earth Probes and other satellites, includ-ing NASA’s Upper Atmosphere Research Satel-lite, the U.S./French TOPEX/Poseidon, Landsat,and the NOAA operational satellites for globalchange data. The data from these systems will becritical for early understanding of certain atmos-pheric and ecological effects.l6
NASA’S REMOTE SENSING BUDGETThe Federal budget for building and operating
existing and planned civilian satellite remotesensing systems is spread across three agencies—DoD, NASA, and NOAA-but most funds arein NASA’s budget (table 2-1 and figure 2-5).Examining NASA’s budget for remote sensingactivities in the context of its other programcommitments reveals that the disparity betweenNASA’s plans and its expected future funding isstill growing, despite NASA’s recent efforts toreduce its funding gap by reducing the size ofEOS, space station, and space shuttle. NASA hasprojected an overall budget increase of 13 percentbetween fiscal year 1993 and fiscal year 1996(figure 2-6, table 2-2). Should anticipated fundingnot materialize, NASA will have little budgetflexibility to respond to unforeseen problems inits Mission to Planet Earth programs.17
The large yearly Federal deficit has createdpressure to save money in the discretionaryportion of the Federal budget. Civilian spaceactivities account for about 2.8 percent of U.S.discretionary budget authority in fiscal year1993.18 In appropriating NASA’s funds for fiscalyear 1992, the House and Senate stated thatNASA, which receives the lion’s share of the
16 Ibid.
17 Seved ob~ms ~ve criticized NASA’S earlier budgeting as highly unrealistic. U.S. Congress, Gened ~comm ~lce
GAO/NSIAD-92-278, NASA: Large Programs May Consume Increasing Share of Linu”ted Future Budgets (WAingto% DC: U.S. GeneralAeeounting Office, September 1992). Ronald D. Brunner, ‘‘Overmnm.it.rmmt at NAS~” presented at the annual American AstronauticalSociety Conference, San Francisco, CA, December, 1992.
18 me dismetioq ~fion of the fiscal year 1993 federal budget request was $502 billion.

Chapter 2—Remote Sensing and the U.S. Future in Space I 19
UiQ%E.-g
0(xlm
7
0
1-
qmu)N
0emr-
N.al
$1-
00a)
00m k
z.-(8
c.—iiii3In
. . . . . . . . . .. . . . .. . . . .. . . . .. . . . .. . . . .. . . . .
. . . . ...
. . . . .. . . . .. . . . . cmv).-.
.

20 I Remote Sensing From Space
2,000
0,000
8,000
1992 1993 1 994* 1 995* 1996”
Remainder
Physics, astronomy and planetary exploration
Research and program management
Mission To Planet Earth
Space shuttle
Space station and new technology investment
“Estimates
Large programs constitute most of NASA’S budget, leave Iittteflexibility, and require a 13 percent budget increase betweenFY93 and FY96.
SOURCE: NASA Budget Estimate, Fiscal Year 1994.
civilian space budget, should expect only modestannual increases in its overall budget.19 Independ-ent reviews of NASA’s budget prospects alsosuggest that NASA may face lower future budg-ets.20 NASA’s budget in fiscal year 1992 was
$14.334 billion, a 3.4 percent boost over the fiscalyear 1991 budget (table 2-2).21 For fiscal year1993, however, NASA’s budget is $14.330 bil-lion. The Clinton Administration is requesting$15.265 billion for NASA for fiscal year 1994, aone billion dollar increase over the 1993 appropri-ation. 22
Figure 2-6 illustrates the required budget in-crease for NASA’s program plan. A level budget(in current year dollars-i.e., one that decreasesas inflation rises), or a budget that is increasedonly slightly, would produce a significant gapbetween available funding and program needs.
Yearly budgets for MTPE may reach more than9 percent of NASA’s total budget by 1995 (figure2-7). If NASA neither receives large budgetincreases nor further reduces the content of itsplans, 23 competition for funds within NASA’S
budget may force difficult choices amongMission to Planet Earth and other majorprojects, including those supporting the humanpresence in space. For example, maintainingNASA’s four largest programs at planned levelsunder a flat agency budget of $14.3 billion infiscal year 1996 would require a 30 percentreduction in the rest of NASA’s programs for thatyear.
The primary competition for funding withinNASA is likely to be with programs supportingthe human presence in space, which today con-sume more than 70 percent of NASA’s budget for
19 ~~~e co~e~es Concw ~ tie Semte lmWge amem~g a series of principles designed tO adpst NASA’S m~titims ~d Smt@Cpl arming to leaner budget allocations in the coming years. ’ Conference Report on the 1992 Appropriations for the Veteran’s AdministrationHousing and Urban Development, and Independent Agencies, House of Representatives Report 102-226 (to accompany HR. 25 19), Sept. 27,1991, p. 54. The Senate language directs that “the agency should assume no more than 5 percent actual growth in fwcal year 1993:” SemiteReport 102-107, July 11, 1991 (to accompany H.R. 2519), p. 130.
20 For Cxmple, tie Elec~o~c ~d~~es Ass~iation for~~~ tit NASA’S budget will &op by about 8 percent h real terms over the neXt
4 years. Electronics Industries Association, Twenty-Eighth Annual EIA Ten-Year Forecast of DoD and NASA Budgets (Washington DC:Electronics Industries Association October 1992).
21 Conw=s appmpfit~ $14.352 billion for tie NASA fisc~ y~budget but laterrescbded $18.4 million from Climmt ~d other projects.
22 me ~omt of ~ rquat i5 s~~ t. the previou5 aW5~ation’s rquest Of $14.993 bilfion for f~d y- 1!)93, which CO~tiS
reduced substantially.23 sched~e s~tchou~ tit f~ t. reduce program ~mmitmerl~ o~y ~Crease & to~ budget for a proj~t and create a “hw wave’ Of
fuhm budget needs,

——.—
Chapter 2–Remote Sensing and the US. Future in Space l21
Table 2-2—NASA Budgets (millions of then-year dollars)
1993 1994 1995 19961991 1992 Estimate Request Estimate Estimate
Space Station (and new technology) . . . . . . .Space transportation capability
development . . . . . . . . . . . . . . . . . . . . . . . .Mission to Planet Earth. . . . . . . . . . . . . . . . . .Physics and Astronomy & Planetary
Expiration . . . . . . . . . . . . . . . . . . . . . . . . .Life Sciences and Space Applications. . . . . .Commerciai programs . . . . . . . . . . . . . . . . . . .Aeronautical, Transatmospheric, and Space
research & technology . . . . . . . . . . :. . . . .Safety, QA, academic programs, tracking
and data advanced systems . . . . . . . . . . .Shuttle production & operations. . . . . . . . . . .Expendable launch vehicle services . . . . . . .Space communications . . . . . . . . . . . . . . . . .Construction of facilities. . . . . . . . . . . . . . . . .Research & program management . . . . . . . .Inspector general . . . . . . . . . . . . . . . . . . . . . .
1,900.0 2,002.8 2,122.5 2,300.0 2,300.0 2,300.0
602.5662.3
739.7828.0
649.2937.9
649.21,074.9
643.31,448.1
639.01,508.4
1,442.9325.9
88.0
1,570.9314.7147.6
1,577.5350.6164.4
1,631.9351.0172.0
1,709.1320.7141.4
1,676.0282.0132.7
893.9 1,101.5 1,138.3 1,398.9 1,528.1 1,650.9
108.14,066.4
229.2828.8497.9
2,211.610.5
122.44,325.7
155,8903.3531.4
1,575.813.9
148.94,069.0
180.8836.2525.0
1,615.015.1
134.44,196.1
300.3820.5545.3
1,675.015.5
145.14,042.7
313.71,014.6
387.21,703.0
16.0
152.34,201.5
363.41,093.3
375.01,752.0
16.5
Agency summary . . . . . . . . . . . . . . . . . . . 13,868 14,334 14,330 15,265 15,713 16,143
SOURCE: National Aeronautics and Space Administration, 1992, 1993.
Figure 2-7-Composition of NASA’s Budget, 1990 and 1995
1990 NASA Budget 1995 NASA Budget
Station Station
Rest of NASA39.5”/0
Rest of NAS37.5Y0
Shuttle30?/0
Shuttle25.70/o
TOTAL: 12.295 TOTAL: 15.173
Note the growth of NASA’s major programs, including Mission to Planet Earth, which increase to neariy 9 percent of total budget.
SOURCE: NASA Budget Estimate, Fiscal Year 1994; Fiscal Year 1992.

22 | Remote Sensing From Space
space activities,24 primarily though the space
shuttle and space station Freedom programs.25
Hence, if NASA’S overall budget remains flator includes only modest growth, unexpectedfuture increases in either of these two largeprograms could squeeze MTPE to the pointthat its effectiveness to support global changeresearch would be severely reduced. Extremelystringent budget conditions would put Congressand the Clinton administration in the position ofhaving to choose between a robust program thattracks global change and manages Earth re-sources and a program that supports humanpresence in space.
The risk of budget surprises related to thesupport of humans in space is relatively high. Asnoted in an earlier OTA report, ‘‘The UnitedStates should expect the partial or total loss of oneor more shuttle orbiters some time in the nextdecade [i.e., the 1990s].”26 As experienced afterthe failure of Challenger in 1986, the costs ofsuch a loss could reach several billion dollars,even neglecting the costs of repairing or replacingthe damaged orbiter.27 Losing an orbiter wouldalmost certainly delay construction of a spacestation, causing much higher costs to that pro-gram.
Additional budget pressures on MTPE couldlead to the use of fewer advanced sensors andother subsystems, or to technology choices that
would raise system operating costs. They couldalso lead to smaller investments than planned inthe distribution and analysis of MTPE data.Furthermore, satellite research and development(R&D) projects, like most other efforts thatinvolve signficant technology R&D, tend togrow in cost beyond initial estimates as engineersand scientists face the complexities of design andproduction, and delays that are beyond the controlof the project directors.28 Cost growth within theMTPE satellite development and/or operationsprograms also would probably reduce the qualityor quantity of scientific observations NASA isable to accomplish.
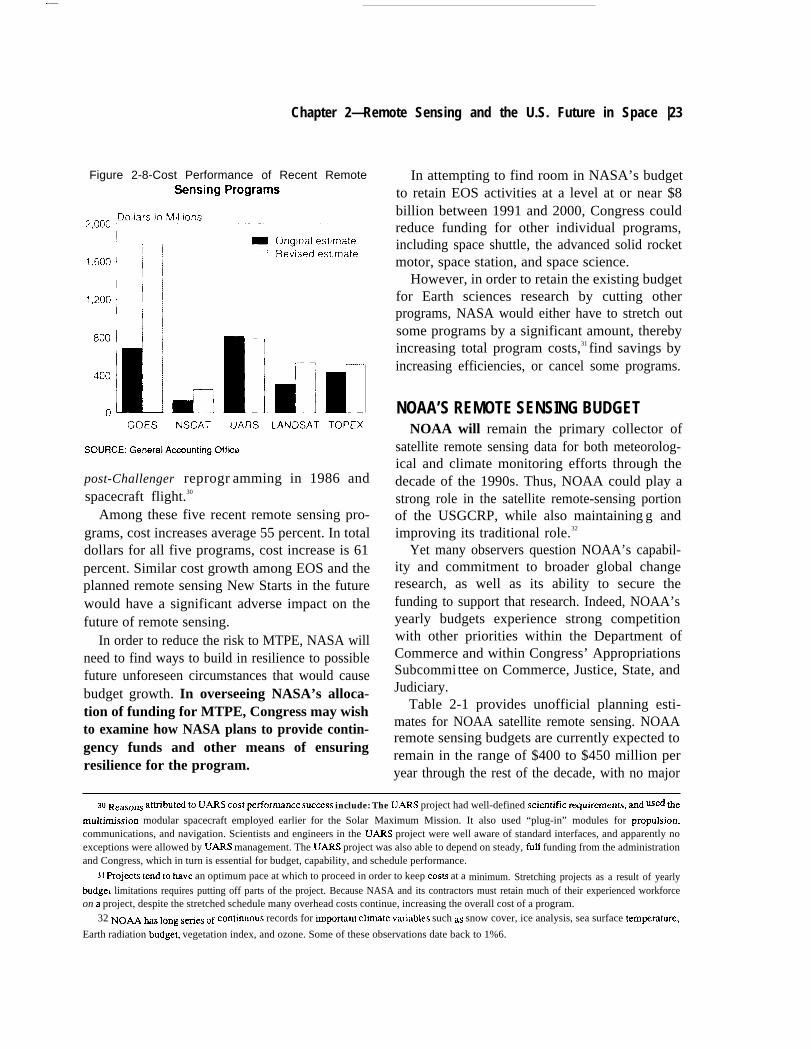
Figure 2-8 indicates cost performance in themajor recent remote sensing ‘‘New Starts. ’ Fourof the five programs have encountered significantcost increases over the original estimates pre-sented to Congress at the time of programapproval (New Start).29 Some cost growth inthese programs is the result of additions orchanges in program content, while the majority ofcost growth is the result of cost increases atcontractors. The GOES-Next program has en-countered the most substantial cost growth ofrecent remote sensing programs, with develop-ment costs increasing more than two and one halftimes original cost estimates since program ap-proval by Congress. UARS, on the other hand,was built and flown with no cost growth between
~ ~t @ excluding $911 million fOf =OtUUltiCS.
24 ~t is, excluding $911 dhOII for &iTOIltMltiCS.
U Du~t spending on space station Free&m and space shuttle dOne COnsum e nearly half of the total budget (table 1-2).26 ~lm of TW~oloW Assessment &cess to Space: The Future of U.S. Space Tran.rportation sYStem (w-on, ~: us.
Government Printing Office, May 1990), p, 7. This is based on an assumption of shuttle launch reliability of between 97 and 99 percent (p.45).
27 MIW of TtximoIogy Assessmen$ Access to Space: The Future of U.S. Space Transportation Systems (wN@ton. w: U.S.
Government Printing Oft3ce, May 1990), p. 21.
2s No~ble rw~t exceptions include the Upper Atmosphere Research Satellite, which was built within budget ~d on sc~ule.
29 FiWes include la~ch ~d operation estimates, except GOES, which d~s not include oP~tions. TRMM and EOS are not included, asthese programs have been in development a relatively short time.
.—
Chapter 2—Remote Sensing and the U.S. Future in Space |23
Figure 2-8-Cost Performance of Recent Remote
post-Challenger reprogr amming in 1986 andspacecraft flight.30
Among these five recent remote sensing pro-grams, cost increases average 55 percent. In totaldollars for all five programs, cost increase is 61percent. Similar cost growth among EOS and theplanned remote sensing New Starts in the futurewould have a significant adverse impact on thefuture of remote sensing.
In order to reduce the risk to MTPE, NASA willneed to find ways to build in resilience to possiblefuture unforeseen circumstances that would causebudget growth. In overseeing NASA’s alloca-tion of funding for MTPE, Congress may wishto examine how NASA plans to provide contin-gency funds and other means of ensuringresilience for the program.
In attempting to find room in NASA’s budgetto retain EOS activities at a level at or near $8billion between 1991 and 2000, Congress couldreduce funding for other individual programs,including space shuttle, the advanced solid rocketmotor, space station, and space science.
However, in order to retain the existing budgetfor Earth sciences research by cutting otherprograms, NASA would either have to stretch outsome programs by a significant amount, therebyincreasing total program costs,31 find savings byincreasing efficiencies, or cancel some programs.
NOAA’S REMOTE SENSING BUDGETNOAA will remain the primary collector of
satellite remote sensing data for both meteorolog-ical and climate monitoring efforts through thedecade of the 1990s. Thus, NOAA could play astrong role in the satellite remote-sensing portionof the USGCRP, while also maintaining g andimproving its traditional role.32
Yet many observers question NOAA’s capabil-ity and commitment to broader global changeresearch, as well as its ability to secure thefunding to support that research. Indeed, NOAA’syearly budgets experience strong competitionwith other priorities within the Department ofCommerce and within Congress’ AppropriationsSubcommi ttee on Commerce, Justice, State, andJudiciary.
Table 2-1 provides unofficial planning esti-mates for NOAA satellite remote sensing. NOAAremote sensing budgets are currently expected toremain in the range of $400 to $450 million peryear through the rest of the decade, with no major
w ReXom ~t~but~ t. UARS cost ~fio~nce SUCCIXS include: The UARS project had well-defined scientilc n%u~~enmt ad ~~ tie
multimission modular spacecraft employed earlier for the Solar Maximum Mission. It also used “plug-in” modules for propulsio%communications, and navigation. Scientists and engineers in the UARS project were well aware of standard interfaces, and apparently noexceptions were allowed by UARS management. The UARS project was also able to depend on steady, fill funding from the administrationand Congress, which in turn is essential for budget, capability, and schedule performance.
31 ~oj=~ tend to have an optimum pace at which to proceed in order to keep COStS at a minimum. Stretching projects as a result of yearlybUdgeL limitations requires putting off parts of the project. Because NASA and its contractors must retain much of their experienced workforceon a project, despite the stretched schedule many overhead costs continue, increasing the overall cost of a program.
32 NOAA ~ long s~~ of con~uou5 records for fip~nt clfite v~ables such M snow cover, ice analysis, sea surface teMptTatie,
Earth radiation budget+ vegetation index, and ozone. Some of these observations date back to 1%6.
24 I Remote Sensing From Space
funding increases expected. This is in markedcontrast to the expansive satellite research effortsunderway at NASA. NOAA’s smaller increasesin yearly remote sensing funding would allow forsome relatively minor planned improvements inPOES satellites and instruments, and the comple-tion and launch of improved GOES satellites (seech. 3: Weather and Climate Observations).
Highly constrained NOAA satellite remotesensing budget requests have historically been thenorm, as illustrated by Administration attempts tocut the POES program to one satellite, and thetermination of the Operational Satellite Improve-ment Program at NASA in the early 1980s (see ch.3: Weather and Climate Observations). A morerecent example of the effects of limited funding inNOAA is Congress’ $5.3 million cut in the“environmental observing services’ line of the1993 NESDIS budget request.
Recent efforts within NOAA to strengthenadvanced sensor research, oceanic remote sens-ing, and climate observations have been largelyunsuccessful. Continuing budget pressures havehampered NOAA’s efforts to participate mean-ingfully in sensor design, mission planning, ordata analysis in U.S. and international efforts todevelop new satellite remote sensing spacecraftand instruments in the 1990s. Yet these endeavorscould build on the substantial investment of otheragencies and countries for satellite system hard-ware to provide additional global change informa-tion. For example, NOAA has still not succeededin securing the relatively small resources (approx-imately $6 million) required to assure directreceipt of vector wind data from the NASAscatterometer instrument aboard the JapaneseADEOS satellite,33 a potentially important en-hancement of NOAA’s forecast capability.
Observers note that the outcomes of the yearlybudget process have caused NOAA’s operationalremote sensing program to ‘‘limp along fromyear to year. Over the past decade, NOAA hasreportedly lost much expertise in remote sensing,
and lost some credibility among the user commun-ity. In sum, NOAA satellite remote sensingfunding appears to constrain NOAA’s abilityto serve U.S. needs for remotely sensed data,especially considering the continued impor-tance to the United States of meteorologicaland long-term climate change data.
THE COSTS AND BENEFITS OFSATELLITE REMOTE SENSING
Between fiscal years 1993 and 2000, theUnited States plans to spend about $14 billion tosupply remotely sensed data form several sys-tems, or an average of $1.75 billion per year. Suchdata serve the U.S. economy by producinginformation useful for predicting weather, man-aging natural and cultural resources, economicplanning, and monitoring the environment (table2-3). They will also help scientists detect andunderstand global change. Multiple systems areneeded to provide different kinds of information.Although a systematic study of how costs andbenefits compare has not been conducted, costsare likely to be small compared to the benefits thatcould be obtained with better information gener-ated from remotely sensed data. For example, asnoted above, knowing many hours in advancewhich path a hurricane is likely to take hasallowed coastal dwellers to prepare their houses,businesses, and public buildings for the on-slaught, and has saved numerous lives as well asmillions of dollars in costly repairs. The manage-ment of rangeland, forest, and wetlands can alsobenefit from the large-scale, synoptic informationthat data form satellite systems can supply.
In the near future, global change research willlikely consume the largest share of the satelliteremote sensing budget. Here again, the gains inincreased knowledge about the effects of harmfulchange could far outweigh the average yearlycosts for space-based global change research(about $1 billion annually beginning in 1995).

Chapter 2–Remote Sensing and the U.S. Future in Space |25
Although estimates of the potential costs tosectors of the world’s economy from globalchange are uncertain, they do indicate that suchcosts could range to tens of billions of dollars peryear for the United States alone (box 2-A).Analysts predict, however, that some of the coststo the U.S. economy from global warming, takenalone, might be offset by the potential benefits.34
The Federal Government may wish to fundprograms to mitigate the effects of global changeor to adapt to it. The choices of how to respond tothe effects of global change, in large part, will bedetermined by scientists’ ability to predict theseeffects. Satellite remote sensing data alone willnot necessarily enable the United States to avoid
potential costs, but some fraction of the costsmight be saved with improved information de-rived from satellite data. Given the large invest-ment the United States and other nations aremaking in the provision of data from satellitesystems, Congress may want to request asystematic study that would compare costs ofproviding satellite data for monitoring theenvironment and for global change researchwith the expected savings better environ-mental information would provide. Such anassessment could help allocate resources based onthe type of data and utility of their informationcontent.
DATA CONTINUITY, LONG-TERMRESEARCH, AND RESOURCEMANAGEMENT
To be effective in monitoring global change orin supporting resource management, the deliveryof high-quality, well-calibrated, remotely senseddata must be sustained over long periods. Certaindata sets, such as those related to Earth’s radiationbudget, should be acquired continuously overdecades. In some cases, data must also bedelivered with few or no gaps in the operation ofthe satellites. For example, losing a Landsatsatellite more than a few months before areplacement can be launched would force re-source managers to find sources of other, possiblyless efficacious, data. Such a data gap would alsoreduce the ability of global change researchers tofollow large-scale changes in the rain forests andother elements of the biosphere.
The need for continuity of data collection anduse is recognized in the Land Remote SensingPolicy Act of 1992, which states:
The continuous collection and utilization ofland remote sensing data from space are of majorbenefit in studying and understanding human
~ F~~ ~-plc, ~~~ ~ff~t of glo~ w- ~u]d &to lengthen the ~OW@ WUon in Sreits that me nOW IIIM@@ thus improving theincome from agriculture and other seasonal industries. See William D. Nordhouse, “Economic Approached to Greenhouse Warming,” inRudiger Dombusch and James M. Poterlan, eds., Global Warm”ng:Economic Policy Respomes ( Cambridge, MA: The MIT Press, 1991), &2.
26 I Remote Sensing From Space
Box 2-A–Estimated Costs Resulting From Global Change
Determining the expected costs resulting from various scenarios of climate change is challenging. Theeconomic effects of climate change can be divided into two broad categories. If climate change does occur, everycountry will endure costs of remediation and costs associated with coping with a changing environment. Costs ofremediation involve expenses incurred adapting to change and preventing further harmful emissions. For example,included in remediation costs would be the expenses incurred for developing less polluting technologies. Adaptingto a changing environment might include the expense of developing new agricultural practices and seeds neededto cope with changing climate and weather patterns. Costs are influenced by technology development, ability ofconsumers to afford new technologies, government regulations, population growth, demographic trends, andeffectiveness of international treaties. Potential costs in several areas could be quite high:
. costs to agriculture could increase by $5.9 to $33.6 billion annually (1992 dollars);
. forests, a $13 billion industry whose costs could increase by $4 billion annually;
. species loss could lead to damages ranging from a few billion to an order of magnitude higher;’
. for the costs of sea-level rise, estimates range from $73 to$111 billion (1965 dollars-cumulative through2100), to $373 billion associated with a one-meter rise, an additional $10.6 billion annually to coverassociated economic losses;2
. loss of wetlands, biological diversity, and water resources; and
. increased fuel and power requirements, $200-300 billion (1986 dollars)3
These and all cost estimates associated with climate change should be regarded with extreme skepticism.The art of estimating the costs o f global change is still in its infancy. Most published estimates are predicting futureevents that are not clearly defined and may not even occur. However, what is clear is that should our climatechange, the costs of change both in real and in opportunity costs could be enormous.
1 ~ll~m R. CIiM, TIW Econom~ of GIobsi Warming, Washington, DC: Institute for international Economics,1992.
z ~ US, Environmental protection Agency, Iil’he Potential Effects of Gtobal Ciimate Change on th9 Unit9dStates,” December, 1989, and US. Environmental Protection Agency, “Changing Climate and the Coast,” 1980.
3 U.S. Environmental protection Agency, “The Potential Effects of Global Ciimate Change on the United States,”December, 1989.
impacts on the global environment, in managing collection and use over decades. In order to bethe Earth’s resources, in carrying out national fully exploited, these calibrated data sets willsecurity functions, and in planning and conduct- have to be archived, maintained in good condi-ing many other activities of scientific, economic, tion, and made readily available to users.and social irnportance.35
If Congress wishes to sustain U.S. efforts to DEVELOPING AND EXECUTING Aunderstand and plan for the effects of global STRATEGIC PLAN FOR SPACE-BASED—change, prepare for more effective manage- REMOTE SENSINGment of Earth’s resources, and support na- The expected constraints on NASA’s budgettional security uses of remotely sensed data, it for MTPE speak to another important theme thatwill have to give attention to funding programs has emerged during the continuing debate overthat would maintain the continuity of data U.S. space policy — how to accomplish the goals

Chapter 2—Remote Sensing and the U.S. Future in Space |27
for U.S. space activities more efficiently and withgreater return on investment. Decisions will bemade in an environment in which several U.S.agencies, private companies, and foreign entitiespursue remote sensing activities. Greater pro-gram integration, both domestically and inter-nationally, has the potential for reducing costsand redundancy, but risks program delays,compromises on goals, and increased cost. Inthe past, the development of new or improvedsatellite sensors and systems has proceeded ac-cording to the specific needs of the fundingagency. However, recent experience with datafrom Landsat and from NOAA and DoD environ-mental satellites, as well as foreign satellites,demonstrates that the utility of data from thesesystems extends far beyond the interests of anysingle agency. Responding to a broader set ofneeds would likely increase the cost of any singlesatellite system or sensor because it would putmore demands on the instruments and satellitebus. However, increased capability might in timeincrease the overall benefit of satellite remotesensing to the U.S. taxpayer.
On the domestic level, the need to maximizethe return on investments in remote sensing,particularly for global change research, whichdominates expected future spending on civil-ian remote sensing systems, suggests thatNASA, NOAA, DoD, and DOE should combineefforts to develop a single, flexible strategicplan that would:
●
●
●
guarantee the routine collection of high-quality measurements of weather, climate,and Earth’s surface over decades;develop a balanced, integrated, long-termprogram to gather data on global change thatincludes scientifically critical observationsfrom aircraft and groundbased platforms, aswell as space-based platforms;develop appropriate mechanisms for archiv-ing, integrating, and distributing data from
●
many different sources for research andother purposes; andensure cost savings to the extent possiblethrough incorporating new technologies insystem design developed in either the privateor public sectors.
Developing a single, flexible plan would re-quire an assessment of whether and where pro-grams of these agencies might conflict, and if so,how they might be harmonized.
9 Collecting Routine Earth ObservationsOperational, long-term remote sensing pro-
grams such as NOAA’s environmental satelliteprograms and Landsat have generally sufferedbudget neglect, while the Nation directs atten-tion instead toward new spaceflight missionssupported through NASA’s budget. An inte-
grated plan would improve the incorporation ofdata from DMSP, GOES, POES, and Landsat intooperational government programs, as well as intoglobal change research.
The recent shift of operational control of theLandsat system from NOAA to DoD and NASA,as stipulated in the Land Remote Sensing PolicyAct of 1992,36 appears to support the routine,long-tern provision of Landsat data for theoperational use of government, the private sector,and international users. From now into the nextcentury, these data will serve as one of theprimary sources for information on the conditionof the land and coastal environments. Landsatdata will also enable the tracing of long-term,gradual changes to Earth’s surface as a result ofclimate change and/or anthropogenic environ-mental effects. However, if Congress and theAdministration wish to ensure continuity ofdata delivery and the continued improvementof Landsat sensors and system components,they will have to maintain a more supportivepolicy and funding environment for land

| |— —
28 | Remote Sensing From Space
remote sensing than they have during the pastdecade.
The private sector has developed a growingmarket for remotely sensed data products, both asbuyer and seller, and is a major force in settingstandards for remotely sensed data and analyticsoftware. It has also created new data applica-tions, and developed innovative sensors. In thepast, many private sector users of remotely senseddata have complained that the government has nottaken their needs and interests into account whendesigning new remote sensing programs. Inorder to ensure that Landsat meets the needsof private sector as well as government users,Congress might wish to encourage DoD andNASA to establish an advisory committee togather input from private industry and acade-mia for building and operating remote sensingsatellites.37
For the United States to assure the continualimprovement of operational satellite systems,it will need a new approach to developing newsensors. In the past, NASA has generally devel-oped remote sensing systems in response to a setof research interests. As its interests change,NASA’s focus on sensors and satellites changewith them.38 In the 1960s and 1970s, someresearch instruments developed by NASA wereincorporated into NOAA’s environmental satel-lites and the Landsat satellites, all of which serveabroad clientele from government and the privatesector. However, in recent years, as exemplifiedby the experience with the development ofNOAA’s GOES-Next geostationary satellite (seech. 3: Weather and Climate Observations), theprevious arrangement for close cooperation be-tween NASA and NOAA has broken down .39
1 Global Change ResearchIn order to be effective in fully understanding
Earth systems, global change research requiresdetailed data about chemical and physical proc-esses in the atmosphere, oceans, and land. Someresearch problems, particularly those that involvemodeling Earth’s atmosphere, also require datataken over decades. In order to make the mostefficient use of funding resources, the long-term research goals of U.S. global changeresearch must be well coordinated acrossagencies and with academia. There should alsobe appropriate means to allocate fundingamong agencies. The USGCRP has served animportant function in focusing the activities of thedifferent agencies toward global change research,but it has relatively little power to adjudicatedifferences among agencies or to bring disciplineto funding decisions. National Space PolicyDirective (NSPD) 7, issued on June 1, 1992,established the Space-based Global Change Ob-servation System (S-GCOS), under the aegis ofUSGCRP, to coordinate the satellite-based globalchange studies of U.S. agencies.
“In support of the USGCRP the S-GCOS shall:
●
●
Improve our ability to detect and documentchanges in the global climate system todetermine, as soon as possible, whether thereis global warming or other potentially ad-verse global environmental changes; and, ifchanges are detected, determine the magni-tude of these changes and identify theircauses.Provide data to help identify and understandthe complex interactions that characterizethe Earth system in order to anticipate
37 F~~ ~.pie, he ~~d R~Ote s~~g pO@ Act of 19~ ~n~tes tie ~lici~tion of advi~ from “a broad range of perspectives . . .
[including] the full spectrum of users of Landsat data including representatives from United States Gov ernrnent agencies, academic institutions,nonprofit organizations, value-added companies, the agricultural, mineral extraction, and other user industries, and the public; Section 101 (c)Landsat Advisory Process.
38 ~mNASA ~M d~velop~ tie L~&at sties ofsurfacxremote sensing satellites in the 1970s, some bm UWH comp~ed ~tNASA’s
shift of data formats made it difficult for tbem to plan on routine use of the data.39 ~ment Ofcomexe, Office of~e qtor General, National Strategy for Satellite Remote Sensing iSMwkci, qubfish~ W%
Febmary 1991.

Chapter 2–Remote Sensing and the U.S. Future in Space |29
changes and differentiate between human-induced and natural processes.
. Provide for a data system to manage theinformation collected by S-GCOS as anintegral part of the Global Change Data andInformation System, consistent with theUSGCRP data policy.
. Provide for the development and demonstra-tion of new space-based remote sensingtechnologies for global change observationand identify candidate technologies for fu-ture operational use. ’ 40
NASA was assigned the lead role in S-GCOS.NSPD7 directs other agencies—including theDepartments of Defense, Energy, and Commerceto cooperate in the development and operation ofspacecraft and data systems. Because S-GCOS isa recent creation, and because of the recentchange of executive branch administration, it istoo early to judge its effectiveness in guiding thedirection of global change research and otheraspects of U.S. satellite remote sensing programs.However, because S-GCOS creates a forumwhere agencies can share information aboutexisting and future plans for space-based globalchange research, it has the potential to reduceredundancy and lead to greater sharing of limitedresources.
I Improving the Use of DataThe need to be more efficient in using re-
sources dictates greater attention to the groundportions of these programs, which are historicallyrelatively inexpensive compared to procuringnew spacecraft and instruments. Although NASAhas demonstrated the ability to collect datafrom a variety of instruments, it has been lesssuccessful in making effective use of them.
Historically, data from remote sensing systemshave been underutilized, while funds thatmight be used for data analysis are insteadfunneled toward the next generation of space-craft.
NOAA and NASA have not made sufficientuse of NOAA’s rich data archives for globalchange research. The Landsat archives held atthe U.S. Geological Survey’s EROS Data Centerare also underutilized for global change research.Such inattention to effective data managementand use could undermine global change researchefforts, particularly NASA’s Earth ObservingSystem (EOS), the largest component in itsMTPE program.
Scientists participating in the MTPE havepressed for close attention to the development ofa powerful system to store, distribute, and analyzedata collected from the various U.S. and interna-tional sensors that will contribute to globalchange research. As a result, NASA is developingthe Earth Observing System Data and Informa-tion System (EOSDIS), which will be composedof several interconnected data archives distrib-uted around the country (figure 2-9).41 As part ofits EOSDIS efforts, NASA has funded the develop-ment of data sets composed of data gathered overthe past two decades from sensors aboard theLandsat satellites and form the NOAA opera-tional environmental satellites. NASA’s earlyexperience in developing these ‘pathfinder’ datasets illustrates the difficulties NASA may encoun-ter in dealing with the massive amounts of datafrom the EOS satellites.42 It also helps NASAresolve many difficulties before EOS becomesoperational. Scientists working on the project arefinding it much more difficult than they antici-pated to process the data to make them useful toglobal change researchers. NASA’s and NOAA’s
@ Nation~ Space Policy Dirmtive 7: Spam-ked Global Change Observations. The White House, signed by Resident Bum 1 June 1992.This NSDD, which attempts to improve coordination and collaboration in global change researc~ originated in the National Space Council.
41 Hu@es Applied Information Services, Inc. won the contract to develop EOSDIS.
42 us. conps~, General &-cou@ ~lce, GAO-C.92-79, Ea~h Obsewing system: Information m NAM’s Incorporation Of
Existing Data Into EOSDL$ (W%shingto% DC: General Accounting Office, September 1992).

30 | Remote Sensing From Space
Figure 2-9—The EOSDIS Network
I ORNLGround-based
EDC I data relatingLand processes to biogeochemical
Imagery dynamics
(
SOURCE: National Aeronautics and Space Administration.
efforts on the pathfinder data sets also make clearthat these data have been underutilized for globalchange research.
A future report in this assessment will treat dataissues in detail. Improving the return on invest-ment in U.S. remote sensing systems willrequire more efficient use of existing remotesensing data acquired by satellite. It will alsorequire making more efficient use of dataacquired by other means, such as data thatcould be taken by aircraft, balloons, UAVS, orfrom groundbased installations. These data
are important for remote sensing instrumentcalibration and validation.
9 Institutional IssuesU.S. research and operational remote sensing
activities cut across disciplinary and institutionalboundaries. Although existing institutional mech-anisms are likely to improve the coordinationof U.S. research and operational remote sens-ing activities, they are unlikely to be sufficientto develop a long-term integrated plan thatallocates resources among the agencies. Be-cause funding and resource decisions rest largely

Chapter 2–Remote Sensing and the US. Future in Space | 31
with each individual agency and its respectivecongressional committees, no mechanism existsto enforce collaboration among agencies or adju-dicate differences that are likely to arise. Con-gress may wish to establish an institutionalmechanism to make resource allocation recomm-endations about remote sensing that extendacross agency boundaries. The Office of Sci-ence and Technology Policy, might be given thisrole. However, as presently constituted, the Of-fice lacks the staff and the mandate to resolvedifferences among agencies. OMB might be ableto assume such a task, but it suffers from a lack ofstaff and expertise. In addition, it is highlydepartmentalized. OTA will examine this andother organizational and institutional issues in afuture report, which will develop a set of optionsfor Congress to consider.
Greater international coordination and collabo-ration on sensors and systems, as well as datatypes and formats, will eventually be needed inorder to reap the greatest benefit from theworldwide investment in remote sensing technol-ogies (see ch. 8: International Cooperation andCompetition. Sensors on existing satellites pro-vide considerable overlap in capability. Althoughsome redundancy is appropriate in order to giveengineers and scientists in different countriesexperience in designing, operating, and usingremote sensing technology, eventually the inter-national community as a whole would be bestserved by reducing overlap43 as much as possibleand by using the available funds to improve theapplication of the data or to provide additionalcapability. The United States and Europe, whichare now headed toward the goal of building andoperating a single system of two polar orbitingsatellites (see ch. 3: Weather and Climate Obser-vations), might consider including Russia in their
plans. The United States and Russia now operatepolar orbiting satellites. Closer cooperation be-tween the United States, Europe, and Russiacould lead to the development and operation of asingle, more capable polar orbiting system. Be-cause of the precarious state of the Russianeconomy, this might initially require supportivefunding from the United States and other coun-tries.
The countries that operate Earth observationsatellites have established two mechanisms tofoster greater cooperation-the Committee onEarth Observations Systems (CEOS) and theEarth Observation-International CoordinationWorking Group (EO-ICWG). Both were deliber-ately created as informal organizations in order toavoid confronting administrative hurdles withineach country that a more formal cooperativestructure might engender. Countries use CEOSand EO-ICWG to inform members about theirplans and to coordinate Earth observations. Thereis no exchange of funds.
In the future, the United States may wish toconsider leading a broadbased cooperativeprogram to collect, archive, and distributelong-term environmental data sets using sen-sors and satellites systems similar to those nowoperated by NOAA.44 If properly structured,such an international system could involve thefunding and talents of many more nations inbuilding and operating a system. It would alsoincrease our capability to gather and processenvironmental data sets over the long term. Thefinal report of this assessment will examine thebenefits and drawbacks of a broadbased interna-tional polar-orbiting system, as well as the relatedissue of closer cooperation on NOAA’s geosta-tionary satellite system.
43 some ~valq ~ we fom of r~m~ncy IS ~e~ in order to provide appropriate backups for failed spacecraft or to provide ad~tio~
coverage. The use of the European Meteosat-3 spacecraft to provide backup for the aging U. S. geostationary environmental satellite, GOES-7,is a case in point.
u John McEhoy, “The Future of Eartb Observations in the USA,’ Space Policy, November 1987, pp. 313-325.

Mand the
Weatherand
ClimateObservations
any variables determine weather. For example, atmos-pheric pressure, temperature, and humidity at differentaltitudes affect the development and progress of stormsystems, the amount of precipitation a region receives,number of cloudy days. Over time, these factors
contribute to the climate on local, regional, and global scales.Throughout the day, sensors located on the land and oceans andin the atmosphere and space:
●
●
●
●
●
take measurements of atmospheric temperature and humid-ity (essential to understanding weather systems and stormdevelopment);monitor atmospheric winds (providing critical informationon weather patterns);take visible-light and infrared images of cloud formationsand weather systems;monitor changes in solar radiation; andmeasure concentrations of important atmospheric constitu-ents.
Data gathered by these sensors are essential to understandingweather and climate. Despite efforts to date, large gaps still existin scientists’ understanding of the detailed mechanisms ofweather and climate and in their ability to predict how weatherand climate will change, Climatologists would like more data onatmospheric chemistry and dynamics, the extent of clouds, windsat the oceans surfaces, and upper atmosphere winds. As therecent concern over the degradation of Earth’s protective ozonelayer demonstrates, human activities alter atmospheric chemicalconstituents and affect the structure and health of the atmosphere.
3

34 I Remote Sensing From Space
Box 3-A-NOAA’s Geostationary Satellite System
The Geostationary Operational Enviromnetal Satellites (GOES) maintain orbital positions over the sameEarth location along the equator at about 22,300 miles above Earth, giving them the ability to make nearlyconstantobservations of weather patterns over and near the United States. GOES satellites provide both visible-light andinfrared images of cloud patterns, as well as “soundings,” or indirect measurements, of the temperature andhumidity throughout the atmosphere. These data are essential for the operations of the National WeatherService-such data provide advance warning of emerging severe weather, as well as storm monitoring. Thevantage point of GOES satellites allows for the observation of large-scale weather events, which is required forforecasting small-scale events. Data from GOES satellites may be received for free directly from the satellite byindividuals or organizations possessing a relatively inexpensive receiver.
In order to supply complete coverage of the continental United States, Alaska, and Hawaii, the GOESgeostationary satellite program requires two satellites, one nominally placed at 75° west longitude and one at 135°west longitude. The first SMS/GOES was placed in orbit in 1974. However, from 1984-1987 and from 1989 to thepresent time, as a result of sensor failures and a lackof replacements, only one GOES satellite has been availableto provide coverage. GOES-7 is currently located at 1120 west longitude, which provides important coverage forthe eastern and central United States. Unfortunately, this single satellite is nearing the end of its “design life” andcould fail at anytime, leaving the United States with no GOES satellite in orbit. The United States has borroweda Meteosat satellite from Europe to cover the East Coast and serve as a backup should GOES-7 fail. Meteosat-3is now positioned at 75° west longitude.SOURCE: National Oceanic and Atmosphere Administration and Office of Technology Assessment, 1993.
By closing these data gaps, scientists hope to NOAA’s OPERATIONAL ENVIRONMENTALunderstand the forces that affect Earth’s weather SATELLITE PROGRAMSand determine its climate. They also hope todifferentiate natural variability from anthropo-genic changes in weather and climate.
Satellite sensors offer wide, repeatable cov-erage, long-term service, and the ability to moni-tor several aspects of weather and climate simul-taneously. Data from satellites contribute to bothshort- and long-term weather prediction andmodeling and enhance public safety. In the shortrun, images of weather systems, obtained pri-marily from satellites in geosynchronous orbit,allow forecasters to predict the probable paths ofsevere storms. Data collected by polar orbitingsatellites concerning the atmosphere, land, andoceans, are invaluable for understanding andmodeling atmospheric temperature, humidity,wind, and the extent and condition of globalvegetation (plate 3).
As noted earlier, NOAA operates two satellitesystems to gather data concerning weather andclimate in order to support the national economyand promote public safety.
The GOES SystemTo provide complete U.S. coverage, NOAA
normally maintains two GOES satellites in orbit(box 3-A). However, difficulties experienced inconstructing the next series of GOES satellites,GOES-Next, and the lack of a backup for thecurrent series, have left the United States depend-ent on a single satellite, GOES-7, the last in thecurrent series. To maintain critical weather obser-vations over the United States, NOAA has signedan agreement with ESA and Eumetsat (box 3-B),the European Organisation for the Exploitation ofMeteorological Satellites,l to lend the United
1 Eumetsat is an intergovernmental organization that operates meteorological satellites. Its satellite systems were developed and built bythe European Space Ageney.

Chapter 3-Weather and Climate Observations |35
Box 3-B—ESA and Eumetsat
The European Space Agency (ESA), a consortium of 13 member states,l has been in existence since 1975.ESA has developed and launched weather satellites and Earth remote sensing satellites. ESA has developed twoexperimental Meteosat spacecraft and an operational series of Meteosats. It is the primary agency responsiblefor developing remote sensing spacecraft in Europe and plays a major role in coordinating European remotesensing efforts. ESA develops and operates weather monitoring satellites on behalf of the European Organisationfor the Exploitation of Meteorological Satellites (Eumetsat).2 Eumetsat is an intergovernmental organization,established by an international convention that states its primary objective:
. . . to establish, maintain and exploit European systems of operational meteorological satellites,taking into account as far as possible the recommendations of the World MeteorologicalOrganization. 3
Some of the same issues that confront NASA and NOAA challenge ESA and Eumetsat. For example,Eumetsat has struggled to clarify its mission with regard to weather forecasting and research. ESA has recentiydecided to split its payloads between two different copies of a modular polar orbiting spacecraft, one in 1998 forscientific research and a second in 2000 for weather forecasting. Eumetsat heralds this decision, which hasextended the organization’s mission to environmental research, as leading to a dearer distinction betweenenvironmental experimentation and operational meteorology.4
1 Austria, Be/gjljm, ~nrnark, Germany, France, Ireland, Italy, The Netherlands, No~ayt SPain, Sw*mSwitzerland, and the United Kingdom; Canada and Finland are associate members.
2 Eumetsat has 16 members, including Finland, Greece, Portugal, Turkey, and the ESA ~mbrs excludingAustria.
3 EUMETSAT ~nvention, Arti~le 2, 1986.
4“Eumetsat Likes Idea of Separate Polar Satellites,” Space News, June 22, 1992, p. 23,
SOURCE: Office of Technology Assessment, 1993.
States Meteosat-3 to supplement observationsfrom GOES-7 and to stand in should GOES-7 fail(figure 3-l). This arrangement illustrates the highlevel of international cooperation in meteorologi-cal remote sensing, which is carried out in otherareas as well. Because weather patterns moveacross national boundaries, international co-operation has been an important component inthe collection of weather data. Governmentsneed to cooperate with each other in order tofollow weather patterns that transcend na-tional boundaries.
GOES-7 is currently operating well, but it andMeteosat-3 are about one year past their designlives. The first satellite in the series of GOES-Next satellites is scheduled for launch in spring1994 (figure 3-2). The follow-on GOES-Nextsatellite has been plagued by technical and
programmatic setbacks that, until the sumrner of1992, led to major schedule slips and large costoverruns. Changes in management have resultedin controlled costs and good schedule success.However, until GOES-Next has been successfullylaunched and placed in operation, the UnitedStates faces the risk of losing weather informationnow provided by geosynchronous satellites.
During the early 1980s, in an effort to improvethe satellite data available to the National WeatherService, NOAA funded and NASA developednew, more complex sensor and satellite designsfor the GOES series. NOAA termed the newsatellite series GOES-Next. GOES-Next willretain the existing visible imaging but also willprovide higher resolution infrared imagery toenhance the prediction and monitoring of severeweather. A separate, continuously operating im-

36 I Remote Sensing From Space
Figure 3-1-Meteosat-3 Images of Earth
These images were made before and after ESA moved Meteosat-3 westward from its earlier position near 500 west longitude toits current position at 75o west longitude. Meteosat 3, launched in 1988, served as Europe’s operational satellite until June 1989,when it was placed in on-orbit storage. In August 1991 ESA reactivated the satellite and moved it from 00 west to 5@ west tosupplement the U.S. GOES system. Beginning January 27, 1993, ESA moved the satellite 1° per day until it reached 75°, wherethe second image was taken.SOURCE: National Oceanic Atmospheric Administration, European Space Agency, Eumetsat.
proved atmospheric sounder2 should allow foruninterrupted data on the atmosphere, contribut-ing to improved storm prediction.
NOAA and NASA have a history of more than30 years of cooperation on environmental satel-lites. NASA developed the frost TIROS polarorbiting satellite in 1960, and in 1974 it launchedSMS-GOES, the precursor to NOAA’s GOESsystem. Generally NOAA has relied on NASA tofund and develop new sensors, several of whichNOAA adopted for its environmental satellites. A1973 agreement between NASA and NOAAresulted in the Operational Satellite ImprovementProgram (OSIP) within NASA, which providedfunding at the rate of some $15 million per yearto support development of new sensors and othertechnologies to improve NOAA’s operational
satellites. In the 1970s, highly successful coopera-tion between NASA and NOAA resulted in thedevelopment of several sensors, including theAdvanced Very High Resolution Radiometer(AVHRR) and the Total Ozone Mapping Spec-trometer (TOMS).3 During the early 1980s, in anattempt to cut its spending on satellite develop-ment, NASA eliminated spending on OSIP,leaving NOAA to fund development of GOES-Next, using NASA as the procurement agency.Problems with program management, unexpectedtechnological challenges, and overly optimisticbids accepted from contractors have caused thedevelopment of GOES-Next to exceed its originalestimated costs by over 150 percent (box 3-C).4 IfCongress wishes NASA to continue to engagein research and development for NOAA’s
2 A ‘‘sounder” is a sensor that provides data leading to estimates of temperature throughout the atmosphere.3 A~ and TOMS provide important data on weather, climate, and global change research. See Box 1-G below for descriptions of these
sensors.
d Including launch costs, the GAO has calculated that the GOE!S-Next progrw including development and construction of five satellites,will cost almost $1.8 billiou compared to its original estimate of $691 million.
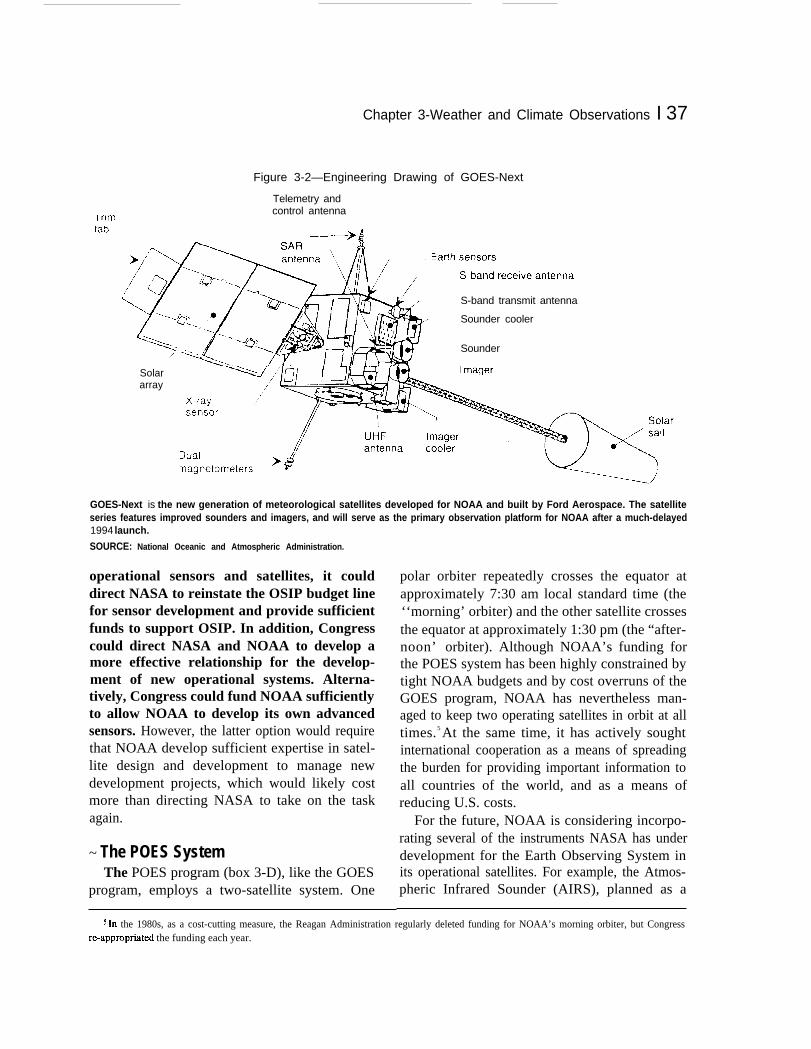
Chapter 3-Weather and Climate Observations I 37
Figure 3-2—Engineering Drawing of GOES-Next
Solararray
Telemetry andcontrol antenna
S-band transmit antenna
Sounder cooler
Sounder
Imager
GOES-Next is the new generation of meteorological satellites developed for NOAA and built by Ford Aerospace. The satelliteseries features improved sounders and imagers, and will serve as the primary observation platform for NOAA after a much-delayed1994 launch.
SOURCE: National Oceanic and Atmospheric Administration.
operational sensors and satellites, it coulddirect NASA to reinstate the OSIP budget linefor sensor development and provide sufficientfunds to support OSIP. In addition, Congresscould direct NASA and NOAA to develop amore effective relationship for the develop-ment of new operational systems. Alterna-tively, Congress could fund NOAA sufficientlyto allow NOAA to develop its own advancedsensors. However, the latter option would requirethat NOAA develop sufficient expertise in satel-lite design and development to manage newdevelopment projects, which would likely costmore than directing NASA to take on the taskagain.
~ The POES SystemThe POES program (box 3-D), like the GOES
program, employs a two-satellite system. One
polar orbiter repeatedly crosses the equator atapproximately 7:30 am local standard time (the‘‘morning’ orbiter) and the other satellite crossesthe equator at approximately 1:30 pm (the “after-noon’ orbiter). Although NOAA’s funding forthe POES system has been highly constrained bytight NOAA budgets and by cost overruns of theGOES program, NOAA has nevertheless man-aged to keep two operating satellites in orbit at alltimes. 5 At the same time, it has actively soughtinternational cooperation as a means of spreadingthe burden for providing important information toall countries of the world, and as a means ofreducing U.S. costs.
For the future, NOAA is considering incorpo-rating several of the instruments NASA has underdevelopment for the Earth Observing System inits operational satellites. For example, the Atmos-pheric Infrared Sounder (AIRS), planned as a
s Ln the 1980s, as a cost-cutting measure, the Reagan Administration regularly deleted funding for NOAA’s morning orbiter, but Congressre-appropriated the funding each year.

38 | Remote Sensing From Space
I
high-resolution instrument that will provide tem- and the data they provide in order to transfer them
Box 3-C Lessons learned From the GOES Experience
The GOES system has been widely praised for its abilities to track both slow moving weather fronts andrapidly developing violent storms. GOES is credited with saving many lives since the first satellite was launchedin 1975. For example, GOES images have contributed to improved early warning of violent storms, resulting ina global 50 percent decrease in storm-related deaths. Yet the development of the GOES follow-on, calledGOES-Next, has met anything but calm weather. GOES-Next has been beset by management and technicalproblems that have resulted in a large cost overrun.1
NASA and NOAA have a long history of cooperation in developing spacecraft. An agreement between thetwo agencies, originaily signed in 1973, gives the Department of Commerce and NOAA responsibility for operatingthe environmental systems and requires NASA to fund development of new systems, and fund and manageresearch satellites. This NASA line item is known as the Operational Satellite Improvement Program, and wasusually funded at an average level of about $15 million per year.2 Prior to initiating GOES-Next development, thisdivision of labor seemed to work well. NASA had developed the TIROS and Nimbus research satellites, which carryinstruments that were eventually transferred to NOAA operational satellite systems. NASA and NOAA budgets andorganizational structure were based to an extent on the agreed-upon division of responsibility.
NASA and NOAA cooperation became less effective over time. During the transition to the ReaganAdministration in 1981, NASA faced cost overruns with ongoing programs and began to spend more of theavailable resources, including the line item that was used for NOAA development, on the Space Shuttle. Inaddition, the Reagan Administration was slow to appoint senior agency management in NASA. As internalpressures mounted, NASA decided not to fund development of NOAA operational sensors and spacecraft. With
the concurrence of the Office of Management and Budget, NASA eliminated the budget line used to funddevelopment of new sensors for NOAA systems.
The GOES satellites operating at the time had life expectancies that would carry the program through thelate 1980s. NOM decided to build a GOES follow-on by 1989 that included a major design change. The systemrequirements led to a very sophisticated design. NOAA wanted to improve the sensor’s visible and infraredresolution and to operate the sounder simultaneously with the imager. In responding to a GAO investigation of theGOES program, NASA officials agreed that NOAA’s requirements would be hard to meet.3 In an effort to shave
1 G~~~fi ~s O@i~IIy w at a~~ $&O million; estimat~ tot~ costs are now over $1.7 biiiion, including
iaunch costs, which shouid average neady $100 miiiion per iaunoh.
2 TMS figure was significantly higher durfng the eaffy 1970s.
3 U . S . - A c c o @ ~ n g ~ ~ , ‘ ~ a t ~ ~ t e l i i t ~ : A c t h - t o R ~ w ~ a t w o f t ~ U.S. eatio~ry
Sateilite Program,” Report to the Chairman, Committee on science, Spaoe, and Technology, House of Representatives,July 1991.
perature and humidity profiles through clouds, to operational use. NASA will also have to takewould be a candidate for use on future NOAA into account the instrumental characteristics neces-satellites. 6 However, NOAA will have to gain sary for developing an operational sensor. NOAAextensive experience with the NASA instruments is also investigating other new instruments to
6 AIRS will measure outgoing radiation and be able to determine land surface temperature. In addition+ the sounder will be capable ofdeterrninin g cloud top height and effective cloud amount+ as well as perform some ozone monitoring.

Chapter 3-Weather and Climate Observations |39
costs, NOAA eliminated the Phase B engineering review, an evacuation of satellite design and design changes.4
What was not clear to NOAA program managers at the time was how great a departure from the original designwas required. NOAA was confronted with the following in deciding how to replace the GOES-D satellite:
● NASA established a policy that future NOAA satellites should be designed to be launched by the Shuttle.The existing GOES design, optimized for launch on an expendable launch vehicle, was not. NASA’s policywas subsequently revised after the Challenger disaster in 1986, but the new design (GOES-Next) hadalready been locked in.
. Several of the early GOES satellites had not demonstrated adequate reliability, failing earlier thanexpected. This forced a decision to advance the procurement schedule.5
. Since NOAA was traditionally an operational entity, it had little hope of receiving approval for satellite R&Dfunding, yet was pressed to proceed with a follow-on NASA procurement.
● Satellite manufacturers, though aware of the problems with the original GOES design, stated that providingsimultaneous imaging and sounding could be incorporated with only modest risk. NOAA and NASAmanagers were skeptical of these claims, but they also needed to proceed quickly with the new design.
. A detailed interim engineering review for the GOES-Next plan was canceled for budget reasons. Thisreview might have revealed some of the problems contained in the original design.6
These factors complicated the decision to proceed with the improvement to GOES, which became knownas GOES-Next. The design change dictated by launch capabilities was unavoidable, given NASA’s launch policy.NOAA proceeded with an ambitious effort that camouflaged some of the risk involved with developing GOES-Next.Nothing in the history of either of the contractors involved (Ford Aerospace7 and ITT) indicated they were less thanqualified for the task.
The experience with GOES-Next highlights the problems of interagency cooperation within the U.S.government. When NASA stopped funding development of operational satellites, agency responsibilities were nolonger dear. Funding authority for development of future operational satellites needs to be clarified.
4 Eric J. krner, “Goes-Next Goes Astray,” Aeruspace AIWMXL May 1992*
5 The ea~y GOES satellites (D-H) were plagued with the same pd)fem-a Small component that was essentialto determining the direotion of the field of view of the VAS sensor prematurely failed. The problem was eventuallyovercome, but not before NOAA was faced with an earty replacement for two of its operational satellites.
6 krner, op. cit., footnote Is.
7 NOW part of kral Corporation.SOURCE: Office of Technology Assessment, 1993.
improve the quality of its POES data collection.7
Over the years, NOAA has established an enormousbase of international data “customers” whodepend on the delivery of data of consistentstandards and familiar formats. It therefore care-fully considers any changes to the format andeschews technical or financial risks to its opera-tions.
The United States historically has transmitteddata form the polar metsats at no cost to thousandsof U.S. and international users, who collect datausing inexpensive Automatic Picture Transmis-sion (APT) recorders or High Resolution PictureTransmission (HRPT) recorders as the satellitepasses over. Some 120 governments and thou-sands of other users around the world benefit from
7 For example, NOAA and Eumetsat are supporting research on the Interferometer Temperature Sounder (ITS) by the University ofWisconsin and Hughes Santa Barbara Research.

40 | Remote Sensing From Space
Box 3-D-NOAA’s Polar-Orbiting Operational Environmental Satellite System
The POES satellites follow orbits that pass dose to the north and south poles as Earth rotates beneath them.They orbit at about 840 kilometers altitude, providing continuous, global coverage of the state of Earth’satmosphere, including essential parameters such as atmospheric temperature, humidity, cloud cover, ozoneconcentration, and Earth’s energy budget, as well as important surface data such as sea ice and sea surfacetemperature, and snow and ice coverage. All current and near-future POES satellites carry five primaryinstruments:
1,
2.
3.
4.
5.
The Advanced Very High Resolution Radiornefer/2 (AVHRR/2) determines aloud cover and Earth’ssurface temperature. This scanning radiometer uses five detectors to create surface images in fivespectral bands, allowing multispectral analysis of vegetation, clouds, lakes, shorelines, snow, and ice.
The High Resolution Infrared Radiation Sounder (HIRS/2). HIRS/2 measures energy emitted by theatmosphere in 19 spectral bands in the infrared region of the spectrum, and 1 spectral band at the far redend of the visible spectrum. HIRS data are used to estimate temperature in a vertical column of theatmosphere to 40 km above the surface. Data from this instrument can also be used to estimate pressure,water vapor, precipitable water, and ozone in a vertical column of the atmosphere.The Microwave Sounding Unit (MSU) detects energy in the troposphere in four areas of the microwaveregion of the spectrum. These data are used to estimate atmospheric temperature in a vertical column upto 100 km high. Because MSU data are not seriously affected by clouds, they are used in conjunction withHIRS/2 to remove measurement ambiguity when clouds are present.The Space Environment Monitor (SEM) is a multichannel charged-particle spectrometer that measuresthe flux density, energy spectrum, and total energy deposition of solar protons, alpha particles, andelectrons. These data provide estimates of the energy deposited by solar particles in the upperatmosphere, and a “solar warning system” on the influence of solar fluctuations on the Earth system.The ARGOS Data Collection System (DCS) consists of approximately 2,000 platforms (buoys,free-floating balloons, remote weather stations, and even animal collars) that transmit temperature,pressure, and altitude data to the POES satellite. The onboard DCS instrument tracks the frequency andtiming of each incoming signal, and retransmits these data to a central processing facility. The system isable to determine transmitter location rather accurately.
Other instruments do not fly on every POES mission. Instruments in this category include:
The Stratospheric Sounding Unit (SSU), a three channel instrument, has flown on all NOAA POES satellites
except for NOAA-1 2. It measures the intensity of electromagnetic radiation emitted from carbon dioxide atthe top of the atmosphere, providing scientists with the necessary data to estimate temperatures through thestratosphere. The SSU is used in conjunction with HIRS/2 and MSU as part of the TIROS Operational VerticalSounder System.
The Solar Backscatter Ultraviolet Radiometer/2 (SBUV/2) measures concentrations of ozone at variouslevels in the atmosphere, and total ozone concentration. This is achieved by measuring the spectral radianceof solar ultraviolet radiation “backscattered” from the ozone absorption band in the atmosphere, while alsomeasuring the direct solar spectral irradiance. The SBUV is flown on POES PM orbiters only.
The Search and Rescue Satellite Aided TrackingSystern (SARSATorS&R)kxates signals from emergencylocation transponders onboard ships and aircraft in distress, and relays these data to ground receivingstations, which analyze them and transmit information to rescue teams in the area.

Chapter 3-Weather and Climate Observations |41
The Earth Radiation Budget Experiment (ERBE) was flown only on NOAA-9 and NOAA-10. This researchinstrument consists of a medium and wide field-of-view nonscanning radiometer, operating in four channelsthat view the Earth and one channel that views the sun, and a narrow field-of-view scanning radiometer withthree channels that scan the Earth from horizon to horizon. ERBE measures the monthly average radiationbudget on regional to global scales, and determines the average daily variations in the radiation budget.
NOAA currently has four POES satellites in orbit. NOAA-11 and NOAA-12, launched in September 1988 andMay 1991, respectively, are operational, while NOAA-9 and NOAA-10, launched in 1984 and 1986, are essentiallyin a stand-by mode. However, the ERBE instrument on NOAA-9 continues to return limited data on the Earth’sradiation budget, and the SBUV/2 instrument on NOAA-10 continues to return useful information on ozoneconcentration in the atmosphere. NOAA plans to upgrade several of the POES instruments in the near future. TheSSU and MSU will be replaced with the Advanced Microwave Sounding Units (aboard NOAA K-M), AVHRR willgain an additional channel, and the ARGOS system will have expanded capacity. NOAA is planning additionalimprovements (in the latter part of the 1990s) to AVHRR, HIRS, and AMSU and expects to add a Total OzoneMapping Spectrometer (TOMS) to the platform.NOTE: The SSU is contributed by the United Kingdom; ARGOS is a contribution of the Freneh Space Ageney CNES; and the SARSATinstrument is a joint project of Canada and France.
SOURCE: Office of Technology Assessment, 1993.
this service.8 In return, through the World Mete- data on the European METOP polar platform.orological Organization,9 many of these usersprovide the United States with local ground-basedand radiosondel0
” data, which are essential tounderstanding large-scale weather patterns andclimate. Some countries contribute directly toU.S. programs by supplying satellite instruments.Over the last few years, France has supplied theARGOS onboard data collection receiver, and,with Canada, the SARSAT location system forthe POES satellites; the United Kingdom hassupplied the SSU.
Negotiations are currently underway betweenNOAA, representing the United States, and ESAand Eumetsat for Europe to assume responsibilityfor morning-crossing operational meteorological
originally, Europe had planned to fly a large polarorbiting platform called POEM (Polar Orbit EarthObservation Mission), planned for launch in1998. It would have included both researchinstruments and operational monitoring instru-ments. However, in order to reduce technical andfinancial risk, ESA and Eumetsat decided in late1992 to split up the platform and place theoperational and climate monitoring instrumentson the Eumetsat METOP platform and the upperatmosphere, ocean, and ice research instrumentson the ENVISAT platform.11 The United Stateswill also fly an improved AVHRR and anAdvanced Microwave Sounding Unit (AMSU)on METOP- 1, which is planned for launch in
s The reception and analysis of data from these and the GOES satellites have become important instructional tools in schools throughoutthe world.
9 See U.S. Congress, Office of Technology Assessment, OTA-ISC-239, International Cooperation and Competition in Ci\Di!ian SpaceActi}’ities (Washington, DC: U.S. Government Printing Office, 1985), ch. 3.
10 ks~en~ ctied by satellites or weather balloons that measure and transmit temperature, hufdity and press~e *ta.
11 me ~nutes of he ESA Mifi~t~ium of November, 1992, s~te:
(1) the Envisat-1 mission planned for launch in 1998, which will be mainly dedicated to understanding and monitoring the environmentand to providing radar data as a continuation of the data provided by ERS 2.
(2) the Metop-1 mission planned for launch in2000, which will provide operational meteorological observations to be carried out takinginto account the requirements expressed by the Eumetsat Council and in accordance with the terms of an Agreement to be concludedwith Eumetsat.

42 | Remote Sensing From Space
Box 3-E-DoD’s Defense Meteorological Satellite Program
Since the mid 1960s, the Defense Meteorological Satellite Program (DMSP) has provided militarycommanders with accurate and up-to-date weather information. It began after DoD argued for a satellite to providereliable and unique weather data in support of U.S. troops involved in exercises or stationed in remote locationsthat lack other sources of weather information.
Each current DMSP block 5D-2 satellite flies in a polar orbit at an altitude of 632 km (530 miles), and viewsthe entire globe twice per day. The satellites use optical and infrared sensors, which cover aground swath of justunder 3,000 km:
The Operational Linescan System (OLS), a visible and infrared imager that monitors aloud cover,has three spectral bands. OLS operates at high spatial resolution (.6km) about 25 percent of the time.
TheMiicrowave Imager(a radiometer used for determining soil moisture, precipitation, and ice cover)has four channels, and a spatial resolution of 25-50 km.
The Microwave Temperature Sounder, used for vertical temperature sensing, has seven channels.
The Microwave Water Vapor Sounder, used for determining humidity through the atmosphere, hasfive channels and spatial resolution between 40 and 120 km.
The satellites are capable of storing up to 2 days’ worth of data before downloading to ground stations locatedat Fairchild AFB, Washington, and Kaena Point, Hawaii. There are currently two of the block 5D-2 satellites inoperation, and anew block upgrade is currently in development. The bus, the structural element of the satellitethat carries and powers the sensors, is similar to the bus used for the TIROS satellites.
Since 1975, the Navy, Air Force, and NOM have coordinated data processing efforts and exchangedmeteorological data through a shared processing network. Each of the processing centers has a particularexpertise: NOM for atmospheric soundings; Navy for sea surface measurements and altimetry; and Air Force forvisible and infrared mapped imagery and aloud imagery. The focus on each area of expertise is designed to limitduplication and ensure cooperation. NOAA’s National Environmental Satellite, Data, and Information Servicearchives the data processed by all three organizations.SOURCE: U.S. Department of Defense, 1993.
2000. This will reduce U.S. costs of providing The program will include some moderate en-data from the second polar orbiter, which is animportant first step in saving U.S. costs for theentire polar satellite system. It may also enablethe United States and Europe to provide moreaccurate coverage of weather and climate.
In the early part of the next century, Europeplans to provide nearly half of the polar-orbiterprogram. NOAA expects the cooperative polarmetsat program to lead to nearly identical U.S.and European instruments, spacecraft, instrumentinterfaces, standard communication procedures,and data transmission standards. This is essentialto reduce problems of integrating instruments andto assure that international partners can use eachother’s data with a minimum of complication.
hancement of instrument capabilities and theaddition of a TOMS to maintain the capability tomonitor atmospheric ozone.
This cooperative structure should enable theUnited States and Europe to supply polar orbiterdata to the rest of the world. Eventually the twopartners might wish to embark on a broadercooperative effort including other countries, whichwould reduce U.S. and European costs and givegreater likelihood to a widely accepted interna-tional data standard. For example, Russia oper-ates a polar-orbiting meteorological satellite,Meteor-3, which already carries a TOMS instru-ment supplied by NOAA. Both the United Statesand Russia would likely benefit from closer

Chapter 3-Weather and Climate Observations |43
cooperation on Earth observation satellite sys-tems.
A more broadly based organization, includingfor example, Russia, China, and India, could alsolead to a more capable system of polar orbiters. Asnoted earlier, the United States and other spacefar-ing nations have organized the Committee onEarth Observations from Space (CEOS) in orderto encourage development of complementary andcompatible Earth observation systems (and data),and to address issues of common interest acrossthe spectrum of Earth observation satellite mis-sions.12 Chapter 8, International Cooperation and
Competition, discusses these and other coopera-tive arrangements in more detail.
DEFENSE METEOROLOGICAL SATELLITEPROGRAM
DoD maintains an independent meteorologicalsystem, the Defense Meteorological SatelliteProgram (DMSP), managed by the Air ForceSpace Command (box 3-E). DMSP (figure 3-3)uses a satellite platform very similar to the NOAAPOES platform and operates in near-polar orbit,but carries somewhat different instruments. Amongother data, DMSP provides visible and infraredground images, measurements of soil and atmos-pheric temperature and moisture content, locationand intensity of aurora (for radar and communica-tions), and measurements of sea state and windfields for naval operations. The military also usesthree-dimensional cloud data from DMSP incomputer models used in operational planning.The phenomena observed by DMSP are similar tothose of interest to civilian weather forecasters,but several of the data requirements, such as windspeed at the oceans’ surface, are of crucial interestto the military.
Figure 3-3-Artist’s Rendition of the DefenseMeteorological Satellite, DMSP Block 5D-2
DMSP, operated by the Air Force, gathers meteorological datafor military and civilian use. The military services and NOAAoperate a joint data center to coordinate data processing anddistribution.SOURCE: U.S. Department of Defense.
Are two polar-orbiting satellite systems re-quired? Critics of the policy of maintainingseparate polar-orbiting systems argue that theUnited States cannot afford both systems.13 DoDand NOAA counter that each satellite systemserves a unique mission. The NOAA satellitesroutinely provide data to thousands of U.S. andinternational users. DMSP serves a variety ofspecialized military needs and provides valuablemicrowave data to the civilian community. Forexample, often the United States has troopsinvolved in exercises or stationed in remotelocations that would not have other sources ofweather information. DoD and NOAA regularlyexchange meteorological data. NOAA benefitsfrom DMSP data, and DoD also routinely usesdata from NOAA. Yet DoD’s needs for bothtraining and operations can be unique. DoD
12 Committm on Earth Observations Satellites, The Relet’ance of Satellite Missions to the Study of the Global Environment, ~CEDConference, Rio de Janeiro, 1992, p 2.
13 ~ 1987 the Gener~ Accounting Office released a study arguing that the United States could achieve savings by eliminating duplicationof environmental satellite systems. See L1. S. Congress, General Accounlmg Office, NSIAD 87-107, ‘ ‘U.S. Weather Satellites: AchievingEconomies of Scale’ {Washington, DC: U.S. Government Printing Office, 1987).

44 | Remote Sensing From Space
requires a reliable source for global weatherforecasting, a function it argues is not duplicatedwithin NOAA. Military analysts fear that civiliansatellite systems, which are not under DoDcontrol, would be unable to deliver crucialweather information to their users in time. DoDalso wants to have a domestic data sourceinsulated from international politics because datafrom another country’s satellites might not al-ways be made available. Finally, differences inthe priorities of instruments result in differingreplacement criteria for satellites when an instru-ment fails. For NOAA the sounder on its POEShas the greatest priority. The DMSP imager holdsthe highest priority for the DoD. For thesereasons, DoD claims a distinct need for its ownmeteorological system.
Congress may wish to revisit the question ofthe possible consolidation of DMSP and theNOAA polar orbiting system as it searches forways to reduce the Federal deficit. Such a studyshould include a detailed analysis of the benefitsand drawbacks of consolidating civilian andmilitary sensor packages in one system, and theability of a combined system to serve militaryneeds in time of crisis. It should also look forinnovative ways for NOAA and DoD to continueto work in partnership to carry out the missions ofboth agencies.
NON-U.S. ENVIRONMENTALSATELLITE SYSTEMS
I ESA/Eumetsat MeteosatThe first European Meteosat satellite was
launched by ESA in 1977. Eumetsat took overoverall responsibility for the Meteosat systemfrom ESA in January 1987. The first spacecraft ofthe Meteosat Operational Programme (MOP-1)was launched in March 1989. MOP-3 is nowbeing prepared for launch in late 1993. It has a
7-year design life. ESA has developed the MOPsatellites on behalf of Eumetsat.
The Meteosat/MOP spacecraft design, instru-mentation, and operation are similar to the currentU.S. NOAA GOES spacecraft. The spin-stabilized spacecraft carry:
1.
2.
a visible-infrared radiometer to providehigh-quality day/night cloud cover data andto collect radiance temperatures of theEarth’s atmosphere; anda meteorological data collection system todisseminate image data to user stations, tocollect data from various Earth-based plat-forms and to relay data from polar-orbitingsatellites.
Meteosat spacecraft are in position to survey thewhole of Europe, as well as Africa, the MiddleEast, and the Atlantic Ocean. They relay imagesand data to a Meteosat Operations Control Centrewithin ESA’S Space Operations Control Centre inDarmstadt, Germany. A Meteorological Informa-tion Extraction Centre, located within the Me-teosat control center, distributes the satellite datato various users.
| Japanese Geostationary MeteorologicalSatellite
The Japanese space agency, NASDA, devel-oped the Geostationary Meteorological Satellites1-4, which were launched in 1977, 1981, 1984,and 1989. GMS-5 is projected for a 1995launch.14 The GMS satellites are manufactured byHughes Space and Communications Group andthe Japanese corporation NEC, and draw heavilyon Hughes’ U.S. experiences with GOES. TheJapan Meteorological Agency operates the thirdand fourth satellites, collecting data from thesystems’ radiometers (visible and infrared sen-sors), and space environment monitors.
14 GMS.S is Cmendy in storage at Hughes Space and Communications Group, awaiting an H-II launch vehicle, which is still under
development.

Chapter 3—Weather and Climate Observations |45
| Commonwealth of Independent StatesThe former Soviet Union assembled an inte-
grated network of meteorological, land, andocean sensing systems that have served a widevariety of military and civilian purposes. Nowessentially controlled by the Russian Republic,these satellites represent one of the most capablearray of remote sensing systems deployed in theworld. The CIS operates eight different spaceplatforms (including the Mir space station) thatprovide remotely sensed data.ls
The CIS Meteor environmental satellite systemconsists of two or more polar orbiters, each of
which lasts only a relatively short time in orbit.Each Meteor satellite provides data roughlysimilar to the NOAA POES satellites. Meteorsatellites carry both visible-light and infraredradiometers, and an instrument for monitoring theflux of high energy radiation from space. Datafrom these instruments lead to information aboutthe global distribution of clouds and snow and icecover, global radiation temperature of the surface,cloud-top heights, and vertical distribution oftemperature. The data can be received around theworld by the same APT stations that receive datafrom the U.S. polar orbiters.
15 See Nichol~ L. JohnsoL The Soviet Year in Space 1990 (Colorado Springs, CO: Teledyne Brow-n tigheem, 1991), PP. 59-70.

SurfaceRemoteSensing 4
B alloons, aircraft, rockets, and spacecraft have all beenused successfully to acquire images and other data aboutEarth’s surface. The earliest data were gathered morethan 100 years ago by photographic cameras mounted on
balloons. The advent of the airplane made possible aerialphotography and the accumulation of historic archives ofpanchromatic (black and white) photographs to documentsurface features and their changes. Eventually, experimentersdiscovered that images acquired in several different regions ofthe electromagnetic spectrum yielded additional valuable infor-mation about surface features, including likely mineral or oil andgas-bearing deposits, or the health of crops. The Department ofAgriculture, for example, has routinely used infrared photogra-phy to monitor the extent of planted fields and the conditions ofcrops, because, compared to many other surface features,vegetation reflects infrared radiation strongly. Airborne micro-wave radar has demonstrated its utility for piercing clouds, andfor detecting the shape and condition of the soil beneathvegetation.
The ability to transmit images of Earth via radio waves madethe use of satellites for remote sensing Earth practical. Theseimages, acquired by electro-optical sensors that convert light toelectronic signals,l can be transmitted to Earth as the satellitepasses over a ground station or they can be stored for laterbroadcast. Placing remote sensing satellites in a near-polar orbitat an altitude that allows them to pass over the equator at the same
I A video camera is one example of an instrument that employs an eledmoptica.1sensor.
47

48 | Remote Sensing From Space
time each day makes it possible to collect imagesof Earth’s surface with nearly the same viewingconditions from day to day,2 enabling users of thedata easily to compare images acquired ondifferent days. Multispectral sensors enable usersto acquire data on surface spectral characteristics.Other, non-polar orbits can be selected to maxi-mize the accumulation of data over certainlatitudes. For example, scientists who designedTOPEX/Poseidon, a scientific satellite designedto collect topographic data on the oceans, chosea mid-latitude orbit, optimizing the orbit to travelabove the world’s oceans, and allowing thesatellite to monitor the effects of tidal changes onocean topography.
THE LANDSAT PROGRAMNASA initiated the Landsat program in the late
1960s as an experimental research program toinvestigate the utility of acquiring multispectral,moderate resolution data about Earth’s surface(plate 4). Since then the Landsat system hasevolved into a technically successful system thatroutinely supplies data of 30 meter (m) g-roundresolution in six spectral bands3 to users aroundthe world (box 4-A). A wide variety of govern-ment agencies at the local, State, and Federallevels, academia, and industry make use ofLandsat data.
From a programmatic standpoint, however, theLandsat program has proved much less successfuland has several times teetered on the brink ofextinction. As the experience of the past decadehas demonstrated, the utility of these data forserving both public and private needs has made itdifficult to arrive at policies for support of
Landsat that satisfy all interests well. After an8-year trial, Congress and other observers haveconcluded that the experiment to commercial-ize the Landsat system has met with onlylimited success.4
| Landsat 7As noted earlier, continuity in the delivery of
remotely sensed data, in many cases, is critical totheir effective use. Many Landsat data users havelong warned that a loss of continuity in thedelivery of data from the Landsat satellites wouldseverely threaten their usefulness. Timely andcontinuous data delivery are important for globalchange research, but apply equally well to otherprojects, including those designed to use Landsatdata for managing natural resources in regionsthat lack other sources of data, or for urbanplanning. Landsat data are extremely importantfor detecting change in the conditions of forests,range, and croplands over local, regional, andglobal scales. They can also be used for monitor-ing changes in hydrologic patterns. Hence, conti-nuity in the delivery of data from Landsat is animportant component of environmental re-search and monitoring.
In 1992, agreeing that maintenance of datacontinuity was of crucial importance, members ofthe House and Senate introduced legislation (H.R.3614 and S. 2297) to establish a new land remotesensing policy. The Land Remote Sensing PolicyAct of 19925 transfers control of Landsat from theDepartment of Commerce to DoD and NASA, tobe managed jointly. According to the Adminis-tration Landsat Management Plan, DoD hasresponsibility for procuring Landsat 7, planned
2 The sun’s angle with respect to the surface varies somewhat throughout the year, depending on the sun’s apparent position with respectto the equator.
3 Band 6, the thermal band, senses data at a resolution of 120 meters.4 See U.S. Congress, OffIce of Technology Assessment Remotely Sensed Data From Space: Dism”butz”on, Pn”cing, and Applications
(Washington DC: OffIce of Technology Assessment July 1992), pp. 34. U.S. House of Representatives, report to accompany H.R. 3614, theLand Remote Sensing Policy Act of 1992, May 1992.
s H.R, 3614 WM pas5d by the House on June 9, 1992. After lengthy dehate, differences between the two bills were reSOkd h HR. 6613,
which was passed by the House in late September and by the Senate in early October. The Act was signed by President Bush on Oct. 29, 1992.

Chapter 4--Surface Remote Sensing |49
Box 4-A—The Landsat Program
The United States initiated the Landsat program in 1969 as a research activity. NASA launched Landsat 1in 1972.1 Data from the Landsat system soon proved capable of serving a wide variety of government and privatesector needs for spatial information about the land surface and coastal areas. NASA designed, built, and operatedLandsats 1-3. The perceived potential economic value of Landsat imagery led the Carter administration to considercommercial operation of the system and begin transferring control of Landsat operations and data distribution fromNASA to the private sector. The first step in the transition gave operational control of the Landsat system to NOAAin 1981, because of NOAA’s extensive experience in operating remote sensing satellites for weather and climateobservations. Landsat 4 was launched in 1982; Landsat 52 became operational in 1984.3
In late 1983, the Reagan administration took steps to speed transfer operation of Landsat 4 and 5 to privatehands because it did not want to continue public funding for the system. A few proponents of commercializationexpected that industry could soon build a sufficient data market to support a land remote sensing system.4 Soonthereafter, Congress began consideration of the Land Remote Sensing Commercialization Act of 1984, which wasintended to provide legislative authority for the transfer processs. Public Law 98-365 was signed into law on July17, 1984. During deliberations over the Landsat Act, the administration issued a request for proposal (RFP) forindustry to operate Landsat and any follow-on satellite system. After competitive bidding,5 NOAA transferredcontrol of operations and marketing of data to EOSAT in 1985.6 At present, EOSAT operates Landsats 4 and 5under contract to the Department of Commerce,7 and manages distribution and sales of data from Landsats 1-5.EOSAT will operate Landsat 6, which is scheduled for launch in the summer of 1993. The U.S. Government haspaid for the Landsat 6 satellite and the launch. EOSAT will operate the satellite at its expense.
Because of concerns over continuity of data collection and delivery, Congress passed the Land RemoteSensing Policy Act of 1992, which transfers control of the Landsat program from NOAA to DoD and NASA. Thislegislation effectively ends the experiment to privatize the Landsat program. The two agencies will procure andoperate Landsat 7.
1 Initially ~i[ed the Earth Resources Technology Satellite, NASA retroactively changed its name in 1975.
2 Landsats 4 and 5 were designed by NASA and built by GE and Hughes Santa Barbara Research @nter.3 see UCS. congress, congressional Research @rVice, me ~u~ufe Of ~~~ R@’note Sensing S~@//i~e SJ’SfWl
(Lax&t), 91-685 SPR (Washington, DC: The Library of Congress, Sept. 16, 1991) for a more complete account of theinstitutional history of Landsat,
4 )-lowever, most analysts were extremely pessimistic about such prospects. See U.S. Congress, congressionalBudget Office, Encouraging Private ktvesrment in Space Activities (Washington, DC: U.S. Government Printing Office,February 1991), oh. 3.
5 ~ven firms responded to the RFP, from which two were selected for further negotiation~OSAT andKodak/Fairchild. After a series of negotiations, during which the government changed the ground rules of the RFP, Kodakdropped out, leaving EOSAT to negotiate with the Department of Commerce.
6 EOSATwas established as a joint venture by RCA (now part of Martin Marfetta Astrospace) and Hughes Spa@and Communications Group (now part of General Motors) for this purpose.
7 Subsystems in both satellites have failed, but together they function as a nearfy complete satellite sYstem.EOSAT has taken great care to nurse these two satellites along, in order to maintain ccmtinuity of data delivery untilLandsat 6 is operational.SOURCE: U.S. Congress, Offica of Technology ksessment, Remotely Sensed Data from Space: Distribution, Pricing, and Applications(Washington, DC: Office of Technology Assessment, July ?992), pp. 2-3.

50 | Remote Sensing From Space
Figure 4-1-Landsat 6 Satellite, Showing the Enhanced Thematic Mapper (ETM)
Enhancedthematic ,
Orbit controlthrusters (4)
SOURCE: EOSAT, 1993.
for launch in late 1997. NASA will manageoperation of Landsat 7 and supervise data sales.6
The agencies will cooperate in developing specifi-cations for possible future Landsat systems and indeveloping new sensors and satellite technology.
Because data continuity is important to manyusers, program managers specified that Landsat 7should at a minimum duplicate the format andother characteristics of data from Landsat 6.Landsat 7 will therefore carry an EnhancedThematic Mapper (ETM) sensor very similar tothe one on Landsat 6 (figure 4- 1). NASA and DoDare currently designing an additional sensor forLandsat, called the High Resolution MultispectralStereo Imager (HRMSI), If funded, HRMSIwould greatly improve the ability of Landsat 7 togather data about Earth’s surface. As currentlyenvisioned, HRMSI would have much highersurface resolution than the ETM (5 m black and
white; 10 m in four visible and infrared bands),and would be capable of acquiring stereo images.7
Combined, these capabilities would allow theDefense Mapping Agency and the U.S. Geologi-cal Survey, among others, to use Landsat data increating multispectral topographic maps. In addi-tion, HRMSI would have the ability to acquiredata on either side of its surface track, allowingthe instrument to improve its revisit time fromLandsat’s current 16 days to only 3 days. Thiscapability would markedly increase the utility ofLandsat data for a variety of applications, such asdetection of military targets and agriculturalmonitoring, where timeliness is an importantfactor. If Congress wishes to improve theability of U.S. agencies to use remotely senseddata in carrying out their legislatively man-dated missions, it may wish to fund HRMSI ora sensor with similar capabilities.
b A Comercial entity may well be chosen to market Landsat data.7 Stereo images make possible the creation cf topographic maps.

Chapter 4-Surface Remote Sensing |51
NASA and DoD estimate that procuring andoperating Landsat 7 with only the ETM sensorthrough the end of its planned 5-year lifetime willcost about $880 million (in 1992 dollars )--$4lOfrom NASA and $470 from DoD, About $398million will be needed in the first few years topurchase the satellite with the ETM. An addi-tional $403 million will be needed between 1994and the projected end of Landsat 7’s useful life topurchase the HRMSI, enhance the ground systemto handle the increased data flow,8 and operate thesatellite. General Electric Corp. and HughesSanta Barbara Research Center, which builtLandsat 6 (table 4-l), were awarded the contractto build Landsat 7 (table 4-2).9
| Future Landsat SatellitesPlanning for a system to replace Landsat 7 after
it lives out its useful life is in the very early stages.Higher spatial resolution, a greater number ofspectral bands, and improved sensor calibra-tion are among the most important improve-ments sought for future Landsat satellites.However, timeliness of data delivery after dataacquisition and the revisit time of the satellite l0 ”also need improvement, especially for moni-toring short-term changes such as occur incrop and other renewable resource produc-tion.
If Landsat 7 proceeds as planned, scientistswill be able to experiment with the use ofhigh-resolution, stereo images in evaluating eco-logical change. However, the limited number ofspectral bands provided by Landsat 7 may inhibitdetailed ecological modeling of land processes.Given the importance of remotely sensed land
Table 4-l—Technical Characteristics of Landsat 6
Orbit and coverage:LandSat 6 will follow an orbit similar to that of Landsats 4
and 5:
Orbit Altitude: 705 kilometersType: Circular, sun synchronous, one orbit every 98.9 minutes
(about 14.5 per day)Equatorial crossing time: 9:45 amRepeat coverage at Equator 16 daysInclination: 98.21
Sensor package:Landsat 6 will carry a Thematic Mapper Sensor similar to
Landsats 4 and 5, but with improved calibration, and anadditional, higher resolution black and white (panchromatic)band.
Enhanced Thematic Mapper characteristics:● Panchromatic band, 15 meter ground resolution● Six (visible-infrared) multispectral bands, 30 meters
resolution● One thermal infrared band, 120 meters.
SOURCE: Earth Observation Satellite Co., 1992.
data to global change research (see chs. 5 and 6),NASA may wish to consider the potential forincorporating some of the enhanced spectralcapabilities of the proposed High ResolutionImaging Spectrometer (HIRIS)ll into the designfor a follow-on to Landsat 7. HIRIS designershave dealt with many of the design and opera-tional issues associated with hyperspectral capa-bilities and could significantly improve the de-sign of a successor to Landsat 7.
Recent technological developments, in, forexample, focal plane technology and active cryocool-ers, suggest that it may be possible to design,build, and operate a Landsat 8 that would be muchmore capable than Land sat 7. The Land RemoteSensing Policy Act of 1992 calls for a technologydevelopment program to fund new sensors and
g With the HRMSI sensor, Landsat 7 would have a maximum data transfer rate from the satellite to the ground station of about 300megabytes per second.
s Martin Marietta Astrospace, which recently purchased GE Astrospace, is now the prime contractor. Hughes Santa Barbara Research Centerbuilt the ETM for Landsat 6, will construct the ETM for Landsat 7. It would also develop HRMSI for Landsat 7. Although several aerospacecorporations expressed interes~ this tarn was the only bidder, in part because other companies felt they would not be competitive with the teamthat had built Landsat 6.
10 per~ps by doubling the number of satellites in orbit.
11 A high.r~~olution sensor that had been proposal for the EOS program, but recently CMICekd. see ch. 5: G~Ob~ ~ge Res~ch.
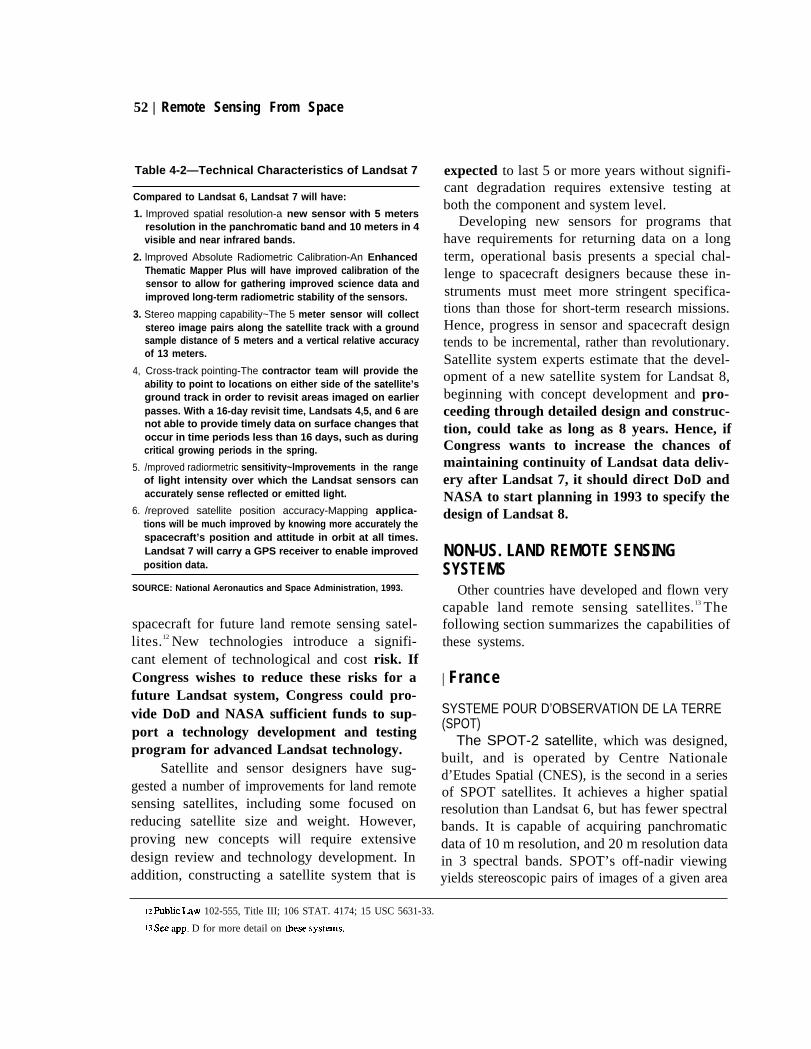
52 | Remote Sensing From Space
Table 4-2—Technical Characteristics of Landsat 7
Compared to Landsat 6, Landsat 7 will have:
1. Improved spatial resolution-a new sensor with 5 metersresolution in the panchromatic band and 10 meters in 4visible and near infrared bands.
2. lmproved Absolute Radiometric Calibration-An EnhancedThematic Mapper Plus will have improved calibration of thesensor to allow for gathering improved science data andimproved long-term radiometric stability of the sensors.
3. Stereo mapping capability~The 5 meter sensor will collect
4,
5.
6.
stereo image pairs along the satellite track with a groundsample distance of 5 meters and a vertical relative accuracyof 13 meters.
Cross-track pointing-The contractor team will provide theability to point to locations on either side of the satellite’sground track in order to revisit areas imaged on earlierpasses. With a 16-day revisit time, Landsats 4,5, and 6 arenot able to provide timely data on surface changes thatoccur in time periods less than 16 days, such as duringcritical growing periods in the spring.
/mproved radiormetric sensitivity~lmprovements in the rangeof light intensity over which the Landsat sensors canaccurately sense reflected or emitted light.
/reproved satellite position accuracy-Mapping applica-tions will be much improved by knowing more accurately thespacecraft’s position and attitude in orbit at all times.Landsat 7 will carry a GPS receiver to enable improvedposition data.
SOURCE: National Aeronautics and Space Administration, 1993.
spacecraft for future land remote sensing satel-lites.12 New technologies introduce a signifi-cant element of technological and cost risk. IfCongress wishes to reduce these risks for afuture Landsat system, Congress could pro-vide DoD and NASA sufficient funds to sup-port a technology development and testingprogram for advanced Landsat technology.
Satellite and sensor designers have sug-gested a number of improvements for land remotesensing satellites, including some focused onreducing satellite size and weight. However,proving new concepts will require extensivedesign review and technology development. Inaddition, constructing a satellite system that is
expected to last 5 or more years without signifi-cant degradation requires extensive testing atboth the component and system level.
Developing new sensors for programs thathave requirements for returning data on a longterm, operational basis presents a special chal-lenge to spacecraft designers because these in-struments must meet more stringent specifica-tions than those for short-term research missions.Hence, progress in sensor and spacecraft designtends to be incremental, rather than revolutionary.Satellite system experts estimate that the devel-opment of a new satellite system for Landsat 8,beginning with concept development and pro-ceeding through detailed design and construc-tion, could take as long as 8 years. Hence, ifCongress wants to increase the chances ofmaintaining continuity of Landsat data deliv-ery after Landsat 7, it should direct DoD andNASA to start planning in 1993 to specify thedesign of Landsat 8.
NON-US. LAND REMOTE SENSINGSYSTEMS
Other countries have developed and flown verycapable land remote sensing satellites.13 Thefollowing section summarizes the capabilities ofthese systems.
| France
SYSTEME POUR D’OBSERVATION DE LA TERRE(SPOT)
The SPOT-2 satellite, which was designed,built, and is operated by Centre Nationaled’Etudes Spatial (CNES), is the second in a seriesof SPOT satellites. It achieves a higher spatialresolution than Landsat 6, but has fewer spectralbands. It is capable of acquiring panchromaticdata of 10 m resolution, and 20 m resolution datain 3 spectral bands. SPOT’s off-nadir viewingyields stereoscopic pairs of images of a given area
12 ~blic bW 102-555, Title III; 106 STAT. 4174; 15 USC 5631-33.
13 SW app. D for more detail on these systems.

Chapter 4-Surface Remote Sensing |53
by making successive satellite passes. A standardSPOT scene covers an area 60 x 60 kilometers(km). CNES expects to launch SPOT 3 in late1993.
CNES developed SPOT with the intention ofselling data commercially and attempting todevelop a self-sustaining enterprise. SPOT Image,S. A., the French company formed to marketSPOT data to a global market, is a majorcompetitor to EOSAT in selling remotely sensedland data. Although SPOT Image has beensuccessful in increasing its yearly sales each year,and now makes a modest profit on SPOT opera-tions, it still does not earn sufficient income tosupport the construction and launch of replace-ment satellites. The French Government, throughCNES, is expected to continue to provide addi-tional satellites through the end of the decade.
During the 1992 and 1993 growing seasons,CNES reactivated SPOT-1 in order to providemore timely coverage of agricultural conditions.Key to the French strategy in building a marketfor remote sensing data is the CNES plan to assurecontinuity of data delivery and a series ofevolutionary upgrades to the SPOT system. Bythe end of the century, CNES plans to add thecapability of gathering 5 m resolution, pan-chromatic stereo data. It also plans to add aninfrared band to enhance the data’s usefulness inagriculture and other applications. The new datapolicy for Landsat 7 under which “unenhanceddata are available to all users at the cost offulfilling user requests’ 14 may pose a problem forSPOT Image, as Landsat data would be sold toprivate sector users for much less than the currentprices. OTA will examine these and other dataissues in a future report on remotely sensed data.
continuous coverage of the country. An indige-nous ground system network handles data recep-tion, data processing, and data dissemination.India’s National Natural Resources ManagementSystem (NNRMS) uses IRS data to support alarge number of applications projects.
India has orbited two IRS satellites: IRS-1Awas launched in March 1988 by a Russianbooster; IRS-lB reached space in August 1991,also launched by a Russian vehicle. Each carriestwo payloads employing Linear Imaging Self-scanning Sensors (LISS). The IRS-series have a22-day repeat cycle, The LISS-I imaging sensorsystem consists of a camera operating in fourspectral bands, compatible with the output fromLandsat-series Thematic Mapper and SPOT HRVinstruments. The LISS-IIA & B is comprised oftwo cameras operating in visible and near infraredwavelengths with a ground resolution of 36.5 m,and swath width of 74.25 km.
As part of the National Remote SensingAgency’s international services, IRS data areavailable to all countries within the coverage zoneof the Indian ground station located at Hyderabad.These countries can purchase the raw/processeddata directly from NRSA Data Centre.
India is designing second generation IRS-lCand ID satellites that will incorporate sensorswith resolutions of about 20 m in multispectralbands and better than 10 m in the panchromaticband. System designers intend to include ashort-wave infrared band with spatial resolutionof 70 m. The system will also include a WideField Sensor (WiFS) with 180 m spatial resolu-tion and larger swath of about 770 km formonitoring vegetation.
| Japan| India
INDIAN REMOTE SENSING SATELLITE (IRS)As India’s first domestic dedicated Earth re-
sources satellite program, the IRS-series provides
JAPAN EARTH RESOURCES SATELLITE (JERS-1)A joint project of the Science and Technology
Agency, NASDA, and the Ministry of Interna-tional Trade and Industry (MITT), JERS-1 was
14 ~blic IAw lo2-5.5; 106 STAT 4170; 15 USC .5615.
54 | Remote Sensing From Space
launched by a Japanese H-1 rocket in February1992. Observations from JERS-1 focus on landuse, agriculture, forestry, fishery, environmentalpreservation, disaster prevention, and coastalzone monitoring. It carries a synthetic apertureradar and an optical multispectral radiometer.
JERS-1 data are received at NASDA’S EarthObservation Center, Saitama, and at the Univer-sity in Kumamoto Prefecture, the Showa Base inthe Antarctica, and the Thailand Marine Observa-tion Satellite station. Under a NASDA-NASAMemorandum of Understanding, the NASA-funded SAR station in Fairbanks, Alaska, alsoreceives JERS-1 data. These data overlap theSAR data from the European ERS-1 mission, andthe future Canadian Radarsat mission, planned forlaunch in 1994.
Japan also operates the Marine ObservationSatellite (MOS lb) system that collects data aboutthe land as well as the ocean surface. See belowfor description.
| Russia
RESURS-OThe Resurs-O digital Earth resources satellites
are roughly comparable to the U.S. Landsatsystem and are derived from the Meteor series ofpolar orbiters. They carry multiple multispectralinstruments operating in the visible to thermalinfrared. Remote sensing instruments aboard aResurs-O comprise two 3-band scanners, provid-ing 45 m resolution. A second 5-band scannersenses a 600 km swath at 240 m X 170 mresolution. A 4-band microwave radiometer viewsa 1,200 km swath at 17 to 90 km resolution. Inaddition a side-looking synthetic aperture radarprovides 100 km coverage at 200 m resolution.The Resurs-O spacecraft can process some data inorbit and relay data directly to ground stations.
Russian scientists are planning a follow-on tothis series, which would carry high-resolutionoptical sensors capable of 15 to 20 m resolution.
They have explored the possibility of establishingcommercial Resurs-O receiving stations in Swe-den, as well as the United Kingdom.
RESURS-FThis class of photographic satellite mimics
Russian military reconnaissance spacecraft byusing a film return capsule, which is deorbitedand brought to Earth under parachute. Resurs-Fland Resurs-F2 spacecraft use the Vostok reentrysphere, earlier used for launching cosmonauts.The Resurs-Fl typically flies at 250km to 400kmaltitude for a 2-week period and carries a three-channel multispectral system that includes threeKATE-200 cameras and two KFA-1OOO cameras.The KATE--200 camera provides for Earth surveyin three spectral bands. It can collect stereoscopicimagery having an along-track overlap of 20, 60,or 80 percent.15 Resolution of the images, accord-ing to spectral band and survey altitude, variesfrom 10 to 30 m over a 180 km swath width. TheKFA-1OOO cameras provide stereo images of upto 5 m resolution with a 60 km swath width.
The Resurs-F2 spacecraft normally circuitEarth for as long as 3 to 4 weeks in a variable orbitof 259 to 277 km. Onboard is the MK-4 camerasystem, which can survey the Earth using a set offour cameras in six spectral channels. Also, 5 to8 m resolution stereo is possible with a swathwidth of 120 to 270 km. Imagery provided byResurs-Fl and F2 spacecraft are being offeredcommercially through Sojuzkarta.
OCEAN SENSING AND THE ICE CAPSBecause the oceans cover about 70 percent of
Earth’s surface, they make a significant contribu-tion to Earth’s weather and climate. The oceansinteract constantly with the atmosphere abovethem and the land and ice that bound them. Yetscientists know far too little about the details ofthe oceans’ effects on weather and climate, in partbecause the oceans are monitored only coarselyby ships and buoys. Improving the safety of
15 Refi~le s(er~ r~uires at least 60 percent overlap.
Chapter 4-Surface Remote Sensing |55
people at sea and managing the seas’ vast naturalresources also depend on receiving better andmore timely data on ocean phenomena, Satelliteremote sensing is one of the principal means ofgathering data about the oceans.
| Research on Ocean PhenomenaIn order to understand the behavior of the
oceans and to make more accurate predictions oftheir future behavior, scientists need to gatherdata about sea temperature, surface color, waveheight, the distribution of wave patterns, surfacewinds, surface topography, and currents. Fluctua-tions in ocean temperatures and currents lead tofluctuations in the atmosphere and therefore playa major part in determining weather and climate.For example, El Nino, the midwinter appearanceof warm water off the coast of South Americaevery 4 to 10 years, decreases the nutrients in thecoastal waters off South America, and thereforethe number of fish. However, in 1988, El Ninohad a major effect on weather patterns over NorthAmerica. The warm water was pushed furthernorth than usual, which created severe stormshundreds of miles to the north and shifted the jetstream further north. This blocked the Canadianstorm systems, which normally send cool air andmoisture south during the summer, and led to anunusual amount of dry, hot weather, precipitatingsevere drought in the central and eastern UnitedStates. l6 The drought, in turn, severely affectedU.S. agriculture. The winter 1992-1993 El Ninocondition had a major role in producing extremelyhigh levels of rain and snow in the western UnitedStates during February 1993. Understanding andpredicting these interactions are major goals ofclimatologists.
The study of other ocean phenomena wouldenhance scientists’ understanding of the structureand dynamics of the ocean. For example, observa-tions of wave conditions are important for model-
ing ocean dynamics. Because winds create waves,measurements of wind speed and direction overwide areas can lead to estimates of wave heightand condition.
Closely observing the color of the oceansurface provides a powerful means of determiningocean productivity. Variations in ocean color aredetermined primarily by variations in the concen-trations of algae and phytoplankton, which are thebasis of the marine food chain. Because thesemicroscopic plants absorb blue and red light morereadily than green light, regions of high phyto-plankton concentration appear greener than thosewith low concentration. Because fish feed on thephotoplankton, regions of high concentrationindicate the possibility of greater fish population.
Interest in using satellites to measure oceanphenomena began in the 1960s. In 1978, thepolar-orbiting TIROS satellites began to gatherdata on sea surface temperatures using the AVHRR(plate 5) and microwave sensors. The maps of seasurface temperatures produced form these datademonstrate complex surface temperature pat-terns that have led to considerable speculationabout the physical processes that might causesuch patterns. However, it was not until NASAlaunched Nimbus 7 and Seasat in 1978 thatscientists were able to gather comprehensivemeasurements of the oceans. Nimbus-7 carried aScanning Multichannel Microwave Radiometer(SMMR) that provided accurate measurements ofsea surface temperatures. By measuring the colorof the ocean surface, its Coastal Zone ColorSeamer (CZCS) provided estimates of oceanbiological productivity.
Seasat17 carried five major instruments-analtimeter, a microwave radiometer, a scatterome-ter, a visible and infrared radiometer, and asynthetic aperture radar. Scientists used data fromthese instruments to measure the amplitude anddirection of surface winds, absolute and relative
16 D. JiUIRS Baker, Planer Earth: The Viewfrom Space (Cambridge, MA: Hanfard UD.iversity ~ess, 1990), pp. 2-3.
IT U.S. ConWws, Mice of Technology Assessment Technology and Oceanography, OTA-O-141 (Washington+ D. C.: U.S. Gve-entPrinting ~lC43, 1981).

56 | Remote Sensing From Space
surface temperature, the status of ocean featuressuch as islands, shoals, and currents, and theextent and structure of sea ice. Although Seasatoperated only 3 months, it returned data ofconsiderable value to ocean scientists and pavedthe way for the current generation of U.S. andforeign ocean instruments and satellite systems.
| Operational Uses of Ocean SatellitesThe development and operation of Seasat
demonstrated the utility of continuous oceanobservations, not only for scientific use, but alsofor those concerned with navigating the world’soceans and exploiting ocean resources. Its suc-cess convinced many that an operational oceanremote sensing satellite would provide significantbenefits.18 The SAR,19 the scatterometer, and thealtimeter all gathered data of considerable utility.Not only do DoD and NOAA have applicationsfor these sensors in an operational mode (i.e.,where continuity of data over time is assured andthe data formats change only slowly), but so alsodo private shipping firms and operators of oceanplatforms. Knowledge of currents, wind speeds,wave heights, and general wave conditions at avariety of ocean locations is crucial for enhancingthe safety of ships at sea, and for ocean platforms.Such data could also decrease costs by allowingship owners to predict the shortest, safest searoutes.
Over the past decade, the U.S. Government hasmade two major attempts to develop and fly adedicated operational ocean satellite carryingsensors similar to those on Seasat. Both attemptsfailed when the programs were canceled for lackof funding. In 1982, the United States canceled ajoint DoD/NOAA/NASA program to develop theNational Oceanic Satellite System (NOSS), and
in 1988 it canceled a similar satellite that theNavy was attempting to develop, the NavyRemote Ocean Sensing Satellite (N-ROSS). TOPEX/Poseidon, a research satellite, was launched in1992 for altimetry studies.
Data from the SeaWiFS instrument aboard theprivately developed SeaStar satellite, will provideocean color information, which could have con-siderable operational use.20Although NASA’sEOS will include ocean sensors to supportresearch on issues concerning the oceans andocean-atmospheric interactions, no instrumentsdevoted to operational uses are planned.
| Observations of Sea IceBecause sea ice covers about 13 percent of the
world’s oceans, it has a marked effect on weatherand climate. Thus, measurements of its thickness,extent, and composition help scientists under-stand and predict changes in weather and climate.Until satellite measurements were available, thedifficulties of tracking these characteristics werea major impediment to understanding the behav-ior of sea ice, especially its seasonal and yearlyvariations.
The AVHRR visible and infrared sensorsaboard the NOAA POES have been used tofollow the large-scale variations in the Arctic andAntarctic ice packs. Because they can “seethrough” clouds, synthetic aperture radar instru-ments are particularly useful in tracking thedevelopment and movement of ice packs, whichpose threats to shipping, and in finding routesthrough the ice. Data from ERS-1, Almaz, andJERS-1 (see below) have all been studied tounderstand their potential for understanding seaice and its changes. The Canadian Radarsat willbe devoted in part to gathering data on the ice
la Dodd Montgome~, “CommercialApplications of Satellite Oceanography,” Oceanus24, No. 3, 1981; Joint Oceanographic Institutions,“Oceanography From Space: A Research Strategy for the Decade 1985 -1995,” report (Washington, DC: Joint Oceanographic Institutions,1984).
19 S= ~Wn& B, box B-3, for a description of how synthetic apatu.re molar OperateS.
m See below for a ~description of SeaStar. See ch. 7 for discussion of the financial arrangements that have made its developmentpossible.

Chapter 4-Surface Remote Sensing |57
packs to aid shippers, fishing fleets, and otherusers of the northern oceans. NASA is providinga receiving station in Alaska to collect Radarsatdata and make them available to U.S. researchers.
MAJOR EXISTING OR PLANNED OCEANAND ICE REMOTE SENSING SATELLITES
The separation of satellites into those that viewthe land or the ocean is highly artificial becauseinstruments used for land features often revealinformation about the oceans and vice versa. Inaddition, because most instruments specificallydesigned either for land or ocean features can flyon the same satellite, such separations are notrequired for operational use, Nevertheless, as aresult of the division of disciplines and the desireof funding agencies to group instruments de-signed primarily for investigating land or oceanfeatures on the same satellite bus, satellitesgenerally fall into one category or the other.
| Canada
RADARSATThis satellite, to be launched in 1995 aboard a
Delta II launcher, will carry a C-band syntheticaperture radar capable of operating in severaldifferent modes and achieving resolutions from10 to 50 m, depending on the swath width desired.It is designed to gather data for:
1.2.3.4.5.6.7.
ice mapping and ship navigation;resource exploration and management;high arctic surveillance;geological exploration;monitoring of crop type and health;forestry management;Antarctic ice mapping.
The satellite will have a repeat cycle of 1 dayin the high Arctic, 3 days over Canada, and 24days over the equatorial regions. The Canadianfirm, Radarsat International, will market datacollected from the Radarsat system. It will offercontracts to stations around the world that are
collecting SPOT and/or Landsat data, enablingthem to collect and market Radarsat data.
| European Space Agency
EARTH RESOURCES SATELLITE (ERS-1)The ERS-1 satellite was launched into polar
orbit by an Ariane booster in July 1991 and wasdeclared operational 6 months later. Operatingfrom a Sun-synchronous, near-polar orbit, ERS-1is the largest and most complex of ESA’S Earthobservation satellites. It carries several instru-ments:
1.
2.
3.
4.
Along Track Scanning Radiometer andMicrowave Sounder, which makes infraredmeasurements to determine, among otherparameters, sea surface temperature, cloudtop temperature, sea state, and total watercontent of the atmosphere.Radar Altimeter, which can function in oneof two modes (ocean or ice) and providesdata on significant wave height; surfacewind speed; sea surface elevation, whichrelates to ocean currents, the surface geoidand tides; and various parameters over seaice and ice sheets.Synthetic Aperture radar to study the relation-ships between the oceans, ice, land, and theatmosphere. The SAR’S all-weather, day-and-night sensing abilities is critical for polarareas that are frequently obscured byclouds, fog, and long periods of darkness.Wind Scatterometer to measure surfacewinds. By measuring the radar backscatterfrom the same sea surface, picked up by thethree antennas placed at different angles,wind speed and direction can be deter-mined.
The primary objectives of the ERS-1 missionfocus on improving understanding of oceans/atmosphere interactions in climatic models; ad-vancing the knowledge of ocean circulation andtransfer of energy; providing more reliable esti-mates of the mass balance of the Arctic and

58 I Remote Sensing From Space
Antarctic ice sheets; enhancing the monitoring ofpollution and dynamic coastal processes (plate 6);and improving the detection and management ofland use change.
More specifically, data form ERS-1 are beingused to study ocean circulation, global wind/waverelationships; monitor ice and iceberg distribu-tion; determine more accurately the ocean geoid;assist in short and medium-term weather forecast-ing, including the determination of wind speedand direction, as well as help locate pelagic fishby monitoring ocean temperature fronts. Datafrom the spacecraft also contribute to the interna-tional World Climate Research Program and tothe World Ocean Circulation Experiment.
| Japan
MARINE OBSERVATION SATELLITE (MOS)The MOS-1 was Japan’s first Earth observation
satellite developed domestically. The frost MOS-1 was launched in February 1987 from Tane-gashima Space Center by an N-II rocket. Itssuccessor, MOS - lb, with the same performanceas MOS-1, was launched by an H-I rocket inFebruary 1990. These spacecraft orbit in sun-synchronous orbits of approximately 909 km andhave a 17-day recurrent period, circling the Earthapproximately 14 times a day. The two spacecraftcan be operated in a simultaneous and/or inde-pendent mode.
MOS-1 and MOS-lb are dedicated to thefollowing objectives:
establishment of fundamental technology forEarth observation satellites;experimental observation of the Earth, inparticular the oceans, monitoring water tur-bidity of coastal areas, red tide, ice distribu-tion; development of observation sensors;verification of their functions and performa-nce; and
. basic experiments using the MOS datacollection system.
Each of the spacecraft carry three sensors: aMultispectral Electronic Self-seaming Radiome-ter (MESSR); a Visible and Thermal InfraredRadiometer (VTIR); and a Microwave ScanningRadiometer (MSR). MOS products are availablefor a fee from the Remote Sensing TechnologyCenter of Japan (RESTEC).
| U.S./French
TOPEX/POSEIDONTOPEX/Poseidon is a research satellite de-
voted primarily to highly accurate measurements(to an accuracy of about 2 cm) of the height of theoceans. The satellite, which was launched inSeptember 1992 by the European Ariane launcher,also carries a microwave radiometer in order tocorrect for the effects of water vapor in theatmosphere. France supplied a solid-state altime-ter and a radiometric tracking system. The satel-lite’s orbit allows determination of ocean topog-raphy from latitudes 63° north to 63° south. Theheight of the ocean is crucial to understandingpatterns of ocean circulation. Accurate altitudemeasurements could lead to better understandingof ocean topography and dynamics, tides, sea iceposition, climate, and seafloor topography, amongother ocean-related qualities.21 Data from TOPEX/Poseidon are distributed to scientists in the UnitedStates, France, and other countries in accordancewith data policies agreed on between NASA,CNES and other members of CEOS.
| Orbital Sciences Corp.
SEASTAR/SEAWlFSThe Orbital Sciences Corp. (OSC) is construct-
ing the SeaStar satellite, which will carry theSea-viewing Wide Field of view Sensor(SeaWiFS), an 8-band multispectral imager oper-
ZI “Sate~te ~~e~c M~~men~ of tie Oceaw” re~rt of the TOPEX Science Working OrOUp, NASA, JPL 1981; Richd FKleld,
“The Shape of Earth from Space, ” New Scientist, Nov. 15, 1984, pp. 4650.

Chapter 4-Surface Remote Sensing |59
Figure 4-2—The Orbital Sciences Corporation’s SeaStar Ocean Color Satellite System
andes
~ C o m m e r c i a lusers
ating in the very near infrared portion of thespectrum. z2 SeaWiFS, which OSC plans tolaunch in late 1993, will be used to observechlorophyll, dissolved organic matter, and pig-ment concentrations in the ocean. The sensor willcontribute to monitoring and understanding thehealth of the ocean and concentration of life formsin the ocean. Data will have significant commer-cial potential for fishing, ship routing, and aquac-ulture, and will be important for understandingthe effects of changing ocean content and temper-atures on the health of aquatic plants and animals.
Under an experimental arrangement with NASA,the company’s SeaStar satellite will collect oceancolor data for primary users (including NASA),
who then have the option to sell both unenhancedand enhanced data to other users (figure 4-2).NASA has agreed to purchase data from orbitalSciences in a so-called anchor tenant arrangementin which NASA has paid OSC $43.5 million upfront. This arrangement allowed OSC to seekprivate financing for design and construction ofthe satellite.23
This experimental data purchase agreementshould provide valuable lessons for possiblefuture agreements of a similar character. If it issuccessful, the Federal Government may pur-chase quantities of other remotely sensed datafrom private systems, allowing these firms to earna profit marketing data to other users.
22 B~lt by Hughes Santa Barbara Research Center.
23 See ch. 7: The p~”vate Sector, for a more detailed discussion of this arrangement.

60 | Remote Sensing From Space
Box 4-B-System TradeoffsRemote sensing instrumentation can be launched into space in a variety of orbital altitudes and inclinations;
instruments can be flown on endo-atmospheric systems-aircraft, balloon, and remotely piloted aircraft; or theycan be sited on the ground. The selection of a particular “system architecture” for a given mission typically involvesmany compromises and tradeoffs among both platforms and sensors. For imaging missions based on satellites,the most important factors indetermining overall system architecture include the required geographical coverage,ground resolution, and sampling time-intervals. These affect platform altitude, numbers of platforms, and a hostof sensor design parameters. Each remote sensing mission will have unique requirements for spatial, spectral,radiometric, and temporal resolution. A number of practical considerations also arise, including systemdevelopment costs; the technical maturity of a particular design; and power, weight volume, and data raterequirements.
Spectral resolution refers to the capability of a sensor to categorize electromagnetic signals by theirwavelength. Radiometric resolution refers to the accuracy with which the intensities of these signals can berecorded. Finally, ternporal resolution refers to the frequency with which remote sensed data are acquired. it isalso possible to categorize the “coverage” of three of the instruments’ four resolutions: spatial coverage is afunction of sensor field of view; spectral coverage refers to the minimum and maximum wavelengths that can besensed; and radiometric coverage refers to the range of intensities that can be categorized. The requiredmeasurement intervals vary widely with mission. For example, data on wind conditions might be required on timescales of minutes; data on crop growth might be needed on time scales of a week or more; and data on changesin land use are needed on time scales of a year or more.
Sensor design requires tradeoffs among the four “resolutions” because each can be improved only at theexpense of another. Practical considerations also force tradeoffs; for example, on Landsat, multispectral andspatial data compete for on-board storage space and fixed bandwidth data communication channels to groundstations. For a given swath width, the required data rate is inversely proportional to the square of the spatialresolution and directly proportional to the number of spectral bands and the swath width. For example, improvingthe resolution of Landsat from 30 m to 5 m would raise the data rate by a factor of 36. Adding more bands to Landsatwould also increase the required data rate. Changing the width of coverage can increase or decrease the requireddata rate proportional to the change in swath width. The baseline design for a proposed high-resolution imagingspectrometer (HIRIS) sensor would have 192 contiguous narrow spectral bands and a spatial resolution of 30 m.1
To accommodate these requirements, designers chose to limit the ground coverage and thereby reduce the swathwidth of the sensor. HIRIS would have been used as a “targeting” instrument and would not acquire datacontinuously.
Spatial resolution drives the data rate because of its inverse square scaling. One way to reduce the data raterequirements without sacrificing spatial resolution is to reduce the field of view of the sensor.2 Designingmultispectral sensors that allow ground controllers to select a limited subset of visible and infrared bands from alarger number of available bands is another option to lower data rates?
1 HIRIS was eliminated as an EOS instrument during the restructuring of EOS (see ch. 5: @Obai mangeResearch).
2 ~edifferentre~utio~ can betradedagainstgroundcoverage. Forexampie, the French SPOTsateiiiteoffers10 m resolution in black and white, but its ground swath width is 60 km versus Landsat 5’s 185 km.
3 Datacornpr~on isanotheroption toreducedata rates. Aiossiesscompression wouid alkwthefuiisetofmwdata to be reoovered; reductions in data rates of approxhnateiy a factor of two might bs gained implementing thesealgorithms. Most researchers prefer this to a data set that has been preprooeasd in away that destroys some data (butreduces data rate requirements) because “one person’s ndse can prove to be another person’s signai.”
SOURCE: 19S3 Landsat Short Oourse, University of California 8anta 8arbaraand Hughes SBRC;Ofiice of Tectmoiogy Assesemen$ 1993.

Chapter 4-Surface Remote Sensing | 6 1
| United States
GEODESY SATELLITE (GEOSAT)Launched in 1985, this satellite carried an
improved version of the altimeter that flew onSeasat. Designed by the U.S. Navy primarily forcollecting precise measurements of ocean topog-raphy for military use, the satellite was initiallyplaced into a 108° orbit. The data from this part ofthe mission were classified but have recently beenreleased for scientific use. The satellite was latermaneuvered into a different orbit in order tocollect data that would allow oceanographers todetermine changes in ocean topography. Geosatoperated until 1989. The Navy plans to replace itwith Geosat Follow On (GFO), which would flyin an orbit that is 1800 out of phase with the orbitof Geosat, Current plans call for a 1995 launch ofGFO.
| Russia
ALMAZFrom March 1991 until November 1992, Alrnaz-
1, a large spacecraft equipped with syntheticaperture radar (SAR), provided radar images ofthe oceans and Earth’s surface.24 Almaz (Russianmeaning “diamond”) orbited Earth in a 300km-high orbit, providing coverage of designatedregions at intervals of 1 to 3 days. Imagery wasrecorded by onboard tape recorders, then trans-mitted in digital form to a relay satellite that, inturn, transmitted the data to a Moscow-basedreceiving facility. The imagery formed a holo-gram recorded on high-density tape for laterprocessing as a photograph. Alternatively, adigital tape can be processed. Hughes STX Corp.
of Lanham, Maryland, is the exclusive worldwidecommercial marketer, distributor, processor, andlicenser of data from the Almaz-1 spacecraft.25 Asecond Almaz satellite is available for launch ifthe funds can be found to launch and operate it.Although the cost of such an operation is reportedto be extremely low compared to other SARsatellites, NPO Machinostroyenia, the satellitebuilder, has not yet found an investor.
| Sensor Design and SelectionEach remote sensing mission has unique re-
quirements for spatial, spectral, radiometric, andtemporal resolution. A number of practical con-siderations also arise in the design process,including system development and operationalcosts; the technical maturity of a particulardesign; and power, weight, volume, and data raterequirements. Because it is extremely expensive,or perhaps impossible, to gather data with all thecharacteristics a user might want, the selection ofsensors or satellite subsystems for a missioninvolving several tasks generally involves com-promises (box 4-B).
Sensor performance may be measured byspatial and spectral resolution, geographical cov-erage, and repeat frequency. In general, tradeoffshave to be made among these characteristics. Forexample, sensors with very high spatial resolutionare typically limited in geographical coverage.Appendix B provides a detailed discussion ofthese technical issues. It also discusses manytechnical and programmatic concerns in thedevelopment of advanced technology for remotesensors and satellite systems.
24 co~mo~. 1870, ~ ~~~ bu~.~~ed, ~~-q~pp~ proto~ spacec~t WW+ ~~ched in 1987. Cosmos-1870 operated for 2 y-,
producing radar imagery of 25-30 m resolution.
25 tiller, A* Corp. WM formed to stimulate commercial use of the satellite data.
GlobalChange
Research 5
G lobal change encompasses many coupled ocean, land,and atmospheric processes. Scientists currently haveonly a modest understanding of how the individualelements that affect climate, such as clouds, oceans,
greenhouse gases, and ice sheets, interact with each other.Additionally, they have only limited knowledge about howecological systems might change as the result of human activities(plate 7) and natural Earth processes. Because changes in climateand ecological systems may pose a severe threat to mankind, butthe uncertainties in both are extremely large, the study of globalchange has assumed major importance to the world. Con-sequently, scientists and concerned policymakers have urgeddevelopment of an integrated program of Earth observationsfrom space, in the atmosphere, and from the surface.
THE U.S. GLOBAL CHANGE RESEARCH PROGRAMThe U.S. Government has developed a comprehensive re-
search program to gather data on global change and evaluate itseffects (box 5-A). The diverse elements of the U.S. GlobalChange Research program (USGCRP) are coordinated by theCommittee on Earth and Environmental Sciences (CEES), acommittee of the Federal Coordinating Council for Science,Engineering Sciences, and Technology (FCCSET), within theOffice of Science and Technology Policy.
The U.S. effort to study global change responds in part to aninternational framework of research and policy concerns articu-
1 Uncertainties in possible adaptation strategies are also extremely large. See theforthcoming report of an assessment of systems at risk from global change, Office ofTechnology Assessment.
63

64 | Remote Sensing From Space
Box 5-A—U.S. Global Change Research Program
Global environmental and climate change issues have generated substantial international research activity.Increased data on climate change and heightened international concern convinced the U.S. Government of theneed to address global change in a systematic way. In 1989, the Director of the Office of Science and TechnologyPolicy, D. AlIan Bromley, established an inter-agency U.S. Global Change Research Program (USGCRP) underthe Committee on Earth and Environmental Sciences.1 Established as a Presidential Initiative in the FY 1990budget, the goal of the program is to provide the scientific basis for the development of sound national andinternational policies related to global environmental problems. The USGCRP has seven main science elements:
. climate and hydrodynamic systems,
. biogeochemical dynamics,
. ecological systems and dynamics,
. earth systems history,
. human interaction,
. solid earth processes, and
. solar influences.
Participation in the USGCRP involves nine government agencies and other organizations.2 Research effortscoordinated through the USGCRP seek a better understanding of global change and the effects of a changingenvironment on our daily lives. Most research projects rely on remote observations of atmosphere, oceans, andland for data. Coordination of research across agencies should eliminate duplication and increase cooperation,
and at minimum will promote communication between agencies. The Committee on Earth and EnvironmentalSciences (CEES) makes suggestions to federal agencies, and federal agencies can raise items for considerationthrough the CEES. Although this process can be cumbersome, most researchers acknowledge that the programhas brought a degree of coordination never before seen in federally sponsored research of this type. However,the attempts at coordination do not assure a comprehensive program that tackles the most important issues. Inaddition, now that the USGCRP is underway, it is no longer treated as a Presidential Initiative. This change of statushas led to concerns that funds previously “fenced off” for global change research will not be forthcoming.3
1 Forfirther information see Committee on Earth and Environmental Sdencesj OUr Changing P’MWt: 7h9W7%J3U.S. G/ohal Change Research Program (Washington, DC: National Science Foundation, 1993).
2 Including the Smithsonian Institution and the Tennesee Valk3y Authofity.
3 These issues are addressed in a forthcoming OTA background paper, HE and the USGCRP.SOURCE: Office of TAnology Assessrne~ 1993.
lated in reports of the Intergovernmental Panel on ing activities that cover a broad spectrum ofClimate Change (IPCC), the International Geo- global and regional environmental issues,’ by:sphere-Biosphere Programme, and the World
● documenting global change,Climate Research Programme (WCRP) and sup- . enhancing understanding of key processes,ported by numerous national scientific panels.The USGCRP is attempting to “produce a
and
predictive understanding of the Earth system to. predicting global and regional environmental
change.support . . . national and international policymak-
2 Committee on Earth and Environmental Sciences, Our Changing Planet: The FY 1993 U.S. Global Change Research Program(Washington DC: National Science Foundation, 1993), pp. 34.

Chapter 5-Global Change Research | 65
NASA’S MISSION TO PLANET EARTHNASA established its Mission to Planet Earth
(MTPE) in the late 1980s as part of its program inEarth sciences, MTPE includes the Earth Observ-ing System (EOS), which consists of a series ofsatellites capable of making comprehensive Earthobservations from space (figure 5-1);3 EarthProbe satellites for shorter, focused studies (box5-B); and a complex data archiving and distrib-ution system called the Earth Observing SystemData and Information System (EOSDIS). UntilNASA launches the first EOS satellite, MTPEresearch scientists will rely on data gathered byother Earth science satellites, such as UARS,the U.S.-French TOPEX/Poseidon,4 Landsat, andNOAA’s environmental satellites. Data from theEOS sensors may provide information that willreduce many of the scientific uncertainties citedby the IPCC--climate and hydrologic systems,biogeochemical dynamics, and ecological sys-tems and dynamics. 5 NASA has designed EOS toprovide calibrated data sets6 of environmentalprocesses occurring in the oceans, the atmos-phere, and over land.
EOS science priorities (table 5- 1) are based pri-marily on recommendations from the Intergov-ernmental Panel on Climate Change and CEES ofthe FCCSET. NASA has designed EOS toreturn data over at least 15 years of operation;its scientific value will be compromised ifmeasurements begun in the late 1990s do notcontinue well into the next century. This raisesa critical issue for Congress: whether a commit-
ment to an Earth Observing System, which mayrequire outlays on the order of $1 billion/yearin current dollars through about 2015, issustainable. Maintaining this level of investmentwill require Congress’ continued interest in meas-uring climate and environmental parameters andassessing the causes of global environmentalchange in the face of other demands on theFederal budget. It will also require continuing,clear support from several presidential administra-tions.
NASA’S early plan for EOS was extremelyambitious, technically risky, and costly. In 1991,Congress told NASA that it should plan forreduced future funding for the first phase of EOS(fiscal year 1992 through fiscal year 2000), and tocut its funding expectations from a projected $17billion to $11 billion.7 This reduction led to amajor restructuring of the EOS program.8 In therestructuring, NASA retained instruments thatfocus on climate issues and reduced or eliminatedthose that would have emphasized gathering dataon ecology and observations of Earth’s surface.The restructured program’s first priority isacquiring data on global climate change. As aresult, NASA has de-emphasized missions de-signed to improve scientific understanding of themiddle and upper atmosphere and of solid Earthgeophysics. The development of remote sensingtechnology has also been affected by these shiftsas NASA has de-emphasized advanced sensorsfor very high-resolution infrared, far-infrared, andsub-millimeter wave spectroscopy. NASA also
3 See app. A for a summary of the MTPE instruments and satellites.4 This U.S./French cooperative satellite was successfully launched into orbit Aug. 10, 1992 aboard an Ariane 4 rocket.
s t ‘OU Changing p~et: tie n 1991 Resewh Pl~’ The U.S. Global Change Reseach Program, a report by the committee on wand Environmental Sciences, October 1990.
6 NASA has proposed to build and launch two sets of three satellites. The first set (called the AM satellite because it will follow a polarorbit and cross the equator every morning) would be launched in 1998, 2003, and 2008. The second set (called the PM satellite) would belaunched in 2000, 2005, and 2010.
7 U.S. Senate, Committee on Appropriations, ‘‘Departments of Veterans Affairs and Housing and Urban Development, and IndependentAgencies Appropriation Bill, 1993, ” report to accompany H.R. 2519, 102-107, July 2, 1992, pp. 52-53.
s A number of scientists urged NASA to restructure the program on grounds of technicat and prograrnma tic risk. See, for example, *’Reportof the Earth Observing System (EOS) Engineering Review Committee, ’ September 1991; Berrien Moore III, “Payload Advisory PanelRecommendations,” NASA manuscript, Oct. 21-24, 1991.
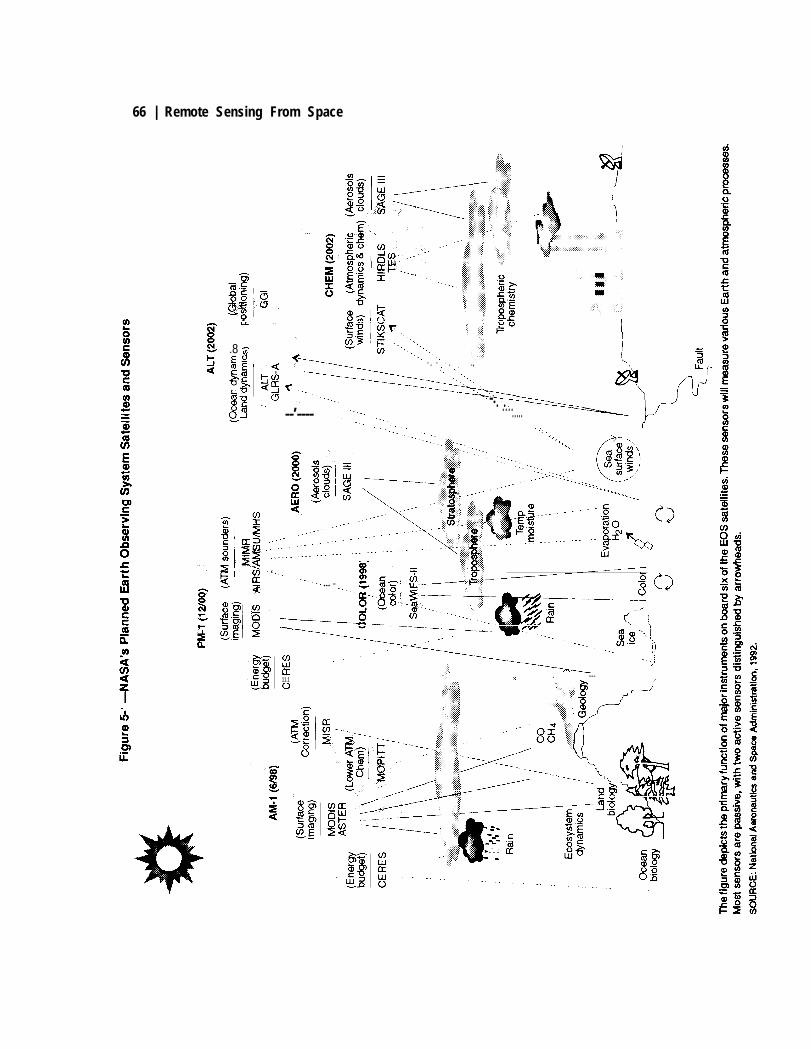
66 | Remote Sensing From Space
.8 ~$ ‘g ‘
. . .. . . . .,
~g J~ ~: =....%V&3 ‘-’ --’---- :---------
-. -.. . . .. . . . .. . . . . .
\
)“-.. ----- - . . . .. . . . . . . . . . ...- -.. . .>.. .
‘ ..-. ,-... -
—/,
u) .-.,k ::,:;
11.1 + ,,, . ---
I :
.,@
:.--- c,:., -,-
- .i “,, - - - - ($!-u)
ua

Chapter 5 - Global Change Research |67
Box 5-B–NASA’s Earth Observing System (EOS)
EOS is the centerpiece of NASA’s contribu-tion to the Global Change Research Program.Managed by NASA’s newly created Mission toPlanet Earth Office,1 EOS is to be a multiphaseprogram lasting about two decades. The originalEOS plan called for NASA to build a total of sixIarge polar-orbiting satellites, which would fly twoat a time on 5-year intervals over a 15-yearperiod. In 1991, funding constraints and concernsover technical and budgetary risk2 narrowed itsscope.
The core of the restructured EOS consists ofthree copies each of two satellites (smaller thanthose originally proposed, and capable of beinglaunched by an Atlas II-AS booster), designed toobserve and measure events and chemicalconcentrations associated with environmentaland climate change. NASA plans to place thesesatellites, known as t he EOS-AM satellite (whichwill cross the equator in the morning while on its
Figure 5-2—Artist’s Conception of NASA’s EarthObserving System AM-1 Platform,
Scheduled 1998 Launch.
SOURCE: Martin Marietta Astro Space.
ascending, or northward, path) and EOS-PM satellite (an afternoon equatorial crossing) in polar orbits. The threeAM satellites will carry an array of sensors designed to study clouds, aerosols, Earth’s energy balance, and surfaceprocesses (figure 5-2). The PM satellites will take measurements of clouds, precipitation, energy balance, snow,and sea ice.
NASA plans to launch several “phase one” satellites in the early and mid 1990s that will provide observationsof specific phenomena. Most of these satellites pre-date the EOS program and are funded separately. The UpperAtmosphere Research Satellite (UARS), which has already provided measurements of high levels ofozone-destroying chlorine oxide above North America, is an example of an EOS phase one instrument. NASA’sEOS plans also include three smaller satellites (Chemistry, Altimeter, and Aero), that will observe specific aspectsof atmospheric chemistry, ocean topography, and tropospheric winds. In addition, NASA plans to include data from
“Earth Probes,” and from additional copies of sensors that monitor ozone and ocean productivity, in the EOS Dataand Information System (EOSDIS).
NASA will develop EOSDIS3 so it can store and distribute data to many users simultaneously. This is a keyfeature of the EOS program. According to NASA, data from the EOS satellites will be available to a wide networkof users at minimal cost to researchers through the EOSDIS. NASA plans to make EOSDIS a user-friendly,high-capacity, flexible data system that will provide multiple users with timely data as well as facilitate the dataarchiving process critical to global change research. EOSDIS willI require substantial amounts of memory andprocessing, as well as extremely fast communications capabilities.
1 created in March 1993 when the Office of Space Science and Applications W= Split into tk ~f~ of Missionto Planet Earth, the Office of Planetary Science and Astrophysics, and the Office of Life Sciences.
2 National Research Council Orange Book; “Report of the Earth observing System (EOS) EnginW~ng Re~ewCommittee,” September 1991.
3 I+ghes information Technology won the contract to develop EOSDIS In 1992.
SOURCE: Office of Technology Wmssment, 1993.

68 | Remote Sensing From Space
Table 5-1—EOS Science and Policy Prioritiesa
Water and energy cycles:● Cloud formation, dissipation, and radiative properties, which
influence the scale and character of the greenhouse effects.. Large-scale hydrology and moist processes, including
precipitation and evaporation.Oceans:. Exchange of energy and chemicals between ocean and
atmosphere and between ocean surface layers and deepocean.
Chemistry of troposphere and lower stratosphere:● Links to hydrologic cycie and ecosystems, transformation of
greenhouse gases in atmosphere, and interactions withclimatic change.
Land surface hydrology and ecosystem processes:. Improved estimates of runoff over surface and into oceans.. Sources and sinks of greenhouse gases.● Exchange of moisture and energy between land surface
and atmosphere.Glaciers and polar ice sheets:. Predictions of sea level and global water balance.Chemistry of middle and upper stratosphere:. Chemical reactions, solar-atmosphere relations, and
sources and sinks of radiatively important gases.Solid Earth:. Volcanoes and their role in climate change.
a List in approximate priority order; these priorities are based on aprogram that would spend approximately $8 billion between 1991 and2000.
SOURCE: Berrien Moore Ill and Jeff Dozier, “Adapting the EarthObserving System to the Projected $8 Billion Budget: Recommenda-tions from the EOS Investigators,” Oct. 14, 1992, unpublished docu-ment available from authors or from the NASA Mission to Planet EarthOffice.
reduced the size of the planned satellites andincreased their number. The restructured programis now more resilient to the loss of a singlesatellite during launch or in space operations, andmore capable of returning some data in the eventof fiscal or political changes. NASA also can-celed or deferred some sensors that were eitherunlikely to be ready for launch on either of thefrost two satellites in the EOS series or too costlyto include in the reduced funding profile.
In passing the fiscal year 1993 NASA appropri-ations, Congress further reduced NASA’s futurefunding expectations for EOS by an additional $3billion, an action consistent with NASA’s effortsto reduce the costs of large programs. Betweenfiscal years 1991 and 2000, NASA can nowexpect to spend $8 billion for EOS ‘‘exclusive ofconstruction of facility, launch, and trackingrequirements, but including the Earth ObservingSystem Data and Information System (EOSDIS).1°NASA has revised its restructured EOS programto account for this projected funding level (box5-C). As a consequence, NASA has reduced mostof the contingency funds, exposing the programto the risk that it will be unable to complete someinstruments or may have to cut back on theircapacity to acquire certain data.
Additional large budget cut-backs may bedifficult to absorb; a third major restructuringmight result in the loss of several instruments.Tight budgets have also precluded the develop-ment of system backups; this lack of redundancyis an additional risk to the EOS program. Theexisting $8 billion program is probably not theprogram NASA would have designed if it hadbegun planning EOS with such a budget in mind.In fact, some scientists have suggested that byplanning a $17 billion program and Scaling back
in accordance with congressional and administrat-ion concerns over the future space budget, NASAwill be less effective in collecting data for globalchange research. Nevertheless, the second re-structuring still emphasizes the collection of dataon climate change, which is the highest priority ofthe USGCRP. If Congress wishes to continue aU.S. emphasis on global change research, itshould support the development of Mission toPlanet Earth at a level sufficient to accomplishthe science objectives of the U.S. Global
9 The reduction in platform size, which was strongly recommended in the ‘‘Report of the Ear& Observing System (EOS) En@e&ngReview Committee,’ allows a reduction in the size and cost of the launch vehicles needed to boost these satellites to space. However, the overallcost for the same data may well be higher eompsred to the original plan that used fewer, larger platforms.
10 U.S. Semte, Committee on Appropriations, ‘‘Departments of Veterans Affairs and Housing and Urban Development, and IndependentAgencies Appropriation Bill, 1993,” report to accompany H.R. 5679, 102-356, July 23, 1992, pp. 145-147.

Chapter 5-Global Change Research |69
Box 5-C-The Revised, RestructuredEOS Program (1993)
In revising the EOS program from its restructuredexpected funding level of$11 billion to $8 billion overthe decade from 1991-2000, NASA:
●
●
●
●
Reduced the amount of contingency available forhandling unexpected problems in instrumentdevelopment and changes in the science require-
ments. This has the effect of increasing thefinancial and technical risk to the program, but itmaintains the core instruments on the EOS AMand PM platforms.Further increased cooperation with Europeanand Japanese partners in EOS. While thisspreads the development burden, it also in-creases the amount of international programcoordination required. It also reduces U.S. influ-ence over the development process. For exam-ple, the United States will leave to its partners thedevelopment of advanced instruments for activemicrowave sensing.Canceled the proposed LAWS and EOS SARinstruments, deferred HIRIS, and moderately
descoped other proposed instruments.Reduced the amount of EOSDIS funding by 30
percent, which forced reductions in the number ofEOSDIS products available to researchers.
SOURCE: “Adapting the Earth Observing System to the Projected$8 Billion Budget: Recommendations from the EOS Investigators,”Berrien Moore Ill, and Jeff Dozier, eds, Oct. 14,1992. Manuscript.
Change Research Program. Although NASAwas able to absorb substantial reductions of itsproposed long term EOS budget by deferringseveral expensive instruments and concentrat-ing on climate research, additional major cutsin NASA’s MTPE budget could sharply reducethe effectiveness of NASA’s research.
As noted above, the restructuring of EOS hasshifted NASA priorities and affected instrumentselection. As a result:
●
●
NASA has reemphasized measurements ofupper atmospheric chemistry in the beliefthat data from existing satellites such as theUpper Atmosphere Research Satellite (UARS—figure 5-3), supplemented by plannedShuttle ATLAS missions and in-situ airb-orne and balloon measurements, will besufficient to monitor ozone depletion andassess the effectiveness of congressionallymandated phase-outs of chlorofluorocar-bons (CFCS). NASA has no plans to launcha satellite designed to acquire equivalentdata after UARS fails .11 However, continuedsatellite measurements will be needed tomonitor the health of Earth’s protectiveozone layer, to guard against scientificsurprises, and to provide the necessaryscientific rationale for international proto-cols that limit emissions of ozone-depletinggases. Long-term information about the stateof the ozone layer will be particularlyimportant for developing nations where therelative cost of limiting CFC emissions maybe highest. NASA intends to provide someof the necessary data with its TOMS instru-ments.Some relatively inexpensive, small satelliteprojects are threatened with delay or cancel-lation—for example, the Active Cavity Ra-diometer Irradiance Monitor (ACRIM),12
which would be used to continue measure-ments to monitor the variability of total solarirradiance, may not fly until 2002. Similarconcerns exist for SAGE, an instrumentdesigned to monitor tropospheric aerosols.NASA has dropped other advanced technol-ogy instruments because of a reduced em-phasis on atmospheric chemistry research.Some researchers express concern that incanceling these instruments, the UnitedStates will lose the opportunity to makeimportant climate measurements and risk
I I u~s ~ plm~ Ovration may extend through 1994. Individual instruments and components ~Y f~l ~li~,
12 On etilier flights of ACRIM.

70 | Remote Sensing From Space
Figure 5-3-Artist’s Conception of NASA’s UpperAtmosphere Research Satellite
SOURCE: Martin Marietta Astro Space.
reductions in the U.S. technology base fordeveloping advanced instruments.NASA has cancelled three important pro-posed instruments: Laser Atmospheric WindSounder (LAWS),13 Synthetic Aperture Radar(SAR), 14 and High Resolution Imaging Spec-trometer (HIRIS).15 All are technically chal-lenging and very expensive to develop.l6 Allare also “facility” instruments that wouldacquire data of interest to a large number ofinvestigators.
Although the technical complexity and chal-lenge of the original EOS program, along with thelack of available funds, has forced many of thesechanges, data from these instruments would makesignificant contributions to our understanding ofthe Earth as an interactive system and of globalchange. If further research demonstrates thatthese or similar instruments are needed to supportadditional progress in understanding global
change, Congress may wish, before the end of thecentury, to consider supplemental funding fortheir development.
In the meantime, NASA should continue todevelop technology and scientific research re-lated to these technologies and find ways toreduce system costs. Increased cooperationwith the DOE-operated national laboratoriesoffers a particularly attractive mechanism todevelop the technology base that will be re-quired for next-generation sensors and space-craft. Lawrence Livermore National Laboratory,Los Alamos National Laboratory, and SandiaNational Laboratories, in particular, have consid-erable expertise in spacecraft instrument design.DOE has proposed collaborative projects focus-ing on the acquisition of data about Earth’sradiation budget, an important componentof DOE’s Atmospheric Radiation Measurement(ARM) program. They have also proposed collab-orative projects to develop hyperspectral sensingthat could be mounted on satellites or aircraft (theDoD also has an aircraft-based program todevelop hyperspectral sensors-’ ’HYDICE’ ‘).
International cooperation can offer a means toincrease the capability of collecting importantenvironmental data while reducing costs for anysingle government. In order to ease its own costburden for sensors and satellite systems whilemaintaining the capability to monitor importantfeatures of Earth’s environment, NASA hasreduced funding for certain sensors and enhancedits cooperative remote sensing programs withother countries. Japan and the European SpaceAgency are being asked to take on the develop-ment of several sensors that would fly on U.S.spacecraft and to provide space on their space-craft for U.S. sensors. However, internationalcooperative arrangements can only fill part of thevoid left by the rapid restructure of EOS. Some of
13 ~r dh~~ m-ement of tropospheric winds at high resolution.
M For -g hi@ resolution radar images of lant oceatL and ice sw’faces.
IS For&g high spa~ resolution images of Earth’s surface in some 200 contiguous, vexy narrow infrared and visible specmal reds.
16 SW app, B for a mom extensive discussion of these instruments and their development.

Chapter 5 GIobal Change Research |71
Table 5-2—The Current EOS Spacecraft Program
199820032008198820002003200620092012200020052010200220072012200220072012
SOURCE: 1993 EOS Reference Handbook, EOS Program Chronology.
the scientific objectives must be deferred untilnew domestic or foreign funding sources aremade available.
Increased international cooperation in remotesensing is possible because over the past decadeother countries have markedly improved theirskills in sensor development and satellite systemsintegration and construction. Canada, France,Germany, the United Kingdom, Japan, Russia,China, and India have made satellite remotesensing a priority. Prospects for greater inter-national cooperation will increase as the re-mote sensing programs of other countriesgrow in technical breadth and capability.
Some policymakers express the concern thatincreased cooperation will boost the technicalcapabilities of other countries by giving foreignindustry a chance to develop technology in whichthe United States has a strong lead. In addition,because foreign experience with some systems isless well developed than that of U.S. industry,some scientists fear sensors developed abroadmight be less capable than ones built domesti-cally, leading to incomplete data sets. Hence, in
order to ensure that the United States does notforfeit the lead in technical capabilities itconsiders vital to national competitiveness,Congress may wish to scrutinize closely thestructure of any international agreements inremote sensing.
Another problem with international cooper-ation is that each country has a strong interest inproviding the most advanced instruments orsystems. The outcome is that a cheap, simplesatellite design can quickly grow into a relativelyexpensive, complex system.
NASA expects to operate EOS and EOSDIS forat least 15 years after the launch of the secondmajor satellite (PM-1) in 2000 (table 5-2). There-fore, the program will necessarily take on thecharacteristics of what has been called an ‘opera-tional program’—in other words, sustained, rou-tine acquisition of data that must be routinelyavailable to researchers and other users on atimely basis. To achieve maximum effective-ness, NASA’s EOS Program must be organ-ized and operated with great attention to theregular, timely delivery of data. This means, for

72 | Remote Sensing From Space
example, not only that EOSDIS (box 5-D) func-tion smoothly, and in a “user friendly” manner,but that the sensor systems that feed data intoEOSDIS are prepared to deliver vast amounts ofdata with few processing errors or system slow-downs.
STRUCTURING A ROBUST RESPONSIVE,GLOBAL CHANGE RESEARCH PROGRAM
NASA plans to use EOS to provide scientistswith data relevant to questions that oftenpolarize public debate regarding climatechange and its global environmental effects.Although these data may help resolve somecontentious scientific issues, they may notproduce results that lead to clearcut policydecisions. Data from instruments aboard EOS andother satellites, as well as from many othersources, will be used to study the effects of globalchange and to predict possible future changes inEarth’s environment. Unlike the recent observa-tions of ozone-destroying chlorine molecules inthe upper atmosphere, which quickly led to aspeedup in the phase-out of U.S. chlorofluorocarbon(CFC) production, few of the research questionsthat can be addressed by the USGCRP will resultin straightforward policy responses. Most ofthese data will provide inputs to complexmodels intended to predict future climatic andenvironmental conditions. Because of the com-plexity of the models, finding sufficient scientificagreement to draw definitive conclusions forpolicymakers to act on may be especially diffi-cult. Although scientific research may provideevidence linking the production of particulargases to deleterious climate changes, predictingregional environmental changes that could signalmajor economic disruptions may not be possiblefor decades. Moreover, even when the facts areknown and the processes understood, proposedsolutions may not necessarily be clear or uncon-tentious. However, the best chance the United
States has to develop the scientific basis forgood policy is to pursue the best science, basedon a robust, responsive global change researchprogram. Such a program would include astrong commitment to making observationsfrom instruments based in aircraft, ships, andground facilities, as well as from space.
| Existing Satellite SystemsMost existing space-based remote sensing
instruments contribute in some way to globalchange research-NOAA’s environmental satel-lites, the Landsat system, and NASA’s researchsatellites. For example, the polar-orbiting NOAAPOES satellites (box 3-D) carry the High Resolu-tion Infrared Radiation Sounder (HIRS) and theMicrowave Sounding Unit (MSU), which dailymeasure atmospheric temperature and humidity,and the Advanced Very High Resolution Radiom-eter (AVHRR), which can be used to monitor theglobal state of vegetation, the extent of Arctic andAntarctic ice pack, and sea surface temperatures.Observations from both instruments contribute toresearch on global change. In general, NOAAinstruments provide the long-term data sets neces-sary for identfying previous trends (plate 9).However, because the instruments in NOAA’senvironmental satellites were designed to serveNOAA’s needs in collecting weather and cli-mate data, these instruments lack the neces-sary calibration to gather precise data re-quired for sensing and interpreting subtle,gradual changes in the environment. Sensorsaboard future NOAA satellites ought to bedesigned to provide data having better calibra-tion.17
Remotely sensed data from Landsat, SPOT,ERS-1, JERS-1, and other satellites optimized forimaging surface features will become increas-ingly important in following local, regional, andglobal environmental change (plate 7). Landsatand SPOT have contributed significant quantities
17 ~ovi~g better Ctibmtion will add to the cost of the SCIISOrS, how~ti.

.
Chapter 5-Global Change Research |73
Box 5-D—Earth Observing System Data and Information System
EOSDIS will consist of 8 interlined Distributed Active Archive Centers (DAACS) and a Socioeconomic Dataand Applications Center (SEDAC) that will archive original data, create scientific data products, and make themavailable to users either at t he centers or on line. NASA plans to spend about $1.5 billion on the development andoperation of EOSDIS. This investment will result in a large number of data sets that can be accessed repeatedlyby various users. Handling large data sets in an open network presents many challenges, and will push the stateof the art in software and communications hardware. EOSDIS will be the key link between the data collected bythe satellite systems and the scientists working on global change research.
EOSDIS will challenge NASA’s technical and organizational skills in part because the system and its dataproducts cannot be well-defined at this early stage. The data storage and retrieval system will require new imageprocessing techniques capable of handling interrelated data sets, and a transparent “window” for the user. Thesystem must be able to run in multiple operating environments, and be accessible by people possessing differentlevels of computer skills. EOSDIS will require innovative solutions to data handling that will take years to develop.EOSDIS will also require improved data compression and decompression algorithms. These compressionschemes must work at extremely fast data rates, yet not degrade data integrity. Maintaining the data securely isa priority for any large data system, and it will be extremely challenging for an EOSDIS that will be open to hundredsand eventually thousands of users.
If EOS data can reduce scientific uncertainty surrounding atmospheric and environmental changes, theprogram will be a success. A successful EOS will depend largely on the ability of EOSDIS designers and managersto create a system in which massive amounts of data can be archived, cataloged, maintained, and made routinelyaccessible to users, and which will maintain the integrity of the data.
NASA’s first objective is to expand the amount of earth science data available to the scientists. With help fromthe science user community, it has identified large, “pathfinder,” data sets for inclusion in EOSDIS Version O.Pathfinder sets will include data that have been collected over many years by operational satellites such as NOAApolar orbiters and geostationary satellites and Landsat. EOSDIS will serve as the archive for these data sets, whichwill assist global change researchers and allow NASA contractors gradually to improve EOSDIS based onexperiences of initial users. According to t he General Accounting Office, progress on gathering and reprocessingpathfinder data has been slow.1 Only one complete data set is expected to be available by 1994, and only threecomplete data sets will be available by 1996. Slow progress on pathfinder data sets may impede planning anddevelopment for latter phases of EOSDIS.
I U.S. Congress, General Accounting Office, “Earth Observing System: Information on NASA’s Incorporation ofExisting Data Into EOSDIS,” September 1992.
SOURCE: Office of Technology Assessment, 1993.
of high-quality data to archives that can be used | Small Satellitesto provide early indications of harmful change in As instruments aboard satellite svstems irn-localized areas.l8 Existing data, especially those prove, they are likely to assist in the developmentbeing prepared under the Pathfinder EOSDIS of much needed information about the globalefforts, need to be studied in detail to understand environment and how it is changing. However, asbetter how to use remotely sensed land data in currently structured, satellite systems may notglobal change studies. provide some of the most urgently needed data
18 see ~t~ew D, f’ro~~, H1~torica[~&~at Daf~ compan”~on$: I[l~s~~hOns of~ndsu~ace change ~as~ton, DC: U.S. (koIO@Cid
Survey, 1993), for a sample of the surfaw changes that Landsat data are capable of revealing. Beeause these digital data can be readily sortedand manipulated in a computer, and merged with other data, they can be used to make quantitative estimates of change.

74 | Remote Sensing From Space
in time to assist the policy debate. In addition,the United States has no plans for monitoringaspects of global change on decadal timescales.Yet, many climatologists and other scientistsbelieve that monitoring on this timescale will beessential to 1) build databases over sufficientlylong periods to support global change researchand refine predictive models, and 2) monitor theoften subtle climatic and ecological changesinduced by anthropogenically produced gases andother pollutants.19
Moreover, some researchers argue that theappropriate instrument platforms to carry outdecadal-scale measurements are not the large,complex, and expensive satellites planned forthe EOS program. These researchers argue thata balanced program for global change researchwould include smaller, less expensive, and lesscomplex satellites that would be developed spe-cifically for particular monitoring missions,20
Several agencies, including NASA, DOE, andARPA, are examining the use of small satellitesfor global change research. Small satellites,which have been defined as costing $100 millionor less, including spacecraft, instruments, launch,and operations, could:21
●
●
●
address gaps in long-term monitoring needsprior to the launch of EOS missions,22
provide essential information to supportprocess studies prior to, and complementarywith, the restructured EOS,allow for innovative experiments to improvethe ability to monitor key variables or im-prove/speed up the process studies.23
Matching small instruments with small satel-lites has several potential advantages: First, itavoids the necessity of integrating multiple in-struments on a single platform-this simplifiesthe acquisition process, albeit at a possibly higheroverall cost. Second, shortening the time tolaunch would add resilience to the satelliteportion of the global change research program,large parts of which are frozen in developmentsome 10 years before flight. Third, flying only asmall number of instruments per satellite allowsscientists to optimize the satellite orbit for aparticular set of measurements.24 Finally, flyingsmall instruments on small satellites increases thelikelihood that a small core of key environmentalsensors can:
●
●
●
be launched before the EOS system and thusprevent data gaps that would otherwise becreated in the mid-to-late 1990s (before EOSlaunches);be maintained even if EOS suffers furthercutbacks; andbe maintained for years beyond the sched-uled 15-year lifetime of the EOS system.
However, the funding for such satellites wouldhave to come from some other source than theEOS program, Otherwise, the deployment of thefirst EOS satellites (AM-1998; PM—2000)would risk being delayed.
Global change researchers express widespreadagreement on the desirability of using smallsatellites for these three roles. However, scientistsexpress sharp disagreements about the long-term
19 For e~ple, the burning of fossil fuels, use of CFCS, and agriculture.
m Liz lbcci, “EOS Backers Push for Faster Launches, ” Space News, Mar. 29, 1993, p. 14.
21 Sti Cotittee on ~ and Environmental Sciences (CEES) of the Federal Coordinating Council for Science, Wnee@, andTechr.vlogy, Report of the Small Climate Satellites Workshop (Washington DC: Office of Science and Technology Policy, May 1992).
22 Gw.fi@ spacwr~ were fi~y proposed in 1991. With the frost EOS launch scheduled fOr 1998, the oPPotitY for usfig these
spacecraft is fast drawing to a close.23 Repoti of the Smzl C/iwte Satellites Worbhop, pp. 20-21. As noted in the texti researchers at the God&d ~titute for SPace Studies
have also proposed using small satellites for long-term (decadal-scale) monitoring in a program that would complement EOS.24 Some fissions ~uke naly sfiul~neous m~u~men~ by ~struments tit c~ot k pachged on a single, sfrdl satellite. b thiS case,
a larger platform carrying several instruments may be desirable. Alternatively, small satellites could be flown in close formation.
Chapter 5 -Global Change Research |75
potential for small satellites to replace larger,more expensive satellites such as Landsat. Advo-cates of small satellites believe satellite weightand volume can be reduced by incorporatingadvanced technologies, now in development,with next generation spacecraft. However, pro-posed new instrument technologies are typicallyat an early stage of development and theircapability to provide the stable, calibrated meas-urements required for global change research islikely to be unproved, Stability and calibrationrequirements are particularly important for long-term monitoring. Fully developed data processingsystems and well-understood data reduction algo-rithms are also required to transform raw data intouseful information.25
Historically, satellite designers have mini-mized risk by introducing advanced technology inan evolutionary manner; typically, only after ithas been proven in the laboratory and acquired aheritage of space worthiness. Although expertsgenerally agree on the desirability of acceleratingthis relatively slow process, they do not agree onthe risk that would be associated with a change inthe traditional development cycle.26 The risks indeveloping a new sensor system have twocomponents: the technical maturity of compo-nent technologies (for example, the detectorsystem), and the design maturity. A particulardesign that has not been used before may be arelatively risky venture for an operationalprogram, even if it is based on proven technol-ogy. Several proposals have been made to reducethe risks of inserting new technologies intooperational programs. Box 5-E summarizes one
Box 5-E-The Advanced Research ProjectsAgency CAMEO Program
ARPA has proposed several advanced technologydemonstrations (ATDs) on small satellites that, ifsuccessful, would rapidly insert technology and shortenacquisition time for larger satellites.’ These demonstra-tions would couple innovative sensor design with ascalable high-performance common satellite bus thatwould employ a novel “bolt-on” payload-bus interface.ARPA-proposed ATDs include ATSSB (advancedtechnology standard satellite bus) and CAMEO (col-laboration on advanced multi-spectral Earth observa-tion). They were fully supported by the Department ofDefense, but were eliminated by the Senate Appropri-ations Committee for fiscal year 1993.
I See app. B for more detail on this proposal.SOURCE: Advanced Research Projects Agency, 1993.
example from the Advanced Research ProjectsAgency.
To date, budget constraints, scientific dis-putes over the merits of specific proposals,intra-agency and inter-agency rivalries, andthe absence of a coherent strategy, developedwithin the executive branch and supported bythe relevant authorization and appropriationcommittees of Congress, has limited efforts todevelop and flight-test emerging technologies.Appendix B discusses these issues at greaterlength along with specific proposals for launchingsmall EOS satellites. Appendix B also notes thatthe development of innovative, lightweight sen-sors appropriate for small satellites and thedevelopment of sensors for long-endurance, high-altitude UAVS share many common features.
25 AII illus~ative Cxmple is given by the complex analysis that is required to measure the Earth’s radiation budget (see app. B).
26 A p~ed development cyc]e has traditio~y been used to procure operational SyStemS. The Steps in tfis cycle cm be grouped as follows:
Phase A—Study Alternate Concepts;Phase B—Perform Detailed Design Deftition Study (manufacturing concerns addressed in this stage);Phase C—Select Best Approach/Buitd and Test Engineering Model;Phase D-Build Flight Prototype and Evaluate on Orbit.This approach should be contrasted with a ‘‘skunk-works’ approach which omits some of these steps. HistoricaUy, the skunk-works
approach has usually been thought more risky than the methodical approach. As a result, it has been used mostly for demonstrations andexperiments.

76 | Remote Sensing From Space
Box 5-F-Radiative Forcingsand Feedbacks
Radiative forcings are changes imposed on theplanetary energy balance; radiative feedbacks arechanges induced by climate change. Forcings canarise from natural or anthropogenic causes (see table5-3). For example, the concentration of sulfate aero-sols in the atmosphere can be altered by both volcanicaction (as occurred following the eruption of Mt.Pinatubo in June 1991) or from power generation
using fossil fuels. The distinction between forcings andfeedbacks is sometimes arbitrary; however, scientistsgenerally refer to forcings as quantities that arenormally specified, for example, CO2 amount, whilefeedbacks are calculated quantities. Examples ofradiative forcings are greenhouse gases (C02, CH4,CFCS, N20, OS, stratospheric H20), aerosols in thetroposphere and stratosphere, solar irradiance, andsolar reflectivity. Radiative feedbacks include clouds,water vapor in the troposphere, sea-ice cover, andsnow cover.SOURCE: office of Technology Assessment, 1993 and Dr. JamesHansen, Goddard Institute for Space Studies.
Present and future global climate change cann-ot be interpreted without knowledge of changesin climate forcings and feedbacks (box 5-F).“Climsat” is the name of a proposed system ofenvironmental satellites that would carry outlong-term monitoring of the Earth’s spectra ofreflected solar and emitted thermal radiation.
Climsat satellites would be flown in pairs, one inpolar and the other in inclined orbit.27 Each wouldcarry three small, lightweight instruments (seebox 5-G). Climsat satellites would be self-calibrating,
28 small enough to be orbited with a
Pegasus-class launcher,29 long-lived (nominally10 years or more), and relatively inexpensive.30
The originators of the Climsat proposal believe itcould provide most of the missing data requiredto analyze the global thermal energy cycle,specifically long-term monitoring of key globalclimate forcings and feedbacks. In addition,proponents claim Climsat would be a more“resilient” system than EOS because it wouldlaunch a small complement of relatively inexpen-sive instruments on small satellites. However,Climsat alone is not intended to fulfill thebroader objectives of the Mission to PlanetEarth and the Earth Observing System Pro-gram.
Monitoring of global radiative forcings andfeedbacks is essential to understanding thecauses, time-scale, and magnitude of potentiallong-term changes in global temperature. How-ever, a program to correlate changes in averagetemperature with changes in radiative forcingsand feedbacks is expected to require measure-ments that would extend over decades. UnlikeEOS satellites, which NASA proposes to fly fora total of 15 years, Climsat satellites would beoperated for several decades.31
27 AS describ~ k tie text, two ~telliles are specified in the Clirnsat proposal because this n-r is necessary for global COverage and
adequate sampling of diurnal variations.
~g SAGE calibration is obtained by viewing the sun (or moon) just before or after every occultation. MINT records its interferogram on asingle detector and therefore would have high wavelength-to-wavelength precision. EOSP interchanges the roles of its detector pairsperiodically. Stable internal lamps are used for radiance calibration.
‘g A launch on Pegasus costs about $10-12 million. Pegasus can carry payloads weighing up to 900 pounds.
Jo Cost estimates are uncetiatan~ly stage of concept deftition, However, two of the three Climsat iftSttUmeINS hWgOne throughpbeA/B studies k EOS. kading Goddard Institute of Space Studies researchers to make the following estimates:
SAGE III-$34 million for 3 EOS copies (18 million for fmt copy);EOSP---$28 million for 3 EOS copies ($16 million for fwst copy);MINT+i15-20 million for fwst copy.
31 EOS ~ffici~s ag& tit d~a~-s~e mofito@ of tie ~ is needed; they foresee some subset of EOS instruments evolving irlto
operational satellites designed for long-term monitoring.

Chapter 5 -Global Change Research |77
Table 5-3-Human Influence On Climate
Both the initial EOS program and the initialClimsat proposal have been revised since theirinitial presentations. Versions of two of the threeClimsat instruments are now scheduled for flighton later EOS missions. However, Climsat sup-porters argue that flying these instruments as partof Climsat would:
●
●
●
●
allow flight in proper orbits;guarantee overlapping operations (over longerperiods), which would result in better cali-brated measurements;allow launch several years before the rele-vant EOS platforms;32 andallow instrument modification on a shortertime-scale than EOS instruments and thus bebetter able to respond to scientific surprises.
Supporters also argue that Climsat instrumentsare better designed to handle scientific surprisesbecause:
●
●
unlike related larger instruments on EOS,they cover practically the entire reflectedsolar and emitted thermal spectra, andthe Climsat instruments measure the polari-zation as well as the mean intensity of thesolar spectrum where polarization is highlydiagnostic of the observed scene.
A key argument in favor of the Climsatproposal is its potential to carry out a core groupof key remote sensing measurements on a decadaltime-scale. In effect, supporters of Climsat arguethat the data that would be gathered by Climsat—or a similar system-is too important to be tied tothe budgetary fate and schedule of EOS. Detrac-tors of the Climsat proposal include those whobelieve that its funding could come only at thedetriment of an already diminished EOS program.Further, they contend that Climsat addresses onlya narrow part of the climate problem. Forexample, they question whether data fromClimsat are, in fact, more important than data onocean color, land-surface productivity, atmos-pheric temperature and humidity, and snow andice volume.
| Complementing Satellite MeasurementsSatellites alone cannot carry out a robust
program of global change research, Orbitingabove the atmosphere, a satellite remote sensingsystem receives information about atmospheric orterrestrial processes only via electromagneticsignals reflected or emitted from the atmosphereor the surface. Sensors collect these signals andtransform them into forms that can be used asinput data for analysis and interpretation. Scien-tists need to compare satellite data with surface-based or airborne measurements to verify that thesatellite data are free of unforeseen instrument
32 Dr. Jme~ H~~n, d~v~loper of tie Clfisat pmps~, esti~tes tit fie Cbsat satelfite wo~d re@re 3 years to build and bi~ch after
approval and procurement processes are complete.

78 I Remote Sensing From Space
Box 5-G - The Data Storage Problem
The sheer size of archives for remotely sensed Earth data can be estimated through some simplecalculations. The data storage requirement is the product of the storage needed for each pixel and the numberof pixels. Such a calculation is done in terms of “bits,” the O’s and 1’s used in computers’ binary arithmetic.
As an example, consider an Earth’s worth of Landsat-like pictures from a notional satellite with 10 bands, eachimaging 25- X 25-meter pixels in terms of 32 brightness levels. The 32 gradations of brightness are expressedby 5 bits, so each square kilometer, consisting of 1,800 pixels, requires 1,800X 10X 5 = 80,000 bits, or 10kilobytes. (For comparison’s sake, this box requires about 2 kilobytes of computer storage.) The Earth’s 200 millionsquare kilometers of land, therefore, would require 2 billion kilobytes of storage capacity.
Two billion kilobytes is roughly the storage capacity of 20 million late-model home computers or 3,000compact disc recordings.
The Human Genome Project, to take another example of data collection and storage, will not have to dealwith nearly this much data. The genome consists of 3.3 billion base pairs, each embodying 1 bit. Thus the genomeis “only” 3,300 megabits, or about 400 megabytes-about the contents of half a compact disc.
To observe change, or the most current situation, further pictures are needed and must be stored. Each addsanother 2 billion kilobytes. Inclusion of the water-covered three-quarters of the Earth’s surface would increase thesize of each picture to 8 billion kilobytes, and “hyperspectral” techniques, involving 100 bands instead of 10, wouldincrease storage needs an additional tenfold.SOURCE: office of Technology Aseeesment, 1993.
artifacts or unforeseen changes in instrument mounted faster on an aircraft or balloon experi-calibration. These comparisons are particularly ment than on a satellite. Furthermore, as notedimportant for long-term measurements and for earlier, the development of instrumentation onmeasurements that seek to measure subtle changes. airborne platforms greatly assists the develop-Satellite data must also be corrected to account for ment of space-qualified instrumentation for satel-the attenuation and scattering of electromagnetic lites. However, balloons and aircraft cannot beradiation as it passes through the Earth’s atmos- used for monitoring global phenomena that havephere. In addition, corrections are necessary to small-scale variability because their coverage isaccount for the variations in signal that occur as limited in time (intermittent coverage, weathera result of changes in satellite viewing angle. restrictions) and space (altitude ceilings, geo-Nonsatellite data can also assist in the analysis of graphic restrictions).satellite data by clarifying ambiguities in theanalysis and confirming certain measurements.Finally, sensors on satellites may be limited in | Process Studies and Unpiloted Airtheir capability to make measurements in the Vehicleslower atmosphere, and they may be unable to “Process”3 3 studies, which are necessary tomake the detailed measurements required for understand global forcings and feedbacks incertain process studies. detail, require ground and in situ measurements.
Balloons and aircraft are generally more “re- For example, a detailed understanding of thesponsive” than satellites: in general, an experi- kinetics and photochemistry that govern thement to monitor a specific process can be formation of the Antarctic ozone hole (and the
33 ~e~ is no clear delineation between “process” studies and monitoring studies. In gener~ global change researchers use the term‘‘process study’ to refer to shorter term less costly, and more focused experiments that aim to elucidate the details of a particular mechanismof some geophysical, chemical, or biological interaction.

Chapter 5-Global Change Research |79
role of the Antarctic vortex) has only beenpossible with in situ balloon and high-altitude
34 Development of highaircraft measurements.altitude unpiloted aircraft would extend thesemeasurements, which would be especially usefulin elucidating the mechanisms that cause signifi-cant loss of ozone over the Arctic and northernlatitudes.
High-altitude unpiloted air vehicles (UAVS)offer significant advantages over satellites formeasuring some upper atmospheric constituents.In particular, they can be used for accurate in situmeasurements-actually sampling the constitu-ents of the upper atmosphere and using thesamples to decipher, for example, the chemicalreactions taking place among stratospheric ozone,chlorine monoxide, bromine monoxide and otherman-made substances. Because instruments onUAVS can be changed or adjusted after eachflight, UAVS are also potentially more responsivethan satellite systems to new directions in re-search or to scientific surprises. Unlike balloons,they move through the air, rather than with it,allowing operators to guide their paths.
In addition to its use of high-altitude balloonsand piloted aircraft, NASA plans to employ asmall UAV called Perseus, developed by thesmall private firm, Aurora Flight Services, Inc.3s
for atmospheric studies. The first two Perseusaircraft (Perseus A) are scheduled for delivery toNASA at a cost of about $1.5 to $1.7 million each.NASA will initially use sensors carried onPerseus to determine the chemistry and move-ment of gases in the stratosphere at altitudes up toapproximately 25 kilometers (82,000 feet).
UAVS may provide global change researcherswith low-cost and routine access to regions of theatmosphere that are inaccessible to piloted air-craft, sampled too infrequently by balloon, andsampled too coarsely by satellites. UAVS shouldalso be highly cost effective in providing crucialin situ measurements of atmospheric chemicalconstituents. They are also a natural test-bed forsmall, lightweight instruments proposed for flighton small satellites. Despite their potential toenable measurements that are crucial for theglobal change research program, governmentsupport for UAV development, and associatedinstrumentation, has been meager and may beinadequate to provide a robust UAV capabil-ity. If Congress wishes to encourage innova-tion in global change research, it may wish toincrease funding for UAVS. Because of their lowdevelopment costs, moderate funding increases ofonly a few million dollars could ultimately lead toa substantial increase in UAV availability forresearch. 36
Satellites view the Earth only from above theatmosphere; this limits their measurement of twophysical quantities of interest to global changeresearch. One, the angular distribution of radia-tion, is necessary for measurements of Earth’sradiation budget.37 The other, the ‘‘flux diver-gence, ’ can be related to the net heating thatoccurs in a particular layer of the atmosphere. Itis a fundamental parameter in global circulationmodels of Earth’s atmosphere and climate. UAVSare ideally suited to make these measurementsand would complement groundbased observa-
34 J,G. Andersou D.W, Toohey, W’.H ‘~e~ ‘‘Free Radicals Within the Antarctic Vortex: The Role of CFCS in Antarctic Ozone Lmss,’Science, vol. 251, Jan. 4, 1991, pp. 39-46.
35 Richard Monastersky, ‘ ‘Voyage Into Unknown Skies, Science News, V01,139, Mar, 2, 1991, pp. 136-37; Michael A. Dornheirn, ‘‘PerseusHigh-Altitude Drone to Probe Stratosphere for SST Feasibility Studies, ” Aviation Week and Space Technology, Dec. 9, 1991, pp. 36-37.
36 NASA is now askfig for additio~ ~d~g of $90 ~ion ovm 5 years to build and fly (JAVS for scientilc research.
37 me ~,s ~ ~r~lation budget’ comis~ of ~cident sutight minus reflected sunlight (for example, from the tops of clouds) and radiation
emitted back to space, primarily from Earth’s surface and atmosphere. The emitted radiation falls predominantly in the infrared and far-inffaredportion of the electromagnetic spectrum. Earth’s average temperature rises or falls to keep the total incoming and outgoing energy equal.Changes in the amount of energy entering or leaving Earth result in global warming or cooling.
80 I Remote Sensing From Space
tions made in the Department of Energy’s atmos- system integrating high-quality measurements ofpheric radiation program (ARM) .38 atmospheric winds, temperature, and moisture,
Groundbased observations in DOE’s ARM would serve to calibrate satellite measurements inprogram also provide an important source of portions of the atmosphere in which measure-calibration data for space-based observations of ments of the satellite and groundbased instru-atmospheric solar heating. Likewise, NOAA’S ments overlap.proposed Telesonde program,39 a groundbased
38 U.S. Dep~~t of Enqy, Office of Hea.lti and Environmental Researck Atmosphen”c Radiation Measurement UWIUnnedAerOwace
Vehicle and Satellite Program Plan, March 1992 draft (Washingto~ DC: Department of Energy, March 1992). Also see Peter Banks et. al.,Small Satellites andRPAs in Global-Change Research, JASON Study JSR-91-33 (McLean, VA: JASON Program OffIce, The MITRE Corp.,July 13, 1992).
w “M~gement ~omtio%” Wave fiopagation Laboratory, National OCeaniC ~d Atmospheric A*@itioQ October 1990.

Military Usesof CivilianRemotely
SensedData 6
D ata from civilian satellites systems such as Landsat, butmore notably SPOT and the Russian Almaz, l haveconsiderable military utility. They can be used toSUDDOrt:
●
●
A L
Military operations—For example, the use of Landsat andSPOT data gave the United States and its U.N. allies amarked advantage over Iraq in the Persian Gulf Conflict.The U.S. Defense Mapping Agency used these data to createa variety of maps for the U.S.-led battle against Iraqi forces(figure 6-l). More recently, in March 1993, the UnitedStates has used Landsat and SPOT data to create maps of theformer Yugoslavia in support of air delivery of food andmedical supplies to besieged towns of Eastern Bosnia.Reconnaissance —The recent use of data from civiliansatellites for military reconnaissance demonstrates thatpost-processing, skilled interpretation, and the use ofcollateral information can make these data highly informa-tive. For this reason, the civilian satellites’ utility inreconnaissance exceeds that which might be expected on thebasis of ground resolution.2 The highly conservative rulesof thumb normally used to relate ground resolution tosuitability for particular reconnaissance tasks underestimatethe utility of moderate resolution multispectral imagery.
However, reconnaissance missions’ requirements fortimeliness often exceed the current capabilities of civil-
1 In October 1992, Almaz, which had been transmitting data from its syntheticaperture radar, fell back into the atmosphere and burned up.
2 Ground resolution is a useful but simplistic measure of the capability to identifyobjects from high altitude.
81

82 I Remote Sensing From Space
Figure 6-l—Bomb Damage Assessment of Baghdad During the Persian Gulf Conflict
Although these SPOT images of downtown Baghdad, Iraq, have sufficient ground resolution (10 m) to distinguish intact bridges(left) from damaged ones (right), SPOT’s usual timeliness would be inadequate for many bomb damage assessment tasks.SOURCE: Copyright 1993, CNES. Provided by SPOT Image Corp., Reston, VA.
ian satellite systems. Landsat satellites pass overany given place along the equator once every 16days; SPOT passes over once every 26 days. Inaddition, both systems may take weeks to processorders and military data users generally requiremuch shorter response times. Because civilianmissions generally have less stringent require-ments than military ones, civilian satellite sys-tems will continue to fall short in this regardunless they begin to cater expressly to the militarymarket or improve revisit time for other reasons,such as crop monitoring or disaster tracking. Asnoted in chapter 4, one way to increase timelinesswithout adding additional satellites is to providesensors with the capability of pointing to the side.SPOT has the capacity for cross-track imaging,and can reimage targets of interest in 1 to 4 days.
. Arms Control—Civilian satellite data havelimited, but important utility for support-ing arms control agreements. Althoughsome facilities have been imaged by civiliansatellites, many other arms-control tasks arebeyond the capabilities (particularly resolu-tion) of civilian satellites. Their greatest
weakness in most military applications-lack of timely response-is of less concernin the arms control arena, where events aretypically paced by diplomatic, not military,maneuvers.Mapping—Mapping, including precise meas-urement of the geoid3 itself, is a civilianmission with important military applica-tions. These include simulation, training,and the guidance of automated weapons.Existing civilian satellite data are not ade-quate to create maps with the coverage orprecision desired for military use. The mili-tary use of data from civilian land remotesensing satellites would be greatly en-hanced by improved resolution, true ste-reo capabilities, and improved orbitallocation and attitude of the satellite. Mili-tary map makers and planners would alsofind use for data acquired with a civiliansynthetic aperture radar system, whichcan sense Earth’s surface through layersof clouds.
3 The figure of the solid Earth.

—
Chapter 6–Military Uses of Civilian Remotely Sensed Data | 83
Box 6-A—The Broadening of Access to Military Information
The commercial availability of militarily useful remotely sensed imagery has sparked the interest of manyinterested in military affairs. Landsat and SPOT images have appeared in the media, and have been used tosupport news stories about military action or potentially threatening behavior (plate 1O). l
Individuals who have used these images to make significant deductions regarding military activity includeJohnny Skorve, whose photographic explorations of the Kola Peninsula using SPOT and Landsat images fill twovolumes; Bhupendra Jasani, who has used SPOT data of the territory of the former Soviet Union to investigatemilitary questions including INF Treaty compliance (plates 11 & 12), and reporters for several news organizations.These efforts have shown that the resolution provided by SPOT and Landsat, while poor compared to therule-of-thumb requirements often stated for some military tasks, is more than sufficient to provide useful and evenintriguing military information.
Civilians have also explored the military use (as distinct from utility) of civilian satellites by studying the recordsof SPOT Image, S.A. The corporation does not identify its customers, but its catalogue does list pictures alreadytaken by latitude, longitude, and date. Peter Zimmerman makes a convincing case, on this basis, that SPOT hasbeen used for military purposes.
These investigations of military matters share at least one trait in common: they do not require especiallytimely data. As described in appendix C, it is lack of timeliness, not of resolving power, that most limits the militaryuse of civilian satellites.
See U.S. Congress, Office of Technology Assessment, Commercial Newgathering from Space, OTA-lSC-TM-40 (Washington, DC: U.S. Government Printing Office, May 1987).
SOURCE: Office of Technology Assessment, 1993.
Because other nations control some of the are offered to all purchasers at the same price andmost capable civilian remote-imaging satellites, delivery schedule, foreign belligerents can buythey could deny the United States access to some Landsat data to further their wars against eachimagery for political reasons, or operate their other. These data, coupled with information fromsystems in ways inimical to U.S. interests. the Global Positioning System (GPS), might evenInvestment in improving U.S. technical be used to prepare for a war (or terrorism) againststrength in civilian remote-imaging could allay the United States or its allies. As technicalthese fears. However, attempting to stay far progress continues to improve spatial and spectralahead of all other countries in every remote resolution, the military utility of successive gen-sensing technology could be extremely expen- erations of civilian remote sensing satellites willsive, and would therefore be difficult to sustain also improve. Although such uses of satellitein an environment of highly constrained budg- data may pose some risk to the United States orets for space activities. From the national its allies, the economic and political benefits ofsecurity perspective, staying ahead in technol- open availability of data generally outweighogies of most importance to national security the risks.interests may be enough. The wide availability of satellite imagery of
Because all countries now generally follow moderate resolution, and inexpensive computera nondiscriminatory data policy,4 in which data tools to analyze these images, broadens the
4 This principle was originated by the United States when it decided to seLl Landsat data on this basis. See U.S. Congress, OffIce of
Technology Assessment, Remote Sensing and the Private Sector, OTA-ISC-TM-239 (Washington, DC: U.S. Government Printing OffIce,April 1984) for a discussion of the relationship of the U.S. nondiscrimina tory data policy to the ‘‘Open Skies’ principle.

84 | Remote Sensing From Space
number and types of institutions and individualswith access to information about secret sites andfacilities (box 6-A). Such information contributesto a widening of the terms of the political debateover future military policies in the United Statesand elsewhere.
Because the military value of remotely senseddata lies in timely delivery, the United Statescould cut off access to data as soon as the
countries’ belligerent status is made clear, as inthe Persian Gulf Conflict where both SPOTImage, S. A., a French firm, and EOSAT, Inc., cutoff data to Iraq. In that case, the French were partof the allied team opposing Iraq. However, theUnited States and France (or another country thatoperates a remote sensing system capable ofbeing used for military purposes) might be onopposing sides of a future dispute.

The United States annually invests hundreds of millionsof dollars in remote sensing satellite systems andservices. Some of this investment has stimulated amarket for commercial products. Private industry con-
tributes to U.S. satellite remote sensing systems in several ways.Under contract to the Federal Government, private companiesbuild the satellites, ground stations, and distribution networks. Inthe case of the Landsat system, a private firm, Earth ObservationSatellite Co. (EOSAT), markets data from Landsats 1 through 5and will soon sell data from Landsat 6.1 In a new financial andorganizational arrangement, Orbital Sciences Corp. (OSC) plansto launch2 and operate the SeaStar remote sensing satellite,which will carry a sensor capable of monitoring the color of theocean surface. Among other ocean attributes, ocean color dataindicate ocean currents, fertile fishing grounds, and ocean health.OSC will sell the data generated by this sensor to an assortmentof customers, including the Federal Government.3 Finally, theremote sensing value-added sector develops useful informationfrom the raw data supplied by aircraft, satellite, and othersources, and sells the resulting information to a wide variety ofusers.
The value-added sector is part of a much larger informationindustry that employs geographic information systems (GIS) andother tools to turn raw data from satellites, aircraft, and other
The Roleof the
PrivateSector 7
sources into useful information. Industry products include maps;
1 Landsat 4 and 5 are currently operating. Landsat 6 will be launched in mid 1993.
q Through NASA, which is acting as an anchor tenant for the arrangement.
85

86 I Remote Sensing From Space
inventories of crops, forests, and other renewableresources; and assessments of urban growth,cultural resources, and nonrenewable resources.According to market estimates, sales of data,hardware, and software currently total about $2billion annually.4 GIS hardware and softwarehave the unique advantage of being able to handlespatial data in many different formats and tointegrate them into usable computer files. For thenext several years, at least, the private sector islikely to derive greater profits from the provi-sion of value-added services than from owningand/or operating remote sensing satellites.Private firms will also likely continue to be asource of improved methods of accessing,handling, and analyzing data.
Improved market prospects for the sales of landremote sensing data will depend directly on thecontinued development of faster, more capable,and cheaper processing systems. In addition, thecontinued improvement of GIS software andhardware will make remotely sensed data accessi-ble to a wider audience. In turn, the growth of theGIS industry will be aided by the development ofthe use of remotely sensed land data, includingthe extensive archives of unenhanced Landsatdata that are maintained by the U.S. GeologicalSurvey Earth Resources Observation Systems(U. S.G.S. EROS) Data Center, Sioux Falls, SouthDakota. 5 OTA will assess the prospects forenhancing the private sector involvement inremote sensing in two forthcoming reports.
Despite professed interest among private entre-preneurs in building and operating land remotesensing satellites systems,6 the high systems costs
and the lack of a clearly defined market for
remotely sensed data have inhibited private offer-ors.7 For example, although EOSAT has stream-lined the operations and data distribution systemof Landsat, and achieved sufficient income tocontinue its efforts without government support,projected increases in revenues from data sales donot appear sufficient to enable a system operatorto finance the construction and operation of theLandsat system. Despite several technologicaladvancements since the 1970s when the NationalAeronautics and Space Administration (NASA)launched the first Landsat satellites, Landsatsystem costs have remained high. The Landsat 6satellite cost about $320 million to build. Landsat7, which improves on the sensors of Landsat 6,will cost between $440 and $640 million to build,depending on whether or not it will carry the HighResolution MultiSpectral Stereo Imager (HRMSI)desired by the Department of Defense (DoD) andNASA.
Future commercialization efforts will dependon whether firms can raise sufficient privateand/or public funding to pay for a system that isprivately developed and operated. The futureviability of a private remote sensing systemwill depend on drastically reducing the costs ofa satellite system through technology develop-ment and/or dramatic market growth. It mayalso rest on allowing private operators todetermine their own data pricing policies.8
Since it launched the frost civilian remotesensing satellite in 1960, in support of theprinciples of “open skies” and free flow ofinformation, the United States has followed apolicy of making remotely sensed data availableon a nondiscriminatory basis to potential custom-
4 ~ ~G1s M~ket5 and @mtunities, 1991s “ Daratech, Cambridge, MA, 1991.
S The EROS data center archive contains some 210,000 multispectral Thematic Mapper scenes gathered fmm around the globe since 1982.
6 See, for example, U.S. Congress, Office of Technology Assessment Commercial Newsgathering from Space, OZ4-TM-ISC-40(Washington DC: U.S. Government printing Office, May 1987).
T However, private companies have invested in less costly aircraft systems. For example, Texaco, Inc. recently embarked on a rnajorprogramto develop a multiband aircraft imaging system for environmental analyses and spill detection.
8 U.S. Congress, Office of Technology Assessment, Remotely Sen.red Data porn Space: Distribution, Pricing, and Applications(Washington DC: Office of Technology Assessment, July 1992).

Chapter 7—The Role of the Private Sector |87
ers — in other words, on terms that are the sameto all customers.9 The Land Remote SensingPolicy Act of 1992 retains nondiscriminatory dataavailability 1o for government-supported systems,but it gives authority to the Secretary of Com-merce to license firms who wish to launch andoperate privately funded systems. These firmsmay offer data on their own terms,l 1 providedthey have not received funding from the U.S.Government to acquire their systems. In January1993, the Department of Commerce (DOC)granted the first commercial remote sensinglicense to WorldView Imaging Corp. of Liver-more, California. The license allows WorldViewto operate a pair of multispectral imaging satel-lites in low Earth orbit. WorldView expects tolaunch its satellites, which are designed to gatherpanchromatic data of 3 m resolution, in a fewyears. 12 On June 10, 1993, Lockheed Corp.
announced that it filed with DOC for a license tooperate a satellite system capable of 1 m resolu-tion (panchromatic) .13
The greatest problem private industry faces indeveloping and operating a remote sensing sys-tem is the difficulty of obtainin g sufficient privatecapital to finance the venture. The Federal Gov-ernment is the largest customer for land remotesensing data. If private industry were able tocount on sufficient sales of data to the governmentfor its needs, the financial markets might be morewilling to finance a remote sensing system.Therefore, if Congress wishes to encourage thedevelopment of a private satellite industry thatbuilds and operates remote sensing satellites, itcould direct Federal agencies to contract for
the provision of data from a privately ownedand operated satellite system, or systems,rather than contract for the construction of asystem to be owned by the government.
Such an approach would give greater discretionto private industry to use its innovative powers tosolve technical problems. It might also involvegreater technical and financial risk, both to thegovernment and to private firms, than one inwhich the private sector acts solely as contractorto the government.14 In the long run, encouragingindustry to take greater responsibility for theprovision of remotely sensed data may also leadto wider data use, as industry would then beencouraged to find new uses for the data. Theexperiment with OSC’s SeaStar satellite systemshould provide useful insights for the develop-ment of future privately owned satellite systems.NASA contracted with OSC to provide a speci-fied quantity of data from the SeaWiFS sensoraboard SeaStar for a specified price. The arrange-ment allows NASA to provide some funding($43.5 million) Up front that OSC has been able touse in developing the sensor and satellite. Moreimportant, NASA anchor tenant agreement withOSC also allowed the company to secure neededadditional funding from the private financialmarket. If this arrangement proves successful, itmight pave the way for similar agreements fordata from larger, more complicated satellites.
In addition, Congress might wish to explorethe option of funding a research programspecifically designed to reduce the costs ofremote sensing systems; cost reduction wouldtake precedence over providing greater capa-
9 U.S. Congress, ~lce of Technology Assessrnen4 Remote Sensing and the Private Sector, OTA-ISC-TM-239 (Washingto% DC: U.S.Government Printing Of31ce, April 1984), p. 7.
10 Ibid.
11 my my, for e~ple, elat to c~ge I@CI prices for more timely detivery of dat& or, fOr m ~ditio~ f=, s~t exclusive access to
certain data for a spectiled period.
12 U.S. ~~ent of commerce News Release, Jan. 28, 1993.
13 ~ud David, ‘‘~~e~ Plans to Market Spy-Quality Imagery, ’ Space News, June 14, 1993.
14 As ~ted ealicr ~ ~~ ~eP~ system p~d for solely by tie Feder~ Govmnment, of ~Mse, ~SO SUSMiXI budge~ tWhDictd, and
progr aromatic risks.
88 I Remote Sensing From Space
bility. It might, for example, wish to fund, on acompetitive basis, the private development ofsensors and small satellite buses specificallydesigned to reduce costs. Although such innova-tive programs involve greater risk than the usualway government procures new technology, as thedevelopment of amateur communications satel-lites has demonstrated, they also have a poten-tially high payoff in increased provision ofinexpensive services.
15 Among other things, an
innovative program to reduce sensor and satellitecosts, or to provide increased capability, mightintroduce greater competition into the develop-ment of remote sensing satellite systems.
The government might also wish to involve theprivate sector in global change research bysharing data sets with private industry for re-
search purposes. In a 1992 report, the GeosatCommittee pointed out that the oil, gas, andmineral extraction industry is heavily involved inperforming research on the environment in con-nection with its profit-making interests. TheGeosat Committee proposed to institute pilotprograms that would involve both private indus-try and the government in a research partnership,in which the government could gain useful globalchange information, and private industry wouldgain access to a wide variety of data to support itsresearch interests.
16 Such research programs, inwhich the government and the private sector joinforces in partnership, could enhance the signifi-cance of remotely sensed data for global changeand even lead to innovative new methods forusing them.
15 ~tew ~dio ~Pmtors ~ve b~t ~d ~~ched seve~ ~1, low-cost, low-orbit communications satellites. See U.S. Congress, OfflCe
of Technology Assemnen4 Aflorduble Spacecraji: Design and Luunch Alternatives, OTA-TM-ISC-60 (Washington DC: U.S. GovernmentPrinting Offke, September 1990), pp. 19-20.
16 me -Sat Committee, ~c., ‘‘Applying Resource Industry’s Research to the U.S. Global Change Research Program,’ No- OK,1992.

InternationalCooperation
andCompetition 8
The European Space Agency (ESA) and the governmentsof China, France, India, Japan, and Russia each operateremote sensing systems to study Earth’s surface. 1
Canada will join this group in 1995 when it launchesRadarsat, a system optimized to monitor ice conditions, espe-cially in the northern hemisphere. Europe, Japan, and Russiaoperate satellite systems designed to gather weather and climatedata. In many cases, data from these systems complement U.S.data. In others, they overlap them. The many non-U.S. remotesensing systems either planned or in operation raise concerns ofcompetition and cooperation for the United States. Untilrecently, the United States led the world in all areas of remotesensing from space. Now other countries compete with theUnited States for the small but growing commercial market inremotely sensed data. For example, SPOT Image, S.A., has beenselling data from the French SPOT satellite since 1987. Othercountries also compete with the United States for scientific andtechnological kudos.
INCREASED INTERNATIONAL COOPERATION IN EARTHMONITORING AND GLOBAL CHANGE RESEARCH
The experience of Canada, ESA, France, Japan, and Russiawith remote sensing technology and data handling suggests thatthey would make effective partners in cooperative satellite anddata programs. Indeed, as noted earlier in this report, the UnitedStates plays an active part in cooperative activities to gather anddistribute meteorological data (box 8-A). It also cooperates
I I
89

90 I Remote Sensing From Space
Box 8-A-international Cooperation in Weather Monitoring
International cooperation in meteorological satellites has a long, successful history.1 The U.N. WorldMeteorological Organization (WMO), founded in 1951, can trace its roots to the International MeteorologicalOrganization, which was established in 1853. The WMO is a planning and coordinating body with basic programsto help all countries cooperatively produce and obtain important meteorological data.
Extensive cooperation is evident between the United States and many European countries. As noted, theUnited States has excellent working relations with Eumetsat and now relies on a Eumetsat weather satellite toaugment coverage of the remaining geostationary operational environmental satellites (GOES) platform; theUnited States had previously made excess GOES weather monitoring capability available to Europe.
Although international cooperation can reduce costs to each party, there are limits on the extent ofcooperation that infeasible. For example, weather patterns and the nature of severe storms in the United Statesare different than those of Europe. In the future, U.S. meteorologists are interested in obtaining simultaneousimages and soundings, a capability that will provide better warning of relatively small, violent storms, such astornados. Because the conditions that might produce small, extremely severe storms are very seldom present inEurope, Eumetsat accords lower priority to simultaneous imaging and sounding in its geostationary satellitesystem.
1 See appendix D for a more detailed description of international oooperatfon in weather monitoring and otherremote sensing activities.
extensively with Europe on the National Oceanic planned satellite Earth observations,3 and in theand Atmospheric Administration’s (NOAA) polarorbiting satellite system, and both Europe andJapan have important roles in National Aeronau-tics and Space Administration’s (NASA) EarthObserving System (EOS) program. In addition,the United States has worked closely with Canadaon the development of Radarsat. NOAA andNASA have sought cooperative arrangements inorder to reduce their program costs, but also to tapthe considerable scientific and engineering exper-tise available in Japan and Europe. U.S. partnershave similar motivations with respect to theUnited States.
The United States participates in the Committ-ee on Earth Observation Systems (CEOS), cre-ated in 1984,2 which coordinates existing and
International Earth Observing System (IEOS),which NASA organized to coordinate the work ofthe international partners in EOS. In other words,these cooperative arrangements provide benefitsconsistent with U.S. space policy:
The United States will conduct internationalcooperative space-related activities that are ex-pected to achieve sufficient scientific, political,economic, or national security benefits for thenation. 4
The success of these cooperative efforts and thedesire to make greater use of shared scientific andtechnical resources, combined with the need tofind more efficient, cost-effective ways of gather-ing global environmental data have led to numer-
Z CEOS developed out of discussions begun in 1982 at the June meeting of the Economic S ummit of Industrialized Nations in which aworking Oroup on Technology, Growth and Employment discussed cooperative efforts in satellite remote sensing. An international Panel ofExperts on Remote Sensing from Space, chaired by the United States, established CEOS in 1984,
s D. Brent Smit.iL “International Coordination of Earth Observation From Space Activities. ’ Paper presented at the Twenty-’l’hirdInternational Symposium on Remote Sensing of Environment, Bangko& Thailand, Apr. 18-25, 1990.
4 The White House, National Space Policy, Nov. 2, 1989, p. 2.
Chapter 8-international Cooperation and Competition |91
ous suggestions for closer international coopera-tion in environmental remote sensing.s Suchsuggestions are consonant with more generalinterest in enhanced international cooperation.
The end of the Cold War and the continuedgrowth of scientific and technical competenceoverseas makes such cooperative arrangementsmuch more feasible than before. Indeed, severalrecent reports have urged greater internationalcooperation in space activities than previouslyexperienced.6 However, the perceptions, habits,and institutions developed by the world duringthe height of the Cold War will not changequickly. In addition, as several recent reports ofthe Carnegie Commission on Science, Technol-ogy, and Government have noted, U.S. scienceand technology institutions need to be improvedin order to foster more effective internationalcollaboration. 7
INTERNATIONAL COOPERATION ANDSURFACE REMOTE SENSING
Several authors have suggested that the UnitedStates should approach other countries aboutestablishing a cooperative program in surfaceremote sensing.8 Because both commercial con-siderations and government prestige and controlare involved in the provision of remotely sensed
surface data, the issue of cooperation is morecomplicated than with strictly government-government cooperative arrangements, or withstrictly commercial cooperative ventures. On theone hand, satellite system costs often exceedone-half billion dollars for a single satellite andits associated ground systems.9 On the other, theexistence of several systems, each generating dataof somewhat different characteristics and quality,gives data purchasers a greater variety of datasources from which to choose. Yet, as a result ofthe high system and operations costs, data pricesremain high even though they are still highlysubsidized. In order to limit unnecessary re-dundancy by governments, reduce costs, andto promote more effective application of thedata for a wide variety of data users, the UnitedStates may wish to explore the potential forworking with other countries in a cooperativeventure in surface remote sensing.
The existing governmental and commercialstructures for multispectral land remote sensingprovide a specific example of how difficult suchcooperation might be to arrange. For example, theFrench firm SPOT Image, S.A. sells data from theFrench SPOT satellite in competition with theU.S. company Earth Observation Satellite Co.(EOSAT), which markets data from the U.S.Landsat satellite. In both cases, the governments
5 John H. McElroy, “Intelsat, Inmar sat and CEOS: Is Envirosat Next?” Presented at the American Institute for Aeronautics andAstronautics Workshop on International Space Cooperation: barring from the Past Planning for the Future, Hawaii, December 1992; D. BrentSmitlL Linda V. Moodie, Betty A. Howard, Lisa R. Schaffer, and Peter Backlund, “Coordinating Earth Obsemations from Space: l’bward aGlobal Earth Observing System” (IAF-9(L1OO). Presented at the 41st Congress of the International As@omutical Federation October 1990,Dresden.
b U.S.-Crest, Partners in Space (Arlingtom VA: U. S.-Cres4 May 1993); Vice President’s Space Policy Advisory Board, A Post Cold WarAssessment of U.S. Space Policy (Washington DC: The White House, December 1992), pp. 33-38; Space Policy Institute and Association ofSpace Explorers, “International Cooperation in Space-New Opportunities, New Approaches: An Assessment,” Space PoZicy, vol. 8, No. 3,August 1992, pp. 195-204.
7 Carnegie Commission on Science Technology, and Government Science and Technology in U.S. International Affairs (New York NY:Carnegie Commission January 1992); Carnegie Commission on Science Technology, and Government ZnternationalEnvironmental ResearchandDevelopment Research andAsses$ment: Proposals forgetter Organizan”on andDecision Making @Jew York NY: Carnegie Commissio%July 1992).
8 Neil R. Helm and Burton 1. Edelsou ‘‘An Internation.rd Organization for Remote Sensing’ (IAF-91-1 12). Paper presented at the 42ndCongress of the International Astronautical Federation October 1991, Montreal, Canac@ John L. McLucas and Paul M. Maughan, ‘ ‘The Casefor EnvirosaC” Space Policy, vol. 4, No. 3, August 1988, pp. 229-239.
9 DOD and NASA ~~ate ~t for ~dsat 7, a~isition ad operatiom costs over 5 y~s of operation will toti over a bitlion dolhirs.
See ch. 4.

92 | Remote Sensing From Space
paid for and launched the satellites. Until theRussian Almaz satellite, which carried a syntheticaperture radar (SAR), failed in October 1992, aRussian government corporation was marketingdata from the government-owned and operatedsatellite.l0
”
Such a cooperative venture might be tried witha system for which the commercial data marketsare less well developed. For example, the UnitedStates could seek to institute a cooperativedevelopment program for a SAR system, to beused not only for global change research, but alsofor supporting development and resource man-agement projects, and for a wide variety ofcommercial uses. The U.S. SAR, which NASAhad planned to build as part of its EOS, wouldhave been a highly sophisticated and expensive,multifrequency, multipolarization system.11 Be-cause of the cost and technical risk involved,NASA deferred development of its EOS SAR.However, because several other countries alsohave experience in building SAR instruments, itmight be possible to construct an effectivemultifrequency, multipolarization SAR system inpartnership with other countries. One way to dothis and keep the technical and managerialinterfaces relatively uncomplicated would be foreach organization involved to build its own SARsatellite designed to operate at a frequencydifferent from the others. 12 Each satelleite could
also be designed to operate aeat several polariza-tions.13 If flown in adjacent orbits, these satelliteswould operate much like a multifrequency, mul-tipolarization SAR on a single platform, but thecost and technical risk of each satellite would beless than for the single platform.
Under this arrangement, partners from differ-ent countries or space organizations could eachcontribute different space instruments, satelliteplatforms, or receiving systems in return forfavorable data prices. Each partner could stilldevelop expertise in several different areas, coop-erating where expertise did not overlap, compet-ing where it did. Because the scale of theinvestment would be so large as to require majorfunding from governments, who would also bethe venture’s primary customers, it might bepossible to structure the project initially under theaegis of CEOS. If the system were technicallysuccessful, it might eventually be advantageousto house it in a more permanent administrativestructure. 14
MAINTAINING A U.S. COMPETITIVEPOSITION IN REMOTE SENSING
The U.S. desire to maintain a strong U.S.position in high technology products in order tocontribute to its economic competitiveness andreach a more favorable balance of internationaltrade raises the question of how the United Statescan bolster its technological advantage and im-prove its competitive market position in remotesensing technology and data products. Especiallywith the projected reductions in spending fordefense-related technologies, the United States isdisadvantaged abroad by its existing policies ofgenerally maintaining an arms-length relation-ship between the government and private indus-
10 Witiaresolution as fme as 7 meters, this satellite was a powerful tool forgeneratingmaps of the Earth’s surface and for ob=wm c-es,despite intervening cloud cover. In the United States, Almaz data were distributedf~t by Space Commerce Corp., and morerecentiy by HughesSTX Corp. For a variety of reasons, including uncertain data delivery, sales have been limited.
11 NASA es~tes place the cows of the NASA plan at about $1.5 billion. See app. B for a detailed description of SAR t=kology.
12 ~L s~ pro- offlci~s, who originated ~s con~pt, sugg~t tit tie bands wo~d IX appropriate--C band, L ban~ and X band.
‘3 Different pola.rizations provide different views of Earth’s surface, depending on the material sensed. Multiple polarizations on the sameinstrument provide substantial additional data for analyzing surface conditions.
14 McE~oy, op. cit., footnote 5.

Chapter 8–international Cooperation and Competition | 93
try. Other countries, most notably Canada andFrance,15 have aggressively pursued the develop-ment of remote sensing satellite systems tomonitor the land surface and oceans in concertwith their private sector.l6
In order to maintain and enhance U.S.capabilities in civilian remote sensing, theUnited States may need to develop new formsof partnership between government and theprivate sector. Otherwise, the United Statescould be left behind in the race to develop newremote sensing technologies. In particular, theprevious chapter suggested that the U.S. govern-ment could undertake R&D programs to fosterinnovation in the development of sensors andsatellite systems within the U.S. private sectorand move toward purchases of data rather thansatellite systems from the private sector.
The final report of this assessment will exam-ine the benefits and drawbacks of internationalcooperative mechanisms in much more detail inthe context of a strategic plan for U.S. remotesensing activities. In particular, it will exploreissues such as:
. institutional models for international coop-eration in remote sensing;
● the roles of U.S. agencies, including NASA,NOAA, Department of Defense, and theDepartment of State;
. the United States as a cooperative partner:successes and failures; and
. the appropriate balance between cooperativeand competitive activities.
15 R~~~ ~s ~so develop~ private companies to market Emotely *A ~@ wi~ ‘id ‘Salts
16 ~m it ~On~~ted Wltb E_jsA’r t. ~J@ &@ from me ~n&t series of m~~ites, tie unit~ Stites ~SO developed a new publicJpnvate
institution. However, ambivalence within the U.S. Government toward the arrangement made it extremely difficult to follow through with thearrangement.


PLATE 4


180
PLATE 8


Appendix A:Research and
The EarthObserving
u ntil recently, meteorological applications were the primaryf o r c e b e h i n d t h e d e v e l o p m e n t o f c i v i l i a n r e m o t e s e n s i n g
systems. In the future, meteorology and global change research
will influence the direction of remote sensing developments.
Widespread attention to scientific issues regarding global change islikely to result in spending several billion dollars for sensor andspacecraft development. This appendix evaluates the relationshipbetween planned sensors and the study of climate and environment, andreviews sensor development plans in detail,
Future remote sensing systems will provide improved recognitionand understanding of environmental problems, and collect data toinform scientists and policymakers of the ramifications of a changingenvironment. 1 Future systems (such as EOS) are designed to provide abetter understanding of the processes affected by changes in theatmosphere. 2 More complete data from remote sensing satellites,combined with increased opportunities to test models against reality,can improve environmental models, especially general circulationmodels (GCMS) of global climate.3
Remote sensing from space provides an effective way to determinethe extent of environmental change. Space-based remote sensors arecapable of yielding the synoptic view of global events necessary toidentify and quantify changes occurring in the atmosphere and on the
I In addition to helping to answer questions about whether the Climate is changing,remote sensing systems are regularly used to monitor ecosystems, map wetlands, andtrack pollution.
2 NASA’s EOS program is being designed to address many of the key areas ofscientific uncertainty. See the National Research Council, The U.S. Global ChangeResearch Program, An Assessment of FY 1991 Plans, National Academy Press, 1990.Although EOS has been restructured since this evaluation was written most of theinstruments evaluated by the study are still included in EOS.
J Effectiveness of the data from any observation system in explaining observedphenomem is determined by the way data are used.
95

96 I Remote Sensing From Space
Box A-1-Climate ChangeMany oft he remote sensing systems discussed in this report are designed to provide data about the climate.
The Earth’s climate is determined by many factors. The primary force is radiant energy from the Sun, and thereflection or absorption and reradiation of this energy by atmospheric gas molecules, clouds, and the surface ofthe Earth itself (including forests, mountains, ice sheets, and urban areas). A portion of the reradiated energyleaves the atmosphere. Over the long term, balance is maintained between the solar energy entering theatmosphere and energy leaving it. Within this balance, interactions among the atmosphere, snow and ice, oceans,biomass, and land cause variations in global and local climate. For example, El Nino, the large-scale warming ofthe tropical Pacific that occurs periodically, is apparently the result of complex interactions between the ocean andatmosphere.’
A region’s general climate is defined by aggregate weather patterns-for example, snowfall, predominantwind direction, summertime high temperature, precipitation-averaged over several decades or longer. Thesepatterns can vary substantially from one year to another in a given area. The mean annual temperature of theUnited States, for example, can differ by O.5 to 1.5 0C. When scientists discuss climate change, they are generallyreferring to trends that persist for decades or even centuries, over and above natural seasonal and annualfluctuations. One type of change arises from forces that are external to the Earth’s climate system. The ice agesand glacial-interglacial cycles, for example, are thought to have been triggered by changes in the seasonal andgeographical distributions of solar energy entering the Earth’s atmosphere associated with asymmetries in theEarth’s orbit around the Sun. Also, major volcanic eruptions can deposit aerosols (e.g., sulfate particles) into thestratosphere, partially blocking or screening sunlight from reaching the surface of the Earth and thus temporarilycooling the Earth’s surface. Variations in volcanic activity (1992 was cooler than normal in many parts of NorthAmerica, in all likelihood because of the eruptions of Mt. Pinatubo), ice sheets, forest cover, marine phytoplanktonpopulations, and/or ocean circulation, among other factors, may have interacted with solar variability (includingchanges in the Sun’s brightness) to determine the Earth’s past temperature record.2
Other changes to the climate can be linked to human activity. Fossil fuel emissions and the release ofcompounds such as chlorofluorocarbons have changed the makeup of the atmosphere. To what extent humanactivity has contributed to changes in atmosphere and how these changes affect the climate is not clear.
1 G.A. Meehl, “~asonal cycle Forcing of El Nifk+!%wthern W“llation in a Global Coupled Ocean-AtmosphereGCM,” JoumalofChnate 3:72-98, 1990.
2 we S. Ba[iunas, and R, Jastrow, “Evidence for Long-Twin Brightness Changes of Solar-Type StarS,” Ni+ttWO
348:520-522, 1990; W.S. Broecker, “Unpleasant Surprises in the Greenhouse?” Nature 328:123-126, 1987; R.A. Bryson,“Late Quarternary Volcanic Modulation of Milankovitch Climate Forcing,” 77woretical and Applied Climatology39:115125, 1989,
SOURCE: Adapted From U.S. Congress, Office of Technology Assessment, Changing by Degrees: Steps to Reduce Greenhouse Gases,OTA-O-4S2 (Washington, DC: U.S. Government Printing Offioe, February 1991).
surface. Global viewing is critical to understanding | Remote Sensing and the Current State ofgeophysical processes, since many seemingly isolated Climate Researchevents are parts of a whole. As a result of growing Is there evidence of climate change (box A-l)? Whatcatalogues of data, better quantitative models that
are the implications of variations in temperature,simultaneously consider ocean and atmosphere have rainfall, cloud cover, polar ice and sea level? Thesegrown in sophistication.4
questions spark controversy among climatologists,biologists, economists, and politicians. Differences in
4 Thomas F. Malone, “Mission to Planet Earth+” Environment, vol. 28, October 1986, p.6.

Appendix A—Research and the Earth Observing System |97
opinion often derive from large uncertainties in data,imperfect numerical models, and assumptions thatdrive predictive models. For example, climate datashow evidence of a slow but steady increase in globaltemperature, and glacial records indicate higher levelsof CO2 and other gases than at any other time since theice age, Yet future trends and consequences ofcontinued climate and environmental change arehighly uncertain. Remote sensing systems are essentialif researchers are to assemble a comprehensive pictureof global processes.
The study of global change, much like the study ofmeteorology, encompasses the effects of many earthprocesses. 5 Scientific uncertainty manifests itself aswide variations in general circulation models used topredict climate change and understand the humanimpact on the environment. Key elements of uncer-tainty in developing predictive models include:
●
●
●
●
clouds, primarily cloud formation, dissipation,and radiative properties, which influence theresponse of the atmosphere to greenhouse forc-ing;oceans, the exchange of energy between theocean and the atmosphere, between the upperlayers of the ocean and the deep ocean, andtransport within the ocean, all of which controlthe rate of global change and the patterns ofregional change;greenhouse gases, quantification of the uptakeand release of the greenhouse gases, their chemi-cal reactions in the atmosphere, and how thesemay be influenced by climate change; andpolar ice sheets, which affect sea level rise.6
General circulation models are complex computermodels of the climate system that quantify theinteraction of various elements of the environment,allowing researchers to develop hypotheses regardingthe climate and elements of change. Uncertainties inGCMS can be reduced in two ways: first, improve thedata used in GCMS; second, rigorously test predictedresults against real events to improve the modelsthemselves.
Plans for future remote sensing satellite systems callfor the development of a number of sensors to obtaindata that will improve scientists’ understanding ofclouds, oceans, and atmosphere. These data, whichwill be used in GCMS and other models, shouldimprove the ability of scientists to understand theinteraction of systems and reduce some of the currentuncertainty. 7
Uncertainties regarding climate change abound, yetsubstantial evidence exists that environmental changehas already taken place. According to many climatolo-gists, human activity is altering the climate systembeyond the limits of natural rates of change experi-enced by the Earth over the last hundreds of thousandsof years.8 Human activity is dramatically changing thechemical makeup of the Earth’s atmosphere. Atmos-pheric concentrations of several “greenhouse gases, ’which trap heat in the atmosphere, naturally keepingthe earth at a habitable temperature, have risen rapidlyover the last 100 years, (box A-2) and according tosome, have contributed to increased average tempera-tures. 9 Most of these gases (carbon dioxide, methane,and nitrous oxide) occur naturally, but their rapidincrease results mainly from human activity. Forexample, the atmospheric concentration of carbondioxide is currently increasing about 30 to 100 timesfaster than the rate of natural fluctuations found in ice
s Ibid, p. 6.
6 Intergovernmental Panel on Climate Change, Scienfifi”c Assewnent of C/imute Change, World Meteorological OrganizMion, 1990, p. xxxi.7 Data detailing changes in land surface hydrology, solar radiation cycle, characteristics of surface albedo, the role of atmospheric and surface
winds, amount and health of biomass, and changes in land features will also play a large role in understanding climate and environmentalchange.
g R.A. Bemer, ‘ ‘Atmospheric Carbon Dioxide Levels Over Phanerozoic Time, ’ Science 249: 1382-1386, 1990; IPCC, op. cit.; C. Lorius,et al., “The Ice-Core Record: Climate Sensitivity and Future Greenhouse Warming, ” Nature 347: 139-145, 1990.
9 According to climate models in use today, increases of 0.3 to 1.1 C should have occurred over the past 100 years as a result of increasedatmospheric concentrations of greenhouse gases. Naturat climate variability and other factors (measurement errors, urban heat island effmts,etc. ) confound detection of almost any climate trends, however. The Intergovernmental Panel on Climate Change, or IPCC-a group of severalhundred scientists from 25 countries, described below-concluded that the global temperature record over this period indicates that the Earthactually has warmed by about 0.45 C, which is within the range of estimates. Yet the findings of the WCC, while representing the views ofmany atmospheric scientists, are not universally accepted.
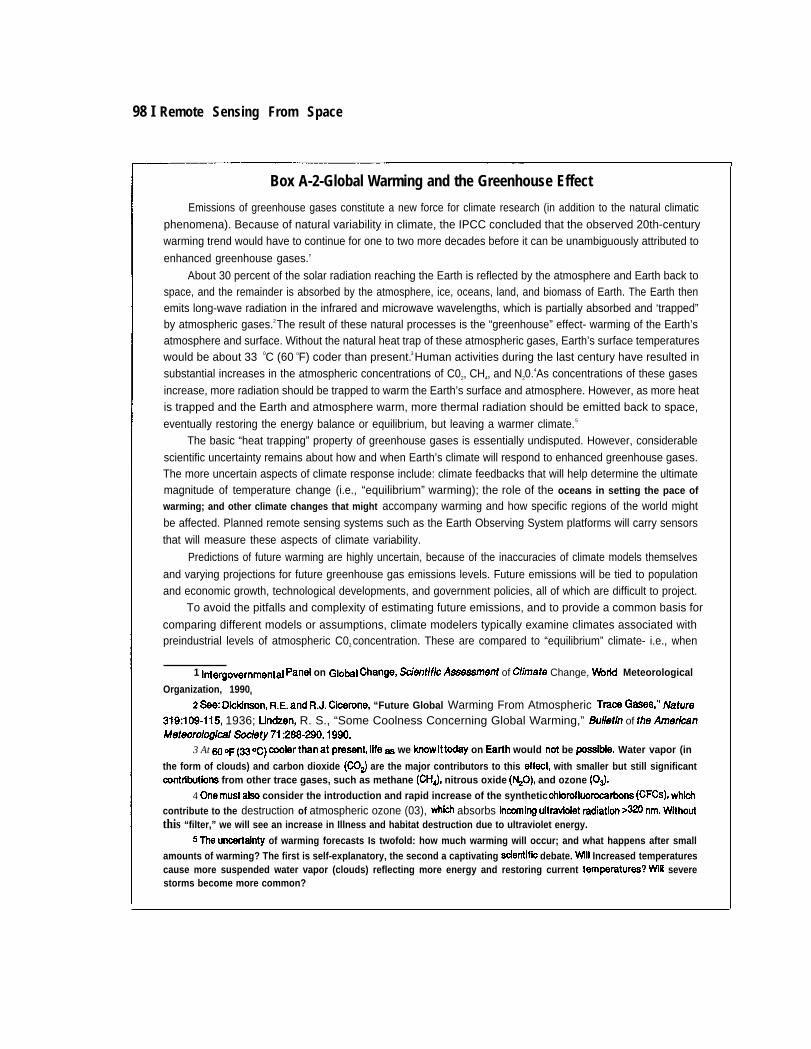
98 I Remote Sensing From Space
Box A-2-Global Warming and the Greenhouse Effect
Emissions of greenhouse gases constitute a new force for climate research (in addition to the natural climaticphenomena). Because of natural variability in climate, the IPCC concluded that the observed 20th-centurywarming trend would have to continue for one to two more decades before it can be unambiguously attributed to
enhanced greenhouse gases.’
About 30 percent of the solar radiation reaching the Earth is reflected by the atmosphere and Earth back tospace, and the remainder is absorbed by the atmosphere, ice, oceans, land, and biomass of Earth. The Earth thenemits long-wave radiation in the infrared and microwave wavelengths, which is partially absorbed and ‘trapped”by atmospheric gases.2 The result of these natural processes is the “greenhouse” effect- warming of the Earth’satmosphere and surface. Without the natural heat trap of these atmospheric gases, Earth’s surface temperatureswould be about 33 0C (60 oF) coder than present.3 Human activities during the last century have resulted insubstantial increases in the atmospheric concentrations of C02, CH4, and N20.4As concentrations of these gasesincrease, more radiation should be trapped to warm the Earth’s surface and atmosphere. However, as more heatis trapped and the Earth and atmosphere warm, more thermal radiation should be emitted back to space,eventually restoring the energy balance or equilibrium, but leaving a warmer climate.5
The basic “heat trapping” property of greenhouse gases is essentially undisputed. However, considerablescientific uncertainty remains about how and when Earth’s climate will respond to enhanced greenhouse gases.The more uncertain aspects of climate response include: climate feedbacks that will help determine the ultimatemagnitude of temperature change (i.e., “equilibrium” warming); the role of the oceans in setting the pace of
warming; and other climate changes that might accompany warming and how specific regions of the world mightbe affected. Planned remote sensing systems such as the Earth Observing System platforms will carry sensorsthat will measure these aspects of climate variability.
Predictions of future warming are highly uncertain, because of the inaccuracies of climate models themselves
and varying projections for future greenhouse gas emissions levels. Future emissions will be tied to populationand economic growth, technological developments, and government policies, all of which are difficult to project.
To avoid the pitfalls and complexity of estimating future emissions, and to provide a common basis for
comparing different models or assumptions, climate modelers typically examine climates associated withpreindustrial levels of atmospheric C02 concentration. These are compared to “equilibrium” climate- i.e., when
1 i~ergovernmenta[ panel on G~~l chan~, ~ent/f/c AWSment of Cllmate Change, Vkdd Meteorological
Organization, 19900
2 ~e: DiMn~n, R,E, and R,J. Cicerone, “Future Global Warming From Atmospheric Tram Gas8s,” ~afure319:109-115, 1936; Lindzen, R. S., “Some Coolness Concerning Global Warming,” Bu//et/n of the AmedcanhfeteorologkalS ociety71 :288-290, 1990.
3 At ~ OF (33 oC) ~~rt~n at pre~nt, life ~ we IUIOW it ttiy on Earth would not be Posstble. Water vapor (in
the form of clouds) and carbon dioxide (COJ are the major contributors to this effect with smaller but still significantmntn%utbns from other trace gases, such as methane (CH~, nitrous oxide (N20), and ozone (OS).
4 one must atso consider the introduction and rapid increase of the synthetic chloroflwr~rbons (CFCS), whichcontribute to the destruction of atmospheric ozone (03), which absorbs in~ing ultm~~et mdiation >320 nm. ~thoutthis “filter,” we will see an increase in Illness and habitat destruction due to ultraviolet energy.
5 The un~rt~nty of warming forecasts Is twofold: how much warming will occur; and what happens after smallamounts of warming? The first is self-explanatory, the second a captivating soientlfic debate. M/Ill Increased temperaturescause more suspended water vapor (clouds) reflecting more energy and restoring current tenpratures? Wiil severestorms become more common?

Appendix A–Research and the Earth Observing System |99
the climate system has fully responded and is in equilibrium with a given level of radiative forcing6 associated withdouble those levels. Although such “sensitivity analyses” provide useful benchmarks, they are unrealistic in thatthey instantaneously double COZ concentrations, rather than increase them gradually overtime. In the last fewyears, scientists have intensified research using more realistic “transient” climate models where C02 increasesincrementally over time.7
Many models indicate that a range of 1.5 to 4.5 OC (3 to 8 oF) bounds the anticipated equilibrium warming,likely in response to a doubling of Co2 from preindustrial levels.8 Uncertainty about the actual figure is primarilydue to uncertainty about feedbacks-processes that occur in response to initial warming and act either to amplifyor dampen the ultimate equilibrium response. The lower end of the range (1.5 OC change) roughly correspondsto the direct impact of heat trapping associated with doubled C02, with Iittle amplification from feedbacks. Theupper end of the range (4.5 ‘C) accounts for feedback processes that roughly triple the direct heat-trapping effect.Hypothesized feedbacks that could release extra CHd and C02 into the atmosphere are not included in presentmodels, g so warming could be even more severe. On the other hand, clouds may block much more solar radiationthan models presently assume and thereby reduce the warming.
A 1.5 to 4.5 ‘C warming bounds model predictions of warming in response to this reference or benchmarkCOZ level. Higher or lower COP concentrations (or a combination of greenhouse gas levels) might lead to greateror less warming. The I PCC “business as usual” emissions scenario projects a global mean temperature increaseabove today’s level of about .25‘C (0.54 oF) per decade, or an increase of roughly 1.0‘C (2.2 ‘F) by 2030 and3.1 “C (6.6 “F) by 2100.
6 Change in temperature or climate caused by changes in solar radiation levels.7 IpCC; Washington, WM. and G.A. Meehl, “Climate Sensitivity Due to Increased C02: Expedients ~th A
Coupled Atmosphere and Ocean General Circulation Model,” C/hnate DyrMmics4:l- 38, 1989.8 lpcc; Stouffer, R-J,, S. Mana~, andJ. Bryan, ‘ClntefiemiS@eriCAS~metry in climate Resportse toa Gradual
Increase of Atmospheric Carbon Dioxide,” Nature 342:660-662, 1989; J. Hansen et al., “Global Climate Changes asForecast by the Goddard institute for Space Studies Three-Dimensional Model,” J. Geophysica/l?eseamh, 93:9341 -9364,1988.
9 IpCC; ~shof, D,, “The Dynamic Greenhouse: Feedback Processes that May lnfluenc8 Future Concentrationsof Atmospheric Trace Gases and Climatic Change,” Climatic Change 14:213-242, 1989.
SOURCE: Adapted from U.S. Congress, Offiea of Technology Assessment, Changing by Degrees: Steps to Reduce Greenhouse Gases(Washington, DC: U.S. Government Printing Office, February 1991).
core samples; 10 concentrations are already 25 percent Climate models attempt to explain and predict howabove average interglacial levels and 75 percent above climate varies. The best current models predict globalthe level during the last glacial maximum.11 Likewise, average surface temperatures will increase 0.5 to 2 ‘Cthe atmospheric concentration of methane is increasing by 2030. However, these models have large uncertain-more than 400 times faster than natural rates of ties. They also provide widely varying estimates of thevariability y. 12 geographic distribution and consequences of change.13
No existing model is complete. 14 Taken together,
10 Lorius, et aI., op. cit.; J.M, E3arnola, et d., ‘; Vostok Ice Core Provides 160,(Kl@Year Record of Atmospheric C02, ” Nurure 329:408-414,1987.
11 IPCC, Sclentifi”c Assessment of Climate Change, op. cit., foomote 6.12 J, ~ppellez et ‘.! “Ice-Core Record of Atmospheric Methane Over the Past 160,000 Years,” Nature 345: 127-131, 1990.IS us, Env~onmen@ ~otection Agency, me Potential Eff&ts of Glob~ climate change on the United States, December 1989.
14 See Peter H. Stone, “Forecast Cloudy: The Limits of Global Warmin g Models,” Technology Review, February/March 1992, pp. 32-40;Bette Hilernan, ‘‘Web of Interactions Makes it Difficult to Untangle Global Warming Data, “ Chemical and Engineenng News, Apr. 27, 1992,pp. 7-19.

100 I Remote Sensing From Space
existing models provide a range of predictions regard-ing future climate. After reviewing numerous models,the IPCC has concluded that if present emission trendscontinue, global average temperatures could rise byroughly an additional 1.0 ‘C by the year 2030.
If the climate were to change drastically, the effectswould not be felt uniformly. Regional changes areextremely hard to predict because of constantlychanging atmospheric and oceanic circulation pat-terns. Greater warming is likely to occur in some areas;negligible change or cooling is expected in others.Some regions may experience more drought, othersmore precipitation and perhaps changes in the fre-quency and intensity of storms.15
The significance of climate change predictions is notclear. Although the evidence that human activity islargely responsible for a changing climate is notbeyond dispute,l6 data collected over the past centuryjustify concern over climate. Reasons for concerninclude hypotheses that climate change could:
1.
2.3.
4.
5.
6.7.8.
9.
rapidly shift climate zones, preventing theadaptive migration of animals and plants;speed the extinction of many species;diminish water quality (a result of algal bloomsin warmer water) in many freshwater lakes andrivers;raise sea level, effectively reducing the amountof beaches and coastal wetlands;reduce agricultural yields, possibly increaseothers, but change the distribution of crops;increase the ranges of agricultural pests;increase the demand for electricity;diminish air quality (increased emissions fromelectric plants, speed atmospheric chemicalreactions that produce atmospheric 03);change morbidity patterns, decrease wintermortality, increase summer mortality;
10. change infrastructure needs of many cities;11. diminish freshwater resources in many re-
gions. 17
Since mitigating human impact on the environmentis expensive and risky, economic uncertainty is oftenused to justify the expense of developing new remotesensing systems. The benefits derived from increasedknowledge of the effects of global change could faroutweigh the average yearly costs for space-basedglobal change research (about $1 billion annually).
CURRENT ENVIRONMENTAL AND CLIMATERESEARCH EFFORTS
Increased data on climate change and heightenedinternational concern convinced the U.S. governmentof the need to address global change. In 1989, theDirector of the Office of Science and TechnologyPolicy, D. Allan Bromley, established an inter-agencyU.S. Global Change Research Program (USGCRP)under the Committee on Earth and EnvironmentalSciences (in OSTP).18 Established as a Presidentialinitiative in the FY 1990 budget, the goal of theprogram is to develop sound national and internationalpolicies related to global environmental issues. TheUSGCRP has seven main science elements:
1.2.3.4.5.6.7.
climate and hydrodynamic systems,biogeochemical dynamics,ecological systems and dynamics,earth systems history,human interaction,solid earth processes, andsolar influences.
Participation in the USGCRP involves nine govern-ment agencies and other organizations. 19 This researcheffort, and the efforts initiated by independent organi-zations (above), seek a better understanding of global
15 Much of the info~ation in t.his s~tion originally appeared in U. S. Congress, Office of Technology Assessmen~ Changing by Degrees.’
Steps @ Reduce Greenhouse Gases, OTA-O-482 (Washingto~ DC: U.S. Government Printing Office, February 1991).
lb See Richard S. Lindzen, ‘‘Global Warming, The Origin and Nature of the Alleged Scientific Consensus, ” Regulation, The Cato Reviewof Business and Government, Spring 1992. Lindzen states, “Not only are there major reasons to believe that models are exaggerating theresponse to increasing carbon dioxide, bu~ perhaps even more significantly, the models’ predictions for the past century incorrectly describethe pattern or warming and greatty overestimate its magnitude. ’
IT U.S. Env~onmental protection Agency, The potential Effects of Global Climate Change on the United States, EPA-230-05-89-050,December 1989.
IS For tier ~omation SIX ‘‘Our Changing planet: The FY 1992 Research PlarL’ The U.S. Globat Change Research ROWatn, A Repoflby the Committee on Earth and Environmental Sciences, a supplement to the U.S. President’s Fiscal Year 1992 Budget.
19 Including the Smithsonian Institution and the Tenne-see Valley AUthOritY.

Appendix A—Research and the Earth Observing System I 101
change. All will rely on remote observations ofatmosphere, oceans, and land for data.
| Mission to Planet EarthThe concept of Mission to Planet Earth evolved over
several years.20 In 1982, at a U.N. space conference(Unispace ‘82), NASA proposed a comprehensive,U.S.-led program to monitor the health of the Earth.Called the Global Habitability Program, it was largelyignored by the conference participants.21 In 1985, theGlobal Habitability concept was transformed, NASAsought to apply the concepts described by globalhabitability to research focused on long-term physical,chemical, and biological changes on a global scale.22
The research effort will rely on data collected byground, air, and space-based systems. NASA hascoordinated its efforts with the Committee on Earthand Environmental Sciences, and agencies of theFederal Government.
NASA’s stated goal for Mission to Planet Earth is to‘‘establish the scientific basis for national and intern-ational policymaking relating to natural and humaninduced changes in the global Earth system."23 Theprimary program objectives include establishing anintegrated, comprehensive, and sustained program todocument the Earth system on a global scale. Missionto Planet Earth scientists will conduct focused, explor-atory studies to improve understanding of the physical,chemical, biological and social processes that influ-ence Earth system changes and trends on globaI andregional scales. NASA-supported scientists will pro-vide information for policymakers based on integratedconceptual and predictive Earth system models.
Mission to Planet Earth will address the followingkey uncertainties regarding climate change:
1. role of greenhouse gases,2. role of clouds,3. role of oceans,4. role of polar ice sheets,5. land surface hydrology, and6. ecosystems response.
These parallel the priorities set by the Committee onEarth and Environmental Sciences. NASA has workedto align the instruments proposed for EOS with thescientific and policy goals addressed by the U.S.Global Change Research Program.
EOS AND RELATED SYSTEMSNASA considers the Earth Observing System the
cornerstone of the Mission to Planet Earth. EOS is tobe a multiphase program that NASA expects to lastabout two decades.24 The core of EOS will be three
copies of two satellites, capable of being launched byan Atlas II-AS booster, a medium lift launcher that isunder development.
The EOS program begins with a number of ‘phaseone’ satellites (most of which predate the EOSconcept, and are funded through other programs) thatwould provide observations of specific phenomena.The Upper Atmosphere Research Satellite (UARS),which has already provided measurements of highlevels of chlorine monoxide (C10)25 above NorthAmerica, is an example of an EOS phase oneinstrument. NASA’s EOS plans also include threesmaller satellites (Chemistry, Altimeter and Aero), thatwould observe specific aspects of atmospheric chemis-
m For ~orc backwound on the genesis of Mission 10 planet m see Burton Edelson+ Science, Jan. 25, 1985, @ditorial); CRS RePOI_I to
Congress, “Mission to Planet Earth and the U.S. Global Change Research program,” Marcia S, Smith and John Justis, June 19, 1990; SallyK. Ride, ‘ ‘Leadership and America’s future in Space, ” A Report to the NASA Administrator, August 1987. The “Ride Report, ” as thisdocument has become known, strongly advocates Mission to Planet Earth as a top priority for NASA’s fiNure.
‘1 See U.S. Congress, Office of Technology Assessment, UNISPACE ’82: A Context for International Cooperation and Competition,OTA-ISC-TM-26 (Washington DC: U.S. Government Printing Office, March 1983), for more information regarding U.S. proposals and thedebate over militarization.
n Ibid.~ presentation of Shelby Tilford, Director, NASA Earth Science and Applications Division, to the Woods Hole Space Science and
Applications Advisory Committee Planning Workshop, July 1991.u s= Ch, 2, ch 5, and app. B for more details about NASA’S Mission to p~et ~ ~d EOS.25 Chlofine monoxide is a ~hemic~ compo~d ~~ when aff~ted by s~lght ~ the upper atmosphere, leads to degradation Of OS. &Qne
is formed m the stratosphere by the reaction of atomic oxygen (0) with molecular oxygen (02). This prwess is beguu by the diss~iation ofOz into O by absorption of solar ultraviolet radiation at wavelengths below 240 nm. This process ocmrs at altitudes above 25 km. This processcan be interrupted by Cl: CI+03-+C10+C+ . . . CIOW+C1+OZ, C1O is therefore a precursor of disappearing ozone.

102 I Remote Sensing From Space
Box A-3-Measurements of Ozone Depletion
For most global change and climate change research, a combination of satellite and in situ measurementsis required to obtain sufficient data. One of the best examples of the need for both types of measurements is thediscovery of the ozone hole above Antarctica. Researchers from the United States and Great Britain had beenmeasuring atmospheric conditions over Antarctica: the U.S. team relying on satellite sensors; the British teamusing ground-based spectrophotometers. In 1983-84, the British team recorded a series of measurements ofozone that seemed extraordinarily low (below 200 Dobson units).1 Data from the Total Ozone MappingSpectrometer (TOMS) aboard Nimbus-7 and the Solar Backscatter Ultraviolet Radiometer (SBUV) aboardpolar-orbiting NOAA satellites were automatically processed by computer before being analyzed. U.S. scientistsfelt that any readings below 200 Dobson units would be outside the range of possibility and were likely the resultof a sensor anomaly; hence they designed a computer algorithm that ignored such measurements. Data werestored, and subsequently reviewed, but these readings were originally dismissed.
Neither did the British team believe its own readings. The first conclusion that project director Joe Farmanand his team reached was that their ground-based sensors, which were old, had been improperly calibrated. Yetwhen anew, updated sensor produced similar results, they realized that the loss of ozone was much greater thananyone expected. This experience demonstrates one of the advantages of ground-based sensors: sensorpackages can be easily replaced to validate the performance of the original system. It also demonstrates thedangers of establishing a threshold for expected results.
Researchers have learned several lessons from the discovery of cyclical ozone depletion over Antarctica.First, because ground-based sensors observe specific phenomena from a site whose environmental parameterscan be thoroughly characterized, they are sometimes more adept at detecting regional change or unusual localenvironmental conditions than are satellite-based sensors. Second, although it is sometimes difficult to distinguishbetween real results (signal) and invalid measurements (noise), setting predetermined limits on naturalphenomena while studying global change is not judicious. Third, even accepted models, such as the one thatprovided the parameters for the U.S. research team, can be far wrong. All models should be scrutinized andtested periodically.
1 ~ Do~n unit is a measurement of thickness standardized to the thickness of the ozone Iayerat 32 degreesFahrenheit and sea level atmospheric pressure. One Dobson unit is equivalent to .001 cm of ozone.
SOURCE: Office of T-nology Assesamen$ 1993.
try, ocean topography, and tropospheric winds. In EOSDIS will require significant technology develop-addition, NASA plans to include data from “EarthProbes,’ additional copies of sensors that monitorozone and ocean productivity, in the EOS Data andInformation System. See box A-3 for a description ofozone measurement.
The EOS Data and Information System (EOSDIS)will be a key feature of EOS (box A-4). According toNASA, data from the EOS satellites will be availableto a wide network of users at minimal cost through theEOSDIS. NASA will develop EOSDIS so it can storedata and distribute them to many users simultaneously.
ment, especially in software, storage, and data process-ing, EOSDIS will require a continued funding effortthat will reach $254 million in 1996. In total, EOSDISis expected to cost $946 million between 1991 and1997, A future OTA report will examine the data issuesrelated to remote sensing.
NASA plans to operate various EOS sensors for 15years, providing researchers with data covering acomplete solarcycle26 and several El Ninos,27 two largenatural variables affecting Earth’s climate. EOS sen-sors will be grouped or co-located by function to
26 Appro ximately every 11 to 15 years, the Sun completes one solar cycle.27 A ~fight ~X of the uppr wat~ of the southern pac~lc, OCCWI_@ about every 4 tO 7 ye~.

Appendix A—Research and the Earth Observing System I 103
Box A-4-The EOS Data and Information System
A central element of NASA’s Mission to Planet Earth is the EOS Data and Information System. This systemis intended to process, store, and distribute the data obtained from Mission to Planet Earth flight projects and
scientific investigations. EOSDIS is intended to be sufficiently flexible to incorporate previously archived data,measurements from non-EOS spacecraft, and ground-, ocean-, and space-based measurements conducted byother Federal, foreign, and international agencies. Through the EOSDIS program, NASA has promised to providea comprehensive system t hat will merge data from a wide variety of sources to serve integrated, interdisciplinaryresearch. EOSDIS is ambitious and complex; it must manage vast streams of data perhaps as many as 400 trillion
bytes per year. This is roughly equivalent to the amount of data that would fill 4 million 100-megabyte hard drives(approximately the amount of storage purchased with a new personal computer). NASA has made comparisonsbetween the amount of data EOSDIS will handle and the amount of information stored in t he Library of Congress.These comparisons are faulty, since the Library of Congress contains paintings, movies, pictures, in addition toprinted media. It is more rational to think of the amount of data to be handled in EOSDIS in terms of the largest
data bases currently on line, and no system in use to date has come close to handling this amount of data.EOSDIS must also make these data easily usable for a very wide variety of users, possibly numbering as
many as 100,000 people, many of whom will have little detailed technical knowledge of remote sensing. EOSDISis intended to provide the tools needed to transform data into information, through activities such as thedevelopment and integration of algorithms (“formulas”) for data analysis, the communication and exchange of dataamong scientists, the maintenance of standards and formats for data and information, and the archiving ofscientific information for access by others.
Structurally, EOSDIS will consist of at least seven research science-oriented Distributed Active ArchiveCenters (DAACS), and several Affiliated Data Centers. The seven sites selected as EOS DAACS are currentlyfunctioning as relatively independent data centers. When linked together and integrated into EOSDIS, the DAACS
will receive raw data from EOS spacecraft and other sources, process the data, and provide data and informationto users. Three systems will operate at each DAAC:
1. a product generation system (PGS),2. a data archive and distribution system (DADS), and
3. an information management system (lMS).
The product generation system at each DAAC will convert raw data signals into standard sets of Earth sciencedata, using data processing software developed by t he scientific user community. The data archive and distributionsystem at each DAAC will serve as the archive and distribution mechanism for EOS data products, as well as otherdata sources both within and outside the EOS program. The information management system at each DAAC willgive users access to all data throughout EOSDIS, as well as help in locating and ordering data. When fullyoperational, a scientist signing onto EOSDIS at any DAAC site will have complete access to all data sets anywherein EOSDIS, regardless of physical location. NASA has promised to have processed data available to scientiststhrough EOSDIS within 4 days of initial observations.
NASA has adopted an “evolutionary” approach for the development of EOSDIS, since pre-definition of allEOSDIS requirements is impossible (e.g., the science and data requirements for studies of the Earth system willchange as our knowledge and experience grow, and most EOSDIS users are currently not practicing Earth systemscientists; some are not yet born). EOSDIS is to have an “open” architecture, meaning that new hardware andsoftware technologies will be easily inserted as EOSDIS evolves, and changing user requirements can beaccommodated. Feedback from users is intended to inform each new increment of EOSDIS, a “learn-as-you-go”approach.
(cuntkwd on naxtpage)
—

104 I Remote sensing From Space
Box A-4-The EOS Data and Information System-Continued
NASA is currently developing an early EOSDIS system (“Version O“) to improve access to existing data andto test the interoperability of existing systems. Version O includes the development of user-friendly “pathfinder”data sets from archived data of NOAA, DOD, and Landsat satellites, developing commonality among DAAC datasystems, and protot yping a few EOSDIS technologies. Version O is scheduled to be in place by late 1994. Versions1 through 6 are planned to be delivered through a single contractor, Hughes Information Technology. Version 1will provide PGS, DADS, and IMS functions at each DAAC, and examine prototyping technologies for dataprocessing and scheduling functions for EOS instruments. NASA plans to have Version 1 operational at all DAACSby 1996. Version 2 will be the first full-scale operational EOSDIS, using data from the first EOS platform, and isscheduled to be operating by the mid-1998 launch of the EOS AM1 spacecraft. Versions 3 through 6 will followas subsequent spacecraft are launched and science needs evolve.SOURCE: National Aeronautics and Space Administration, General Aeeounting Office, National Researeh Counal, House ofRepresentatives Seienee, Space and Technology Committea
provide simultaneous coverage by complementary for all observation/monitoring projects, despite needsinstruments. Another advantage to the broad array ofsensors carried by the EOS platforms will be the abilityto isolate the effects of individual variables. A goal ofEOS is to make possible real-time analysis of theseobservations.
NASA has scheduled the launch of the first EOSsatellite for 1998. Critics of EOS claim that thisschedule does not allow for timely data gathering. Thepossibility exists that gaps in monitoring stratospheric
for scientific information.
EOS INSTRUMENTS
EOS Phase One-EOS Phase One is a series ofsmall satellites that have been grouped together underthe aegis of EOS. Most of these satellites were fundedunder existing programs prior to inclusion in the EOSprogram. Phase one includes the instruments below,29
which will be launched beginning in 1993.ozone could occur in 1995-2000, especially if theUpper Atmosphere Research Satellite (UARS, the first
●
of the EOS Phase One satellites) that concentrates onmeasuring upper atmosphere ozone, fails to live pastits expected lifetime (1995). Germany had been splanning a satellite to monitor ozone, but tight budgetsmay prevent such an effort. TOMS (total ozonemapping spectrometers) will be available on othersatellites, but may not have the ability to ‘‘record indetail the chemical changes occurring in the strato-sphere. ’28 Scientists express concern that similar gapswill exist in other climate monitoring efforts, and willlikely arise during the lifetime of EOS. The reality ofaustere budgets will affect global change research:smaller than expected budgets will not allow funding
Sea Wide Field Sensor (SeaWiFS), an ocean colorsensor to study ocean productivity and ocean/atmosphere interaction, still an area of climateuncertainty.Total Ozone Mapping Spectrometer, additionalcopies of the TOMS instruments to fly on NASAexplorer class satellites and on Japan’s AdvancedEarth Observation Satellite (ADEOS). An earlierversion of TOMS had flown on Nimbus-7 in1978, and on a (then) Soviet Meteor-3 on August15, 1991. Japan has developed the ADEOS as aninternational effort (app. D); the U.S. is providingtwo of the sensors,30 France is Providing one, 31 andJapan will develop several others, including aninterferometric monitor for greenhouse gases and
~ C ‘Gaps ~m in Sateuite Data’ Nature, vol. 335, p. 662, Feb. 20, 1992.29 me ~uber of p~~e oneexp~ent~ ~t~ s~ive tie most rment budget cut was ~C)WII at tie time MS report went to pI_lXS. NASA
will also include data from POES, GOES, DMSP, LandSat and other satellites in the EOSDIS, hence NASA also lists data from these satellitesas phase one data.
30 me semors ~ tie to~ ozone ~pp@ spectrometer (TOMS) ~d NASA Scatterometer.
31 Polariza tion and Directionality of tbe Earth’s Reflectance (POLDER).

Appendix A—Research and the Earth Observing System I 105
●
●
●
an improved limb atmospheric spectrometer.ADEOS will be used to measure ozone and othergases, as well as measure ocean surface winds.The NASA Scatterometer, an instrument de-signed to study the ocean’s surface to determinewind patterns and air-sea interaction, now tenta-tively scheduled for flight on ADEOS-11.The Tropical Rainfall Measurement Mission(TRMM), also a joint program with Japan, willmake extensive measurements of precipitation,clouds and hydrology in tropical regions, whichcannot be time-sampled adequately from polarorbit. 32
TOPEX/Poseidon, a group of sensors for measur-ing ocean topography and altimetry on a platformlaunched by France on an Ariane booster inAugust 1992.
The Upper Atmosphere Research Satellite, launchedin September 1991, became the first of these PhaseOne satellites to enter service. Although its develop-ment began in 1985, UARS is viewed as the first majorproject of the Mission to Planet Earth. The UARSplatform carries 10 instruments in order to meet twoproject goals:
1.
2,
Observe the atmosphere over the northern hemi-sphere during two winters. The northern hemi-sphere has a greater terrain/ocean ratio, thusproviding a highly dynamic interaction betweenearth, ocean and atmosphere, Although UARSmay function for over nine years, the instrumentfor these observations (the Cryogenic LimbArray Etalon Spectrometer or CLAES) requirescryogens that will be exhausted in about 2 years.Observe dynamic processes (presence of chlo-rofluorocarbons, stratospheric winds, etc.) re-sponsible for the hole in the ozone layer aboveAntarctica.33
Other instruments carried on the UARS include animproved Stratospheric and Mesospheric Sounderused to observe infrared molecular emissions, amicrowave limb sounder used to measure chemicals
(especially chlorine monoxide) in the upper atmos-phere, a halogen occultation experiment, a windimaging interferometer, a solar ultraviolet spectralirradiance monitor, a solar stellar irradiance instru-ment, and a particle environment monitor.34
EOS-AMThe EOS-AM satellites,35 the first of which
NASA plans to launch in June 1998, will character-ize the terrestrial surface and examine the aerosoland radiation balance within clouds. It will carryfive sensors.
1.
2.
The Clouds and Earth’s Radiant Energy System(CERES) will provide earth scientists withmeasurements of cloud and radiation flux. Themeasurements will be taken with two broadbandscanning radiometers, each functioning on threecharnels. These radiometers will calculate theamount of radiation that is reflected by theEarth’s surface and the amount reflected byclouds. Comparing these measurements willallow a better understanding of the role thatclouds play in regulating the earth’s climate.Measurements of reflected radiation and thereflective efficiency of different cloud types willenable development of global oceanic and at-mospheric models.The Moderate Resolution Imaging Spectroradi-ometer—(MODIS), will be used to measurebiological and physical processes that do notrequire along-track pointing. These applicationswill include long-term observation of surfaceprocesses/global dynamics such as: surface tem-perature; ocean color; chlorophyll fluorescence;concentration of chlorophyll; vegetation cover,productivity; fires; snow cover/reflectance; cloudcover; cloud properties. Data collected by MODISwill be used to take global measurements ofchlorophyll, dissolved organic matter and otherconstituents that provide insight about oceanproductivity. MODIS will provide data useful tothe determination of the role of the oceans in the
32 Shelby G. Tilford, Gregory S. Wilson and Peter W. Backhmd, “Mission To Planet Earth,” paper presented at the 42d Cong. of theInternational Astronautical Federation Oct. 5-11, 1991, Montreal, Cam&.
33 f ‘DiscoveV t. ~mch Ffit Element of NASA’S Mission t. PIanet Em’ ‘A}ian”on Week a~SPace Tec~no/ogy, Sept. 9, 1991, pp. 63-67.
~ Ibid.
35 For a more complete description of EOS in~~ents, sm NASA’s 1993 EOS Reference Handbook, NASA, Eti Science SUppOll OffiCe.

106 I Remote Sensing From Space
3.
4.
5.
global carbon cycle. These data will have appli-cations in models as well as providing informa-tion regarding the productivity of aquatic andterrestrial plants. Measurements of total precipi-tation and aerosol properties will also be facili-tated by MODIS measurements.The Multiangle Imaging Spectra-Radiometer(MISR) will be the only EOS instrument that willprovide information on cloud and surface angu-lar reflectance. The instrument is designed toobtain images of each scene from multiple anglesand in four spectral bands. The data are collectedusing nine charged-coupled device (CCD)pushbroom cameras. Measurements taken byMISR will allow researchers to determine theeffects of aerosols in the atmosphere, understandhow different cloud types affect the radiationbudget, evaluate some changes in the Earth’sforest and deserts, and study aspects of interac-tion between biophysical and atmospheric proc-esses.The Advanced Spaceborne Thermal Emissionand Reflection radiometer (ASTER) is an imagi-ng radiometer that will be used to provide highspatial resolution images of land, water, andclouds. ASTER is one of Japan’s contributions tothe EOS program. Images taken in the visible andnear infrared, shortwave infrared, and thermalinfrared wavelengths will be used in the study ofsoil and rock formations, to monitor volcanoes,and to measure surface temperatures, emissivityand reflectivity. The visible and near infrared andshortwave infrared channels will also have theability to provide information on land usepatterns and vegetation. The very near infraredand thermal infrared capabilities will provideinformation on coral reefs and glaciers. Someevaporation and land and ocean temperaturereadings will be possible as well.Measurements of Pollution In The Troposphere,or MOPITT, a correlation spectrometer, willprovide measurements of pollution in the tropo-sphere at three wavelengths in the near infrared.It will specifically measure levels of carbonmonoxide and methane.
NASA plans to include the Earth Observing Scan-ning Polarimeter (EOSP) on the second AM platform(an earlier flight of EOSP was rejected by NASA—see
app. B). EOSP will be designed to map the radianceand linear polarization of reflected and scatteredsunlight through 12 spectral bands, and provide globalmeasurements of aerosol distribution and cloud prop-erties. EOSP is a polarimeter that scans cross-track,providing a global profile of aerosol optical thickness.These data will correct clear-sky ocean and landmeasurements that are of critical importance to otheroptical measurements of the Earth’s surface.
In addition to EOSP, AM-1 will carry a secondinstrument not on the first AM platform. The Tropo-spheric Emission Spectrometer (TES) will be aninfrared imaging spectrometer that will provide globalthree-dimensional profiles of all infrared-active spe-cies from surface to lower stratosphere. This informa-tion will be used to study greenhouse gases, tropo-spheric ozone, precursors of acid rain, and gasexchange in the stratosphere leading to ozone deple-tion.
EOS COLOREOS-Color (1998) will measure oceanic biomass
and productivity.. The Sea Wide Field of view Sensor (SeaWiFS-11)
will be a multi-band (8) imager that will operatein the very near infrared portion of the spectrum.SeaWiFS will be used to observe chlorophyll,dissolved organic matter and pigment concentra-tions in the ocean. The sensor will contribute tounderstanding the health of the ocean and concen-tration of life forms in the ocean.
EOS AEROEOS-Aero (2000) will measure atmospheric aer-
0s01s.. The Stratospheric Aerosol and Gas Experiment
(SAGE III) will be a grating spectrometer,designed to obtain global profiles of aerosols,ozone, water vapor, nitrous oxides, airbornechlorine, clouds temperature and mesospheric,stratospheric and tropospheric pressure. SAGE isa follow-on to earlier instruments of the samename. SAGE III will be self-calibrating, and willhave a better vertical range than its predecessors.
EOS-PMEOS-PM (2000) will examine clouds, precipita-
tion and the Earth’s radiative balance; will meas-

Appendix A—Research and the Earth Observing System I 107
ure terrestrial snow a nd sea ice; observe sea surfacetemperature and monitor ocean productivity.
CERES (see above).MODIS-N (see above).The Atmospheric Infrared sounder (AIRS) is ahigh spectral resolution sounder that will providetemperature and humidity profiles throughclouds. It will measure outgoing radiation and beable to determine land skin surface temperature.In addition, the sounder will be capable ofdetermining cloud top height and effective cloudamount, as well as perform some ozone monitor-ing.The Advanced Microwave Sounding Unit (AMSU-A) and the Microwave Humidity Sounder (MHS)are both microwave radiometers that will provideall weather atmospheric temperature measure-ments from the surface up to 40 km (AMSU) andatmospheric water vapor profiles (MHS).The Multifrequency Imaging Microwave Radi-ometer (MIMR) will provide passive measure-ments of precipitation, soil moisture, global snowand ice cover, sea surface temperature, cloudwater, water vapor and wind speed, MIMR will beprovided to NASA by the European SpaceAgency.
EOS-ALTEOS-Alt (2002) will observe ocean circulation
and ice sheet mass balance using the followinginstruments:
●
●
The EOS altimeter (ALT) will be a dual frequencyradar altimeter. ALT will provide mapping datafor sea surface and polar ice sheets. The returnpulse of the radar can also provide information onocean wave height and wind speed.The Geoscience Laser ranging system and altime-ter (GLRS-A) will be tailored to measure geo-dynamic, ice sheet, cloud, and geological proc-esses and features.
EOS-ChemEOS-Chem (2002) will track atmospheric chemi-
cal species and their transformations; and measureocean surface stress.
●
●
●
The High Resolution Dynamics Limb Sounder(HIRDLS) will be an infrared seaming radiome-ter that derives from similar units deployed on theNimbus and UARS satellites, It will be used tosound the upper troposphere, stratosphere andmesosphere to determine temperature; concentra-tions of O3, greenhouse gases, and aerosols;locations of polar stratospheric clouds/cloud tops.The Active Cavity Radiometer Irradiance Moni-tor (ACRIM) is designed to measure solar outputand variations in the amount of radiation thatenters the atmosphere.The Stratospheric Aerosol and Gas Experiment(SAGE III) will be the third in a series of similarinstruments. See description under AERO, above.Microwave Limb Sounder (MLS) is a passive,limb sounding radiometer, The MLS will bedesigned to study and monitor atmospheric proc-esses that affect ozone. Particular emphasis willbe given to the impact of chlorine and nitrogen.NASA may try to fly the GPS GeoscienceInstrument (GGI) aboard the Chem satellite. GGIwill be designed to contribute to the accuracy ofmapping data collected by other sensors (down tothe centimeter level). It will also play a role inionospheric gravity wave detection.
The primary EOS spacecraft, AM and PM, will bereplaced over time to ensure at least 15 years ofcoverage, Follow-on payloads will remain flexible tomeet needs as determined by the evolution of scientificunderstanding derived from earlier launches.3b
~ Sbtement by L.A, Fisk Associate Adrninisrrator for Space Science and Applications, National Aeronautics and Space Admink-tioubefore the Subcommittee on Science, Technology and Space, Committee on Commerce, Science and Transpotitiou United States Senate(102d Cong.), Feb. 26; 1992.

Appendix B:The Future
of EarthRemote Sensing
Technologies
T his appendix examines technology issues associated with theresearch, development, and acquisition of future U.S. civilianEarth observation systems. It begins with a review of EOSscience priorities and the effect of EOS program restructuring
on the development of advanced remote sensing technology. Thisappendix also discusses ongoing efforts to develop affordable and/orless risky versions of several large EOS “facility” instruments thatwere deferred or deleted during program restructuring. Next, theappendix briefly summarizes sensor platform and design considera-tions, including design compromises and tradeoffs that must be madeto match a particular mission with an appropriate sensor and platformcombination.
Finally, this appendix explores the state of the technical ‘ ‘infrastruc-ture’ for future space-based remote sensing efforts. Researchersinterviewed by OTA general ly bel ieved that planned efforts in
technology development at the component level were suff icient to
develop next-generation sensors. However, they were less sanguine in
t h e i r a s s e s s m e n t o f e f f o r t s f o r ‘ ‘ e n g i n e e r i n g ’ d e v e l o p m e n t , f o r
example, the packaging and prototyping of integrated, space-qualified
sensors . Engineering development, while not as glamorous as basic
science, is essential if the United States wishes to reduce the size,
weight, and cost of space-based sensors and platforms. As discussed
below, engineering issues also enter into debates over the maturity ofproposals to develop new small satellites.
Introducing advanced technologies in Earth remote sensing systemsraises several issues, including the role of government in identifyingand promoting R&D for Earth remote sensing; and the timing of theintroduction of new technologies in operational remote sensingprograms. NOAA’s problems with the development of its GOES-Nextenvironmental satellite system brought the latter issue to congressionalattention (see ch. 3). The issue has also arisen in connection with theselection of sensors for Landsat 7,now scheduled for launch in 1997.
109

110 | Remote Sensing From Space
Finding a balance between the risks and potentialbenefits of technical innovation is a particular problemin satellite-based remote sensing systems becausethese systems are characterized by long lead times andhigh costs. Payload costs are a sensitive function ofsatellite weight and volume. 1 In principle, satelliteweight and volume might be reduced by incorporatingadvanced technologies, now in development, with nextgeneration spacecraft, However, in practice, proposednew instrument technologies are often at an early stageof development and have not demonstrated the abilityto provide the stable, calibrated data sets required forglobal change research. In addition, they may not havethe fully developed data processing systems andwell-understood data reduction algorithms required totransform raw data into useful information.2 Therequirements for stability, calibration, and well-developed data analysis systems are particularly evi-dent in long-term monitoring missions.
Historically, programs have attempted to minimizerisk in satellite programs by introducing new technolo-gies in an evolutionary reamer, typically only aftersubjecting them to exhaustive tests and provingdesigns in laboratory and aircraft experiments.3 Al-though experts generally agree on the desirability ofaccelerating this relatively slow process, they do notagree on the risk that would be associated with achange in the traditional development cycle.4 Therisks in developing a new sensor system have twocomponents: the technical maturity of componenttechnologies (e.g., the detector system), and the
design maturity. A particular design that has notbeen used before may be a relatively risky venturefor an operational program, even if it is based onproven technology.5
Efforts to develop and flight-test emerging technol-ogies have been limited by a number of factors,including budget constraints; scientific disputes overthe merits of specific proposals; intra-agency andinter-agency rivalries; and the absence of a coherentstrategy for remote sensing, developed within theexecutive branch and supported by the relevant author-ization and appropriation committees of Congress.These problems are embedded in an issue of evengreater concern to global change researcher-whether it will be possible to sustain institutionalcommitments, including those from NASA, DOE,and DoD, for periods of time that are long com-pared to the time for changes in the executivebranch and in Congress. Without such a commit-ment, much of the current effort to develop strategiesand instrumentation to monitor important climatologi-cal variables could be wasted.
| Technology and the Restructured EarthObservation System
In conjunction with its international partners, theUnited States plans a program of Earth observationsystems to provide, by the early years of the nextcentury, comprehensive monitoring of Earth resources,weather, and natural and human-induced physical and
1 U.S. Congress, Oftlce of Technology Assessment, Affirtib/e Spucecrafi: Design and Launch Alternatives, OTA-TM-ISC-60(Washington, DC: U.S. Government Printing Office, September 1990).
z The complex analysis required to measure the Earth’s radiation budget (discussed below) provides an illustrative example.
~ For example, in the 1960s and 1970s NASA and NOAA had a successful 3-stage process for instrument development: (1) technologyde}elopmenr was supported via an Advanced Applications Flight Experiments (AAFE) program for new instrument concepts, usually leadingto tests on aircraft flights, (2) research space j7ighrs were provided for promising instruments graduating from AAFE, on the Nimbus satelliteseries, with flights every 2 or 3 years, (3) opera(iona/ satellites carried instruments selected from those tested via the fhst two stages.
i A phased development cycle has traditionally been used to procure operational systems. The steps in this cycle can be grouped as follows:Phase A—Study Alternate ConceptsPhase B—Perform Detailed Design Definition Study (manufacturing concerns addressed in this stage)Phase C—Select Best Approach/Build and Tesl Engineering ModelPhase D-Build Fllght Pwtotypc and Evaluate on OrbitThis approach should be contrasted with a ‘‘skunk-works’ approach which omits some of these steps. Historically, the skunk-works
approach has usually been thought more risky than the methodical approach. As a result, it has been used mostly for demonstrations andexperiments.
s Recognizing this problem, the Advanced Research Projects Agency (ARPA) has proposed several advanced technology demonstrations(ATDs) on small satellites that, if successful, would rapidly insert technology and shorten acquisition time for larger satellites. Thesedemonstrations would couple innovative sensor design with a scalable high-performance common satellite bus that would employ a novel“bolt-on” payload-bus interface.

—.
Appendix B—The Future of Earth Remote Sensing Technologies I 111
chemical changes on land, in the atmosphere, and inthe oceans (see chs. 3-5). NASA’s Earth ObservingSystem of satellites is the centerpiece of NASA’sMission to Planet Earth. NASA has designed EOS toprovide 15 years of continuous high-quality data setsrelated to research priorities recommended by theIntergovernmental Panel on Climate Change (IPCC)and the Committee on Earth and EnvironmentalScience (CEES) of the Federal Coordinating Councilfor Science, Education, and Technology (FCCSET)(table 5-1 ). To achieve 15-year data sets, each of twoEOS polar platforms, with a design life of 5 years,would be flown three times. Most scientists believe anobservation period of 15 years is long enough toobserve the effects of climate change resulting fromthe sunspot cycle (11 years), several El Nino events,and eruptions of several major volcanoes. It shouldalso be possible to observe some effects of deforesta-tion and other large-scale environmental changes.Scientists are less certain whether 15 years is longenough to distinguish the effects of anthropogenicgreenhouse gases on Earth’s temperature from naturalbackground fluctuations. Ecological studies of thehealth and migration of terrestrial systems also requirelonger continuous records (on the order of 20-50years).
Intermediate-size, polar-orbiting satellites are theprincipal EOS platforms for sensors gathering globalchange data.6 Measurements for MTPE can be broadlydivided into two types:
1. Long-term monitoring-to determine if climateis changing, to distinguish human-induced fromnaturally induced climate change, and to deter-mine global radiative forcings and feedbacks(box B-1).
2, Mechanistic or “process” studies-detailed analy-sis of the processes that govern phenomenaranging from the formation of the Antarcticozone hole to the gradual migration of treespecies. 7
Global change researchers disagree over whether theEOS program as currently configured is optimallydesigned to perform these different missions andwhether the EOS program will address the mostpressing scientific and policy-relevant questions. EOSprogram officials point to repeated and extensivereviews by interdisciplinary panels in the selection ofinstruments and instrument platforms as evidence thattheir program is properly structured. Program officialsalso note that payload selection panels followedpriorities set by members comprised mostly of theo-rists who would be the users of data, rather thaninstrument builders hoping for approval of a particularmission. Nevertheless, some Earth scientists expressconcern that:
The limitations of satellite-based platforms willprevent process-oriented studies from being per-formed at the level of detail that is required toaddress the most pressing scientific questions;Continuous long-term (decadal time-scale) moni-toring is at risk, because of the high-cost, longlead times, and intermittent operations that havehistorically characterized design, launch, andoperation of large multi-instrument satellite plat-forms.
According to this view, a more “balanced” EOSprogram might have greater support for small satellitesand a more balanced USGCRP program might includegreater support for groundbased measurement pro-
A These arc multl-instrument satelhtcs and are relatively expensive. For example, NASA estimates that total hardware development costsfor the EOS AM-1 satellite and Its sensors will approach .$800 million. This figure does not include launch costs, which are expected to bq$100150 m]llmn, or gnwnd segment and operatlrms costs. EOS AM-1 includes the U.S.-developed MODIS, MISR, and CERES instrumentsand the forei.grl-suppllcd ASTER and MOPIIT instruments (provided at no cost to build to the United States).
The cojt of bulldlng followr-ons m the AM series would be substantial} less as much of the initial cost is associated with nonrecuningInstrurnerrt .ind $pacccraft bus (icjign :md development costs and one-time acquisition of ~ground support elements. Savings of 50 to 70 percentmay hc powble, depending on the acqu]slt ion time-schedule. EOS PM series of multi-instrument satellites will not be a copy of the AM series.( ‘osts for PM-1 are expected to be s]milar, but somewhat lower, than for AM-1. Follow-ons to the PM series may not be as expensive asfollow-on.s m the AM-l sencs because most of the PM instruments are repeated.
~ Sclcntists make no clear (ielineatirm between process studies and monitoring studies. In general, global change researchers use the term‘ ‘process study ‘‘ to refer to short-term less costly, and more focused experiments that aim to elucidate the details of a particular mechanismof some geophysical, chcrnlcal, or biological inter,ic( ion. The distinction is least useful for studies of the land surface, which may require yearsor more of study (for example, studies of terrestrial ecosystems may require a decade or more of obscmati~n [o s~dY a P~~ticul~ Process suchas migratmn of tree species).

112 I Remote Sensing From Space
Box B-1-Climate Forcings and FeedbacksClimate forcings are changes imposed on the planetary energy balance that alter the global temperature;
radiative feedbacks are changes induced by climate change. Forcings can arise from natural or anthropogeniccauses. Examples of natural events are the eruption of Mt. Pinatubo in June 1991, which deposited sulfateaerosols into the upper atmosphere, and changes in solar irradiance, which scientists believe may vary by severaltenths of a watt/m2 per century (the Earth absorbs approximately 240 watts/m2 of solar energy). Examples ofanthropogenic forcings appear in the table “Human Influence On Climate,” below. At present, the dominant climateforcing appears to be the increasing concentration of greenhouse gases in the atmosphere.
The distinction between forcings and feedbacks is sometimes arbitrary; however, forcings can be understood
as quantities normally specified in global climate model simulations, for example, C02 amount, while feedbacksare calculated quantities. Examples of radiative forcings are greenhouse gases (C02, CH4, CFCS, N2Q 03,stratospheric H20), aerosols in the troposphere and stratosphere, solar irradiance, and surface reflectivity.Radiative feedbacks include clouds, water vapor in the troposphere, sea-ice cover, and snow cover. For example,an increase in the amount of water vapor increases the atmosphere’s absorption of long-wave infrared radiation,thereby contributing to a warming of the atmosphere. Warming, in turn, may result in increased evaporation leadingto further increases in water vapor concentrations.
The effects of some forcings and feedbacks on climate are both complex and uncertain. For example, cloudstrap outgoing, cooling, longwave infrared radiation and thus provide a warming influence.1 However, they alsoreflect incoming solar radiation and thus provide a cooling influence. Current measurements indicate t hat the neteffect of clouds is a cooling one. However, it is uncertain if the balance will shift in the future as the atmosphereis altered by the accumulation of greenhouse gases.
An example of a radiative forcing whose effect on climate is uncertain is ozone. The vertical distribution ofozone (O3) affects both the amount of radiation reaching the Earth’s surface and the amount of re-radiated infraredradiation that is trapped by the greenhouse effect. These two mechanisms affect the Earth’s temperature inopposite directions. Predicting the climate forcing due to ozone change is difficult bemuse the relative importanceof these two competing mechanisms is also dependent on the altitude of the ozone change. Calculations by Dr.James Hansen of the Goddard Institute for Space Studies indicate that ozone loss in the upper stratosphere warmsthe Earth’s surface because of increased ultraviolet heating of the troposphere; ozone addition in the tropospherewarms the surface moderately; and ozone loss in the tropopause causes a strong cooling because the lowtemperature at the tropopause maximizes the ozone’s greenhouse effect.2
1 V. ~manathan, Bruce R. Barkstrom, and Edwin Harrison, “Climateandthe Earth’s Radiation Budget,” phySiCSToday, vol. 42, No, 5, May 1989, pp. 22-32.
2 me tmvs~ere, or loWr atmosphere, is the region of the atmosphere where =dr is most den= and where most
weather occurs. By this definition, the troposphere extends from the surface to altitudes of roughly 30,000-50,000 feet.In dear sky, the tropxphere is Iargefy transparent to incoming solar radiation, which is absorbed at the Earth’s surface.
The temperature of the atmosphere falls steadily with increasing altitude throughout the troposphere (normaliyseveral ‘F per 1,000 feet altitude). The heat transfer by turbulent mixing and convection that results from this variation,the coupling of the Earth’s rotation to the atmosphere, and latitudinal variations in temperature are responsible for thedevelopment and movement of weather systems. Troposphere temperatures reach a minimum at the tropopause, theboundary between the troposphere and the stratosphere, and then remain approximately constant through the iowerstratosphere. The temperature rises again in the upper stratosphere. The tropopause can reach temperatures as low as185 K (-126 oF) in the polar winter.

Appendix B—The Future of Earth Remote Sensing Technologies I 113
Human Influence On Climate
Fossil Fuel Combustion
● CO2 and N2O emission (infrared (IR) trapping). CH4 emission by natural gas leakage (IR trapping). NO, N02 emission alters 03 (ultraviolet absorption and IR trapping)
. Carbonaceous soot emission (efficient solar absorption)
. S02-Sulfate emission (solar reflection)Land Use Changes
● Deforestation (releases C02, increases albedo, and increases snow albedo feedback)
. Regrowth (absorbs C02, decreases albedo, and decreases snow albedo feedback)
. Biomass burning (releases C02, NO, NOZ, and aerosols)
● Landfills (releases CH4)Agricultural Acfivity
● Releases CH4 (IR trapping)● Releases N20 (IR trapping)
/ndustrial Activity
● Releases CFCS (IR trapping and leads to ozone destruction)
. Releases SF6, CF4, and other ultra-longlived gases (IR trapping virtually forever)SOURCES: J. Hansen, W. Rossow, and 1. Fung, ‘(Long-Term Monitoring of Global Climate Forcings and Feedbacks,” Proceedings of aWorkshop held at NASA Goddard Institute for Space Studies, Feb. 3-4, 1992; and Johan Benson, “Face to Face,” Interview with JamesHansen, Aerospace America, April 1993, pp. 6-11. Table on human influenee on climate adapted from Dr. Jerry D. Mahlman,‘(Understanding Climate Change,”’ Draft Theme Paper, prepared for Climate Researeh Needs Wwkshop, Mohonk Mountain House, Nov.8, 1991. I
grams, including ocean measurement systems, and thought to be most in need of improved scientificalternative sensor platforms, such as long-duration,high-altitude unpiloted air vehicles.
The USGCRP and National Space Policy Directive7 have assigned the lead role in enabling globalobservations from space to NASA (see ch. 2). Greatersupport for the non-space-based elements of theUSGCRP would provide important data that wouldcomplement or correlate data derived from space-based platforms. Officials from the USGCRP, NASA,and NOAA who attended a February 1993 OTAworkshop were unanimous in their belief that rela-tively modest additions of funds could produce sub-stantial increases in scientific output.8
In restricting the EOS program (see ch. 5) NASAhas sought to emphasize those global change issues
understanding to support national and internationalpolicymaking activities. This has affected both mis-sion priorities and instrument selection. The restruc-tured program’s first priority is acquiring data onglobal climate change. As a result, NASA hasdeferred missions designed to improve scientificunderstanding of the middle and upper atmosphere andof solid Earth geophysics. Instruments affected by thisdecision include new sensors for very high-resolutioninfrared, far-infrared, and submillimeter wave spect-roscopy.
Deferral of instruments to monitor solid Earthphysics, which includes the study of crustal and icesheet movements, was based on the relative unimpor-tance of these processes to global climate change. A
8 For example, several officials agreed that increases in USGCRP budgets on the order of $100 million per year for correlative measurementswould ‘ ‘double scientific output. Greater support for complementary non-space-based elements of the USGCRP could be provided either byredirection of already tight NASA budgets, from greater support for the USGCRP within the DOE, DoD, and other relevant departments andagencies, or from increases in USGCRP budgets. EOS program officials are empbatic in stating that their already reduced budget has littleflexibility to accommodate further reprogramming. A discussion of this and related issues will appear in a forthcoming OTA background paper,‘‘EOS and USGCRP: Are We Asking and Answering The Right Questions?’

114 I Remote Sensing From Space
Figure B-l—Physical Processes Operating In the Stratosphere
Ultraviolet (UV)radiation
Catalyticchemistry
Solar UV \Chemistryand dynamics
o
N 02
—.. —.— > H 02
Clo<’- ‘ - -‘ -
Trace speciestransport
\
Temperatureforced winds
Troposphere
The arrows show interactions between imposition and atmospheric renditions. Maintenance of the stratospheric ozone layer,which shields terrestrial life from solar UV radiation, is of prime concern.SOURCE: “Protecting the Ozone Layer,” Energy and Technology, May, June 1990, p. 50.

Appendix B—The Future of Earth Remote Sensing Technologies I 115
different reasoning may account for the decision todefer instruments to monitor stratospheric chemistryand, in particular, ozone depletion (figure B-l). TheUnited States and other nations had already agreed tosteps that would phase out the use of ozone-depletingchlorofluorocarbons (CFCS). Furthermore, even with-out the EOS instruments, NASA officials couldanticipate improvements in understanding of upperatmosphere chemistry and the mechanisms for ozonedepletion as data from UARS, a precursor satellite toEOS, was combined and analyzed with data fromgroundbased, and in-situ balloon and aircraft meas-urements.
However, assessment of the success of efforts tostabilize ozone reductions may be hampered by thedeferral of instruments to monitor the upper atmos-phere. In addition, elimination of missions that mightprovide a detailed understanding of the fundamentalprocesses that are causing ozone depletion in the lowerstratosphere increases the risk that the United Statesand other countries will be unprepared to respond tofuture “surprises” with respect to ozone depletion.10
Similarly, detailed process studies are necessary tomeasure the sources and sinks of carbon dioxide andother greenhouse gases. Without this knowledge,regulative and mitigative actions cannot be made withhigh confidence that the desired effect (for example,decreased rate of CO2 increase) will occur as antici-pated. l 1
U.S. policy makers are divided on the question ofwhat, if any, steps the United States should take toreduce the emission of greenhouse gases.12 E O S
instruments will supply some of the needed scientificdata on the effect of greenhouse gases on globalwarming (box B-2). Ultimately, researchers hope toadvance climate models to the point where reliablepredictions can be made about the magnitude of globalwarming and regional effects. Policymakers regardthis information as essential to guide adaptation ormitigation efforts. In contrast, although the physicaland chemical processes governing the depletion ofozone in the upper atmosphere have many uncertain-ties, the international community has agreed to reduceCFC emission in hopes of reducing ozone depletion.This difference in approach is clearly related to theavailability of relatively inexpensive alternatives toCFCS. Pressure to act despite uncertainty was alsoinfluenced by predictions that various CFCS wouldreside in the stratosphere for 50 to 150 years afteremission. In addition, aircraft and satellite observa-tions of a growing ozone hole in the Antarctic fueledpublic pressure for action to stabilize ozone levels.
Steps to mitigate the effects of ozone depletion orglobal warmin g will require financial or other sacri-fices. The relative cost of these mitigative efforts maybe highest in developing nations. Building an inter-national consensus on the appropriate steps tomitigate ozone depletion and possible global warm-ing will require a USGCRP program organized toanswer the most important scientific questions.“Good policy” is most likely to flow from “goodscience. ”
The rest of this section discusses three key instru-ments that were delayed or not funded:
s Solar ultraviolet radiation is the principal source of energy in the stratosphere and is responsible for many important photochemicalprocesses. Ozone is concentrated in the stratosphere at altitudes between approximately 65,000 and 100,000 feet. The absorption of solarultraviolet radiation by ozone is responsible for the increase in temperature with altitude that characterizes the stratosphere. The stratosphereis coupled to the lower atmosphere chemically (through photochemical processes), radiatively, and dynamically (various global circulationprocesses). See discussion and figure 4 in V. RamanathaL Bruce R. Barkstsou and Edwin HarrisoG “Climate and the Earth’s RadiationBudgeC’* Physics Today, vol. 42, No. 5, May 1989, pp. 22-32.
10 UARS is not a long-term monitoring satellite-its various instruments have expected lifetimes that range from approtitely 14 montito 4 years. Currently, there is no planned follow-on to UARS. Although some of its instruments will fly on EOS platforms, a gap of severalyears in time-series of data is likely.
11 Jerry D. Mahhmq “Understanding Climate Change, ” Draft Theme Paper prepared for Cthnate Research Needs Workshop, MohonkMountain House, Nov. 8, 1991.
12 poliw Options for tie Ufitd Sbtes Me a~v~ ~ us Conwss, Offim of T~~o@y Assessmen~ Changing by Degrees: Steps tO
Reduce Greenhouse Gases, OTA-O-482, (WashingtoIL DC: U.S. Government Printing Ofllce, February 1991).

116 I Remote Sensing From Space
Box B-2–The Greenhouse Effect
The Earth’s atmosphere is composed of approximately 78 percent nitrogen, 21 percent oxygen, and a hostof trace gases such as water vapor, carbon dioxide, and methane. Although these gases are nearly transparentto solar radiation, atmospheric water vapor, water in clouds, and other gases absorb about 20 percent of theincoming solar radiation, An additional 30 percent of the incoming solar radiation is scattered or reflected,especially by clouds, back into space. By contrast, the atmosphere is opaque to the less energetic infraredradiation emitted by the Earth’s surface. About 90 percent of this heat energy given off the surface is absorbedby the clouds, water vapor, and trace gases such as C02, methane, and chlorofluorocarbons that are beingincreased by human activities.
Once absorbed in the atmosphere, the heat energy is reradiated, much of it back to the surface which canbe further warmed, leading in turn to increased heat emission to the atmosphere and further absorption andreradiation to the surface. In this way, clouds, water vapor, and other trace gases have the effect of warming thesurface (however, as noted above, clouds also cool the surface by reflecting incoming solar radiation back tospace). In fact, the recycled energy reemitted from the atmosphere to the surface is nearly twice the energyreaching the surface from the Sun. It is this “greenhouse effect” that makes the Earth’s climate different from theMoon. The analogy is not perfect, however, because it suggests that the atmosphere and the glass in agreenhouse lead to warming by the same mechanisms of trapping and reradiation. A greenhouse actually stayswarm because the glass keeps the atmospheric moisture from escaping (which is why effective greenhouses arealways humid), thereby reducing the cooling effect of evaporation. Despite the difference in how the mechanismswork, the term “greenhouse effect” has stuck, providing us with a reminder that allowing continued increases inthe concentration of trace gases (and associated increases in the water vapor concentration) will eventually leadto future warming.
SOURCE: Quotation from “Systematic Comparison of Global Climate Models,” Lawrenee Uvermore National Laboratory, Energy andTtinology Review, May-June 1990, p. 59.
1. LASER ATMOSPHERIC WIND SOUNDER– ters to accuracies of 2 to 3 meters/second. ScientistsLAWS would not only use this information in numerical
LAWS is a proposed Doppler laser radar13 that weather prediction,14 but also to understand a numberwould allow direct measurement of tropospheric winds of climate processes, including the transport of waterwith high resolution. As conceived by NASA, LAWS vapor in the atmosphere and the heat, mass, andwould provide wind speed and direction at different momentum coupling between the ocean and thealtitudes in the troposphere every 100 square kilome- atmosphere. In addition, if successful, LAWS would
13 ASO c~]ed li&r, for light ra&r. The Doppler shift is the change in laser frequency of the retur% which 1S prOpOttiOrEd tO the s@ter~’s
radial motion relative to the laser source. A familiar analog to this is the change in pitch that is heard as an ambulance siren or train whistleapproaches and then recedes from a stationary observer.
In operatiou a LAWS satellite would transmit a pulse of laser energy towards the - some of which would be scattered back to the satelliteby atmospheric clouds and aerosols. Scatterers in clouds and aerosols move with the local wind velocity. Therefore, wind velocities can bedetermined by analyzing the return signal’s Doppler shift. The different altitudes at which the wind velocities are measured is determined byanalyzing the round-trip travel time of the laser pulse.
14 me input for nw~c~ w~ther prediction models are maps of temperature, water vapor, md wind speeds and directions defined overa global network of model gridpoints. These maps, which may contain some 1,000,000 values, specify an ‘‘initial state’ of the atmosphere.Numerical weather prediction consists of using model equations to advance this initial set of data to a new set at a later time. Current systemsare limited in their capabilities because they tack access to global wind fields.
It might be thought that wind fields could be derived from temperature fields, which ean be roughly determined with current satellite systems.Although there are dynamical relations between temperature fields and wind fields, wind measurements have more information than dotemperature measurements, especially for the smaller scales of motion that are of key importance for weather prediction. Source: Cecil bi@Lawrenee Livermore NationaJ Laboratory, private communication.

Appendix B—The Future of Earth Remote Sensing Technologies I 117
allow the determination of the distribution of aerosolsand cirrus clouds, and the heights of cirrus andstratiform15 clouds.
As initially proposed, LAWS was a large instrumentwith a mass of some 800 kilograms. It would fly on itsown platform and its solar power supply would berequired to supply some 2,200 watts of continuouspower. 16 A space-based laser wind sounder requires
large amounts of power because of the necessity totransmit high-power laser pulses and because candi-date lasers convert only a small fraction of their inputelectrical energy into laser light.17 The LAWS pro-posal called for a pulsed, frequency-stable CO2 lasertransmitter operating at the 9.11 micron line of the C02
laser system; 18 a 1.5 meter transmit/receive telescope;and a cooled detector. The laser transmitter wouldproduce pulses with an energy of approximately 15 to20 Joules per pulse, with a pulse repetition rate thatcould be varied between 1 and 10 pulses per second.
NASA established a 5-year lifetime requirement forLAWS. With laser repetition rates of 5 to 10 pulses persecond, this is equivalent to requiring reliability overapproximately 1 billion laser pulses. The high cost of
LAWS (according to officials at GE Astro-SpaceDivision, about $600 million in 1991 dollars) anduncertainty about the ability of a space-based CO2 laserto maintain its pulse rate over 5 years were among thechief reasons that NASA chose not to fund LAWS inthe restructured EOS program. Efforts to demonstratethat a CO2 laser can deliver billion shot lifetimes led tothe demonstration, by GE in the summer of 1992, of100 million pulses from a sealed, laboratory system.GE Astro-Space officials believe that by adding asmall, lightweight (less than 5 kg) gas refill systemcontaining ten laser fills a LAWS space-based lasercould achieve one billion pulses.
Research into laser alternatives for the CO2 laser isproceeding in many locations, especially DOE na-tional laboratories. In principle, solid-state lasersshould be less prone to failure than high-power gasC O2 lasers. 19 However, another potential advan-tage-the reduction in requirements for laser energy
or the size of telescope optics—is less certain.20
Development of space-based solid-state lasers for aLAWS mission will require the resolution of a numberof technical issues.21 Some of these are associated with
15 s~a~om ~]~ud~, ~ ~~cu]m m~ne Stratocmu]us, S]gfificanfly ~fect tie s~fiace heat budget ~d may be important in regulating
climate, Because marine stratocumulus are associated with regions of large-scale subsidence, they are typically not overlain by higher clouds,and hence would be observable by a space-based laser wind sounder. Source: Dr. Michael Hardesty, NOAA Wave Propagation Laboratory,Boulder, CO, private communication.
16 ~ an effo~ t. reduce costs, a “descowd’ ‘ LAws ~ ~s.o been s~dl~. ~ls ~s~ent wo~d reduce tie Ouput pOWeT by a factor C)f
3-4 and reduce the telescope diameter to 0,75 meters. A LAWS science team meeting in Huntsville, AL, from Jan. 28-30, 1992, consideredthe science implications of building this instrument. They concluded that the descoped instrument could still measure tropospheric winds wellenough to make important contributions to atmospheric general circulation models.
17 For example, the ‘‘wallplug’ eftlciency of the baseline COZ laser is approximately 5 percent,
[g More precisely, this is a line intie ‘W180Z isotope laser, This line is chosen because the reduced abundance of this isotope int.he atmosphereminimizes atmospheric attenuation.
19 For ewp]e, sohd-smte liners would avoid tie diffl~lties of designfig a long-lived gas ~dling system. They would also avoid the
possibility of failure from electrode “poisoning’ ‘—impurities introduced into the laser as a resutt of sputtering from the electric dischargeelec~odes, (However, based on the demonstration described above, GE researchers concluded that sputtering would not be a serious problem. )
m me ~ser enerm and sim of telescope optics for a laser radar are related to the efficiency of the detection pmcess, w~ch IIMY be m=smedby the signal-to-noise ratio (SIYi) coming out of the detector, The leading candidate solid-state laser operates at a wz Telength near 2 microns.A longstanding, and still unresolved, debate within the community of researchers developing LAWS is whether this shorter laser wavelengthsystem would have overall superior performance compared to the proposed 9.1 micron COZ laser system.
‘1 These include the design of a system to provide the very accurate pointing of the narrow laser beam that is needed to ensure reeeption ofthe return signal. In addition, both the optics and the beam quality of UWS would have to be near-perfect (i.e., near diffraction limitedperformance) because LAWS would use coherent detection to measure wind velocities. (Coherent detection mixes a stable frequency sourcewith the return signal to generate a beat frequency that is proportional to the wind velocity,) COZ wind lidars with similar requirements for beamquality and optics quality have operated successfully on the ground for over a decade,
Several DOE national laboratories are also exploring the potential of noncoherent laser Doppler velocimetry, which would measure windvelocities without using coherent detection. Noncoherent methods have much lower requirements for pointing accuracy and beam quality.However, they may be less sensitive than coherent systems and they also have additionat requirements, for example, the necessity to measurethe amplitude of the transmitted and received beam precisely.

118 Remote Sensing From Space
the development of the requisite laser crystals, semi-conductor array pumps, and coherent detectors; othersare related to the pointing and stability of theshorter-wavelength system. Eye safety is also an issueof greater concern at the operating wavelengths of thesolid state laser than it is with the CO2 laser.
Currently, only the CO2 system is far enough intodevelopment for consideration in early EOS flights.An effort to find international partners for this systemis underway; GE officials also are exploring potentialcollaborations among NASA, DOE, NOAA, and DoD.
2. SYNTHETIC APERTURE RADAR-SARNASA originally proposed a SAR for the EOS
program because of its unique ability to make highresolution global measurements of the Earth’s surface(see box B-3), but decided not to fund it because of itsprobable high cost (over $1 billion in 1991 dollars).Operating at microwave frequencies, SAR radar re-turns are sensitive to the electrical and geometricproperties of the Earth’s surface, its cover, and its nearsubsurface. These data complement optical imageryand the combined data set may allow the study of suchimportant Earth system processes as the global carboncycle. Because SARS operate at microwave frequen-cies they are largely unaffected by clouds. This isparticularly useful for monitoring the intensely cloudedtropical and polar regions of the Earth. Operationduring both day and night is also possible becauseSARS, like all radars, provide their own illumination inthe form of radar energy.
SAR data could substantially improve the value ofother EOS data. For example, researchers are particu-larly excited by the possibility of combining data fromSAR about the physical properties of Earth’s surfacewith data about chemical composition from HIRIS (seebelow). The combination would have the potential todate the ages of geomorphic surfaces and thus provideanew data set that would determine the rates of surfaceerosion and deposition.22 A space-based SAR wouldalso provide digital topographic data, vital for mosthydrologic, geologic, and geophysical investigations.By using two antennas, SARS can be used in aninterferometric mode to acquire global topographicdata at resolutions on the order of 30 to 50 metershorizontal, 2 to 5 meters vertical.23
Synthetic aperture radar is a well understood tech-nology with a long heritage of both civilian andmilitary applications. The U.S. experience in flyingspace-based SARS for civilian applications began withthe Seasat mission in 1978 and continued with SARmissions on Space Shuttle flights in 1981 and 1984(Shuttle Imaging Radar-A & B). Currently, the JetPropulsion Laboratory is preparing a third Shuttleimaging radar, SIR-C, for l-week flights in 1994-1996(box B-4). SIR-C will include a German and ItalianX-band SAR (and is therefore sometimes referred to asSIR-C/X-SAR); the combination of systems will form
a multiangle, multifrequency, multipolarization radar(a “color” SAR) that will demonstrate the technolo-gies necessary for EOS SAR.24 Foreign experience inspace-borne SARS includes the two SARS currently inorbit. These systems, built and operated by Japan andEurope, are free-flying systems designed for multiyear
~ B.L. Isacks and Peter Moughinis-Marlq “Solid Earth p~el, “ in The Earth Observer, vol. 4, No. 1, 1992, pp. 12-19. The Earth Observeris published by the EOS Project Science Office, Code 900, NASA Goddard Space Flight Center, Greenbelt, MD. As discussed below, budgetcuts forced cancellation of I-IRIS fiorn the EOS program.
2-3 D~ne L Evms, Jet ~p~sion ~borato~, p~soti cOmCnticatiOn, Apr. 20, 1992. The essence of tie ~tefierometic SM ‘Wtique
is to transmit a radar pulse and usc the phase difference in signals received by two antennas, sepamted by a known distance, to infer groundelevations. The required distance between the separated antennas increases M the frequency is lowered. Thus, for example, bband transmissionwould require locating receive antennas on two separate spacecraft. However, at Ka band, both antennas could be located on a single spacecraft(one located on a boom).
~ me capability to vw radw incidence angle is necessary for measurements that require penetration to the Surface, for example, ~ mapp@
forest clear cuts. SIR-C, which is being developed by the Jet Propulsion Laboratory for NASA, is a two-frequency, multi-polarization SARthat can vary its angle of incidence from 15c’ to 55°. SIR-C/X-SAR is a joint project of NASA, the German Space Agency and the ItaLian SpaceAgency and will be the first spaceborne radar system simultaneously to acquire images at multiple wavelengths and polarizations. X-SAR,which Germany and Italy are providing, is a single polarization radar operating at X-band (3 cm wavelength). It is mounted on a bridge structurethat is tilted mechanically to align the X-band beam with SIR-C’s L-and C-band beams. SIR-C/X-SAR is scheduled to fly aboard the SpaceShuttle on 3 missions in 1994-1996 and will acquire seasoml data on vegetation, snow, and soil moisture.

Appendix B—The Future of Earth Remote Sensing Technologies I 119
Box B-3-Synthetic Aperture Radar
Spaceborne radar systems may be classified in three general categories: imagers, altimeters, andscatterometers/spectrometers. Imaging radars are used to acquire high-resolution (few meters to tens of meters)large-scale images of the surface. They are used for the study of surface features such as geologic structures,ocean surface waves, polar ice cover, and land use patterns. A synthetic aperture radar is a special type ofmicrowave radar-a “side-looking radar” (see figure B-2)-that achieves high resolution along the direction ofmotion of its airborne or spaceborne platform.
Radar resolution is usually defined as the minimum ground separation between two objects of equalrefIectivity t hat will enable t hem to appear individually in a processed radar image. A sideways-looking radar hastwo resolutions: range resolution (“cross-track” resolution), which is perpendicular to the ground track, and azimuthresolution (“along-track”) resolution, which is in the direction of motion. Range resolution is determined by thelength of the radar pulse because objects at different ranges can only be distinguished if their radar returns do notoverlap in time. Azimuthal resolution is determined in conventional radar systems by the width of t he ground stripthat is illuminated by the radar, which is determined by the antenna beamwidth. Unlike conventional radar, theazimuthal resolution obtainable with a SAR is not determined by the size of antenna used in themeasurement. A small antenna with a wide field-of-view can make high spatial resolution images by taking manyclosely spaced measurements.
Mathematically, an array of antennas is equivalent to a single moving antenna along the array line as longas the received signals are coherently recorded (i.e., phase information is retained) and then added. The SARtechnique can be applied to spaceborne radar applications where the motion of t he spacecraft allows a particularobject on Earth to be viewed from numerous locations along the orbital path. It can be shown that the bestazimuthal resolution on t he ground using a synthesized array is equal to L/2, where L is the antenna length. Thisresult is counter-intuitive because smaller antennas have higher resolution and because the ground resolution isindependent of sensor altitude.
In his text on radar remote sensing, Charles Elachi notes that the fact that the resolution is independent ofthe distance between sensor and the area being imaged can be understood by noting that the farther the sensoris from the ground, the larger the footprint, and therefore the longer the synthetic array, This leads to a finersynthetic beam which exactly counterbalances the increase in distance.
The other surprise of synthetic aperture technique-finer resolution can be achieved with a smallerantenna-ca n be explained by noting t hat the smaller the antenna, t he larger the footprint and the synthetic array.This leads to a finer synthetic beam, and therefore, finer resolution, However, smaller antennas gather less energythan larger antennas. Therefore, for maximum signal-to-noise in the detected signal, a designer may choose thelargest antenna that is consistent with the minimum required resolution and the volume constraints of theinstrument package. (Another way to increase the signal-to-noise would be to increase the time the SAR dwells
in scanning a particular scene; however, platform speed in low-Earth orbit (approximately 7 km/s) places practicallimits on this method.)
The return radar echoes received by a SAR are spread over a time that is proportional to the distance betweenthe SAR platform and various features in the target. In addition, interference between signals reflected from variousparts oft he target will modify t he amplitudes and the phases of the echo signal pulses. Thus, synthetic apertureradar signals are unintelligible in their raw form; they must be processed electronically to produce a useful visualdisplay. Uncompensated motion during aperture synthesis causes a blurring of the resultant SAR image.Techniques to deblurr these images using novel image processing software/parallel computer processing arebeing developed with the support of DOE and DoD.
(continued on next page)
L

120 I Remote Sensing From Space
Spaceborne synthetic aperture radars can achieve ground azimuthal resolutions that are hundreds or eventhousands of times better than those from a real aperture system. (In practice, the azimuthal resolution is oftenmade equal to the range resolution.) However, they require very fast on-board electronic processing andhigh-speed data links to the ground. Data are generated at enormous rates in SARs-for EOS SAR, 180 Mbpspeak, 15 Mbps, average.
Satellite-based SARS have their antenna, power, and data transmission requirements fixed by missionrequirements such as spatial and temporal resolution and radar frequency. For example, the frequency andaltitude of a SAR drive antenna size requirements; the required signal-to-noise ratio is a important factor indetermining transmitter power requirements; and the size and resolution of the area to be imaged dictate therequired data rate. Power requirements scale as the cube of altitude; power-aperture products scale with thesquare of altitude.’ Power, size, and weight requirements may be relaxed for aircraft-mounted SAR. However,compensating for a platform that vibrates and may be buffeted by winds and changing atmospheric conditionsposes new challenges. In addition, aircraft-mounted SAR have the endurance limitations common to allaircraft-mounted instruments.
1 ~ese fact~s are related byttte “radarequation,” which can be expressed in terms of the observed signai to nhratio (SNR). The SNR is dependent on receiver performance. In addition it is proportional to the average transmitted power;the square of the antenna gain (proportional to area); the cube of the radar wavelength; the target radar “cross section,”(a measure of target reflectivity); the cross-track resolution (which is related to the bandwidth of the radar processor andis therefore related to the noise); the inverse cube of the slant range to target; and the inverse of the spacecraft velocit y.SOURCES: Briefings to OTA, Jet Propulsion Laboratory, January 1992; Chartes Elachi, Spacdwrne Radar Remote Sensing: App/ieat/onsand Techniques, (New York, NY: The Institute of Electrical and Electronics Engineers, 19SS); and “Radar Images,” in Sandia NationalLaboratory, Sandia Technology: Engineering and Scierree Accomplishments, 1992, pp. 32-33.
operation. A similar free-flying Canadian SAR is combined with advances in modeling of radar backscat-scheduled for launch in 1995.25
All current and planned foreign space-based SARSoperate in single-frequency, single-polarization mode.In contrast, the proposed EOS SAR, like SIR-C/X-SAR, would be capable of making multiangle, multi-frequency, multipolarization measurements. Thesecapabilities allow more information to be extractedfrom an analysis of radar backscatter and would giveEOS SAR the potential to make global measurementsof biomass, soil moisture, polar ice, and geology.26
(Data from aircraft27 and Shuttle-based experiments
ter signals will be necessary to demonstrate thatbiomass and soil moisture measurements over vege-tated land can, in fact, be made precisely enough to beuseful to global change researchers.) Multifrequency,multipolarization SARS have been developed foraircraft experiments, but until recently they have beenconsidered too challenging and expensive to incorpo-rate in a free-flying spaceborne system.
In principle, EOS SAR could have been used tomonitor and characterize forest growth. AtmosphericC02 from forests is a key unknown parameter in the
~ See ch. 4: Stiace Remote Sensing and app. D for descriptions of eNsting SAR SateuteS.26 FOrelw s~5 ~ve more lfit~ ~apabiliti~ for glob~ c~ge res~ch comp~ed to the proposed EOS SAR. The European ERS- 1
operates in C-band (at 5.4 GHz). This frequency is especially suited for mapping sea ice and snow cover, but is not the preferred frequencyfor most EOS-class science missions. For example, studies of plant and soil moisture require lower frequency SARS because the lowerfrequency penetrates deeper into vegetation and soils. ERS-1 also does not have global coverage. The Japanese JERS-1 operates in L-band (at1.3 GHz), and is preferred for more science missions. However, JERS- 1 has relatively poor signal-to-noise ratio. Its principal scientitlc objectiveis to study geology. The Canadian Radarsat witt be a single frequency and pol arization instrument operating in C-band (at 5.3 GHz), and willhave a wide swath width, but its principal application will be to monitor polar ice in the northern latitudes. (The Russian Alrnaz, whichde-orbited on Oct. 17, 1992, was a single polarization instrument that operated at a frequency near 3.1 GHz in the S-band.)
27 Airborne SARS include tie Jet PmpuIsion Laboratory AIRSAR, a three-frequency pokirnetric SAR that 1S providing prototype data forthe Shuttle Lmaging Radar-C (SIR-C) and the EOS SAR.
Appendix B—The Future of Earth Remote Sensing Technologies I 121
global carbon cycle.28
EOS SAR would have comple-mented EOS MODIS, which will monitor C02 uptakein the oceans, by monitoring the extent of deforesta-tion, the biomass of existing forests, and the succes-sional stage of existing forests. Remote sensing studiesof biomass in the tropical forest require a capability tosense both the forest canopy structure and the treetrunks underneath the canopy. Radar returns from the“C” band of EOS SAR would be sensitive to thecanopy structure while the longer wavelength ‘‘L’band would be able to penetrate the canopy and giveinformation about tree height, biomass, and canopyarchitecture.29
The principal impediment in developing EOS SARis its high cost, a direct result of the requirements fora high-power system with a large antenna. TheEuropean Space Agency’s ERS-1 SAR cost nearly $1billion 30 and the Japanese JERS-1 cost approximately$380 million. Early estimates of the cost of EOS SAR,including ground segment and launch costs, ap-proached $1 billion.
Cost reductions are possible if ways can be found tolower power and size requirements. Program managersfor EOS SAR generally believe that reducing power,mass, and size requirements will result from invest-ment in what are, in effect, engineering programs31—
scientists see no near-term technology ‘breakthrough’that would change this conclusion. As noted earlier,program officials for both EOS SAR and LAWS raiseconcerns that government technology developmentefforts generally minimize funding for engineering andrisk reduction programs and instead fund what isconsidered more basic science. Yet, investing intechnology development may have significant payoffin more capable, lower cost technology.
Another option for EOS SAR would be to combinethe data streams from a constellation of co-orbitingspacecraft, each carrying a single frequency SAR. Thecost of each instrument might be reduced by using astandard instrument bus. A more substantial oppor-tunity for savings would come from internationalcollaboration. NASA and its sister agencies in Canadaand Europe have begun informal discussions toexplore the possibility of achieving the multifrequencycapabilities proposed for EOS SAR through intern-ational partnerships. The European Space Agency(ESA) and Canada might provide C-band data (possi-bly with polarization diversity), the United Statesmight provide L-band polarimetric data, and Germanymight provide X-band data. To achieve the objectivesof multitemporal observations and data continuity inthe near term, the agencies have discussed develop-
~ The global carbon cycle describes the movement of carbon from i(s sources and sinks in the ocean, atmosphere, and land (e.g., ice packtundr% jungles, marshes). For example, during the day, plants take carbon dioxide from the atmosphere and convert it into organic compoundssuch as carbohydrates by using solar energy and water (the process of ‘‘photosynthesis’ ‘). Plants emit COZ during respiration, when they usethe energy stored in these compounds. The balance favors the net accumulation of carbon in trees, shrubs, herbs, and roots. When forests arecut, the effect on atmospheric C02 depends on how much carbon was stored (i.e., total biomass), what happens to the cut wood, and how thelands are mamged (e.g., new vegetation WI1l take up COZ unless the site IS converted to a reservoir, highway, or other nonvegetative state.Source: U.S. Congress, Office of Technology Assessment, Changing by Degrees: Steps To Reduce Greenhouse Gases, OTA-0482(Washington DC: U.S. Government Printing Office, February 1991), pp. 201-203.
29 ~c SAR on tie European EFN- 1 has been limited in its capability to make soil moisture measurements, even though Its frequency andincidence angle were specifically chosen for this application, because of the problem of differentiating between vegetation cover and groundmoisture. EOS SAR would allow better separation of radar backscatter contributions from the Earth’s surface and its ground cover. In principle,a multiangle, multifrequency, multipolarization SAR would allow soil moisture to be distinguished from canopy moisture or soil moisture tobe distinguished from vegetation moisture. (Successful tests have occurred in aircraft experiments; however, EOS SAR would have to ableto make similar measurements at an accuracy useful for global change.) The multiple frequency and polarization data of EOS SAR would begathered simultaneously. This would allow researchers to monitor processes independent of diurnal or weather effects, for example, monitoringsoil and canopy moisture, which will change from day to night or after a rainfall. Simultaneous measurements are also useful in monitotigice in marginal ice zones.
30 ~s fiWe ~cludes tie cost to develop, build, and launch the satellite and to construct a network of ground receiving stations and facilities.In addition+ the cost includes development of supporting instruments such as the Along-Track Scanning Radiometer. The cost to build a secondradar satellite that would be similar to ERS- 1 and use the existing ground segment is approximately $500 million.
31 Al~ough tie comPnent tw~ologies for an EOS SAR are not new, tie system possesses a number of U@Ue rM@XIlentS tit S@eSS
design and add to cost. For example, special monolithic microwave integrated circuits (MMIC) with exceptionally linear response would berequired. Similarly, specialized efforts would be needed to package SAR components in lighter weight and smaller structures. An attendee atOTA’S workshop on technologies for remote sensing noted that power efficient MMICS and lightweight antenna structures are examples ofSAR-related technology that have suffered from lack of funding.
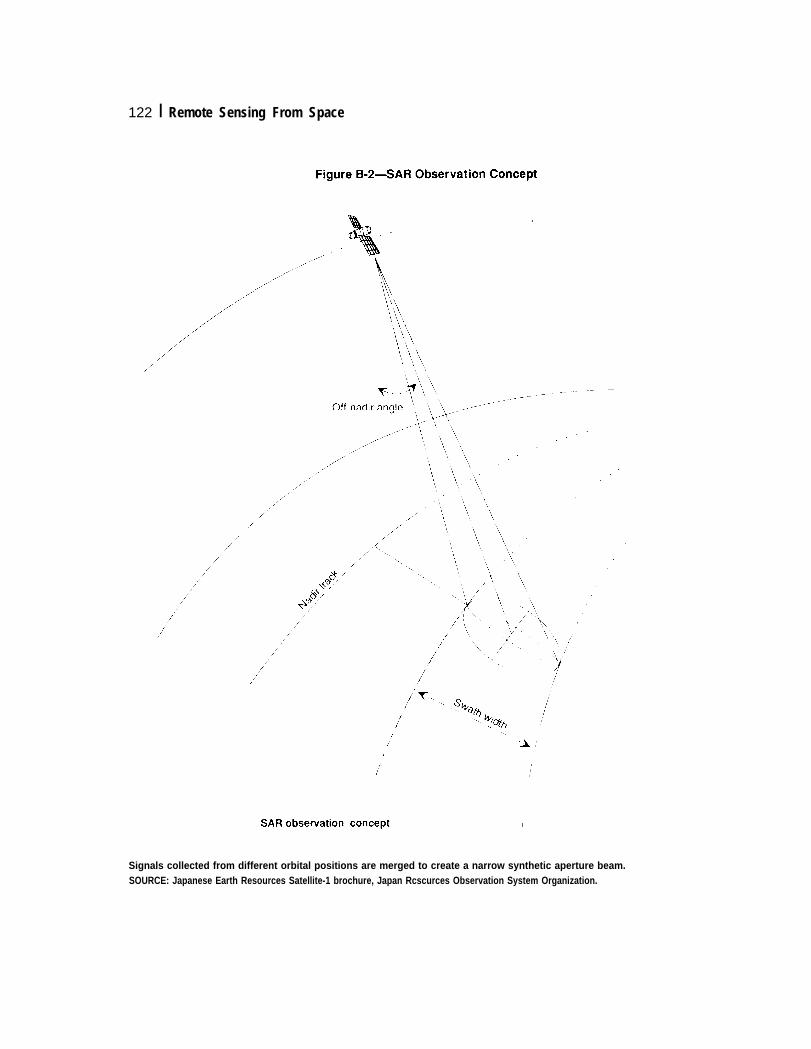
122 I Remote Sensing From Space
bm.
Signals collected from different orbital positions are merged to create a narrow synthetic aperture beam.SOURCE: Japanese Earth Resources Satellite-1 brochure, Japan Rcscurces Observation System Organization.

Appendix B–The Future of Earth Remote Sensing Technologies I 123
ment of a SIR-C/X-SAR flee-flyer in order to providemultiparameter SAR data prior to an EOS SARmission. Discussions regarding exchange of scienceteam members have been initiated in order to analyzethese options further.
3. HIGH-RESOLUTION IMAGINGSPECTROMETER–HIRIS
Since 1972, the Landsat series of satellites haveimaged most of the Earth land surface at 80-meterand 30-meter resolution in several relatively broadvisible and infrared spectral bands.32 The reflectancecharacteristics of vegetation, soil, and various surfacematerials are sufficiently different that they can bedistinguished by the relative strength of their reflec-tance in various combinations of these bands.
HIRIS was conceived as an ‘‘imaging spectrome-ter’ capable of making much more refined measure-ments of the Earths surface than Landsat by acquiringsimultaneous images of the Earth in hundreds ofcontiguous narrow spectral bands. In principle, analy-sis of HIRIS data would allow direct identification ofsurface composition; for example, identifying specificminerals, specific types of trees or ground cover,pollutants in water, and vegetation under “stress.”33
HIRIS would build on experience with the AirborneVisible and Infrared Imaging Spectrometer (AVIRIS),which became operational in 1988.34 NASA’s originalHIRIS proposal envisioned an instrument that wouldcollect images in 192 narrow spectral bands (approxi-mately 0.01 microns wide) simultaneously in the 0.4 to2.5 micron wavelength region. This range, from thevisible to the near-infrared, contains nearly all of thespectral information that can be derived from passivesensors collecting reflected solar energy.
NASA chose HIRIS’ spatial resolution to be 30meters in part because of its use in vegetation researchand geological mapping. For example, in forest
Box B-4-Shuttle Imaging Radar
NASA has flown two models of a synthetic apertureradar on the Shuttle, the Shuttle imaging radar, SIR-Aand SIR-B. Both instruments collected thousands ofimages of Earth’s surface between +280 North and-280 South. SIR-C, an international effort that incorpo-rates more advanced technology, is designed to fly onthe Space Shuttle for l-week experiments in 1994,1995, and 1996. The United States is providing adual-frequency quad-polarization radar operating atL-band and C-band frequencies; Germany and Italywill supply an X-band imaging radar. The combined3-frequency system (sometimes referred to as SIR-C/X-SAR) is the latest in a series of Shuttle imagingradars designed to demonstrate the technologiesnecessary for an EOS SAR. SIR-C/X-SAR will befunctionally equivalent to EOS SAR and will be usedto identify the optimum wavelengths, polarizations,and illumination geometry for use by EOS SAR.However, EOS SAR would not be attached to a shuttleand would require an independent power source fromsolar panels. It would also have more stringent volumeand weight constraints. On the other hand, if launchedon an expendable launcher, a free-flying SAR wouldnot have to have the safety requirements of systemsthat are rated for flight with humans.SOURCE: Jet Propulsion Laboratory: Briefing to OTA, 1992.
ecosystems, successional changes in vegetation struc-ture and function are linked to the size of gaps createdby tree death, windfall, and other disturbances.35
Thirty meters corresponds to the approximate sizepatch that develops in an Eastern hardwood forestwhen a tree is felled. It is also the approximate
sz ~ngm time.~erle~ of data is available from the series of Advanced Vev Hi@ Resolution ‘diometer (A
VHRR) sensors that have beenorbited on TIROS polar satellites. AVHRR provides multispectral imaging (2 visible channels; 3 infrared channels), but at much lowerresolution ( 1 km and 4 km).
33 Alexander F. H. Goetz and Mark He*g, “The High Resolution Imaging Spectrometer (HIRIS) for EOS, ” IEEE Transactions onGeoscience and Remote Sensing, vol. 27, No. 2, March 1989, pp. 136-144. Plant leaf spectml reflectance has been shown to differ when plantsare stressed by a variety of agents including dehydration and fungus attack. See Gregory A. Carter, ‘‘Responses of Leaf Spectral Response toPlant Stress,” American .lournal of Botany, 80(3): 239-243, 1993.
34 A much ~orc ~emltive “=slon of A~S, ~1~—hypmsp&~ digital i~ging coll~tion experiment-is being developed by the
Naval Research Laboratory for aircraft flight in 1994. HYDICE wI] serve as a testbed for both the technologies that would enable HIRIS andfor advanced aircraft-mounted sensors that could have militay applications in land and ocean surveillance.
35 Goe~ md Herring, op. cit., footnote 33, p 138.

124 | Remote Sensing From Space
resolution needed in some geological applications andis roughly the minimum resolution necessary to detectroads. Even higher resolutions may be desirable, butthe combination of hyperspectral imaging, relativelyhigh spatial resolution, and requirements for largedynamic range36already stresses many aspects ofinstrument design, especially data handling and trans-mission.
HIRIS was originally scheduled for flight on thesecond EOS-AM platform in 2003. Faced with the1992 reductions in the proposed outlays for EOS,NASA deleted HIRIS because of its high probable cost(more than $500 million in 1991 dollars). Efforts todesign a smaller, lighter, and therefore lower costinstrument are continuing. Proposals for a smallerHIRIS include reductions in required ground resolu-tion (which reduces the size of instrument optics andpeak data rates) and the use of active refrigeration tocool infrared focal plane arrays.37 Establishing the costof a smaller, lighter HIRIS is complicated by disputesover how much to budget to cover unanticipated costsassociated with the introduction of advanced sensortechnologies. Additional research is also required toestablish the utility of HIRIS to support the highestpriority missions of the restructured EOS program.3g
| Platforms: Issues and TradeoffsEach remote sensing mission has unique require-
ments for spatial, spectral, radiometric, and temporalresolution (box 4-B). Numerous practical considera-tions are also present, including system developmentcosts; the technical maturity of a particular design; andpower, weight, volume, and data rate requirements. Asa result, the selection of a “system architecture’ for a
remote sensing mission typically requires compro-mises and tradeoffs among both platforms and sensors.For example, some of the factors in determiningsystem architecture for imaging of the land surface arethe required geographical coverage, ground resolution,and sampling time-intervals. In turn, these affectplatform altitude, the number of platforms, and a hostof sensor design parameters.
SATELLITE V. NON-SATELLITE DATACOLLECTION
Remote sensing instrumentation can be placed inspace on platforms that have a variety of orbitalaltitudes and inclinations. It can also be flown onendo-atmospheric platforms: aircraft (e.g., NASA’sER-2), balloons, and remotely piloted aircraft.39 Fi-nally, instruments can be sited at well-chosen locationson the Earth’s surface.
Satellites play a central role in global changeresearch because they facilitate global, synoptic, andrepeatable measurements of many Earth systems (boxB-l). Thus, for example, satellite-based measurementsare ideal for monitoring changes in global biomass,land use patterns, the oceans and remote continentalregions, and global processes that have large amountsof small-scale variability, such as weather.40 However,satellite-based measurements also have a number oflimitations that only complementary remote sensingprograms can address.
Orbiting above the atmosphere, a satellite-basedremote sensing system gathers information about theEarth by measuring emitted or reflected electromag-netic radiation. These signals are then manipulated intoforms that can be used as input data for analysis andinterpretation. However, the process that converts
3 6 sm~or~ ~pable of dete~fig ~i~s hat vary widely in intemi~ (large dynamic range) and c h a r a c t e r i z i n g SlgrldS f r e e l y (S-
quantization) are required to analyze scenes of widely varying reflectance and to characterize processes that may have only small differencesin reflection.
37 NASA ~ s~fi~ s~l~ cycle mW~c~ c~lers for EOS for approv~ or potential ins~en~ such as AIRS, SWIRLS, TES,
HIRDLS, and SAFIRE. Only the Oxford Stirling cooler is space qualified (a Lockheed mechanical cooler maybe space qualMed in the nearfuhue----it is scheduled for flight in November 1994). Incorporation of mechanical coolers for EOS instruments wilt be possible only if currentexpectations for satisfactory cooling power, endurance, and vibration isolation are met.
3S H~S Wm fiti~ly prows~ when geolo@c~ qpfications had a higher priori~. ~S hv~tigatom have been asked to show that
spacebased imaging spectrometry can, in fac~ monitor portions of the carbon cycle. Source: Berrien Moore III and Jeff Dozier, ‘‘Adaptingthe Earth Observing System to the Projected $8 Billion Budget: Rmommendations from the EOS Investigators, ” Oct. 14, 1992, unpublisheddocument available from authors or from NASA Office of Space Science and Applications.
39 some shofl-d~ation ~-sl~ sampling of tie atmosphme CaII alSO be accomplished USing rockets.
40 sate~te.bas~ mWWmen~ are not ne~ssary to measure variables whose dis~bution is approximately UIlifOITll, for example, dle
atmospheric concentration of C02, which can ~ monitored at a few sites on tie gro~d.

Appendix B—The Future of Earth Remote Sensing Technologies I 125
measurements into geophysical variables is oftencomplex and data from nonsatellite measurements arenecessary to reduce ambiguities in the analysis. Scien-tists also need to compare satellite data with surface-based or airborne measurements to verify that thesatellite data are free of unforeseen instrument artifactsor unforeseen changes in instrument calibration. Thesecomparisons are particularly important for long-termmeasurements and for measurements that seek tomeasure subtle changes. Satellite data must also becorrected to account for the attenuation and scatteringof electromagnetic radiation as it passes through theEarth’s atmosphere. In addition, corrections are neces-sary to account for the variations in signal that occuras a result of changes in satellite viewing angle.41
Another !imitation of sensors on satellites is theircapability to make measurements in the lower atmos-phere. They may also be unable to make the detailedmeasurements required for certain process studies. Forexample, an understanding of the kinetics and photo-chemistry that govern the formation of the Antarcticozone hole (and the role of the Antarctic vortex) hasonly been possible with in-situ balloon and high-altitude aircraft experiments.42 Ground and in-situmeasurements also help ensure that unexpected phe-nomena are not inadvertently lost as a result ofinstrument or analysis errors .43 Satellite-borne sensorsare also unable to measure climatological variables tothe precision necessary for certain numerical weatherand climate models, and their ability to determinetemperature, moisture, and winds is inadequate formeteorologists interested in predicting, rather than justdetecting, the formation of severe storms/hurricanes.
UNPILOTED AIR VEHICLESResearchers interested in elucidating mechanisms
for ozone depletion are particularly interested inobtaining a stable, controllable, long-endurance plat-form that could be instrumented to monitor conditionsin the upper atmosphere at altitudes up to and above 25km (approximately 82,000 feet). Scientific explora-tions of this region are currently hampered by theuncontrollability of balloons, the inadequate altitudecapabilities and high operating costs of piloted aircraft,and the inadequate spatial and temporal resolution ofsatellite-borne instruments.
Several recent studies have concluded that unpilotedair vehicles (UAVS) are capable of carrying instru-ments that would provide unique and complementarydata to the NASA’s EOS program and to the DOE’sgroundbased Atmospheric Radiation Measurementprogram. 44 For example, high-altitude UAVS would
allow detailed studies of the mechanisms involved inthe formation, maintenance, and breakup of theAntarctic ozone hole. In turn, this information couldprovide researchers with the tools to predictf the onsetof a similar hole in the Arctic. Positioning a UAVabove a heavily instrumented site on the ground wouldalso allow researchers to obtain accurate verticalprofiles of radiation, water droplets, water vapor, iceparticles, aerosols, and cloud structure-informationthat complements surface measurements and that isessential to test larger-scale models of atmosphericphenomena (UAVS would characterize processes oc-curring on a scale of General Circulation Model gridbox, which is several tens of thousands of squarekilometers) .45
41 see Jeff Dozier and Alan H. Strahler, “Ground Investigations in Support of Remote Sensing, ” Manual of Remote Sensing: Theory,Instruments, and Techniques (Falls Churcb VA: American Society of Phtograrnm etry and Remote Sensing, 1983).
42 J.G. Anderson, D.W. Toohey, W.H. Brune, “Free Radicals Within the Antarctic Vortex: The Role of CFCS in Antarctic Ozone Loss,’Science, vol. 251, Jan. 4, 1991, pp. 39-46.
43 me diXovW of the $ *ozone hole’ ‘ above ~tarcticapmvides ~ ins~ctive example of tie impo~ce of Wound-bmti observations (bOX
A-3).
~ See Peter Banks et al., “Small Satellites and RPAs in Global-Change Researc~” JASON Study JSR-91-330 (McLea~ VA: JASONProgram Office, The MITRE Corp., July 13, 1992); U.S. Department of Energy, OffIce of Health and Environmental Researe& AtmosphericRadiation Me~surement Unmanned Aerospace Vehicle and Satellite Program Plan, March 1992 Draft (Washingto~ DC: Department ofEnergy, March 1992); and James G. Anderson and John S. Langford, eds., Unmanned Aircraft: An Essential Component in Global ChangeResearch, version 1.0, June 1991, (available from authors). A popular article that discusses the potential role of UAVs in atmospheric researchappears in Steven Ashtey, ‘‘Ozone Drone, “ Popular Science, vol. 241, No, 1, July 1992, pp. 60-64.
45 Water Vawr and clouds tie tie dominant regulators of radiative heating on the planeL and Uncertainty about tie effmt of clouds on cltite
is a source of fundamental uncertainty in climate prediction. Scientists have proposed UAVS for making some of these measurements.
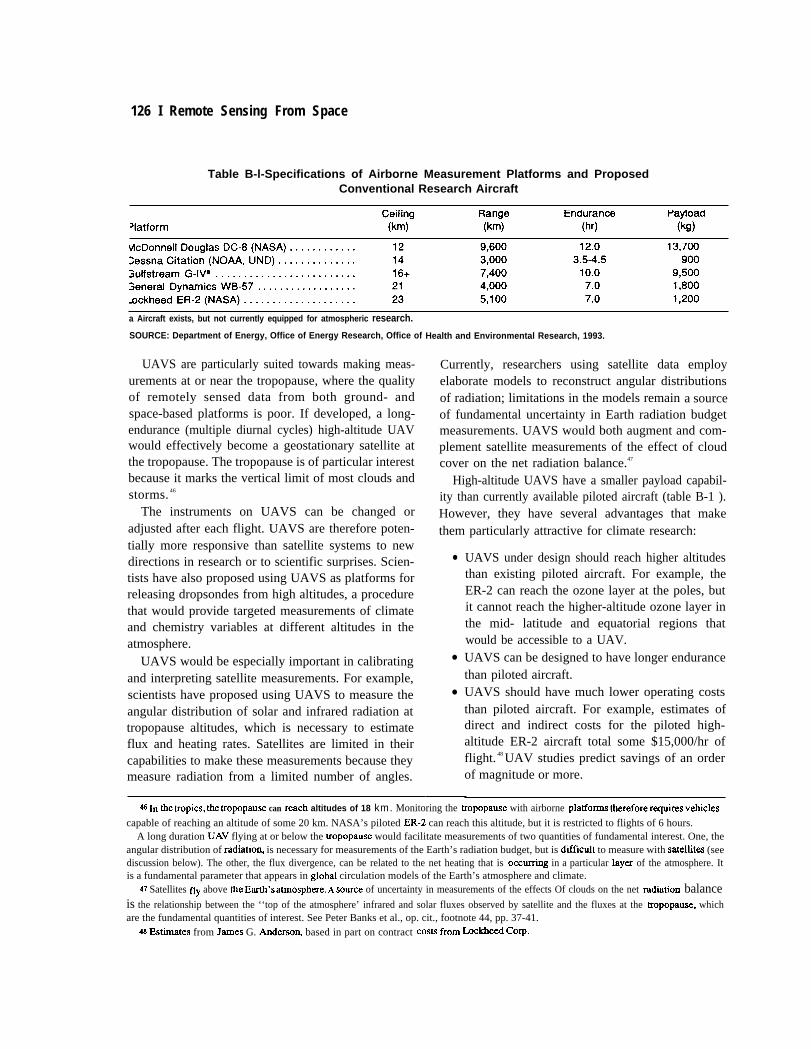
126 I Remote Sensing From Space
Table B-l-Specifications of Airborne Measurement Platforms and ProposedConventional Research Aircraft
a Aircraft exists, but not currently equipped for atmospheric research.
SOURCE: Department of Energy, Office of Energy Research, Office of
UAVS are particularly suited towards making meas-urements at or near the tropopause, where the qualityof remotely sensed data from both ground- andspace-based platforms is poor. If developed, a long-endurance (multiple diurnal cycles) high-altitude UAVwould effectively become a geostationary satellite atthe tropopause. The tropopause is of particular interestbecause it marks the vertical limit of most clouds andstorms. 46
The instruments on UAVS can be changed oradjusted after each flight. UAVS are therefore poten-tially more responsive than satellite systems to newdirections in research or to scientific surprises. Scien-tists have also proposed using UAVS as platforms forreleasing dropsondes from high altitudes, a procedurethat would provide targeted measurements of climateand chemistry variables at different altitudes in theatmosphere.
UAVS would be especially important in calibratingand interpreting satellite measurements. For example,scientists have proposed using UAVS to measure theangular distribution of solar and infrared radiation attropopause altitudes, which is necessary to estimateflux and heating rates. Satellites are limited in theircapabilities to make these measurements because theymeasure radiation from a limited number of angles.
Health and Environmental Research, 1993.
Currently, researchers using satellite data employelaborate models to reconstruct angular distributionsof radiation; limitations in the models remain a sourceof fundamental uncertainty in Earth radiation budgetmeasurements. UAVS would both augment and com-plement satellite measurements of the effect of cloudcover on the net radiation balance.47
High-altitude UAVS have a smaller payload capabil-ity than currently available piloted aircraft (table B-1 ).However, they have several advantages that makethem particularly attractive for climate research:
●
●
●
UAVS under design should reach higher altitudesthan existing piloted aircraft. For example, theER-2 can reach the ozone layer at the poles, butit cannot reach the higher-altitude ozone layer inthe mid- latitude and equatorial regions thatwould be accessible to a UAV.UAVS can be designed to have longer endurancethan piloted aircraft.UAVS should have much lower operating coststhan piloted aircraft. For example, estimates ofdirect and indirect costs for the piloted high-altitude ER-2 aircraft total some $15,000/hr offlight. 48 UAV studies predict savings of an orderof magnitude or more.
~ k me ~opics, &e tropopause can reach altitudes of 18 km. Monitoring the tropopause with airborne platfOrmS therefOre re@res vticles
capable of reaching an altitude of some 20 km. NASA’s piloted ER-2 can reach this altitude, but it is restricted to flights of 6 hours.A long duration UAV flying at or below the tropopause would facilitate measurements of two quantities of fundamental interest. One, the
angular distribution of radiatio~ is necessary for measurements of the Earth’s radiation budget, but is dtilcult to measure with satellit= (seediscussion below). The other, the flux divergence, can be related to the net heating that is ooauring in a particular laycx of the atmosphere. Itis a fundamental parameter that appears in globat circulation models of the Earth’s atmosphere and climate.
47 Satellites fly above tie Eti’s atmosph~e. A source of uncertainty in measurements of the effects Of clouds on the net rWhtiOII balanceis the relationship between the ‘‘top of the atmosphere’ infrared and solar fluxes observed by satellite and the fluxes at the tropopause, whichare the fundamental quantities of interest. See Peter Banks et al., op. cit., footnote 44, pp. 37-41.
a Estiates from James G. Anderso~ based in part on contract Costs frOm mkh~ COrP.
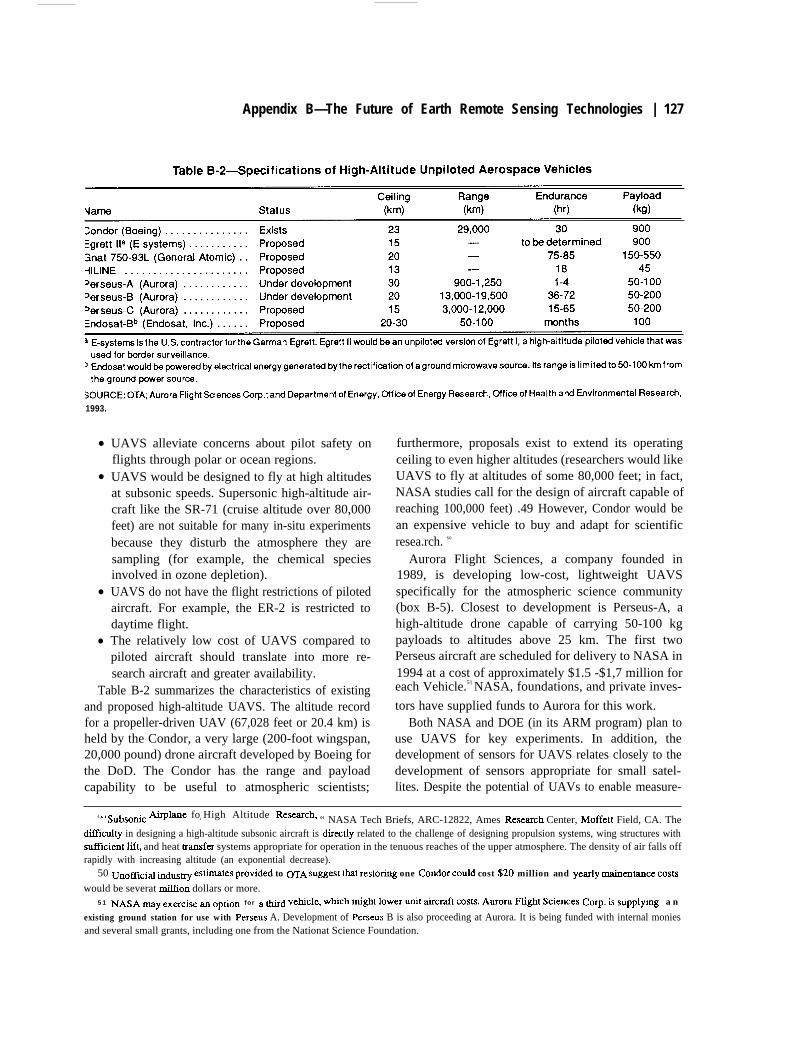
Appendix B—The Future of Earth Remote Sensing Technologies | 127
1993.
●
●
●
●
UAVS alleviate concerns about pilot safety onflights through polar or ocean regions.UAVS would be designed to fly at high altitudesat subsonic speeds. Supersonic high-altitude air-craft like the SR-71 (cruise altitude over 80,000feet) are not suitable for many in-situ experimentsbecause they disturb the atmosphere they aresampling (for example, the chemical speciesinvolved in ozone depletion).UAVS do not have the flight restrictions of pilotedaircraft. For example, the ER-2 is restricted todaytime flight.The relatively low cost of UAVS compared topiloted aircraft should translate into more re-search aircraft and greater availability.
Table B-2 summarizes the characteristics of existingand proposed high-altitude UAVS. The altitude recordfor a propeller-driven UAV (67,028 feet or 20.4 km) isheld by the Condor, a very large (200-foot wingspan,20,000 pound) drone aircraft developed by Boeing forthe DoD. The Condor has the range and payloadcapability to be useful to atmospheric scientists;
furthermore, proposals exist to extend its operatingceiling to even higher altitudes (researchers would likeUAVS to fly at altitudes of some 80,000 feet; in fact,NASA studies call for the design of aircraft capable ofreaching 100,000 feet) .49 However, Condor would bean expensive vehicle to buy and adapt for scientificresea.rch. so
Aurora Flight Sciences, a company founded in1989, is developing low-cost, lightweight UAVSspecifically for the atmospheric science community(box B-5). Closest to development is Perseus-A, ahigh-altitude drone capable of carrying 50-100 kgpayloads to altitudes above 25 km. The first twoPerseus aircraft are scheduled for delivery to NASA in1994 at a cost of approximately $1.5 -$1,7 million foreach Vehicle.51 NASA, foundations, and private inves-
tors have supplied funds to Aurora for this work.Both NASA and DOE (in its ARM program) plan to
use UAVS for key experiments. In addition, thedevelopment of sensors for UAVS relates closely to thedevelopment of sensors appropriate for small satel-lites. Despite the potential of UAVs to enable measure-
4 9 ,,sub~o~c ~~e for High Altitude Re~cht “ NASA Tech Briefs, ARC-12822, Ames Researeh Center, Moffett Field, CA. Thediffkulty in designing a high-altitude subsonic aircraft is direetly related to the challenge of designing propulsion systems, wing structures withsuftlcient ML and heat rransfer systems appropriate for operation in the tenuous reaches of the upper atmosphere. The density of air falls offrapidly with increasing altitude (an exponential decrease).
50 unofflcl~ indu~~ e~~tes provid~ to OTA sugg~t tit resto@ one Condor could cost $20 million and y~ly main~t2D(% COStS
would be severat rnitlion dollars or more.5 1 NASA my exacix ~ option for a ~d vehicle, which ~@t lower tit ~c~t WSE. A~Ora Flight sciences COrp. is SUpply@ a n
existing ground station for use with Perseus A. Development of Perseus B is also proceeding at Aurora. It is being funded with internal moniesand several small grants, including one from the Nationat Science Foundation.

128 I Remote Sensing From Space
Box B-5 The Perseus UnpilotedAerospace Vehicle
Perseus A is designed to carry payloads of about 50kg to altitudes of 30 km in support of stratosphericresearch. Perseus A will carry liquid oxygen to supportcombustion because air densities at 30 km are onlysome 2 percent those of sea level.
Perseus B would trade altitude for payload massand flight duration. It would also replace the closed-cycle engine design of Perseus A with a two-stageturbocharged engine. This more complicated engineavoids the payload penalty incurred by carryingon-board oxidant and is the key to long endurance.
Perseus C would be designed for mid-latitudemeteorological research and be capable of carrying100 kg payloads to altitudes of 12-15 km.SOURCE: Perseus Payload User’s Guide, Aurora Flight SciencesCorp., 1992.
ments crucial to the global change research program,congressional support for civilian UAV development,and associated instrumentation, has been meager andmay be inadequate to provide a robust UAV capabil-ity.52 If it wishes to encourage innovation in global
change research, Congress may wish to increasefunding for the development of UAVS specificallydesigned for USGCRP missions. Because UAVScould be highly cost effective, moderate fundingincreases of only a few million dollars per year couldultimately lead to a major increase in UAV availabilityfor research.
THE ROLE OF SMALL SATELLITES IN EARTHOBSERVING PROGRAMS
“Small” satellites have been defined as costing$100 million or less including spacecraft, instruments,launch, and operations. As noted in ch. 5, NASA, DOEand ARPA are examining small satellite systems forthree roles in the U.S. Global Change ResearchPrograrn:53 1) to address gaps in long-term monitoringneeds prior to the launch of EOS missions, 2) toprovide essential information to support process stud-ies prior to, and complementary with, the restructuredEOS, and 3) to allow for innovative experiments todemonstrate techniques that greatly improve the abil-ity to monitor key variables or improve/speed up theprocess studies.54
Small satellites have three advantages as comple-ments to larger systems, First, they are characterizedby relatively low cost compared to larger satellites.55
This facilitates ‘risk taking’ and encourages technicalinnovation. Small satellite proponents see this advan-tage as the key to enabling rapid, affordable augmenta-tion and modernization of larger satellites. Second,small satellite missions can be developed in only a fewyears or less. Typically, development of a smallsatellite avoids the potential problems associated withmanaging the integration of multiple instruments on asingle platform. Shortening the time to launch wouldadd resilience to the satellite portion of the globalchange research program, large parts of which arefrozen in development some 10 years before flight.Third, flying only a small number of instruments persatellite allows orbits to be optimized for a particularset of measurements.56
52 For exmple, although the FY 93 USGCRP report to Congress gave strong support for a $10 million dollar new start by tie DOE to developa UAV program, tight budgets prevented its irnplemeatation. For further information, see Our Changing Planet: The FY 1993 U.S. GlobalChange Research Program (Washington DC: National Science FoundatioxL 1992), p. 71.
53 SW Committ& on Earth and Environmental Sciences (CEES) of the Federal Coordinating Council for Science, Engineering, andTechnology, Report of the Small Climate Satellites Workshop (Washingto& DC: Office of Science and Technology Policy, May 1992).
w Report of the Smll C/imte Sate//ltes Workshop, pp. 20-21. In addition to these missions, researchers at tie Godtid ~ti~te for SPace
Studies have proposed using small satellites for long-term (decadal-scale) monitoring in a program that would complement EOS.55 ~ey ~so wei@ 1ess ~d do not require as expensive a launcher. However, launch costs are Smd compared to other EOS cosB.
Mutti-instrument EOS AM and PM satellites, Landsat 6, Landsat 7, and proposed EOS facility instruments-LAWS, Sm and HIRIS----requirea launcher in the Atlas 2AS-class. Launch costs with an Atlas 2AS may be some $130 rnilliorL but this is 20 percent or less of total systemcosts (which also includes ground segment costs).
M However, some missions r~uire nearly simultaneous measurements by instruments that cannot be packaged on a skgle Wteuite. ~ Wscase, a larger platform carrying severat instruments may be desirable. Another option would be to attempt to fly small satellites in closeformation.
ST For a more detailed dis~ssion of this subject see V. Ramanathan, Bruce R. Barkstrom, and EdwiI_I Harrisor4 ‘ ‘Climate arid tie ~’sRadiation Budget, ” Physics Today, vol. 42, No. 5, May 1989, pp. 22-32.

—
Appendix B—The Future of Earth Remote Sensing Technologies I 129
A SMALL SATELLITE “GA P-FILLER’ ’-CLOUDSAND THE EARTH’S RADIATION BUDGET57
The effects of human activities on the planetaryenergy balance are a principal focus of climate changeresearch. The Earth’s energy balance or ‘‘radiationbudget’ consists of incident sunlight, reflected sun-light (e.g., from the tops of clouds), and radiationemitted back to space, primarily from the Earth’ssurface and atmosphere. The emitted radiation fallspredominantly in the infrared and far-infrared portionof the electromagnetic spectrum, The radiation budgetis directly related to climate because the balancebetween the absorbed solar energy and the emittedenergy determines the long-term average global tem-perature. In addition, the temporal and spatial varia-tions of the radiation balance are linked to the globalcirculation patterns of the atmosphere and the oceans. sg
Lack of knowledge concerning how changes incloud type and cover59affect the radiation budget is a
principal source of uncertainty in 1) predicting climatechanges associated with anthropogenic increases ingreenhouse gases; and 2) understanding past andfuture climate changes caused by variations in solaroutput or in the orbital characteristics of the Earth60.
Scientists have monitored the Earth’s radiationbudget with spaceborne instrumentation since theearly 1960s.
61 The most precise measurements of theradiation balance and the effects of clouds (box B-6)were made with sensors that were part of the EarthRadiation Budget Experiment (ERBE) (box B-7).Iong-term measurements of the radiation budget
and related data are necessary to distinguish
between anthropogenic and naturally occurring
variations in Earth’s climate. Continuing measure-
ments of Earth’s radiation budget, and the effect of
clouds and aerosols, are necessary to establish abaseline that might guide future policy decisions.
58 Many coup]cd ocean.atmosphere-land interactions influence the radiation budget. For example, the intensity of radiation emitted from tieland surface varies w]th surface temperature. However, surface temperature depends on such factors as the amount of incoming solar ra(iiation,which is affected by atmospheric absorption and scattering (which can be altered by human induced greenhouse gas changes or by natural eventssuch as volcanic eruptions), and the effects of clouds. Surface temperature is also affected by surface moisture (because the surface cools byevaporation), which in turn is affected by surface composition and the presence of surface vegetation. Cloud formation and distribution dependon a host of coupled ocean-atmosphere-land processes.
59 ~e$e Chnges ~clude he d]s~bution and fractional cover over land and ocean, and changes in cloud ~ti~de, latitude! and ‘efl~tivitY.
~c optical reflectivity of’clouds is itself a sensitive function of the detailed internal structure of the cloud, for example, the size and distributionof water droplets and Ice crystals.
~ Solm output has been Masured since 1978 and has fluc~ated by approximately (J. 1 percent. AS noted earlier, the Ed absorbs
approximately 240 watts\mz of solar energy. Based on correlation of measured irradiance changes with visible features on the Sun+ scientistssuspect that solar irradlance may \ ary by several tenths of a watt per century. Changes of Earth’s orbit (e.g., its eccentricity or the inclinationof its spin axis) occur on time scales ranging from approximately 20,000 to 100,000 years. Source: Johan Benson, ‘ ‘Face to Face, Interviewwith James Hamew Aerospace America, April 1993, p, 6.
61 Andrew ~Meton, sa~elll~e Remote sensing In cli~f(~l(jgy (@Oca RatOn, FL: CRC Ress), pp. 206-209,

130 I Remote Sensing From Space
NASA plans to continue radiation budget measure-ments as part of EOS by flying radiation budgetsensors on the U.S./Japan
62 sa t e l l i t e and on the
AM-1 platform (the CERES instrument, a follow-on toERBS). TRMM and AM-1 are scheduled for launch in1997 and 1998, respectively. NASA plans relatedflights of SAGE,63 the stratospheric aerosol and gasexperiment, as part of EOS. NASA officials acknowl-edge the desirability of flying CERES and SAGEmissions before EOS flights in the late 1990s, both toassure data continuity and to have instruments in placebefore the next occurrence of El Nino-type events in1995-1997 (see box B-8).& Researchers would alsolike to have instruments in place to monitor climate-changing surprises such as the eruption of Mt.Pinatubo. However, NASA has not identified sourcesof funding for these missions.
Researchers attending OTA’S workshop on thefuture of remote sensing technology stressed that, to be
useful, radiation budget sensor systems must have veryhigh-quality calibration, long-term stability, and fullydeveloped data processing systems. Similar concernsgovern the ACRIM mission (see box B-9). Measure-ments taken on successive satellites must also overlapfor a sufficient time period to allow the two systems tobe intercalibrated.
Sensor requirements of fine calibration and long-term stability can be understood intuitively by observ-ing that the radiation balance is the difference betweenlarge energy inputs and outputs. Therefore, relativelysmall measurement or calibration errors in incoming oroutgoing radiation will lead to errors in the energybalance that would mask evidence of an actual change.Similarly, changes in the way raw data are convertedto radiation intensities could mask small changes in theradiation balance.65
A small satellite that would include the CERESinstrument is among a number of small satellites being
62 TRMM, the tropicaJ rainfall measuring mission, will combine a NASA-supplied spacecraft with a Japanese launch vehicle. ‘Ihe payloadfor TRMM will be supplied jointly.
63 SAGE I flew ~m Fe- 1979 to Nove~r 1981. SAGE ~ ~ b- flying on & ERBS ~tefite SiIICC octo&r 1984, a period we~beyond the instrument design life. Flights of SAGE III before the year 2000 were recommended by the Payload Advisory Panel of the EOSInvestigators’ Working Group in October 1992 because ‘SAGE has demonstrated that it can monitor consistently and overlong term severalparameters that are crucial to global change: a. vertical profiles of ozone, b. stratospheric and tropospheric aerosol loading, and c. water vaporin the upper troposphere and lower stratosphere. The SAGE ozone measurements are now a key component of the present monitoring of thechanging stratospheric ozone; the aerosol measurements are crucial for assessing the variability of solar forcing to the climate systemconsequent to the sporadic and highly variable volcanic aerosols. ” See Bernen Moore III and Jeff Dozier, “Adapting the Earth ObservingSystem to the Projected $8 Billion Budget: Recommendations from the EOS Investigators,” Oct. 14, 1992, unpublished document availablefrom authors or from NASA Office of Space Science and Applications, pp. 23-25.
1$1 ~her fli~ts of SAGE III on a ‘ ‘mission of opportunity” is advocated by EOS’ Payload Panel Advisory Group. One ~ch flight would
be on a planned NOAA weather satellite that could accommodate SAGE without necessitating expensive modiilcation of the bus or causingsigni.tlcant changes in the planned instrument package. NOAA’s ‘AM” TIROS series is a suitable candidate (it has a space where the SBWsensor is placed for “PM’ flights); a 1997 launch might be possible if funding is identifkd. However, even if this gap-falling mission werelaunched, sampling of diurnal variations would still be lacking because NOAA weather satellites fly in polar, sun-synchronous orbits. To ftithe potential gap in SAGE data and to supply data from inclined orbits, scientists have proposed flight of SAGE II on a planned 1995 Russianlaunch. As of June 1993, NASA officials had not identi.fkd funding for either of these options.
65 Denv~g ~diation budget &~ from ~te~ite.~~ instrument measurements is till extremely COII@eX Prowss tit ~ires sophistic~~
models and computer programs. The steps involved in processing radiation data include:
. Convert instrument counts to radiant energy at detector.
. Unfiiter that signal to the froni end of the instrument (i.e., put back what was lost in the instrument’s optical path). This correction is scenedependent.
. Convert to radiance at the top of the atmosphere.
. Convert radiance to flux using angulardirectional models.Robert Cess, “Science Context of Small Globat Change Satellites or Perspectives From One Who Would Like To Have Satellite
Radiometric Data Before He Retires or Expires, ‘‘ in Paul V. Dreseler and Jack D. Fellows, cc-chairrnq Collected Viewgraphs: A Supplementto the Reporr of the Smull Satellites Workshop, (Washington D.C.: Committee on Earth and Environmental Sciences, June 1992).

Appendix B—The Future of Earth Remote Sensing Technologies I 131
Box B-7–Earth Radiation Budget Experiment (ERBE)
ERBE (Earth Radiation Budget Experiment) is a NASA research instrument that consists of two parts. Thefirst is a relatively wide fixed field-of-view instrument with four Earth-viewing radiometers and a Sun-viewingradiometer equipped with shutters. The Earth-viewing radiometers monitor outgoing Earth radiation in two bands:0.2 to 5 microns (short-wave infrared) and 0,2 to 50 microns (broadband total). The second part of ERBE is anarrow field-of-view (instantaneous field of view of approximately 3°) three-channel (0.2 to 50,0.2 to 5.0, and 5.0to 50 micron) instrument that can be scanned. ERBE data allow an analysis of monthly and seasonal variationsof the radiation balance at regional scales. They also allow an analysis of the effect of clouds on the radiationbudget. As noted in the text, analysis of ERBE data to date has shown that the net effect of clouds is a small coolingof the Earth. scientists are still unsure how the planetary energy balance will be affected by clouds in futureatmospheres that are likely to contain higher concentrations of greenhouse gases such as C02.
To monitor the Earth’s radiation budget properly, daily global data from two polar orbits (A.M. and P. M.) anda mid-latitude inclined orbit of 50-60 degrees are required. ERBE sensors flew on the Earth Radiation BudgetSatellite (ERBS), which was launched by the Space Shuttle into a Iow-inclination, non-sun-synchronous orbit andthe NOAA 9 and NOAA 10 operational weather satellites, which are in sun-synchronous polar orbits. These werelaunched in December 1984 and July 1986, respectively. Five years of data were collected before the last ERBEscanner failed in 1990.1
1 Non-scanner measurements are continuing on the NOAA-9 and NOAA-10 and data are continuing to be archived.However, the ability to characterize the scene covered by ERBS, which is crucial in radiation budget measurements, islimited because the non-scanners have a relatively wide field-of-view. As a result, the data have limited utility comparedto the data that was being provided by the ERBS narrow field-of-view scanner.SOURCE: National Aeronautics and Space Administration and Office of Technology Assessment, 1993,
considered for joint missions among NASA, DOE,66 discussed in ch. 5. The several decade record ofand DoD (through ARPA). (However, as noted earlier,budget constraints and other difficulties have delayedimplementation of these proposals.) NASA officialsinterviewed by OTA supported efforts by DOE andDoD for collaboration because interagency coopera-tion may be the key to ensuring the long-term supportthat is necessary for multidecadal missions such asERBS. In addition, harnessing the expertise resident inDOE laboratories could accelerate the development oftechnologies that promise to reduce mission costs.
CLIMSAT: A SMALL SATELLITE COMPLEMENTTO EOS
The rationale for launching a series of smallenvironmental monitoring satellite*Climsat-was
high-quality data on CO2 abundance in the atmosphereis a prototype for the kind of measurements thatClimsat would perform (figure B-3). CO2 change is akey climate forcing variable. In addition, the historicalC O2 record provides an important constraint onanalyses of the carbon cycle and directs researchers tothe kind of detailed measurements needed to under-stand the observed CO2 change.67 In the same way,Climsat’s long-term monitoring of other global forc-ings and feedbacks would help bound the thermalenergy cycle and direct researchers toward detailedmeasurements of climate processes (some of thesemeasurements would be made in the EOS program).
~ ResWch grOUpS in the DOE have proposed to build and launch, by 1995, one or more small spacecraft equipped wi~ mdiation budgetinstruments similar to those now flying on ERBS, or with what they believe would be an improved sensor. The improved sensor, which wouldbe designed by DOE, promises better capability in analyzing the spectral content of the received signals. DOE researchers believe their sensorwould therefore allow a better understanding of climate forcing from for example, COZ and water vapor. However, the importance of stibifityin instrument calibration and data analysis argue for a cautious approach when comidering major departures from previous ERBE sensors.
67 J~es men, NASA Goddard Institute for Space Studies, peNOIEd communication, 1993.

132 I Remote Sensing From Space
Box B-8-The Linkage Among Earth’s Systems: El Nino and the Southern Oscillation
Coastal Peru is arid enough so that sun-baked mud is often used to build houses. In theneighboring ocean, intense upwelling pumps nutrients tot he surface to create one of t he world’s richestfisheries. In late 1982 the nutrient pump shutdown, eliminating the local fishery. And the rains began:some normally arid zones received as muchas3m[118 inches] of rain within a 6 month period. Mudhouses dissolved, and much of the transportation infrastructure washed away. Almost 1,000 years ago,a similar climatic disaster destroyed a prosperous agricultural civilization rivaling the Incas.
Peru was not alone: the impact of the strange climatic events of 1982-83 was global. In Indonesia,vast areas of rainforest were destroyed in fires spawned by a devastating drought. Australiaexperienced the worst drought in its recorded history: firestorms incinerated whole towns, livestockherds had to be destroyed, and production of cotton, wheat, and rice was sharply reduced. In Brazil,an exceptionally poor rainy season distressed the impoverished Nordeste region, while southern Braziland northern Argentina were hit with destructive flooding. Throughout southern Asia, poor monsoonrains in 1982 reduced crop yields and slowed economic growth. China saw drought over the northernpart of the country and unusual winter floods in the south, leading to major losses in the winter wheatcrop. . . Severe winter storms rearranged the beaches of California; spring floods covered the streetsof Salt Lake City. . .
The above paragraphs describe events that occurred as a result of an irregularly recurring pattern known asENSO. The acronym combines its oceanographic manifestation in the eastern tropical Pacific, El Nino, with itsglobal atmospheric component, the Southern Oscillation. ENSO is an irregular cycle with extremes of variableamplitude recurring every 2 to 7 years. The 1982-83 events are an instance of its warm phase. Events of 1988,including catastrophic flooding of Bangladesh, demonstrate the impact of t he cold phase. Historically El Nino wasthe name given to the marked warming of coastal waters off Ecuador and Peru. It is now understood that duringthe ENSO warm phase the warming covers the equatorial Pacific from South America to the dateline, fullyone-quarter of the circumference of the Earth (plate 8).SOURCE: Mark A. Cane, Geophysics Report E/Ninoandthe Southern Osci//ation (ENSO), Larnont-Ooherty Earth Observatory, ColumbiaUniversity,
Although Climsat is designed for long-term meas- . Short-term tests of climate models/understandingurements, it would also address short-term issues.68
(e.g., effects of volcanic aerosols).These include:
Each Climsat satellite would carry three instruments. Assessment of climate forcing resulting from
(box B-10). Versions of two of these instruments,ozone change versus forcing that results from
SAGE ILIG9 (Stratospheric Gas and Aerosol Experi-changes in CFC concentrations.
. Assessment of climate forcing resulting from ment) and EOSP (Earth Observing Seaming Polarime-
anthropogenic tropospheric aerosol change ver- ter),firstsus CO2 change.
are part of the current plans for EOS. However,launches of these instruments may not occur until
~ ~ese issues ~emong hose discussed in the Supplementary Report to the Intergovernmental Panel on Climate Change @CC) ScientificAssessment (an update of the 1990 report). The IPCC supplementary report concludes that stratospheric ozone depletion may be offsetting muchof the greenhouse warming caused by CFCS. In additiow cooling by tropospheric aerosols from sulfur emissions may have offset a significantpart of the greenhouse warming in the northern hemisphere during the past several decades.
@ SAGE fJI is ~ improved version of SAGE II, now in orbit. It should increase the accuracy of aerosol, ozone, and water vapormeasurements. It should also permit extensions of these measurements deeper into the troposphere.
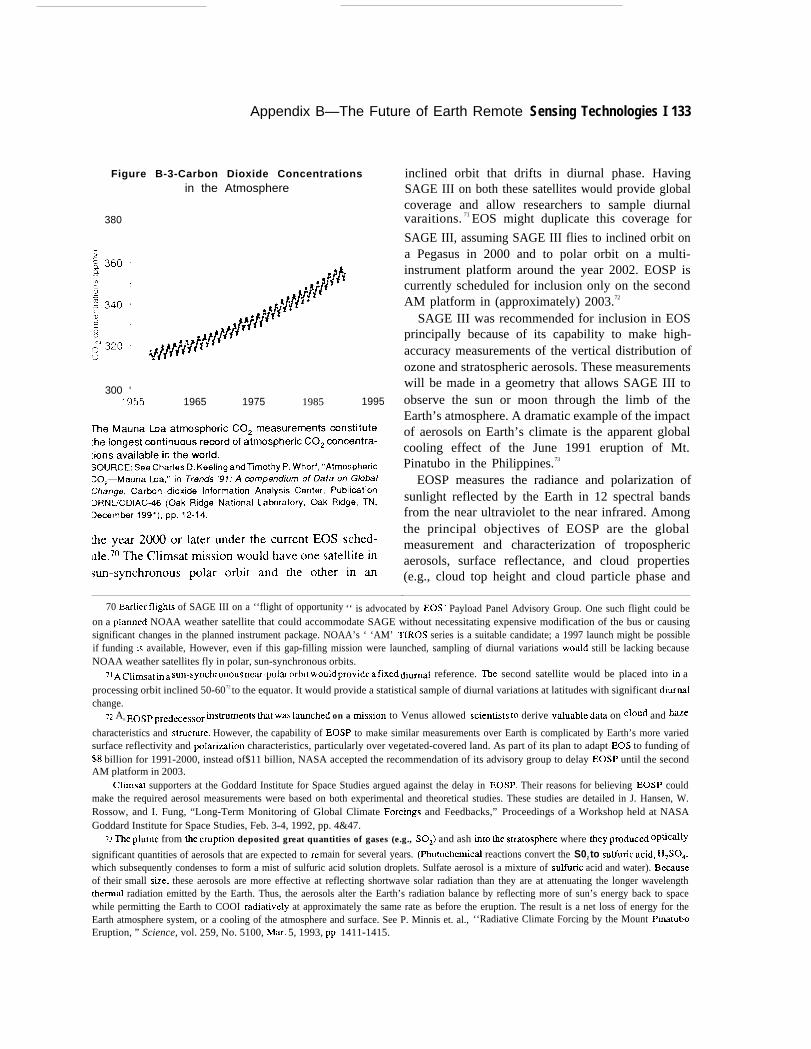
Appendix B—The Future of Earth Remote Sensing Technologies I 133
Figure B-3-Carbon Dioxide Concentrationsin the Atmosphere
380
300 ‘1955 1965 1975 1985 1995
inclined orbit that drifts in diurnal phase. HavingSAGE III on both these satellites would provide globalcoverage and allow researchers to sample diurnalvaraitions. 71 EOS might duplicate this coverage for
SAGE III, assuming SAGE III flies to inclined orbit ona Pegasus in 2000 and to polar orbit on a multi-instrument platform around the year 2002. EOSP iscurrently scheduled for inclusion only on the secondAM platform in (approximately) 2003.72
SAGE III was recommended for inclusion in EOSprincipally because of its capability to make high-accuracy measurements of the vertical distribution ofozone and stratospheric aerosols. These measurementswill be made in a geometry that allows SAGE III toobserve the sun or moon through the limb of theEarth’s atmosphere. A dramatic example of the impactof aerosols on Earth’s climate is the apparent globalcooling effect of the June 1991 eruption of Mt.Pinatubo in the Philippines.73
EOSP measures the radiance and polarization ofsunlight reflected by the Earth in 12 spectral bandsfrom the near ultraviolet to the near infrared. Amongthe principal objectives of EOSP are the globalmeasurement and characterization of troposphericaerosols, surface reflectance, and cloud properties(e.g., cloud top height and cloud particle phase and
70 &ller fllghts of SAGE III on a ‘‘flight of opportunity ‘‘ is advocated by EOS Payload Panel Advisory Group. One such flight could beon a plamed NOAA weather satellite that could accommodate SAGE without necessitating expensive modification of the bus or causingsignificant changes in the planned instrument package. NOAA’s ‘ ‘AM’ TIROS series is a suitable candidate; a 1997 launch might be possibleif funding 1s available, However, even if this gap-filling mission were launched, sampling of diurnal variations would still be lacking becauseNOAA weather satellites fly in polar, sun-synchronous orbits.
71 A Cllmat ~ a sun_sync~onous ncm_wlM orbit would provide a fixed did reference. The second satellite would be placed into in a
processing orbit inclined 50-6072 to the equator. It would provide a statistical sample of diurnal variations at latitudes with significant diurmlchange.
YZ An EOSp ~redwessor ~smments tit was Iauched on a fission to Venus allowed SClt?IItlStS tO derive v~uable dam on cloud and ‘e
characteristics and stmcture. However, the capability of EOSP to make similar measurements over Earth is complicated by Earth’s more variedsurface reflectivity and polarimtion characteristics, particularly over vegetated-covered land. As part of its plan to adapt EOS to funding of$8 billion for 1991-2000, instead of$11 billion, NASA accepted the recommendation of its advisory group to delay EOSP until the secondAM platform in 2003.
Climsat supporters at the Goddard Institute for Space Studies argued against the delay in EOSP. Their reasons for believing EOSP couldmake the required aerosol measurements were based on both experimental and theoretical studies. These studies are detailed in J. Hansen, W.Rossow, and I. Fung, “Long-Term Monitoring of Global Climate Forcings and Feedbacks,” Proceedings of a Workshop held at NASAGoddard Institute for Space Studies, Feb. 3-4, 1992, pp. 4&47.
73 The Plme from the emption deposited great quantities of gases (e.g., SOZ) and ash hto the smatosphere where they pmduc~ oPti~lY
significant quantities of aerosols that are expected to re main for several years. (Photochemical reactions convert the S02 to sufic acid, H2SOA,which subsequently condenses to form a mist of sulfuric acid solution droplets. Sulfate aerosol is a mixture of sulfiuic acid and water). Beeauseof their small sti.e, these aerosols are more effective at reflecting shortwave solar radiation than they are at attenuating the longer wavelengththermat radiation emitted by the Earth. Thus, the aerosols alter the Earth’s radiation balance by reflecting more of sun’s energy back to spacewhile permitting the Earth to COOI radiatively at approximately the same rate as before the eruption. The result is a net loss of energy for theEarth atmosphere system, or a cooling of the atmosphere and surface. See P. Minnis et. al., ‘‘Radiative Climate Forcing by the Mount PinatuboEruption, ” Science, vol. 259, No. 5100, Mar. 5, 1993, pp. 1411-1415.

134 I Remote Sensing From Space
Box B-9-Why Remote Sensing Places Particular Demands on InstrumentCalibration and Stability
Much of global change research consists of establishing long-term records that will allow anthropogenicchanges to be distinguished against a background of naturally occurring fluctuations. Therefore, measurementsmust be finely calibrated, instruments must have long-term stability, and data reduction and analysis algorithmsmust be well understood. Measurements of the Earth’s radiation budget illustrate these requirements. Anotherexample of the need for finely calibrated data in global change research is provided by the ACRIM (active cavityradiometer irradiance monitor) instrument to monitor long-term changes in the total solar output. This instrumentis currently not on the EOS flight manifest, but NASA officials have stated their desire to fly ACRIM on a “flight ofopportunity.”
The interaction of the Earth and its atmosphere with the total optical solar radiation from the sun determinesweather and climate. Even small variations in the total solar output would have profound effects on both weatherand climate if they persisted. Scientific evidence exists for past climate changes, including cyclic changes rangingin period from the approximate 11-year solar activity cycle to many millions of years. Variations in solar output aresuspected as the cause of some cycles, particularly short-term ones.
Acquiring an experimental database on solar variability is a necessary first step in testing hypotheses abouthow solar variability might affect climate. It is also necessary if researchers are to distinguish variations in solaroutput from other climate “forcings” such as changes in concentration and vertical distribution of infrared trapping“greenhouse” gases, aerosols, and clouds. Previous ACRIM measurements, beginning with the “Solar MaximumMission” in 1980, have shown that solar luminosity varies with solar activity during the n-year solar cycle.Researchers would Iike to extend the ACRIM record base begun in the 1980 as part of the Earth radiation budgetdatabase for the Global Change Research Program. They would especially Iike to avoid gaps between successiveACRIM missions to “connect” (calibrate) readings between successive instruments and facilitate detection ofsubtle changes.
In his proposal for launching a new ACRIM mission before the mid-1990s,l Richard C. Willson, of the JetPropulsion Laboratory, cites estimates that all the climate variations known to have occurred in the past, from majorice ages to global tropical conditions, could be produced by systematic solar variability of as little as 0.5 percentper century. Because the results of many solar irradiance experiments would be required to monitor the solarIuminosity for 100 years, the relative precision of successive experiments would have to be small compared to O.5percent.
Researchers have adopted an overlap strategy that would deploy successive ACRIM experiments so thatoverlapping observation periods of approximately 1 year can be used to provide relative calibration of the data ata precision level (0.00I% of the total irradiance) that is substantially smaller than their inherent uncertainty (0.1%).
Although continuous data on solar luminosity has not existed long enough to detect the presence of sustained solarluminosity changes that might have climate implications, the long-term precision required to detect such a trendwould considerably exceed 0.1 percent.
1 NASA ~ans to fly ACRIM on EOS flights starting around the year 2002, but a potential gap in measur~entsexists for the approximate period of 1994-2002. The only ACRIM sensor now in orbit is on UARS, a satellite whose usefulIifeis expsctedto end In 1994. UARS might exceed Its design life, but recent problems with its battery povversuppliesalsoserve as a reminder that satellites can suffer premature failure.SOURCES: Office of TAnology /keeeernent and Richard C. Willeon, “Science Objective of an Active Cavity Radiometer IrradianceMonitor (ACRIM) Experiment on a Dedicated Small Satellite System,” in Committee on Earth and Environmental Sciences (CEES) of theFederal Coordinating Coundl for Science, Engheedng, and Technology, I?epoft of the Sma//C/hnate Satellites )Wrkshop (Washington,DC: Office of Sdenoe and Technology Policy, May 1992).
Appendix B—The Future of Earth Remote Sensing Technologies I 135
Box B-10-Climsat Sensor Summary
SAGE Ill (Stratospheric Gas and Aerosol Experiment): an Earth-limb scanning grating spectrometer thatwould be sensitive from t he ultraviolet to the near infrared. Yields profiles of tropospherc aerosols,O3N02,H2OOCIO-most down to aloud tops. Instrument mass: 35 kg; Power (mean/peak): 10/45 watts; Estimated Cost: $34million for 3 EOS copies ($18M + $8M + $8 M).
EOSP (Earth Observing Scanning Polarimeter): global maps of radiance and polarization; 12 bands from nearUV to near IR. Yields information on aerosol optical depth (a measure of aerosol abundance), particle size andrefractive index, cloud optical depth and particle size, and surface reflectance and polarization. Instrument mass:19 kg; Power (mean/peak): 15/22 watts; Estimated Cost: $28 million for 3 EOS copies ($16M + $6M + $6M).
MINT (Michelson Interferometer): Infrared measurements between 6 and 40 microns. Yields cloudtemperature, optical depth, particle size and phase, temperature, water vapor, and ozone profiles and surfaceemissivity. Instrument mass: 20 kg; Power (mean/peak): 14/22 watts; Estimated Cost: $15-$20 million for first copy.SOURCE: J. Hansen, W. Rossow, and 1. Fung, “Long-Twin Monitoring of Global Climate Forcings and Feedbacks,” Proceedings of aWorkshop held at NASA Goddard Institute for Space Studies, Feb. 3-4,1992.
size). Characterization of clouds and aerosols is science missions, including EOS and the Mission tonecessary for both climate models and to interpretsignals received by satellite from the Earth’s surface(e.g., by AVHRR and Landsat). For example, aerosolsaffect the transmission of electromagnetic radiationthrough the atmosphere and the clouds, but they arecurrently among the most uncertain of global climateforcings. Cloud cover and aerosol content are highlyvariable; like SAGE III, the argument for launchingthese instruments as part of Climsat, rather than EOS,is the additional coverage and better sampling ofdiurnal variations.
MINT (Michelson Interferometer) is the onlyClimsat instrument that is currently not scheduled forinclusion in EOS. MINT would measure the infraredemission from the Earth at high spectral resolutionover a broad spectral range. Its principal measurementobjectives include cloud temperature, transrnissivity,particle size and phase (water or ice); temperature,water vapor, and ozone vertical profiles; and surfaceemissivity.
| Developing Advanced Systems forRemote Sensing
The final section of this appendix draws on com-ments by participants at an OTA workshop on thefuture of remote sensing technology and briefingsfrom scientists at NASA, DOE national laboratories,and industry.
NASA has identified a variety of high-prioritytechnologies needed to enable or enhance future space
Planet Earth (box B-1 1). NASA’s most urgent short-term technology requirements are for more sensitivelong-wave infrared detectors, reliable cryogenic cool-ing systems, and development of submillirneter andterahertz microwave technologies. Mid-term require-ments include new lasers, improved onboard datastorage systems, and development of larger antennastructures. Long-term requirements, which are consid-ered very important for the success of MTPE, includeimprovements in software and data analysis and inpower systems. Improvements in software and dataanalysis are critical to the success of EOS becausescientists need to convert the raw data to informa-tion. Accumulating data is not equivalent to solvingproblems.
Participants of OTA’S workshop on the future ofremote sensing technology generally agreed thatexisting and planned efforts in technology develop-ment at the component level were sufficient to developnext-generation sensors. However, several participantsexpressed concern about the lack of commitment andfunds to perform required engineering, integration, andprototyping of integrated, space-qualified sensors.This work is essential if the size, weight, and cost ofspace-based sensors is to decrease. Such efforts areparticularly important for the large EOS “facility”instruments that were deferred or canceled-LAWS,SAR, and HIRIS. (One participant characterized thekind of development work that is necessary to develop

136 I Remote Sensing From Space
Box B-11–Technology For Mission To Planet Earth
Direct Detectors
The particular need is for detectors capable of monitoring the interaction of the long-wave infrared thermalemission from the Earth with greenhouse gases-this requires detection of far-infrared photons in the 8 to 20micron range.
Cryogenic Systems
Cryogenic coolers are needed to increase the sensitivity of infrared radiation detectors, particularly at longwavelengths. Stored cryogens (e.g., liquid nitrogen) are not suitable for long-duration missions. Passive radiativecoolers, which area mature technology, cannot be employed when extremely low temperatures are required orwhen there are geometric limitations (a passive cooler requires a large surface that never absorbs energy fromthe sun).
Mechanical cryo-coolers are miniature refrigerators. NASA plans to use tens of mechanical coolers duringthe 15-year EOS program. Concerns about their use include: their long-term reliability in a space environment; howto damp vibrations (NASA currently favors employing two matched cryo-coolers in a configuration where thevibrations of one cancel the other’s); how to increase the efficiency of coolers (to provide sufficient cooling power);and how to reduce the cost of developing space-qualified units, which is currently measured in the million dollarrange.
Submillimeter and Terahertz Microwave Technologies
The millimeter, sub-millimater (frequencies above 300 GHz) and terahertz region of the microwave is ofinterest because this is the region where small, light molecules and free radicals of fundamental importance in t hechemistry of the upper atmosphere can be monitored via their strong rotational emissions. Monitoring in this regionalso complements other techniques. For example, measurements taken with millimeter/sub-millimeter techniquesare not affected by changes in aerosol or dust concentrations in the atmosphere (because the wavelengths arelarger than the dust or aerosol particle size). In contrast, optical or ultraviolet measurements are strongly affectedby aerosol and dust loading and therefore are sensitive to changes that resulted from the eruption of Mt. Pinatubo.Using techniques that are common to ground-based radio astronomy, researchers can analyze the strength andspectral width of molecular line shapes to determine the altitude and temperature distribution of molecules andradicals such as CIO, water vapor, nitrous oxide (N20), CO, and H02.’
Historically, sources and detectors for this region of the electromagnetic spectrum have been notoriouslydifficult to develop. At lower frequencies, up through the millimeter wave region, conventional klystrons andmultiplication techniques may be used. Optically pumped far-infrared lasers provide a source of energy at higherfrequencies, but only at a relatively few discrete laser frequencies.
Lasers
As noted earlier, development of a space-qualified high-power laser would allow the measurement of globalwind velocities. it would also be a powerful method to identify and measure concentrations and vertical profiles
1 Mol~ules are “excited” to higher energy states following collisions with other gas species. Emission of energyoocurs when the molecule “relaxes” back to its normal energy state. The strength of the emission is a function of molecularabundance. In addition, beoause of “pressure broadening,” the spectral w“dth of the emission contains information on thealtitude distribution of the emitting molecule (pressure broadening occurs for molecules of Interest at altitudes at pressurescorrespmding to altitudes below 70 km). See, for example, Alan Parrish, “Millimeter-wave Environmental Remote Sensingof Earth’s Atmosphere,” Microwave Journal, vol. 35, No. 12, Dec. 1992, pp. 24-34.

Appendix B—The Future of Earth Remote Sensing Technologies I 137
of trace gases in the troposphere and stratosphere. In addition, it would allow accurate global measurements ofaltitudes and land surface elevations from space. Current research centers on the demonstration of reliability ofCOZ gas lasers and development of alternative solid-state lasers. Solid-state lasers require a laser “pump” toexcite the upper energy level involved in laser action. Current research is focused on the development ofdiode-laser pumps because of their inherent reliability and energy efficiency.
LAWS is an example of a Iidar (light detection and ranging, i.e., laser-based radar). New lasers are neededfor Iidars and for DIAL (differential absorption Iidar). Important molecular atmospheric species such as oxygen,water, and trace species such as nitric oxide (NO) and the hydroxyl radical (OH) can be measured with greatsensitivity using DIAL. Atmospheric temperatures and pressure can also be determined from an analysis of themolecular absorption line width and strength. Laser measurements of molecular absorption bands for speciesrequire tunable sources with extremely high frequency stability. For global use, systems must also operate ateye-safe levels or in eye-safe spectral regions. As mentioned earlier, laser velocimetry can be performed usingeither coherent or novel incoherent techniques. All of these issues are being explored in very active programs atDOE and NASA laboratories.
Onboard Data Storage Systems
EOS spacecraft will acquire enormous quantities of data. Onboard storage is necessary to manage thesedata-either to store data until satellite downlinks to Earth ground stations are available later in t he orbit, or tofacilitate data manipulation/compression to Iower the required communication data rate to Earth. For example, theEOS AM-1 platform will acquire data at some 100 million bits/second (peak) and 16 million bits/second (average).Output of data at peak rates up to 150 million bits/second will occur when AM-1 is in contact with the TDRS satellitecommunications relay.
Near-term plans call for digital tape recorders to be used in EOS; however, the requirements of EOSspacecraft will push the limits of tape recorder technology. Current research is focused on developing alternativespace-qualified storage systems, which would be smaller, lighter, more reliable (tape recorders have many movingparts), and better matched to the data requirements. Concepts under development include solid-state memoriesand optical disk technology.
Large Antenna Structures
Large lightweight antennas would facilitate development of affordable SARS.
Improvements in Software and Data Analysis
If current plans continue, the fully deployed EOS system of polar orbiters and other spacecraft are expectedto acquire some 1-2 trillion bits of data each day. Storing these data and translating them into useful information
in a timely manner is critical to the success of EOS. The SEASAT spacecraft (which included a SAR) operatedfor only three months in 1978, but scientists took eight years to analyze the data. A sizable fraction of the total EOScost (currently at $8 billion for this decade) is earmarked to solving the myriad of problems associated with dataacquisition, analysis, and dissemination. OTA plans to publish a report on EOS data issues in late 1993.
Power Systems
Development of lighter weight and more energetic power systems would have a number of applications. Inparticular, when combined with lightweight, large antenna structures, the possibility exists for placing radarsystems in higher orbits. Ultimately, researchers would like to place systems in gee-stationary orbit. Largeantennas would be needed because the beam size on the Earth is inversely proportional to antenna size.SOURCE: OTA and Robert Rosen and Gordon 1. Johnston, “Advanced Technologies to Support Earth Orbiting Systems,” paperIAF-92-0751, presented at the 43rd Cong. of the International Astronomical Federation, Aug. 25-Sept. 5, 1992, Washington, DC.

138 I Remote Sensing From Space
Box B-12–ARPA Space Technology Initiatives in Remote Sensing
ARPA’s Advanced Systems Technology Office has proposed several advanced technology demonstration(ATDs) that might point to remedies for key problems in the development of future space systems: lack ofaffordability, long development times, and high technical risk. ARPA program managers note that “our currentpractice is to custom-build large satellites on roughly 10-year cycles. To avoid unacceptable program risk, onlyproven or space-qualified technologies are typically incorporated. These technologies become obsolete evenbefore the first satellite is launched ...”
Two ARPA ATDs have particular interest to the civilian remote sensing community: the Advanced TechnologyStandard Satellite Bus (ATSSB) and the Collaboration on Advanced Multispectral Earth Observation (CAMEO).ATSSB would be characterized by very high payload mass fraction and a simplified payload interface (“bolt-on”)
that would support a wide variety of missions while minimizing acquisition times and recurring costs. CAMEO isa proposal for a joint DoD/DOE/NASA collaboration to design, build, and launch a satellite using ATSSB that wouldcarry instruments of interest to both civil and military users.
CAMEO would demonstrate the utility of smaller satellites to rapidly insert technology and shortendevelopment time for larger satellites. It would carry three instruments:
. CERES, a NASA-developed instrument for aloud and Earth radiation budget measurements. CERES isan approved EOS instrument scheduled for launch in the late 1990s. Earlier versions of the CAMEOproposal considered a higher performance, but unproved, las Alamos-designed radiometer.
● MPIR, a DOE-developed, very wide-field of view (90 degrees; swath width at nadir for nominal orbit altitudeof 700 km is 1,000 km), pushbroom multispectral imaging radiometer. MPIR’s principal objective would be
to gather data for global change research, primarily aloud properties (e.g., cloud detection, identification,type, amount height, reflectance, optical thickness, and internal characteristics such as particle size andphase). Its 10 spectral bands would measure reflected sunlight and thermal emission from the Earth atvisible/near-infrared to long-wave infrared wavelengths from 0.55-12 microns. Because MPIR’s primarymission is measurement of cloud properties, high resolution is not necessary. The baseline proposal callsfor a ground resolution of 2 km at nadir. MPIR would cool its medium-wave and long-wave infrareddetectors to 60 K with an 600-milliwatt Stirling-cycle mechanical cooler. MPIR would be small (it would fitin a box 20 cm X 20 cm X 36 cm) and lightweight (25 kg). Its size and weight would also make it suitablefor a flight on a UAV.
lasers for LAWS and SAR as “somewhere between Workshop participants agreed unanimously that thisexploratory and advanced development.”)
Several researchers interviewed by OTA believedthe lack of attention to engineering development wassymptomatic of a larger problem: government interestand investment typically wane as a technology be-comes more mature. However, schedule slips and costoverruns that occur during the final stages of instrument/platform development might be avoided by making agreater investment earlier in the development cycle,even if it is for what maybe perceived as lower priorityengineering problems.
Currently, the time required between preliminarydesign and launch for a new, large, and complexsatellite system may stretch to nearly a decade.
period must be reduced for remote sensing systems.Similarly, workshop participants stressed the impor-tance of reducing space mission costs. Unfortunately,the space community has not reached consensus onhow best to achieve these goals. Box B-12 discussesARPA’s belief that space missions can be carried outwith lower costs and shortened acquisition times bydeveloping small satellites that would employ a smallcommon satellite bus featuring standardized payload-bus interfaces. In particular, ARPA has proposed ajoint collaboration among NASA, DOE, and ARPA tobuild and fly a gap-filling satellite to collect data forEarth radiation budget experiments. This satellitewould also demonstrate technology applicable to

Appendix B—The Future of Earth Remote Sensing Technologies I 139
. LMIS, a DARPA-sponsored narrow field-of-view, high-resolution multispectral imager. LMIS would usepushbroom image formation and have a mechanically cooled focal plane. Notable among itscharacteristics is its hyperspectral imaging (32 bands) in visible/near-infrared bands. Other spectral bandswould image the Earth in visible, short-, and medium-wave infrared. Resolutions would range from 2.5meters in the panchromatic band to 20 meters in the medium-wave infrared. LMIS’ swath width at nadirwould be 20 km.
CAMEO’s flight of CERES would avoid a likely gap in Earth radiation budget measurements while LMIS andATSSB would demonstrate technologies for advanced imaging satellites. In particular, ARPA hopes LMIS andATSSB would facilitate follow-ons in the Landsat series that would be lighter, smaller, less expensive, andincorporate a greater number of spectral bands. However, realizing all of these objectives in an imaging systemsimilar to Landsat is likely to prove difficult, even if the CAMEO demonstration proved successful. For example,although the Thematic Mapper on Landsat 6 and Landsat 7 have fewer bands and somewhat lower groundresolution than proposed for LMIS, they also have a much larger swath width (165 km versus LMIS’ 20 km).Whether it will possible to develop a LMIS-type instrument with a wider field-of-view is one of many technicalchallenges. An ancillary issue t hat affects CAMEO and other proposed multispectral and hyperspectral imagingsatellites is how best to use the added spectral information. Researchers in the satellite-based HIRIS program andin the aircraft-based HYDICE program are still at a relatively early stage in determining the capabilities ofhyperspectral imaging.
ARPA’s ATDs were fully supported by the DoD, but were severely cut by the Senate Appropriations DefenseSubcommittee staff. The programs have been restructured for a fiscal year 1994 start and include an added newemphasis on the potential benefits of CAMEO in enabling the United States to develop and greatly expand its rolein future commercial remote sensing markets.SOURCE: Advanesd Research Projeets Ageney, 1993.
follow-ons in the Landsat series and to global change As noted in chapter 2, the projected annual shortfallresearch. Other proposals for small satellites andlightweight remote sensing instruments have beenadvanced by the DOE national laboratories (boxB-13).
In an era of level or declining budgets, cost, nottechnology, may be the most important factor indetermining which new remote sensing projects tofund.74 However, even without the pressure inducedby recent budget cutbacks, programs that hope toaddress the fundamental questions associated withglobal change research in a timely manner will stillhave to evolve in the direction of “smaller, faster,better, cheaper.” Shorter project development peri-ods and lower costs would better match the period overwhich scientific understanding improves, technologyadvances, and changes occur in the Earth systemsunder study.
between NASA’s planned activities and appropria-tions may increase throughout the decade. Withmultibillion dollar shortfalls, new development effortsfor remote sensing technologies may be curtailed in aneffort to maintain ongoing programs. Given thisreality, one OTA Advisory Panel member suggestedthat NASA should institute a process to phase outapproximately 15 percent of the base program per yearto make room for innovation and new scientific/technical directions. This panel member further notedthat because the current management approach is tokey new ideas to budget appropriations, “new ideasrarely see the light of day. ’
Other researchers interviewed by OTA agreed thatlack of funding for some programs might stifle futureinnovation in the future, but disagreed with theassessment that a problem currently exists. They
74 ~s view is widely held; see, for example, Dean Freer, ‘‘Using Today’s Strategic Defense Initiative (SDI) Technologies to AccomplishTomorrow’s hw Cost Space Missions, ” IAF-92-0752, paper presented at 43rd World Space Congress, Aug. 31, 1992, Washingto~ D.C.

140 I Remote Sensing From Space
Box B-13-DOE Multispectral and Hyperspectral Imaging Systems
The Department of Energy is developing a variety of multispectral instruments for launch on small satellitesto support ongoing efforts in global change research and to demonstrate technologies for nuclear proliferationmonitoring. DOE’s multispectral pushbroom imaging radiometer-MPIR-was discussed in box B-12. This box
summarizes characteristics of two other proposed DOE instruments: SiMS-small imaging multispectralspectrometer (formerly denoted as “mini-HIRlS”) and the MT1-multispectral thermal imager.
The SIMS spectrometer is a joint NASA-DOE technology project to demonstrate that a small, lightweightinstrument can obtain high spectral resolution images of modest spatial resolution that would be useful for globalchange research and non-proliferation missions. SIMS would have two grating spectrometers. It would operatein 5 nm contiguous bands from 0.4-1 micron and from 1-2.5 micron. SIMS would employ a 10 cm diametertelescope; its spatial resolution in the various bands would be 80-100 meters from its nominal orbit altitude of 700km.1
AS noted in earlier discussions of HIRIS, hyperspectral imaging with even modest spatial resolution can
translate into enormous data rate and storage requirements. A 20 km X 20 km SIMS image would contain some100 trillion bits. Data rate and storage requirements can be reduced, however, by selecting only a small subset
of spectral channels for each scene.The Multispectral Thermal Imager (MTl) is, in effect, DOE’s version of ARPA’s LMIS instrument (box B-1 1).
MTI is a technology demonstration that is jointly sponsored by DOE’s Sandia National Laboratory, Los AlamosNational Laboratory, and Savannah River Technology Center. Its objectives are to collect high spatial resolutionmulti-spectral and thermal images for proliferation monitoring and to demonstrate technology applicable for futureLandsats. However, in contrast to ARPA’s proposal for CAMEO, MTI’s development will not be tied to thedevelopment of a new standardized bus.
MTI would operate from 0.4-12 microns in 18 spectral bands. The instrument would fly in a nominal orbit
altitude of 500 km with a 0.35 meter diameter telescope. Its spatial resolution would range from 5 meters in the0.4-1 micron (VNIR) to 40 meters in the 8-12 micron band (LWIR). A separate Iinear array would be used for each
spectral channel on a common focal plane assembly that would be cooled to 80 K with Stirling-cycle mechanicalcoolers.
noted, for example, that innovation and new scientific fourth groupings might be satisfied by advancedor technical directions have emerged out of existingefforts by several agencies, notably in the discoveryand investigation of the Antarctic ozone hole. Further-more, they believed that competitive peer review ofgrant proposals to agencies such as the NationalScience Foundation insured turnover in base pro-grams.
| Developing Follow-ons in Landsat SeriesUser requirements for surface remote sensing data
can be grouped in four broad categories as shown intable B-3. The first grouping of requirements will besatisfied by the EOS system; the second grouping issatisfied by the current Landsat; and the third and
Landsats. -
Landsat 5 was launched in March 1984. It hasgreatly exceeded its planned operational life and willbe replaced by LandSat 6 in late 1993. Landsat 6 issimilar in most respects to Landsat 5, differing mostnoticeably in its incorporation of an enhanced The-matic Mapper (TM) (table 4-1 ). The enhanced featuresof Landsat 6 include the addition of a 15-meterpanchromatic (black and white) band, which can beused as a ‘‘sharpening’ band for the 30-metermultispectral imagery and improved band-to-bandregistration (i.e., how well the same scene is recordedin different spectral bands). Landsat 7, scheduled forlaunch in the 4th quarter of 1997, would be the first
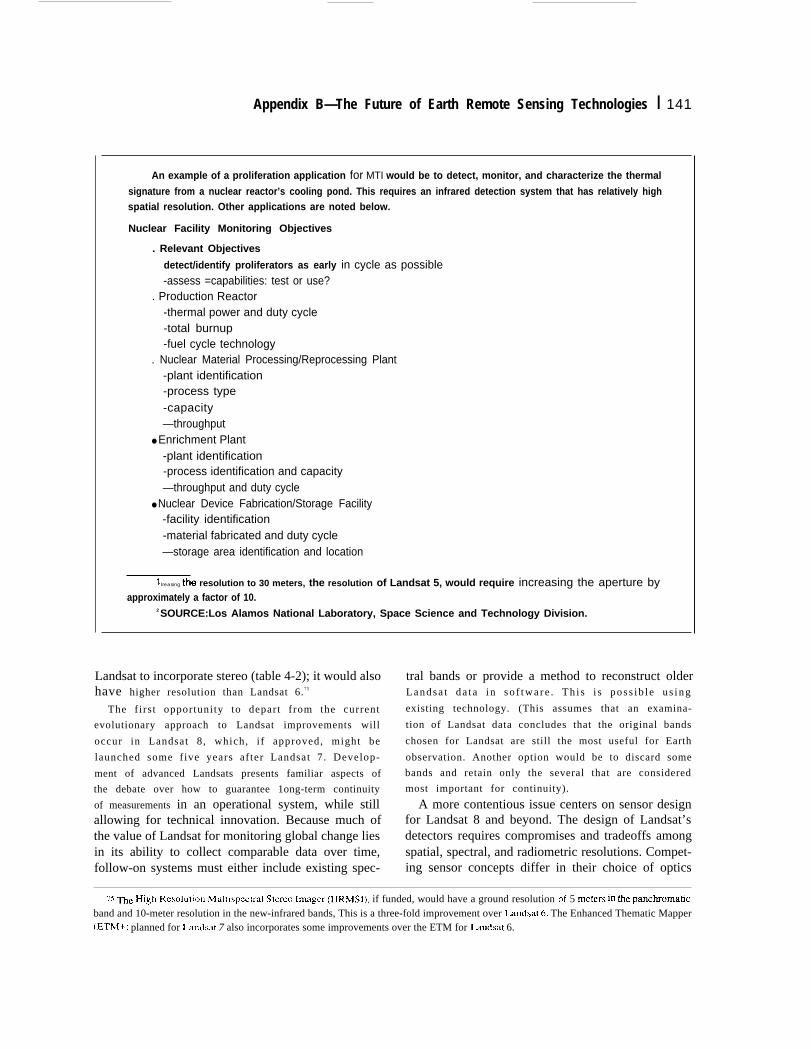
Appendix B—The Future of Earth Remote Sensing Technologies I 141
An example of a proliferation application for MTI would be to detect, monitor, and characterize the thermal
signature from a nuclear reactor’s cooling pond. This requires an infrared detection system that has relatively highspatial resolution. Other applications are noted below.
Nuclear Facility Monitoring Objectives
. Relevant Objectives
detect/identify proliferators as early in cycle as possible-assess =capabilities: test or use?
. Production Reactor-thermal power and duty cycle-total burnup-fuel cycle technology
. Nuclear Material Processing/Reprocessing Plant-plant identification-process type-capacity—throughput
● Enrichment Plant-plant identification-process identification and capacity—throughput and duty cycle
● Nuclear Device Fabrication/Storage Facility-facility identification-material fabricated and duty cycle—storage area identification and location
1 Ireasing the resolution to 30 meters, the resolution of Landsat 5, would require increasing the aperture byapproximately a factor of 10.
2 SOURCE:Los Alamos National Laboratory, Space Science and Technology Division.
Landsat to incorporate stereo (table 4-2); it would also tral bands or provide a method to reconstruct olderhave higher resolution than Landsat 6. 75 Landsa t da t a i n so f twa re . Th i s i s pos s ib l e u s ing
The f irst opportunity to depart from the current existing technology. (This assumes that an examina-
evolutionary approach to Landsat improvements will tion of Landsat data concludes that the original bands
occur in Landsat 8, which, i f approved, might be chosen for Landsat are still the most useful for Earth
launched some f ive years af ter Landsat 7. Develop- observation. Another option would be to discard some
ment of advanced Landsats presents familiar aspects of bands and retain only the several that are considered
the debate over how to guarantee 1ong-term continuity most important for continuity).
of measurements in an operational system, while still A more contentious issue centers on sensor designallowing for technical innovation. Because much of for Landsat 8 and beyond. The design of Landsat’sthe value of Landsat for monitoring global change lies detectors requires compromises and tradeoffs amongin its ability to collect comparable data over time, spatial, spectral, and radiometric resolutions. Compet-follow-on systems must either include existing spec- ing sensor concepts differ in their choice of optics
75 me H1~h Resolution Mulllspcctra] stereo Im~ger (HRMSI), if funded, would have a ground resolution of 5 mCtcrS in tie pmc~omaticband and 10-meter resolution in the new-infrared bands, This is a three-fold improvement over Landsat 6, The Enhanced Thematic Mapper(ETM+) planned for Landsat 7 also incorporates some improvements over the ETM for Landsat 6.
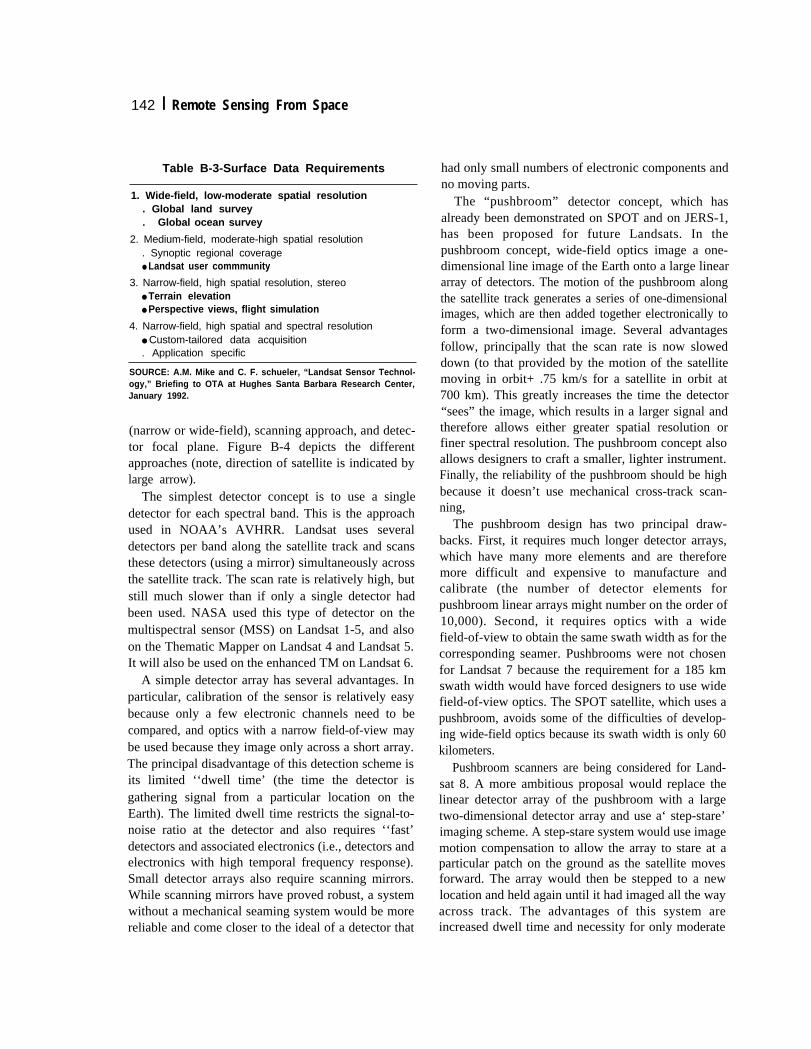
142 I Remote Sensing From Space
Table B-3-Surface Data Requirements
1. Wide-field, low-moderate spatial resolution. Global land survey. Global ocean survey
2. Medium-field, moderate-high spatial resolution. Synoptic regional coverage● Landsat user commmunity
3. Narrow-field, high spatial resolution, stereo● Terrain elevation● Perspective views, flight simulation
4. Narrow-field, high spatial and spectral resolution● Custom-tailored data acquisition. Application specific
SOURCE: A.M. Mike and C. F. schueler, “Landsat Sensor Technol-ogy,” Briefing to OTA at Hughes Santa Barbara Research Center,January 1992.
(narrow or wide-field), scanning approach, and detec-tor focal plane. Figure B-4 depicts the differentapproaches (note, direction of satellite is indicated bylarge arrow).
The simplest detector concept is to use a singledetector for each spectral band. This is the approachused in NOAA’s AVHRR. Landsat uses severaldetectors per band along the satellite track and scansthese detectors (using a mirror) simultaneously acrossthe satellite track. The scan rate is relatively high, butstill much slower than if only a single detector hadbeen used. NASA used this type of detector on themultispectral sensor (MSS) on Landsat 1-5, and alsoon the Thematic Mapper on Landsat 4 and Landsat 5.It will also be used on the enhanced TM on Landsat 6.
A simple detector array has several advantages. Inparticular, calibration of the sensor is relatively easybecause only a few electronic channels need to becompared, and optics with a narrow field-of-view maybe used because they image only across a short array.The principal disadvantage of this detection scheme isits limited ‘‘dwell time’ (the time the detector isgathering signal from a particular location on theEarth). The limited dwell time restricts the signal-to-noise ratio at the detector and also requires ‘‘fast’detectors and associated electronics (i.e., detectors andelectronics with high temporal frequency response).Small detector arrays also require scanning mirrors.While scanning mirrors have proved robust, a systemwithout a mechanical seaming system would be morereliable and come closer to the ideal of a detector that
had only small numbers of electronic components andno moving parts.
The “pushbroom” detector concept, which hasalready been demonstrated on SPOT and on JERS-1,has been proposed for future Landsats. In thepushbroom concept, wide-field optics image a one-dimensional line image of the Earth onto a large lineararray of detectors. The motion of the pushbroom alongthe satellite track generates a series of one-dimensionalimages, which are then added together electronically toform a two-dimensional image. Several advantagesfollow, principally that the scan rate is now sloweddown (to that provided by the motion of the satellitemoving in orbit+ .75 km/s for a satellite in orbit at700 km). This greatly increases the time the detector“sees” the image, which results in a larger signal andtherefore allows either greater spatial resolution orfiner spectral resolution. The pushbroom concept alsoallows designers to craft a smaller, lighter instrument.Finally, the reliability of the pushbroom should be highbecause it doesn’t use mechanical cross-track scan-ning,
The pushbroom design has two principal draw-backs. First, it requires much longer detector arrays,which have many more elements and are thereforemore difficult and expensive to manufacture andcalibrate (the number of detector elements forpushbroom linear arrays might number on the order of10,000). Second, it requires optics with a widefield-of-view to obtain the same swath width as for thecorresponding seamer. Pushbrooms were not chosenfor Landsat 7 because the requirement for a 185 kmswath width would have forced designers to use widefield-of-view optics. The SPOT satellite, which uses apushbroom, avoids some of the difficulties of develop-ing wide-field optics because its swath width is only 60kilometers.
Pushbroom scanners are being considered for Land-sat 8. A more ambitious proposal would replace thelinear detector array of the pushbroom with a largetwo-dimensional detector array and use a‘ step-stare’imaging scheme. A step-stare system would use imagemotion compensation to allow the array to stare at aparticular patch on the ground as the satellite movesforward. The array would then be stepped to a newlocation and held again until it had imaged all the wayacross track. The advantages of this system areincreased dwell time and necessity for only moderate

Focalplane
Appendix B—The Future of Earth Remote Sensing Technologies I 143
Figure B-4-Surface Optical Remote Sensing Techniques
“Whisk-broom”
Serial Parallelcross-track cross-track
<Low-earth orbit6.75 km/see ground velocity
—
Cross-track Highscan speed
Motion Continuous
Multipledetectorsper band
Medium
Oscillatory
Linear Two-dimensionalarray for array foreach band each band
Zero Medium
SOURCE: Hughes Santa Barbara Research Center Briefing Charts, 1992.
field-of-view optics. Its disadvantages are a larger andmore complex focal plane than the pushbroom, whichleads to greater problems in manufacturing, calibrationand higher cost. Active mechanical cooling is alsolikely to be necessary to cool the array (passiveradiative cooling may be possible for pushbroomdetectors). The discontinuous motion also presentsproblems—the system has to settle between each step.A last option, which is not appropriate for Landsat, isa full stare system. Satellite velocities in low-Earthorbit are too fast to allow a full stare system to dwelllong enough on a region of interest. Full stare systemscould be used in geosynchronous orbits.
As noted at the beginning of this appendix, the risksin developing a new sensor system have two compo-nents: the technical maturity of component technolo-gies and the design maturity. A particular design thathas not been used before may be a relatively riskyventure for an operational program, even if it is basedon proven technology. Some concepts for advancedLandsats would stress both component maturity anddesign maturity.
A notable example of a new component technologythat might enable the design of smaller, lighter, andless expensive land remote sensing instruments, withmuch greater spectral capabilities, is the linear spectral
144 I Remote Sensing From Space
wedge filter, the heart of a proposed “Wedge Spec-trometer. ’76 The wedge spectrometer, under develop-ment at Hughes Santa Barbara Research Center(SBRC), would be an extremely compact visible andinfrared imaging spectrometer. A demonstration sys-tem has been fabricated; it uses a 1 cm2 linear spectralwedge filter and detector array to gather a 128 X 128pixel image in each of about 64 spectral bands in thevisible/near-infrared region (0.4-0.85 microns) .77 SBRChas tested this system on an aircraft under ARPAsponsorship and generated image products.
The compactness of the wedge spectrometer is
achieved in part because spectral discrimination occurs
in a focused beam. In contrast, imaging spectrometersthat use gratings or prisms to disperse light requirecollimating and reimaging optical and mechanicalcomponents. The wedge spectrometer is also thought
to be inherently cheaper and more rugged than gratingor prism instruments. The key element of the system,the filter wedge, has been fabricated and is in use indevices such as laser warning receivers. However, thefilter wedge in a laser warning receiver would not besuitable for calibrated remote sensing.
Officials at SBRC informed OTA of several spectraland radiometric performance issues that require furtherwork so that a wedge spectrometer might be used inEarth remote sensing applications that require a highdegree of radiometric and spectral sensitivity.78 SBRCis currently under contract to the Defense NuclearAgency to demonstrate the wedge spectrometer fortreaty verification applications. SBRC expects todemonstrate the device operation in the short-waveinfrared (SWIR) bands in calendar year 1993.79
76 me key elaent of the w~ge Spectrometer is the linear spectral wedge filter; a thin-fb optical device that &ansmits hght at a centerwavelength that is specified by the spatial position of illumination on the fiher. (A thin film of oil selects light via a similar ‘‘interference’effect and accounts for the familiar rainbow of colors that are seen from varying thicknesses of an oil slick. The wedge falter is, in effecc aninterference filter with a thickness that varies linearly along one axis.) Therefore, if an array of detectors is placed behind the filter, each detectorwill encounter light from a scene at a different center wavelength. If there is a linear variation in wavelength versus spatiat positiom the arrayoutput is effectively the sampled spectrum of the scene. An array of detectors behind the falter will vary spatially in one direction and spectrallyin a perpendicular direction. Scanning the falter/array assembly along the spectrat dimension will build a 2-dimensional spatial image in eachof the spectrat bands transmitted by the filter.
rI ~e new.~wed is often defined as 0.4- 1.0 micro~.
78 A ~ljor issue for the filter wedge 1S improving “out of band’ performance---currently, energy at wavelen@hs other than at the centerwavelength specified by the spatial position of illumination on the filter may be passed. This energy undergoes multiple reflections within thefilter substrate and results in inaccuracies in spectral information. Grating or prism systems are immune from this problem.
79 me SWIR is often defined as 1.0-2.5 microns.
Appendix C:Military Uses
of CivilianRemote Sensing
Data
T his appendix addresses the military utility of data from civilian
remote-sensing satel l i tes . This utility draws the interest Of
those who might ignore the satellites and their more prosaic
utility for Earth-sciences applications. Technically, it presses
the satellites to their limits of resolution, both spatial and spectral, and
timeliness. Politically, it raises questions of who should be allowed to
buy what data. Militarily, it brings a whole new group of intelligenceplatforms, for what they are worth, into play for only their marginalcost. The Department of Defense has been purchasing remotely senseddata from EOSAT (Landsat) and SPOT Image (SPOT) for some time. 1
However, tile extensive use of Landsat and SPOT data in the PersianGulf Conflict has awakened public and congressional interest in thesubject and focused attention on the issues involved.
This appendix does not address such questions as the civilian(scientific) utility of military satellites, or the “overlap” of civilian andmilitary satellite capabilities. Thus, the sensitive question of thecapabilities of military satellites does not concern us here-we needonly investigate the capabilities of civilian satellites, and the questionof how well those capabilities might serve military needs.
| Military Remote Sensing MissionsMilitary remote sensing missions include reconnaissance (including
broad area search, combat intelligence, indications and warning of war,and arms control verification); mapping, charting, and geodesy; andmeteorology. While rule-of-thumb precepts quantifying the capabili-ties needed to perform certain tasks abound, we find them wanting and
1 U.S. Congress, Office of Technology Assessment, l?emote Sensing and the PrivateSector; l.rsue.~ for D/.rcu.r.rion, OTA-TM-lSC-20 (Washing[on, DC U.S. GovernmentPrinting Office, March 1984).
2 Or capabihty—most such precepts reduce satellite capabilities to a single parameter,‘‘resolution.
145

146 I Remote Sensing From Space
prefer instead to be guided by instances in whichspecific satellites imaged specific targets of militaryinterest, or targets like those of military interest. Seenin this light, even some of the least promising civiliansatellites show surprising potential military utility.
RECONNAISSANCE MISSIONSReconnaissance is ‘‘a mission undertaken to obtain,
by visual observation or other detection methods,information about the activities and resources of anenemy or potential enemy. ‘‘3 This mission dates backat least as far as the spies Moses and Joshua sent intothe Promised Land,4 and has traditionally been theprovince of unarmed or Lightly armed scouts (likeJoshua and his men), as well as cavalry, balloons,5 andaircraft. Particular reconnaissance missions include(roughly in ascending order of difficulty) broad areasearch; indications and warning; combat intelligence;and arms control agreement verification.
Broad Area Search—This mission is the mostunfocused reconnaissance possible: sweeping attentionto an area of land or sea looking for previouslyundetected items of potential military significance,rather than for some particular military installation orformation. The enormous scope of the typical broadarea search mission is, typically, somewhat offset bythe large size of the targets of interest: when searchingthe hinterlands, one probably seeks clandestine or newmilitary installations, indications of new militaryprograms, and the like. Detailed examination of whatone finds can be done later, with more focusedcoverage.
Broad area search is almost the norm for reconnais-sance at sea: even in peacetime, ships and airplanespatrol the oceans to see whatever is there. While theirefforts are largely focused on submarines, thesedifficult and yet important targets do not get all of the
attention; tracking of surface ships remains a vitalmission in the United States Navy.
Indications and Warning—Indications and Warn-ing comprises:
.,. those intelligence activities intended to detect andreport time-sensitive intelligence information on for-eign developments that could pose a threat to the UnitedStates or allied military, political, or economic interestsor to U.S. citizens abroad. It includes forewarning ofenemy actions or intentions; the imminence of hostili-ties; insurgent or other attack on the United States, itsoverseas forces, or allied nations; hostile reactions toUnited States reconnaissance activities, terrorists’ at-
tacks; and other similar events.b
D u r i n g c r i s i s , r e a r r a n g e m e n t o f a i r c r a f t , t a n k s ,
rai lcars, or ships within their basing areas, or their
departure from their basing areas, could lead one to
expect that an attack, or at the very least an alert, was
underway. Vigilance regarding warning signs is a
major intelligence mission for the United States. By its
very nature, this mission must be performed continu-
ously. Its intensity increases during periods of tension
and crisis.
Combat Intelligence-Combat intelligence is ‘thatknowledge of the enemy, weather, and geographicalfeatures required by a commarider in the planning andconduct of military operations, It provides militaryforces with enormous leverage, and is a prerequisite forthe American style of War,g and, indeed, for victoryitself, ‘‘Knowledge of the enemy” includes the sizeand character of his forces, where they are and wherethey are not, the routes by which they are supplied, theextent of their logistic preparation for movement orcombat, the nature of any fortifications they mayoccupy, and so on. It also includes the character ofterrain and weather where operations might occur.
3 Depa~~nt of Defense Dictiona~ of Military and Associated Term.r (Joint Pub 1-02, formerly JCS ~b 1). ~s is tie fist def~tion of.“reconnaissance.’ The second is more general and includes mapping, hydrography, etc..
4 Numbers 13: 1-25 and Joshti 2:1-24. (See also Numbers 13:27 and 13:28 for an early example of an ‘‘On the one hand ... , but on theother hand . . . “ intelligence assessment.)
s Both crewed and otherwise. See Curtis Peebles, The Moby Dick Projecf (WashingtorL DC: Smithsonian Institution+ 1991).
b Department of Defense Dictionary of MiIita~ and Associated Terms, op. cit., footnote 3, p. 177.7 Ibid., p. 74.g * ‘No commander an succ~d ~ess he demands and receives the intelligence and combat kfOImiNiOn he netXk. ’ Udd S@teS Army
FM 100-5, Operations, August 1982, Washir@o~ DC, p. 6-6.

Appendix C-Military Uses of Civilian Remote Sensing Data I 147
Surprisingly, military weather is not quite the sameas civilian weather. Civilian satellites presently makesignificant contributions to the military’s weatherforecasting: the military person’s “theater’ and themeteorologist ‘‘mesoscale’ correspond to about thesame spatial dimensions-on the order of a millionsquare kilometers. But the knowledge of weatherrequired for the combat intelligence mission caninclude scales of time and space not normally associ-ated with weather forecasts, right down to the limitingcase of informing a commander as to the currentweather at his present location. Military meteorologyalso includes measurement of parameters seldomwanted or needed in the civilian world, such as directmeasurement of rain rate.9 Civilian weather satellites’deficiencies in satisfying military needs include:atmospheric sensing and observation capabilities,meteorological data acquisition and assimilation sys-tems, and models needed to make reliable forecastsand ‘‘nowcasts’ (descriptions of the weather withinthe coming day) of mesoscale weather with resolutionof kilometers, extent of thousands of kilometers, andtimescales of 6 to 72 hours. The military’s goal ofworldwide rapid response exceeds any current capabil-ity, military or civilian, for collecting data and turningthem into a forecast. ’”
Some argue that the military’s asserted need for itsown weather satellite system, the Defense Meteorolog-ical Satellite Program (DMSP), stems from bureau-cratic, not meteorological, concerns:
. . . there is considerable evidence to justify initiating
action to converge the DMSP and TIROS systems.What has been lacking is sufficient impetus for thefederal agencies involved to take such action.11
However, DMSP proponents can point to the woes of
GOES-Next as evidence to support their position that
the military need for weather forecasting is too great tobe left in the hands of any other organization.
Monitoring Arms Control Agreements-Armscontrol agreement verification is:
. . . a concept that entails the collection, processing, andreporting of data indicating testing or employment ofproscribed weapon systems, including country of originand location, weapon and payload identification, andevent type. ’2
It also entails the evaluation of those data, and theconsideration of them in light of a larger politicalcontext. Congress, particularly the Senate-in theexercise of its Constitutional mandate to advise andconsent in the making of treaties-has made verifiabil-ity a prerequisite for most arms control treaties. Whileverification entails many ingredients other than thoselisted above (including political judgment-calls), theJoint Chiefs’ list includes most or all of whatarms-control theorists refer to as the ‘‘monitoring’part of verification; arms control agreement monitor-ing has become an important task for the U.S.intelligence community. Indeed, some have arguedthat this one task has preoccupied U.S. high-technology intelligence collection as a whole.13
MISSIONS OTHER THAN RECONNAISSANCE
Mapping, Charting, and Geodesy-Tradition dic-tates the use of the word “map” by ground forces andthe use of the word ‘‘chart’ by naval forces, includingeach force’s respective air arms. 14 Geodesy is the
measurement of the shape of the Earth. The DefenseMapping Agency uses the phrase ‘Mapping, Charting,and Geodesy” (MC&G) as the description of itsprincipal mission,
15 defining the term as fOllows:
9 Civilian meteorologists can let rainwater accumulate and then issue a report of the amount of rainfatl recorded overa cetiain time. Militarymeteorologists can need to know instantaneous rain rate, because of its effect on radar systems.
10 ~s Pmgaph tiaws on “Comments on Military Uses of Civilian Remote Sensing Satellites, ” Major General Robert A. RosenbergUSAF, (retired), Aug. 4, 1992.
I I Gener~ ~co~t~g Office, GAO NSIAD-87- 107, Weather Satellites, p. 4.
12 Department of Defense Dictiona~ of Milita~~ and Associated Terms, Op. cit., footnote 3, p. 36.13 ~gelo Codevilla, znforming Sratecraji (New York+ W: Free ~ess, 1992)* P. 112.
ILt me jo~t Semlces* Dep~rtmenf of Defense DJctionaV of Mi/ita~ and Associated Terms (Joint Pub 1-02, formerly JCS ~b 1) defines a
‘ ‘map’ as ‘‘a graphic representation, usually on a plane surface, and at an established scale, of natural or artificial features on the surface ofa part or the whole of the earth . . . ,’ p. 219.
15 Defense Mapping Agency briefing to OTA s~f, May 13, 1992.
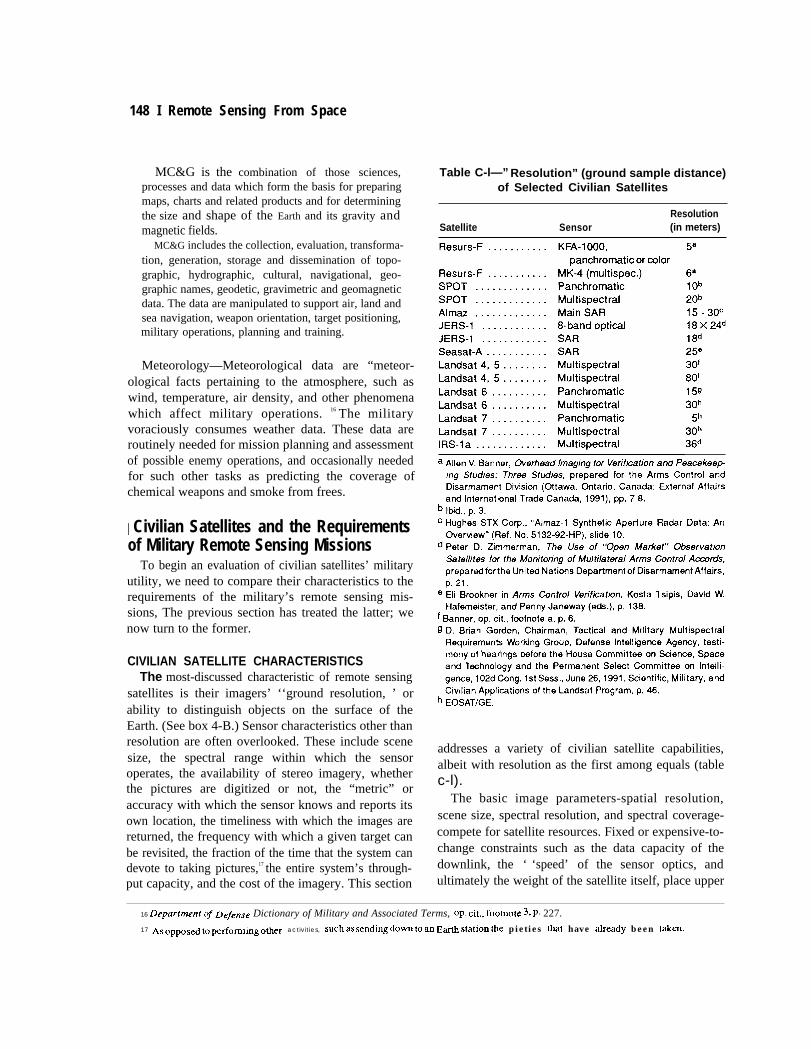
148 I Remote Sensing From Space
MC&G is the combination of those sciences,processes and data which form the basis for preparingmaps, charts and related products and for determiningthe size and shape of the Earth and its gravity andmagnetic fields.
MC&G includes the collection, evaluation, transforma-tion, generation, storage and dissemination of topo-graphic, hydrographic, cultural, navigational, geo-graphic names, geodetic, gravimetric and geomagneticdata. The data are manipulated to support air, land andsea navigation, weapon orientation, target positioning,military operations, planning and training.
Meteorology—Meteorological data are “meteor-ological facts pertaining to the atmosphere, such aswind, temperature, air density, and other phenomenawhich affect military operations. 16 The militaryvoraciously consumes weather data. These data areroutinely needed for mission planning and assessmentof possible enemy operations, and occasionally neededfor such other tasks as predicting the coverage ofchemical weapons and smoke from frees.
| Civilian Satellites and the Requirementsof Military Remote Sensing Missions
To begin an evaluation of civilian satellites’ militaryutility, we need to compare their characteristics to therequirements of the military’s remote sensing mis-sions, The previous section has treated the latter; wenow turn to the former.
CIVILIAN SATELLITE CHARACTERISTICSThe most-discussed characteristic of remote sensing
satellites is their imagers’ ‘‘ground resolution, ’ orability to distinguish objects on the surface of theEarth. (See box 4-B.) Sensor characteristics other thanresolution are often overlooked. These include scenesize, the spectral range within which the sensoroperates, the availability of stereo imagery, whetherthe pictures are digitized or not, the “metric” oraccuracy with which the sensor knows and reports itsown location, the timeliness with which the images arereturned, the frequency with which a given target canbe revisited, the fraction of the time that the system candevote to taking pictures,17 the entire system’s through-put capacity, and the cost of the imagery. This section
Table C-l—” Resolution” (ground sample distance)of Selected Civilian Satellites
ResolutionSatellite Sensor (in meters)
addresses a variety of civilian satellite capabilities,albeit with resolution as the first among equals (tablec-l).
The basic image parameters-spatial resolution,scene size, spectral resolution, and spectral coverage-compete for satellite resources. Fixed or expensive-to-change constraints such as the data capacity of thedownlink, the ‘ ‘speed’ of the sensor optics, andultimately the weight of the satellite itself, place upper
16 Department of Defe~e Dictionary of Military and Associated Terms, op. cit., foo~ote 3* P. 227.
17 AS opposed t. pe-fom~g ~~er activities, such as send~g do~ to an E* s~tion the pieties that have tieady been tilkc?!ll.

Appendix C-Military Uses of Civilian Remote Sensing Data I 149
limits on the amount of information the image cancontain. Within those limits, tradeoffs must be made soas to maximize the image’s utility for its intendedpurpose. A multipurpose satellite entails another levelof tradeoff, compromise among purposes. A civiliansatellite, especially a commercial one, is intended to beall things to all customers, and thus will not necessarilyfill any one customer’s bill perfectly.
Resolution----One often sees the optical acuity ofremote sensing systems expressed in terms of theground resolution (or ‘ ‘resolution,” or “ground sam-ple distance”) of their imagery-the closest that twoobjects can be and still be perceived as two separateobjects. 18 In practice, it is usually about twice the size
of the smallest item that can be perceived as a separateobject.
Many sources in the open intelligence literaturetabulate the utility of different ground resolutions(table C-2).19 These sources generally list variousobjects and the ground resolutions needed to performvarious tasks with respect to these objects, such as‘‘detection, ‘‘recognition, ’ ‘‘identification, and‘‘technical analysis. ’ For example, 9-meter resolutionallows the detection of a ship, but 3- to 4-meterresolution may be needed to determine the type of theship (e.g., ‘‘submarine’ and even finer resolution isneeded to determine its class (e.g., Oscar). The manysources, some quoting from others, show roughagreement as to the resolutions needed for the differenttasks.
A more sophisticated expression of sensor defini-tion, the Image Interpretability Rating Scale (IIRS),
Table C-2—Resolution Requirements (in meters)Sorted by Task and Target
Task
Target Detect Identify Analyze
Surface ships . . . . . . . 15 0.15 0.04Land minefield. . . . . . 3 0.30 0.08Missile sites . . . . . . . . . 3 0.15 0.04
takes into account aspects of image quality other thanground resolution. These include contrast, intensity,shadowing, and so on. The IIRS is, at base, a subjectiverating system: it works from the image’s utility indetecting, identifying, or analyzing given types oftarget to the image’s rating on the scale.20
Both IIRS and the more objective (but simplistic)ground resolution paradigm address the utility ofimages. However, the tasks to which they refer are ofthe most rudimentary nature. Military consumers ofremotely sensed data are really not interested indetecting, identifying, or analyzing particular objects.They care about such tasks as mapping, forecasting,targeting, and verifying. The ground resolution neededto perform these tasks is not so clear-cut, anddeficiencies in image quality can in some cases bemade good by virtuoso performance of the imageinterpreter’s art. For example, ships too small to beseen at a given resolution could, if under way, bedetected via their wakes. Fences, themselves an
IS The Depurtmenf ~fDefen~e Dic(iona~ of Military and Associated Terms (Joint Pub 1-02, formerly JCS ~b 1 ) defines ‘‘resolution’ M‘‘a measurement of the smallest detail wh]ch can be distinguished by a sensor system under specific conditions. ” The role of the word‘ ‘distinguished” in this definition is sometimes given insufficient emphasis.
‘9 These include:McDonnell Douglas Aircraft Corp., The Reconnaissance Handy Book, p. 125.Ronald J. Ondrejk~ ‘‘Imaging Technologies, in Arms Conrrol l’enfication, Kosta Tsipis, David W. Hafemeister, and Penny Janeway
(cds.), p, 67.Jeffery T. Richelson, ‘ ‘Implications for Nations Without Space-Based Intelligence-Collection Capabilities, ’ (in Civilian Obsen!ation
Sufellites and Infernanonul Security, Peter Zimmerman et at. (eds.)), p. 60.Ronald A. Scribncr et al,, The Verification Challenge: Problems and Promise of Strategic Nuclear Arms Control Verification, p. 32.U. S, Congress, Office of Technology Assessment, Verification Technologies: Cooperative Aerial Surveillance in International
Agreements, OTA-ISC-40, (Washington, DC: U.S. Government Printing Office, July 1991), p. 38.United States Department of Defense, Headquarters, Department of the Army, STP 34-% D1-SM Soldier’s Manua/ Skill Level 1 MOS
96D Imagery Analyst, pp. 2-146 to 2-150.~ Itek CII Systems Bullctm IL-Z, ‘‘IIRS Image Interpretability Rating Scale” (Lexingtom MA: Litton Itek Optical Systems, 1984).

150 I Remote Sensing From Space
indicator of the nature of the facility they surround,21- 22
can be detected by the way they channel foot traffic(and the paths it creates),23 and by its effect onvegetation, 24 while dummy installations are givenaway by the absence of foot traffic in their vicinities25
or the lack of snowmelt on their roofs.26 In a mostremarkable instance of detecting the non-resolvable, J.Skorve found a set of seven Soviet submarine-communications antennas in an 80-meter Landsatpicture. 27 Although the antennas themselves cannot be
seen, the snowflake pattern28 created by their bases,their stays, and their stays’ bases is some 1,700 metersacross. Skorve apparently deduced the function of theantennas from their large size, which bespeaks a longwavelength most suitable for communication withsubmarin es. He indicates that weather conditionsprevented a cued follow-up shot with the higher-resolution SPOT. Working with even less raw ma-terial, Peter Zimmerman analyzed a SPOT picture ofthe Soviet Northern Fleet headquarters at Severo-morsk, concluding that:
. . . there are no buildings or rocky terrain around thebase, which suggests that caverns have been blasted outof the cliffside.29
Photo interpreters are, however, only human, andtheir logic can at times be faulty. For example, analystsnoted that a certain building in Iraq lacked the multiplesurrounding fences associated with high-technology
military work. However, it was later discovered thatthe building lay inside a huge military facility, whosesecurity fences apparently lay entirely outside theboundaries of the overhead picture.30
Moreover, targets of sufficient contrast can bedetected even if they are too small to be resolved. (Weare familiar with this effect because of the operation ofour own eyes, which can detect distant stars withoutresolving them.) Again citing the example of a ship,heat from machinery or absorbed sunlight could makethe ship such a bright thermal infrared source, orreflected sunlight could make it such a bright visible,near infrared, or medium infrared source—in contrastto the surrounding sea—that it would light Up a whole
pixel31 despite occupying far less space than is imagedby that pixel. Alternatively, concave corners in theship’s superstructure could strongly reflect energystraight back to a radar satellite (such as the now-defunct AlmaZ-l, or ERS-1), again lighting up a pointon the image and showing that something other thanthe ocean was there, even though it could not beresolved.
The whole resolution concept is also confounded bytargets that exceed the system’s resolution in onedimension while falling short in another. A railroad,for example, is narrower than 30 meters but farlonger—railroads can and do occasionally appear in
21 soldier’s Manul Sb”ii Level I, Imagery Analyst, p. 2-439.
22 1‘me Space Media Network a~ysts who published a story about the Soviet electro-optical facility atop Mt. S~glok in Tadjikistan feltconfident that they had seen double fencing on that site. Such indications of security call attention to an industrial site that might otherwisehave been overlooked. (Peter Zimmerman, ‘‘The Use of ‘Open Market Observation Satellites for the Monitoring of Multilateral Arms ControlAccords,” p. 51.)
23 Soldier’s Ma~l Sia”ll Level i, op. cit., foomote 21, p. 2-367.
B Ibid., p. 2457.
~ Ibid., p. 2-360.
26 Dino A. Brugioni, ‘‘The Serendipity Effect of Aerial Reconnaissance, Interdisciplinary Science Reviews, vol. 14, No. 1, 1989, p. 16.Brugioni also points out that snowplowing habits can indicate facilities’ functions: headquarters buildings typically receive the most promptservice.
27 Joby Skome, The Ko/a Zrnage Atlas, Oslo, The Norwegian Atlantic committee, 1991.
~ ~e sixfold symme~ arises because six antennas surround the seventh in a hexagon.29 peter z~emm ‘‘A New Resource fOr Arms control, “ New Scienh”st, Sept. 23, 1989, p. 39.30 Jay c, Davis and David A. KaY~ ‘ ‘Iraq’s Secret Nuclear Weapons Program, ” Physics Today, July 1992, p. 24.31 A ‘‘p~el, ’ ‘ short for ‘‘picture element, ‘‘ is a single one of the many dots, of differing color and/or brightness, that combine to form a
picture. Computer graphics use true pixels, while newspaper and magazine pictures use an offset image printing process whose dots can beseen with a magnifying glass, Broadcast TV forms images that are discrete, like computer images, in the scan-to-scan dimension and diffuse,like emulsion film images, in the along-the-scan one.

— . ——
Appendix C-Military Uses of Civilian Remote Sensing Data I 151
Landsat images, because a pattern made up of non-resolvable elements can be discerned.32
Thus, resolution requirements are hard to specify.The following sections assess the military utility ofparticular satellites not just in terms of the resolutionsneeded for particular tasks, but in terms of thesatellites’ proven overall abilities to see targets ofinterest in MC&G, meteorology, broad area search,Indications and Warning, battlefield intelligence, andarms control monitoring. Considerable overlap existsin these target categories. For example, a largeclandestine missile factory or radar would be a broadarea search target and also an arms-control monitoringtarget.
Scene Size-Just as users will always hanker afterfiner resolution, they will always want larger scenesizes, everything else being equal. However, largerscenes come at a price-in dollars, resolution, orboth-and therefore are subject to some limits.
Spectrum—"Panchromatic" sensors make imagesthat a lay person would term a black-and-whitephotograph, using visible light.
“Spectral coverage’ refers to the satellite’s abilityto detect light, and thus form images, in different partsof the spectrum, such as the visible band or infrared.These can all be combined into a “panchromatic”(black-and-white) picture, or separated. “Multispec-tral” sensors take, or construct, what the lay personwould call color pictures. Normally the colors seen inthe color pictures are not the colors of the orginalscene, but are instead a ‘‘fauvist’ color set chosen soas to make the information contained in the picture asapparent as possible to the human eye. One obviousreason for making such a color substitution is that thewavelengths orginally collected by the sensor may notbe visible to the human eye. For example, the infraredportion of the spectrum (with wavelengths too long tobe seen by the human eye) contains data useful in avariety of circumstances such as nighttime. Thereforea ‘‘color composite’ image is used, in which thevarious parts of the spectrum sampled by the sensor arerepresented by colors visible to the human eye. In the
common case of a combination using the near infraredband, such as a Landsat 4,3,2 TM band combination,the term “false color” is often used to describe thisform of enhanced presentation.
‘‘Spectral resolution’ refers to the satellite’s abilityto subdivide the covered portion of the spectrum intosmaller segments, in effect discerning different colorsin the scene. while multispectral sensors of the Landsatclass collect images using a handful of wavelengthbands, recent advances in detector technology andcomputational power have made it possible to buildsensors that have hundreds of very narrow spectralbands. These “hyperspectral” imaging systems, stillexperimental in nature, have the potential to discernmuch additional information in the scene, contributingto the detection of camouflaged or concealed targets,ocean bottom features, small-plot crop plantings ofinterest to drug interdiction efforts, detailed structuresin clouds, and other highly detailed image features ofmilitary interest. Whereas panchromatic sensors com-bine all the light they receive into a single image andmultispectral sensors sample light in several non-adjacent color bands, hyperspectal sensors sort incom-ing light into a hundred or more mutually exclusiveand collectively exhaustive ‘‘bins. The detailedspectral information thus captured allows for detailedexamination of the scene, especially with regard toidentifying particular materials in the scene by theirunique spectral “fingerprints.”33
Synthetic Aperture Radars, such as those aboard thenow-defunct Almaz-1, JERS - 1, and ERS - 1, operate ateven longer wavelengths, the microwave portion of theelectromagnetic spectrum. Their final products havethe appearance of black-and-white photographs, butthey can be colorized, for example to display soilcharacteristics of particular interest.
Stereoscope—Three-dimensional or “stereo” im-ages are useful in a wide variety of tasks, and essentialin map-making and the creation of scenery in flightsimulators. A stereo satellite image combines imagestaken at slightly different locations in the fashionfamiliar from childhood’s various ‘‘3-D Viewer’ toys
32 ~ even more complicated CKSe is that of minefield. The minefield’s extent can exceed the sensor’s resolution in bo~ dfi~tiom, ~~each mine being nonresolvably smaI1. In some cases, the trained eye can perceive the presence of the field, based on the pattern of nonresolvedspecks.
33 Ro5enberg, op. cit., foo~ote 10, and an Aug. 27, 1992, briefing at the Naval Rti~ch LaboratoV, was~ngton, DC on ~ek ~D1cE
(Wpq=@~ W@J Im3ng and co~e~tion Expe~ent) prok=t.

152 I Remote Sensing From Space
and, indeed, from human depth perception itself. Insome applications, a photo interpreter sees and benefitsfrom this illusion personally;34 in others, computersmanipulate the data to produce a contour map, with noactual 3-D viewing having taken place. The value ofstereoscopic coverage is so great as to elicit a rareinstance of sardonic wit from the U.S. Army in itsSoldier’s Manual, Skill Level I Irnagery Analyst: “YOU
will appreciate the advantages of stereoscope moreeach time you interpret photography that doesn’t havesufficient overlap to permit stereo viewing. ’35 For bestresults with human viewing, the separation betweenthe points where the picture was snapped should beabout a tenth of the distance to the target.36
Photo reconnaissance aircraft produce the stereopairs by taking photographs in rapid succession duringtheir pass over the target. Civilian satellites currentlylack this ability, and can make stereo pairs only bycarefully planned shots on separate orbits. JERS-1planning included the ability to make along-trackstereo pairs .37
Metric—Accurate photogrammetric measurementof the objects seen in the image requires an accurateaccount of the distance and viewing angle from thesensor to the target. If, in addition, accurate absolutelocation of the objects with respect to a largercoordinate system (such as global latitude, longititude,and altitude) is desired, an accurate account of theabsolute location of the sensor is needed. Such locationis now best obtained from the Global PositioningSystem (GPS), whose unencrypted signals normallyallow three-dimensional location to within 80 metersor better and time-domain location within a hundred-millionth of a second and whose encrypted signalsprovide even freer location and time accuracy. Theanalogous Russian GLONASS system provides com-parable accuracy but poor coverage. Through repeatedmeasurements, the accuracy of either system can beincreased. Access to the ‘‘precise-code’ GPS output,which is normally encrypted, could allow a satellite to
locate itself to within lo-meter accuracy or better.Special processing software can also improve metricaccuracy. For example, routine decisionmaking dataprocessing can locate SPOT data to within half apixel. 38
Considerable accuracy is possible even withoutsuch systems. France’s SPOT, for example, can locateits pictures to within one kilometer purely through theuse of its own orbit data.39
Timeliness-There are actually two aspects oftimeliness, both desirable. First, the rapidity withwhich an order is filled, measured in terms of thelength of time between the request and the collectionof the imagery. Second, the freshness of the imagery,measured in terms of the length of time between themoment that the image is collected and the moment itis delivered to the customer. These two types oftimeliness are not strongly related, except insofar asmost customers will want them both.
The former depends in part on the ‘‘revisit time’ ofthe satellite (how long it takes between successivepasses over the same spot) and the degree to which itcan aim its camera obliquely, obviating the need for anexact pass over the target. These combine to create anaverage delay between successive opportunities toimage the target. The actual delay—which one mightterm the “visit time’ ’-experienced by the customerwill vary according to how lucky he or she is: a luckycustomer will request a picture right before an opportu-nity to schedule it arises, while an unlucky one willrequest a picture just after a good time to take it haspassed, resulting in a delay. Such a customer mightwant to shop around for a different satellite’s services.Customers seeking visible-light views of regionsfrequently covered by clouds will also find themselvessubject to collection delays caused by weather. Revisittimes can be considered two ways: the revisit time ofa particular satellite, or that afforded by a satellitesystem, in which a pair of satellites can halve the revisittime. The second column of the table below reflects
~ Wl@ ~r~ps, an ficially exaggerated depth dimension so as to aid in the interpretation task.~S SOldier’S Man~l, skill Lel*el I, op. cit., footnote 21, p. 2-281.
36 Dodd Light u.s.G.s National Aerial PhotoWaphy ~o~
37 zimme~~ op. cit., footnote 22, p. 21.
38 wil~ Ke~edy, Hughes SIX Corp., personal communication, July 8, 1992.
w Wflfim ~ith ad David W. Simpso% ‘ ‘Monitoring Underground NUCIW Tests, ‘‘ in Peter Zimrnermaq Civilian Observation Satellitesand International Security (New York NY: St. Martin’s, 1990), p. 116.

Appendix C-Military Uses of Civilian Remote Sensing Data I 153
Table C-3—Timeliness of Selected CivilianSensing Systems
Revisit time “Freshness”Satellite (days) (days)
this distinction. Also counted as part of the “visitt i m e ’ is the delay entailed in processing the cus-
tomer’s order on the ground. This delay-often best
measured in weeks in business-as-usual commercial
operation—is far beyond acceptable limits for many
military uses.
The second type of timeliness, which one might
term ‘ ‘freshness, ” depends upon the way pictures get
from the satellite to the customer. Normally, process-
ing on the ground-needed to turn a signal from thespacecraft into a usable image—accounts for much ofthis delay. In the case of Resurs-F, however, additionaldelay results from the use of a film-return-as opposedto TV-like-transmission of the picture from thesatellite, Film-return systems return a capsule ofphotographic film to the ground for processing. Alucky customer will request a picture just before theroll of film is used up. This aspect of timeliness is amajor difference between the two high-resolutioncompetitors, SPOT (table C-3) and Resurs-F: SPOTuses a digital video downlink while Resurs-F uses aphysical film-return system (see app, D).
Throughput—Image vendors can only sell picturesas fast as they can take them. At some level of demand,perhaps reachable by even a single customer duringperiod of peak use such as a war, further picturescannot be purchased at all for a while, and additionalrequests will have to go unfilled.
Cost—However important the mission, cost is animportant consideration. Civilian satellites are noexception. Whether a cost is deemed ‘high’ or ‘low’depends upon how it compares to the costs ofalternative means of accomplishing the mission and tothe cost of allowing the mission to remain unper-formed (table C-4).
Control--space-race handicappers will already havenoted that the civilian satellites with the freest resolu-tions (SPOT, Resurs-F, and the now-defunct Alrnaz)do not belong to the United States. Therefore, politicalconsiderations might vitiate the potential militaryutility of these satellites in a crisis, In the case of theGulf War, this effect worked in favor of the UnitedStates: the French were on our side, and sold SPOTimages only to ‘‘well known clients in support of theallied effort. ’40 On the other hand, it has been statedthat France denied the United States use of SPOTduring planning for the 1986 raid on Libya. Evenduring normal peacetime operation Russia has had apolicy of not selling Resurs-F imagery of its ownterritory, though Almaz images are available. Thispractice, too, could change in light of Russian needsfor foreign exchange.
40 st~p~ne Chenard, ‘ ‘Lessons of the First Space War, ” Space Markets, April 1991, p. 5.

154 I Remote Sensing From Space
Table C-4-Costs and Capacities ofSelected Civilian Satellites
$1,000
CIVILIAN SATELLITES’ USE IN MILITARY
saw considerable use in the Persian Gulf War.One particular application of mapping is the study
of deployment-constraining terrain characteristics inthe deployment regions of the Russian land-mobileSS-25 missile. Budget Director Richard Darman citedthe Defense Department ‘‘absolute need’ for multi-spectral images as a reason to turn the Landsat programover to DoD,41 perhaps to perform this area limitationanalysis.
Mapping does not necessarily mean undetailedcoverage; some important targets for mapping, such asrailroads, are not always visible at the resolutions oftenassociated with maps. Because of its chancy success inpicking up these targets, Landsat is the subject ofvarying performance assessments, ranging from ‘Land-sat does not show the railroads, sometimes not even therivers’ ’42 to:
. . . since MSI maps are images of the Earth, theyshow existing roads, trails, airfields, etc. Clear,open areas, which may be suitable for militarypurposes, also stand out and are easily factoredinto planning. For example, after the 82ndAirborne Division obtained a Landsat map ofKuwait City, it asked for national imagery todetermine if there were traps or obstructions thatwould prevent an airborne landing. MSI imagesmay be able to show surface or subsurfacefeatures down to 30 meters, depending on waterclarity. The Navy used MSI data in planningamphibious operations during Operations DesertShield and Desert Storm.43
Certainly some railroads, roads, and rivers arevisible in the Landsat pictures (images 1-17) of theKola peninsula used in J. Skorve’s The Kola SatelliteImage Atlas (footnote 27).
Both SPOT and Landsat data are used in militaryflight simulators. An important and emerging part ofMC&G relates to combat intelligence: the creation ofdatabases for guidance systems. While the creation ofscenes used by DSMAC,44 for example, could well becategorized as combat intelligence, the maps used bythe pilot or TERCOM45 during the approach properlybelong to the realm of MC&G. Though Landsat datawere not used in preparing TERCOM maps for the
41 ~~ ~womt &am from ‘ ‘SAC n~ds ~dsat to hut mobile missiles, ’ ‘ Military Space, Dec. 18, 1989 (Arlington, VA: PashaPublications), p. 3.
42 Brigadier &ner~ Da,le E, Stovall, USAF, quoted in ‘‘Lessons of the First Space War, ’ Space kfarkers, Ap~ 1991, p. 6.
43 Sareq of ~fense Dick Cheney, IJ. S. Department of Defense, Conduct o~the Persian Guy War: Find Report tO Congre$$, p. T-23 1.
This reference, while in a section entitled ‘Muki-Spectral Imagery: LandSat,’ might refer to SPOT MSI as well or instead. SPOT is mentionedin an earlier subsection but without acknowledgment that SPOT images were used in the Persian Gulf War, which they were.
M D1gi~ Scene ~tc~g and correlation, ‘l%is system accomplishes terminal guidance by relating a TV image of tie sighted met ma
to a stored image, and guiding the missile to that part of the image that has been designated as the target.45 Temain cone~tion ~d ~tc~, ~s syst~ uses stored ~ps of ce~ patches to be ovefiown en route to the target. when tie
missile’s inertial guidance system decides that it is over a patck it activates an altimeter. The alimeter readings are then correlated with theelevations present in the patch to fiid the missile’s ground track. A course correctioncsn then be made, if necessary. Unlike DSMAC, TERCOMlooks only at elevations on a one-dimensional ground track, not a two-dimensional landscape.

Appendix C-Military Uses of Civilian Remote Sensing Data I 155
Tomahawk cruise missile strikes executed in Opera-tion Desert Storm, the ability to make such use ofLandsat data is expected in the near future.46
Uniquely, the MC&G mission demands extremeconsistency in its data. Change analysis is useful inalmost all military uses of remotely sensed data, but thechanges exploited in MC&G imagery maybe so subtlethat almost any alterations in the sensor are detrimen-tal, perhaps even fatal, to completion of the mission .47Thus, consumers of MC&G data often oppose “up-grades” in the sensors they use, preferring oldones—flaws and all-to new ones whose output willnot be strictly comparable to the archived outputs ofthe old sensors. At the level of precision demanded byMC&G, software cannot compensate for the effects ofconcern. For example, some MC&G consumers op-pose even integer-denominated improvements in reso-lution, even though one would think that, say, 30-meter resolution could be recovered from 15-meterdata simply by averaging blocks of four 15-meterpixels into single 30-meter pixels. Because of possiblenonlinearity in the response of the sensors to bright-ness, however, this approach can fail.
Meteorology—DoD operates meteorological sat-ellite systems, completely devoted to serving theweather-forecasting needs of the military.
Two Defense Meteorological Support Program(DMSP) Block 5D-2 satellites, aided by the NationalOceanic and Atmospheric Administration (NOAA)Polar-Orbiting Operational Environmental Satellites(POES) as well as the European Meteosat and SovietMeteor civilian weather satellites, served the military’sweather forecasting needs in the Gulf War.48
Weather and other forces change underwater cur-rents in ways that the Navy must monitor in order topredict sonar propagation paths, This requirement iscurrently filled by civilian NOAA satellites.49
Broad Area Search-Broad area search for majorinstallations could be accomplished by civilian satel-lites. Many sources, such as certain editions of theDepartment of Defense publication Soviet Military
Power and even a novel by the author Tom Clancy,show photographs of such installations, taken bycivilian satellites. (Which is not to say that that is howthe Department of Defense or other civilian customersorginally became aware of them.) In the cases of theairfields, shipyards, and naval bases, even the un-trained eye can readily identify the nature and functionof the facilities.
Interestingly, the coarse resolution of civilian sen-sors (especially those best suited to broad area search)is less of an impediment, in the case of somehigh-contrast targets, than one might imagine: detec-tion of any target in a supposedly desolate area, evenone of sub-pixel size, is a success for the broad areasearcher (table C-5). For example, Landsat-4, using itsBand 7, detected the “Wrangel Island Anomaly,” acircle 2 miles in diameter on the arctic ice nearWrangel Island. This circle called attention to dots nearits center that might otherwise have been overlooked.These turned out to result from tests of a new Sovietsubmarine’s ability to punch its way through the ice,preparatory to launching a ballistic missile. The circlewas made by an observation aircraft circling the testsite. 50 In other examples, buildings of the NorthKorean nuclear plant at Yongbyon show up (albeit asdots) in a Landsat Thematic Mapper5l picture, andships off California are visible in the Seasat-A radarimage. The use of the Thematic Mapper in this role isintriguing, because it suggests the possibility ofdeliberately sacrificing resolution so as to obtainimproved contrast against a target that is much hotterthan the surrounding landscape. In the same vein, onecould operate visible-light satellites at night, when
fi D. Bfian Gordo~ Chairma~ Tactical and Military Multispectral Requirements Working Group, Defense htelhgen~ Agency, testionYof hearings before the House Committee on Science, Space and Technology and the Permanent Select Committee on Intelligence, 102dCongress, 1st Ses., June 26, 1991. Scientific, Military, and Civilian Applications of the Landsat Progrm p. 31. Note that the essence of aTERCOM map is its elevation data, available only from stereo imagery.
47 Ckge det~tion for ~~w Pwses may not be as subtle as that used by MC&G.
@ Chewd, op. cit., footnote 40, p. 11.
49 Ibid.50 Some soUce~ refer to ~ ~fi]e as a con~~] ~her~s othe~ descfibe it as an actu~ @ce on tie ice, created by the shght r~ effect
of the contrail. The latter explanation is more plausible in that a contrail would drift away and become diffuse, whereas a melted circle in theice would become more pronounced the longer the airplane loitered.
51 DOD sowces ofien call this devia the ‘ ‘Thematic Imager, ’ perhaps because its output 1s an tige, not a map.
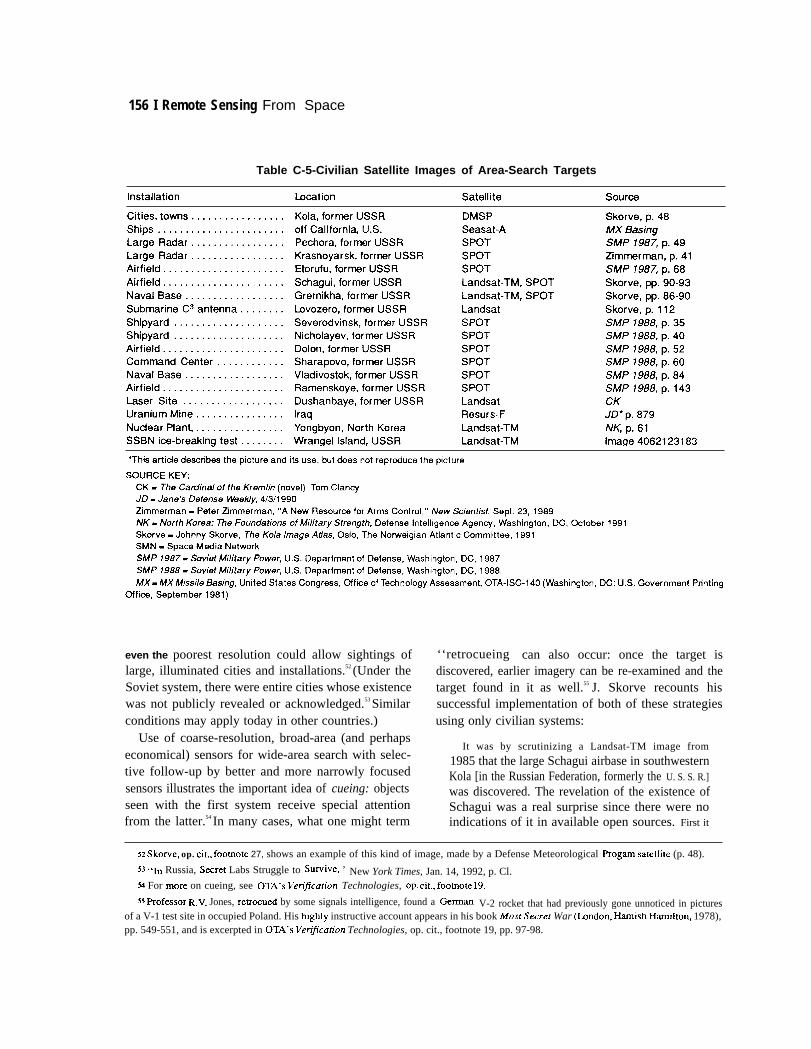
156 I Remote Sensing From Space
Table C-5-Civilian Satellite Images of Area-Search Targets
even the poorest resolution could allow sightings of ‘‘retrocueing can also occur: once the target islarge, illuminated cities and installations.52 (Under the discovered, earlier imagery can be re-examined and theSoviet system, there were entire cities whose existence target found in it as well.55 J. Skorve recounts hiswas not publicly revealed or acknowledged.53 Similar successful implementation of both of these strategiesconditions may apply today in other countries.) using only civilian systems:
Use of coarse-resolution, broad-area (and perhapsIt was by scrutinizing a Landsat-TM image from
economical) sensors for wide-area search with selec- 1985 that the large Schagui airbase in southwesterntive follow-up by better and more narrowly focused Kola [in the Russian Federation, formerly the U. S. S. R.]sensors illustrates the important idea of cueing: objects was discovered. The revelation of the existence ofseen with the first system receive special attention Schagui was a real surprise since there were nofrom the latter.54 In many cases, what one might term indications of it in available open sources. First it
52 Skome, op. cit., foo~ote 27, shows an example of this kind of image, made by a Defense Meteorological PrOgarn =tellite (p. 48).
53 <‘~ Russia, Swret Labs Struggle to Sun’ive, ’ New York Times, Jan. 14, 1992, p. Cl.~ For more on cueing, see OTA’S Verijicatiun Technologies, OP. Cit., foomote 19.
55 ~oftisor R.V. Jones, retmcued by some signals intelligence, found a Gemm V-2 rocket that had previously gone unnoticed in picturesof a V-1 test site in occupied Poland. His highty instructive account appears in his book Most Secret War (Londo& Hamish Hamittom 1978),pp. 549-551, and is excerpted in OZ4’S Venfi”cation Technologies, op. cit., footnote 19, pp. 97-98.
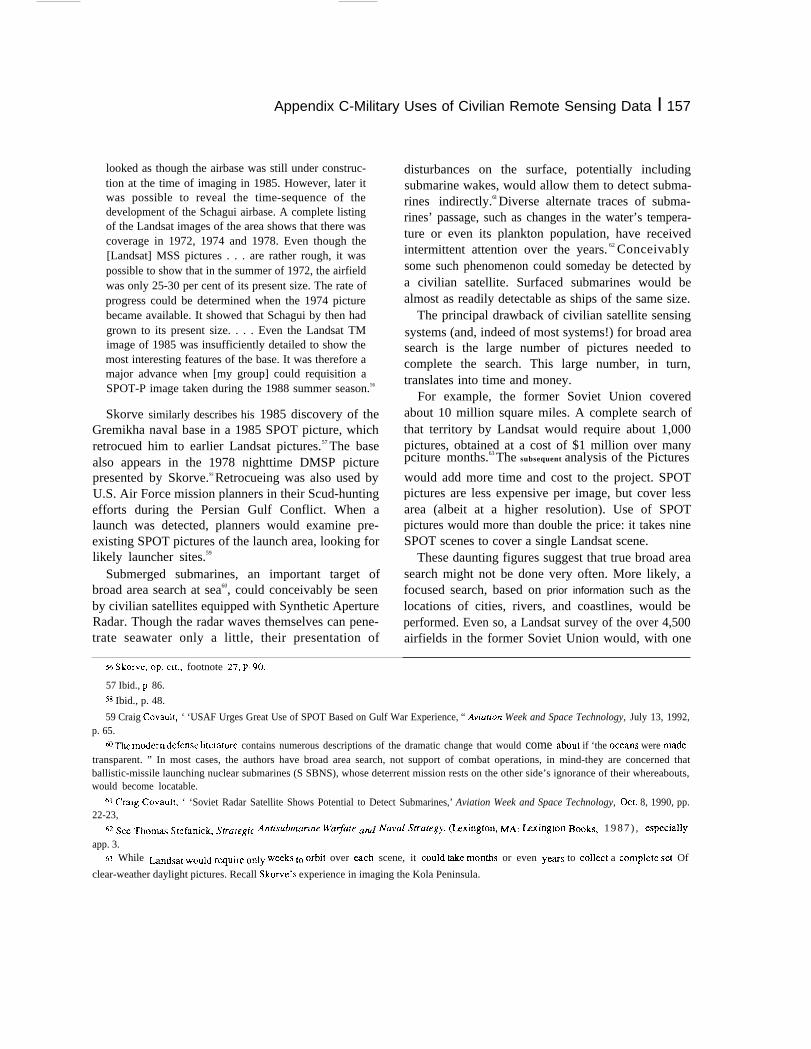
Appendix C-Military Uses of Civilian Remote Sensing Data I 157
looked as though the airbase was still under construc-tion at the time of imaging in 1985. However, later itwas possible to reveal the time-sequence of thedevelopment of the Schagui airbase. A complete listingof the Landsat images of the area shows that there wascoverage in 1972, 1974 and 1978. Even though the[Landsat] MSS pictures . . . are rather rough, it waspossible to show that in the summer of 1972, the airfieldwas only 25-30 per cent of its present size. The rate ofprogress could be determined when the 1974 picturebecame available. It showed that Schagui by then hadgrown to its present size. . . . Even the Landsat TMimage of 1985 was insufficiently detailed to show themost interesting features of the base. It was therefore amajor advance when [my group] could requisition aSPOT-P image taken during the 1988 summer season.56
Skorve similarly describes his 1985 discovery of theGremikha naval base in a 1985 SPOT picture, whichretrocued him to earlier Landsat pictures.57 The basealso appears in the 1978 nighttime DMSP picturepresented by Skorve.ss Retrocueing was also used byU.S. Air Force mission planners in their Scud-huntingefforts during the Persian Gulf Conflict. When alaunch was detected, planners would examine pre-existing SPOT pictures of the launch area, looking forlikely launcher sites.59
Submerged submarines, an important target ofbroad area search at sea60, could conceivably be seenby civilian satellites equipped with Synthetic ApertureRadar. Though the radar waves themselves can pene-trate seawater only a little, their presentation of
disturbances on the surface, potentially includingsubmarine wakes, would allow them to detect subma-rines indirectly.6l Diverse alternate traces of subma-rines’ passage, such as changes in the water’s tempera-ture or even its plankton population, have receivedintermittent attention over the years. 62 Conceivablysome such phenomenon could someday be detected bya civilian satellite. Surfaced submarines would bealmost as readily detectable as ships of the same size.
The principal drawback of civilian satellite sensingsystems (and, indeed of most systems!) for broad areasearch is the large number of pictures needed tocomplete the search. This large number, in turn,translates into time and money.
For example, the former Soviet Union coveredabout 10 million square miles. A complete search ofthat territory by Landsat would require about 1,000pictures, obtained at a cost of $1 million over manypciture months.63 The subsequent analysis of the Pictures
would add more time and cost to the project. SPOTpictures are less expensive per image, but cover lessarea (albeit at a higher resolution). Use of SPOTpictures would more than double the price: it takes nineSPOT scenes to cover a single Landsat scene.
These daunting figures suggest that true broad areasearch might not be done very often. More likely, afocused search, based on prior information such as thelocations of cities, rivers, and coastlines, would beperformed. Even so, a Landsat survey of the over 4,500airfields in the former Soviet Union would, with one
M Skone, Op. cit., footnote 27, P. 90
57 Ibid., p, 86.
s~ Ibid., p. 48.
59 Craig Covault, ‘ ‘USAF Urges Great Use of SPOT Based on Gulf War Experience, “ A]’iution Week and Space Technology, July 13, 1992,p. 65.
m nc m~ern defe~se hterature contains numerous descriptions of the dramatic change that would come about if ‘the oceans were madetransparent. ” In most cases, the authors have broad area search, not support of combat operations, in mind-they are concerned thatballistic-missile launching nuclear submarines (S SBNS), whose deterrent mission rests on the other side’s ignorance of their whereabouts,would become locatable.
61 Crmg Covault, ‘ ‘Soviet Radar Satellite Shows Potential to Detect Submarines,’ Aviation Week and Space Technology, (M. 8, 1990, pp.22-23,
62 se ~omm Stefanlck, ,~~ategic Ann”~ubman”ne wa~are ~~ NaV,a[ s~a~egy, ~~gton, MA: Gxing[on BOOkS, 1 9 8 7 ) , especidy
app. 3.C3 While ~ndsat would ~Wu~e o~y weeks [o orbit over ~ch scene, it could take mon~ or even years to collect a Complete Set Of
clear-weather daylight pictures. Recall Skorve’s experience in imaging the Kola Peninsula.
158 I Remote Sensing From Space
picture each, cost $18 million.64 In this case, use ofSPOT would be more economical, because an airfieldwould fit inside a single scene, negating SPOT’sdisadvantage of having a smaller scene size: the SPOTversion of this search would cost only $4.5 million.
Searches at sea highlight another problem as well.Not only would an Almaz search of the 400,000-square-mile Sea of Japan (an antisubmarine warfare arena ofmodest size) have required 640 25x25-km scenes at atotal pre-analysis cost of about a million dollars, but itwould have taken at least a week to complete65—toolong to be of use in many antisubmarine warfarescenarios.
A new broad-area search mission has arisen withincreasing military involvement in countering thenarcotics trade: searching for fields of illegal drugs.According to a United Nations report,
. . . it would be feasible to develop a global system forlocating cultivation of illicit narcotic crops by space-borne remote sensing devices but that preliminaryactivity would need to include inspection on the groundat selected test sites to verify the accuracy of informa-tion interpreted from satellite photography.66
Presently, there is great interest in detecting coca (fromwhich cocaine is derived) planted in South America.Created as a land-use sensor, Landsat would seemideal for this mission, However, coca turns out to be adifficult crop to monitor. MSS and TM differentiatebetween vegetation and other features by detecting keysubstances such as chlorophyll, other pigments, colorin general, water content, and even leaf structure:67 Itturns out that the contrast from the minor chlorophylldifferences among coca and other local plants such ascitrus fruits is small.
Not only is coca’s multispectral signature similar tothat of other plants in the area, but the agricultural
practices of the coca growers can stymie detection:they interplant coca with other crops, and even grow itin patches covered by a tree canopy. Coca tends to beproduced in small plots, commonly a half a hectare totwo hectares-so small-sized plots would be too smallto dominate a pixel,68 increasing the probability thatsurrounding features will overshadow evidence ofcoca. Also, other interfering features (e.g., smoke,clouds) can interfere with satellite detection. Largemarijuana fields, however, generally create an easierLandsat target.
Indications and Warning—The indications andwarning mission (I&W) is very demanding, and policymakers would certainly like to be able to spread itamong as many systems as possible. Table C-6 lists avariety of targets similar to those that might beroutinely imaged in the performance of the I&Wmission.
While aircraft are visible in Banner’s SPOT picturesof Kabul airport, they become much more apparentwhen one panchromatic image of the airport is overlaidon another, with false color added to highlightdifferences. Then the moved aircraft-which appearonly in one image or the other and are hence brightlycolored-become quite obvious not only through theircolor and shape but through their placement on rampsand runways where any large movable object would bepresumed to be an aircraft.
Banner’s SPOT-aided discovery that trucks had lefta military encampment near Kabul deserves specialnote for two reasons. First, Banner’s knowledge thatthe site was a military camp, and that it housed theSoviet 108th Motorized Rifle Division, was not gainedvia satellite imagery: it was collateral information,
openly available, that aided him in his photointer-pretation. Second, the size of an individual vehicle
~ ASS- that no two ~lelds are close enough to fit into the same picture. In facti near cities two or three airfields might exist in the
same Landsat scene. However, this effect is not strong enough to alter the conclusions of this calculation. Skorve’s 17-picture Landsat Kolaatlas shows an average of only slightly more than one airbase per picture (not counting duplicate views of the same base in overlapping pictures)even though Kola is a very militarized region and even though some pictures show as many as four or five bases.
~ Almazfacts fromAviarion Week and Space Technology, Oct. 8, 1990; area of the Sea of Japanffom 1990 World Almana c. Almaz’s imageprocessing facility in Moscow is projected to be able to handle about 100 images per day.
66 UN ~termtio~ Narcotics Control Board Report for 1990, 1/91.
ST Kennedy, op. cit., footnote 38.
@ A hectare is 10,OOO ~uare meters, or about 2.5 acres. An 80 x 80 meter pixel is thus 0.64 hectares in are% and itS boundaries wodd not
necessarily be aligned with those of the planted plot. Even adjacent small coca plantings may not add up to a discernible target because theyare owned by different growers, who cultivate them in different ways. Thus the signature of an unhamested field may be diluted by that of anadjacent harvested field.
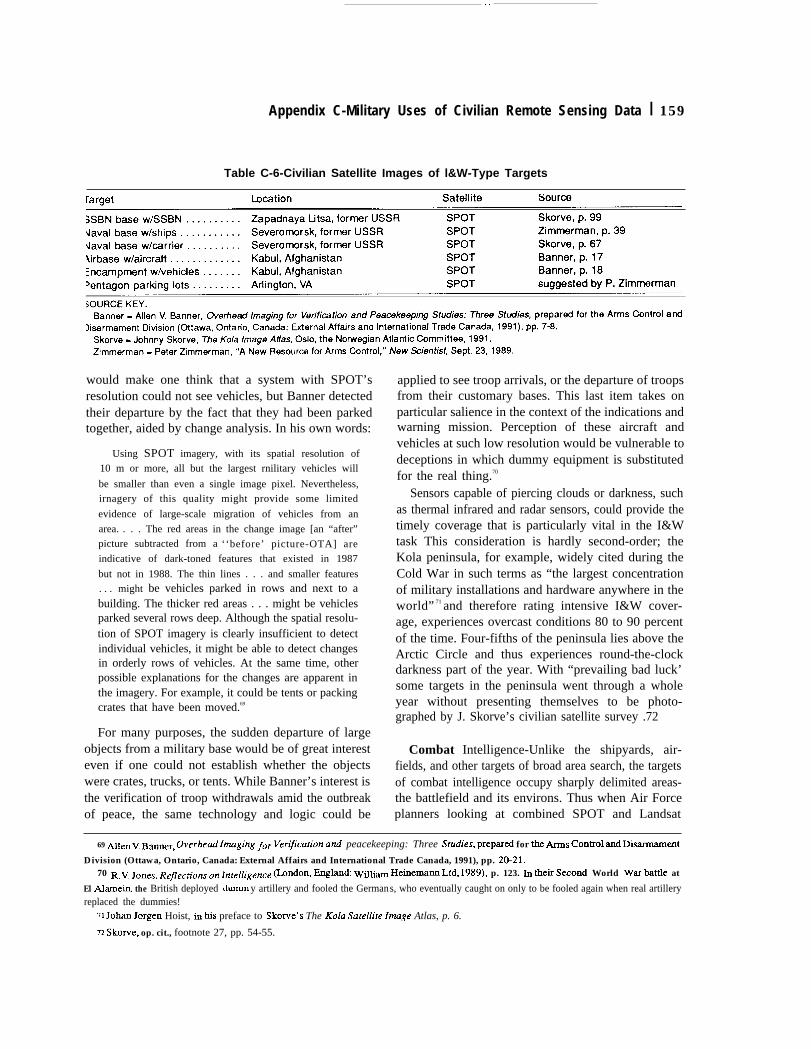
. . . . .
Appendix C-Military Uses of Civilian Remote Sensing Data I 159
Table C-6-Civilian Satellite Images of l&W-Type Targets
would make one think that a system with SPOT’sresolution could not see vehicles, but Banner detectedtheir departure by the fact that they had been parkedtogether, aided by change analysis. In his own words:
Using SPOT imagery, with its spatial resolution of10 m or more, all but the largest rnilitary vehicles will
be smaller than even a single image pixel. Nevertheless,irnagery of this quality might provide some limited
evidence of large-scale migration of vehicles from an
area. . . . The red areas in the change image [an “after”picture subtracted from a ‘‘before’ picture-OTA] areindicative of dark-toned features that existed in 1987
but not in 1988. The thin lines . . . and smaller features. . . might be vehicles parked in rows and next to abuilding. The thicker red areas . . . might be vehiclesparked several rows deep. Although the spatial resolu-tion of SPOT imagery is clearly insufficient to detectindividual vehicles, it might be able to detect changesin orderly rows of vehicles. At the same time, otherpossible explanations for the changes are apparent inthe imagery. For example, it could be tents or packingcrates that have been moved.69
For many purposes, the sudden departure of largeobjects from a military base would be of great interesteven if one could not establish whether the objectswere crates, trucks, or tents. While Banner’s interest isthe verification of troop withdrawals amid the outbreakof peace, the same technology and logic could be
applied to see troop arrivals, or the departure of troopsfrom their customary bases. This last item takes onparticular salience in the context of the indications andwarning mission. Perception of these aircraft andvehicles at such low resolution would be vulnerable todeceptions in which dummy equipment is substitutedfor the real thing.70
Sensors capable of piercing clouds or darkness, suchas thermal infrared and radar sensors, could provide thetimely coverage that is particularly vital in the I&Wtask This consideration is hardly second-order; theKola peninsula, for example, widely cited during theCold War in such terms as “the largest concentrationof military installations and hardware anywhere in theworld” 71 and therefore rating intensive I&W cover-age, experiences overcast conditions 80 to 90 percentof the time. Four-fifths of the peninsula lies above theArctic Circle and thus experiences round-the-clockdarkness part of the year. With “prevailing bad luck’some targets in the peninsula went through a wholeyear without presenting themselves to be photo-graphed by J. Skorve’s civilian satellite survey .72
Combat Intelligence-Unlike the shipyards, air-fields, and other targets of broad area search, the targetsof combat intelligence occupy sharply delimited areas-the battlefield and its environs. Thus when Air Forceplanners looking at combined SPOT and Landsat
69 Al]en v. B-~r, @erhe&I~8i~~ for Venfi”cation ad peacekeeping: Three s(~ies, prepar~ for the kIIIS Control ~d D~~t
Division (Ottawa, Ontario, Canada: External Affairs and International Trade Canada, 1991), pp. 2(P21.70 R.V, Jona, Reflec~jonS on ~nte~~jgence @ndon, Eng~d: Wilm Heine~M Ltd, 1989), p. 123. h their second World WU <fle at
El Alamein+ the British deployed durnm y artillery and fooled the Germans, who eventually caught on only to be fooled again when real artilleryreplaced the dummies!
T] Jo~ Jorgen Hoist, h tis preface to Skome’s The KokI Satellite ]~ge Atlas, p. 6.
72 Skone, op. cit., footnote 27, pp. 54-55.
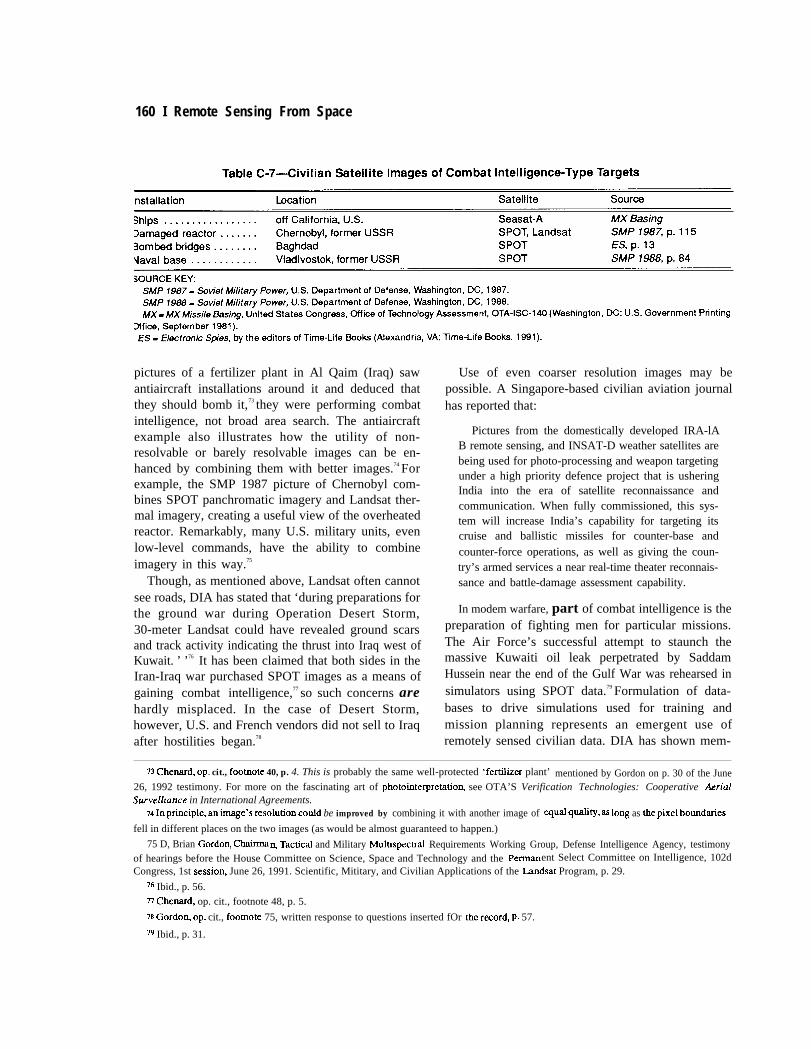
160 I Remote Sensing From Space
pictures of a fertilizer plant in Al Qaim (Iraq) sawantiaircraft installations around it and deduced thatthey should bomb it,73 they were performing combatintelligence, not broad area search. The antiaircraftexample also illustrates how the utility of non-resolvable or barely resolvable images can be en-hanced by combining them with better images.74 Forexample, the SMP 1987 picture of Chernobyl com-bines SPOT panchromatic imagery and Landsat ther-mal imagery, creating a useful view of the overheatedreactor. Remarkably, many U.S. military units, evenlow-level commands, have the ability to combineimagery in this way.75
Though, as mentioned above, Landsat often cannotsee roads, DIA has stated that ‘during preparations forthe ground war during Operation Desert Storm,30-meter Landsat could have revealed ground scarsand track activity indicating the thrust into Iraq west ofKuwait. ’ ’76 It has been claimed that both sides in theIran-Iraq war purchased SPOT images as a means ofgaining combat intelligence,77 so such concerns arehardly misplaced. In the case of Desert Storm,however, U.S. and French vendors did not sell to Iraqafter hostilities began.78
Use of even coarser resolution images may bepossible. A Singapore-based civilian aviation journalhas reported that:
Pictures from the domestically developed IRA-lAB remote sensing, and INSAT-D weather satellites arebeing used for photo-processing and weapon targetingunder a high priority defence project that is usheringIndia into the era of satellite reconnaissance andcommunication. When fully commissioned, this sys-tem will increase India’s capability for targeting itscruise and ballistic missiles for counter-base andcounter-force operations, as well as giving the coun-try’s armed services a near real-time theater reconnais-sance and battle-damage assessment capability.
In modem warfare, part of combat intelligence is thepreparation of fighting men for particular missions.The Air Force’s successful attempt to staunch themassive Kuwaiti oil leak perpetrated by SaddamHussein near the end of the Gulf War was rehearsed insimulators using SPOT data.79 Formulation of data-bases to drive simulations used for training andmission planning represents an emergent use ofremotely sensed civilian data. DIA has shown mem-
73 Cheud, op. cit., footnote 40, p. 4. This is probably the same well-protected ‘fetitier plant’ mentioned by Gordon on p. 30 of the June26, 1992 testimony. For more on the fascinating art of photointerpretatio~ see OTA’S Verification Technologies: Cooperative AerialSurvelliance in International Agreements.
74 ~p~ciple, an ~age’s ~solutlon co~d be improved by combining it with another image of Wud quati~, as long as the P~el bound~es
fell in different places on the two images (as would be almost guaranteed to happen.)
75 D, Brian Gordoq Chairma % TacticaJ and Military Multispectral Requirements Working Group, Defense Intelligence Agency, testimonyof hearings before the House Committee on Science, Space and Technology and the Permanent Select Committee on Intelligence, 102dCongress, 1st sessio~ June 26, 1991. Scientific, Mititary, and Civilian Applications of the Landsat Program, p. 29.
76 Ibid., p. 56.77 che~d, op. cit., footnote 48, p. 5.
78 Gordo~ op. cit., foomote 75, written response to questions inserted fOr the rword, P. 57.
79 Ibid., p. 31.
Appendix &Military Uses of Civilian Remote Sensing Data I 161
bers of Congress a few minutes of video tapeportraying a simulated pilot’s eye view of a flyaroundof Kuwait City and the neighboring Faylakah Island.Landsat, SPOT, and Resurs-F images were combinedto create this tape.80 A published example shows howan original SPOT picture of Baghdad can be turnedinto a pilot ’s-eye view of the approach to a target,complete with antiaircraft guns and annotations show-ing the locations of sites to avoid hitting, such asschools and mosques.81
An important part of combat intelligence relates toMC&G: the creation of databases for guidance sys-tems. While the creation of map patches used byTERCOM, for example, could well be categorized asMC&G, the scenes used by the pilot or DSMAC(Digital Scene Matching and Correlation) properlybelong to the realm of combat intelligence.
As mentioned in the description of the nascentIndian capabilities, the combat intelligence missioncontinues after the attack is made. Bomb damageassessment must be performed to see if the targetmerits another attack. The entry in table C-7 regardingthe damaged reactor at Chernobyl represents a possiblebomb damage assessment mission, but the readershould be aware that bomb damage assessment isnotoriously difficult even with the best of sensors, andthat civilian satellites are unlikely to play any appre-ciable role in bomb damage assessment in the foresee-able future. 82
In performing the combat intelligence missionduring coalition warfare such as that prosecuted by our
side during the war with Iraq, civilian satellites havethe advantage that their product can be released toforeigners allied with the United States.83 It can also bedistributed near the front without fear of compromis-ing the capabilities of highly classified systems ifcombat intelligence documents are captured.
Arms Control Agreement Monitoring—’’Pol-itics, ’ as Prince Bismarck said, ‘‘is the art of thepossible. ”84 For this reason, arms control agreementsare, to a large degree, crafted so as to be verifiable atthe limits of available technology .85 The SALT armscontrol agreements
86 dealt with large objects such as
submarin es and missile silos. President Jimmy Cartersaid, during the SALT era, that “Photoreconnaissancesatellites have become an important stabilizing factorin world affairs in the monitoring of arms controlagreements. ’87 Increased arms control ambitions andimproved verification technology (as well as thenewfound acceptability of on-site inspection) nowcombine to create agreements such as START, inwhich constraints are applied to the payloads ofmissiles deployed underground.
Present-day civilian satellites seem hardly capableof verifying even yesterday’s arms control agreements.For example, SALT specified that an intercontinentalballistic missile (ICBM) would be deemed to be of a“new type” if its dimensions (or, more accurately, thedimensions of its silo launcher) differed from those ofits predecessor by more than 5 Percent.** Such atolerance---less than 1 meter89cannot be measured
w Ibid., p. 37.81 Covault, Op. cit., footnote 59, pp. 61, 63.
82 Swre- of Defeme Dick Cheney, Conduct of the persian Gulf Conflict: An Interim Report to Congress, p. 14-2, and conduct of the
Persian Guy War: Final Report to Congress, pp. C-14 to C- 16.
83 Gordo~ op. cit., footnote 75, p. 28.84 The O@ord Dlctiomry of Quo[afzon$, 4th editioq Angela partington (~.) (oxford, ~: Oxford University press, 1992), p. 84.
85 Ide~ly, tw~olo= ~ou]d be develo~ ~th an eye to -g v~fiable those agr~en~ that wme desirable for other reasons. See U.S.
Congress, Office of Technology Assessment, Verification Technologies: Managing Research and Development for Cooperative Arms ControlMonitoring Measures, OTA-ISC-488 (Washington DC: U.S. Government Printing Office, May 1991).
66 From t~y~s perspective S~T I includ~ the signed ~d ra~i~ MM Treaty and tie ~terirn Agreement on Offensive AllIIS. SfiT H
was signed but never ratified. All continue to figure in today’s arms-control compliance debate, even though time spans stated in the InterimAgreement and SALT II have now elapsed. START, signed but not yet ratified, subsumes many of the SALT provisions that have lived onpast their officiat lifetimes.
.87 SpeWh by fiesldent Jimmy Carter, at the Kemedy Space Center, Oct. 1, 1978.
88 ~ter, Comlderab]e contention would ~se over tie quesiton of whether (his proviso ~fe~d to finear dimensions Or tO VOIUme. b tie
present context, this important consideration is irrelevant.89 Not because 5 ~rcent of the dlametm is less tin a meter, but ~~use tie difference between WI a~owable 5 p~cent change and an illegal
6 percent change is less than 1 meter. This important point is made by Zimmerrnam op. cit., footnote 22, p. 41.

162 I Remote Sensing From Space
by today’s civilian satellites, though they could see theconstruction equipment present during silo modifica-tion if they looked at the right time.
However, civilian remote sensing satellites are notwithout utility in arms control verification (table C-8).They can, for example, locate facilities deservinggreater attention from other treaty-monitoring sys-tems, including onsite inspection. Jasani’s analysis ofSS-25 sites in the former Soviet Union brings to lightseveral discrepancies between the site plans submittedby the Soviet side and the actual layouts of the sites.The INF Treaty protocol allows for the revision of datasubmitted in the data exchanges (Article IX.3), andSPOT-derived indications that such revision was inorder could be freely shown to CIS representatives.
| The View From the Other SideSo far this analysis has been one-sided, addressing
only the benefits the U.S. military could derive fromcivilian remote sensing satellites. In this section weshall turn to the view from the other side—ways inwhich an adversary could diminish the utility of thesesatellites to the United States military, and ways inwhich he could avail himself of their services to themilitary detriment of the United States.
CAMOUFLAGE, CONCEALMENT, AND DECEPTION(CC&D)90
Sun-Tzu Wu, the ancient Chinese military writer,maintained that deception was the cornerstone ofsuccessful military planning. More recently, the erst-while Soviet military emphasized the role of mas-kirovka, a military art grouping under one tarpaulin theWestern notions of camouflage, concealment, anddeception. 9l The Soviets’ confederated successors andThird-World understudies doubtless attach similarimportance to these dissimulative practices.
“Camouflage is the technique of hiding from viewthat which is physically present,”92 and includes themottled paint and nets festooned with fresh-cut branches
familiar to us from war movies and television, andother techniques of making the objects of interestblend in with the ground.
“Concealment” includes other means of avoidingdetection. In the case of radar satellites such as Almaz,concealment could be accomplished by jamming—beaming junk radio waves of the correct frequency atthe satellite. Such jamming would ‘‘appear as darkstatic interference on imagery and [would] usuallycover the entire section of imagery in the area ofcoverage. ’93
“Deception is the technique of making what isphysically present appear to be something differ-ent. ’94 It includes the use of dummies and decoys.‘‘Dummies are imitations of actual objects or installa-tions, usually composed of dummy weapons, emplace-ments, vehicles, and equipment, They are designed tosimulate real activity and draw fire away fromcamouflaged or concealed activities. Decoys are lureslocated in logical military positions but far enoughfrom actual targets to prevent fire directed against themfrom hitting the real sites, ’ ’95 Interestingly, a decoy ordummy must—for realism’s sake-be camouflaged,though not so well as to prevent it from being seen!
Military applications of civilian remote sensing thatuse the sensors’ utmost spatial resolution and relyheavily on the deductive powers of the end user couldbe deceived by the crudest of CC&D operations:10-meter resolution could hardly hope to discriminatea decent dummy from the real thing. However, civiliansatellites’ spectral resolution could come to the rescue:painted-on foliage might look realistic in the visible-light portion of the spectrum, but only the fanciestcamouflage nets maintain their deception into the nearinfrared. Thermal infrared provides yet another view,one very difficult to mask. The detection of these, andof CC&D efforts in general, is aided greatly ifcomparative covers (multiple images of the sameregion) are available: comparison of a current image toan archive picture taken much earlier immediately
LX) sm ~~o OTA~S Verification Technologies, op. cit. footnote 19, esp=idly ch. 3 and WP. B.
!31 s=, for ~mple, Cmufiuge: A Soviet View, ~oviet Milltaq Th~~ght, no. 22, ~mlated and published under the auspices of the U.S.
Air Force (Vhshingtom DC: U.S. Government Frinting OffIce, 1989). This volume is comprised of two Soviet books on maskirovka.~ Soldier’s ~n~ Skill Level I, op. cit., footnote 21, p. 2-298.
93 Ibid., p. 2-484.
~ Ibid., p. 2-298.
93 Ibid., p. 2-236.
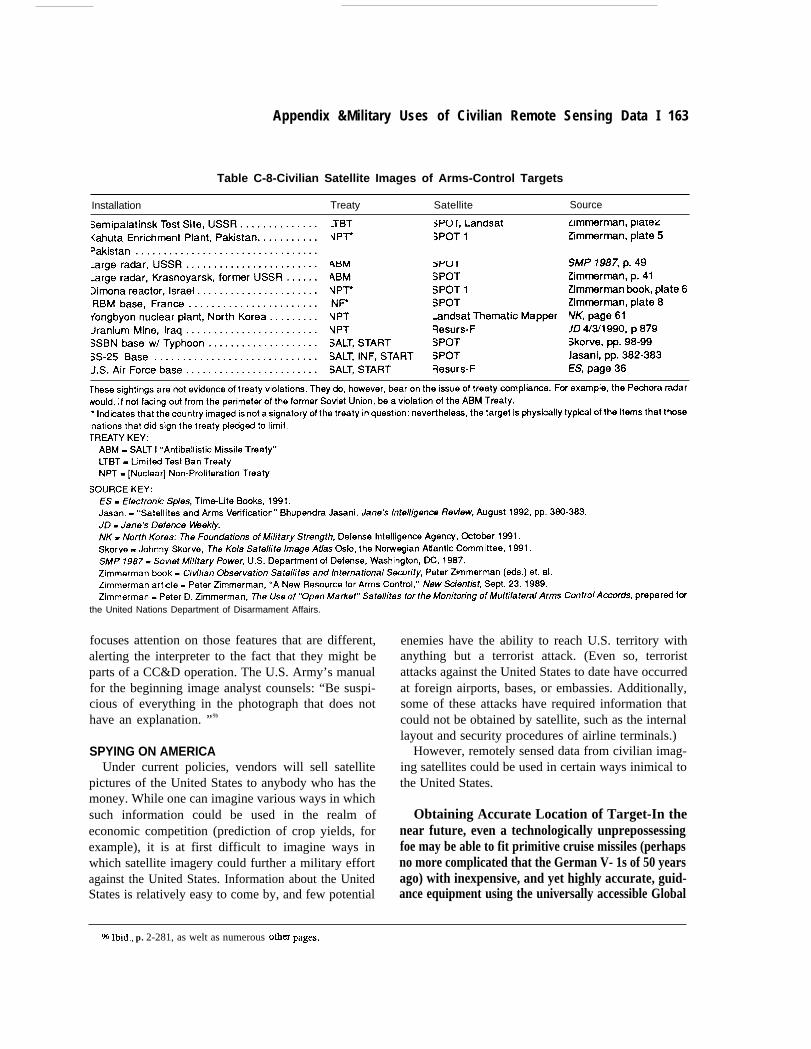
Appendix &Military Uses of Civilian Remote Sensing Data I 163
Table C-8-Civilian Satellite Images of Arms-Control Targets
Installation Treaty Satellite Source
the United Nations Department of Disarmament Affairs.
focuses attention on those features that are different,alerting the interpreter to the fact that they might beparts of a CC&D operation. The U.S. Army’s manualfor the beginning image analyst counsels: “Be suspi-cious of everything in the photograph that does nothave an explanation. ”9b
SPYING ON AMERICAUnder current policies, vendors will sell satellite
pictures of the United States to anybody who has themoney. While one can imagine various ways in whichsuch information could be used in the realm ofeconomic competition (prediction of crop yields, forexample), it is at first difficult to imagine ways inwhich satellite imagery could further a military effortagainst the United States. Information about the UnitedStates is relatively easy to come by, and few potential
enemies have the ability to reach U.S. territory withanything but a terrorist attack. (Even so, terroristattacks against the United States to date have occurredat foreign airports, bases, or embassies. Additionally,some of these attacks have required information thatcould not be obtained by satellite, such as the internallayout and security procedures of airline terminals.)
However, remotely sensed data from civilian imag-ing satellites could be used in certain ways inimical tothe United States.
Obtaining Accurate Location of Target-In thenear future, even a technologically unprepossessingfoe may be able to fit primitive cruise missiles (perhapsno more complicated that the German V- 1s of 50 yearsago) with inexpensive, and yet highly accurate, guid-ance equipment using the universally accessible Global
w ~id., p. 2-281, as welt as numerous Other pagw.

164 I Remote Sensing From Space
Positioning System (GPS).97 Such accurate guidanceengenders a need for accurate knowledge of thetarget’s location, because otherwise the accurate guid-ance is wasted. A typical target would be a building ona military base. A SPOT or other image with goodmetric data would allow for accurate GPS-basednavigation of the missile to the target.
Testing CC&D Methods-The practitioner ofCC&D, especially that directed against civilian imag-ing satellites, could test the efficacy of his methods byrequesting imagery of test targets, in his own territory,incorporating his CC&D methods. In this way hewould be spying not on America’s territory, but on hercivilian detection capabilities vis-a-vis his denialtechniques.
Observation of Denied Areas---Despite America’soverall character as an open society, there exist manygood-sized military reservations to which access isdenied. These could be probed through the use ofsatellite photography.
| Market Motives and Military MissionsTechnical progress is possible in all facets of remote
sensing technology+ specially in the four basicparameters, spatial and spectral coverage and reso-lution—but civilian satellites’ designs are based ontradeoffs among these and other desirable characteris-tics. These tradeoffs are made on the basis of civilianscience and commercial demands. Assuming that thedesign of future systems is not shaped by militaryrequirements recycled into the commercial marketplace,will civilian satellites, through technical progress,become ever-more suited to military missions?
Almost any technological improvement in civilianremote sensing technology will have some militarybenefit, but the principle defect of civilian satellites formilitary remote sensing-their untimely responsive-ness—is unlikely to be remedied unless the designersof civilian satellites accede explicitly to their militarycustomers’ demands. In the civilian world, timelinessmeasured in days or weeks is perfectly acceptable formost applications: geology and topography aren’tgoing anywhere, and pictures of crops, evanescent
though their subjects may be, can often be scheduledfar in advance because planting and harvesting occuron strict schedules.
Interestingly, arms control missions-in whichcivilian satellites do not now perform conspicuouslywell because of their limited resolutio~may be verywell-served by the civilian satellites of the future.Market forces will almost certainly push satellites tofiner resolutions, and the arms control mission requiresno greater a timeliness than do many civilian missionsbecause arms control verification takes place on adiplomatic, not a military, time scale. However, thehigh resolutions desired by the arms<ontrol customerwould have little use for nonmilitary missions andwould pressure the satellite’s design away from thebroad-area coverage desired for the nonmilitary mis-sions.
Might a satellite optimized for military uses be builtand launched as a commercial venture? Such a“mercsat’ is already in the advanced planning stage:a U.S. company has proposed to build, launch, andoperate a satellite for a foreign customer, providingdata with l-meter resolution98 and other such dealshave been contemplated.99 This arrangement is not anexport of anything but the data, because the foreigncustomer would at no time lay hands on the satellite orits
|
1.
2.
controls.
FindingsCivilian satellites such as Landsat, but most notablySPOT and Resurs-F, have considerable militaryutility. Imagery from these assets can and has beenused to support military operations. Their utility forarms control is limited. Technical progress, espe-cially in spatial and spectral resolution, continues toimprove the military utility of successive genera-tions of these satellites.Civilian satellites’ use to date for military recon-naissance suggests that post-processing, skilledinterpretation, and the use of collateral informationcan make even fuzzy pictures informative. For thisreason, the civilian satellites’ in reconnaissanceexceeds that which might be expected on the basisof ground resolution—a simplistic, though custom-
~ K~s@ Tsip:s, New York Times, Apr. 1, l~z, P. ~5.
98$ ‘Efitw Want TO Buy U.S. Spy Satellite,” Space News, vol. 3, No. 43 (Nov. 16-22, 1992), p. 1.99 wil~ J. Bm~, “3 Natiom Seek To Buy Spy Satellita, Causing a pOhW ~t kl U.S.,’ New York Times, Nov. 23, 1992, p. A7.
.. .
Appendix C-Military Uses of Civilian Remote Sensing Data I 165
ary, measure of capability-and the highly conser-vative rules of thumb normally used to relate it tosuitability for particular reconnaissance tasks.
3. However, reconnaissance missions’ requirementsfor timeliness often exceed the current capabilitiesof civilian satellite systems. Because civilian mis-sions’ timeliness requirements are relatively laxcompared to military ones, civilian satellite sys-tems will continue to fall short in this regard unlessthey begin to cater expressly to the military market.
4. Foreign ownership of the most capable civilianremote-imaging satellites brings into play the usualforeign-source considerations: the United Statescould be denied access to imagery for politicalreasons, and the assets could well be operated inways inimical to U.S. interests, and so on. Restora-tion of U.S. technical dominance in the commercialremote-imaging field could allay these fears.
5. Though the possibility of using Landsat, SPOT, and
Resurs-F data to sense enemy forces springs most
readily to mind when one speaks of military uses of
civilian sensing, the military needs accurate mete-
orological data as well . These, too, come from
civilian satellites as well as from the military’s own
weather satellites.
6. Mapping—including precise measurement of the
geoid itself—is a civilian mission with important
mil i tary applicat ions. These applicat ions include
simulation, training, and the guidance of automated
weapons. Mapping to date falls short of what most
people might imagine, both in terms of coverage
and of precision. A more capable system, perhaps
a interferometric SAR, would remedy this shortfall.
7 . M a n y u s e s , c iv i l i an and mi l i t a ry , o f r emote ly
sensed Earth data require that one be able to mix,
m a t c h , c o m p a r e , c o n t r a s t , c o m b i n e , a d d ,
or subtract data from different sources. While such
operations are hampered by the plethora of different
formats and media in which the data are collected
and stored, this lack of standardization poses no
insuperable obstacles-data from such diversesources as Landsat, SPOT, and even the Russian
Almaz are routinely combined once an initiallearning period has passed. Moreover, in recentaction by the executive branch, the Secretary ofDefense and the Director of Central Intelligencehave chartered a new Central Imagery Office.lm
Specifically included in its responsibilities are theareas of imagery formats, standardization, andinteroperability.
| Issues for Congress1. Standardization: Is there need for Federal action
to regularize Earth data reporting formats andmedia? If so, ought action to be taken by theexecutive or the legislative branch?
2. Competitiveness: Civilian satellites such as Land-sat, but most notably SPOT and Resurs-F, haveconsiderable military utility. Imagery from theseassets can and has been used to support militaryoperations. Is potential loss of this military market,by EOSAT to foreign suppliers a national competi-tiveness concern?
3. Threats to Security: The United States could bedenied access to imagery for political reasons, andthe assets could well be operated in ways inimicalto U.S. interests. Putting the shoe on the other foot,other countries could use civilian images of theUnited States or its foreign military deployments toplan their attacks. Can the U. S., through itsLandsat program, take action to prevent or detersuch operation?
4. Entanglement: Foreign belligerents can, and prob-ably have, buy Landsat pictures (or use GPS data)to further their wars against each other. They mighteven buy them to prepare for a war (or terrorism)against the United States or its allies, fulfillingLenin’s prophecy that the capitalist would sell therope that would be used to hang him. How shouldthe United States respond to indications that suchactivity might be in the offing? Could the UnitedStates detect that such use of Landsat images wasbeing made?
lm Dep~ent of Defense Directive 5105.56, MY 6, 1992.

Appendix D:Non-U.S. Earth
ObservationSatellite
Programs
M any countries routinely use satellite remote sensing for landplanning, weather forecasting, environmental monitoring,and other purposes. Most of these countries share data withthe United States, neighboring countries, and international
organizations. This appendix summarizes the remote sensing systemsof other countries and organizations.
EUROPEDevelopment of remote sensing spacecraft in Europe is under the
management of the European Space Agency (ESA), a consortium of 13member states-Austria, Belgium, Denmark, Germany, France, Ire-land, Italy, The Netherlands, Norway, Spain, Sweden, Switzerland, andthe United Kingdom. Finland has ESA Associate Member status, andthere is an agreement for close cooperation with Canada. Since ESA’Sinception in May 1975, it has pursued an Earth observation program.
Meteosat/MOPESA’S Earth observation program was based initially on a series of
pre-operational meteorological satellites, called Meteosat. 1 The first—Meteosat l—was launched in November 1977 and placed in ageostationary orbit, but suffered an onboard imaging failure after twoyears of service. A second pre-operational Meteosat was launched inJune 1981. Yet another of the series, a Meteosat P2 (a refurbishedengineering model for the pre-operational series), was deployed in June1988.
The first spacecraft of the Meteosat Operational Programme (MOP-1) was launched in March 1989 and carried four independent imaging
‘ What’s the Forecast? The European Space Meteorology Operational Programme,European Space Agency, ESA F-01, 2nd Edition, ESTEC, Noordwijk, The Netherlands,January 1989.
167

168 I Remote Sensing From Space
channels. MOP-2 was orbited in March 1991,2 andMOP-3, the sixth spacecraft of the Meteosat series,will be ready for launch in late 1993. It will have anexpected seven-year life.
The MOP satellites are developed and operated byESA on behalf of the European Organisation for theExploitation of Meteorological Satellites (Eumetsat).3
Formed in January 1987, Eumetsat is composed of 16member states: Belgium, Denmark, Finland, France,Germany, Greece, Ireland, Italy, The Netherlands,Norway, Portugal, Spain, Sweden, Switzerland, Tur-key, and the United Kingdom. Eumetsat manages theoperational Meteosat program, while ESA procures,launches and operates the spacecraft on a reimbursablebasis for Eumetsat. In general, the Meteosat/MOPspacecraft design, instrumentation, and operation aresimilar to the U.S. NOAA SMS/GOES spacecraft. Thespin-stabilized spacecraft carry:
●
●
a visible-infrared radiometer to provide high-quality day/night cloud cover data and to takeradiance temperatures of the Earth’s atmosphere,anda meteorological data collection system to dis-seminate image data to user stations, to collectdata from various Earth-based platforms, and torelay data from polar-orbiting satellites.
The satellite’s principal payload is a high-resolutionradiometer. This instrument allows imaging of theEarth in three spectral bands: visible light; thermalinfrared; and infrared “water vapor” (see table D-l).
Meteosat spacecraft are positioned to survey thewhole of Europe, as well as most parts of Africa, theMiddle East and the Atlantic Ocean. The satellitesrelay images and data to the Meteosat OperationsControl Centre within ESA’S Space Operations Con-trol Centre in Darmstadt, Germany. The Meteorologi-cal Information Extraction Centre, located within theMeteosat control center, distributes the satellite data tovarious users.
Meteosat is part of a program involving fourgeostationary satellites (nominally, two American, oneEuropean and one Japanese) that constitutes the basisof the World Weather Watch of the Global Atmos-phere Research Program. Data from the Meteosatseries is received in Europe directly from the satellitesand relayed to the United States.4 Meteosat data areused in various international research projects. Re-cently, as the result of an agreement between Eumetsatand NOAA, ESA moved Meteosat to a position of75oW longitude in order to provide better coverage ofthe United States (see ch. 3).5
EumetsatEumetsat manages the Meteosat series of geosta-
tionary satellites and is NOAA’s partner in thefollow-on NOAA-K, L, and M satellites. Eumetsat isheadquartered in Darmstadt, Germany, and is estab-lishing a remote sensing ground infrastructure, includ-ing data processing and archives. Eumetsat is develop-ing user access policies for full and open access to datain the meteorological tradition, but is also providingincentive for European countries to become membersand share the financial burden of maintaining andimproving operational meteorological services. Non-member countries are likely to pay for data throughroyalties or license fees. Encryption of satellite datawould allow enforcement of any Eumetsat pricingpolicies. 6
The Meteorological Information Extraction Centrein Darmstadt develops products in support of theInternational Satellite Cloud Climatology Project, withselected products supplied to the Global Telecommu-nications System of the World Meteorological Organ-ization (WMO) as part of the World Weather Watch.These data are archived at ESA’S Operations ControlCentre, which also controls and operates the Meteosatsatellites for Eumetsat.
European Remote Sensing Satellite (ERS)The ERS-1 satellite was launched into polar orbit by
an Ariane booster in July 1991 and was declared
2 MOP-2: A4eteosat Operational Programme, ESA/EUMETSAT, European Space Agency, ESA C-6, January 1991.3 c ~ESA H~d~ over Met~~at.5 to E~TSAT, ” ESA News Release, No. 2, EuropMn Space Agency, Paris, France, Jan. 14, 1992.
d NOAA archives Meteosat data for use in the U.S.5< *Metmsat.3 t. tie Rescue , . . of NOM,” in ESA Newsletter, No. 9, European Space Agency, Paris, France, November 1991.6 Lisa R. Shaffer, “The Data Management Challenge,” presented at Annual Meeting of the American Association for the Advancement
of Science, Washington, DC, February 1991.

Appendix D-Non-US. Earth Observation Satellite Programs I 169
Table D-l—Spectral Coverage of Selected Remote Sensing Satellites
* Antlclpatcd launch
170 I Remote Sensing From Space
Table D-l-Spectral Coverage of Selected Remote Sensing Satellites-Continued
7 c t~s- I Now Ddi3KxI Operational, “ ESA News Release, European Space Agency, Paris, France, Jan. 27, 1992.

..
Appendix D—Non-U.S. Earth Observation Satellite Programs I 171
Satellite
Speectral Coverage
Ultraviolet
Blue
Green
Red
Near Infrared
Mid Infrared
Thermal IR
Microwave
Panchrornatic
Meteor 2CISNumerous
NIA
NIA
.50-,70
NIA
NIA
8-12(8 km rcs.)
141-18,7(30 km rcs)
NIA
N/JA
Meteor-3CIS8-91
.5 km
2600 km
.25-,38(3-5 km rcs)N/A
.50-,80
NIA
NIA
10-12.5011.5012.50
9.65-187(42 km rcs)
NIA
N/A
CIS2.90
N/A
NIA
50-.60
60-70 (2channels)
70-80.80-1 10
1050-11501150-1250
NIA
.8 cm band/6-15 km rcs,3.15 cmband/l -2 kmrcsNIA
CIS4-88
10-30 m
180 km
N/A
NIA
.50-60
60-70
NIA
.70-8080-1.10
104-126
.8-4.5 cmband17-90 km rcs9,2 cm SAR200 m rcsN/A
ClS5-91,6 launched in1990-9110-30 m
180 km
NIA
NIA
NIA
.63-70 (6channels,
NIA
N/A
N/A
NIA
N/A
1.1 km
NIA
.48-53
.53-.58
.58-68
.725 -1.10
10.5 -12.5
NIA
N/A
N/A
IRS 1-BIndia3-88/8-9 1
72 m
148 km
N/A
45-.52
52-59
62-68
.77-86
NIA
N/A
NIA
365 m7425 km

172 I Remote Sensing From Space
operational six months later.7 Operating from a sun-synchronous, near-polar orbit, ERS-1 is the largest andmost complex of ESA’S Earth observation satellites.8
The ERS-1 platform is based on a design developed forthe French SPOT program.
From a 98.5-degree orbit at 785-km altitude, ERS-1makes use of a synthetic aperture radar (SAR) to studythe relationships between the oceans, ice, land, and theatmosphere. The SAR’S all-weather, day-and-nightsensing capability is critical for polar areas that arefrequently obscured by clouds, fog, or long periods ofdarkness.
The primary mission objectives of ERS-1 include:9
●
●
●
●
●
improving understanding of oceans/atmosphereinteractions in climatic models;advancing the knowledge of ocean circulationand transfer of energy;providing more reliable estimates of the mass ofthe Arctic and Antarctic ice sheets;enhancing the monitoring of pollution and dy-namic coastal processes;improving the detection and management of landuse change.
Data from ERS-1 allows researchers to:
●
●
●
●
●
study ocean circulation and global wind/waverelationships;monitor ice and iceberg distribution;more accurately determine the ocean geode;assist in short and medium-term weather forecast-ing, including the determination of wind speed;locate pelagic fish through monitoring of oceantemperature fronts.
The spacecraft’s synthetic aperture radar providesall-weather, high-resolution (30 meters) imagery in100-km-wide swaths over oceans, polar regions, andland. A core suite of onboard microwave sensors issupported by additional instruments (see table D-l).
ESA has developed a ground system for ERS-1,including centers for receiving, processing, validating,disseminating and archiving data:
●
●
●
●
●
●
the Mission Management and Control Centre(MMCC) in Darmstadt, Germany, which carriesout all satellite operations control and manage-ment, including instrument operational schedul-ing;ESA ground stations at Kiruna (Sweden), Fucino(Italy), Gatineau and Prince Albert (Canada), andMaspalomas (Canary Islands, Spain) which pro-vide the main network for data acquisition and theprocessing/dissemination of fast-delivery prod-ucts;national ground stations around the world re-ceive ERS-1 high-rate data by arrangement withESA, extending the coverage potential of thehigh-resolution SAR imaging mission. One suchground station, funded by NASA, is the AlaskaSAR facility at the University of Alaska Fair-banks. This facility, combined with two SARstations in Canada and one in Sweden, providenearly complete satellite coverage of Alaska andthe Arctic for the first time; 10
the Earthnet ERS-1 Central Facility (EECF) inItaly, which carries out all user interface func-tions, including cataloging, handling of userrequests, payload operation planning, schedulingof data processing and dissemination, qualitycontrol of data products and sensor performancemonitoring;Processing and Archiving Facilities (PAFs) lo-cated in the United Kingdom, Germany, France,and Italy which are the main centers for thegeneration of off-line precision products and thearchiving of ERS-1 data and products;user centers and individuals, such as national andinternational meteorological services, oceano-graphic institutes, and various research centers.
7 “ERS- 1 Now Declared operational, “ ESA News Release, European Space Agency, Paris, France, Jan. 27, 1992.
g The Data Book of ERS-1: The European Renwte Sensing Satellite, ESA BR-75, European Space Agency Publications Divisio% ES’I’EC,Noordwijk, The Netherlands, 1991. Pam Vass, and Malcolm Handoll. UK ERS-1 Reference Manual, DC-MA-EOS-ED-0001, Issue No. 1.0,Royal Aerospace Establishment, Farnboroughj UK, January 1991.
9 R. Holdaway, “UK Instruments for Mission to Planet Earth, ” presented at 42nd Congress of the International Astronautical Federation
OAF), (M-91-139), Montre~, Canada, Oct. 5-11, 1991; Ian pinker, “Satellite Sees All,” Space, vol. 7, No. 6, November/December 1991,pp. 8-12.
10 ‘ ‘satellite Facility Ready as ERS-1 b~chti,” Geoph~~sicaZInstitute Quarter/y, vol. 9, Nos. 3 & 4, Fairbanks, AlaslciL summer 1991.

Appendix D—Non-U.S. Earth Observation Satellite Programs I 173
An ERS-2 spacecraft, a follow-on mission to ERS-1,is an approved ESA project for launch in 1994, therebyoffering uninterrupted data collection from 1991 untilthe initiation of ESA’S Polar Orbit Earth ObservationMissions (POEM) program scheduled to begin orbitaloperations in 1998. ESA will first launch Envisat, anexperimental ecological monitoring satellite. Later,around 2000, ESA will launch the Metop satellite,designed to provide operational meteorological data.Eumetsat will provide data from the Metop system incooperation with NOAA (see ch. 3 and ch. 8), ERS-2,along with ERS-1 instrumentation, will carry theGlobal Ozone Monitoring Experiment package toanalyze atmospheric chemistry, using medium-resolution spectrometry in the ultraviolet and visibleregions of the spectrum to examine ozone and otherchemical substances in the troposphere and strato-sphere.
The ERSC Consortium (Eurimage, Radarsat Inter-national, and SPOT Image Consortium) is responsiblefor worldwide commercial distribution of ERS-1 dataand products to users. Eurimage is owned by fourcompanies: Telespazio (Italy), Dornier (Germany),Satimage (Sweden), and British Aerospace (UnitedKingdom), with each as a 25 percent shareholder.Eurimage is responsible for the distribution of all ESAproducts within Europe and the Middle East, Radarsatdistributes products in North America. SPOT isresponsible for distribution to remaining world mar-kets. 11
The European Space Agency’s remote sensing datamanagement program is called Earthnet. 12 This groupis headquartered in Frascati, Italy, at the EuropeanScientific Research Institution (ESRIN).13 ESA pri-marily serves European users, but data from Earthnetare available to any user for a price, either directly orthrough Eurimage. Earthnet provides basic remotesensing data in digital and photographic format, whilehigher level products are turned over to value-addedfirms for production and distribution. Users from
countries who contributed to the cost of the programare given preferential prices.
FRANCESysteme Probatoire d’Observation de la Terre(SPOT)
The SPOT-1 spacecraft was launched in February1986 by Centre National D’Etudes Spatiales (CNES),the French space agency, as an operational, commer-cial satellite. The SPOT program represents a $1.7billion investment through the end of the decade.14
CNES acts as overall program leader and manager withfull responsibility for satellite launches and orbitalcontrol and related funding. Government/industryorganizations participating in the SPOT program are ledby CNES, the Swedish Space Corporation in Sweden,and the Societe Nationale d’Investissement of Bel-gium.
SPOT-1 was placed in a sun-synchronous, near-polar orbit of 824 X 829 km altitude, with a designlifetime of two years. Every 369 revolutions around theEarth (every 26 days), SPOT-1 arrives at the sameplace over the globe. SPOT-1 carries twin pushbroomCCD High Resolution Visible (HRV) Imaging Instru-ments. The HRV can point up to 27 degrees off thesatellite track, allowing the satellite to reimage placeson the surface within 2 or 3 days. Also onboard are twomagnetic tape data recorders and a telemetry transmit-ter. Until December 1990, the HRV observed in threespectral bands in multispectral mode with a swathwidth (nadir viewing) of 60 km; and in panchromaticmode with a swath width of 60 km (see table D-l).SPOT-1 attained a ground resolution of 20 meters inmultispectral mode, and 10 meters in panchromaticmode. SPOT-1 off-nadir viewing yielded stereo-scopic pairs of images of a given area during succes-sive satellite passes. A standard SPOT-1 scene coversan area 60 X 60 km.
SPOT-1 lifetime of two years stretched until itsfirst retirement in 1990, after suffering from a failing
11 Peter de Selding, ‘‘ESA Sigm Long-awaited Imagery Sales Deal, ’ Space New)s, vol. 3, No. 5, Feb. 1016, 1992, pp. 4; “ESA InitiatesCommercd Distribution of ERS-1 Data,” ESA News Refeuse, No. 8, European Space Agency, Paris, France, Feb. 7, 1992.
]Z s~fer, op, cit., fOOtnOte 6“
13 E-et Wm ongl~ly es~blished t. rwelve and me availab]e EM obsemation dam from non-ESA satellites, such as Landsat and
MOS, Tires-N, Seasat, HCMM, Nimbus-7, and SPOT, but is now the focal point for ESA remote sensing data mamgemen~ with substantialERS-1 responsibilities.
14 ~unc~rng SPOT 2.]nfor~tion Fi/e, Centre Nation~ d’Etudes Spatiales, Toulouse France, 1989; ‘ ‘France: Remote sensing ~~~’
in Science and Technology perspechves, Foreign Broadcast Information Service, vol. 5, No. 4, Apr. 30, 1990, pp. 11-12.

174 I Remote Sensing From Space
onboard tape recording system. The satellite wasreactivated in March 1992,15 with ground operatorsmaking use of SPOT-1 imaging instruments andreal-time acquisition mode. By providing operationalservice, SPOT-1 is being used to meet a data demandduring the northern hemisphere growing season, and toreduce the workload on SPOT-2 over high-demandareas.
SPOT-2 was launched in January 1990 as a replicaof SPOT-1. Only minor modifications were used in thebuilding of SPOT-2: use of improved charge coupleddevices (CCD); improved calibration housing; and theaddition of a high-precision orbit determination sys-tem.
A SPOT-3 has been built and is ready for launchwhen needed, to assure continuity of SPOT servicesuntil the year 2000. SPOT-3 will exhibit the samecapability as the first two SPOT spacecraft, but willalso carry a Polar Ozone and Aerosol Measurementinstrument for the USAF Space Test Program.
SPOT-4 has been approved for development, andshould be ready in 1994 in the event of a SPOT-3failure. SPOT-4 is considered the first of the second-generation Earth observation platform series. SPOT 4will be built around an improved platform that willhave an expected operational life of five years.16
SPOT-4 will have increased on-board instrumentationcapacity and performance, including more than doublethe electric, computing, and recording capacity. TheHigh Resolution Visible Imaging Sensors carriedonboard SPOTS 1-3 are to be upgraded to HighResolution Visible Infra-Red by the addition of amid-infrared band (1.58-1 .75 microns) .17
Beyond SPOT-4, discussions are underway con-cerning synthetic aperture radar and optical instru-ments, such as a new stereo, high-resolution imager. 18
CNES is studying the potential for developing a
microwave subfamily within the SPOT family ofremote sensing satellites using the SPOT-4 spacecraftbus. Using a synthetic aperture radar, such a spacecraftcould be introduced in parallel with the optical SPOTfamily after 2000.19 The radar-carrying satellite wouldbe operated on a commercial basis and would maxi-mize use of the SPOT receiving station network, aswell as commercial and product delivery facilities.
SPOT satellites transmit data to an expandingnetwork of receiving stations. Major space imageryreceiving stations are located at Toulouse, France, andin Kiruna, Sweden. Other receiving stations capable ofreceiving SPOT data are located in Canada, India,Brazil, Thailand, Japan, Pakistan, South Africa, andSaudi Arabia, as well as the European Space Agency’sstation in the Canary Islands, Spain. Actual operationof the satellite is carried out by CNES at SPOT missioncontrol in Toulouse.
Formed in 1978 and located in Reston, Virginia,SPOT Image, Inc. provides U.S. businesses, universi-ties, and government agencies a range of products andservices based on SPOT data.20The worldwide com-mercial headquarters, SPOT Image, S. A., is anchoredin France, with SPOT Imaging Services in Australiaand SPOT Asia located in Singapore. SPOT distribu-tors are present in over 50 countries around the world.
HeliosCommon with the development of a SPOT-4 is the
Helios reconnaissance satellite being built for theFrench Ministry of Defense.21 This satellite receivedapproval in 1988. Italy and Spain are partners in thisproject, contributing 14 percent and 7 percent of thefunding, respectively. Helios will have a reportedresolution of about 1 m. Helios-1 should be ready forlaunch in 1994, possibly followed 2 years later byHelios-2.
15 f ~spoT. 1 Res~~ Operational Service, ” SPOT Image Co~oration Press Release, Restoq VA, Mar. 27, 1992.16 J,M. Au&~, C. Bi~ard, and P. Ranzoli. ‘The SPOT MKII Bus, A Key to Earth Observation in the ‘90s, ’ presented at the 42nd COn@XS
of the International Aeronautical Federation (IAF-91-013), Montreal, Canada, Oct. 5-11, 1991.IT c. Fra~er, Alfi Baudo~ et ~., ‘‘A Stereo, High Resolution Concept for the Future of the SPOT Program, ’ presented at the 42nd Congress
of the International Astronautical Federation (IAF-91-128), Montreal, Canada, Oct. 5-11, 1991.18 D. Sewela, J.P. Durpaire et al., “GLOBSAT: A French Proposat for Earth Environment Monitoring from Polar orbi~” @F-91-120),
Montreal Canada, Oct. 5-11, 1991.19 J.p. A~~es, D. Massome~ and O. Grosjmn. “A New Radar System for the French Program in the ‘00s,” presented at 40th Congress
of the International Astronautical Federation (IAF-89-124), Malaga, Spaim Oct. 7-13, 1989.m Stephne Chenard, “SPOT’s Subsidized Success Story, “ in Space Markets, February 1990, pp. 102-103.21 Ann~/ Report 1$290, Centre National D’Etudes Spatiales (CNES), Ptis, France, pp. 65-68.

Appendix D—Non-U.S. Earth Observation Satellite Programs [ 175
The Ministry of Defense has appointed CNES to actas overall system architect for Helios and has given itprocurement responsibility for the Helios segment.The Western European Union (WEU) has establisheda facility in Torrejon, Spain, to analyze images fromSPOT and Landsat. It will also receive some imageryfrom Helios.22
TOPEX/PoseidonLaunched in July 1992 aboard an Ariane booster,
TOPEX/Poseidon is studying the topography of theocean’s surface and ocean currents worldwide. Theproject is a joint undertaking, initiated in September1983 between France and the United States. Thespacecraft is the result of the merger of two similarprograms: NASA’s Ocean Topography Experiment(TOPEX) and France’s CNES Poseidon experiment.
The launch marked the first time a NASA spacecraftwas launched by an Ariane booster.23 The satelliteshould operate for at least three years and is comprisedof two French and five U.S. instruments: a NASA radaraltimeter; a NASA laser retroreflector assembly; aNASA frequency reference unit; a NASA TOPEXmicrowave radiometer; a Jet Propulsion Laboratoryglobal positioning system demonstration receiver; aCNES solid state altimeter; and the CNES Determina-tion d’Orbite et Radiopositionement Integre par Satel-lite (DORIS) receiver.
From its 1,334-km altitude, the TOPEX has a fixedground track that repeats every 127 circuits of Earth(9.9 days). Using NASA tracking and data relaysatellites, as well as laser tracking from the ground, thesatellite’s orbit around the Earth can be pinpointedwithin an accuracy of 13 centimeters. A comparison ofthe distance between satellite and sea surface with thedistance between the satellite and the Earth’s centerallows for accurate topographic mapping of the ocean,
The U.S. radar altimeter operates with a primechannel of 13.6 GHz in the Ku-band and a secondarychannel at 5.3 GHz in the C-band. The microwaveradiometer is a four-channel, three-frequency sensorthat operates at 18, 21, and 31 GHz to measure thecorrection for the tropospheric water vapor content of
the altimeter nadir column to an accuracy of 1.2 cm.The French radar altimeter is a single-frequency (13.65GHz) experimental sensor, with an accuracy of about2 cm. The CNES DORIS dual-frequency (401 and2036 Mhz) dopplerreceiver achieves an accuracy of 10cm.
Data received from the TOPEX/Poseidon will assistin the World Ocean Circulation Experiment (WOCE),and the Tropical Ocean Global Atmosphere (TOGA)program.
JAPANThe Japanese are engaged in an active remote
sensing satellite program and are expected to expandtheir work in this arena, both in ground and spacesegments.24 Movements into the commercial sales ofremote sensing data seem likely, as Japan moves intoa continuity of data flow from their own EarthResources Satellite (JERS-1) and the Advanced EarthObserving Satellite (ADEOS).
The Geostationary Meteorological Satellite (GMS)GMS “Himawari” series satellites have contributed
to the improvement of Japan’s meteorological servicesand development of weather satellite technology .25Data gathered by the GMS satellites are shared with theWorld Weather Watch, Operational weather data,including monitoring of cloud cover, temperatureprofiles, real-time storm monitoring, and severe stormwarning, are key missions objectives of the GMSseries. The cloud distribution pictures are used incountries of Southeast Asia and the Western Pacific.
The first satellite in the GMS series was launched bya U.S. Delta rocket in July 1977, with later GMSsatellites boosted by Japan’s own N-II and H-1 rockets.GMS-2 and the GMS-3 were launched in August 1981and August 1984, respectively, with the H-1 launchingthe GMS-4 in September 1989. Now under develop-ment for a projected 1994 launch is the GMS-5, whichis expected to conclude the series.
Japan’s space agency, NASDA, developed the firsttwo GMS satellites and the Japan Meteorological
.22 peter B. de%lding, “Potential Partners Give Helios Follow-On Cool Response,’ Space News, June 28, p. 5.23 R, Hal], f ‘TOpE~oseldon satellite: Emb]ing a Joint U, S. French ~ssion for G]ob~ Ocem s~dy, ’ presented at QIst congress Of the
International Astromutical Federation, (IAF-9O-1O1), Dresden, Germany, Oct. 6-12, 1990.~ NAL7DA-Nah~na[ Space Development Agency of Japan, Tokyo, Japan, 1991.M Geo~faTionan Mereoro/()<qlcu/ ,$afe//ite-5, National Space Development Agency of Japan, 3/10~ Tok>ro, JaPan> 1991.

176 I Remote Sensing From Space
Agency was in charge of the installation of groundfacilities needed for their operations. Since GMS-3, thetwo agencies share the development costs of thesatellite. NASDA is responsible for developmentefforts, while the Japan Meteorological Agency man-ages the operation of the satellites and the distributionof data.
Design of the GMS, which is manufactured byHughes Communications and Space Group and Japan’sNEC, draws heavily from the Hughes-built U.S. GOESmeteorological satellite. The GMS satellites are spin-stabilized, and carry radiometers, the space environ-ment monitor, along with a data collection system,which gathers environmental data from ground-basedinstruments. The GMS-3 was replaced by the GMS-4as the primary GMS satellite, but is still capable oftransmitting cloud photos over the earth 28 times perday. GMS-4 provides 1.25-km resolution in the visiblechannel, and 5-km resolution in the infrared charnel.Sensors onboard the GMS-4 include a single imagingVisible and Infrared Spin Scan Radiometer (VISSR)operating in 0.5 to 0.75 microns visible band and 10.5to 12.5 microns in the infrared band. This instrumentprovides a full-disc Earth image in less than a halfhour, simultaneously in both visible and infraredbands. The visible channel consists of four detectors(with four backup detectors) that scan simultaneously,covering a 1.1-km area. The GMS-4 also carries aspace environment monitor to survey radiation levelsat geostationary altitude and to monitor solar protons,electrons, and alpha particles.
GMS-5 will be launched in late 1994, and will besimilar to the GMS-4 design. It will carry a Search andRescue experiment on behalf of the Ministry ofTransport of Japan.
Marine Observation Satellite (MOS-1, MOS-1b)The MOS-1 is Japan’s first domestically developed
Earth observation satellite.2b MOS-1 was launched inFebruary 1987 from Tanegashima Space Center by anN-II rocket. Its successor, MOS-lb, was launched bya H-I rocket in February 1990. These spacecraft weresent into a sun-synchronous orbit of approximately909 km and have a 17-day recurrent period, circling the
Earth 14 times a day. The two spacecraft can beoperated in a simultaneous and/or independent mode.
MOS-1 and MOS-lb (also called MOMO-1 andMOMO-lb) are dedicated to the following missionobjectives:
●
●
●
Establishment of fundamental technology forEarth observation satellites;Experimental observation of the Earth, in particu-lar the oceans, such as water turbidity of coastalareas, red tide, ice distribution; development ofobservation sensors; verification of their func-tions and performance;Basic experiments using the MOS data collectionsystem.
Each of the spacecraft carries three sensors: aMultispectrum Electronic Self-Scanning Radiometer;a Visible and Thermal Infrared Radiometer and aMicrowave Scanning Radiometer (table D-l). Bothsatellites are designed for a two-year lifetime.
Facilities to receive data directly from the MOSseries are located at Japan’s Earth Observation Centerin Hatoyama-cho, Hiki-gun, Saitama prefecture. Dataprocessing facilities have also been set up by NASDAat the Remote Sensing Center of the National ResearchCouncil of Thailand, located in a suburb of Bangkok.This Thailand station can receive MOS data overThailand, Bangladesh, Bhutan, Cambodia, Malaysia,Vietnam; and part of China, India, Indonesia, Nepaland Philippines. The Thailand collection center trans-ports monthly data to Japan’s Earth ObservationCenter and NASDA for processing and generation ofproducts.
MOS products are available for a fee from theRemote Sensing Technology Center of Japan(RESTEC). RESTEC was established under the guid-ance of the Science and Technology Agency andNASDA in 1975 as a foundation, with the assistanceof Mitsui & Co., Ltd. and the Mitsubishi Corporation.
Earth Resources Satellite-1 (JERS-1)JERS-1 is a joint project of the Science and
Technology Agency, NASDA, and the Ministry ofInternational Trade and Industry (MITI). JERS-1 was
26 Marine Observation Satellite-i, National Space Development Agency of Japaq 8/5T, Tokyo, Japa& 1990. Keiji Maruo, “Remote SensingActivities in Japan, ’ in Space Commercialization: Satellite Technology, edited by F. Shahrokhi, N. Jasenhdiyana, and N. Tarabzouni, vol. 128of Progess in A.womzutics and Aeronuufic.r, American Institute of Aeronautics and Astronautics, Washingto& DC, 1990.
~T Earth Resources Sareflire-1, National Space Development Agency of Japa~ 3/10’r, To@o, Japan, 1991.

Appendix D—Non-U.S. Earth Observation Satellite Programs I 177
launched by an H-I rocket in February 1992, 27
Problems with a balky radar antenna were overcome inthe early months of the mission.
The JERS-1 is Japan’s third domestic remotesensing satellite (following the MOS-1 and MOS-lb)and will observe Earth using optical sensors and anL-band SAR for two years. JERS-1 will enable theoverlaying of optical multispectral data with all-weather radar imagery. JERS-1 was placed in asun-synchronous orbit of approximately 570 km. Itsrecurrent period over the same location is 44 days.
The primary purpose of JERS-1 is to verify func-tions and performance of optical sensors and asynthetic aperture radar, and to establish an integratedsystem for observing the Earths resources. Earthobservations are to focus on land use, agriculture,forestry, fishery, environmental preservation, disasterprevention, and coastal zone monitoring.
The JERS-1 radar system has day/night and all-weather observation capabilities. Resolution of theradar is 18 meters with a swath width of 75 km. TheSAR is capable of an off-nadir angle of 35 degrees(table D-l), An onboard recorder records SAR andOPS data when no data receiving station is available,allowing JERS-1 to attain global coverage.
In Japan, JERS-1 data are received at NASDA’SEarth Observation Center, Saitama. In addition, .JERS -1 data are received at the Tokai University inKumamoto Prefecture, the Showa Base in the Antarc-tic, and the Thailand MOS-1 station. Under a NASDA-NASA Memorandum of Understanding, the NASA-funded SAR station in Fairbanks, Alaska, also receivesJERS-1 data. These data overlap the SAR data from thealready-orbiting European ERS-1 mission and theCanadian Radarsat mission, planned for launch in1994.
Advanced Earth Observation Satellite (ADEOS)The main objective of ADEOS, the next generation
of Japanese Earth observation satellites, is to continueand further advance Earth observation technologyspurred by the MOS-1 and JERS-1 programs. Thespacecraft is to have a 3-year lifetime.28 ADEOS willhave a sun-synchronous, 98.6 degree inclination orbit
with a crossing time of 10:30 am, and a repeat cycle of41 days.
ADEOS will verify functions and performance oftwo NASDA sensors, the Ocean Color and Tempera-ture Scanner (OCTS) and the Advanced Visible andNear Infrared Radiometer (AVNIR). The OCTS willbe used for marine observation with high precision,and the AVNIR for land and coastal observation withhigh resolution.29
NASA plans to fly the Total Ozone MappingSpectrometer (TOMS) aboard ADEOS, as well as aNASA Scatterometer (NSCAT), which will provideaccurate measurements of ocean surface winds. Sucha device was demonstrated during the U.S. Seasatprogram in 1978.
Along with the U, S.-provided sensors, the Interfer-ometric Monitor for Greenhouse Gases (IMG) will beprovided by the Ministry of International Trade andIndustry of Japan, the Improved Limb AtmosphericSpectrometer and the Retroreflector in Space will beprovided by the Environment Agency of Japan. Lastly,the Polarization and Directionality of the Earth’sReflectance (POLDER) instrument is to be providedby the French space agency, CNES,
The ADEOS program will also conduct experimentson Earth observation data relay using the EngineeringTest Satellite-VI and the Experimental Data Relay andTracking Satellite to enhance global observationcapabilities. Lastly, Japanese officials expect to dem-onstrate the ADEOS modular design they believenecessary to build future Japanese polar-orbitingplatforms.
ADEOS was initially to be launched by the H-IIrocket in early 1995, but delays in the H-II programand problems integrating non-Japanese instrumentshave caused a slip in schedule. Japan now plans aFebruary 1996 launch.
The OCTS instrument planned for ADEOS is to bea multispectral radiometer designed to measure globalocean color and sea surface temperature simultane-ously during the day. It is based on the VTIRinstrument flown on the MOS-1 series. OCTS spatialresolution will be approximately 700 meters, with a1,400-krn swath width. The OCTS will be pointable on
x (~EO,S) Adl,anced Earth Obsenl;ng Satellite, National Space Development Agency of JaP~ 3/1 ~t TOkYO! ~aP~t 191 ~
29 N, IWWM, Makoto Kajii et al., ‘ ‘Status of ADEOS Mission Sensors, ’ presentd at 42d Congress of the International AstronauticalFederation (IAF-91-144), Montreal, Canada, Oct. 5-11, 1991.
178 I Remote Sensing From Space
command and capable of tilting along track to eitherside of nadir.
The AVNIR is a high spatial resolution multispec-tral radiometer for Earth observing during the day invisible and near-infrared regions. AVNIR is a third-generation sensor using CCD technology, preceded byMESSER of the MOS-1 and OPS of the JERS-1. Thesensor swath width is approximately 80 km. AVNIR isequipped with a pointing mechanism that selects theobserving path arbitrarily in the cross track direction ofADEOS flight.
Major specifications of the sensors aboard ADEOSare as follows:
●
●
●
●
●
The NASA Scatterometer (NSCAT) can measuresurface wind speed and direction over the globaloceans. Swath width: 1,200 km; frequency:13.995 GHz; wind speed measurement accuracy:2 m/s.; direction accuracy of 20 degrees (at spatialresolution of 50 km). This sensor will observeglobally, day and night;The NASA Total Ozone Mapping Spectrometer(TOMS) will observe ozone changes, evaluate
changes in ultraviolet radiation and sense sulfurdioxide in the atmosphere. Swath width: 2,795km; wavelengths: 304.0, 312.5, 325.0, 317.5,332.6 and 360 microns. This sensor will operatein the day on a global basis;The CNES Polarization and Directionality of theEarth’s Reflectance (POLDER) sensor will ob-serve solar radiation reflected by the Earth’satmosphere. Swath width: 1,440 X 1,920 km;wavelengths: 0.443, 0.490, 0.520, 0.565, 0.670,0.765, 0.880, 0.950 microns. This device willoperate in the day on a global basis;MITT’s Interferometric Monitor for GreenhouseGases (IMG) will observe carbon dioxide andother greenhouse gases. Swath width: 20 km;wavelengths: 3.3-14 microns. This sensor willobserve globally, day and night;Environment Agency of Japan’s Improved LimbAtmospheric Spectrometer (ILAS) will observethe micro-ingredients in the atmosphere overhigh-latitude areas on the Earth’s limb. Wave-
●
lengths: 0.75-0.78 and 6.2-11.8 microns. Thissensor will operate on a regional basis;Environment Agency of Japan’s Retroreflector inSpace (RIS) that measures ozone, fluorocarbons,carbon dioxide, etc., by laser beam absorption.Laser beam is transmitted from ground stationand reflected on ADEOS. Wavelengths: 0.3-14microns. This experiment will be done on aregional basis.
Mission operation of ADEOS will be controlledfrom the NASDA Earth Observation Center (EOC).However, the limited visibility of ADEOS by the EOCwill require use of foreign, near-polar ground stationsas well, Data rate for direct transmission from ADEOSis a maximum of 100 megabits per second (Mbps).
Future PlanningFuture plans by Japan in Earth observation satellites
center on a number of post-ADEOS sensors andsatellites, as well as enhancement of the remotesensing ground segment, data networks, remote sens-ing training activities, and marketing.30
Tropical Rainfall Measurement Mission (TRMM)-TRMM is detailed in appendix A.
Japanese Polar Orbiting Platform (JPOP)--Japanese officials expect this platform to succeedADEOS in the late 1990s and to constitute a Japanesecontribution to the international Earth observationsystem. The JPOP is expected to be launched by H-IIrocket into Sun-synchronous orbit after 1998.
Ground Facilities—Use of NASDA’S Earth Obser-vation Center (EOC) will increase given its role in thedata reception and processing of Landsat, SPOT,MOS-1, MOS-lb, JERS-1 and ADEOS data.
Data DistributionThe role of the Remote Sensing Technology Center
of Japan (RESTEC) will likely grow in future years.31
RESTEC handles data distribution for Landsat, MOS,and SPOT to general users in Japan and foreigncustomers. NASDA data policy for MOS-1 is to chargefor the cost of reproduction and handling. NASDA isresponsible for processing JERS-1 data, but RESTEC
m Monitom’ng the Ea~h Envirowntfiom space: A Scenario of Earth Observation for the Next Decade, National Space DevelopmentAgency of Japan (NASDA), Tokyo, Japan.
31 RESTEC: Remote Sensing Technology Center of Japan, To&o, Jap~ 1991.

Appendix D—Non-US. Earth Observation Satellite Programs I 179
will distribute the NASDA-processed JERS-1 data toJapanese and foreign users.
Japanese geography and politics permit only onesatellite tracking and receiving facility, which does notview Earth-orbiting spacecraft often enough to permitglobal data acquisition and relay to Earth of taperecorded data. Until Japan establishes a data relaysatellite capability, it must rely on internationalcooperation to obtain data from its satellites.32
COMMONWEALTH OF INDEPENDENTSTATES (CIS)
The former Soviet Union’s space activities show agreat and expanding interest in Earth observation, notonly for military purposes, but for assessing resourceson a regional and global scale.33
Beyond military spaceborne reconnaissance assets,the Soviet meteorological and remote sensing pro-grams have been forged into an integrated network,comprising various spacecraft. Today the CIS operateseight different types of space platforms-both pilotedand automated spacecraft-that provide global envi-ronmental data, and it is proposing even more systemsfor the future.34 This network is comprised of Meteor
2 and Meteor 3-series satellites; the Okean-O space-craft; the Resurs-0, Resurs-Fl and Resurs-F2 satel-lites; and the piloted Mir space station complex.
Soviet authorities have claimed that their nation’smeteorological and remote sensing satellites providean economic savings of some one billion rubles eachyear. Indeed, Earth observation data are widely used inthe former Soviet Union for land and forestry manage-ment, mapping soil erosion threats, studying icesituations in polar areas, and monitoring earthquakeand avalanche hazards.35
MeteorMeteor was the first civil applications satellite
deployed by the former USSR. It is comparable, in
many ways, to the U.S. NOAA series. Following along stretch of testing under the Cosmos satellite label,the first Meteor was identified as such in 1969.Numbers of Meteor l-class spacecraft were launchedand then replaced (after 1975) by the current Meteor2-class spacecraft and (after 1985), by the Meteor 3satellite. Meteor 2 and Meteor 3 satellites are routinelylaunched, typically twice a year.
Meteor 2 satellites are placed in 950-km polar orbits,with two or three of this class of spacecraft in operationat all times. Grouped in a constellation, individualMeteor 2 satellites gather data from one-fifth of theglobe during a single circuit of Earth, relaying data onclouds, ice cover, and atmospheric radiation levels.Two of these satellites provide 80 percent coverage ofthe Earth’s surface in six hours.
Onboard a Meteor 2 satellite are scanning radiome-ters for direct imaging and global coverage; a scanninginfrared radiometer for global coverage; and a scan-ning infrared spectrometer, covering eight channels(table D-l). Automatic Picture Transmission (APT) iscarried out from a Meteor 2-class satellite at frequen-cies between 137 and 138 Mhz, therefore compatiblewith international APT formats. Some 15,000 APTterminals exist across the CIS territories.
The newer Meteor 3-class satellites are being placedinto higher orbits, 1,200 km, in order to preventcoverage gaps in the equatorial regions. Payload ofMeteor 3 spacecraft are similar to Meteor 2 satellites(table D-l). Also onboard Meteor 3-class spacecraft isa radiation measurement device to record electron andproton charges in the space environment.
The Meteor 3 satellites are designed to accommo-date additional payload packages. For example, theAugust 1991 Meteor 3 launch carried NASA’s TotalOzone Mapping Spectrometer (TOMS).3G Russia plansto fly Earth radiation budget instruments provided byCNES aboard a future Meteor 3.
Russian authorities have discussed developing aGeostationary Operational Meteorological Satellite
32 S& S&fer, op. cit. footnote 6.
J3 Nicbolas L. Johnso~ The soviet Year in Space 1990, Teledyne Brown Engineering, Colorado Spfigs, CO, 1991.
~ Neville Kidger, “The Soviet Unmanned Space FleeL” Spacejl’ight, vol. 32, July 1990, pp. 236-239.N MMcla Smlm ,Sol,ief Space Comrcia/lzafion Ac~~,i~es, CRS Repo~ for Conwess, congr~sioti Reseuh Service, 88-473 SPR,
Washington DC, July 6, 1988. Kazakov, Roudolf V. Applications of Soviet Remote Sensing Data for Studies of Natural Resources andMapping Pu~oses. Sojuzkarta Company, Moscow, 1991.
36 Brim Dunbar and Dolores Beasley, NASA News, “Soviets to Launch NASA Instrument to Study Ozone Levels,’ Release 91-127, NASAHeadquarters, Washington, DC, Aug. 12, 1991; NASA Meteor-31TOMS Press Kit, NASA Headquarters, Washingto& DC, Aug. 12, 1991.
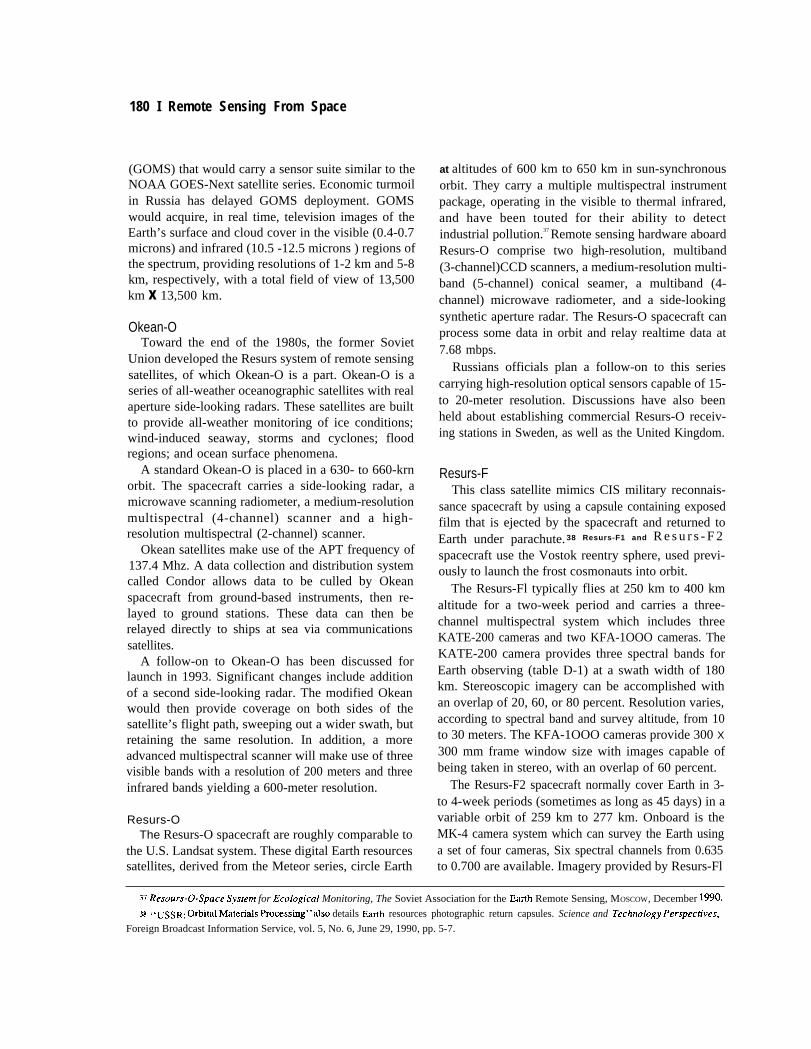
180 I Remote Sensing From Space
(GOMS) that would carry a sensor suite similar to theNOAA GOES-Next satellite series. Economic turmoilin Russia has delayed GOMS deployment. GOMSwould acquire, in real time, television images of theEarth’s surface and cloud cover in the visible (0.4-0.7microns) and infrared (10.5 -12.5 microns ) regions ofthe spectrum, providing resolutions of 1-2 km and 5-8km, respectively, with a total field of view of 13,500km x 13,500 km.
Okean-OToward the end of the 1980s, the former Soviet
Union developed the Resurs system of remote sensingsatellites, of which Okean-O is a part. Okean-O is aseries of all-weather oceanographic satellites with realaperture side-looking radars. These satellites are builtto provide all-weather monitoring of ice conditions;wind-induced seaway, storms and cyclones; floodregions; and ocean surface phenomena.
A standard Okean-O is placed in a 630- to 660-krnorbit. The spacecraft carries a side-looking radar, amicrowave scanning radiometer, a medium-resolutionmultispectral (4-channel) scanner and a high-resolution multispectral (2-channel) scanner.
Okean satellites make use of the APT frequency of137.4 Mhz. A data collection and distribution systemcalled Condor allows data to be culled by Okeanspacecraft from ground-based instruments, then re-layed to ground stations. These data can then berelayed directly to ships at sea via communicationssatellites.
A follow-on to Okean-O has been discussed forlaunch in 1993. Significant changes include additionof a second side-looking radar. The modified Okeanwould then provide coverage on both sides of thesatellite’s flight path, sweeping out a wider swath, butretaining the same resolution. In addition, a moreadvanced multispectral scanner will make use of threevisible bands with a resolution of 200 meters and threeinfrared bands yielding a 600-meter resolution.
Resurs-OThe Resurs-O spacecraft are roughly comparable to
the U.S. Landsat system. These digital Earth resourcessatellites, derived from the Meteor series, circle Earth
at altitudes of 600 km to 650 km in sun-synchronousorbit. They carry a multiple multispectral instrumentpackage, operating in the visible to thermal infrared,and have been touted for their ability to detectindustrial pollution.37 Remote sensing hardware aboardResurs-O comprise two high-resolution, multiband(3-channel)CCD scanners, a medium-resolution multi-band (5-channel) conical seamer, a multiband (4-channel) microwave radiometer, and a side-lookingsynthetic aperture radar. The Resurs-O spacecraft canprocess some data in orbit and relay realtime data at7.68 mbps.
Russians officials plan a follow-on to this seriescarrying high-resolution optical sensors capable of 15-to 20-meter resolution. Discussions have also beenheld about establishing commercial Resurs-O receiv-ing stations in Sweden, as well as the United Kingdom.
Resurs-FThis class satellite mimics CIS military reconnais-
sance spacecraft by using a capsule containing exposedfilm that is ejected by the spacecraft and returned toEarth under parachute. 38 Resurs-F1 and R e s u r s - F 2
spacecraft use the Vostok reentry sphere, used previ-ously to launch the frost cosmonauts into orbit.
The Resurs-Fl typically flies at 250 km to 400 kmaltitude for a two-week period and carries a three-channel multispectral system which includes threeKATE-200 cameras and two KFA-1OOO cameras. TheKATE-200 camera provides three spectral bands forEarth observing (table D-1) at a swath width of 180km. Stereoscopic imagery can be accomplished withan overlap of 20, 60, or 80 percent. Resolution varies,according to spectral band and survey altitude, from 10to 30 meters. The KFA-1OOO cameras provide 300 X300 mm frame window size with images capable ofbeing taken in stereo, with an overlap of 60 percent.
The Resurs-F2 spacecraft normally cover Earth in 3-to 4-week periods (sometimes as long as 45 days) in avariable orbit of 259 km to 277 km. Onboard is theMK-4 camera system which can survey the Earth usinga set of four cameras, Six spectral channels from 0.635to 0.700 are available. Imagery provided by Resurs-Fl
37 Resours.O.Space System for Ecological Monitoring, The Soviet Association for the Earth Remote Sensing, MOSCOW, December 1990.
38$ *USSR: @bi~ ~terials ~ocessing’ ~SO details Earth resources photographic return capsules. Science and TedVdOgy perspech”ves,
Foreign Broadcast Information Service, vol. 5, No. 6, June 29, 1990, pp. 5-7.

Appendix D-Non-US. Earth Observation Satellite Programs I 181
and F2 spacecraft are being offered commerciallythrough the Soyuzkarta company .39
AlmazRecently, the CIS collected a wealth of data from its
A1maz satellite. Almaz-1 was a large spacecraftequipped with synthetic aperture radar (SAR) forday/night operations. Launched in March 1991 andoperated until October 1992, the Almaz followed a300-krn-high orbit, and provided coverage of anappointed region at intervals of one to three days. Itsorbital position was corrected every 18-31 days, andaccounted for considerable fuel use. The orbit was alsochanged frequently to comply with customers’ re-quests. A similar bus-sized, radar-equipped prototypespacecraft-Cosmos-l 870-was launched in 1987,and was based upon that of the piloted Salyut and Mir
40 Cosmos- 1870 operated for two years,space stations.producing radar imagery of 25 to 30 meters resolution.
An Almaz Corporation was formed to stimulatecommercial use of the satellite data. G1avkosmos, thecivil space arm in Russia, NPO Machinostroyenia, andthe U.S.-based Space Commerce Corporation of Hous-ton, Texas, established a joint Data Processing andCustomer Support Center in Moscow to assist custom-ers in using Almaz data. The French company, SPOTImage, also markets Almaz data in the United Statesand Canada. In 1992, Hughes STX Corp. of Lanham,Maryland, signed an agreement with Almaz Corp. ofHouston to be exclusive worldwide commercial mar-keter, distributor, processor and licenser of data fromthe Almaz-l spacecraft.
41 According to some reports,Almaz data sales have been slow; a sales target of $2million for 1992 may have been unrealistic.42
The Russians would like to launch and operate anAlmaz-2. However, lack of capital and a weak marketfor Almaz data have prevented such arrangements.
MirSince the first crew occupied the Mir space station
in 1986, cosmonauts onboard the orbiting complex
have completed numerous experiments dedicated toEarth remote sensing. Various Earth imaging systemshave been flown to the Mir, such as the Kate-200,KFA-1OOO, and the MK4 camera hardware also usedon board the Resurs-1 and Resurs-2 satellites.
The Kavant-2 module, attached to the central core ofthe Mir in December 1989, carried the MKF-6Mcamera, capable of imaging Earth at a resolution of22.5 m.
Of significance is the potential for further expansionof the Mir complex to include a Priroda remote-sensingmodule, which has been under development for severalyears. Russia plans to attach the Priroda module to Mirin late 1994. Use of instruments carried inside themodule would be geared to monitoring ocean surfacetemperatures, ice cover, wind speed at the oceansurface, and surveying concentrations of aerosols andgases in the atmosphere.
INDIAIndia has invested heavily in space-based remote
sensing. The Indian Space Research Organization(ISRO) is the primary government space agency for thecountry, organized under the government’s Depart-ment of Space. The ISRO Satellite Centre is theprimary laboratory for design, building, and testing ofIndian satellites.
A National Remote Sensing Agency was estab-lished in 1975 and is charged with shaping anoperational remote sensing system for India. Since1979, India’s central Earth station in Shadnagar hasreceived U.S. NOAA spacecraft data, as well asinformation transmitted by Landsat, SPOT, and thecountry’s own Indian Remote Sensing (IRS) space-craft. IRS is the data mainstay for India, accounting forover 72 percent of the data requests by users, followedby Landsat at 18 percent and SPOT around 6 percent .43
India’s remote sensing program centers on use of theIndian Satellite (INSAT) series, two Bhaskara space-craft, the Rohini satellites, and the Indian Remote
w soyuz~rta, Foreign Trade Assoia[io~ Kartex, MOSCOW . Sovero No. 28 1/88.
.@ BuYer*~ Guide Almz Radar Remote Sensing ,yalP//ite, Space Commerce Corporation, Houston. Texas; William B Wirin! ‘‘New Vision
from Space: ALMAZ, ” Aerospace & Defense Science, October/November 1990, pp. 19-22, William B. Wirim Almaz: hoking ThroughClouds, presented at 1 lth Symposium EARSel, Gru, Austria July 3-5, 1991.
q] “Hughes STX Signs Agreement on Data from Russian Satellite, ” The Wo.rhz’ngton Post, Mar. 2, 1992, p. 7.
42 Daniel J. Marcus, ‘‘Ahnaz Team Fears Shutdown Without More Foreign Sales,’ Space News, vol. 3, No. 3, Jan. 27-Feb, 2, 1992, p. 23.A? [nV,entorY of Remote ,~en$lng Faclll[ie$ and ~tiv,itie$ in the E,~CAp Region, United Nations Inventory Report: India, December 1990.

182 I Remote Sensing From Space
Sensing satellite series: IRS-1A and IRS-lB, Alongwith the development of these spacecraft, India haspursued an independent launch capability, althoughU. S., Soviet, and European boosters have also beenutilized to launch Indian satellites.
BhaskaraThe Bhaskara series served as experimental space-
craft, launched by Soviet boosters in 1979 and 1981.The Bhaskara spacecraft were each placed in a roughly400-mile-high Earth orbit. Both satellites carried slowscan vidicon equipment and passive microwave radi-ometers. The satellite’s vidicon equipment operated in0.54-0.66 micron and 0.75-0.85 micron spectral chan-nels, and produced images for land use, snow cover,coastal processes, and for forestry purposes. Theradiometers operated in the 19, 22, and 31 GHz rangeand collected data on sea surface phenomena, watervapor and liquid water content.
RohiniThe Rohini series began with Rohini-1 launched
into Earth orbit in July 1980, using India’s nationalbooster, the SLV-3, While the initial Rohini wasapparently used to measure rocket performance, Rohini-2, orbited in May 1981, carried remote sensingequipment but operated for only 9 days. Rohini-3 wasorbited in April 1983 and also carried equipment for“remote sensing’ purposes. Material provided byISRO for this assessment contains no mention of theRohini series. Western officials have claimed thesesatellites are designed to assist in the creation of anIndian military reconnaissance capability.
INSATThe Indian National Satellite system combines both
Earth observation and domestic communications func-tions. The INSAT spacecraft built to date have been ofAmerican design, purchased by India from FordAerospace. The INSAT-lA was launched in April1982 by a U.S. Delta rocket, but suffered problemsduring deployment of spacecraft hardware. An INSAT1B was subsequently launched using a U.S. SpaceShuttle in August 1983. INSAT 1C was launched byan Ariane booster in July 1988, and an INSAT ID wasrocketed into orbit by a commercial U.S. Delta in June1990.
INSAT remote sensing activities center on using atwo-channel Very High Resolution Radiometer (VHRR)
that yields 0.55-0.75 micron visible and 10.5-12.5micron infrared images of the Earth. From theirgeostationary altitude, INSAT spacecraft produceimagery every 30 minutes. INSAT-series spacecrafthave a design life of some ten years. In addition toimagery, the INSAT satellites relay data collected fromsome 100 hydrological, oceanographic, and meteoro-logical ground stations.
INSAT-2 is under development, and will be con-structed by ISRO and Indian companies and launchedby an Ariane booster. Similar in capabilities toprevious INSATS, the INSAT-2 is expected to yieldhigher VHRR resolution in the 2 km visible and 8 krninfrared. A series of two INSAT-2 test spacecraft andthree additional operational satellites is now beingplanned.
Indian Remote Sensing Satellite (IRS)As India’s first domestic dedicated Earth resources
satellite program, the IRS series provides continuouscoverage of the country, with an indigenous groundsystem network handling data reception, data process-ing and data dissemination. India’s National NaturalResources Management System uses IRS data formany projects.
To date, two IRS satellites have been launched:IRS-1A in March 1988 by a Russian launcher; andIRS-l B in August 1991, also launched by a Russianbooster, Both IRS spacecraft carry identical onboardhardware.
IRS-1A and IRS-lB are the backbone of India’sNatural Resources Management System; both are in904-km polar sun-synchronous orbit. Each carries twopayloads employing Linear Imaging Self-scanningSensors (LISS), which operate in a pushbroom scan-ning mode using CCD linear arrays. The IRS satelliteshave a 22-day repeat cycle. The LISS-I imaging sensorsystem constitutes a camera operating in four spectralbands compatible with the output from Landsat-seriesThematic Mapper and SPOT HRV instruments (tableD-l), Geometric resolution of the LISS-I is 72 metersat a swath of 148 km. The LISS-IIA and B arecomprised of two cameras operating in 0.45 to 0.86microns with a ground resolution of 36.5 meters, eachwith a swath of 74 km. The two units are located oneither side of the LISS-I and view either side of theground track with a 3-km lateral overlap.

Appendix D—Non-U.S. Earth Observation Satellite Programs I 183
Data products from the IRS can be transmitted inreal time, or by way of tape recorder. As part of theNational Remote Sensing Agency’s international serv-ices, IRS data are available to all countries which arewithin the coverage zone of the Indian ground stationlocated at Hyderabad: Afghanistan, Bahrain, Bangla-desh, Bhutan, Burma, Cambodia, China, Indonesia,Iran, Laos, Malaysia, Maldives, Mali, Nepal, Oman,Pakistan, Qatar, Saudi Arabia, Singapore, Socotra,Somalia, Sri Lanka, Thailand, United Arab Emirates,the CIS (former USSR), Vietnam, and Yemen. Thesecountries can receive the raw/processed data directlyfrom the NRSA Data Center.
IRS Follow-on SeriesSecond-generation IRS-l C and 1D satellites are
being designed to incorporate sensors with resolutionsof about 20 meters in multispectral bands and betterthan 10 meters in the panchromatic band apart fromstereo viewing, revisit and onboard data recordingcapabilities. ISRO is planning to add a band in ShortWave IR (SWIR) at a spatial resolution of 70 meters.In addition, a Wide Field Sensor (WiFS) with 180meters spatial resolution and a larger swath of about770 km is planned for monitoring vegetation.
India expects to launch IRS-l C sometime in 1994,while IRS-l D will be launched in 1995 or 1996. AnIRS-series spacecraft capable of microwave remotesensing—similar to Europe’s ERS-1—is also underconsideration for launching in the late ‘90s.
Ground FacilitiesIRS data are regularly acquired at the National
Remote Sensing Agency (NRSA) Earth station atShadnagar, Hyderabad. Five regional remote sensingservice centers have been established to provide usersdigital analysis and interpretation of IRS data and otherremotely sensed satellite information. The centers arelocated at Bangalore, Dehra Dun, Jodhpur, Nagpur andKharagpur. Also, state remote sensing centers in all 21states have been established to carry out projects of
direct relevance to the states and/or participate innational programs.
The use of low-cost PC-based digital image process-ing systems have permitted widespread applications ofremote sensing data throughout India. IRS data havebeen used to monitor drought, map saline/alkalinesoils, estimate large area crop production, and inven-tory urban sprawl of all cities with populations greaterthan one million.
CHINAChina’s remote sensing activities have been tied to
satellite communications and geographic informationsystems designed to alert the government of environ-mental situations, such as impending flood conditions
Capable of launch-and to estimate disaster damage.44
ing its own satellites with its Long March boosters,China’s remote sensing work centers around the FengYun (FY) satellite series to gather meteorologicaldata, 45 while China’s FSW (see below) recoverablesatellites have returned film of remotely sensed scenesto Earth-useful for commercial and military pur-poses.46 In December 1986, the Chinese inaugurated
operational use of a Landsat receiving station, pur-chased from the United States. China pays a $600,000annual access fee to EOSAT to use the Landsat groundterminal. 47 China can market the data without restric-tion. The station is positioned at Miyun, northeast ofBeijing, with processing facilities situated northwestof Beijing. Lastly, China and Brazil are cooperating onthe Earth Resources Satellite system comprised of twospacecraft and several Earth stations.
Feng Yun (FY)The Feng Yun (FY) “Wind and Cloud” satellites
are built for meteorological purposes, to monitorconditions of China’s vast territory and coastline, Twoof the FY series have been launched since September1988.
While China can obtain realtime cloud NOAA/TIROS-N data, this information is not in the three-dimensional
“The Proposat About Constructing the National Disaster Monitoring, Forecast and Controla c. FaW-~ Tong I@, and Yang Jia-c~,
System, ” presented at 42d Congress of the International Astronautical Federation, (T.AF-91-1 13), Montreal, Canada, Oct. 5-11, 1991.45 M. ~fiong, and XuFuxia%, “Chinese Meteorological Satellites and Technical Experiment of the Satellites,” presented at 42d Congress
of the International Astronautical Federation (1.AF-91-017), Montreal, Canadq Oct. 5-11, 1991.46 Recoverable Sare//lf@,$W~icorgra},iO Test P/a&orm, Chinese ~demy of Space Technology, Beijing, Chim.
47 ~c~ Smlti, space Comercia/jzanon in china a~~apan, CRS Repofi for Congress, (88-519 SPR), Congressional Research Service,
Washin@oU DC, July 28, 1988, pp. 8-9.
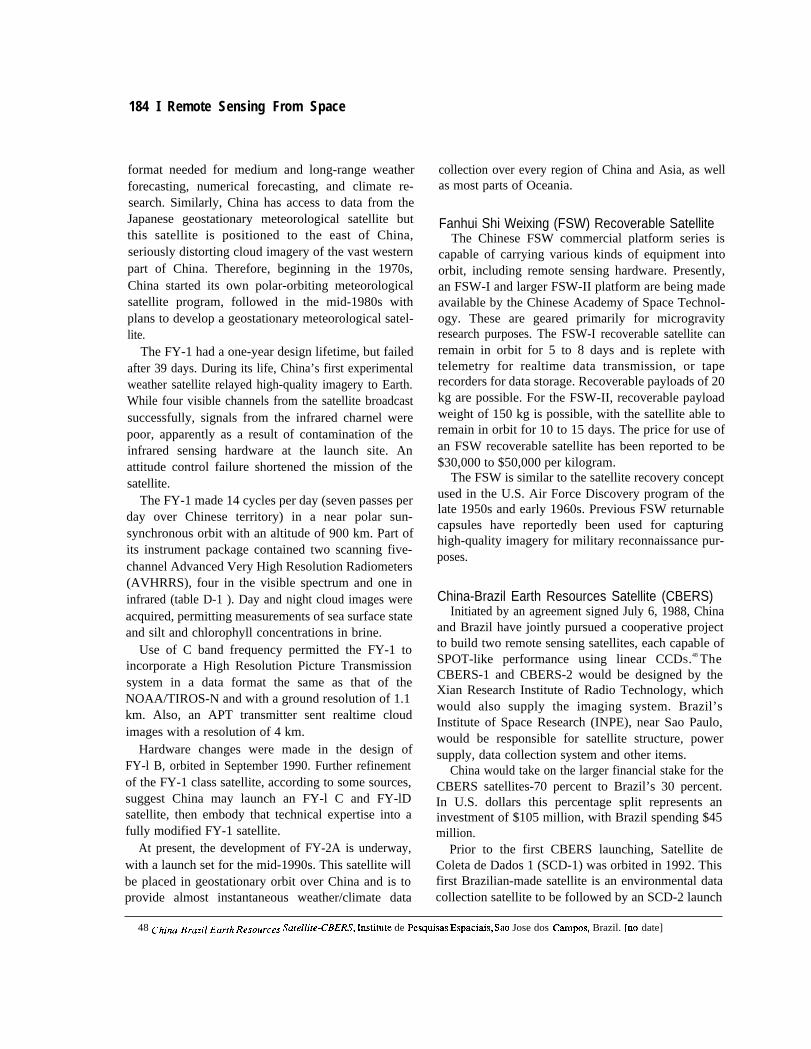
184 I Remote Sensing From Space
format needed for medium and long-range weatherforecasting, numerical forecasting, and climate re-search. Similarly, China has access to data from theJapanese geostationary meteorological satellite butthis satellite is positioned to the east of China,seriously distorting cloud imagery of the vast westernpart of China. Therefore, beginning in the 1970s,China started its own polar-orbiting meteorologicalsatellite program, followed in the mid-1980s withplans to develop a geostationary meteorological satel-lite.
The FY-1 had a one-year design lifetime, but failedafter 39 days. During its life, China’s first experimentalweather satellite relayed high-quality imagery to Earth.While four visible channels from the satellite broadcastsuccessfully, signals from the infrared charnel werepoor, apparently as a result of contamination of theinfrared sensing hardware at the launch site. Anattitude control failure shortened the mission of thesatellite.
The FY-1 made 14 cycles per day (seven passes perday over Chinese territory) in a near polar sun-synchronous orbit with an altitude of 900 km. Part ofits instrument package contained two scanning five-channel Advanced Very High Resolution Radiometers(AVHRRS), four in the visible spectrum and one ininfrared (table D-1 ). Day and night cloud images wereacquired, permitting measurements of sea surface stateand silt and chlorophyll concentrations in brine.
Use of C band frequency permitted the FY-1 toincorporate a High Resolution Picture Transmissionsystem in a data format the same as that of theNOAA/TIROS-N and with a ground resolution of 1.1km. Also, an APT transmitter sent realtime cloudimages with a resolution of 4 km.
Hardware changes were made in the design ofFY-l B, orbited in September 1990. Further refinementof the FY-1 class satellite, according to some sources,suggest China may launch an FY-l C and FY-lDsatellite, then embody that technical expertise into afully modified FY-1 satellite.
At present, the development of FY-2A is underway,with a launch set for the mid-1990s. This satellite willbe placed in geostationary orbit over China and is toprovide almost instantaneous weather/climate data
collection over every region of China and Asia, as wellas most parts of Oceania.
Fanhui Shi Weixing (FSW) Recoverable SatelliteThe Chinese FSW commercial platform series is
capable of carrying various kinds of equipment intoorbit, including remote sensing hardware. Presently,an FSW-I and larger FSW-II platform are being madeavailable by the Chinese Academy of Space Technol-ogy. These are geared primarily for microgravityresearch purposes. The FSW-I recoverable satellite canremain in orbit for 5 to 8 days and is replete withtelemetry for realtime data transmission, or taperecorders for data storage. Recoverable payloads of 20kg are possible. For the FSW-II, recoverable payloadweight of 150 kg is possible, with the satellite able toremain in orbit for 10 to 15 days. The price for use ofan FSW recoverable satellite has been reported to be$30,000 to $50,000 per kilogram.
The FSW is similar to the satellite recovery conceptused in the U.S. Air Force Discovery program of thelate 1950s and early 1960s. Previous FSW returnablecapsules have reportedly been used for capturinghigh-quality imagery for military reconnaissance pur-poses.
China-Brazil Earth Resources Satellite (CBERS)Initiated by an agreement signed July 6, 1988, China
and Brazil have jointly pursued a cooperative projectto build two remote sensing satellites, each capable ofSPOT-like performance using linear CCDS.48 TheCBERS-1 and CBERS-2 would be designed by theXian Research Institute of Radio Technology, whichwould also supply the imaging system. Brazil’sInstitute of Space Research (INPE), near Sao Paulo,would be responsible for satellite structure, powersupply, data collection system and other items.
China would take on the larger financial stake for theCBERS satellites-70 percent to Brazil’s 30 percent.In U.S. dollars this percentage split represents aninvestment of $105 million, with Brazil spending $45million.
Prior to the first CBERS launching, Satellite deColeta de Dados 1 (SCD-1) was orbited in 1992. Thisfirst Brazilian-made satellite is an environmental datacollection satellite to be followed by an SCD-2 launch
48 China_Brazi/ Earth Re~ource~ Safe//ite-CBERS, I~titute de Pequisas Espaciais, Sao Jose dos CtimpOS, Brazil. [nO date]

Appendix D—Non-U.S. Earth Observation Satellite Programs I 185
in 1993. Each will be placed in 750-km orbits. TwoSensoriarnento Remoto (SSR) satellites are also to belaunched, in 1995 and in 1996, respectively. CarryingCCD cameras capable of 200-meter resolution, theSSR-1 and SSR-2 are to be placed in 642-km,sun-synchronous orbits.
The CBERS project completed its phase B work in1989, when the preliminary design of the satellite wascompleted. The project is currently in the developmentand engineering phase with some contracts withBrazilian industries established. Because of budgetdifficulties, work on the project has been slowed.
Launch of the CBERS-1 appears now to be plannedfor 1995, with the satellite placed in a 778-kmsun-synchronous orbit. CBERS-2 launch is targetedfor 1996. The CBERS five-channel linear CCD wouldprovide visible and panchromatic coverage. Spectralbands would range from 0.51 microns to 0,89 microns.Ground resolution of the CCD camera is 20 meters. ACBERS infrared multispectral scanner would includefour channels between 0.5 and 12.5 microns. Theinfrared multispectral scanner would yield an 80-meterground resolution, CBERS imagery is designed torival SPOT and Landsat data. China’s Great WallIndustry Corp. and Brazil’s Avibras Aeroespacial in1989 signed a joint venture agreement to establishINSCOM, a company that would specialize in estab-lishing a ground data handling network. Like China,Brazil has a Landsat ground station, operating a facilitysince 1973, A data processing center was establishedthere the following year.
INTERNATIONAL COOPERATION INREMOTE SENSING
Global climate change knows no national borders.Satellite observations of the Earth, therefore, must intime become a truly international activity. A myriad oforganizations now play key roles in the attempt tocoordinate the scientific study of Earth’s biosphere,These include groups from the national and interna-
tional scientific community; government agencies;and intergovernmental science bodies.49
Key OrganizationsThe International Council of Scientific Unions
(ICSU)--created in 1931 as an autonomous federationconsisting of 20 disciplinary scientific unions and 70national member organizations---has endorsed andruns the International Geosphere-Biosphere Program(IGBP) to help determine the interactive physical,chemical and biological processes that regulate thetotal Earth system, including the influences of humanactions on those processes.
The IGBP, in turn, involves the United Nations(UN) World Meteorological Organization (WMO), theUnited Nations Educational, Scientific, and culturalOrganization (UNESCO), and the United NationsEnvironment Program (UNEP), which, in turn, iscoordinating the World Climate Research Program(WCRP).
In 1988, the UN established the IntergovernmentalPanel on Climate Change (IPCC), sponsored jointly bythe WMO and the UNEP. The IPCC serves as aprimary international forum for addressing climatechange, with three working groups that: assess scien-tific evidence on climate change; assess likely impactsresulting from such change; and consider possibleresponse strategies for limiting or adapting to climatechange.
As a member of ICSU, the National Academy ofSciences’ National Research Council (NRC) partici-pates in the IGBP through its Committee on GlobalChange (CGC), which is reviewing the U.S. GlobalChange Research Program (USGCRP). Another NRCentity, the Committee on Earth Studies (CES), isproviding the federal government with advice on thestudy of the Earth from space.
Remote sensing for environmental monitoring cutsacross territory, airspace and economic zones of theEarth’s nation states, where the systematic exchange ofdata or joint access will necessitate international
@ ~cla S, Smlh, and John R. JUWUS, Mission to PlanetEarth and the U.S. Globa[ Change Research Program, CRS Report for Conpss,
Congressional Research Service, 90-300 SPR, June 19, 1990; James D. Baker, “Observing Global Change from Space: Science &Technology, ’ presented at Annual Meeting of the American Association for the Advancement of Science, Washingto% DC, February 1991;C[imate Change: The IPCC Scienfrjic Assessment, J.T Houghton, G.J. Jenkins and J.J. Ephraums, eds., Cambridge University Press,Cambridge, MA, 1990, pp. 315-328; Assessment of Satellite Earth Observation Programs-1991, Committee on Earth Studies, Space StudiesBoard, Commission on Physical Sciences, Mathematics, and Applications, Nationat Research Council, Washington, DC, 1991; and Congressof the United States, Office of Technology Assessmen4 Changing By Degrees: Steps to Reduce Greenhouse Gases (OZ4-OE-O-482,Washington DC: U.S. Government Printing OffIce, February 1991), pp. 282-283.
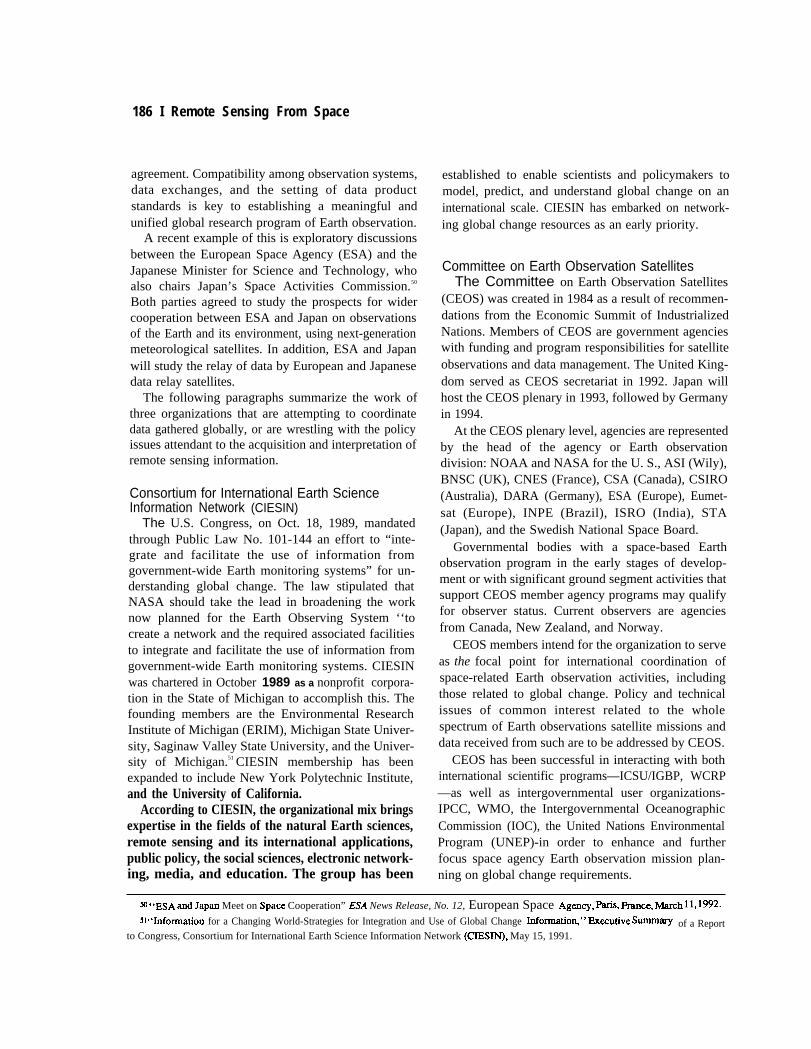
186 I Remote Sensing From Space
agreement. Compatibility among observation systems,data exchanges, and the setting of data productstandards is key to establishing a meaningful andunified global research program of Earth observation.
A recent example of this is exploratory discussionsbetween the European Space Agency (ESA) and theJapanese Minister for Science and Technology, whoalso chairs Japan’s Space Activities Commission.50
Both parties agreed to study the prospects for widercooperation between ESA and Japan on observationsof the Earth and its environment, using next-generationmeteorological satellites. In addition, ESA and Japanwill study the relay of data by European and Japanesedata relay satellites.
The following paragraphs summarize the work ofthree organizations that are attempting to coordinatedata gathered globally, or are wrestling with the policyissues attendant to the acquisition and interpretation ofremote sensing information.
Consortium for International Earth ScienceInformation Network (CIESIN)
The U.S. Congress, on Oct. 18, 1989, mandatedthrough Public Law No. 101-144 an effort to “inte-grate and facilitate the use of information fromgovernment-wide Earth monitoring systems” for un-derstanding global change. The law stipulated thatNASA should take the lead in broadening the worknow planned for the Earth Observing System ‘‘tocreate a network and the required associated facilitiesto integrate and facilitate the use of information fromgovernment-wide Earth monitoring systems. CIESINwas chartered in October 1989 as a nonprofit corpora-tion in the State of Michigan to accomplish this. Thefounding members are the Environmental ResearchInstitute of Michigan (ERIM), Michigan State Univer-sity, Saginaw Valley State University, and the Univer-sity of Michigan.51 CIESIN membership has beenexpanded to include New York Polytechnic Institute,and the University of California.
According to CIESIN, the organizational mix bringsexpertise in the fields of the natural Earth sciences,remote sensing and its international applications,public policy, the social sciences, electronic network-ing, media, and education. The group has been
established to enable scientists and policymakers tomodel, predict, and understand global change on aninternational scale. CIESIN has embarked on network-ing global change resources as an early priority.
Committee on Earth Observation SatellitesThe Committee on Earth Observation Satellites
(CEOS) was created in 1984 as a result of recommen-dations from the Economic Summit of IndustrializedNations. Members of CEOS are government agencieswith funding and program responsibilities for satelliteobservations and data management. The United King-dom served as CEOS secretariat in 1992. Japan willhost the CEOS plenary in 1993, followed by Germanyin 1994.
At the CEOS plenary level, agencies are representedby the head of the agency or Earth observationdivision: NOAA and NASA for the U. S., ASI (Wily),BNSC (UK), CNES (France), CSA (Canada), CSIRO(Australia), DARA (Germany), ESA (Europe), Eumet-sat (Europe), INPE (Brazil), ISRO (India), STA(Japan), and the Swedish National Space Board.
Governmental bodies with a space-based Earthobservation program in the early stages of develop-ment or with significant ground segment activities thatsupport CEOS member agency programs may qualifyfor observer status. Current observers are agenciesfrom Canada, New Zealand, and Norway.
CEOS members intend for the organization to serveas the focal point for international coordination ofspace-related Earth observation activities, includingthose related to global change. Policy and technicalissues of common interest related to the wholespectrum of Earth observations satellite missions anddata received from such are to be addressed by CEOS.
CEOS has been successful in interacting with bothICSU/IGBP, WCRPinternational scientific programs—
—as well as intergovernmental user organizations-IPCC, WMO, the Intergovernmental OceanographicCommission (IOC), the United Nations EnvironmentalProgram (UNEP)-in order to enhance and furtherfocus space agency Earth observation mission plan-ning on global change requirements.
~ 44ESA and Jap~ Meet on Space Cooperation” ESA News Release, No. 12, European Space Agency, park, fiance, -h 11, 1~.
51 c ‘~omtion for a Changing World-Strategies for Integration and Use of Global Change hlfOrnlatiO%’ fi=utive S~ of a Reportto Congress, Consortium for International Earth Science Information Network (CIESIN), May 15, 1991.

Appendix D—Non-U.S. Earth Observation Satellite Programs I 187
Space Agency Forum on ISY (SAFISY)The International Space Year (ISY) of 1992 promul-
gated the establishment in 1988 of SAFISY, a coordi-nation group of the world space agencies.52 SAFISYprovided a mechanism, through periodic meetings, forthe agencies to share ideas and pool resources inconnection with the International Space Year.
Panels of experts were established by SAFISY, twoof which are scientific in nature, The Panel of Expertson Earth Science and Technology monitored projectsthat are designed to provide worldwide assessment ofthreats to the environment through satellite observa-
tions and the development of predictive models. ThePanel of Experts on Space Science monitored projectsunder the theme ‘‘Perspectives from Space, ’ empha-sizing that unlimited perspectives are gained throughall aspects of space science study and through ventur-ing out into space<
A third SAFISY panel, Panel of Experts on Educa-tion and Applications, was geared to promote ISYeducational activities internationally, many of whichdeal with satellite remote sensing.
52 sp~c~ &~~cy F~~m on ~~ ~tematio~ Space Year-Third Meeting (SAFISY-3), NASDA CM-147, Kyoto, JaP~ MY 17-18> l~o.
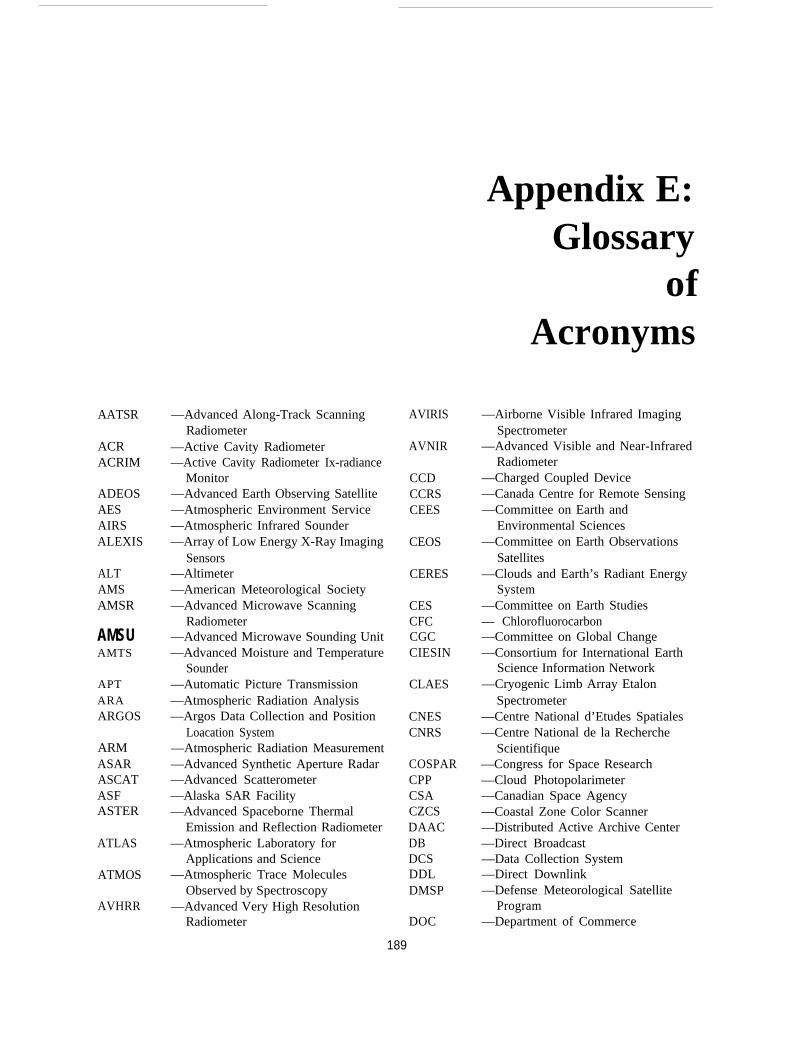
Appendix E:
AATSR
ACRACRIM
ADEOSAESAIRSALEXIS
ALTAMSAMSR
AMSUAMTS
APTARAARGOS
ARMASARASCATASFASTER
ATLAS
ATMOS
AVHRR
—Advanced Along-Track ScanningRadiometer
—Active Cavity Radiometer—Active Cavity Radiometer Ix-radiance
Monitor—Advanced Earth Observing Satellite—Atmospheric Environment Service—Atmospheric Infrared Sounder—Array of Low Energy X-Ray Imaging
Sensors—Altimeter—American Meteorological Society—Advanced Microwave Scanning
Radiometer—Advanced Microwave Sounding Unit—Advanced Moisture and Temperature
Sounder—Automatic Picture Transmission—Atmospheric Radiation Analysis—Argos Data Collection and Position
Loacation System—Atmospheric Radiation Measurement—Advanced Synthetic Aperture Radar—Advanced Scatterometer—Alaska SAR Facility—Advanced Spaceborne Thermal
Emission and Reflection Radiometer—Atmospheric Laboratory for
Applications and Science—Atmospheric Trace Molecules
Observed by Spectroscopy—Advanced Very High Resolution
Radiometer
AVIRIS
AVNIR
CCDCCRSCEES
CEOS
CERES
CESCFCCGCCIESIN
CLAES
CNESCNRS
COSPARCPPCSACZCSDAACDBDCSDDLDMSP
DOC
Glossaryof
Acronyms
—Airborne Visible Infrared ImagingSpectrometer
—Advanced Visible and Near-InfraredRadiometer
—Charged Coupled Device—Canada Centre for Remote Sensing—Committee on Earth and
Environmental Sciences—Committee on Earth Observations
Satellites—Clouds and Earth’s Radiant Energy
System—Committee on Earth Studies— Chlorofluorocarbon—Committee on Global Change—Consortium for International Earth
Science Information Network—Cryogenic Limb Array Etalon
Spectrometer—Centre National d’Etudes Spatiales—Centre National de la Recherche
Scientifique—Congress for Space Research—Cloud Photopolarimeter—Canadian Space Agency—Coastal Zone Color Scanner—Distributed Active Archive Center—Direct Broadcast—Data Collection System—Direct Downlink—Defense Meteorological Satellite
Program—Department of Commerce
189

190 I Remote Sensing From Space
DOD —Department of DefenseDOE —Department of EnergyDOI —Department of the InteriorDORIS —Doppler Orbitography and
Radiopositioning Integrated bySatellite
DOS —Department of StateDPT —Direct Playback TransmissionDRSS —Data Relay Satellite SystemEC —European CommunityEDC —EROS Data CenterEDRTS —Experimental Data Relay and
Tracking SatelliteEOC —EOS Operations CenterEOS —Earth Observing SystemEOS-AERO —EOS Aerosol MissionEOS-ALT —EOS Altimetry MissionEOS-AM —EOS Morning Crossing (Ascending)
MissionEOSAT —Earth Observation Satellite companyEOS-CHEM-EOS Chemistry MissionEOSDISEOSPEOS-PM
EPAERBEERBSEROSERSERTS-1
ESAESDIS
EWUNETS-VI
—EOS Data and Information System—Earth Observing Seaming Polarimeter—EOS Afternoon Crossing
(Descending) Mission—Environmental Protection Agency—Earth Radiation Budget Experiment—Earth Radiation Budget Satellite—Earth Resources Observation System—European Remote-Sensing Satellite—Earth Resources Technology
Satellite-1—European Space Agency—Earth Science Data and Information
System—European Scientific Research Institute—Engineering Test Satellite-VI
E UMETSAT-European Organization for theExploitation of MeteorologicalSatellites
FCCSET —Federal Coordinating Council forScience, Engineering, and Technology
FOV —Field-of-ViewFST —Field Support TerminalFY —Feng YunGCDIS —Global Change Data and Information
SystemGeosat —Navy Geodetic Satellite
GEWEX
GGIGLASGLIGLRSGMS
GOES
GOMIGOMOS
GOMRGOMS
GPSHIRDLS
HIRIS
HIRSHIS
HYDICE
ICSU
IGBP
ILAS
INSATIMG
IPCC
IRSIRTSISAMS
ISYJERSJOESJPLJPOPLAGEOS
—Global Energy and Water CycleExperiment
—GPS Geoscience Instrument—Geoscience Laser Altimeter System—Global Imager—Geoscience Laser Ranging System—Geostationary Meteorological
Satellite—Geostationary Operational
Environmental Satellite—Global Ozone Monitoring Instrument—Global Ozone Monitoring by
Occultation of Stars—Global Ozone Monitoring Radiometer—Geostationary Operational
Meteorological Satellite—Global Positioning System—High-Resolution Dynamics Limb
Sounder—High-Resolution Imaging
Spectrometer—High-Resolution Infrared Sounder—High-Resolution Interferometer
Sounder—High-Resolution Picture Transmission—Hyperspectral Digital Imagery
Collection Experiment—International Council of Scientific
Unions—International Geosphere-Biosphere
program—Improved Limb Atmospheric
Spectrometer—Indian National Satellite—Interferometric Monitor for
Greenhouse Gases—Intergovernmental Panel on Climate
Change—Indian Remote Sensing Satellite—Infrared Temperature Sounder—Improved Stratospheric and
Mesospheric Sounder—International Space Year—Japan Earth Resources Satellite—Japanese Earth Observing System—Jet Propulsion Laboratory—Japanese Polar Orbiting Platform—Laser Geodynamics Satellite.

Appendix E—Glossary of Acronyms I 191
LandsatLidarLIMS
LISLISSLITE
LRMERIS
MESSR
METOPMHS
MIPAS
MISR
MODIS
MOPMOPITT
MOSMSRMSSMSUMTPEMTSNASA
NASDA
NESDIS
NOAA
NREN
NRSANSCATNSPDOCTSOLS
—Land Remote-Sensing Satellite—Light Detection and Ranging—Limb Infrared Monitor of the
Stratosphere—Lightning Imaging Sensor—Linear Imaging Self-scanning Sensors—Lidar In-Space Technology
Experiment—Laser Retroreflector—Medium-Resolution Imaging
Spectrometer—Multispectrum Electronic Self-
Scanning Radiometer—Meteorological Operational Satellite—Microwave Humidity Sounder—Multifrequency Imaging Microwave
Radiometer—Michelson Interferometer for Passive
Atmospheric Sounding—Multi-Angle Imaging
SpectroRadiometer—Microwave Limb Sounder—Moderate-Resolution Imaging
Spectroradiometer—Meteosat Operational Programme—Measurements of Pollution in the
Troposphere—Marine Observation Satellite—Microwave Scanning Radiometer—Multispectral Scanner—Microwave Sounding Unit—Mission to Planet Earth—Microwave Temperature Sounder—National Aeronautics and Space
Administration—National Space Development Agency
(Japan)—National Environmental Satellite, Data,
and Information Service—National Oceanic and Atmospheric
Administration—National Research and Education
Network—National Remote Sensing Agency—NASA Scatterometer—National Space Policy Directive—Ocean Color and Temperature Scanner—Optical Line Scanner
OMB —Office of Management and BudgetOPS —Optical SensorsOSC —Orbital Sciences Corporation
OSIP —operational Satellite ImprovementProgram
POEM —Polar-Orbit Earth Observation
POES
POLDER
RARadarsatRESTECRFRISSAFIRE
SAFISYSAGE
SAMSSARSARSATor S&RSBUV
SCARABSeaWiFSSEDACSEMS-GCOS
SIR-CSLRSMMR
SOLSTICE
SPOT
SSM/ISSUSTIKSCAT
Mission—Polar-orbiting Operational
Environmental Satellite—Polarization and Directionality of Earth’s
Reflectance—Radar Altimeter—Radar Satellite—Remote Sensing Technology Center—Radio Frequency—Retroreflector in Space—Spectroscopy of the Atmosphere using
Far Infrared Emission—Space Agency Forum on ISY—Stratospheric Aerosol and Gas
Experiment—Stratopheric and Mesospheric Sounder—Synthetic Aperture Radar—Search and Rescue Satellite Aided
Tracking System—Solar Backscatter Ultraviolet
Radiometer—Scanner for the Radiation Budget—Sea-Viewing Wide Field Sensor—Socio Economic Data Archive Center—Space Environment Monitor—Space-based Global Change
Observation System—Shuttle Imaging Radar-C—Satellite Laser Ranging—Scanning Multispectral Microwave
Radiometer—Solar Stellar Irradiance Comparison
Experiment—System Probatoire d’Observation de la
Terre—Special Sensor Microwave/Imager—Stratospheric Sounding Unit—Stick Scatterometer

192 I Remote Sensing From Space
SWIRTDRSS
TIROS
TMTOMSTOGATOPEX
TUSKUARSUAVSUNEPUNESCO
—Short Wave Infrared—Tracking and Data Relay Satellite
System—Television Infrared Observing Sat-
ellites—Thematic Mapper—Total Ozone Mapping Spectrometer—Tropical Ocean Global Atmosphere—Ocean Topography Experiment—Tropical Rainfall Measuring Mission— Tethered Upper Stage Knob—Upper Atmosphere Research Satellite—Unpiloted Air Vehicles—United Nations Environment Program—United Nations Educational, Scientific,
and Cultural Organization
USDAUSGCRP
USGS
VISSR
VTIR
WCRPWEUWMO
WOCEX-SAR
—U.S. Department of Agriculture—U.S. Global Change Research
Program—U.S. Geological Survey—Very High Resolution Radiometer—Visible and Infrared Spin Scan
Radiometer—Visible and Thermal Infrared
Radiometer— World Climate Research program—Western European Union—The U.N. World Meteorological
Organization—World Ocean Circulation Experiment—X-Band Synthetic Aperture Radar

Index
ACRIM. See Active Cavity Radiometer Irradiance MonitorActive Cavity Radiometer L-radiance Monitor
description, 69, 134EOS-Chem, 107
ADEOS. See Advanced Earth Observation SatelliteAdministration La.ndsat Management Plan, 48,50Advanced Earth Observation Satellite, 24, 177-178Advanced Microwave Sounding Unit
EOS-PM, 107METOP platform, 41
Advanced Research Projects AgencyCAMEO program, 75space technology initiatives, 138-139
Advanced Spaceborne Thermal Emission and Reflectionradiometer, 106
Advanced Technology Demonstrations, 75, 138-139Advanced Technology Standard Satellite Bus, 75, 138Advanced Very High Resolution Radiometer
AVHHR/2, 40METOP platform, 41research cooperation between NASA and NOAA, 36
Advanced Visible and Near Infrared Radiometer, 177-178Air Force Space Command, 15Aircraft, piloted and unpiloted, 78-79, 124-128AIRS. See Atmospheric Infrared SounderAlmaz, 61, 181Altimeters
description, 6ocean remote sensing, 56, 57
AMSU. See Advanced Microwave Sounding UnitAPT. See Automatic Picture Transmission recordersARGOS Data Collection System, 40ARM. See Atmospheric Radiation Measurement programArms control monitoring, 82, 161-162, 163ARPA. See Advanced Research Projects AgencyASTER. See Advanced Spaceborne Thermal Emission and
Reflection radiometerATDs. See Advanced Technology DemonstrationsAtmospheric Infrared Sounder, 37, 107Atmospheric Radiation Measurement program, 70ATSSB. See Advanced Technology Standard Satellite BusAurora Flight Services, Inc., 79Automatic Picture Transmission recorders, 39AVHRR. See Advanced Very High Resolution RadiometerAVNIR. See Advanced Visible and Near Infrared
Radiometer
Balloons, 78-79Bhaskara series, 181Broad area search, 155-158Bromley, D. Allan, 100Budgets
costs of remote sensing, 24-25DoD’s remote sensing systems, 18global change research program, 13NASA’s remote sensing systems, 18-23NOAA’s remote sensing systems, 18, 23-24reduction of NASA’s Earth Observing System program,
17-18,65-68
CAMEO. See Collaboration on Advanced MultispectralEarth Observation
Camouflage, Concealment, and Deception, 162-163Canada, remote sensing satellite, 57CBERS. See China-Brazil Earth Resources SatelliteCC&D. See Camouflage, Concealment, and DeceptionCEES. See Committee on Earth and Environmental ScienceCentre Nationale d’Etudes Spatial, 52-53CEOS. See Committee on Earth Observations SystemsCERES. See Clouds and Earth’s Radiant Energy SystemChina, satellite programs, 183-185China-Brazil Earth Resources Satellite, 184-185
193

194 I Remote Sensing From Space
CIESIN, See Consortium for International Earth ScienceInformation Network
CIS. See Commonwealth of Independent StatesCivilian space program
future of, 11-13market motives, 164military use, 81-84, 145-164satellite characteristics, 148-154
Climate change. See also Global changecurrent state of research, 96-100geostationary satellite system, 34-37human influence, 113meteorological satellite system, 4244non-U.S. environmental satellite systems, 44-45observations of satellite sensors, 33-34polar-orbiting satellite system, 37-43
Climate feedbacks, 76, 112Climate forcings, 76, 112-113Climsat, 76-77, 131-135Clinton administration, NASA budget request, 20Clouds and Earth’s Radiant Energy System, 105, 129-131CNES. See Centre Nationale d’Etudes SpatialCO2 change, 132, 133Coastal Zone Color Scanner, 55Collaboration on Advanced Multispectral Earth
Observation, 75, 138Combat intelligence, 159-161Committee on Earth and Environmental Sciences, 13,63-64Committee on Earth Observations Systems, 31,90, 186Commonwealth of Independent States
earth observation satellite programs, 179-181environmental satellite system, 44-45
Congressional considerationscomparing costs and benefits of global change research,
25-26consolidation of DoD’s meteorological system and NOAA’s
polar-orbiting system, 16,44cost reduction for remote sensing systems, 87-88Earth Observing System funding, 65future of space-based remote sensing, 2-3global change data collection continuity, 27improved calibration sensitivity of NOAA sensors, 14-15international cooperation in remote sensing programs, 71land remote sensing support, 27-28Landsat sensors funding, 50Landsat technology development funding, 52military uses of civilian remote sensing data, 165NASA’s funding plans for Mission to Planet Earth, 23,
68-69non-space-based research support, 17planning for development of Landsat 8,52private satellite industry support, 87private sector use of land remote sensing, 28,85-87
research cooperation between NASA and NOAA, 36-37small satellite systems support, 75unpiloted air vehicles funding, 79, 128
Consortium for International Earth Science InformationNetwork, 186
CZCS. See Coastal Zone Color Scanner
DAACS. See Distributed Active Archive CentersData gathering, 4DCS. See ARGOS Data Collection SystemDefense Meteorological Satellite Program
future of, 15-16, 17weather observations, 4244
Department of Defensecollaborative projects with NASA, 70developing a strategic plan for remote sensing, 26-27Landsat program, 48-52meteorological satellite system, 15-16, 42-44remote sensing budget, 18
Department of Energy, strategic plan for remote sensing,26-27
Distributed Active Archive Centers, 73, 103DMSP. See Defense Meteorological Satellite ProgramDOD. See Department of DefenseDOE. See Department of Energy
Earth Observation-Intemational Coordination Working Group,31
Earth Observation Satellite Company, 49, 85Earth Observing Scanning Polarimeter
Climsat, 133, 135description, 106
Earth Observing Systemcurrent state of climate research, 96-100description, 16-18,95-96, 101-107EOS Aero, 106EOS-Alt, 107EOS-AM, 105-106EOS-Chem, 107EOS Color, 106EOS Phase One, 104-105EOS-PM, 106-107global change research, 65-72,73instruments not funded, 116-124program, 71and related systems, 101-104restructured program, 69science and policy priorities, 68technology and the restructured program, 110-124
Earth Observing System Data and Information Systemdescription, 102-104global change research, 65-72,73improving the use of research data, 29-30

Index I 195
Earth Probe satellites, 67Earth Radiation Budget Experiment, 41, 131Earth Resources Satellite, 57-58, 176-177El Nino, 55,97, 132Electro-optical sensors, 47Enhanced Thematic Mapper, 50-51Environmental change. See Global changeENVISAT platform, 41EO-ICWG. See Earth Observation-International
Coordination Working GroupEOS. See Earth Observing SystemEOSAT. See Earth Observation Satellite CompanyEOSDIS. See Earth Observing System Data and Information
SystemEOSP. See Earth Observing Scanning PolarimeterERBE. See Earth Radiation Budget ExperimentERS. See European Remote Sensing SatelliteERS-1. See Earth Resources SatelliteESA. See European Space AgencyETM. See Enhanced Thematic MapperEumetsat. See European Organization for the Exploitation of
Meteorological SatellitesEurope
coordination of satellite research, 31earth observation satellite programs, 167-175
European Organization for the Exploitation ofMeteorological Satellites
description, 168environmental satellite system, 44loan of Meteosat-3 to U. S., 34-35METOP polar platform, 39,41
European Remote Sensing Satellite, 168-173European Space Agency
environmental satellite system, 44loan of Meteosat-3 to U. S., 34-35METOP polar platform,41ocean remote sensing satellite, 57-58
Fanhui Shi Weixing recoverable satellite, 184FCCSET. See Federal Coordinating Council for Science,
Engineering, and TechnologyFederal Coordinating Council for Science, Engineering
Sciences, and Technology, 13,63Feng Yun, 183-184Filter wedge, 14Flux divergence, 79-80France
land remote sensing system, 52-53, 173-175ocean remote sensing, 58, 175
FSW. See Fanhui Shi Weixing recoverable satelliteFunding. See BudgetsFY. See Feng Yun
GCMS. See General circulation modelsGeneral circulation models, 95,96Geodesy satellite
description, 61Geosat Follow On, 61
Geographic information systems, 85-86Geosat. See Geodesy satelliteGeoscience Laser Ranging System and Altimeter, 107Geostationary Meteorological Satellites, 44, 175-176Geostationary Operational Environmental Satellites
future of, 14weather observations, 34-37
Geostationary Operational Environmental Satellites-Nextcost performance, 23description, 35-36development problems, 36, 38-39
GIS. See Geographic information systemsGlobal change. See also Climate change; Earth Observing
Systemcontribution of space-based remote sensing, 13COStS, 25, 26data collection continuity, 25-26improving the use of research data, 29-31international cooperation, 89-91operational meteorological satellite systems, 14-15research program budgets, 13U.S. research program, 28-30,63-64
Global Change Data and Information System, 29Global Habitability Program, 101Global Positioning System, 83
GPS Geoscience Instrument, 107Global Wa.rmin g, 98-99GLRS-A. See Geoscience Laser Ranging System and
AltimeterGMS. See Geostationary Meteorological SatellitesGOES. See Geostationary Operational Environmental
SatellitesGPS. See Global Positioning SystemGreenhouse effect, 98-99, 115-116Ground resolution, 81, 148
Helios, 174-175High Resolution Dynamics Limb Sounder, 107High-Resolution Imaging Spectrometer, 123-124High Resolution Infrared Radiation Sounder, 40High Resolution Multispectra1 Stereo Imager, 50-51High Resolution Picture Transmission recorders, 39HIRDLS. See High Resolution Dynamics Limb SounderHIRIS. See High-Resolution Imaging SpectrometerHIRS/2. See High Resolution Infrared Radiation SounderHRMSI. See High Resolution Multispectral Stereo ImagerHRPT. See High Resolution Picture Transmission recordersHughes STX Corporation, 61

196 I Remote Sensing From Space
Hyperspectral imaging systems, 123-124, 139, 140
Ice caps. See Ocean remote sensingIEOS, See International Earth Observing SystemIIRS. See Image Interpretability Rating ScaleILAS. See Improved Limb Atmospheric SpectrometerImage Interpretability Rating Scale, 149Imaging radiometer, 6IMG. See Interferometric Monitor for Greenhouse GasesImproved Limb Atmospheric Spectrometer, 177India
earth observation satellite program, 181-183ground facilities, 183land remote sensing system, 53
Indian National Satellite system, 182Indian Remote Sensing Satellite
description, 53, 182-183follow-on series, 183
Indian Space Research Organization, 181Indications and Warning, 158-159Insat. See Indian National Satellite systemInterferometric Monitor for Greenhouse Gases, 177-178Intergovernmental Panel on Climate Change, 65International cooperation, 89-93, 186-187International Earth Observing System, 90IPCC. See Intergovernmental Panel on Climate ChangeIRS. See Indian Remote Sensing SatelliteISRO. See Indian Space Research OrganizationI&W. See Indications and Warning
Japandata distribution, 178-179earth observation satellite program, 175-178environmental satellite system, 44future planning, 178land remote sensing, 53-54ocean remote sensing, 58
Japan Earth Resources Satellite, 53-54, 176-177JERS-1. See Japan Earth Resources Satellite
Land remote sensingapplications, 8, 10description, 47-48France, 52-53, 173-175India, 53Japan, 53-54, 176-177Landsat program, 48-52Russia, 54
Land Remote Sensing Commercialization Act of 1984,49Land Remote Sensing Policy Act of 1992
continuity of data collection and use, 25-26introduction of legislation, 48shift of operational control of Landsat, 27, 48
technology development program, 51-52Landsat program
description, 48,49developing follow-ens, 140-144future satellites, 51-52Landsat 7,48,50-51military uses, 81-84role of private sector, 85-86use of data, 27-28
Laser Atmospheric Wind Sounder, 116-118LAWS. See Laser Atmospheric Wind SounderLidar altimeter, 6Linear Imaging Self-searming Sensors, 53, 182LISS. See Linear Imaging Self-searming Sensors
Mapping, Charting, and Geodesy, 82-84description, 147-148use of civilian satellites, 154-155
Marine Observation Satellite, 58, 176MC&G. See Mapping, Charting, and GeodesyMeasurements of Pollution in the Troposphere, 106MESSR. See Multispectral Electronic Self-scanning
RadiometerMeteor satellites, 179-180Meteosat Operational Programrne, 167-168Meteosat satellites
description, 44, 167-168loan to U. S., 34-36
METOP polar platform, 41MHS. See Microwave Humidity SounderMichelson Interferometer, 135Microwave Humidity Sounder, 107Microwave Imager, 42Microwave Limb Sounder, 107Microwave Scanning Radiometer, 58Microwave Sounding Unit, 40Microwave Temperature Sounder, 42Microwave Water Vapor Sounder, 42Military operations
civilian satellite characteristics, 148-154issues for Congress, 165market motives, 164remote sensing missions, 145-148use of civilian satellites, 81, 154-165
MIMR. See Multifrequency Imaging Microwave RadiometerMINT. See Michelson InterferometerMir space station, 181MISR. See Multiangle Imaging Spectra-RadiometerMission to Planet Earth
budget, 18-23current research efforts, 101description, 16-18global change research, 65-72,73
Index I 197
improving the use of research data, 29new technology for, 136-137
ML-S. See Microwave Limb SounderModerate Resolution Imaging Spectrometer, 105-106MODIS. See Moderate Resolution Imaging SpectrometerMOP. See Meteosat Operational ProgrammeMOPITT See Measurements of Pollution in the TroposphereMOS. See Marine Observation SatelliteMPIR. See Multispectral Pushbroom Imaging RadiometerMSR. See Microwave Scanning RadiometerMSU. See Microwave Sounding UnitMIT. See Multispectral Thermal ImagerMTPE. See Mission to Planet EarthMultiangle Imaging Spectra-Radiometer, 106Multifrequency Imaging Microwave Radiometer, 107Muhispectral Electronic Self-searming Radiometer, 58Multispectral Pushbroom Imaging Radiometer, 138Multispectral Thermal Imager, 140-141
N-ROSS. See Navy Remote Ocean Sensing SatelliteNASA. See National Aeronautics and Space AdministrationNational Aeronautics and Space Act of 1958, 12National Aeronautics and Space Administration
cooperative research development with NOAA, 36-39developing a strategic plan for remote sensing, 26-27global change research, 65-72,73global research budget, 13Landsat program, 48-52Mission to Planet Earth, 16-18, 101-107remote sensing budget, 18-23
National Environmental Satellite, Data, and InformationService, 14, 24
National Natural Resources Management System, 53National Oceanic and Atmospheric Administration
data processing coordination with DoD, 42,43-44developing a strategic plan for remote sensing, 26-27environmental earth observations, 14-15the geostationary satellite system, 34-37, 38-39the polar-orbiting satellite system, 37-43remote sensing budget, 18, 23-24
National Oceanic Satellite System, 56National Remote Sensing Agency, 183National Space Policy Directive 7,28National Weather Service, 14,34Navy Remote Ocean Sensing Satellite, 56NESDIS. See National Environmental Satellite, Data, and
Information ServiceNimbus 7, 55NNRMS. See National Natural Resources Management
SystemNOAA. See National Oceanic and Atmospheric
AdministrationNOSS. See National Oceanic Satellite System
NRSA. See National Remote Sensing AgencyNSPD7. See National Space Policy Directive 7
Ocean Color and Temperature Scanner, 177-178Ocean remote sensing
Canada, 57description, 54-55European Space Agency, 57-58, 168, 172France, 58, 175Japan, 58, 176observations of sea ice, 56-57operational uses of ocean satellites, 56Orbital Sciences Corp., 59,61research of ocean phenomena, 55-56Russia, 61, 180sensor design and selection, 60, 61United States, 61United States/France, 58, 175
OCTS. See Ocean Color and Temperature ScannerOffice of Science and Technology Policy, 31Okean-0, 180OLS. See operational Linescan SystemOperational Linescan System, 42Operational Satellite Improvement Program, 36,38Orbital Sciences Corporation, 59,61OSC. See Orbital Sciences CorporationOSIP, See Operational Satellite Improvement ProgramOzone depletion, 102, 115. See also Radiative forcings
Perseus, 79, 127-128Platforms
role of small satellites, 128satellite v. non-satellite data collection, 124-125unpiloted air vehicles, 125-128
POEM. See Polar Orbit Earth Observation MissionPOES, See Polar-orbiting Operational Environmental
SatellitePolarization and Directionality of the Earth’s Reflectance,
177-178Polar Orbit Earth Observation Mission, 41Polar-orbiting Operational Environmental Satellite
future of, 14-15weather observations, 37-43
POLDER. See Polarization and Directionality of the Earth’sReflectance
Private sectorpartnership with government for system development,
92-93role in remote sensing, 85-88use of land remote sensing, 28, 85-88
Process studies, 79-80Pushbroom detectors, 139, 142-143
198 I Remote Sensing From Space
Radar altimetersdescription, 6ocean remote sensing, 57
Radarsat, 57Radar sensors, 6Radiation budget, 8,79, 129-131Radiative feedbacks, 76, 112Radiative forcings, 76, 112-113Radiometers. See also Advanced Very High Resolution
Radiometerimaging, 6ocean remote sensing, 57polar-orbiting operational environmental satellites, 40,41
Radiometric resolution, 60Radiosondes, 41Reagan Administration, NASA funding, 38Reconnaissance, 81-82, 146-147Remote Sensing Technology Center of Japan, 58, 178-179Resolution, role in military detection, 148-151RESTEC. See Remote Sensing Technology Center of JapanResurs satellites, 54, 180-181Retroreflector in Space, 177RIS. See Retroreflector in SpaceRohini series, 181Russia
environmental satellite system, 44-45, 179-180land remote sensing, 54, 180-181MIR space station, 181ocean remote sensing, 61, 180-181possible coordination of satellite research, 31
S-GCOS. See Space-based Global Change ObservationSystem
SAFISY. See Space Agency Forum on International SpaceYear
SAGE III. See Stratospheric Aerosol and Gas ExperimentSanta Barbara Research Center, 144SAR. See Synthetic Aperture RadarSARSAT. See Search and Rescue Satellite Aided Tracking
SystemSatellite de Coleta de Dados, 184-185satellites
applications of remote sensing, 6-10benefits of remote sensing, 22,24-25control, 153costs, 24-25, 153, 154current remote sensing systems, 2, 72-73earth monitoring satellites, 3international coordination of research, 31metric, 152military use against U. S., 162-164NOAA’s operational meteorological systems, 14-15nonsatellite data, 77-78, 124-125
role of private sector, 85-88small systems, 73-76, 128-129spectrum, 151stereoscope, 151-152throughput, 153timeliness, 152-153USe in military operateions, 154-162
SBRC. See Santa Barbara Research CenterSBUV/2. See Solar Backscatter Ultraviolet Radiometer/2Scanning Multichannel Microwave Radiometer, 55Scatterometer
aboard ADEOS satellite, 24description, 6EOS Phase One, 105NASA, 177-178ocean remote sensing, 56, 57
SCD. See Satellite de Coleta de DadosSea ice. See Ocean remote sensingSea-viewing Wide Field of view Sensor
EOS Color, 106EOS Phase One, 104surface remote sensing, 59, 61
Search and Rescue Satellite Aided Tracking System, 40Seasat, 55-56SeaStar satellite, 59,61,87SeaWiFS. See Sea-viewing Wide Field of view SensorSEM. See Space Environment MonitorSensoriamento Remoto satellites, 185Sensors
applications, 6-10design and selection, 60,61developing new systems, 28how SensOrS WOrk, 5-6for land remote sensing, 49-50research cooperation between NASA and NOAA, 36-37
Shuttle Imaging Radar, 118, 123Shuttle orbiters, 22SIMS. See Small Imaging Multispectral SpectrometerSIR-C. See Shuttle Imaging RadarSmall Imaging Multispectral Spectrometer, 140SMMR. See Scanning Multichannel Microwave RadiometerSolar BackScatter Ultraviolet Radiometer/2,40Solar radiation, 6,7Sounders, 6,37,40Space Agency Forum on International Space Year, 187Space-based Global Change Observation System, 28-29Space Environment Monitor, 40Space program
applications of remote sensing, 6-10collecting routine earth observations, 27-28developing a strategic plan for remote sensing, 26-27future of civilian program, 11-13global change research, 28-29

Index I 199
improving the use of data, 29-30remote sensing defintion, 5role of private sector, 85-88U.S. space policy, 90
Spectral resolution, 60, 151SPOT. See Systeme Pour d’Observation de la TerreS&R. See Search and Rescue Satellite Aided Tracking
SystemSSR. See Sensoriamento Remoto satellitesSSU. See Stratospheric Sounding UnitStratospheric Aerosol and Gas Experiment
Climsat, 133, 135EOS Aero, 106
Stratospheric Sounding Unit, 40Surface remote sensing. See also Land remote sensing;
Ocean remote sensinginternational cooperative development program, 92
Synthetic Aperture Radardescription, 118-123
ocean remote sensing, 56-58, 61Systeme Pour d’Observation de la Terre
description, 52-53, 173-174
military uses, 81-84SPOT Image, S. A., 53
Technology issuesdeveloping advanced remote sensing systems, 135-141EOS program restructuring, 110-124Landsat follow-ens, 140-144overview, 109-110platforms, 124-135
Television Infrared Observing Satellites, 14-15Temporal resolution, 60TES. See Tropospheric Emission SpectrometerTIROS. See Television Infrared Observing SatellitesTOMS. See Total Ozone Mapping SpectrometerTOPEX/Poseidon
description, 58, 175EOS Phase One, 105
Total Ozone Mapping SpectrometerEOS Phase One, 104-105NASA, 177-178polar-orbiting satellite, 41research cooperation between NASA and NOAA, 36
TRMM. See Tropical Rainfall Measurement MissionTropical Rainfall Measurement Mission, 105Tropospheric Emission Spectrometer, 106
UARS. See Upper Atmosphere Research SatelliteUAVS. See Unpiloted air vehiclesUnpiloted air vehicles
advantages, 125-128description, 79-80, 125-126Perseus, 127-128specifications, 127
Upper Atmosphere Research Satellitecost performance, 23global change research, 69,70project goals, 105
U.S. Global Change Research ProgramClimsat, 76-77complementing satellite measurements, 77-78coordination of global change research, 28-29current research efforts, 100description, 63-64existing satellite systems, 72-73Mission to Planet Earth, 65-72non-space-based research, 17process studies, 79-80program structure, 72purpose, 13small satellites, 73-76unpiloted air vehicles, 79-80
USGCRP. See U.S. Global Change Research Program
Value-added services, 85-86Visible and ThermaI Infrared Radiometer, 58VTIR. See Visible and Thermal Infrared Radiometer
Weather monitoringgeostationary satellite system, 34-37international cooperation, 90meteorological satellite system, 42-44non-U.S. environmental satellite systems, 44-45observations of satellite sensors, 33-34operational meteorological satellite systems, 14-15polar-orbiting satellite system, 37-43
Wedge Spectrometer, 144Wide Field Sensor, 53WiFS. See Wide Field SensorWind scatterometer, 57WMO. See World Meteorological OrganizationWorld Meteorological Organization, 35,41,90WorldView Imaging Corporation, 87