the future of biogas in europe 1997
TRANSCRIPT
<CvVXX®VWorkshop. Sf
*vyy^ir -D>r--3o7?
°<Jr
THE FUTURE OF BIOGASIN EUROPE
Proceedings RECEIVES)
Herning Congress Centre Denmark
September 8, 9 & 10 1997
ALTENER
Seminar * Workshop * Study Tour
THE FUTURE OF BIOGAS IN EUROPE
1997
Edited byJens Bo Holm-Nielsen
Institute of Biomass Utilization and Biorefinery South Jutland University Centre
(SUC)
Organisers:Institute of Biomass Utilization and Biorefinery, SUC
in co-operation with the WfE partners ALTENER Waste for Energy Network
Published by: BioPress, Risskov
COLOPHON
This report has been prepared within the framework of Waste for Energy, Biogas Sector coordination, under the ALTENER Programme by the Institute of Biomass Utilization and Biorefinery, South Jutland University Centre (SUC).
Management and coordination of the WfE, Biogas sector programme are entrusted to:
SUCSouth Jutland University Centre Niels Bohrs Vej 9 DK- 6700 Esbjerg, Denmark Phone: + 45 79 141111 Fax: + 45 79 141199 E-mail: [email protected]
Contact persons: J.B. Holm-Nielsen, J. Lind & T. A1 Seadi
WfE-network group does not guarantee the correctnes and/or completness of data, designs, constructions, products or production processes included or described in this report or their suitability for any specific application.
Date of completion of this report: August 1997
ISBN: 87-90074-12-2
Additional copies of this report are available from: Institute of Biomass Utilization and Biorefinery, SUC Niels Bohrs Vej 9 DK-6700 Esbjerg, Denmark
B
DISCLAIMER
Portions of this document may be illegible electronic image products. Images are produced from the best available original document.
CONTENTS page
PROGRAMME...........................................................................................................................................E
LIST OF SPEAKERS.................................................................................................................................G
LIST OF WfE-NETWORK..........................................................................................................................I
LIST OF PARTICIPANTS......................................................................................................................... J
PREFACE..................................................................................................................................................Q
ACKNOWLEDGEMENT.......................................................................................................... :.............. R
The Future of Biogas in Denmark and Europe............................................................................................1
Johannes Christensen
Strategies on Biomass Energies in EU........................................................................................................ 12
Emmanuel Xenakis
Centralized co-digestion and efficient nutrient recycling............................................................................ 15
S0ren Tafdrup
Different systems and approaches to treat municipal solid waste - a state-of the art assessment.................21
A. Krieg
Farm Scale Biogas Concepts in Europe...................................................................................................... 30
A. Wellinger
Biogas - Agriculture and Environment...................................................................................................... 39
LeifKnudsen
Hygiene and Sanitation Requirements in Danish Biogas Plants..................................................................50
HJ. Bendixen
c
Monotormg and Controlling the Biogas Process........................................................................................ 59
Birgitte K. Ahring
Co-digestion of ley crop silage, straw and manure..................................................................................... 74
Ake Nordberg
Farm-scale biogas development in Southern Germany...................................................................................... 82
Erwin Koberle
Biogas production and biogas as vehicle fuel - Swedish experiences........................................................... 90
Anna E. Lindberg
Integration of Biogas in Municipal Energy Planning and Supply...............................................................96
Niels Nedergaard
The co-digestion of animal manure and food industry residues in the UK; the role of the NFFO as a catalyst................................................................................................................................................ 103
Clare T Lukehurst
Treatment and Trade of Organic Manures in the Future........................................................................ 110
J.CA.M. Verkuyten,
Biogas/Fossil gas options: The future for integration of biogas in the natural gas sector in Denmark and in Europe..........................................................................................................................................115
Anker Biering Jensen
Fiscal Instruments for the Financial Support of Renewables in the Netherlands...................................... 118
D
PROGRAMME - Sunday 7 September 1997
Arrival and hotel check-in for international participants.
PROGRAMME - Monday 8 September 1997
The European Waste for Energy network welcomes all the participants to “The Future of Biogas in Europe". This event is part of the ALTENER Programme 1997.
The prime objectives are to create a forum for further development of biogas and to contribute to the dissemination of knowledge of biogas technologies. The main topics will be implementation, commer? cial exploitation and promotion of opportunities in anaerobic digestion and biogas energy conversion from organic waste, animal manure and a wide range of other biomass resources.
Seminar:09.00-09.10 Opening Addresses, by Niels Nedergaard, Director, Herning Municipal Utilities and
Jens Bo Holm-Nielsen, M.Sc., Chairman of the Organising Group.
09.10 - 09.30 Future of Biogas in Denmark & Europe, by Johannes Christensen, Seminar Chairman, Head of Dept., Danish Institute of Agricultural and Fisheries Economics.
09.30 - 09.50 Strategies on Biomass Energies in EU. Different EU programmes and policies thatrelate to development of the European Biogas Sector, by Emmanuel Xenakis, Principal Administrator, ALTENER, DG XVII, European Commission.
09.50-10.10 Coffee break.
10.10 -10.35 Centralised co-digestion and efficient nutrient recycling, by Seren Tafdrup, M.Sc.,Danish Energy Agency.
10.35 -11.00 Combined anaerobic/aerobic treatment of organic household waste. CentralEuropean concepts. (TBW-process, Valorca, Dranco, Compogas etc) by Andreas Krieg, M.Sc., TBW GmbH, Frankfurt, Germany.
11.00 -11.30 Farm-scale biogas concepts in Europe, by Dr. Arthur Wellinger, NOVA Energie, Schwitzerland.
11.30 -12.00 Biogas - Agricultural and Environmental benefits, by Leif Knudsen, M.Sc., DanishFarmers' National Advisory Centre, Arhus.
12.00-13.15 Lunch.
13.15 -13.45 Hygiene and Sanitation Requirements in Danish Biogas Plants, by Dr. med. vet.H.J. Bendixen, Holeby, Denmark.
13.45 -14.15 Process control for optimised biogas production in large scale biogas plants, by Associate Professor Birgitte Ahring, Danish Technical University.
14.15 -14.45 Co-digestion of ley crop silage, straw and manure, by Ake Nordberg, SeniorResearch
Workshop: BUSINESS FORUM / MEETING POINTS15.00 -18.00 Workshop Chairmen: Jeanne Moller, Director, EIEE & Arne Jensen, Head of department,
EURA.
19.00 - CULTURAL ARRANGEMENT & RECEPTION.
E
PROGRAMME - Tuesday 9 September 1997
Seminar:08.30 - 09.10 Farm-scale biogas development in Southern Germany, including the latest stirring
systems, digester concepts and cogeneration, by Erwin Koberle, M.Sc., Biogaskontor, Obermarchtal, Germany.
09.10 - 09.40 Swedish Biogas Experiences, including - Biogas as transportation fuel, by Anna Lindberg, M.Sc., VBB Viak, Stockholm, Sweden.
09.40 -10.00 Biogas and bioenergy integration in the municipal energy planning and energy supply, by Niels Nederg&rd, Director, Herning Municipal Utilities, Denmark.
10.00 -10.15 Coffee break
10.15 -12.00 Visit to Studsgard Biogas Plant (co-digestion of MSW, food waste and animal manure) and Biogas combined heat and power unit.
12.00-13.15 Lunch.
13.15 -13.35 Co-digestion of animal manure and food industry residues in the UK; the role of NFFO as a catalyst, by Dr. Clare T. Lukehurst, Broadstairs, Kent, United Kingdom.
13.35 -13.55 European Manure Association - treatment and trade of organic manure in the future? by Jurgen Verkuyten, Director, EMA & Mestbureau Cost, The Netherlands.
13.55 -14.15 Biogas/Fossil gas options: the future for integration of biogas in the natural gas sector, in Denmark and in Europe, by Anker Biering Jensen, Planner, Naturgas Midt-Nord, Viborg, Denmark.
14.15 -14.45 Financial incentives for biomass and waste-to-energy systems, by Edward Pfeiffer, M.Sc., NOVEM, The Netherlands.
14.45 -15.00 End of Seminar sessions: open microphone discussion.
Workshop: BUSINESS FORUM / MEETING POINTS15.00 -18.00 Workshop Chairmen: Jeanne Moller, Director, EIEE & Arne Jensen, Head of department,
EURA.
PROGRAMME - Wednesday 10 September 1997
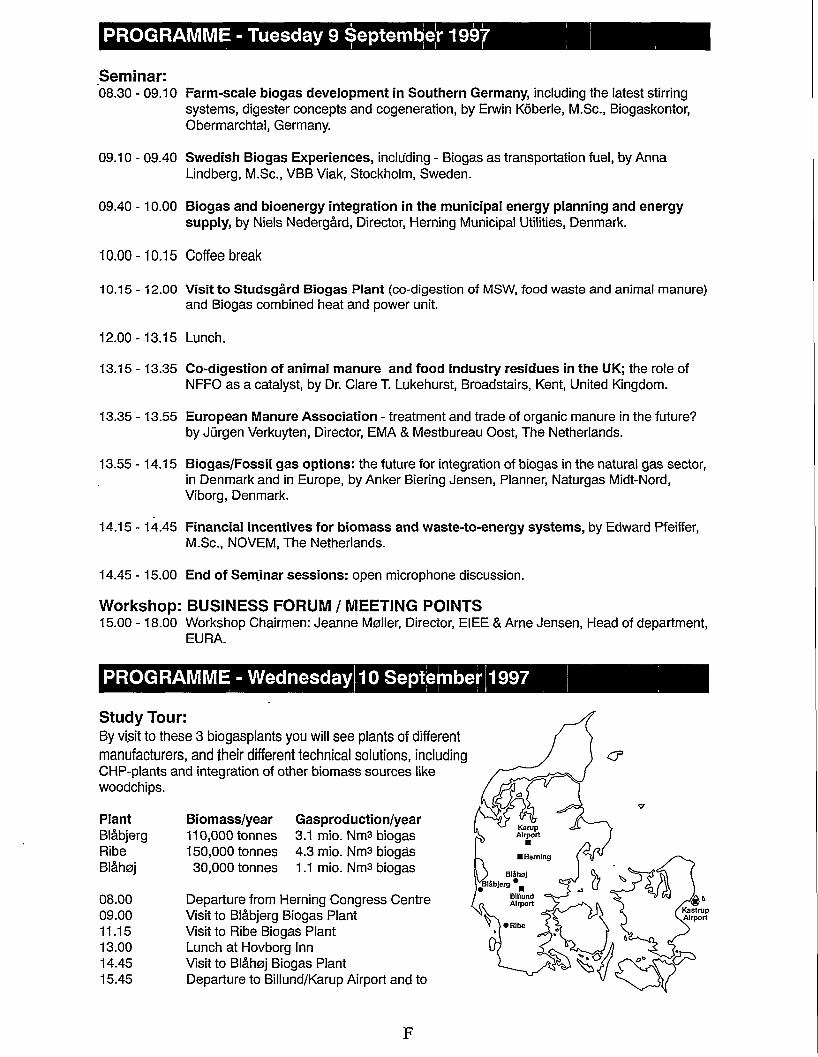
Study Tour:By visit to these 3 biogasplants you will see plants of different manufacturers, and their different technical solutions, including CHP-plants and integration of other biomass sources like woodchips.
PlantBl&bjergRibeBlAhoj
Biomass/year110.000 tonnes150.000 tonnes 30,000 tonnes
Gasproduction/year3.1 mio. Nms biogas 4.3 mio. Nm3 biogas1.1 mio. Nm3 biogas
08.00 Departure from Herning Congress Centre09.00 Visit to Bl&bjerg Biogas Plant11.15 Visit to Ribe Biogas Plant13.00 Lunch at Hovborg Inn14.45 Visit to Blcihej Biogas Plant15.45 Departure to Billund/Karup Airport and to
KarupAirport
■Herning
tilSbjergBillundAirport
Kastrup.Airport
• Ribe
F
LIST OF SPEAKERS
Johannes ChristensenDanish Institute of Agricultural and Fisheries EconomicsTofteg&rds Plads, Gl. K0ge Landevej 1-3DK-2500 Valby, DENMARKPhone: +45 36 442080 Fax: +45 36 441110
Emmanuel XenakisEuropean CommisionDirectorate - General XVII -EnergyAvenue de Tervuren/Tervurenlaan 226B-1049 Brussels, BELGIUMPhone: +32 2 295 5135 Fax: +32 2 295 5852
S0ren TafdrupDanish Energy Agency,Amaliegade 44DK-1256 Copenhagen K, DENMARK Phone: + 45 33926700 Fax: +45 33 114743 E-mail: [email protected]
Andreas Krieg TBW GmbH Baumweg 10,D-60316 Frankfurt, GERMANYPhone: +49 6994 35070 Fax: +49 6994 350711
Arthur Wellinger NOVA Energie P.O. Box 73CH- 8356 Ettenhausen, SWITZERLAND Phone: +41 5236 83470 Fax: +41 5236 54320
LeifKnudsenThe Danish Agricultural Advisory Centre Udkaersvej 15, Skejby DK-8200 Arhus N, DENMARK Phone: +45 87 405000 Fax: +45 87 405090
H.J. Bendixen Torslundevej 51DK- 4960 Holeby, DENMARK Phone/Fax: +45 53 906833
Birgitte AhringThe Technical University of Denmark, Department of Environmental Science and Engineering, Bygning 115,DK-2800 Lyngby, DENMARKPhone: + 45 45 251566 Fax: +45 45 932850E-mail: [email protected]
Ake NordbergSwedish Institute of Agricultural EngineeringP.O.Box 7033S-750 07 Uppsala, SWEDENPhone: +46 018-303300 Fax: +46 018-300956E-mail: [email protected]
Erwin Koberle Biogaskontor Hauptstrasse 6,D-89611 Obermarchtal, GERMANY Phone: +49 7375 92005 Fax: +49 7375 92006 E-mail: [email protected]
Niels Nedergaard Herning Municipal Utilities Enghavevej 10DK-7400 Herning, DENMARK Phone: +45 99 268211 Fax: +45 99 268212
Anna Lindberg VBB Viak Box 34044S-100 26 Stockholm, SWEDENPhone: +46 8-695 60 00 Fax: +46 8-695 62 40E-mail: [email protected]
G
Clare T. LukehurstRenewable Energy and Rural Development Consultant52, Broadstairs Road, Broadstairs UK-Kent CT10 2 RJ, UNITED KINGDOM Phone/fax: +44 1843 861690
Jurgen Verkuyten EMA & Mestbureau Oost Postbus 828NL-7400 AV Deventer,THE NETHERLANDSPhone: +31 570 661566 Fax: +31 570 661555
Anker Biering JensenNaturgas Midt-nordVognmagervej 14DK-8800 Viborg, DENMARKPhone: +45 86 626499 Fax: +45 86 628751E-mail: [email protected]
Edward Pheiffer NOVEMCatharijnesingel 59, Postbus 8242 NL-3503 RE Utrecht, THE NETHERLANDS Phone: +31 30-2393493 Fax: +31 30-2316491
H
LIST OF WfE-NETWORK
Olivia MatosC.B.E., Centro de Biomassa para a Energia Apartado 49,3220 Miranda do Corvo, PORTUGAL Phone: +351 39 52488/36 Fax: +351 39 52452 E-mail: [email protected]
Kees Kwant NOVEMCatharijnesingel 59, PO Box 8242 3503 RE Utrecht, THE NETHERLANDS Phone:+31 30 239 3631 Fax:+31 30 231 64 91 E-mail: [email protected]
Constantino DalianisCRES, Center for Renewable Energy Sources 19th Km Marathonos Av.GR 190 09 Pikermi, Attiki, Athens, GREECE Phone: +30 1 603 9900 Fax: +30 1 603 9904 -5 E-mail: [email protected]
Luis EstabanCIEMAT, Institute de Energias RenovalbesCtraN-11142290 Lubia, SPAINPhone /fax: +34 75 281013E-mail: [email protected]
Guiseppe Caserta ITABIASede operativa c/o RENAGRI Via Tommaso Grossi, 6 00184 Roma, ITALYPhone: +39 6 77720 1038 Fax: +39 6 700 9380E-mail: [email protected]
Alfred SchmidtTU Wien, Institute of Chemical Engineering,Fuel and Environmental TechnologyGetreidemarkt 9A-1060 Wien, AUSTRIAPhone: +43 158801 Fax: +43 15876394E-mail: [email protected]
Hans Falsterdk TEKNIKGladsaxe Mpllevej 15DK- 2860 Spborg, DENMARKPhone: +45 39 696511 Fax: +45 39 696002E-mail: [email protected]
Satu Helynen WT EnergyKoivurannantic 1, PO Box 1603 FIN- 40101 Jyvaskyla, FINLAND Phone: +358 14 672 550 Fax: +358 14 672 598 E-mail: [email protected]
Magdalena SvenssonNUTEK, Swedish National Board for Industrial and Technical Development S- 11786 Stockholm, SWEDEN Phone: +46 8 681 9393 Fax: +46 8 681 9328 E.-mail: [email protected]
Jens Bo Holm-NielsenInstitute of Biomass Utilization andBioreferiny, South Jutland University CentreNiels Bohrs Vej 96700 Esbjerg, DENMARKPhone: +45 79141111 Fax:+45 79 141199E-mail: [email protected]
I
LIST OF PARTICIPANTSRegistreted the 20th August 1997
COUNTRY COMPANY NAME
Armenia Department of Prospective Development Yeravan
Ruben Egoryan
Austria JoanneumResearch/LandesenergievereinSteiermark
Gerfreid Jungmeier
Belgium Biotim Jan Liessens
Belgium European Commision Emmanuel Xenakis
Belgium University of Liege Michel Crine
Denmark H.J. Bendixen
Denmark Niels Defour
Denmark Bioplan Ltd. Per Thostrup
Denmark Bioscan Ltd. Birger Nordahl
Denmark Bioscan Ltd. Finn Rasmussen
Denmark Burmeister & WainScandinavian Constractor Ltd.
Erik Breiner Kristensen
Denmark Carl Bro Ltd. Spren Krasmer
Denmark Danish Biomass Association Jprgen Blinkenberg Grosen
Denmark Danish Directorat for Development
Finn Rexen
Denmark Danish Energy Agency S0ren Tafdrup
Denmark Danish Institute of Agricultural and Fisheries Economics
Johannes Christensen
Denmark Danish Institute of Agricultural and Fisheries Economics
Kurt Hjort-Gregersen
J
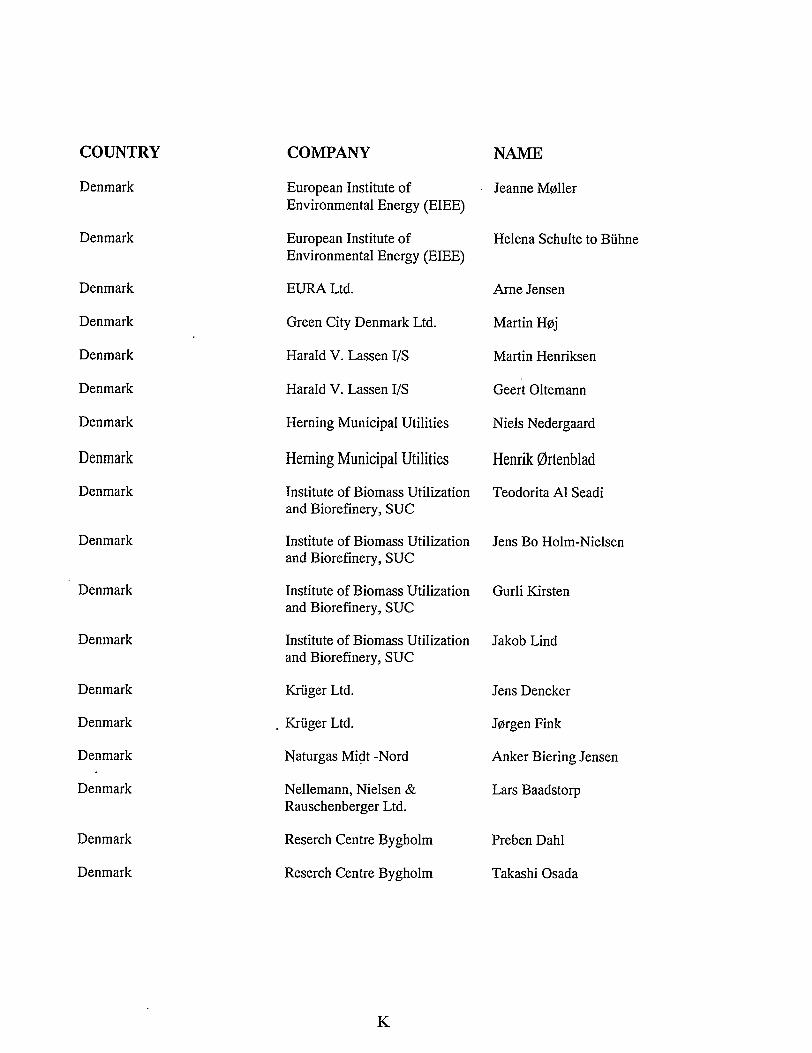
COUNTRY COMPANY NAME
Denmark European Institute of Environmental Energy (EIEE)
Jeanne Mpller
Denmark European Institute of Environmental Energy (EIEE)
Helena Schulte to Buhne
Denmark EURA Ltd. Arne Jensen
Denmark Green City Denmark Ltd. Martin Hpj
Denmark Harald V. Lassen I/S Martin Henriksen
Denmark Harald V. Lassen I/S Geert Oltemann
Denmark Herning Municipal Utilities Niels Nedergaard
Denmark Herning Municipal Utilities Henrik 0rtenblad
Denmark Institute of Biomass Utilization and Biorefinery, SUC
Teodorita A1 Seadi
Denmark Institute of Biomass Utilization and Biorefinery, SUC
Jens Bo Holm-Nielsen
Denmark Institute of Biomass Utilization and Biorefinery, SUC
Gurli Kirsten
Denmark Institute of Biomass Utilization and Biorefinery, SUC
Jakob Lind
Denmark Kruger Ltd. Jens Dencker
Denmark . Kruger Ltd. Jprgen Fink
Denmark Naturgas Midt -Nord Anker Biering Jensen
Denmark Nellemann, Nielsen & Rauschenberger Ltd.
Lars Baadstorp
Denmark Reserch Centre Bygholm Preben Dahl
Denmark Reserch Centre Bygholm TakashiOsada
K
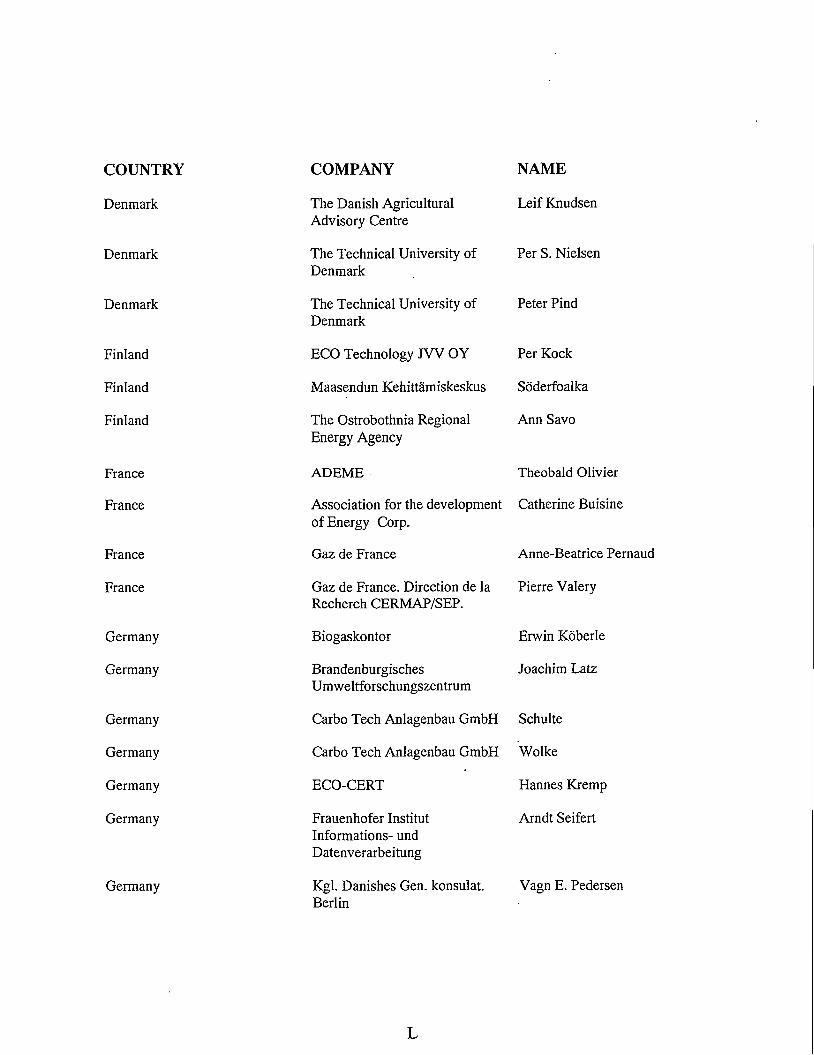
COUNTRY COMPANY NAME
Denmark The Danish AgriculturalAdvisory Centre
Leif Knudsen
Denmark The Technical University of Denmark
Per S. Nielsen
Denmark The Technical University of Denmark
Peter Find
Finland ECO Technology JW OY Per Kock
Finland Maasendun Kehittamiskeskus Soderfoalka
Finland The Ostrobothnia Regional Energy Agency
Ann Savo
France ADEME Theobald Olivier
France Association for the development of Energy Corp.
Catherine Buisine
France Gaz de France Anne-Beatrice Pernaud
France Gaz de France. Direction de la Recherch CERMAP/SEP.
Pierre Valery
Germany Biogaskontor Erwin Koberle
Germany BrandenburgischesUmweltforschungszentrum
Joachim Latz
Germany Carbo Tech Anlagenbau GmbH Schulte
Germany Carbo Tech Anlagenbau GmbH Wolke
Germany ECO-CERT Hannes Kremp
Germany Frauenhofer Institut Informations- und Datenverarbeitung
Arndt Seifert
Germany Kgl. Danishes Gen. konsulat. Berlin
Vagn E. Pedersen
L
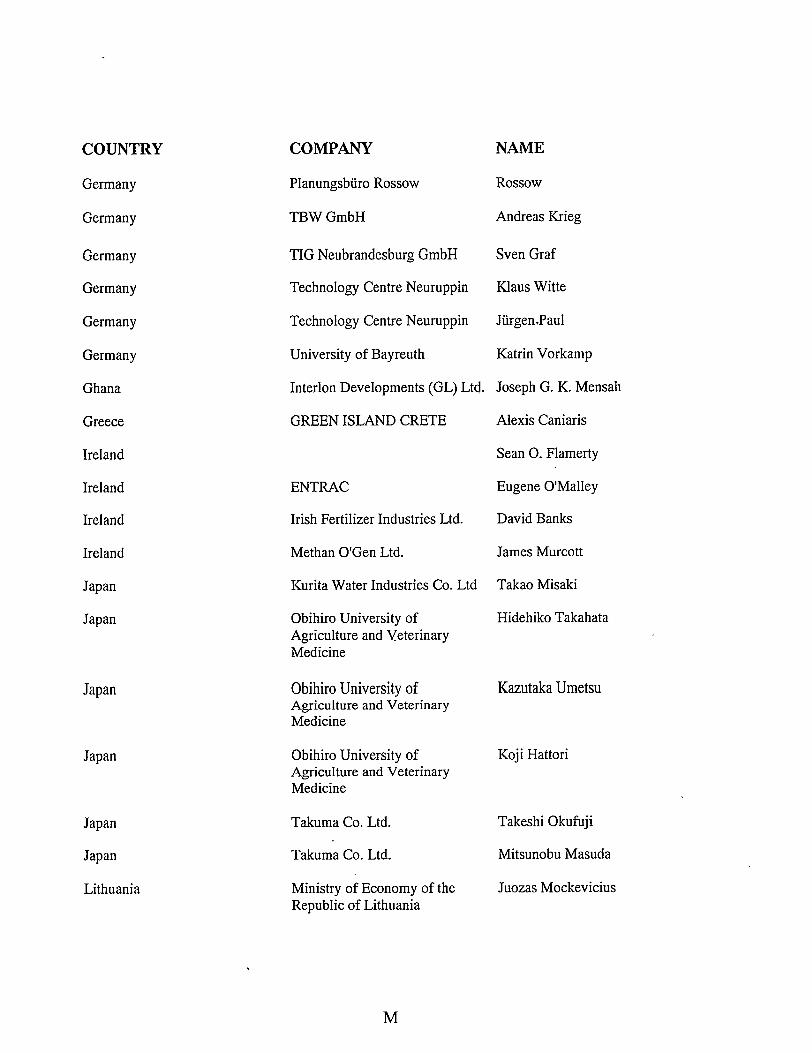
COUNTRY COMPANY NAME
Germany Planungsburo Rossow Rossow
Germany TBW GmbH Andreas Krieg
Germany TIG Neubrandesburg GmbH Sven Graf
Germany Technology Centre Neuruppin Klaus Witte
Germany Technology Centre Neuruppin Jurgen.Paul
Germany University of Bayreuth Katrin Vorkamp
Ghana Interlon Developments (GL) Ltd. Joseph G. K. Mensah
Greece GREEN ISLAND CRETE Alexis Caniaris
Ireland Sean 0. Flamerty
Ireland ENTRAC Eugene O'Malley
Ireland Irish Fertilizer Industries Ltd. David Banks
Ireland Methan O'Gen Ltd. James Murcott
Japan Kurita Water Industries Co. Ltd Takao Misaki
Japan Obihiro University ofAgriculture and Veterinary Medicine
Hidehiko Takahata
Japan Obihiro University ofAgriculture and Veterinary Medicine
Kazutaka Umetsu
Japan Obihiro University ofAgriculture and Veterinary Medicine
Koji Hattori
Japan Takuma Co. Ltd. Takeshi Okufuji
Japan Takuma Co. Ltd. Mitsunobu Masuda
Lithuania Ministry of Economy of the Republic of Lithuania
Juozas Mockevicius
M
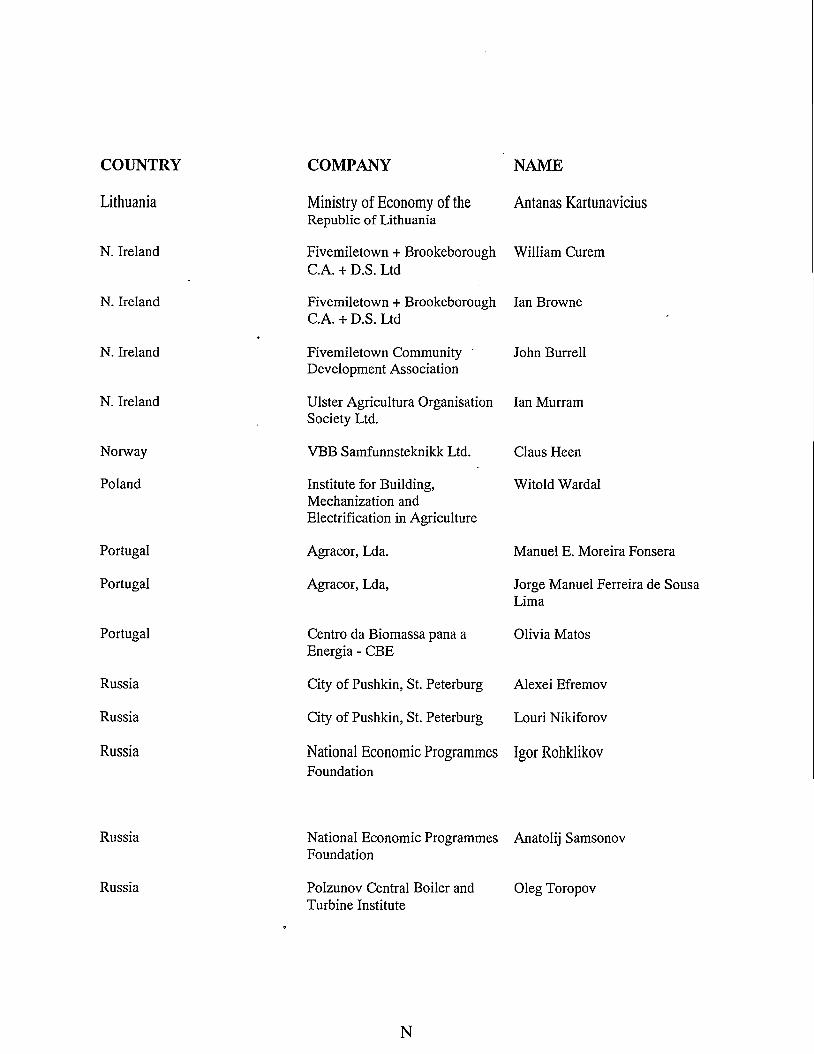
COUNTRY COMPANY NAME
Lithuania Ministry of Economy of theRepublic of Lithuania
Antanas Kartunavicius
N. Ireland Fivemiletown + Brookeborough C.A. + D.S. Ltd
William Curem
N. Ireland Fivemiletown + Brookeborough C.A. + D.S. Ltd
Ian Browne
N. Ireland Fivemiletown Community ' Development Association
John Burrell
N. Ireland Ulster Agricultura Organisation Society Ltd.
Ian Murram
Norway VBB Samfunnsteknikk Ltd. Claus Keen
Poland Institute for Building, Mechanization andElectrification in Agriculture
Witold Wardal
Portugal Agracor, Lda. Manuel E. Moreira Fonsera
Portugal Agracor, Lda, Jorge Manuel Ferreira de Sousa Lima
Portugal Centro da Biomassa pana a Energia - CBE
Olivia Matos
Russia City of Pushkin, St. Peterburg Alexei Efremov
Russia City of Pushkin, St. Peterburg Louri Nikiforov
Russia National Economic Programmes Foundation
Igor Rohklikov
Russia National Economic Programmes Foundation
Anatolij Samsonov
Russia Polzunov Central Boiler and Turbine Institute
Oleg Toropov
N
COUNTRY COMPANY NAME
Spain Barcelona City Council Josep Puig
Spain LEIA Luis Becerra Carollo
Sweden Alvans Card Anders Godman
Sweden Dept. Systems Ecology /Gotland Rolf Gydemo
Sweden Jordbrukstekniska Institute! Mats Edstrom
Sweden Swedish Institut of Agricultural Engineering
Ake Nordberg
Sweden VBB Viak Anne Lindberg
Switzerland EREPSA Yves Membrez
Switzerland NOVA Energie Arthur Wellinger
The Czech Republic Czech Delegation 5x NN
The Czech Republic Energoprojekt Praha a.s Martin Handusek
The Czech Republic Energoprojekt Praha a.s Jiri Vala'sek
The Czech Republic Energoprojekt Praha a.s Toma's Folprecht
The Czech Republic Energoprojekt Praha a.s Toma's Klima
The Czech Republic R.A.B., s.r.o. Trabon Mirosjav Kajan
The Netherlands De Boo & Partner Win de Boo
The Netherlands Haskoning B.V. A.H.H.M. Schomaker
The Netherlands EMA & Mestbureau Oost Jurgen Verkuyten
The Netherlands ETC Netherlands M. Buiter
The Netherlands NOVEM Edward Pheiffer
The Netherlands Schucking Energietechniek J. Schucking
United Kingdom EU/MAFF G.N. Parker
o
COUNTRY COMPANY NAME
United Kingdom Fivemiletown + Brookeborough C.A. + D.S. Ltd
Ian Barnek
United Kingdom Porridge District Council David Pinney
United Kingdom North Tamar Business Network Charles Clarke
United Kingdom North Tamar Business Network Michael Miller
United Kingdom Renewable Energy and Rural Development Consultant
Clare T. Lukehurst
United Kingdom Torrigde District Council Bill Brook
United Kingdom Torrigde District Council Desmond Shadrick
p
PREFACE
Focus on Waste & Biomass for Energy: Altener Programme 1997The European Waste to Energy network is part of the ALTENER Programme 1997. The prime objectives of the network are the development and dissemination of strategies for promotion, implementation and commercial exploration of opportunities in energy from waste and biomass resources. During 1997 special attention is paid to energy conversion from municipal solid waste, biosas production from animal manure and organic waste, and wood residuals for energy production
Future of Biogas in EuropeThe growing awareness of the pollution problems, associated with inadequate management of animal manure and all types of organic wastes, emphasises the need for appropriate solutions to deal with the problem. A strengthening of overall policy on environmental protection, as regards waste as well as manure handling, with well defined enforcement measures, will stimulate the dissemination of biogas technologies. On the basis of production of renewable energy, the processes deliver both environmental and agricultural benefits.
The Future of Biogas in Europe is an event within the frame-work of knowledge and information exchange. The main topic of this event is production of biogas through anaerobic digestion. How much progress has been made in practice? Full scale operations throughout Europe covering all types of biogas plants will be highlighted. There will be focus on biogas technology development and technology transfer. What are the future prospects for biogas integration in the energy sector in Europe? What are the biogas potentials and the available biomass resources? Participants will have the opportunity to exchange information with other participants within the sector.
Seminar: The main topics of the seminar are the production of Biogas by Anaerobic Co-digestion - Status and Progress in Europe. Issues such as Co-digestion of Animal Manure, Municipal Solid Waste (MSW)-organic fraction, Food Waste as well as Innovative Steps and concepts of Cleaner Technologies will be presented and discussed.
Workshop: How do we get started? What are the future developmental steps? How to co-operate in the area of knowledge and know-how dissemination? This event includes business meetings, dissemination of knowledge and expertise, project contacts etc. A meeting area is available where the participants can reserve "Meeting Points" for the workshop session.
Study Tour: Visits to different types of biogas plants in the western part of Denmark will be arranged, to show the successful application of a number of renewable energy technologies. The Danish organisation group will assist in arranging visits of special interest.
Q
ACKNOWLEDGEMENT
The source of information for this book is the papers presented at the "Future of Biogas in Europe" '97 Conference September 8-10 1997 in Herning, Denmark.The event was organized jointly by WfE-nett, Waste for Energy network under the EU ALTENER programme and a Danish organizing group consisting of EURA Ltd. (Ringkpbing County Development Company), Herning Municipal Utilities, European Institute of Environmental Energy and Institute of Biomass Utilization and Biorefinery, SUC. The latest, South Jutland University Centre (SUC) served as chair of the committee. All partners involved in the organizing throughout Europe have our warmest greetings for their participation. I wish to express my gratitude to all participants, speakers and mentioned institutions. There assistance, support and enthusiasm has made the work possible, interesting and challenging.
Jens Bo Holm-Nielsen, Editor and chair of programme committee
R
THE FUTURE OF BIOGAS IN DENMARK ANDEUROPE
Johannes Christensen, Danish Institute of Agricultural and Fisheries Economics, Toftegards Plads, Gl. K0ge Landevej 1-3, DK-2500 Valby (Copenhagen)
INTRODUCTION
Production of biogas via anaerobic fermentation is a process that has been known for many years. Anaerobic fermentation is widely used in wastewater purification systems. The last decade technological breakthroughs have occured regarding the utilisation of animal manure and organic industrial and household waste in biogas systems, which have enabled a commercial utilisation to be within reach.
A large raw-material potential is existing and could form the basis for the production of renewable energy from biogas, while the biogas plant and the organisation behind it can simultaneously contribute to solving a series of environmental problems. The latter may prove to be of increasing importance to the plants' economy. Today the revenue mainly consists of the sale of energy.
The biogas plant is still very vulnerable from a commercial point of view, and the actual breakthrough is still uncertain. Relapse is still a very real possibility. A major increase in the number of biogas plants implies that the systems must be able to survive economically, mainly on the basis of the animal manure, which is by far their greatest resource. Today, animal manure is supplemented with easily digestible industrial and household waste which generates significantly greater gas production per m3 than animal manure. Therefore, the plants need to reduce operating and capital costs even further and continue to internalise their environmental advantages.
As a result, the need for continued research and development work in the field still exists, just as direct and indirect public funding is necessary to ensure an economic framework which is sufficiently favourable. Biogas systems will hardly be able to survive in the foreseeable future on normal market-economy conditions unless new energy crises and drastic price increases for fossil fuels occur.
1
POTENTIAL AND ACTUAL BIOGAS PRODUCTION
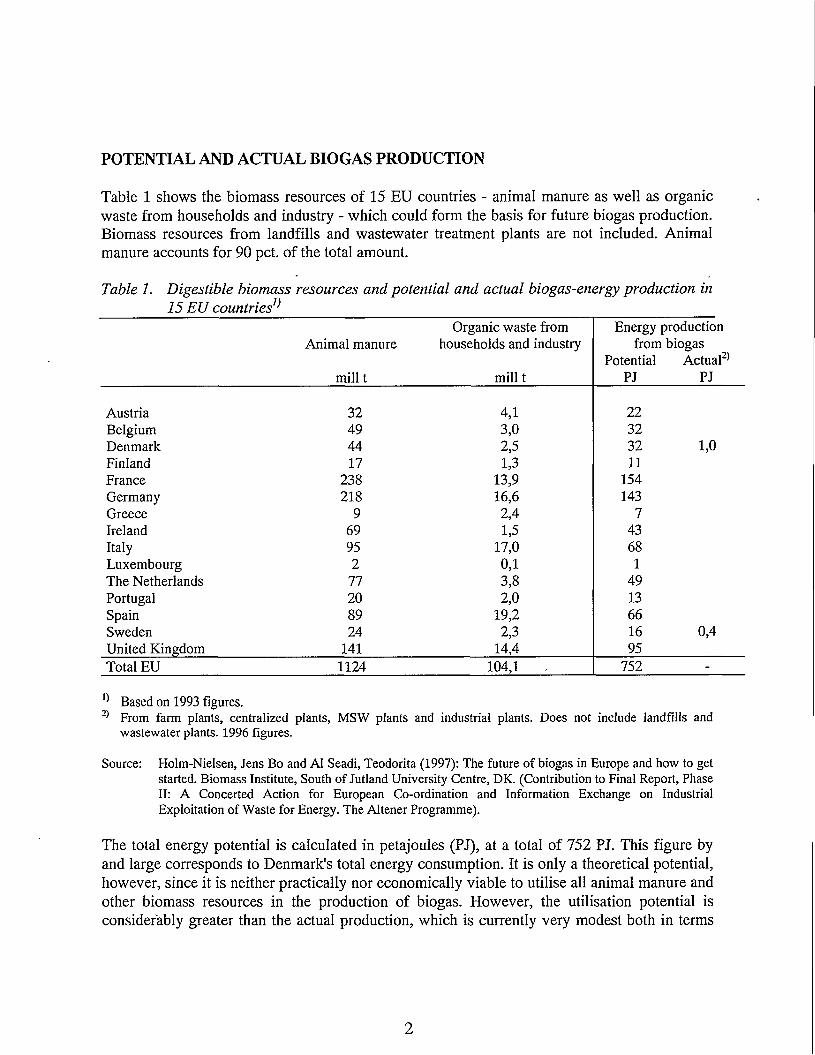
Table 1 shows the biomass resources of 15 EU countries - animal manure as well as organic waste from households and industry - which could form the basis for future biogas production. Biomass resources from landfills and wastewater treatment plants are not included. Animal manure accounts for 90 pet. of the total amount.
Table 1. Digestible biomass resources and potential and actual biogas-energy production in 15 EU countries1 ̂
Animal manure
mill t
Organic waste from households and industry
mill t
Energy production from biogas
Potential Actual^PJ PJ
Austria 32 4,1 22Belgium 49 3,0 32Denmark 44 2,5 32 1,0Finland 17 1,3 11France 238 13,9 154Germany 218 16,6 143Greece 9 2,4 7Ireland 69 1,5 43Italy 95 17,0 68Luxembourg 2 0,1 1The Netherlands 77 3,8 49Portugal 20 2,0 13Spain 89 19,2 66Sweden 24 2,3 16 0,4United Kingdom 141 14,4 95Total EU 1124 104,1 752
0 Based on 1993 figures.2) From farm plants, centralized plants, MSW plants and industrial plants. Does not include landfills and
wastewater plants. 1996 figures.
Source: Holm-Nielsen, Jens Bo and A1 Seadi, Teodorita (1997): The future of biogas in Europe and how to get started. Biomass Institute, South of Jutland University Centre, DK. (Contribution to Final Report, Phase II: A Concerted Action for European Co-ordination and Information Exchange on Industrial Exploitation of Waste for Energy. The Altener Programme).
The total energy potential is calculated in petajoules (PJ), at a total of 752 PJ. This figure by and large corresponds to Denmark's total energy consumption. It is only a theoretical potential, however, since it is neither practically nor economically viable to utilise all animal manure and other biomass resources in the production of biogas. However, the utilisation potential is considerably greater than the actual production, which is currently very modest both in terms
2
of the amount of biomass and of the country's total energy consumption. Production in Denmark and Sweden is calculated at 1 and 0.4 PJ respectively. Corresponding specifications from the other countries are unavailable, but Denmark and Sweden presumably have the greatest utilisation percentage of all countries, namely 3.1 and 2.5 respectively of the specified potential.
Denmark has 18 centralized plants and 20 farm plants in operation. In addition there are 5 plants at industrial companies. Sweden has 4 large plants based partly on household wastes, 8 industrial plants and 6 farm plants in operation. Germany has more than 200 farm plants, and there are a number of farm plants in Austria, Italy, Portugal and England.
The main conclusion is that the use of biogas in Europe is modest in relation to the raw- material potential, and biogas produces only a very small share of the total energy supply.
CONCEPTS AND TECHNOLOGY
In the last 10 years, Danish efforts have focused on developing large centralized biogas plants (see figure 1), and during the last three years also to improve the farm plants.
From the outset, the centralized plant concept was solely based on the utilisation of animal manure delivered from a group of suppliers within a radius of up to about seven kilometres from the plant. The addition of various forms of organic waste from industry soon proved beneficial, and in recent years some of the plants have been using sludge and source- sorted household wastes. The supplementary waste, for which a receiver fee is often paid to the biogas plant, usually yields more gas per m3 than animal manure.
Transport and storage systems are also connected to the centralized plants. In some cases, a post treatment of the de-gassed slurry occurs (separation). The plants are well-suited for recycling and redistributing the slurry and nutrients, partly to the group of suppliers and partly to other farmers like arable farmers who can use the surplus slurry. By so doing, the plant solves an important assignment for agriculture and the environment. The processing of slurry in the biogas system reduces obnoxious smells during spreading, and the slurry is also more homogenous and its nutrient content easier to declare. Moreover, the number of disease germs are significantly reduced.
The size of the 18 plants in operation varies from 25 to more than 400 m3 of feedstockper day. Half of the plants are based on mesophilic operation and the other half on thermophilicoperation.
The gas is normally converted at a combined heat and power plant. Electricity is sold to the grid and heat to a local district heating plant. The plant economy is very dependent on selling the energy generated at the plant, which can be a problem as far as the heat is concerned. In this regard, a connection to a district heating net is an obvious advantage, almost a necessity, which enables the generated heat to be utilized year round.
3
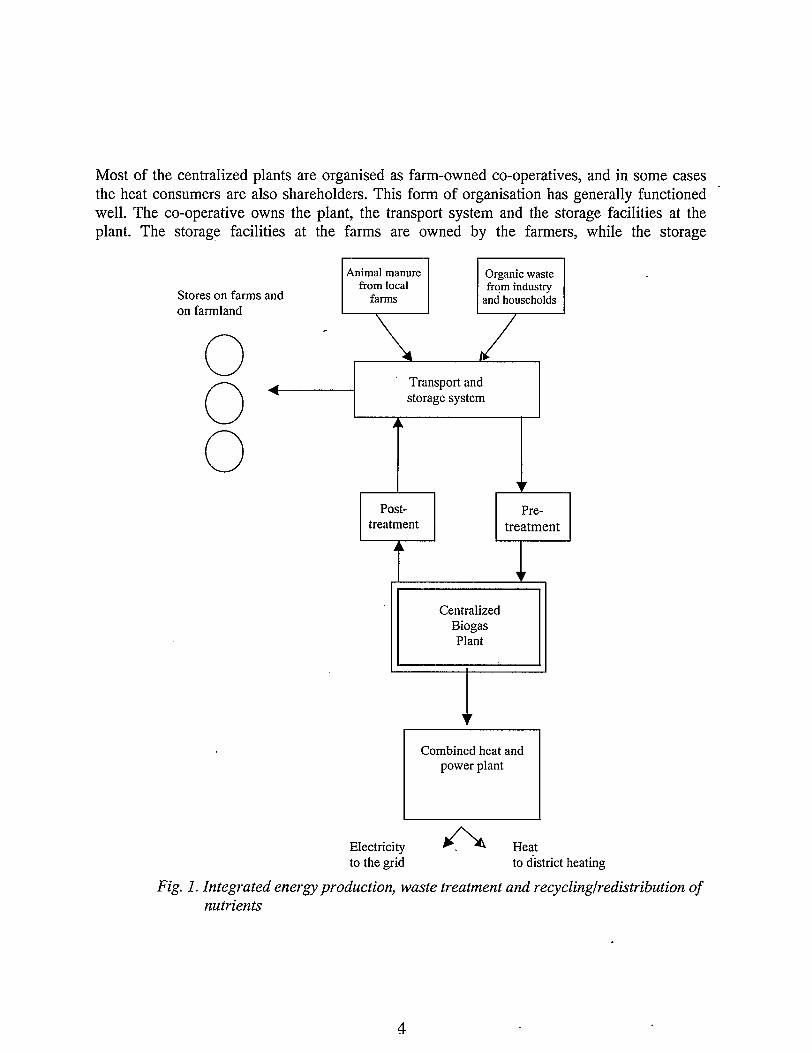
Most of the centralized plants are organised as farm-owned co-operatives, and in some cases the heat consumers are also shareholders. This form of organisation has generally functioned well. The co-operative owns the plant, the transport system and the storage facilities at the plant. The storage facilities at the farms are owned by the farmers, while the storage
Stores on farms and on farmland
Posttreatment
Pretreatment
Animal manure from local
farms
Organic waste from industry
and households
Transport and storage system
Combined heat and power plant
CentralizedBiogasPlant
Electricity to the grid
ZVHeatto district heating
Fig. 1. Integrated energy production, waste treatment and recycling/redistribution of nutrients
4
facilities placed on farmland may be owned collectively and subsequently leased to the farmers. The combined heat and power plant is owned and run for the most part by the district heating company that buys the biogas at a specified price.Considerable technological progress has been made in recent years concerning the centralized plants:
* Higher and more reliable production through the addition of organic waste as well as through technical improvements, gas extraction from storage tanks and improved control and regulation
* Development of pumps, mixers and heat exchangers resulting in savings in power consumption and fewer interruptions of operations
* Improved and less expensive gas purification and gas transport using low pressure* Criteria for neutralising infectious matter* Techniques for preventing obnoxious smells around the plants* Cheaper slurry transport and improved logistics concerning redistribution and utilisation of
slurry.
As far as the farm plants are concerned, corresponding progress has occurred in the fields of biogas production and technology. Development efforts are being staked partly on high-tech plants and partly on simpler, cheaper plants with a covered slurry tank and the reactor as an integrated section.
The primary conclusion is that the construction of technically well-functioning plants is now possible. Moreover the plants can be adopted to meet various requirements and preferences regarding the production and utilisation of biogas, which can unite agricultural, environmental and energy-related interests.
The centralized plants are forced to accept the transport of the slurry, which in a numberof instances would have happened anyway, since distribution among the farms often isnecessary. The farm plants have no transport costs. In return it can be more difficult to utilise the economy-of-scale advantages and ensure a professional operation of the plant. Likewise it can be difficult to handle waste which requires special hygienic measures and controls. Finally, the farm plants often have a problem of surplus heat in relation to the sales potential. The decision-making process involved in establishing a farm plant is relatively simple since often only one decision-maker is involved, namely the farmer. There are many parties involved at the centralized plants, and under normal circumstances, planning and preparation usually lasts 1 to IV2 years before the final decision to build is made.
ECONOMY OF BIOGAS PLANTS
Plant economy is a vital factor affecting the future growth in the number of biogas plants. In Denmark, the plants' economies have been subjected to extensive registration and analyses. Table II shows the analysis results for two centralized plants, Ribe and Lemvig, which economically speaking are among the most well-functioning.
5
Both plants receive around 400 m3 of slurry and industrial waste per day. The Ribe plant produces approximately 12,000 m3 of biogas per day, while the Lemvig plant produces approximately 14,000 m3 per day, or approximately 30 and 35 m3 respectively per m3 of feedstock. The production figures have been quite stable in recent years.
The economic results are shown in terms of the amount of m3 of feedstock. The analysis is based on the realised sale revenues and the current running costs according to the accounts of the plants. The capital costs are calculated on the basis of initial investments and the expected lifetime of various plant components. The calculations are based on a real interest rate of 5 pet. p.a. Initially, the plants received a grant amounting to 39 pet. of the investments at Ribe and 26 pet. at Lemvig. These investments grants are not included, since the purpose of the analysis is to assess the potential of attaining a balance in the company economy without a grant.
The sale revenues consist of gas sales, receiver fees for industrial waste and storage rental fees. The costs include the production of biogas, transport of biomass and storage of biomass. Capital costs amount to approximately 30 DKK per m3 of feedstock and correspond to approximately 50 pet. of the total costs at Ribe and approximately 40 pet. at Lemvig.
It appears that costs exceed sale revenues, except in 1995 at the Lemvig plant when it showed a profit of 4 DKK per m3 of feedstock. In practice, the losses are covered by the initial grant which as previously mentioned is not included in the analysis.The general conclusion from the assessment of results from the centralized plants is, that it is possible under favourable conditions to achieve a balance in the company economy without grants for initial investments. However the risk is still too big to justify the removal of the investment grants completely. It is mandatory to have favourable local conditions for selling the biogas and for supplies of animal manure and supplementary waste. At least 35 m3 of biogas per m3 of feedstock must be achieved, which means that easily digestible waste must be added, which moreover often provide a receiver fee. Slurry generates 20 to 25 m3 of gas per m3, which is not enough to achieve a balanced economy.
Furthermore, the price paid for the gas must correspond to current rules on tax exemptions and electricity production subsidies. In accordance with Danish law, there are considerable taxes levied on energy produced from coal and oil while biomass energy is exempt from taxation. If biogas were to be sold at a price corresponding to the normal market price for oil, the revenues from the gas sales, cf. Table II, would by and large be cut in half, making it impossible to achieve a balanced company economy.
6
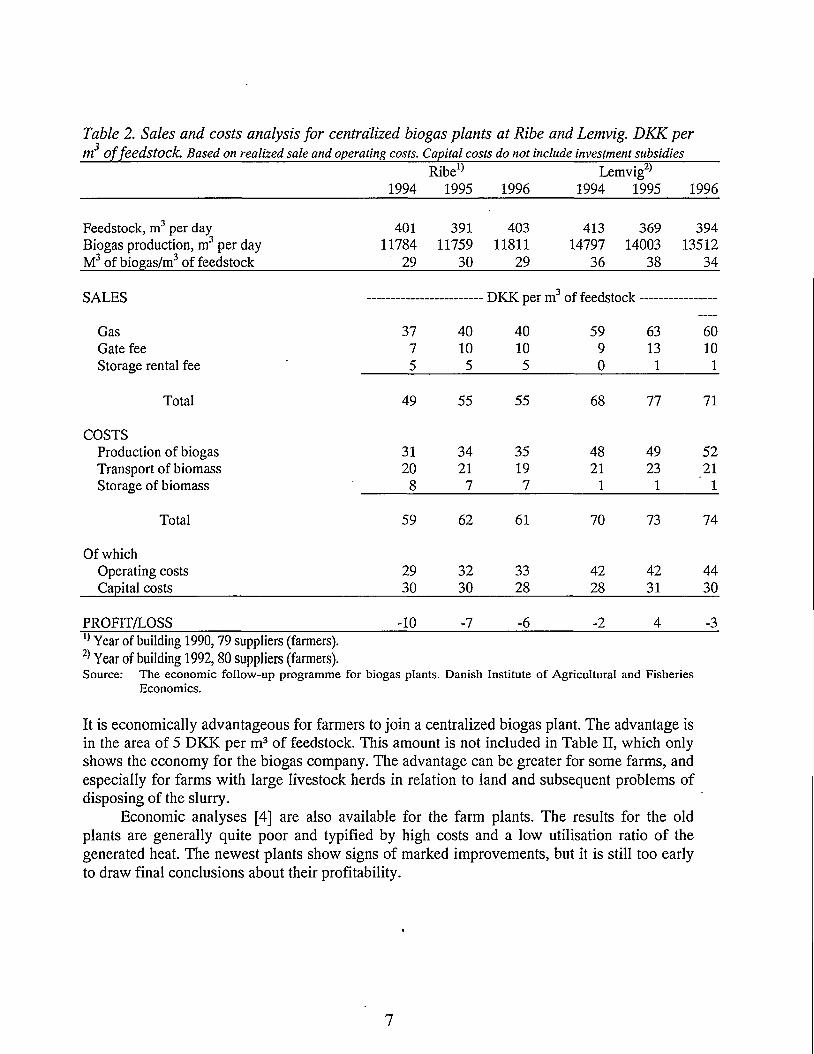
Table 2. Sales and costs analysis for centralized biogas plants at Ribe and Lemvig. DKK per m3 of feedstock. Based on realized sale and operating costs. Capital costs do not include investment subsidies
1994Ribe')
1995 1996Lemvig2^
1994 1995 1996
Feedstock, m3 per day 401 391 403 413 369 394Biogas production, m3 per day 11784 11759 11811 14797 14003 13512M3 of biogas/m3 of feedstock 29 30 29 36 38 34
SALES - DKK per m3 of feedstock------
Gas 37 40 40 59 63 60Gate fee 7 10 10 9 13 10Storage rental fee 5 5 5 0 1 1
Total 49 55 55 68 77 71
COSTSProduction of biogas 31 34 35 48 49 52Transport of biomass 20 21 19 21 23 21Storage of biomass 8 7 7 1 1 1
Total 59 62 61 70 73 74
Of whichOperating costs 29 32 33 42 42 44Capital costs 30 30 28 28 31 30
PROFIT/LOSS -10 -7 -6 -2 4 -3!) Year of building 1990,79 suppliers (farmers).2) Year of building 1992,80 suppliers (farmers).Source: The economic follow-up programme for biogas plants. Danish Institute of Agricultural and Fisheries
Economics.
It is economically advantageous for farmers to join a centralized biogas plant. The advantage is in the area of 5 DKK per m3 of feedstock. This amount is not included in Table II, which only shows the economy for the biogas company. The advantage can be greater for some farms, and especially for farms with large livestock herds in relation to land and subsequent problems of disposing of the slurry.
Economic analyses [4] are also available for the farm plants. The results for the old plants are generally quite poor and typified by high costs and a low utilisation ratio of the generated heat. The newest plants show signs of marked improvements, but it is still too early to draw final conclusions about their profitability.
7
RESEARCH AND DEVELOPMENT
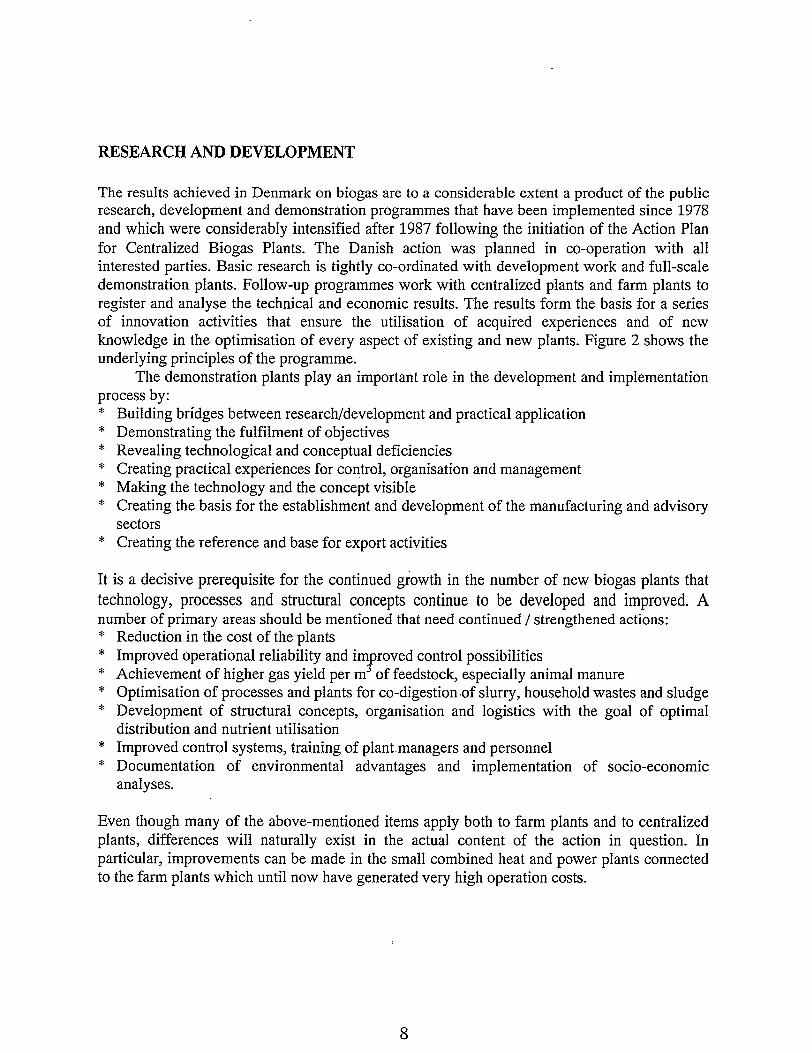
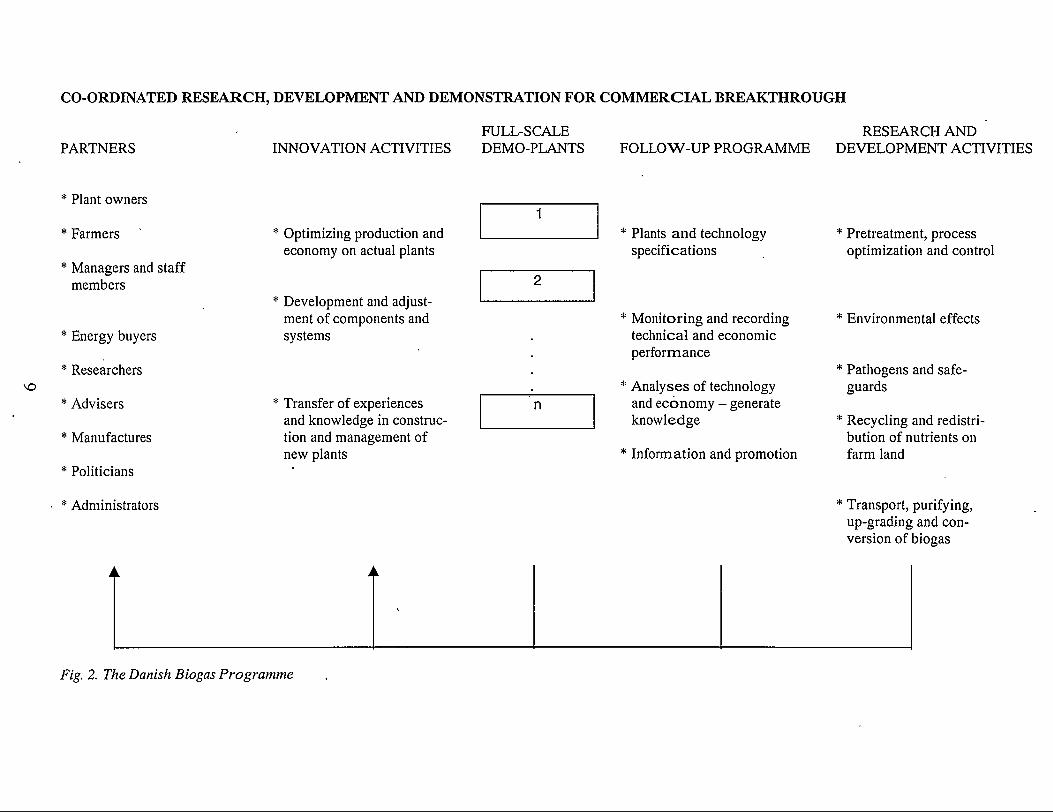
The results achieved in Denmark on biogas are to a considerable extent a product of the public research, development and demonstration programmes that have been implemented since 1978 and which were considerably intensified after 1987 following the initiation of the Action Plan for Centralized Biogas Plants. The Danish action was planned in co-operation with all interested parties. Basic research is tightly co-ordinated with development work and full-scale demonstration plants. Follow-up programmes work with centralized plants and farm plants to register and analyse the technical and economic results. The results form the basis for a series of innovation activities that ensure the utilisation of acquired experiences and of new knowledge in the optimisation of every aspect of existing and new plants. Figure 2 shows the underlying principles of the programme.
The demonstration plants play an important role in the development and implementation process by:* Building bridges between research/development and practical application* Demonstrating the fulfilment of objectives* Revealing technological and conceptual deficiencies* Creating practical experiences for control, organisation and management* Making the technology and the concept visible* Creating the basis for the establishment and development of the manufacturing and advisory
sectors* Creating the reference and base for export activities
It is a decisive prerequisite for the continued growth in the number of new biogas plants that technology, processes and structural concepts continue to be developed and improved. A number of primary areas should be mentioned that need continued / strengthened actions:* Reduction in the cost of the plants* Improved operational reliability and improved control possibilities* Achievement of higher gas yield per in of feedstock, especially animal manure* Optimisation of processes and plants for co-digestion of slurry, household wastes and sludge* Development of structural concepts, organisation and logistics with the goal of optimal
distribution and nutrient utilisation* Improved control systems, training of plant.managers and personnel* Documentation of environmental advantages and implementation of socio-economic
analyses.
Even though many of the above-mentioned items apply both to farm plants and to centralized plants, differences will naturally exist in the actual content of the action in question. In particular, improvements can be made in the small combined heat and power plants connected to the farm plants which until now have generated very high operation costs.
8
CO-ORDINATED RESEARCH, DEVELOPMENT AND DEMONSTRATION FOR COMMERCIAL BREAKTHROUGH
FULL-SCALE RESEARCH ANDPARTNERS INNOVATION ACTIVITIES DEMO-PLANTS FOLLOW-UP PROGRAMME DEVELOPMENT ACTIVITIES
Plant owners
Farmers * Ontimizine nroduction and1
* Plants and technology * Pretreatment, processeconomy on actual plants specifications optimization and control
Managers and staffmembers 2
* Development and adjust-ment of components and * Monitoring and recording * Environmental effects
Energy buyers systems technical and economicperformance
Researchers * Pathogens and safe-* Analyses of technology guards
Advisers * Transfer of experiences n and economy - generateand knowledge in construe- knowledge * Recycling and redistri-
Manufactures tion and management of bution of nutrients onnew plants * Information and promotion farm land
Politicians '
Administrators * Transport, purifying,up-grading and con-version of biogas
Fig. 2. The Danish Biogas Programme
OVERALL ASSESSMENT OF THE FUTURE POTENTIAL OF BIOGAS
It is difficult to formulate precise prognoses regarding the development and growth of the Danish biogas sector, and even more difficult in regards to Europe as a whole. Many uncertain factors are involved.
As previously demonstrated, a large potential waste-biomass exists, consisting first and foremost of animal manure. Nonetheless, this biomass potential is often inaccessible in the concentrations needed within local areas or on farms for turning the establishment of a biogas plant into a viable venture. At present, the economy also depends on the addition of easily digestible wastes from households and industry, and these wastes are only available in relatively limited amounts.
A technological foundation on which to build now exists, and down through the years the plants have become quite reliable. However, the cost of the plants still needs to be reduced.
It is important that the energy produced can be sold, and in this context access to the heating market often poses a problem. In Denmark, biogas heat competes with natural gas and other biomasses like straw and wood chips. Combination solutions with natural gas or dualfuel utilisation at the same heat and power plant or upgrading biogas to natural gas standards and sales to the natural gas net could generate new market opportunities.
Biogas plants attract considerable interest in connection with the solution of environmental problems, particularly in regards to reducing the emission of greenhouse gasses to fulfil CO2 policy objectives, not to mention the reduction of obnoxious smells, the recycling and distribution of nutrients as well as the removal of wastes from industry and households. Undoubtedly, the future of biogas is closely related to successful efforts to realise and document the positive environmental effects, internalising these effects in the economies of the biogas plants. The requirements on waste treatment and farmers' processing of animal manure will be more rigorous in the future, due to factors like the implementation of the EU's nitrate directive.
At present, most of the revenues derive from the sale of energy, and as a result energy price trends are important. In recent years real energy prices have actually decreased, and no great changes are expected in the foreseeable future. In the long term, the situation can totally change if an actual shortage of fossil resources arises. In this event, the primary problem would. be acquiring new energy sources, which would improve the biogas's prospects considerably.
In a European context, the economic prerequisites of biogas appear relatively good in Denmark. Direct investment subsidies are provided, and indirect subsidies exist in the form of tax exemption for heat and subsidies for producing electricity. In addition, the centralized plants have received municipal loan guarantees which have made it possible to acquire rather inexpensive financing. In other European countries, the prerequisites are less favourable, and the economy of biogas plants is correspondingly much poorer than in Denmark where the company economy can only balance under optimal conditions.
Greater public subsidies will naturally promote biogas production. From a society point of view, the environmental aspects of biogas production are the main priority, and the question is therefore how much our society is willing and ought to pay for these benefits. Other
10
alternatives exist for solving the previously mentioned environmental problems, and an increase in the subsidisation of biogas seems unrealistic.
The above-mentioned factors lead to the main conclusion that a growth in biogas production in Denmark and the rest of Europe will occur concurrently with successful attempts, via research and development, at making the plants more profitable and at demonstrating and documenting their environmental benefits, especially benefits that are involved in an integrated processing of animal manure, sludge, and industrial and household wastes and which guarantee the correct utilisation and distribution of agricultural nutrients. It is expected that a market will develop for both large centralized plants and small farm plants.
A heavy growth in the number of biogas plants is hardly expected within the next few years. It would require dractic increases in energy prices and/or public funding, and there is little probability that developments of this kind will occur.
REFERENCES
1. Danish Energy Agency (1995): Progress Report on the Economy of Centralized Biogas Plants.
2. Energistyrelsen (1995): Biogasfasllesanlasg, fra ide til realitet.
3. Hjort-Gregersen, K. (1996): Centralized Biogas Plants; Economic Potential. Proceedings of the 9th European Bioenergy Conference Copenhagen. Commission of the European Communities.
4. Hjort-Gregersen, K. (1997): 0konomien i gardbiogasanlseg. Delrapport 3, Statens Jordbrugs- og Fiskeripkonomiske Institut. 5
5. Holm-Nielsen, J.B. and A1 Seadi, T. (1997): The future of biogas in Europe and how to get started, Biomass Institute, South of Jutland University Centre, Denmark (Contribution to Final Report phase II: A Concerted Action for European Co-ordination and Information Exchange on Industrial Exploitation of Waste for Energy. The Altener Programme).
11
Strategies on Biomass Energies in EU
Emmanuel Xenakis, Principal Administrator DG XVII - Energy. European Commission Rue de la Loi /Weststraat 200, B-1049 Bruxelles, Belgium
The EU policy on renewables, the Green Paper and the ALTENER action in the field of biomass.
The following subjects will be outlined hereafter:
a. The reasons for promoting renewablesb. The European programmes supporting renewablesc. The Green Paper of the Commission on renewablesd. The biomass within the ALTENER programme
a : THE REASONS FOR PROMOTING RENEWABLES:
The reasons for the promotion of renewables are:
• to improve the EU's security of supply• to protect the environment, in particular as far as CO2 emissions are concerned• to contribute to the solution of structural problems of employment and revenue, in particular
in rural areas
b : THE EUROPEAN PROGRAMMES SUPPORTING RENEWABLES:
The main EU programmes, supporting the renewable deployment, are the research and development programmes JOULE,'THERMIE and FAIR, included in the 4th framework programme, the ALTENER programme and the "Community Support Framework" programme.
Research and development (R&D) activity within the JOULE and THERMIE programmes are divided into five areas, of which the third concerns the renewable energies. The support could range from 40 to 100 % of the cost. JOULE programme is research oriented, while the THERMIE programme is demonstration oriented.
The FAIR programme is also a specific research and development programme for agriculture and agrifood industry. It could cover, among others, projects in connection with the biogas exploitation.
12
The ALTENER programme provides support for the so called "software" actions, promoting renewables, mainly training and information actions, including events like the present one. Furthermore, it provides support for technical specifications, creation of infrastructure, for the promotion of renewables and so on. ALTENER does not support investments.
Finally the "Community Support Framework" programme promoting the regional development, could, in some cases, support traditional technology investments in relation to renewables.
c : THE GREEN PAPAER OF THE COMMISSION ON RENEWABLES:
The Green Paper of the Commission entitled "Energy for the Future - Renewable Sources of Energy" (November, 96), gave a new impetus in the renewable energies deployment. The aim of this document is to stimulate wide consultation and discussion with all interested parties.
On the basis of the reactions, a fully developed strategy, with an action plan for increasing the share of renewable energy sources in the energy balance, will be developed.
The Green Paper outlines general orientations, that will be in depth considered and possibly adjusted on the basis of the responses. These ideas are:
• Doubling the renewables contribution in the energy consumption by 2010• Strengthening Member States co-operation on renewables• Reinforcing policies in favour of renewables• Ensuring the monitoring of progress towards achieving the objectives
d : THE BIOMASS WITHIN THE ALTENER PROGRAMME:
The ALTENER programme provides for a specific action for the promotion of the industrial exploitation of the biomass.
In compliance with that, the Commission supported the creations of three biomass networks, the first concerning vegetative biomass (Agro-forestry Network), the second concerning liquid biofuels and the third concerning wastes, including agricultural wastes. The present event is organised in the framework of the third network.
The objectives of the networks are the following :
• Detecting and promoting business opportunities as well as any kind of collaboration in connection with the biomass exploitation. The business forum organised here is an example of the means used for achieving this objective.
13
• Transferring of knowledge in relation with biomass exploitation, from the countries which possess this knowledge to those which do not. The study tour that will take place here is an example of such means, but in the future, the Commission wishes to put emphasis on "mini training" actions.
• Reinforcing collaboration between National Biomass Centres.• Undertaking studies, and to the extent of possible, relevant action for overcoming barriers to
the deployment of renewables.
Summarising my presentation, I would say that the reasons motivating the European policy in favour of renewables are the energy security supply, the protection of the environment and to a certain extent the contribution to the solution of the problems of employment and revenue, particularly in agricultural areas. There are a number of European programmes, supporting renewable energies. The recent initiative of the Commission to introduce, with it's Green Paper on renewables, a debate on setting up a concrete action plan on renewables, is expected to give
• a new impetus to their deployment.Finally I mentioned that ALTENER created four biomass networks and their four
objectives. I would like to ask you to concentrate in particular on the last point. The Commission is very interested to maximise the efficiency of this action, and you, biomass players, are the best placed for advising us. Any comment, suggestion, remark and idea are welcomed.
14
Centralized co-digestion and efficient nutrient recycling
S0ren Tafdrup, M.Sc., Biogas Specialist, Danish Energy Agency, Amaliegade 44, DK-1256 Copenhagen, Denmark, Phone +45 33 92 67 00, Fax +45 33 11 47 43
ABSTRACT
The centralized biogas plants co-digest animal manure and organic waste, producing biogas and liquid fertilizer as a result. 19 centralized biogas plants are in operation in Denmark. In 1996 they digested 200,000 tonnes organic industrial wastes with 800,000 tonnes manure. The average gate fee for waste reception is around DKK 50 per tonne. Thus, the centralized biogas plants provide the organic waste producers with an economically attractive as well as environmentally sound recycling option.
The farmers play a key role. It is a precondition that the farmers benefit sufficiently from the operation of the centralized biogas plant. An average economic advantage for the farmers of approximately DKK 5 in all per m3 slurry has been calculated. Even though this is a relatively modest amount, it is enough to generate interest on the part of the farmers. A further tightening of the legislation is expected in a few years concerning utilization of nutrients in manure and land applied organic wastes. This, together with increasing focus on odour reduction, is expected to add to the farmers interests in centralized biogas plants.
At present biogas contributes with 2 PJ per year to the energy supply in Denmark. According to the official energy action plan, the total biogas production from all kinds of biogas plants is to be doubled by the year 2000 and increased 10-fold by the year 2020. A major part of this increase is expected to come from new centralized biogas plants. The annual potential for biogas production from biomass resources available in Denmark is estimated to be approximately 30 PJ. Animal manure comprises about 80% of this potential.
KEYWORDS
Agricultural; anaerobic; biogas; centralized; co-digestion; energy; environmental; fertilizer; greenhouse; industrial; manure; nutrient; recycling; renewable; wastes.
BACKGROUND
The centralized biogas plants co-digest animal manure and organic waste, producing biogas and liquid fertilizer as a result. Manure, mainly as slurry, is transported from a number of farms to the plant. It is co-digested with "clean" organic wastes from abattoirs, food industries and municipalities. After digestion, the slurry is returned as nutritionally defined fertilizer, partly to the farms that supply fresh manure, and partly to farms that are engaged in crop farming only.
15
The biogas plants are sited in order to ensure that the energy production can be utilized with a high degree of efficiency. In most cases the gas is used for combined heat and power generation. The electricity is sold to the grid, while the heat is used for district heating of towns and villages. District heating is quite common in Denmark.
The benefits include renewable energy production, reduced greenhouse gas emissions, cheap and efficient organic waste recycling, and improved utilization of the manure as fertilizer.
The concept of centralized biogas plants has been developed since the mid-1980s. At present (September 1997) 19 centralized biogas plants are in operation in Denmark. They serve approx. 650 farms. The capacities range from 50 to 500 tonnes of feedstock per day with resulting gas production in the range of 1,000 to 15,000 m3 per day. A total of about 1.2 million tonnes biomass feedstock are digested per year. The feedstock typically consists of 80% manure and 20% "pure" organic waste from abattoirs or food industries. A few plants alsoadd sewage sludge or the organic part of source-separated household waste. At present only V/2% of the total feedstock consists of sewage sludge and household waste, but this share is expected to increase in the future.
Several government programmes have been carried out in order to evaluate and promote centralized biogas plants in Denmark. The Action Programme for Centralized Biogas Plants was implemented from 1987 to 1991, and the Follow-up Programme was finalized in 1995. Details about programmes and findings can be found in previous publications [1,2,3]. At present the third development programme is being executed.
Experience since 1987 shows that financially viable centralized biogas plants can be created. A number of important preconditions for financial competitiveness of centralized biogas plants can be pointed out: enhanced gas production and reception fees from co-digestion with organic wastes, high quality key components leading to operational stability and low costs of operation and maintenance, firm plant management, and energy sales prices at the level of DKK 2.5 per m3 methane. Operational and capital costs as low as DKK 50 per tonne of feedstock are attainable. Thus, centralized biogas plants provide a link to organic waste recycling, which in many cases is cheaper than other options.
Renewable energy sources are exempted from Danish state taxes whereas taxes are paid for the use of fossil fuels. Even though local variations in biogas prices can be considerable (in the range of 10-20%) the tax exemption in general secures the biogas plants a value of the net energy production corresponding to approx. DKK 2.50 per m3 methane.
In addition all plants so far have received investment grants from the Danish Energy Agency. The objective is to reduce the investment grants gradually as technological and economic improvements are achieved. In the late 1980s the plants had 30-40% of the investment costs covered by grants. Today new centralized biogas plants are receiving around 20% of the investment costs as public grants. A further reduction is expected.
Further details about the economic preconditions in Denmark can be found in the 1995 progress report [2]. This report also discusses the validity of the results for projects in other countries with different reference energy prices and different financing possibilities.
16
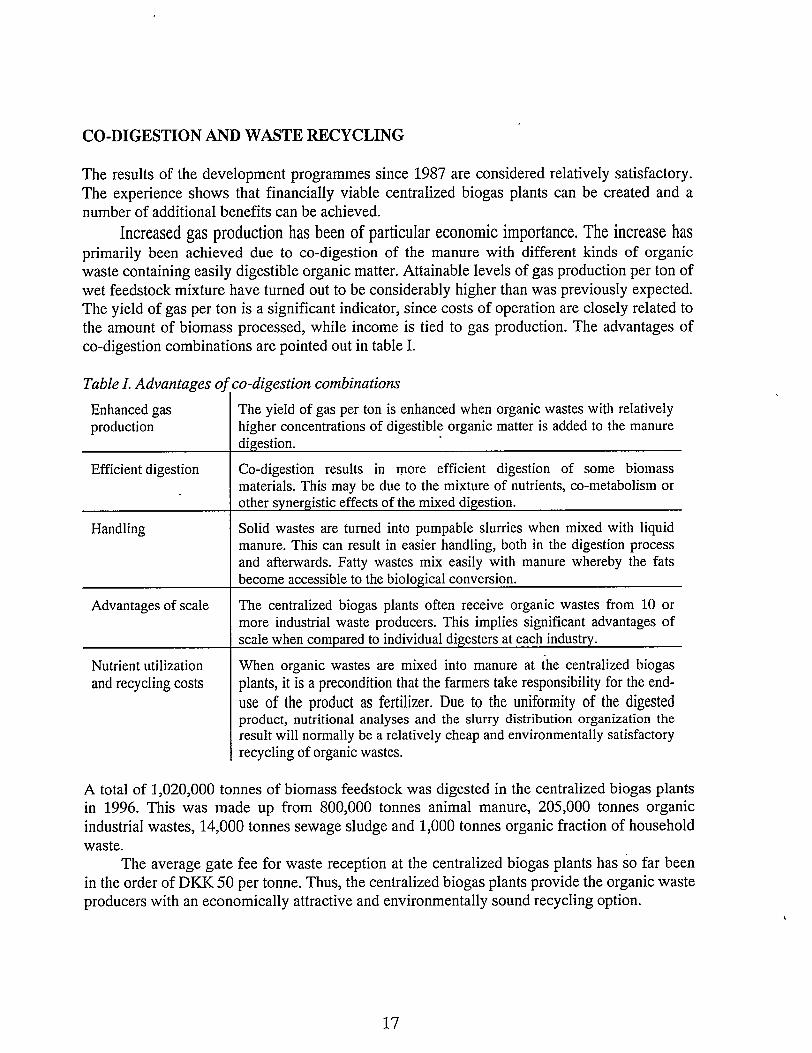
CO-DIGESTION AND WASTE RECYCLING
The results of the development programmes since 1987 are considered relatively satisfactory. The experience shows that financially viable centralized biogas plants can be created and a number of additional benefits can be achieved.
Increased gas production has been of particular economic importance. The increase hasprimarily been achieved due to co-digestion of the manure with different kinds of organic waste containing easily digestible organic matter. Attainable levels of gas production per ton of wet feedstock mixture have turned out to be considerably higher than was previously expected. The yield of gas per ton is a significant indicator, since costs of operation are closely related to the amount of biomass processed, while income is tied to gas production. The advantages of co-digestion combinations are pointed out in table I.
Table I. Advantages ofco-digestion combinations
Enhanced gas production
The yield of gas per ton is enhanced when organic wastes with relatively higher concentrations of digestible organic matter is added to the manure digestion.
Efficient digestion Co-digestion results in more efficient digestion of some biomass materials. This may be due to the mixture of nutrients, co-metabolism or other synergistic effects of the mixed digestion.
Handling Solid wastes are turned into pumpable slurries when mixed with liquid manure. This can result in easier handling, both in the digestion process and afterwards. Fatty wastes mix easily with manure whereby the fats become accessible to the biological conversion.
Advantages of scale The centralized biogas plants often receive organic wastes from 10 or more industrial waste producers. This implies significant advantages of scale when compared to individual digesters at each industry.
Nutrient utilization and recycling costs
When organic wastes are mixed into manure at the centralized biogas plants, it is a precondition that the farmers take responsibility for the end- use of the product as fertilizer. Due to the uniformity of the digestedproduct, nutritional analyses and the slurry distribution organization the result will normally be a relatively cheap and environmentally satisfactory recycling of organic wastes.
A total of 1,020,000 tonnes of biomass feedstock was digested in the centralized biogas plants in 1996. This was made up from 800,000 tonnes animal manure, 205,000 tonnes organic industrial wastes, 14,000 tonnes sewage sludge and 1,000 tonnes organic fraction of household waste.
The average gate fee for waste reception at the centralized biogas plants has so far been in the order of DKK 50 per tonne. Thus, the centralized biogas plants provide the organic waste producers with an economically attractive and environmentally sound recycling option.
17
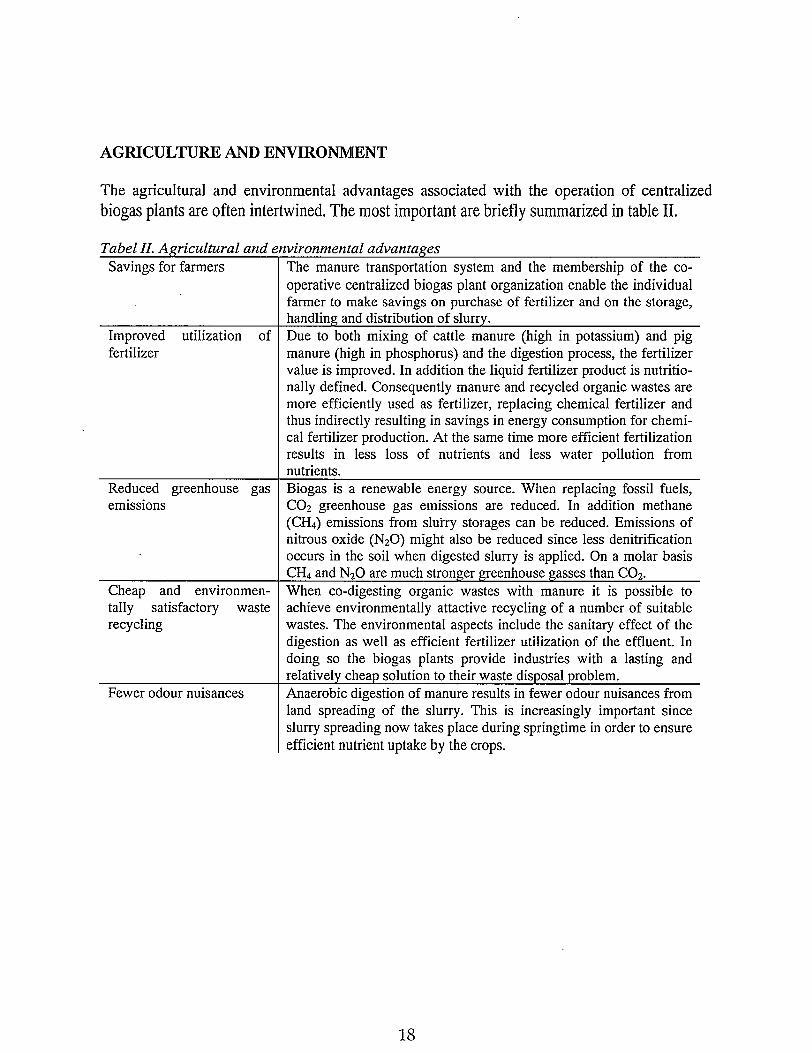
AGRICULTURE AND ENVIRONMENT
The agricultural and environmental advantages associated with the operation of centralized biogas plants are often intertwined. The most important are briefly summarized in table II.
Tabel II. Agricultural and environmental advantagesSavings for farmers The manure transportation system and the membership of the co
operative centralized biogas plant organization enable the individual farmer to make savings on purchase of fertilizer and on the storage, handling and distribution of slurry.
Improved utilization of fertilizer
Due to both mixing of cattle manure (high in potassium) and pig manure (high in phosphorus) and the digestion process, the fertilizer value is improved. In addition the liquid fertilizer product is nutritionally defined. Consequently manure and recycled organic wastes are more efficiently used as fertilizer, replacing chemical fertilizer and thus indirectly resulting in savings in energy consumption for chemical fertilizer production. At the same time more efficient fertilization results in less loss of nutrients and less water pollution from nutrients.
Reduced greenhouse gas emissions
Biogas is a renewable energy source. When replacing fossil fuels, C02 greenhouse gas emissions are reduced. In addition methane (CH4) emissions from slurry storages can be reduced. Emissions of nitrous oxide (N20) might also be reduced since less denitrification occurs in the soil when digested slurry is applied. On a molar basis CH4 and N20 are much stronger greenhouse gasses than C02.
Cheap and environmentally satisfactory waste recycling
When co-digesting organic wastes with manure it is possible to achieve environmentally attactive recycling of a number of suitable wastes. The environmental aspects include the sanitary effect of the digestion as well as efficient fertilizer utilization of the effluent. In doing so the biogas plants provide industries with a lasting and relatively cheap solution to their waste disposal problem.
Fewer odour nuisances Anaerobic digestion of manure results in fewer odour nuisances from land spreading of the slurry. This is increasingly important since slurry spreading now takes place during springtime in order to ensure efficient nutrient uptake by the crops.
18
Establishing a centralized biogas plant always involves a number of interests and parties: farmers, industries, utilities, municipalities and other authorities.
The farmers, however, play a key role. They both deliver manure and have responsibility for using the liquid fertilizer product. It is therefore a key precondition that the farmers benefit sufficiently from the operation of the plant. Otherwise they simply do not participate in which case no viable plant can be created.
An average economic advantage for the farmers of approx. DKK 5 in all per m3 slurry has been calculated. Even though this is a relatively modest amount, it is enough to generate interest on the part of the farmers. In the future less savings on storage must be expected, since most of the manure storage capacity has now been established. On the other hand a further tightening of the legislation is under its way concerning utilization as fertilizer of nutrients in manure and land applied organic wastes. This, together with increasing focus on odour reduction, is expected to add to the farmers interests in centralized biogas plants.
ONGOING EXPANSION
In April 1996 the Danish government presented its new energy action plan "Energy 21" [4], Long-term transition to substantial renewable energy supply is one of the key elements. According to the plan, the total biogas production from all kinds of biogas plants is to be doubled by the year 2000 and increased 10-fold by the year 2020. A major part of this increaseis expected to come from new centralized biogas plants.
Thus, the main target of the ongoing biogas development work in Denmark is to make sure that the year 2000 doubling of biogas production is realized. Centralized biogas plants and landfill gas plants are going to be the main contributors. To support this work the Biogas Development Programme are pushing towards the following objectives:
• Further economic improvement leading to plants that can be economically independent of supply of industrial wastes with high concentration of digestible organic matter.
• Development and demonstration of improved, low-cost farm-scale biogas plants including several years of follow-up on the economics.
• Anaerobic digestion of the organic fraction of source-sorted municipal solid waste to further develop satisfactory solutions both environmentally and economically.
• Efforts to optimize fertilizer utilization and minimize losses in connection with biogas plants, with especial focus on N-fertilizer. •
• Speeding up the exploitation of landfill gas for reasons of reducing methane emissions as well as gaining energy supply.
19
At present biogas contributes with 2 PJ per year to the energy supply in Denmark. Thus, the 10-fold increase by the year 2020 implies a production of 20 PJ biogas per year. The annual potential for biogas production from biomass resources available in Denmark is estimated to be approximately 30 PJ. Animal manure comprises about 80% of this potential.
REFERENCES
1. Danish Energy Agency (1992). "Update on Centralized Biogas Plants". Published by the Danish Energy Agency, Amaliegade 44, DK-1256 Copenhagen K (also available in German).
2. H.H. Lindboe, K. Hjort-Gregersen, S. Tafdrup, O.G. Jacobsen, J. Christensen, (1995). "Progress report on the economy of centralized biogas plants". Published by the Danish Energy Agency.
3. S. Tafdrup, J. Christensen, K. Hjort-Gregersen, J.D., Jensen, T. Birkmose, H.J. Bendixen, H.B. Mpller, (1995). "Biogasfaellesanlaeg fra ide til realitet". Published by the Danish Energy Agency (available only in Danish).
4. Danish Ministry of Environment and Energy (1996). "Energy 21 - the Danish Government's Action Plan for Energy 1996". Published by the Danish Energy Agency.
20
Different systems and approaches to treat municipal solid waste - a state-of the art assessment
A. Krieg, H. Euler, F. v. Klopotek, C. Kellner, TBW GmbH, Sustainable Techno-logies, Building & Business Consultants, Baumweg 10, D-60316 Frankfurt/Main, Germany
ABSTRACT
Anaerobic digestion is still a fairly new technology in the area of utilisation of organic residues, in particular as far as treatment of household wastes and integration of agricultural production is concerned. In the last few years, a number of different processes and concepts, with a variety of different intentions, have been developed and established on the European market, in particular in Germany. Actual categories and parameters, used to analyse, structure and compare available treatment systems, are not yet fully satisfying.
The presentation will consist of the following elements:
1. Factors influencing the market of the technology in the recent past.
2. Brief comparison of features of anaerobic solid waste digestion with landfilling, composting and incineration.
3. Brief comparison between some European and Non-European countries, concerning municipal solid waste digestion.
4. Main topics in the actual German Anaerobic Municipal Solid Waste Treatment (AMSWT) debate.
5. Comparison of some existing AMSWT systems and concepts.
6. Presentation of a comprehensive structure, covering the main technical elements of any of the different technologies available. 7
7. Outlook.
21
RE: 1 FACTORS INFLUENCING THE MARKET OF THE TECHNOLOGY IN THE RECENT PAST
AMSWT technologies have experienced an astonishing upsurge in the last few years, particularly in Germany, but as well in a number of other northern European countries.
The reasons are manifold and can mostly be classified as follows:
a) Technologies concerning municipal solid waste digestion have been improved, diversified and partially standardised.
b) Demand for the technology has increased and diversified.
c) Cost- and benefit-relations have changed due to a number of external factors.
d) The technology is more known within the society.
Re:a An increased offer of the technology
• The number of companies offering AMSWT has increased considerably.• The number of available and proven processes suitable for different waste material,
treatment purposes, sizes and economic, environmental as well as hygienic framework conditions has increased.
• The Research and Development phase of principles of the technology can increasingly be considered completed with the overall performance being increasingly mature.
Re:b An increased demand can be partially explained by the following factors:
• The technology has gone through the primary trial and error-phases and has proven its long-term reliability.
• Due to increased environmental legislation and control, alternative processes are no longer technically sufficient or no longer viable when compared to AMSWT.
• The spectrum of organic waste substrates to be disposed of has increased considerably.
22
Re:c Cost-benefits have improved
• Environmental legislation ■ has increased the overall treatment and disposal costs for competing processes.
• Technical progress and influence, in particular from the agricultural sector, has reduced investment and operation costs.
• Price or opportunity costs to sell or use energy and compost have improved.• With any major company trying to get a demonstration plant built, investment prices
are presently even below real costs.• Technical influence from agricultural biogas and co-fermentation plant producers and
their more robust and cost-efficient design and operation features.
Re:d The technology is better known
• Due to organisational efforts of companies offering anaerobic treatment processes and their professional organisations, the technology has become considerably better known.
• Due to the overall environmental debate concerning renewable energy, emission control and climatic change, the technology has received more political attention in the recent years.
• A number of training institutions and financial and legal decision makers have understood that anaerobic treatment is the first choice from an environmental point of view and have passed supportive legislation.
RE: 2 COMPARISON WITH LANDFILLING, INCINERATION, COMPOSTING
a) There are a number of factors which have increasingly discredited landfilling technologies:
• Seepage water and gaseous emissions or, if these are to be avoided, the high costs for seepage water and gas collection and treatment.
• Long operation, observation and treatment costs, even after the landfills have been closed.• High land demand, becoming increasingly unattractive with rising land prices.• Recirculation of material can barely be integrated with „all inclusive" landfilling practices.• Unforeseeable and cumulative chemical, physical and biological processes and synergisms
due to the mix of materials incorporated in the landfills.
23
b) Compared to incineration in particular:
• High treatment costs and resulting need for huge treatment capacities.• High emissions, if not the ultimate filtering technology is applied.• Difficult energy balance with moist waste material.• High treatment costs for remaining ashes.• Insufficient use of raw materials.• Resistance of local population.• Stop an increased application of „all inclusive" incinerators for household wastes.
c) Compared to composting plants:
• Due to tighter emission control, the costs for composting plants have increased to the level of anaerobic plants.
• The energy produced is not recovered and utilised.• Combined aerobic-anaerobic treatment eliminates a larger portion of seeds and pathogens.• The spectrum of substrates to be composted is considerably smaller than one to be digested.
These factors have contributed to an increased demand for AMSWT.
RE: 3 WHAT IS THE DIFFERENCE BETWEEN GERMANY AND SOME OTHER ARTICULARLY „NORHTERN/MIDDLE“ EUROPEAN COUNTRIES IN TERMS OF AMWST AND THE REST OF EUROPE, OTHER INUDSTRIAL COUNTRIES AND THE DEVELOPING WORLD?
Some of the following factors appear to be of particular importance:
=> Cost and scarcity of land.=> Environmental conscience and relevance.=> History of application of biogas technology and availability of know-how, promoting
organisations and the general position of renewable energies and recycling technologies.=> Cost of waste treatment and disposal.=> Development of waste separation technologies.
These factors correlate strongly with some legislation and public promotion schemes applied in particular in Germany like:
24
• Legislation to enforce the use of material and energy recycling for waste products if possible.
• Definition of a maximum percentage of organic material to be disposed on landfills.• Prohibiting any landfilling without leakage protection, gas collection and treatment.• Legislation to enforce the rehabilitation of old landfills.• Emission control on composting plants.• Promotion of renewable energy schemes.• Determination of the sale price for electricity from renewable energies.• Tight environmental law enforcement on emissions from incinerators.• High waste management prices, charged from the citizens.• Costs for agroindustrial moist waste disposal, at a level to allow anaerobic treatment.• A strong organisational base to promote anaerobic technologies.• A tradition of organic material recycling in agriculture.• Strong legislation and supportive action concerning waste separation.
RE: 4 MAIN TOPICS IN THE ACTUAL GERMAN AMSWT DEBATE
However, there are still a number of crucial issues which have not yet been solved. These are:
• High investment costs for the treatment plants, partially due to the level of machinery needed; the fact that most plants used to be pilot plants and the long permission process, needed particularly in Germany.
• High operational costs due to manpower requirements, replacement of machinery and insufficiently smooth operation for the treatment plants.
• The marketing of by-products, mainly for electricity, heat and compost.• Lack of lobby on the political level.• Improvement of legislation in favour of AMSWT.
Activities to improve these shortcomings in Germany are listed below:
=> Investment costs could be reduced by transferring conceptual, process and operational experience, in terms of machinery from agricultural biogas and co-fermentation plants, to the AMSWT sector. The same applies to time and costs of operation, where some agricultural experiences could be used to ease the cost, time, maintenance and training efforts for the Operation of AMSWT. As well, the pilot character of many AMSWT plantscould be reduced, once the proven elements were transferred from experiences within the agricultural and agroindustrial sectors. In addition, an organised quality control mechanism for compost and its integration into the overall waste management organisation have supported the technology’s long-term viability.
25
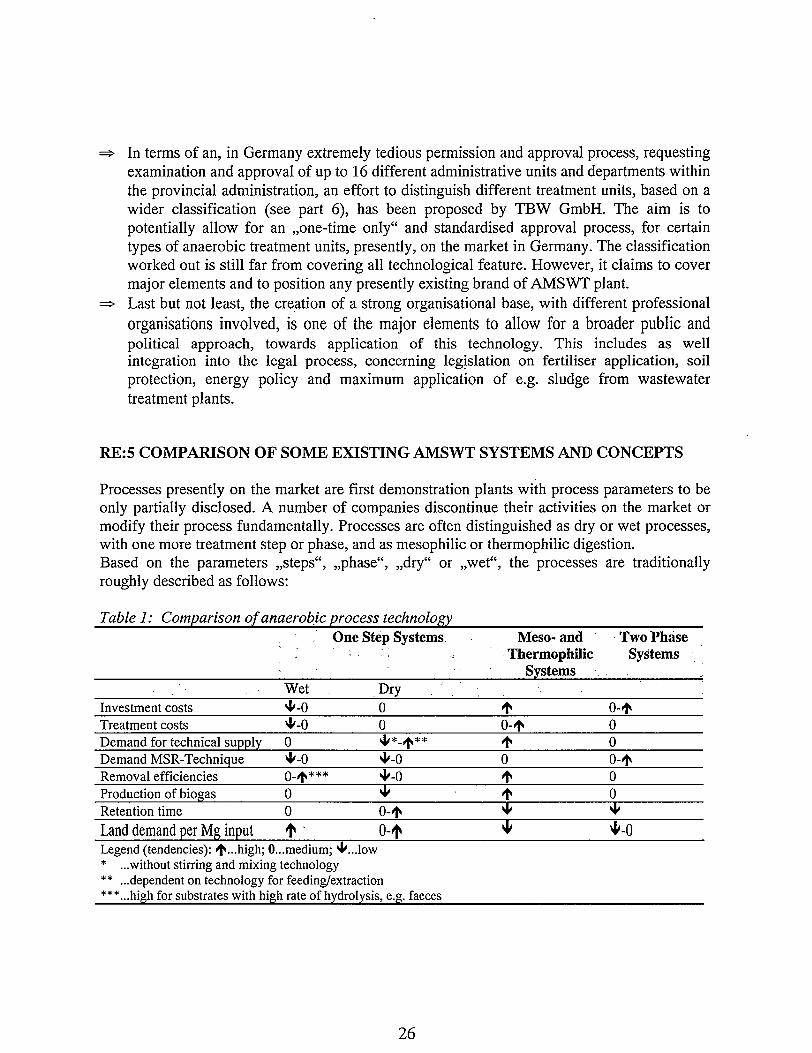
=> In terms of an, in Germany extremely tedious permission and approval process, requesting examination and approval of up to 16 different administrative units and departments within the provincial administration, an effort to distinguish different treatment units, based on a wider classification (see part 6), has been proposed by TBW GmbH. The aim is to potentially allow for an „one-time only" and standardised approval process, for certain types of anaerobic treatment units, presently, on the market in Germany. The classification worked out is still far from covering all technological feature. However, it claims to cover major elements and to position any presently existing brand of AMSWT plant.
=> Last but not least, the creation of a strong organisational base, with different professional organisations involved, is one of the major elements to allow for a broader public and political approach, towards application of this technology. This includes as well integration into the legal process, concerning legislation on fertiliser application, soil protection, energy policy and maximum application of e.g. sludge from wastewater treatment plants.
RE:5 COMPARISON OF SOME EXISTING AMSWT SYSTEMS AND CONCEPTS
Processes presently on the market are first demonstration plants with process parameters to be only partially disclosed. A number of companies discontinue their activities on the market or modify their process fundamentally. Processes are often distinguished as dry or wet processes, with one more treatment step or phase, and as mesophilic or thermophilic digestion.Based on the parameters „steps“, „phase“, „dry“ or „wet“, the processes are traditionally roughly described as follows:
Table 1: Comparison of anaerobic process technologyOne Step Systems Meso- and
Thermophilic Systems
Two Phase Systems
Wet . DryInvestment costs *-0 0 t o-tTreatment costs *-0 0 o-t 0Demand for technical supply 0 4#*.^** t 0Demand MSR-Technique *-0 *-0 0 o-tRemoval efficiencies *-0 t 0Production of biogas 0 * t 0Retention time 0 0-* * *Land demand per Mg input t o-t * *-0Legend (tendencies): ...high; 0...medium; 4'...low * ...without stirring and mixing technology ** ...dependent on technology for feeding/extraction ***...high for substrates with high rate of hydrolysis, e.g. faeces
26
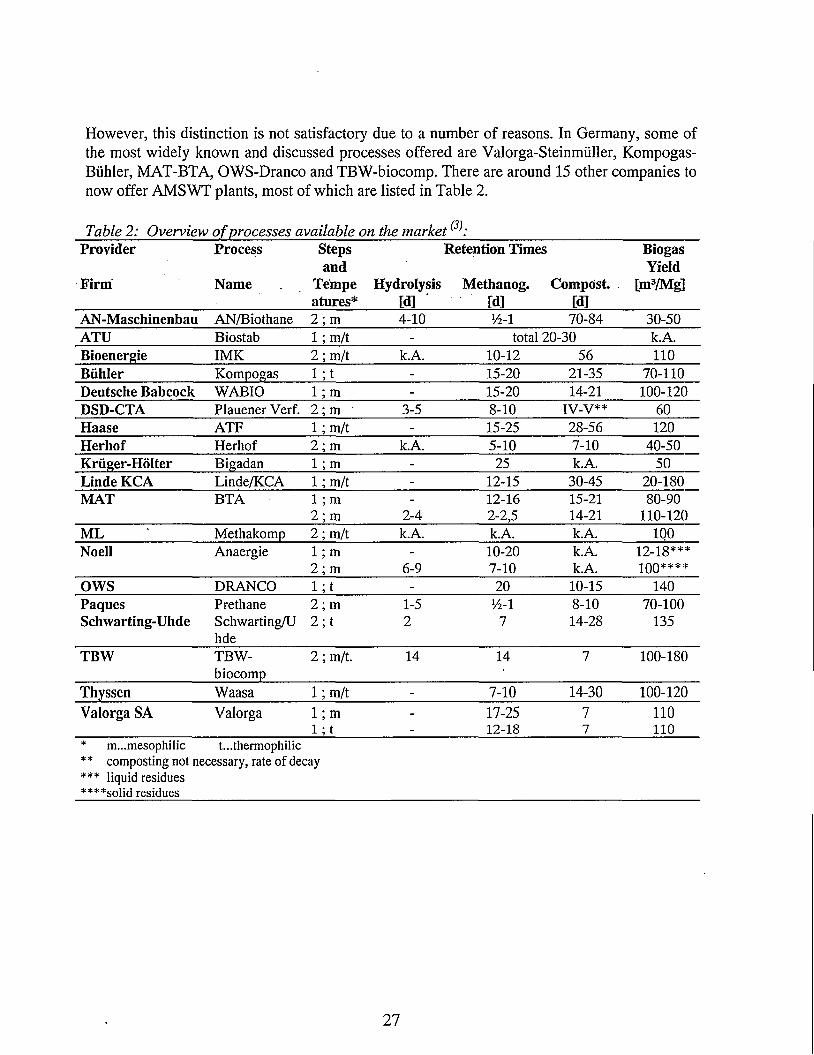
However, this distinction is not satisfactory due to a number of reasons. In Germany, some of the most widely known and discussed processes offered are Valorga-Steinmiiller, Kompogas- Biihler, MAT-BTA, OWS-Dranco and TBW-biocomp. There are around 15 other companies to now offer AMSWT plants, most of which are listed in Table 2.
Table 2: Overview of processes available on the marketProvider Process Steps Retention Times Biogas
and YieldFirm Name Tempe
atures*Hydrolysis
[d]Methanog.
Id]Compost.
[d][m3/Mg]
AN-Maschinenbau AN/Biothane 2; m 4-10 y2-i 70-84 30-50ATU Biostab 1; m/t - total 20-30 k.A.Bioenergie IMK 2; m/t k.A. 10-12 56 110Btihler Kompogas l; t - 15-20 21-35 70-110Deutsche Babcock WABIO 1; m - 15-20 14-21 100-120DSD-CTA Plauener Verf. 2; m ’ 3-5 8-10 IV-V** 60Haase ATF 1; m/t - 15-25 28-56 120Herhof Herhof 2; m k.A. 5-10 7-10 40-50Kriiger-Holter Bigadan 1 ; m - 25 k.A. 50Linde KCA Linde/KCA 1; m/t - 12-15 30-45 20-180MAT BTA 1; m - 12-16 15-21 80-90
2; m 2-4 2-2,5 14-21 110-120ML Methakomp 2; m/t k.A. k.A. k.A. 100Noell Anaergie 1; m - 10-20 k.A. 12-18***
2; m 6-9 7-10 k.A. 100****OWS DRANCO 1; t - 20 10-15 140Paques Prethane 2; m 1-5 1/2-I 8-10 70-100Schwarting-Uhde Schwarting/U
hde2; t 2 7 14-28 135
TBW TBW-biocomp
2; m/t. 14 14 7 100-180
Thyssen Waasa 1; m/t - 7-10 14-30 100-120Valorga SA Valorga 1; m
l ;t- 17-25
12-1877
110110
* m...mesophilic t... thermophilic** composting not necessary, rate of decay *** liquid residues ****solid residues
27
RE: 6 PRESENTATION OF A COMPREHENSIVE STRUCTURE COVERING THE MAIN TECHNICAL ELEMENTS OF ANY OF THE DIFFERENT TECHNOLOGIES AVAILABLE
To allow for a broader comparison of different process parameters and for a standardisedpermission process, the systematic structure shown in table 3 has been developed.
RE: 7 OUTLOOK
Some future developments of the technology are heading into the following directions:
1. A further simplification with parallel sophistication of elements of the treatment plants, to allow for a more reliable and lower maintenance operation and for a reduction of the manpower needed.
2. An increased standardisation of modular treatment plants, allowing for a faster construction, lower investment and planning costs and a standardised maintenance and servicing programme.
3. Specialised diversification of technologies, according to the emphasis of the respective output and result.
4. Improved sorting and pre-treatment technologies.
5. Early integration of agricultural enterprises and production.
6. Integration of AMSWT with a broader spectrum of substrates, with different treatment, recycling and disposals options, within one waste management scheme, and, in the future, one infrastructural management scheme, preferably including energy, wastewater and agriculture as well. 7
7. An increased share of BOO and BOT schemes, implemented inside and outside of Europe.
28
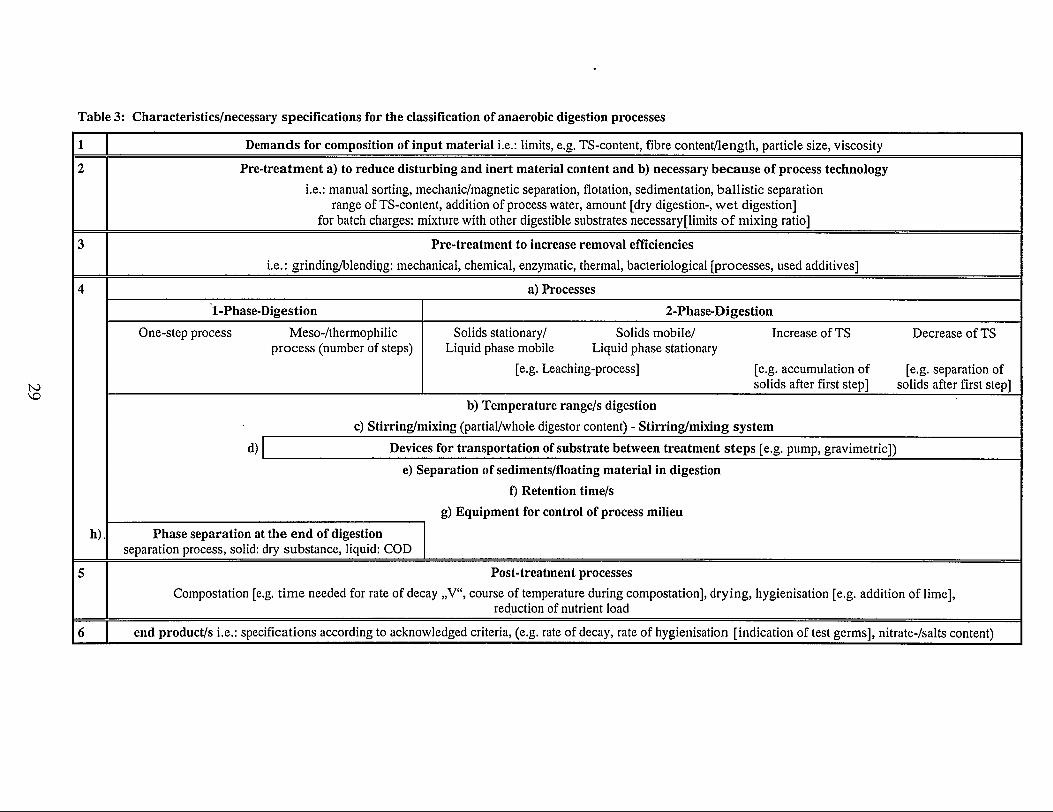
Table 3: Characteristics/necessary specifications for the classification of anaerobic digestion processes
1 Demands for composition of input material i.e.: limits, e.g. TS-content, fibre content/length, particle size, viscosity2 Pre-treatment a) to reduce disturbing and inert material content and b) necessary because of process technology
i.e.: manual sorting, mechanic/magnetic separation, flotation, sedimentation, ballistic separation range of TS-content, addition of process water, amount [dry digestion-, wet digestion]
for batch charges: mixture with other digestible substrates necessary[limits of mixing ratio]3 Pre-treatment to increase removal efficiencies
i.e.: grinding/blendipg: mechanical, chemical, enzymatic, thermal, bacteriological [processes, used additives]4
h).
a) Processes1-Phase-Digestion 2-Phase-Digestion
One-step process Meso-/thermophilicprocess (number of steps)
Solids stationary/ Solids mobile/ Increase of TS Decrease of TSLiquid phase mobile Liquid phase stationary
[e.g. Leaching-process] [e.g. accumulation of [e.g. separation ofsolids after first step] solids after first step]
b) Temperature range/s digestionc) Stirring/mixing (partial/whole digestor content) - Stirring/mixing system
d) Devices for transportation of substrate between treatment steps [e.g. pump, gravimetric])e) Separation of sediments/floating material in digestion
f) Retention time/sg) Equipment for control of process milieu
Phase separation at the end of digestion separation process, solid: dry substance, liquid: COD
5 Post-treatment processesCompostation [e.g. time needed for rate of decay „V“, course of temperature during compostation], drying, hygienisation [e.g. addition of lime],
reduction of nutrient load
6 end product/s i.e.: specifications according to acknowledged criteria, (e.g. rate of decay, rate of hygienisation [indication of test germs], nitrate-/salts content)
Farm Scale Biogas Concepts in Europe
A. Wellinger, Nova Energie, PO Box 73, 8356 Ettenhausen, Switzerland
THE SECOND WAVE OF AGRICULTURAL BIOGAS PRODUCTION
The origin of agricultural biogas goes back to the second world war, where fuel shortage was the driving force for its production. More than 40 small scale digesters were operated in France, primarily with solid waste. In Germany some 25 plants of rather large size and high technical standard were put in operation.
The second move towards agricultural biogas came after the first oil crisis 1973, when biogas was given high priority again, to substitute for fossil fuels. At first, the take-of for the construction of farm scale biogas plants was slow. Only after the second oil crisis in 1979/80 the construction started to boom. In 1984 over 500 on-farm biogas plants were in operation [1], roughly one fourth thereof in Switzerland. This tremendous increase was made possible by high subsidies of the EU and of the individual countries. Together often close to 100% of the construction cost was covered by public money.
Unfortunately, most of these installations were individually designed. Hence, technical faults have been constantly repeated, giving every single plant its own tale of woe. As a result, in 1985 only about 45 biogas plants were still in operation out of those 200 built in EU- countries.
The story was different in Switzerland where neither the state nor the EU of course(!) did pay subsidies. From the 100 installations in operation 56 were made of only two different designs. Only 10 installations had to stop operation due to unmanageable problems. Despite the technical success, the construction of new plants on individual farms came to a halt: construction cost increased and oil prices decreased again in the second half of the eighties.
Electricity production was not a topic at that time, because in many cases electricity companies refused to accept „home brewed" current, claiming that it would disturb the grid due to irregular upperwaves leading to break downs of electronically controlled washing machines, Computers, etc. Anyway, the slow down of farm scale biogas installations gave room for another development: The centralized biogas plants. But that’s another story.
REBIRTH OF FARM SCALE BIOGAS UNITS AFTER RIO
What twenty years ago was recognized by a minority of farmers and consumers only, becomes nowadays acknowledged by a broad population: An environmentally sound agricultural production is a obligatory precondition for a long term, sustainable preservation of arable land and ground water quality.
30
One possible issue is biological farming where manure is accepted as the only fertilizer and source of humus. Biogas can ease the manure application considerably: Manure becomes more homogeneous after AD allowing a more even distribution and it is less edging allowing headfertilization on growing plants. But before all, AD effects a shift to higher ammonia concentrations which is taken up by the soil and the plants immediately without migrating to the ground water. Beside the improvement of quality, biogas production in closed digesters and storage tanks reduces methane release - one of the worst green house gases - as compared to open lagoons. In addition it substitutes for fossil fuels and consequently reduces the CO2
formation.The conference of Rio has opened the eyes of at least the European politicians and
animated them to subsidies sustainable farming and their respective technologies again. Germany for example, pays nowadays roughly 40% subsidies for biogas installations.
Rio has for sure helped to stimulate biogas production again. However, there are additional reasons which led - alone or in combination - to the rebirth of the technology:
• Today, the technique is mature allowing simple constructions.• With the technical simplification, self-construction becomes possible with only little help
from specialized engineers.• Collective construction of individual digesters reduces material cost.• Small centralized plants between two to three farmers reduces investment cost and allows a
better energy utilization.• Low-cost turn-key installations are giving farmers with no skill for construction the chance
to produce biogas at reasonable cost.• CHP-plants equipped with used car engines reduce investment cost• The politically fixed high prices for electricity from renewable energies improve economy• Co-fermentation of organic wastes from household and industry brings additional gas
production and net income from the treatment fee.
DO IT YOURSELF-SYSTEMS
Close to 300 out of the 400 farm scale systems in Germany were self constructed by farmers. The basic engineering was made by specialists of the Bundschuh association. They propagated the do-it-yourself method through conferences and guided tours to biogas farmers for over 13 years.
The systems are essentially based on two designs: the Darmstadt digester made of steel and the concrete-made Accumulation Continuous Flow (ACF) system developed at the Federal Research Station in Tanikon, Switzerland [2].
31
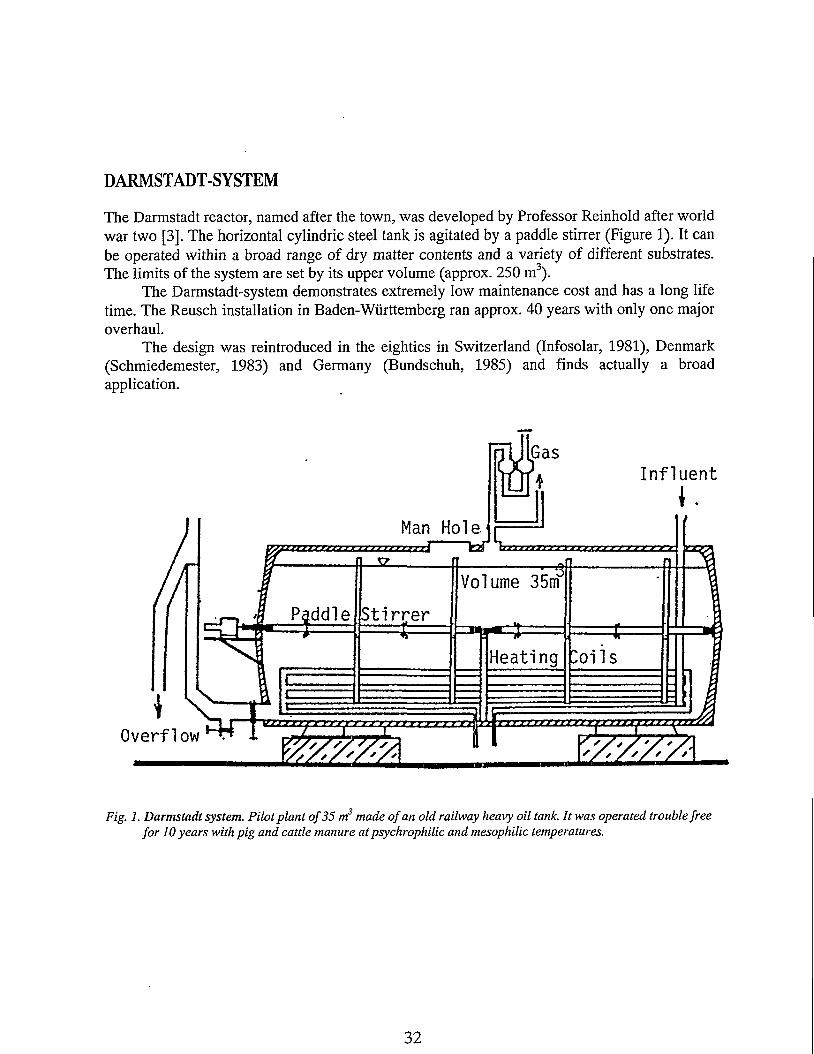
DARMSTADT-SYSTEM
The Darmstadt reactor, named after the town, was developed by Professor Reinhold after world war two [3]. The horizontal cylindric steel tank is agitated by a paddle stirrer (Figure 1). It can be operated within a broad range of dry matter contents and a variety of different substrates. The limits of the system are set by its upper volume (approx. 250 m3).
The Darmstadt-system demonstrates extremely low maintenance cost and has a long life time. The Reusch installation in Baden-Wurttemberg ran approx. 40 years with only one major overhaul.
The design was reintroduced in the eighties in Switzerland (Infosolar, 1981), Denmark (Schmiedemester, 1983) and Germany (Bundschuh, 1985) and finds actually a broad application.
Influent
Man Hole.
Volume 35m
Paddle Stirrer
Heating
Fig. 1. Darmstadt system. Pilot plant of 35 m3 made of an old railway heavy oil tank. It was operated trouble free for 10 years with pig and cattle manure at psychrophilic and mesophilic temperatures.
32
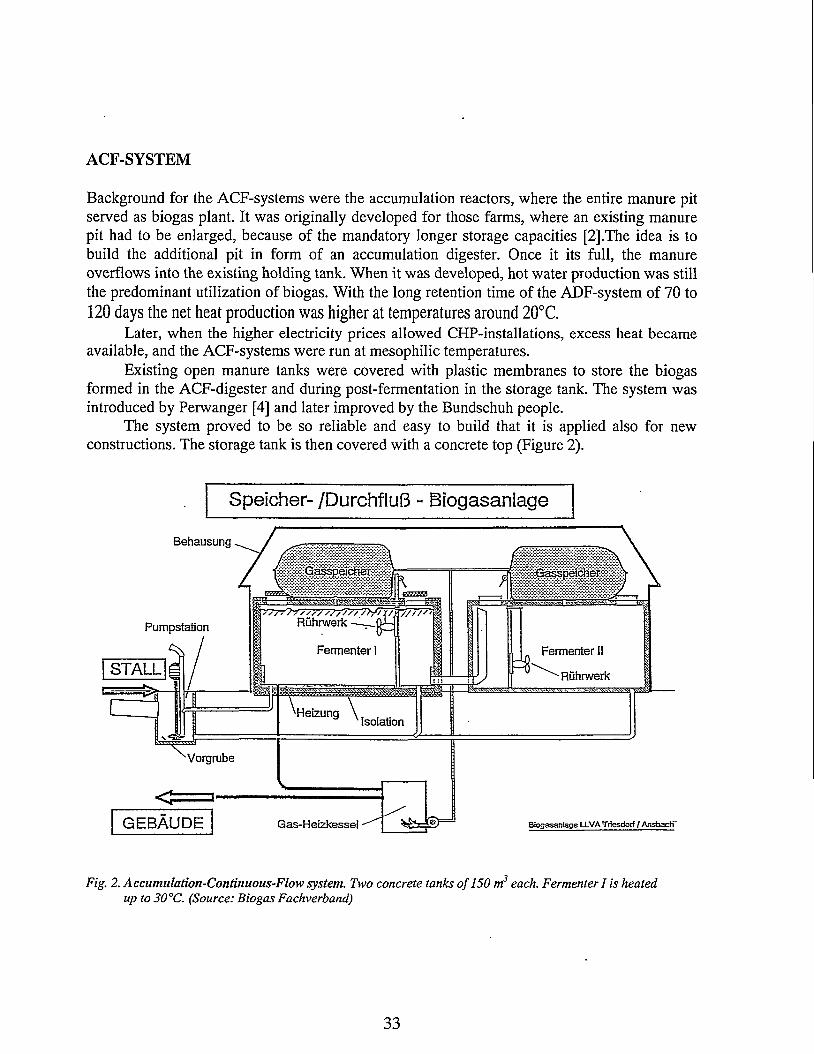
ACF-SYSTEM
Background for the ACF-systems were the accumulation reactors, where the entire manure pit served as biogas plant. It was originally developed for those farms, where an existing manure pit had to be enlarged, because of the mandatory longer storage capacities [2] .The idea is to build the additional pit in form of an accumulation digester. Once it its full, the manure overflows into the existing holding tank. When it was developed, hot water production was still the predominant utilization of biogas. With the long retention time of the AJDF-system of 70 to 120 days the net heat production was higher at temperatures around 20°C.
Later, when the higher electricity prices allowed CHP-installations, excess heat became available, and the ACF-systems were run at mesophilic temperatures.
Existing open manure tanks were covered with plastic membranes to store the biogas formed in the ACF-digester and during post-fermentation in the storage tank. The system was introduced by Perwanger [4] and later improved by the Bundschuh people.
The system proved to be so reliable and easy to build that it is applied also for new constructions. The storage tank is then covered with a concrete top (Figure 2).
Speicher- /DurchfluB - Biogasanlage
Behausung
'7777s777777>/7T7 ////'Ruhtwerk —Pumpstation
Fermenter I Fermenter II
STALL Ruhrwerk
•HeizungIsolation
GEBAUDE Gas-Heizkessel Biogasanlage LLVA Triesdorf / AnsbacH"
Fig. 2. Accumulation-Continuous-Flow system. Two concrete tanks of 150 m3 each. Fermenter I is heated up to 30°C. (Source: Biogas Fachverband)
33
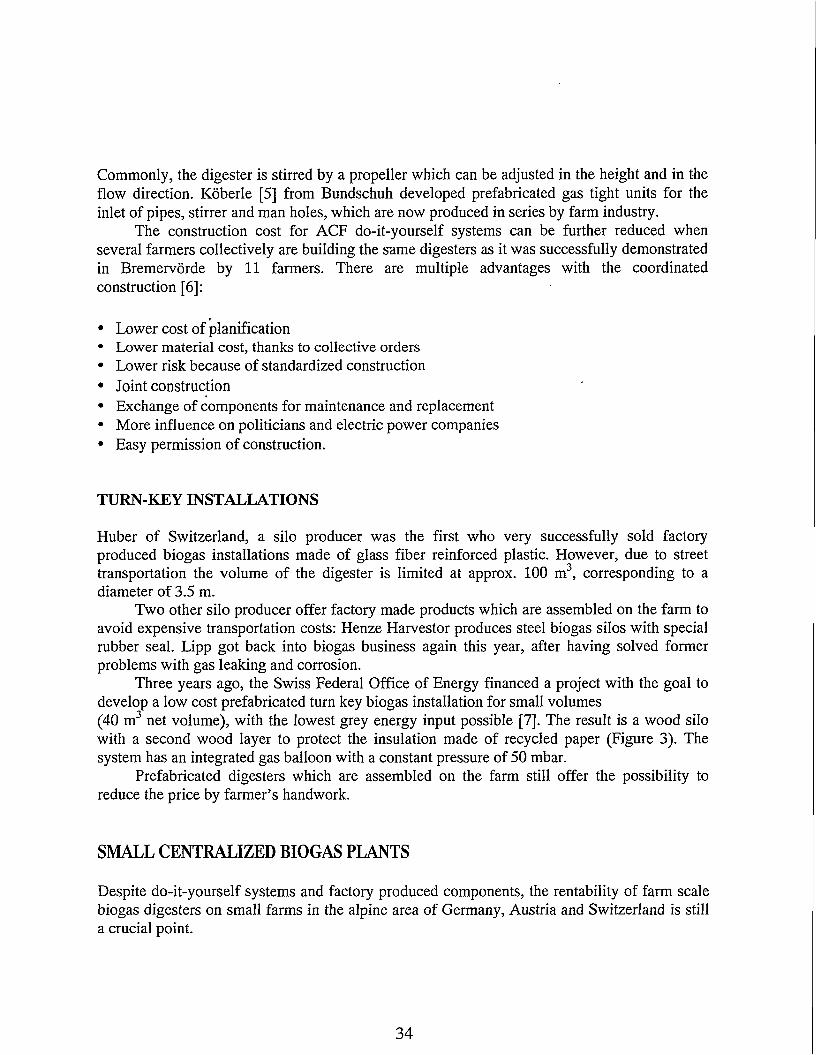
Commonly, the digester is stirred by a propeller which can be adjusted in the height and in the flow direction. Koberle [5] from Bundschuh developed prefabricated gas tight units for the inlet of pipes, stirrer and man holes, which are now produced in series by farm industry.
The construction cost for ACF do-it-yourself systems can be further reduced when several farmers collectively are building the same digesters as it was successfully demonstrated in Bremervorde by 11 farmers. There are multiple advantages with the coordinated construction [6]:
• Lower cost of planification• Lower material cost, thanks to collective orders• Lower risk because of standardized construction• Joint construction• Exchange of components for maintenance and replacement• More influence on politicians and electric power companies• Easy permission of construction.
TURN-KEY INSTALLATIONS
Huber of Switzerland, a silo producer was the first who very successfully sold factory produced biogas installations made of glass fiber reinforced plastic. However, due to street transportation the volume of the digester is limited at approx. 100 m3, corresponding to a diameter of 3.5 m.
Two other silo producer offer factory made products which are assembled on the farm to avoid expensive transportation costs: Henze Harvester produces steel biogas silos with special rubber seal. Lipp got back into biogas business again this year, after having solved former problems with gas leaking and corrosion.
Three years ago, the Swiss Federal Office of Energy financed a project with the goal to develop a low cost prefabricated turn key biogas installation for small volumes (40 m3 net volume), with the lowest grey energy input possible [7]. The result is a wood silo with a second wood layer to protect the insulation made of recycled paper (Figure 3). The system has an integrated gas balloon with a constant pressure of 50 mbar.
Prefabricated digesters which are assembled on the farm still offer the possibility to reduce the price by farmer’s handwork.
SMALL CENTRALIZED BIOGAS PLANTS
Despite do-it-yourself systems and factory produced components, the rentability of farm scale biogas digesters on small farms in the alpine area of Germany, Austria and Switzerland is still a crucial point.
34
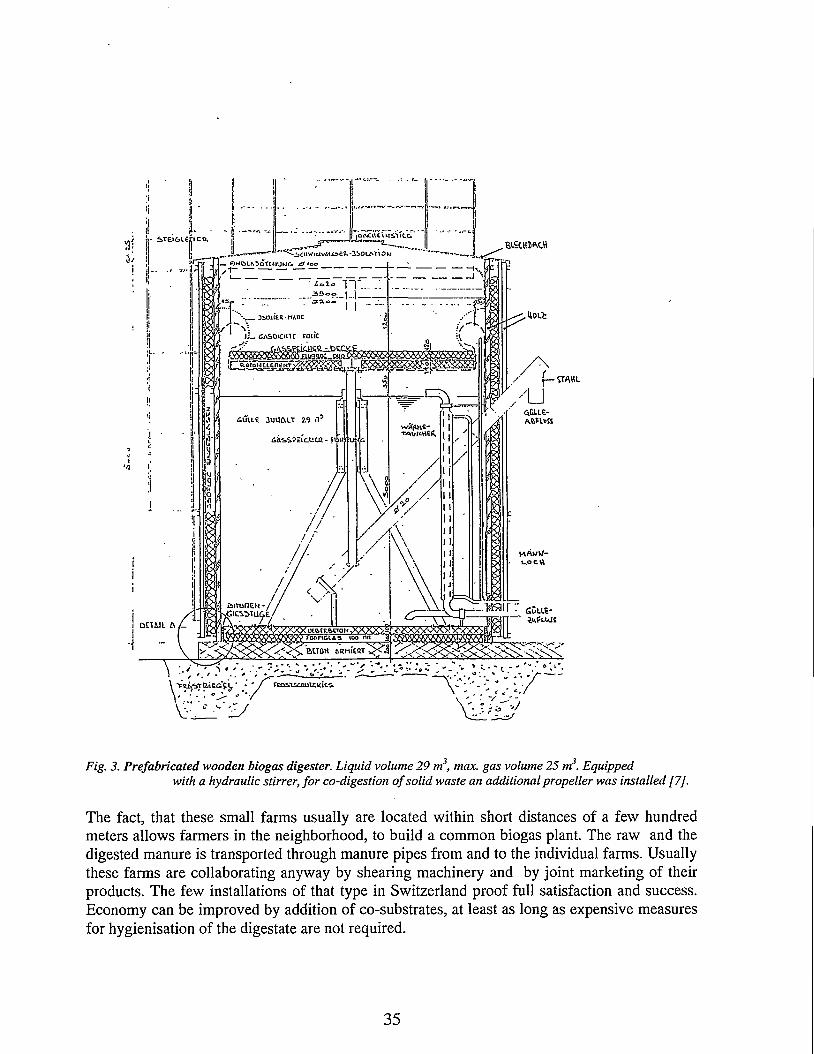
iD/VLlXtiUS'tlC.G*
'‘^^tUWiUuMJ^ei^OiOLMlOu
EiHttUiSotCNUklG 0 too ----tv'^ IT....:
OSOLIUt-MAJIt
CASoicmc roue
(5®5^^^^P^&5sa^®8S5S 305S5g
IF=?\6UILE 3UUALT 19 il
Ut&tB. SCION -AXXXVS ^
&CT0H MtMtEttT
rcosistnutttacs
Fig. 3. Prefabricated wooden biogas digester. Liquid volume 29 m3, max. gas volume 25 m3. Equippedwith a hydraulic stirrer, for co-digestion of solid waste an additional propeller was installed [7].
The fact, that these small farms usually are located within short distances of a few hundred meters allows farmers in the neighborhood, to build a common biogas plant. The raw and the digested manure is transported through manure pipes from and to the individual farms. Usually these farms are collaborating anyway by shearing machinery and by joint marketing of their products. The few installations of that type in Switzerland proof full satisfaction and success. Economy can be improved by addition of co-substrates, at least as long as expensive measures for hygienisation of the digestate are not required.
35
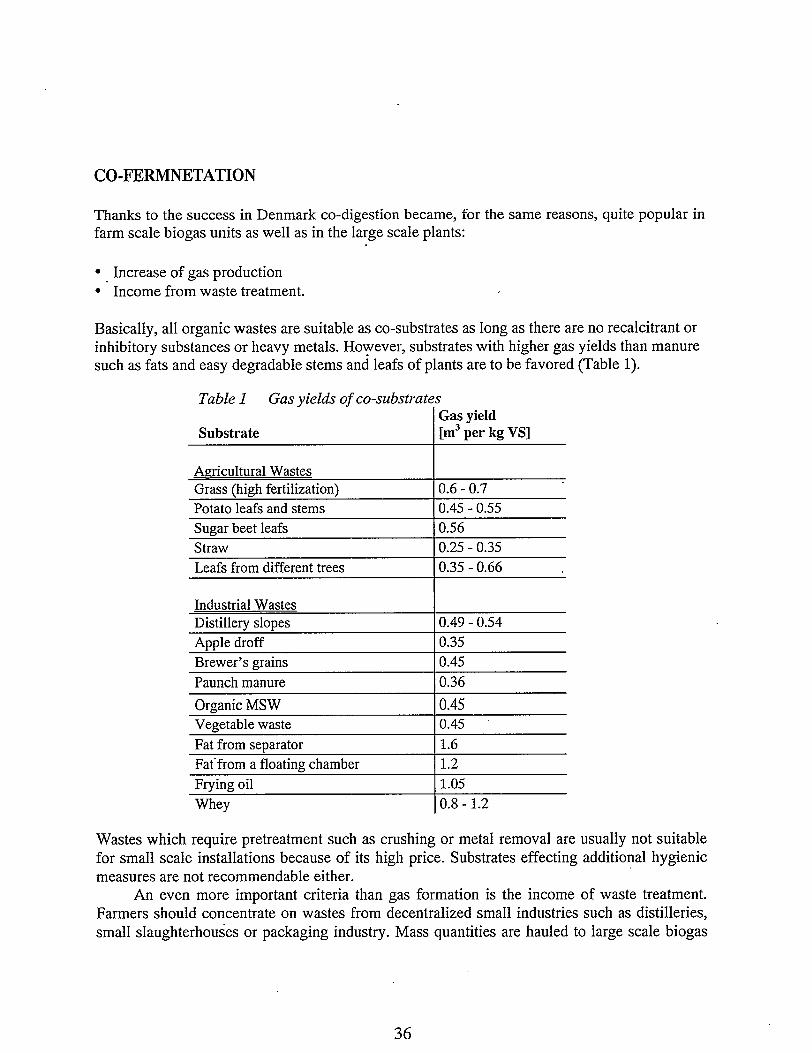
CO-FERMNETATION
Thanks to the success in Denmark co-digestion became, for the same reasons, quite popular in farm scale biogas units as well as in the large scale plants:
• Increase of gas production• Income from waste treatment.
Basically, all organic wastes are suitable as co-substrates as long as there are no recalcitrant or inhibitory substances or heavy metals. However, substrates with higher gas yields than manure such as fats and easy degradable stems and leafs of plants are to be favored (Table 1).
Table 1 Gas yields of co-substrates
SubstrateGas yield [m3 per kg VS]
Agricultural WastesGrass (high fertilization)
ovoo
Potato leafs and stems 0.45 - 0.55Sugar beet leafs 0.56Straw 0.25 - 0.35Leafs from different trees 0.35 - 0.66
Industrial WastesDistillery slopes 0.49 - 0.54Apple droff 0.35Brewer’s grains 0.45Paunch manure 0.36Organic MSW 0.45Vegetable waste 0.45Fat from separator 1.6Fat'from a floating chamber 1.2Frying oil 1.05Whey 0.8 - 1.2
Wastes which require pretreatment such as crushing or metal removal are usually not suitable for small scale installations because of its high price. Substrates effecting additional hygienic measures are not recommendable either.
An even more important criteria than gas formation is the income of waste treatment. Farmers should concentrate on wastes from decentralized small industries such as distilleries, small slaughterhouses or packaging industry. Mass quantities are hauled to large scale biogas
36
plants effecting a real market which ultimately leads to a drop in treatment fees. There is much less competition for smaller amounts of waste. Also farmers should not depend on one industrial waste alone. Digestion of a number of different wastes gives more flexibility to seasonal variations and reduces the pressure on treatment cost.
A good example in Switzerland is the collaboration of a dairy farmer with a vegetable grower. The farmer gets an increased gas production allowing to run a second CHP and the vegetable grower reduces its cost of waste dipping by a factor of three (55 SFR vs. 160 SFR).
Other farmers are treating up to seven different co-substrates which are delivered to the farm. They get improved gas production and the industries have lower treatment costs and shorter transportation distances.
OUTLOOK
The near future of farm scale biogas production looks bright as long as the high electricity prices are maintained by political will and subsidies remain higher than approx. 20%. If in all the number of biogas plants is growing as it is in Germany (within the last two years about 200 new plants have been built) [8] then biogas will add its share to a nuclear power free electricity production, as does wind energy in Germany, Holland or Denmark.The standard for manure digesters is set. There is still some way to go for solid waste digesters. However, first inputs have been given in [9,10]
ACKNOWLEDGMENT
This paper was written in the framework of the AD-Nett information network, an EU FAIR RTD Programme and was made possible by a contribution of the Swiss Federal Office of Education and Science which is gratefully acknowledged.
37
RERERENCES
1. A. Wellinger, K. Sutter and K. Egger, ^Technical and Social Integration of Biogas Plants into Farm Management10 11, Proc. 5th Int. Symp. on AD, eds. E.R. Hall and P.N. Hobson, Advances in Water Pollution Control (1988): 413-419.
2. K. Sutter and A. Wellinger, „The ACF-System: A new low temperature biogas digester11, Proc. 4th Int. CIEC Symp. (1987): 61-70.
3. Reinhold, „Gasgewinnung in der Landwirtschaft nach dem System Darmstadt11 Landtechnik 2/1952.
4. A. Perwanger, „Untersuchung und Optimierung von Biogasanlagen in der Praxis mit technisch oekonomischer Vergleichsauswertung11, Schlussbericht Landtechnik Weihenstephan, 373 S.
5. E. Koberle, „Bauhandbuch Betonrundbehalter Biogasanlage11,14 S.
6. E. Schneider, „Bremervordener Modell11, Tagungsunterlagen „Biogas in der Landwirtschaft11, Fachverband Biogas, 7.-10. Januar 1997.
7. K. Egger et.al., „Kleine schlusselfertige Biogasanlage11 Schlussbericht Bundeamt fur Energiewirtschaft (1990), 13 S.
8. Mitgliederrundbrief 6/97, Fachverband Biogas e.V.
9. U. Baserga, K. Egger and A. Wellinger, „Entwicklung einer Pilotanlage (Anacom) zur Vergarung von Festmist11, INFOENERGIE (1994), 42 S.
10. U. Baserga and K. Egger, „Entwicklung der Garkanalpilotanlage zum Vergaren von strohhaltigemMist11, INFOENERGIE (1995), 30 S.
38
Biogas - Agriculture and Environment
Senior Adviser LeifKnudsen and Adviser Torkild Birkmose, The Danish Agricultural Advisory Centre, Aarhus, Denmark
For a number of years the environmental impact of intensive farming has been discussed in both Europe and North America. Cultivating the soil always leads to a higher loss of nutrients to the surrounding environment than the loss recorded from natural areas. Loss of nitrogen by leaching may have the effect that the set limit for nitrate of 50 mg NO3 per litre of water is exceeded in areas, where the water supply is based on ground water. Furthermore, nitrogen leaching may lead to eutrophication followed by oxygen depletion in inland waterways whereas it has hardly any significant environmental impact in freshwater areas (Miljpstyrelsen, 1995). Ammonia volatilization followed by deposition influences nutrient-poor biotopes like heaths, marshlands etc. (Miljpstyrelsen, 1995). Increasing importance is attached to the loss of phosphorus from farmland as the discharge of sewage from urban areas and industries are reduced due to effective chemical and biological treatment plants. Environmental problems related to loss of phosphorus is primarily eutrophication of freshwater lakes (Tunney et al, 1997). Nitrous oxide (N%0), resulting from denitrification of nitrate in the soil, and the emission of methane contribute considerably to the greenhouse effect. Both nitrous oxide and the emission of methane are influenced by the volume of animal production, but no certain data on the connection and the importance are available.
Loss of nutrients from farm production is primarily related to animal production. The largest environmental impact concerns the loss of nutrients in areas, where the live-stock production is very intensive in large compact areas and, where the produced amount of nutrients in animal manure and other organic manures exceed the requirements of the crops. Even though no excess production of nutrients from animal manure exists at national level in the western European countries, apart from Holland and Belgium (Table 1), there are in many EU countries specific areas where there is a surplus of animal manure, e.g. in the western part of Jutland (Denmark) in Nieder-sachsen (Germany) and in Bretagne (France).
39
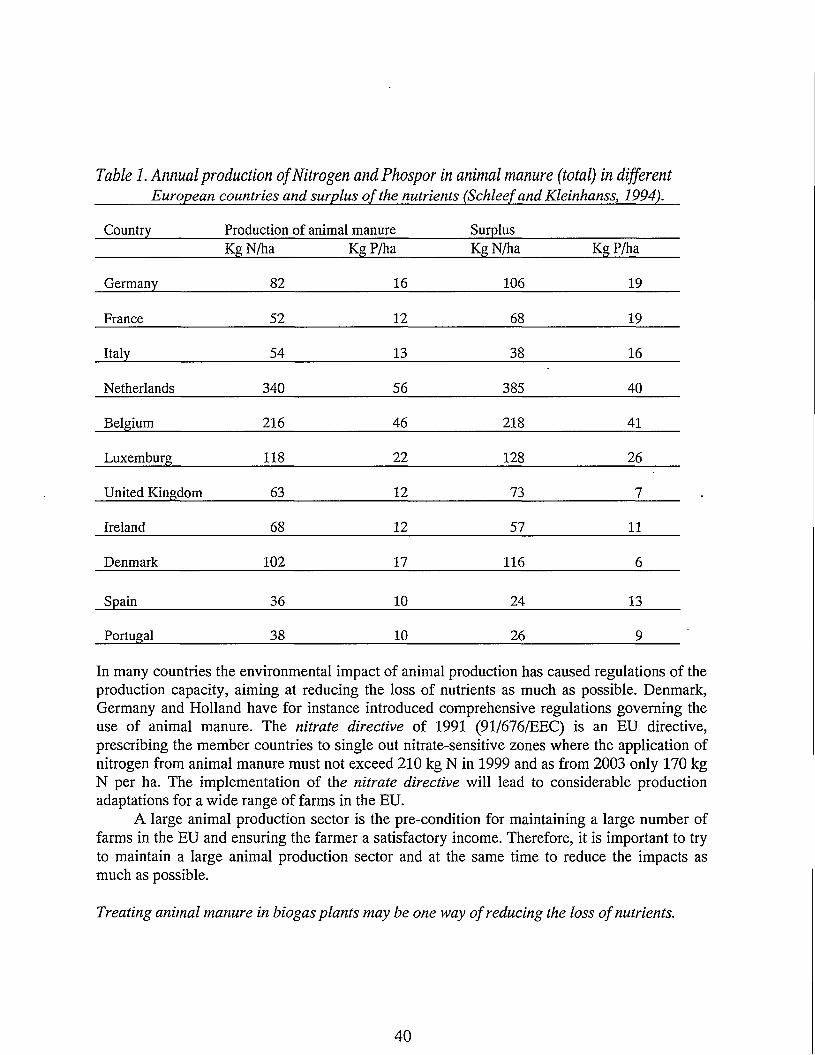
Table 1. Annual production of Nitrogen andPhospor in animal manure (total) in different European countries and surplus of the nutrients (Schleef and Kleinhanss, 1994).
Country Production of animal manure SurplusKgN/ha Kg P/ha KgN/ha Kg P/ha
Germany 82 16 106 19
France 52 12 68 19
Italy 54 13 38 16
Netherlands 340 56 385 40
Belgium 216 46 218 41
Luxemburg 118 22 128 26
United Kingdom 63 12 73 7
Ireland 68 12 57 11
Denmark 102 17 116 6
Spain 36 10 24 13
Portugal 38 10 26 9
In many countries the environmental impact of animal production has caused regulations of the production capacity, aiming at reducing the loss of nutrients as much as possible. Denmark, Germany and Holland have for instance introduced comprehensive regulations governing the use of animal manure. The nitrate directive of 1991 (91/676/EEC) is an EU directive, prescribing the member countries to single out nitrate-sensitive zones where the application of nitrogen from animal manure must not exceed 210 kg N in 1999 and as from 2003 only 170 kg N per ha. The implementation of the nitrate directive will lead to considerable production adaptations for a wide range of farms in the EU.
A large animal production sector is the pre-condition for maintaining a large number of farms in the EU and ensuring the farmer a satisfactory income. Therefore, it is important to try to maintain a large animal production sector and at the same time to reduce the impacts as much as possible.
Treating animal manure in biogas plants may be one way of reducing the loss of nutrients.
40
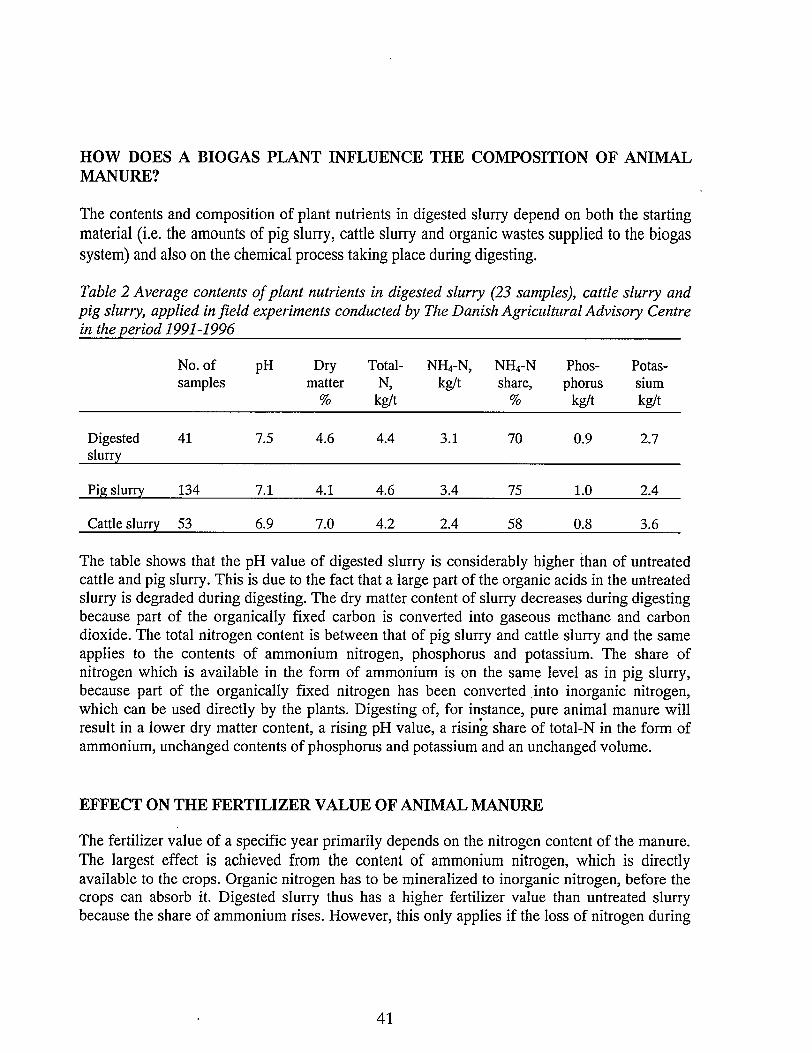
HOW DOES A BIOGAS PLANT INFLUENCE THE COMPOSITION OF ANIMAL MANURE?
The contents and composition of plant nutrients in digested slurry depend on both the starting material (i.e. the amounts of pig slurry, cattle slurry and organic wastes supplied to the biogas system) and also on the chemical process taking place during digesting.
Table 2 Average contents of plant nutrients in digested slurry (23 samplesj, cattle slurry and pig slurry, applied in field experiments conducted by The Danish Agricultural Advisory Centre in the period 1991-1996
No. of pH Dry Total- NH4-N, NH4-N Phos- Potas-samples matter N, kg/t share, phorus slum
% kg/t % kg/t kg/t
Digested 41 7.5 4.6 4.4 3.1 70 0.9 2.7slurry
Pig slurry 134 7.1 4.1 4.6 3.4 75 1.0 2.4
Cattle slurry 53 6.9 7.0 4.2 2.4 58 0.8 3.6
The table shows that the pH value of digested slurry is considerably higher than of untreated cattle and pig slurry. This is due to the fact that a large part of the organic acids in the untreated slurry is degraded during digesting. The dry matter content of slurry decreases during digesting because part of the organically fixed carbon is converted into gaseous methane and carbon dioxide. The total nitrogen content is between that of pig slurry and cattle slurry and the same applies to the contents of ammonium nitrogen, phosphorus and potassium. The share of nitrogen which is available in the form of ammonium is on the same level as in pig slurry, because part of the organically fixed nitrogen has been converted into inorganic nitrogen, which can be used directly by the plants. Digesting of, for instance, pure animal manure will result in a lower dry matter content, a rising pH value, a rising share of total-N in the form of ammonium, unchanged contents of phosphorus and potassium and an unchanged volume.
EFFECT ON THE FERTILIZER VALUE OF ANIMAL MANURE
The fertilizer value of a specific year primarily depends on the nitrogen content of the manure. The largest effect is achieved from the content of ammonium nitrogen, which is directly available to the crops. Organic nitrogen has to be mineralized to inorganic nitrogen, before the crops can absorb it. Digested slurry thus has a higher fertilizer value than untreated slurry because the share of ammonium rises. However, this only applies if the loss of nitrogen during
41
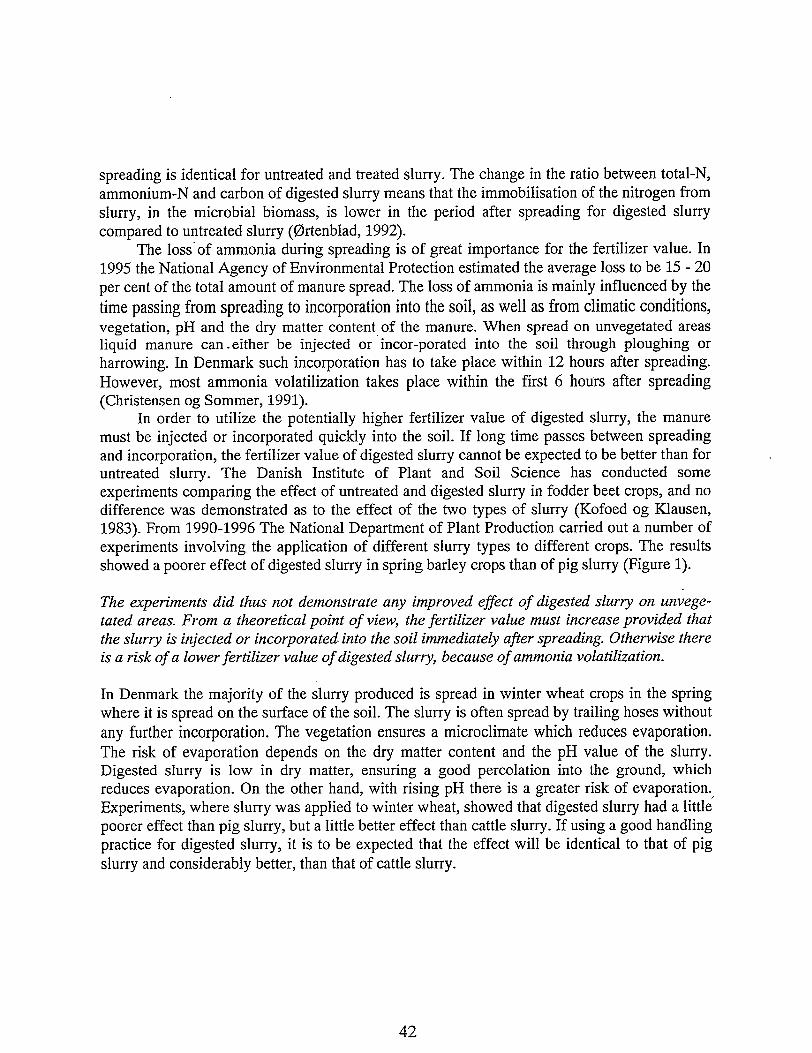
spreading is identical for untreated and treated slurry. The change in the ratio between total-N, ammonium-N and carbon of digested slurry means that the immobilisation of the nitrogen from slurry, in the microbial biomass, is lower in the period after spreading for digested slurry compared to untreated slurry (0rtenblad, 1992).
The loss of ammonia during spreading is of great importance for the fertilizer value. In 1995 the National Agency of Environmental Protection estimated the average loss to be 15 - 20 per cent of the total amount of manure spread. The loss of ammonia is mainly influenced by the time passing from spreading to incorporation into the soil, as well as from climatic conditions, vegetation, pH and the dry matter content of the manure. When spread on unvegetated areas liquid manure can.either be injected or incor-porated into the soil through ploughing or harrowing. In Denmark such incorporation has to take place within 12 hours after spreading. However, most ammonia volatilization takes place within the first 6 hours after spreading (Christensen og Sommer, 1991).
In order to utilize the potentially higher fertilizer value of digested slurry, the manure must be injected or incorporated quickly into the soil. If long time passes between spreading and incorporation, the fertilizer value of digested slurry cannot be expected to be better than for untreated slurry. The Danish Institute of Plant and Soil Science has conducted some experiments comparing the effect of untreated and digested slurry in fodder beet crops, and no difference was demonstrated as to the effect of the two types of slurry (Kofoed og Klausen, 1983). From 1990-1996 The National Department of Plant Production carried out a number of experiments involving the application of different slurry types to different crops. The results showed a poorer effect of digested slurry in spring barley crops than of pig slurry (Figure 1).
The experiments did thus not demonstrate any improved effect of digested slurry on unvegetated areas. From a theoretical point of view, the fertilizer value must increase provided that the slurry is injected or incorporated into the soil immediately after spreading. Otherwise there is a risk of a lower fertilizer value of digested slurry, because of ammonia volatilization.
In Denmark the majority of the slurry produced is spread in winter wheat crops in the spring where it is spread on the surface of the soil. The slurry is often spread by trailing hoses without any further incorporation. The vegetation ensures a microclimate which reduces evaporation. The risk of evaporation depends on the dry matter content and the pH value of the slurry. Digested slurry is low in dry matter, ensuring a good percolation into the ground, which reduces evaporation. On the other hand, with rising pH there is a greater risk of evaporation. Experiments, where slurry was applied to winter wheat, showed that digested slurry had a little poorer effect than pig slurry, but a little better effect than cattle slurry. If using a good handling practice for digested slurry, it is to be expected that the effect will be identical to that of pig slurry and considerably better, than that of cattle slurry.
42
80
70
Digested Pig Cattle Digested Pig Cattleslurry slurry slurry slurry slurry slurry
Vinter wheat Spring barley
Fig. 1. N effect (utilization percentage) of digested slurry, pig slurry and cattle slurry in field experiments.
The effect of phosphorus and potassium in untreated manure is considered identical to the effect of the same substances from commercial fertilizers. Therefore the effect of these nutrients, following a degassing of the slurry, cannot be demonstrated. In a centralized biogas plant the animal manure is mixed with different types of slurry and perhaps nutrients from different wastes. This may, in some cases, change the relation between the different nutrients in such a way, that it better covers the requirements of the crops, and from an overall point ofview, this may lead to a better utilization of the nutrients, because the slurry is often applied on the basis of the content of the most limited nutrient. In other cases the relation between the nutrients may aggravate.
OTHER ADVANTAGES OF DIGESTING ANIMAL MANURE FROM THE FARMERS' POINT OF VIEW
Animal manure, especially slurry, may contain a number of infectious matters like salmonella, lung worm, intestinal parasites etc. This may result in restricted spreading of the manure on individual farms and give rise to problems when moving manure to other farms.
Studies at Danish centralized biogas plants show that digesting of slurry effectively reduces the amount of infectious matters. This means that the farmer is free to choose among more ways of using the manure from his livestock. This could be of major importance, especially on intensively grazed farms.
43
Due to the Danish legislation on the use of animal manure, practically all the manure produced has to be spread in the spring. Slurry spreading in winter wheat crops in May, where the slurry is not incorporated gives rise to much complaint from nearby urban areas. This has been a rising problem over recent years, so many farmers are interested in reducing this odour nuisance. Studies of the odour problem are unsafe and only few have been conducted. It is widely held that the odour nuisance from digested slurry is less than from untreated slurry. If this can be documented, it could be an important incentive for digesting animal manure.
LOSS OF NITROGEN TRHOUGH AMMONIA VOLATILIZATION
In Denmark we assume that about 30 per cent of the set free nitrogen in animal manure volatilizies and that about 77 per cent of the total ammonia volatilization in Denmark originates from animal manure. Out of the total evaporation from animal manure 39 per cent originates from housing facilities and 22 per cent from storage facilities, whereas 39 per cent evaporates during and immediately after spreading (Henriksen et al. 1995). Consequently, increasing importance is attached to ammonia volatilization in the environmental debate.
Digesting of slurry is of no importance to the evaporation from housing facilities but is related to storing and spreading.
The rising pH values in digested slurry increase the risk of ammonia evaporation, as the balance between ammonium and ammonia depends on the pH value and shifts towardsammonia with rising pH. And contrary to ammonium, ammonia can evaporate.
As opposed to untreated cattle slurry, digested slurry only seldom produces an efficient natural floating cover, in the slurry storage tank. Lack of floating cover in combination with a high pH value is crucial as the ammonia evaporation can be extremely intensive. Experiments conducted by the Danish Institute of Plant and Soil Science show that up to 20 per cent of the nitrogen in digested slurry may evaporate from tanks without floating cover. At the same time, it was demonstrated that ammonia evaporation can easily be reduced to 1-2 per cent by covering the slurry with an artificial floating cover of straw or Leca (air- filled clay granules) (Sommer, 1995).
So, it is very important to have an efficient floating cover on tanks holding digested slurry. Calculations thus show that the cost of establishing a floating cover of air-filled clay granules or straw can compensate for savings in purchased commercial fertilizers. If no effective floating cover is created, the loss of ammonia from stores will be much higher from digested slurry than from untreated slurry. Consequently, initiatives must be taken to establish a floating cover, if the trend is towards shifting from untreated to digested slurry.
44
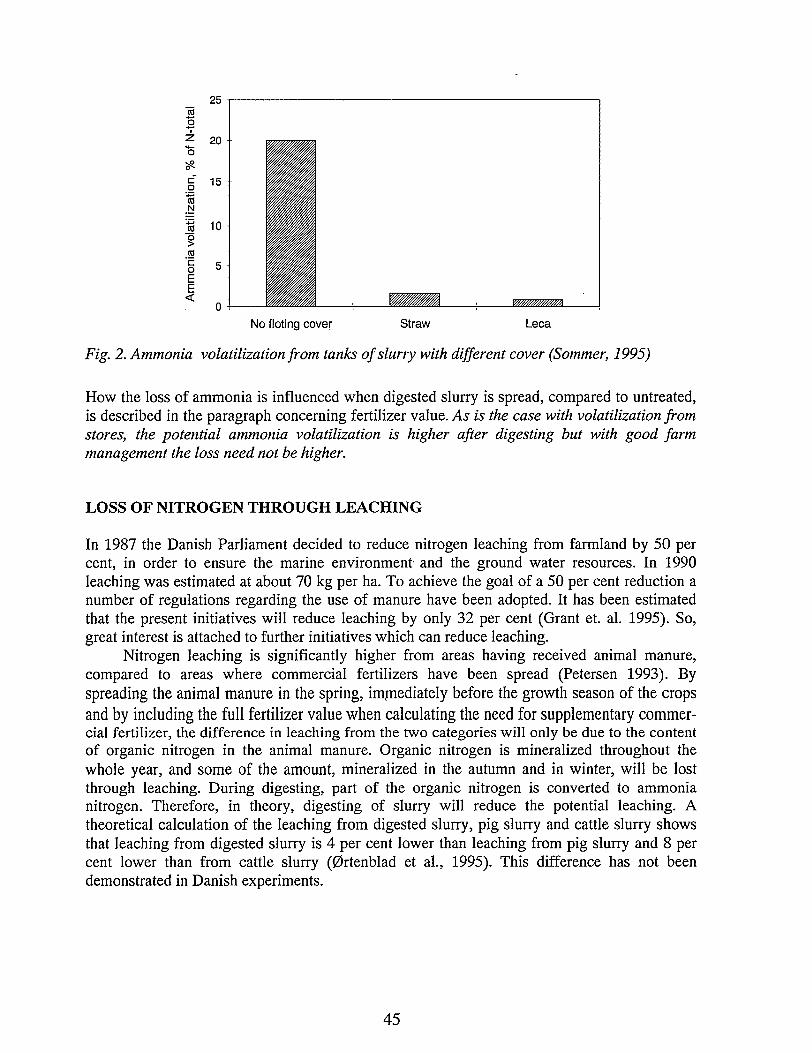
Straw Leca
25 t
No floting cover
Fig. 2. Ammonia volatilization from tanks of slurry with different cover (Sommer, 1995)
How the loss of ammonia is influenced when digested slurry is spread, compared to untreated, is described in the paragraph concerning fertilizer value. As is the case with volatilization from stores, the potential ammonia volatilization is higher after digesting but with good farm management the loss need not be higher.
LOSS OF NITROGEN THROUGH LEACHING
In 1987 the Danish Parliament decided to reduce nitrogen leaching from farmland by 50 per cent, in order to ensure the marine environment and the ground water resources. In 1990 leaching was estimated at about 70 kg per ha. To achieve the goal of a 50 per cent reduction a number of regulations regarding the use of manure have been adopted. It has been estimated that the present initiatives will reduce leaching by only 32 per cent (Grant et. al. 1995). So, great interest is attached to further initiatives which can reduce leaching.
Nitrogen leaching is significantly higher from areas having received animal manure, compared to areas where commercial fertilizers have been spread (Petersen 1993). By spreading the animal manure in the spring, immediately before the growth season of the crops and by including the full fertilizer value when calculating the need for supplementary commercial fertilizer, the difference in leaching from the two categories will only be due to the content of organic nitrogen in the animal manure. Organic nitrogen is mineralized throughout the whole year, and some of the amount, mineralized in the autumn and in winter, will be lost through leaching. During digesting, part of the organic nitrogen is converted to ammonia nitrogen. Therefore, in theory, digesting of slurry will reduce the potential leaching. A theoretical calculation of the leaching from digested slurry, pig slurry and cattle slurry shows that leaching from digested slurry is 4 per cent lower than leaching from pig slurry and 8 per cent lower than from cattle slurry (0rtenblad et al., 1995). This difference has not been demonstrated in Danish experiments.
45
LOSS OF NITROGEN THROUGH DENITRIFICATION
The information available about the amount of nitrogen lost through denitrification fromfarmland is very unsafe. Part of the emission may be in the form of nitrous oxide (N2O), which is a greenhouse gas. Studies by 0rtenblad et al. 1991 and 0rtenblad et at. 1992 show a significantly lower denitrification from digested slurry, compared to untreated cattle slurry. The same result was found by Rubzek et al. in 1995. However, the existing measurements cannot quantify the effect of digesting of slurry on the emission of nitrous oxide. At present the Danish Institute of Plant and Soil Science is making a direct comparison of the nitrous oxide emission from digested and untreated slurry.
LOSS OF PHOSPHORUS
So far the loss of phosphorus from farmland has been considered insignificant. As the discharge of phosphorus from industries and urban areas has decreased, the loss of phosphorus from farmland may get increasing importance. Even though the loss of phosphorus is of no economic importance for the farmer, it can be high enough to cause eutrophication of lakes. The loss of phosphorus from Danish farmland has been estimated at 170 g phosphorus per ha in the period from 1989-1995.
To reduce the loss of phosphorus from farmland it is important not to add more phosphorus than the crops remove from the fields, where the phosphorus content is high enough to ensure optimum growth. In Denmark this applies to almost the total agricultural area. In regions with intensive livestock production there is still a surplus production of phosphorus, resulting in increasing phosphorus content in the soil. To avoid this, the animal manure produced must be spread on a larger area but this involves high costs of transportation. In Denmark, the addition of phosphorus to farmland is limited to a certain amount per ha. This limit does not ensure that the amount of phosphorus added exceeds the amount absorbed by the crops and thus not that the content in the soil increases.
Centralized biogas plants which treat large quantities of slurry can contribute to an improved distribution of the slurry, because contracts, concerning large amounts of digested slurry of uniform quality, can be signed with farms with no livestock or only a limited livestock number per ha. At the biogas plants at Thorsp and Ribe studies have shown that such a redistribution of slurry is in actual fact taking place (Birkmose, 1996). In other cases the centralized biogas plants may have an adverse effect on the phosphorus balance in areas with a high livestock intensity because phosphorus is also added in the form of wastes. Optimum utilization of the entire amount of digested slurry calls for a strong organization of the plants, which is for instance found at Ribe biogas plant.
46
SEPARATION OF ANIMAL MANURE - A FUTURE POSSIBILITY AT THECENTRALIZED BIOGAS PLANTS
One of the big problems of manure handling is the huge volume as the dry matter content is only 6-10 per cent. This involves extremely high costs of transportation in relation to the nutrient value. In areas with a high livestock density, e.g. Denmark and Holland, a lot of experiments have been carried out in order to separate water from animal manure, but so far no commercial plants are available which can do the job at a competitive price. Centralized biogas plants handle very large quantities of animal manure and will thus benefit from the scale advantages of a separation technique.
The environmental advantage of separation is that it is both cheaper to redistribute the nutrients over large distances and it may be possible to improve the availability of nitrogen in the concentrated manure. In the absence of a technological breakthrough, as regards a plant that is able to separate pure water, a plant is being tested right now which is capable of separating slurry into two fractions: a concentrated fraction which can be transported to other regions and a thin fraction which can be spread near the farm or the centralized biogas plant. Studies have shown that about 10 per cent of the nitrogen and the phosphorus can be concentrated in about 2.5 per cent of the volume of the digested slurry through a simple mechanical separation (screw press). The first experiments with decanting centrifugation of slurry show that about 65 per cent of the phosphorus and 12 per cent of the nitrogen can be separated in a concentrated fibre fraction (Kruger, 1997). As phosphorus is likely to be the key element regarding the amount of animal manure to be spread per ha and in order to maintain or increase the production of animal manure in an area, separation and a subsequent transportation of the fibre fraction to less livestock intensive areas - perhaps 150 km - may be capable of solving the harmony problem of the area. This may be an economically interesting alternative to transporting the. entire amount of slurry over the same distance. From an environmental point of view this may ensure that both nitrogen and phosphorus from animal manure are applied only according to the needs of the crops. However, there will be a surplus of potassium in the weak fraction but excess potassium is not considered an environmental problem.
47
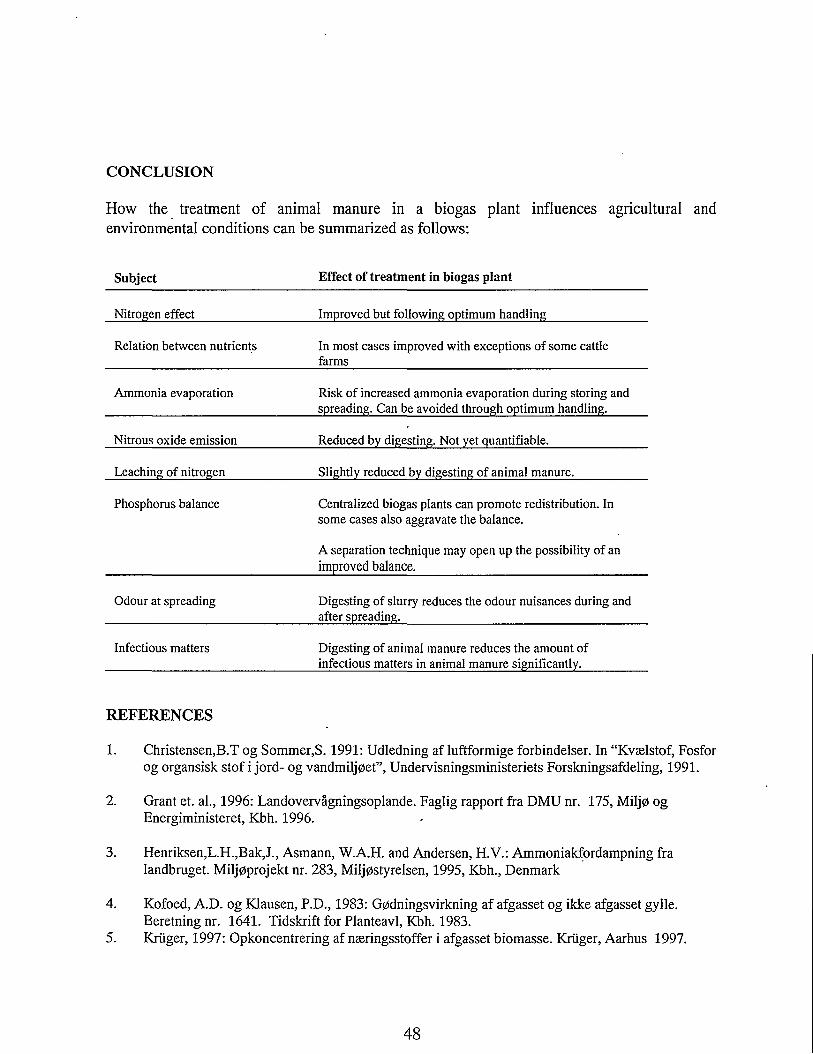
CONCLUSION
How the treatment of animal manure in a biogas plant influences agricultural and environmental conditions can be summarized as follows:
Subject Effect of treatment in biogas plant
Nitrogen effect Improved but following optimum handling
Relation between nutrients In most cases improved with exceptions of some cattle farms
Ammonia evaporation Risk of increased ammonia evaporation during storing and spreading. Can be avoided through optimum handling.
Nitrous oxide emission Reduced by digesting. Not yet quantifiable.
Leaching of nitrogen Slightly reduced by digesting of animal manure.
Phosphorus balance Centralized biogas plants can promote redistribution. Insome cases also aggravate the balance.
A separation technique may open up the possibility of an improved balance.
Odour at spreading Digesting of slurry reduces the odour nuisances during and after spreading.
Infectious matters Digesting of animal manure reduces the amount of infectious matters in animal manure significantly.
REFERENCES
1. Christensen,B.T og Sommer,S. 1991: Udledning af luftformige forbindelser. In “Kvaelstof, Fosfor og organsisk stof i jord- og vandmilj0et”, Undervisningsministeriets Forskningsafdeling, 1991.
2. Grant et. al., 1996: Landovervagningsoplande. Faglig rapport fra DMU nr. 175, Miljp og Energiministeret, Kbh. 1996.
3. Henriksen,L.H.,Bak,J., Asmann, W.A.H. and Andersen, H.V.: Ammoniakfordampning fra landbruget. Miljoprojekt nr. 283, Miljpstyrelsen, 1995, Kbh., Denmark
4. Kofoed, A.D. og Klausen, P.D., 1983: Gpdningsvirkning af afgasset og ikke afgasset gylle. Beretning nr. 1641. Tidskrift for Planteavl, Kbh. 1983.
5. Kruger, 1997: Opkoncentrering af naeringsstoffer i afgasset biomasse. Kruger, Aarhus 1997.
48
6. Milj0styrelsen, 1992: Vandmilj0-92: Redeg0relse fra Milj0tyrelsen nr. 2,1992, Kbh.,Denmark Oertenblad, H., Hvelplund,E. and Henriksen, K., 1991: G0dningsvirkning og tab af kvaelstof fra almindelig og afgasset kvasggylle. Landbrugets Radgivningscenter, Aarhus.
7. Oertenblad, H., Hvelplund,E. and Henriksen, K., 1992: Sammenligning af g0dningsvirkning og tab af kvaelstof fra almindelig og afgasset kvaeggylle. Landbrugets Radgivningscenter, Aarhus.
8. Oertenblad et al., 1995: Naeringsstofudnyttelse af afgasset gylle. Landbrugets Radgivningscenter, Aarhus, 1995.
9. Pedersen, C.A.(red.), 1997: Oversigt over Landsforspgene 1996. Landbrugets Radgivningscengter, Aarhus 1997.
10. Petersen, N., 1993: Kvaelstofudvaskning ved forskellig landbrugspraksis. Projekt om jord og grundvand fra Miljpstyrelsen, nr. 3,1995. Kbh. 1995
11. Schleef, K.H. and Kleinhanss,W: Mineral balances in agriculture in EU, Part I, 1994: The Regional level, Arbeistsbericht 1/94. Contribution to the Study: “Standards of nitrate in
' European Community: Processes of change in policy instruments and agriculture”.
12. Sommer,S., 1997: Ammonia volatilization from farm tanks containing anaerobically digested animal slurry. Atmospheric Environment, 31(6): 863-868
13. Tunney, H., Carton,O.T., Brookes,P.C. and Johnston,A.E.: Phosporus Loss from soil to water. CAB International, Oxon, United Kingdom, 1997
49
Hygiene and Sanitation Requirements in Danish Biogas Plants
H.J. Bendixen, Dr.med.vet. eth.c., Torslundevej 51, DK-4960 Holeby, Denmark
ABSTRACT
According to Danish regulations, systematic pathogen reducing treatment is required, when industrial byproducts and waste products, and urban waste, ie garbage from households and sewage sludge, are processed, before being used - without restrictions - as fertilizers on agricultural land. An adequate pathogen reducing effect (PRE) can be achieved in the digestion tanks and sanitation tanks of the biogas plants, provided they are operated correctly and respect the criteria of the official requirements. The FS- method is a microbiological indicator method based on faecal streptococci (enterococci) (FS). It may be used to check the sanitation effect achieved by the treatment in a tank. The effect is expressed numerically by the log]0-reduction of the numbers of FS measured in the biomass before and after treatment. The PRE was examined in 10 large-scale biogas plants during a period of 2-3 years. It was demonstrated that properly directed and well-functioning thermophilic digestion tanks ensure the removal of most pathogenic microorganisms from organic waste and slurry. The removal of pathogens by the treatment in mesophilic digestion tanks is incomplete. Systematic studies of the processes of inactivation of bacteria and vims in slurry and in animal tissues gave evidence that the PRE is enhanced in the microbiological environment of thermophilic digestion tanks. The sanitation criteria, ie combinations of temperature/time, for the processing of biomass in digestion tanks and sanitation tanks in biogas plants are specified.
KEYWORDS
Anaerobic digestion, pathogen reduction, biogas plants, slurry, wastes, sanitation, criteria.
PATHOGENS IN THE ENVIRONMENT OF FOOD PRODUCING AJVHNALS
Modem technology in livestock production has resulted in the use of new methods for handling and distributing manure and slurry on agricultural soil. Simultaneously, plans are implemented to recycle industrial by-products and waste products, and urban waste, ie garbage from households and sewage sludge by using them as fertilizers on farm land instead of the traditional dumping or incineration.
Large quantities of these types of organic waste are now recycled. They originate from a multitude of sources, and are often of dubious or unknown origin. They may often contain bacteria, viruses and parasites surviving in particular in manure, by-products and wastes of animal origin. Measures should be taken to break the flow of pathogens along these new pathways of
50
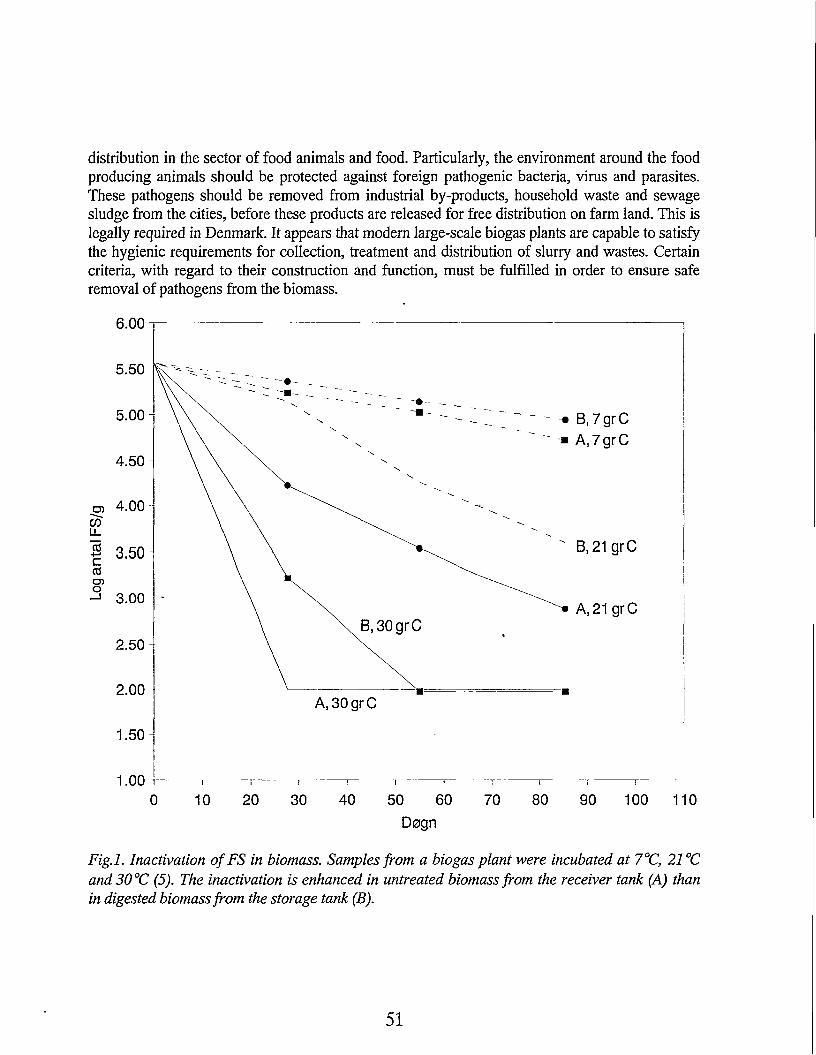
distribution in the sector of food animals and food. Particularly, the environment around the food producing animals should be protected against foreign pathogenic bacteria, virus and parasites. These pathogens should be removed from industrial by-products, household waste and sewage sludge from the cities, before these products are released for free distribution on farm land. This is legally required in Denmark. It appears that modem large-scale biogas plants are capable to satisfy the hygienic requirements for collection, treatment and distribution of slurry and wastes. Certain criteria, with regard to their construction and function, must be fulfilled in order to ensure safe removal of pathogens from the biomass.
A, 30grC
0 10 20 30 40 50 60 70 80 90 100 110
Dogn
Fig.l. Inactivation of FS in biomass. Samples from a biogas plant were incubated at 7°C, 21 °C
and 30 °C (5). The inactivation is enhanced in untreated biomass from the receiver tank (A) than in digested biomass from the storage tank (B).
51
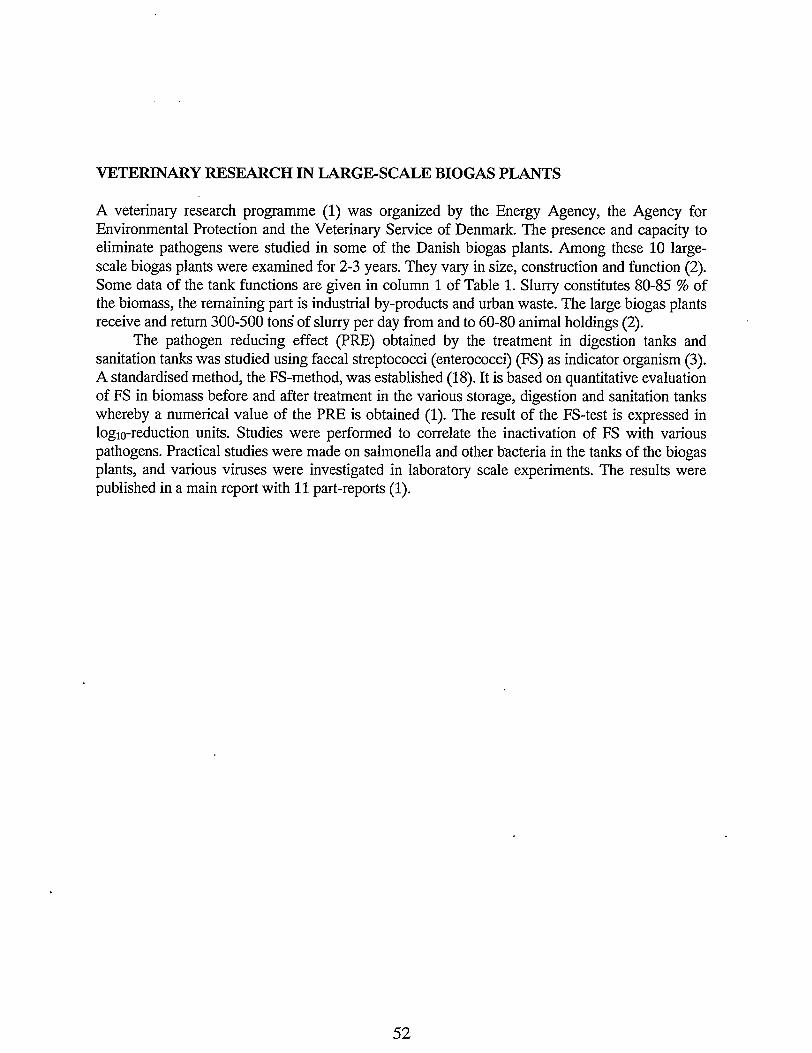
VETERINARY RESEARCH IN LARGE-SCALE BIOGAS PLANTS
A veterinary research programme (1) was organized by the Energy Agency, the Agency for Environmental Protection and the Veterinary Service of Denmark. The presence and capacity to eliminate pathogens were studied in some of the Danish biogas plants. Among these 10 large- scale biogas plants were examined for 2-3 years. They vary in size, construction and function (2). Some data of the tank functions are given in column 1 of Table 1. Slurry constitutes 80-85 % of the biomass, the remaining part is industrial by-products and urban waste. The large biogas plants receive and return 300-500 tons of slurry per day from and to 60-80 animal holdings (2).
The pathogen reducing effect (PRE) obtained by the treatment in digestion tanks and sanitation tanks was studied using faecal streptococci (enterococci) (FS) as indicator organism (3). A standardised method, the FS-method, was established (18). It is based on quantitative evaluation of FS in biomass before and after treatment in the various storage, digestion and sanitation tanks whereby a numerical value of the PRE is obtained (1). The result of the FS-test is expressed in logio-reduction units. Studies were performed to correlate the inactivation of FS with various pathogens. Practical studies were made on salmonella and other bacteria in the tanks of the biogas plants, and various viruses were investigated in laboratory scale experiments. The results were published in a main report with 11 part-reports (1).
52
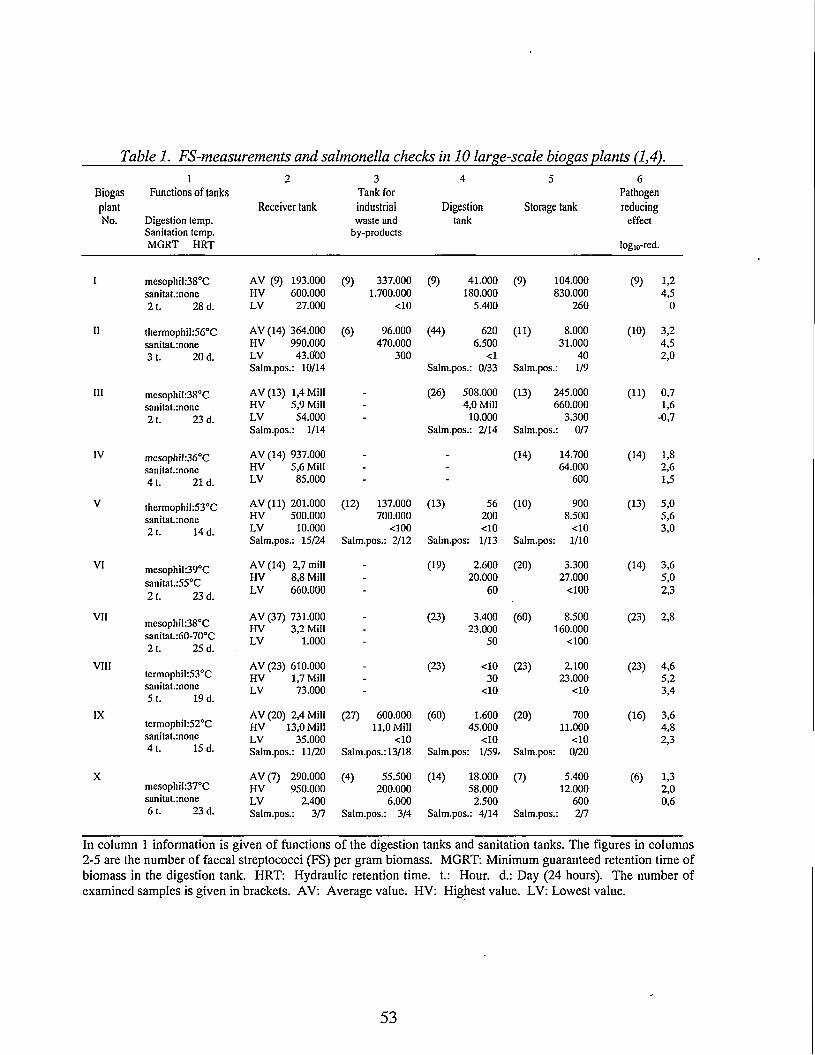
Table 1. FS-measurements and salmonella checks in 10 large-scale biogas plants (1,4).
Biogas1
Functions of tanks2 3
Tank for4 5 6
PathogenplantNo. Digestion temp.
Sanitation temp. MGRT HRT
Receiver tank industrial waste and
by-products
Digestiontank
Storage tank reducingeffect
logio-red.
I mcsophil:38°C sanitat.:none21. 28 d.
II thermophil:56°C sanitat.inone3 t. 20 d.
HI mesophil:38°Csanitat.:none 21. 23 d.
mesophil:36°C sanitat.:none 41. 21 d.
thermophil:53°C sanitat.inone 21. 14 d.
V1 mesophil:39°Csanitat.:55°C 21. 23 d.
^ mesophil:38°Csanitat.:60-70°C 21. 25 d.
VIIItermophil:53 C sanitat.inone 5 t. 19 d.
IXtermophil:52 C sanitat.inone 41. 15 d.
XmesophiIi37°C sanitat.inone 61. 23 d.
AV (9) 193.000 (9) 337.000 (9) 41.000 (9) 104.000 (9) 1,2HV 600.000 1.700.000 180.000 830.000 4,5LV 27.000 <10 5.400 260 0
AV (14) 364.000 (6) 96.000 (44) 620 (11) 8.000 (10) 3,2HV 990.000 470.000 6.500 31.000 4,5LV 43.000 300 <1 40 2,0Salm.pos.i 10/14 Salm.pos.i 0/33 Salm.pos. 1/9
AV (13) 1,4 Mill - (26) 508.000 (13) 245.000 (11) 0,7HV 5,9 Mill - 4,0 Mill 660.000 1,6LV 54.000 - 10.000 3.300 -0,7Salm.pos.: 1/14 Salm.pos.i 2/14 Salm.pos .: 0/7
AV (14) 937.000 - - (14) 14.700 (14) 1,8HV 5,6 Mill - - 64.000 2,6LV 85.000 - - 600 1,5
AV (11) 201.000 (12) 137.000 (13) 56 (10) 900 (13) 5,0HV 500.000 700.000 200 8.500 5,6LV 10.000 <100 <10 <10 3,0Salm.pos,i 15/24 Salm.pos.! 2/12 Salm.pos: 1/13 Salm.pos : 1/10
AV (14) 2,7 mill - (19) 2.600 (20) 3.300 (14) 3,6HV 8,8 Mill - 20.000 27.000 5,0LV 660.000 - 60 <100 2,3
AV (37) 731.000 (23) 3.400 (60) 8.500 (23) 2JHV 3,2 Mill - 23.000 160.000LV 1.000 - 50 <100
AV (23) 610.000 _ (23) <10 (23) 2.100 (23) 4,6HV 1,7 Mill - 30 23.000 5,2LV 73.000 - <10 <10 3,4
AV (20) 2,4 Mill (27) 600.000 (60) 1.600 (20) 700 (16) 3,6HV 13,0 Mill 11,0 Mill 45.000 11.000 4,8LV 35.000 <10 <10 <10 2,3Salm.pos,i 11/20 Salm.pos.! 13/18 Salm.pos: 1/59. Salm.pos:: 0/20
AV(7) 290.000 (4) 55.500 (14) 18.000 (7) 5.400 (6) 1,3HV 950.000 200.000 58.000 12.000 2,0LV 2.400 6.000 2.500 600 0,6Salm.pos.: 3/7 Salm.pos.: 3/4 Salm.pos.i 4/14 Salm.pos.: 2/7
In column 1 information is given of functions of the digestion tanks and sanitation tanks. The figures in columns 2-5 are the number of faecal streptococci (FS) per gram biomass. MGRT: Minimum guaranteed retention time of biomass in the digestion tank. HRT: Hydraulic retention time, t.: Hour, d.: Day (24 hours). The number of examined samples is given in brackets. AV: Average value. HV: Highest value. LV: Lowest value.
53

— PPV 55*
100.00 1000.00
+ PPV 70*
-X- SP 55*
-e MKS 55*
-©■ AUJ 55*
-0- SI 55
+ FS 50*
* FS 55*
Timer FS 60
Fig. 2. Inactivation of animal viruses and FS in slurry at various temperatures. PPV: Porcine parvovirus and SP: Classical swine fever virus (15). MKS: Foot- and mouth disease virus, AUJ: Aujeszky virus and SI: Swineinfluenza virus (8). FS: Faecal enterococci (3).
PATHOGENGS IN SLURRY, INDUSTRIAL BY-PRODUCTS AND URBAN WASTE
The types and quantities of pathogenic bacteria, viruses and parasites present in manure, urine and slurry, and also in industrial by-products and urban waste, depend on the health status of the domestic animals and the human population of the region. The survival is influenced by storage conditions and composition of the biomass (see Figure 1) where FS is used as model (5). Most pathogenic bacteria are inactivated before the FS.
Pathogens in slurry. Bacteria and parasites (6,7) and viruses (8) may survive in manure and slurry for a long time, i.e. weeks or months, at ambient winter and summer temperatures between 0°C and 25°C. Digested biomass in storage tanks at biogas plants and farms may contain pathogens which have not been properly eliminated (9,10). In column 2 of Table 1 a survey is given of the FS contents of slurry in receiver tanks. The average values vary between
54
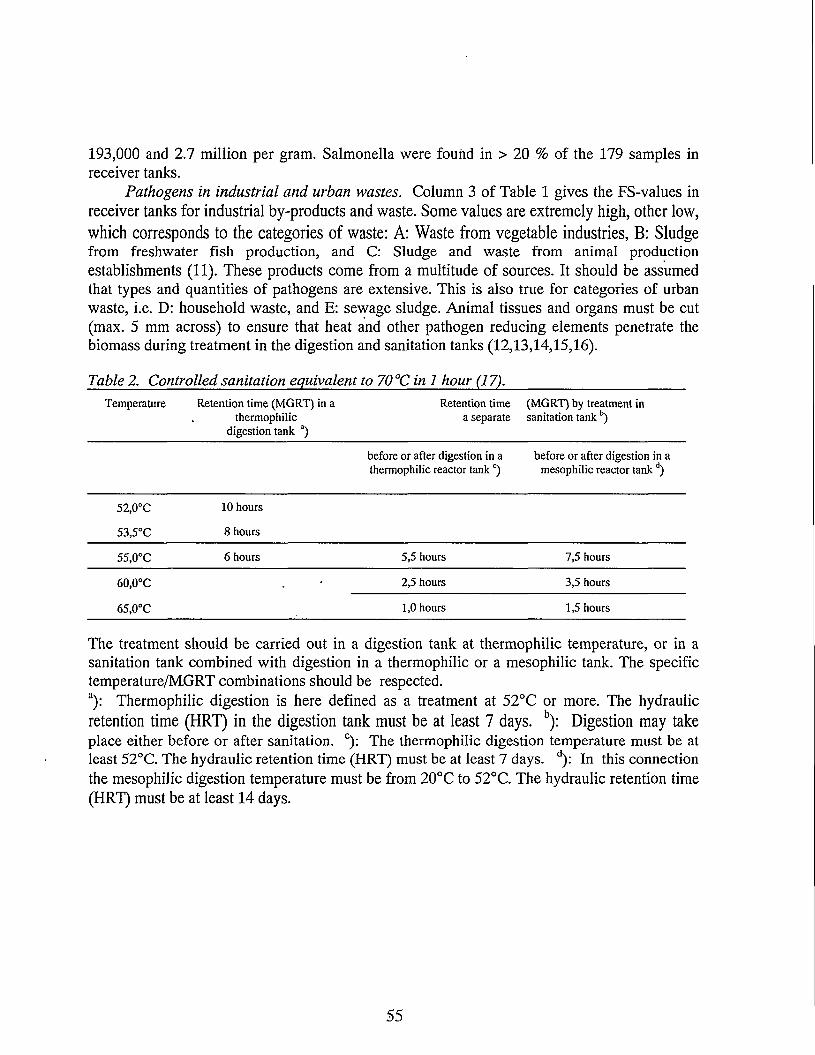
193,000 and 2.7 million per gram. Salmonella were found in > 20 % of the 179 samples in receiver tanks.
Pathogens in industrial and urban wastes. Column 3 of Table 1 gives the FS-values in receiver tanks for industrial by-products and waste. Some values are extremely high, other low, which corresponds to the categories of waste: A: Waste from vegetable industries, B: Sludgefrom freshwater fish production, and C: Sludge and waste from animal production establishments (11). These products come from a multitude of sources. It should be assumed that types and quantities of pathogens are extensive. This is also true for categories of urban waste, i.e. D: household waste, and E: sewage sludge. Animal tissues and organs must be cut (max. 5 mm across) to ensure that heat and other pathogen reducing elements penetrate the biomass during treatment in the digestion and sanitation tanks (12,13,14,15,16).
Table 2. Controlled sanitation equivalent to 70 °C in 1 hour (17).
Temperature Retention time (MGRT) in a . thermophilic
digestion tank a)
Retention time a separate
(MGRT) by treatment in sanitation tank
before or after digestion in a thermophilic reactor tank ^
before or after digestion in a mesophilic reactor tank d)
52,0°C 10 hours
53,5°C 8 hours
55,0°C 6 hours 5,5 hours 7,5 hours
60,0°C . 2,5 hours 3,5 hours
65,0°C 1,0 hours 1,5 hours
The treatment should be carried out in a digestion tank at thermophilic temperature, or in a sanitation tank combined with digestion in a thermophilic or a mesophilic tank. The specific temperature/MGRT combinations should be respected.a): Thermophilic digestion is here defined as a treatment at 52°C or more. The hydraulicretention time (HRT) in the digestion tank must be at least 7 days. b): Digestion may takeplace either before or after sanitation. c): The thermophilic digestion temperature must be at least 52°C. The hydraulic retention time (HRT) must be at least 7 days. d): In this connection the mesophilic digestion temperature must be from 20°C to 52°C. The hydraulic retention time (HRT) must be at least 14 days.
55
REQUIREMENTS FOR SANITATION
By comparing the FS-values in columns 2 and 4 in Table 1, i.e. before and after digestion/sanitation, the PRE achieved can be evaluated. The PRE is expressed numerically by the logio-reduction, see column 6. The practical experience (1,4,19) is the following: In mesophilic digestion tanks the PRE is modest and corresponds to a logio-reduction of 1-2 units, often below 1. Considerable numbers of pathogens will pass through the tank when the load is high in the untreated biomass. If waste and sludge of categories C, D and E are treated, they must pass a separate sanitation tank. In thermophilic tanks the PRE is adequate when a logio- reduction of 4 units is obtained. These observations constitute the basis for the requirements in the notification on the use of waste on agricultural land (17) (See Table 2). The FS-method must be used to confirm that the PRE is always adequate. The final product must contain < 100 FS per gram, and no salmonella in 25 gram biomass.
DISCUSSION
The official requirements for hygienic treatment of biomass are now integrated in a notification issued by the central competent authority (17). Biogas plants are supervised by the local authority, who issue the operational license and ensure that legal requirements are respected. The FS-method is available to measure the PRE of digestion and sanitation tanks, which should ensure uniformity in the control of biogas plants.
A major risk of spread of pathogens is related to the collection, transport and handling of untreated slurry and wastes. This risk is reduced when slurry and liquid wastes are handled in closed tanks and tubes. Outside surfaces of vehicles must be washed and cleansed regularly, and the inner surface of the transport tank cleansed and disinfected between each transport. Rules for good operational practices have been issued.
Many livestock owners, producers of industrial by-products and city authorities have recognised that the sanitary state of recycled biomass must be improved. Traditions and behaviour in the daily routines are, however, difficult to change in this sector. It is satisfying toobserve the steps forward taken in the Danish biogas plants where progress is created by voluntary initiatives of the owners and technical advice given by the authority.
It is worth mentioning that the Veterinary Service in Denmark is responsible for establishing measures to stop and eliminate pathogens which may be spread when serious infectious diseases occur. If such diseases are discovered among animals in the vicinity, or among the herds of the clients of a biogas plant, certain restrictions will be imposed. The extent and duration of these may depend on the general state of hygiene in the biogas plant, and on the PRE of the digestion and sanitation tanks.
56
CONCLUSION
Large biogas plants are capable of fulfilling the official criteria for sanitation of waste. The FS- method can be used for measuring the pathogen reducing effect (PRE) in digestion and sanitation tanks. The PRE obtained in thermophilic tanks may be kept above 4 logio-reduction units. The PRE obtained in mesophilic digestion tanks is 1-2 logio-reduction units. It is necessary to treat the biomass in a separate sanitation tank when waste of categories C, D and E are processed in mesophilic tanks.
REFERENCES
1. H.J. Bendixen (rapporteur)(1995). Smitstofreduktion i biomasse, Vol.I: Main report, Vol.II: 11 part reports, Ed. Veterinaerdirektoratet, Copenhagen. Part reports are included in this list of references marked by *).
2. Anon. (1995) Biogasfcellesanlceg -fra ide til realitet. Ed. Energistyrelsen, Copenhagen.3. O. Bennetzen and U.S. Mikkelsen (1993). FS-metodens anvendelighed som hygiejnisk
kontrolparameter, Dansk Vet.tidsskr.,76, 597-604, 653-656, 691-694. See also *) Annex II.4. H.J. Bendixen (1996). Hygiejniske forholdsregler og smitstofreducerende behandling i danske
biogasanlaeg. Dansk Vet.tidsskr. 96, p. 475-482.5. U.S. Mikkelsen and O. Bennetzen (1995). Vcekstforhold i ubehandlet og termofilt stabiliseret
biomasse afevt. patogener belyst vedfcekale streptokokkers vcekstbetingelser. *) Annex V.6. H.E. Larsen and B. Munch (1981). Sygdoms- og milj0mcessige problemer i forbindelse med
behandling og spredning af flydende husdyrg0dning (gylle). Ed. The Royal Vet. and Agric. Univ., Copenhagen
7. B. Ilspe (1993). Smitterisici ved genanvendelse af organisk affald. Dansk Vet.tidsskr.76, p. 77 - 85.
8. A. Bptner (1990). Modelstudier vedr0rende overlevelse af virus i gylle under traditionel opbevaring og under udradning i biogasanlceg. Ed. Statens Veterinaere Institut for Virus- forskning, Lindholm.
9. O. Bennetzen (1995). Mikrobiologiske forhold i decentrale biomassetanke i Ribe biogasanlceg. *) Annex VII.
10. F. Boisen (1995). Patogene bakteriers vcekstforhold i biomasse. *) Annex VI.11. M. Kraglund (1995). Indholdet af patogene bakterier i affald leveret til biogasanlceg. *) Annex
VIII. •12. B. Ahring, B. Lund and G. Jungersen & P. Have and V. Fr0kjaer Jensen (1995). Modelstudier
vedr0rende overlevelse af virus i gyllebaseret biomasse under udradning i laboratorieskala biogasanlaeg. *) Annex X.
13. B. Lund, H.J. Bendixen, P. Have and B. Ahring (1996). Reduction of pathogenic bacteria and viruses by anaerobic digestion. In: Management of Urban Biodegradable Wastes, pp. 281-285, James & James, London
14. B. Espensen (1995). Praktiske fors0g med smitstofreducerende behandling af husholdningsaf- fald *) Annex III
57
15. V. Frpkjaer Jensen and P. Have (1995). Overlevelse af virus i animalske produkter ved udrad- ning/hygiejnisering i gylle under anaerobe forhold. *) Annex XI.
16. U.S. Mikkelsen and O. Bennetzen (1995b). Kildesorteret affald i biogasfcellesanloeg. Betydningen af varmetransmissionen i knogler for kontrolleret hygiejnisering af kildesorteret affald. *) Annex IX.
17. Milj0- og Energiministeriet (1995): Notification No. 730 of 5. September 1995 on the use of waste products on agricultural land, Copenhagen.
18. FS-metodeforslag (1995). Bestemmelse af streptococcer i biomasse ved pladespred- ningsmetoden. *) Annex I.
19. H.J. Bendixen (1996). Hygiene and sanitation requirements in Danish biogas plants. In Proceedings of the 9th European Bioenergy Conference: Biomass for energy and the environment, Copenhagen 1996, Vol I, p. 296-301. Pergamon.
58
MONITORING AND CONTROLLING THE BIOGAS PROCESS
Birgitte K. Ahring and Irini Angelidaki, Department of Environmental Science and Engineering, Building 115, The Technical University of Denmark, 2800 Lyngby, Denmark.
ABSTRACT
Many modern large-scale biogas plants have been constructed recently, increasing the demand for proper monitoring and control of these large reactor systems. For monitoring the biogas process, an easy to measure and reliable indicator is required, which reflects the metabolic state and the activity of the bacterial populations in the reactor. In this paper, we discuss existing indicators as well as indicators under development which can potentially be used to monitor the state of the biogas process in a reactor. Furthermore, data are presented from two large scale thermophilic biogas plants, subjected to temperature changes and where the concentration of volatile fatty acids was monitored. The results clearly demonstrated that significant changes in the concentration of the individual VFA occurred although the biogas production was not significantly changed. Especially the concentrations of butyrate, isobutyrate and isovalerate showed significant changes. Future improvements of process control could therefore be based on monitoring of the concentration of specific VFA’s together with information about the bacterial populations in the reactor. The last information could be supplied by the use of modern molecular techniques.
KEYWORDS
Centralized biogas plants, monitoring and control, optimization, volatile fatty acids
INTRODUCTION
Large-scale anaerobic digestion of livestock manure has received growing attention during the recent years in Denmark and elsewhere as a method for utilizing organic wastes more efficiently for production of energy and fertilizers. Other advantages are reduced problems of odours as well as improved handling qualities, during spreading on fields. The main advantage is though that biogas is a renewable form of energy, which do not contribute to the increase of the greenhouse gas, carbon dioxide.
An interesting approach which has been introduced and tested in recent years in Denmarkis the construction of large centralized biogas plants (CBP), serving a number of farmers and supplying energy to public utilities (district heating and electricity grids) (Ahring et al., 1992).
59
Biogas production from the Danish plants has increased dramatically from approx. 100,000 m3- biogas/month in the beginning of 1989 to approx. 3,000,000 m3-biogas/month in 1996. In addition to manure, these CBP are treating other types of wastes such as industrial organic wastes, household waste and sewage sludge. However, the economy of these plants is often marginal and optimization is of great importance. Therefore, there is an urgent need to develop reliable methods for the evaluation and control of the anaerobic digestion process.
In the present paper we discuss possible indicators for monitoring and control of the anaerobic process. Furthermore, we present a study case from two large scale biogas plants, where volatile fatty acids were evaluated as indicators for process imbalance, after perturbations were introduced by sudden change in the process temperature.
MONITORING AND CONTROL
The control of bioreactors is mainly restricted to regulation of the hydraulic loading. Also, regulation of the substrate concentration and composition by proper waste management could help in obtaining optimal reactor conditions and a better utilization of the available substrates. Other important regulation functions are the regulation of parameters such as the temperature, in accordance with the optimum of the microbial populations.
Monitoring of CBP is today mainly based on the biogas production as illustrated in Fig.la. The operator of the plant evaluates the process from the knowledge of biogas production and decides if an increased loading of the reactor is possible. Two types of operation strategies can result from this type of control. The “cautious operator” keeps the loading low, to be sure to avoid overloading and unpleasant surprises. However, the process will run at a sub-optimal level and the microbial populations will be present in a slow and undynamic state. The second type of strategy is performed by the “brave operator”; this person keeps increasing the reactor loading, resulting in an increased production of biogas until the point where the process is overloaded and process failure occurs. Both operators will have no qualified information of the state of the process and, thus, no possibility of reacting against imbalance at an early stage.
An alternative control scheme can be seen in Fig. lb. The operator, in this case, can optimize the process based on a number of inputs including information of the state of the process. Eventually, this control can be automatized and performed by a computer based process logic controller. The alternative scheme requires that a suitable process parameter can be identified for monitoring process performance.
60
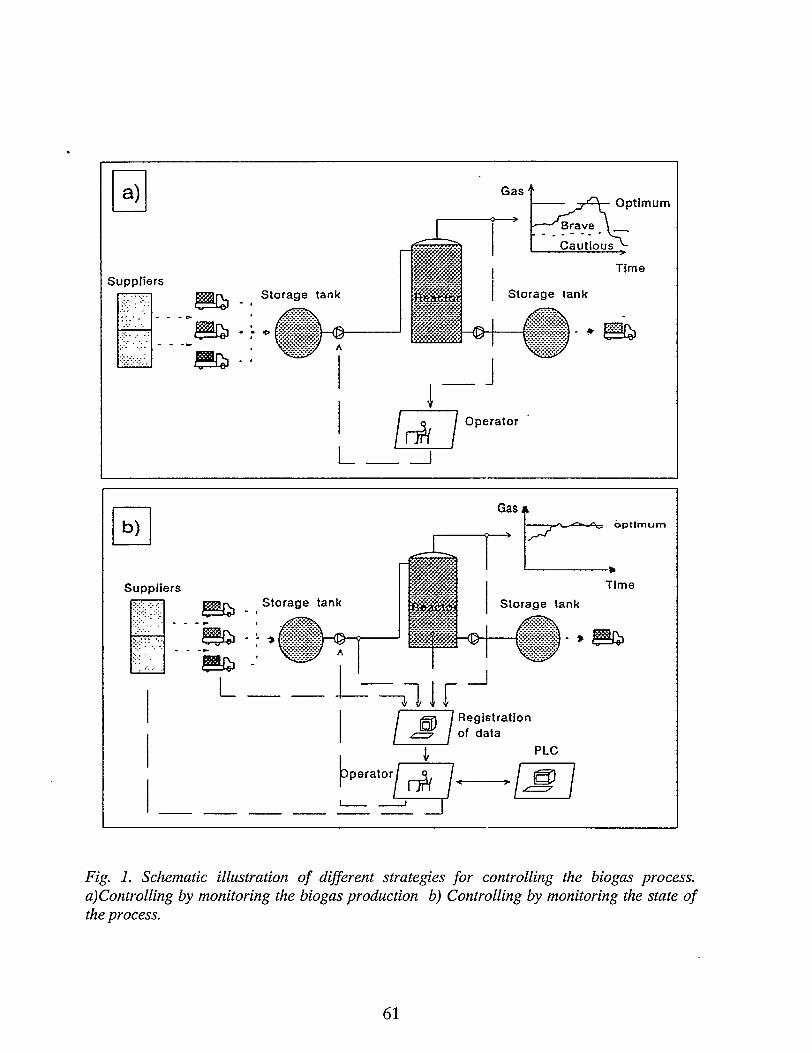
Gas '■Optimum
Cautious
TimeSuppliers
Storage tankStorage tank
Operator
/fe optimum
TimeSuppliersStorage tank Storage tank
Registration of data
perator
Fig. 1. Schematic illustration of different strategies for controlling the biogas process. a)Controlling by monitoring the biogas production b) Controlling by monitoring the state of the process.
61
INDICATORS FOR PROCESS IMBALANCE
Anaerobic digestion is a complex process consisting of a series of microbial reactions catalyzed by consortia of different bacteria (Mclnerney et al., 1980). The interdependence of the bacteria is a key factor of the biogas process. Under conditions of unstable operation, intermediates, such as volatile fatty acids and alcohols, accumulate (Gujer and Zehnder, 1983) at different rates, depending on the substrate and the type of perturbation causing instability (Allison, 1978). Thus, changes in the concentration of intermediates indicate disturbance of the biogas process.The most common disturbances causing imbalance are hydraulic or organic overloading, presence of inorganic or organic toxins or variations in the process conditions, such as temperature or substrate composition (Switzenbaum et al. 1990).
Recently, efforts have been made to identify suitable indicators for process evaluation. An ideal indicator should be easy to measure, should detect imbalance at an early stage and in a direct relation to reflect the metabolic status of the system. It is also important that the relative change of the parameter following a perturbation is significant compared to background fluctuations and analysis accuracy.
Several parameters have been suggested as stress indicators. The process indicators can either be indicators indirectly depicting the metabolic activity of the bacteria in the reactor (Table 1), or indicators of the numbers and metabolic state of the bacteria in the reactor (Table 2).
Traditional indicators
Traditional indirect process indicators have been used for monitoring the biogas process. Such indicators include measurements of biogas production, biogas composition, pH, volatile solids degradation efficiency and VFA concentrations (Table 1).
The biogas production is the most common and often the only parameter monitored. However, biogas production does not reflect the state of the process, unless correlated with the influent amount of organic matter and the knowledge of biogas composition.Biogas and methane yields will be influenced when reactor failure occurs, but this will not be a sensitive indicator (Switzenbaum, 1990). Hill and Holmberg, (1988) used a methane yield below 0.25 I-CH4 /g volatile solids, added to define reactor failure. However, they further concluded that this indicator was not very sensitive.
Variations in biogas composition are observed during process imbalance. However, the variations will only be significant after the imbalance is well established.
pH is also used as process parameter, as this parameter can easily be measured. However, pH can only be used as a process indicator, when treating wastes with low buffering capacity. With highly buffered wastes, such as manure, pH was found to vary only 0.5 units, even after severe accumulation of more than 100 mM VFA (Angelidaki and Ahring, 1994). Likewise, Hill and Holmberg, (1988) found that pH was only lowered to 5.9-6.8 in situations of severe reactor failure.
62
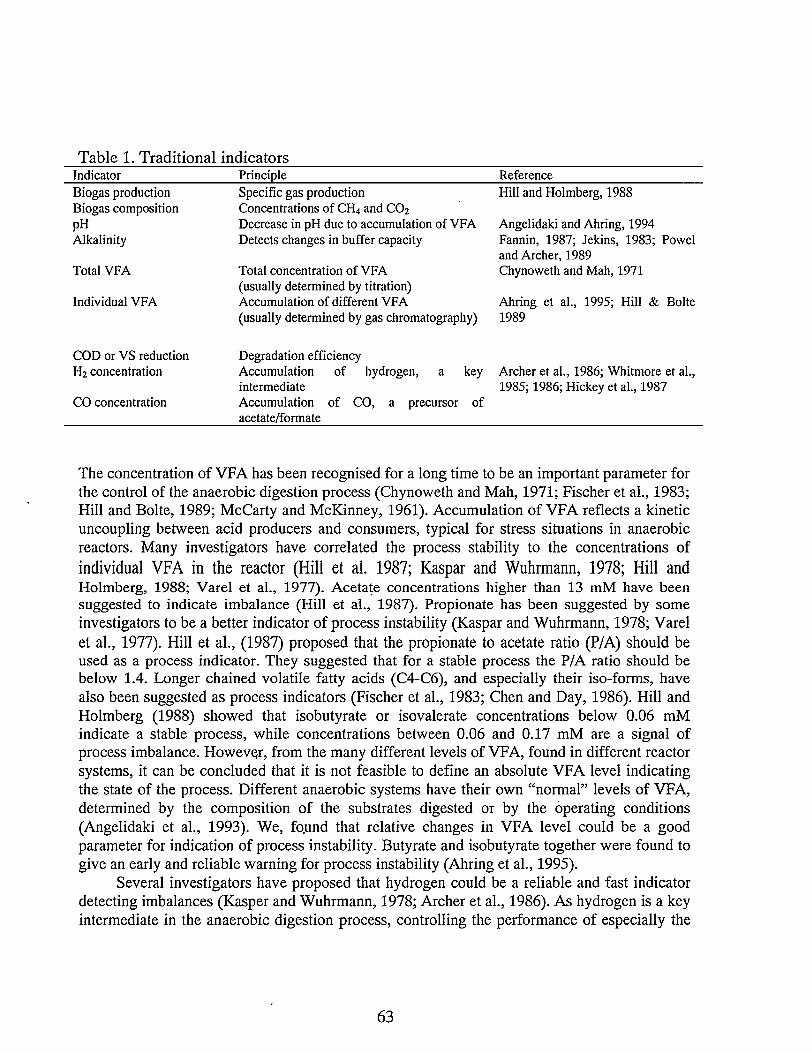
Table 1. Traditional indicatorsIndicator Principle ReferenceBiogas production Specific gas production Hill and Holmberg, 1988Biogas composition Concentrations of CH4 and C02
pH Decrease in pH due to accumulation of VFA Angelidaki and Ahring, 1994Alkalinity Detects changes in buffer capacity Fannin, 1987; Jekins, 1983; Powel
and Archer, 1989Total VFA Total concentration of VFA
(usually determined by titration)Chynoweth and Mah, 1971
Individual VFA Accumulation of different VFA Ahring et al., 1995; Hill & Bolte(usually determined by gas chromatography) 1989
COD or VS reduction Degradation efficiencyH2 concentration Accumulation of hydrogen, a key Archer et al., 1986; Whitmore et al.,
intermediate 1985; 1986; Hickey et al., 1987CO concentration Accumulation of CO, a precursor of
acetate/formate
The concentration of VFA has been recognised for a long time to be an important parameter for the control of the anaerobic digestion process (Chynoweth and Mah, 1971; Fischer et al., 1983; Hill and Bolte, 1989; McCarty and McKinney, 1961). Accumulation of VFA reflects a kinetic uncoupling between acid producers and consumers, typical for stress situations in anaerobic reactors. Many investigators have correlated the process stability to the concentrations of individual VFA in the reactor (Hill et al. 1987; Kaspar and Wuhrmann, 1978; Hill andHolmberg, 1988; Varel et al., 1977). Acetate concentrations higher than 13 mM have been suggested to indicate imbalance (Hill et al., 1987). Propionate has been suggested by some investigators to be a better indicator of process instability (Kaspar and Wuhrmann, 1978; Varel et al., 1977). Hill et al., (1987) proposed that the propionate to acetate ratio (P/A) should be used as a process indicator. They suggested that for a stable process the P/A ratio should be below 1.4. Longer chained volatile fatty acids (C4-C6), and especially their iso-forms, have also been suggested as process indicators (Fischer et al., 1983; Chen and Day, 1986). Hill and Holmberg (1988) showed that isobutyrate or isovalerate concentrations below 0.06 mM indicate a stable process, while concentrations between 0.06 and 0.17 mM are a signal of process imbalance. However, from the many different levels of VFA, found in different reactor systems, it can be concluded that it is not feasible to define an absolute VFA level indicating the state of the process. Different anaerobic systems have their own “normal” levels of VFA, determined by the composition of the substrates digested or by the operating conditions (Angelidaki et al., 1993). We, fo.und that relative changes in VFA level could be a good parameter for indication of process instability. Butyrate and isobutyrate together were found to give an early and reliable warning for process instability (Ahring et al., 1995).
Several investigators have proposed that hydrogen could be a reliable and fast indicator detecting imbalances (Kasper and Wuhrmann, 1978; Archer et al., 1986). As hydrogen is a key intermediate in the anaerobic digestion process, controlling the performance of especially the
63
volatile acid degrading bacteria, this is an obvious concept. Archer et ah, (1986) monitored hydrogen concentration in the gas phase of a pilot scale reactor treating brewery waste. Hydrogen could detect imbalance within 3-6 hours, much earlier than VFA accumulation was detected. Other investigators have found that hydrogen showed limiting sensitivity during changes in organic loading and addition of toxic compounds and a hydrogen dampening effect was detected (Hickey et al., 1987). The major drawback of the use of hydrogen as process indicator is that the concentration seems to vary considerably, often without obvious reason, blurring the interpretation of the results (Switzenbaum et al., 1990). At present, no simple method exists for measurements of hydrogen directly in the liquid phase. Use of measurement of gas phase concentration do not always reflect the actual concentration seen by microbes due to phase transfer limitations and to inter-species relationship in the bacterial flocks.
Alternative indicators
The second group of process indicators that can be used to monitor the biogas process are directly correlated to the bacterial populations or their activity (Table 2).
Microbial characterization is traditionally carried out by counting viable cells by traditional microbiological techniques such as the Most Probable Number (MPN) or by Cell Forming Unit (CFU) technique. Both techniques are time consuming and strongly depending on the cultivation media and conditions. These methods are further only valid for dispersed cells and are not suited for complex samples, containing cells attached to particles or juxtapositioned syntrophic cultures. Dolfing and Bloemen, (1985) obtained “confusing andclearly wrong results” when estimating MPNs of methanogens in granular sludge. Besides the incomplete dispersion of the bacteria, these authors also point to suboptimal culture conditions and non-culturability of some physiological groups as an explanation to their poor results. It is generally accepted that the majority of microbes in complex systems are not culturable under normal conditions, making this method strongly selective and the result rather unreliable.
In the specific methanogenic activity test (SMA), the activity of various physiological groups of microorganisms involved in the terminal anaerobic process, during degradation of complex substrates is tested by following the initial rate of accumulation of methane. The test was standarized by Sprensen and Ahring (1993). The SMA test is one of the most direct measurement of the potential activity of methanogens and was found to correlate well with the state of the anaerobic process (Ahring, 1995). However, for high background levels of substrates in the reactor, the method was found useless (Sgrensen and Ahring 1993). Therefore, the method can only be used for monitoring the state of biomass under balanced conditions or during initial process problems.
64
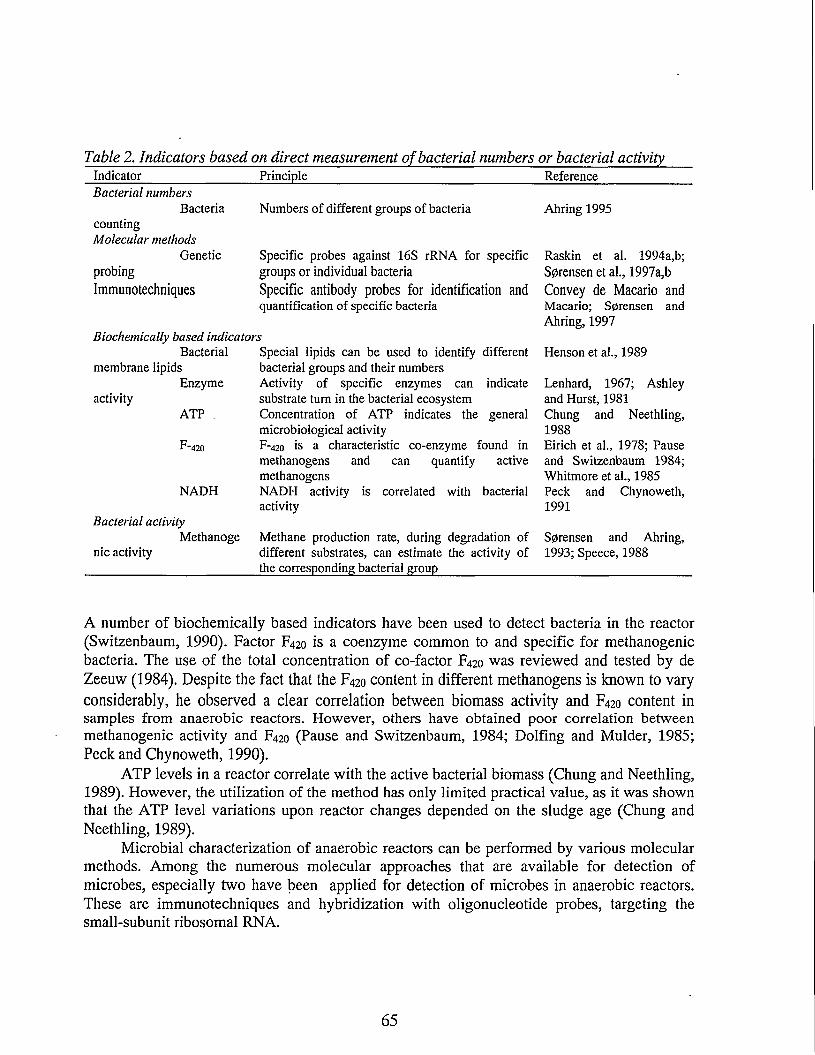
Table 2. Indicators based on direct measurement of bacterial numbers or bacterial activityIndicator Principle ReferenceBacterial numbers
BacteriacountingMolecular methods
Numbers of different groups of bacteria Ahring 1995
Genetic Specific probes against 16S rRNA for specific Raskin et al. 1994a,b;probing groups or individual bacteria Sprensen et al., 1997a,bImmunotechniques Specific antibody probes for identification and Convey de Macario and
quantification of specific bacteria Macario; Sorensen and Ahring, 1997
Biochemically based indicatorsBacterial Special lipids can be used to identify different Henson et al., 1989
membrane lipids bacterial groups and their numbersEnzyme Activity of specific enzymes can indicate Lenhard, 1967; Ashley
activity substrate turn in the bacterial ecosystem and Hurst, 1981ATP . Concentration of ATP indicates the general Chung and Neethling,
microbiological activity 1988F-420 F-420 is a characteristic co-enzyme found in Eirich et al., 1978; Pause
methanogens and can quantify active and Switzenbaum 1984;methanogens Whitmore et al., 1985
NADH NADH activity is correlated with bacterial Peck and Chynoweth,
Bacterial activityactivity 1991
Methanoge Methane production rate, during degradation of Sorensen and Ahring,nic activity different substrates, can estimate the activity of
the corresponding bacterial group1993; Speece, 1988
A number of biochemically based indicators have been used to detect bacteria in the reactor (Switzenbaum, 1990). Factor F420 is a coenzyme common to and specific for methanogenic bacteria. The use of the total concentration of co-factor F420 was reviewed and tested by de Zeeuw (1984). Despite the fact that the F420 content in different methanogens is known to varyconsiderably, he observed a clear correlation between biomass activity and F420 content in samples from anaerobic reactors. However, others have obtained poor correlation between methanogenic activity and F420 (Pause and Switzenbaum, 1984; Dolfing and Mulder, 1985; Peck and Chynoweth, 1990).
ATP levels in a reactor correlate with the active bacterial biomass (Chung and Neethling, 1989). However, the utilization of the method has only limited practical value, as it was shown that the ATP level variations upon reactor changes depended on the sludge age (Chung and Neethling, 1989).
Microbial characterization of anaerobic reactors can be performed by various molecular methods. Among the numerous molecular approaches that are available for detection of microbes, especially two have been applied for detection of microbes in anaerobic reactors. These are immunotechniques and hybridization with oligonucleotide probes, targeting the small-subunit ribosomal RNA.
65
Ten years ago, the use of immunological tests for characterization of anaerobic reactor samples was briefly introduced by the group of Macario and co-workers (Conway de Macario and Macario, 1985). These tests involved the use of polyclonal antibodies and were based onimmunological protocols, developed for defined cultures (Conway de Macario et al., 1982). By combining indirect immunofluorescence (IIP) microscopy and a semiquantitative slide immunoenzymatic assay (SIA) with a more traditional microscopic characterization of samples, the most numerous and immunoreactive morphotypes of methanogens were identified. This combination of methods was named the SIA constellation. The method was further developed by Sprensen and Ahring (1997). Polyclonal antibody probes for detection have been used in several works to characterize and compare different methanogenic populations in anaerobic reactors (Schmidt et al.1993) The first attempt to utilize the enzyme linked immunosorbent assay (ELISA) concept for identifying methanogens with immunoprobes was by Archer (1984). The method has since been further developed and used to identify methanogenic populations in reactors fed with different substrate composition and loading (Sorensen et al., 1997b). However, although the method is very promising, much work remains before the method can be applied routinely as a process indicator in a reliable way.
The use of oligonucleotide probes for characterization of methanogens in anaerobic reactors has been introduced by Raskin and co-workers (Raskin et al. 1994a; 1994b; 1995a; 1995b). In most cases, the probes were labelled with 32P and used for slot blot hybridization with RNA extracted from reactor samples. The radioactively labelled probes were well suited for determination of population shifts upon changes in the operation of anaerobic reactors (Raskin et al., 1994a; 1995b). The hybridization results with probes were consistent with measurements of methanogenic activity tests. The major disadvantage of oligonucleotide probing for routine analysis of anaerobic reactors is the extensive work involved in RNA extractions, slot-blot hybridizations and data analysis. Whole cell in-situ hybridization has also been developed. By this method extraction of 16S RNA is not necessary since the probe passes though the cell membrane and hybridize in-situ. However, due to the complexity and the three dimensional structure of 16S rRNA, the use of fluorescence in situ hybridization is sometimes difficult to interpret (Fisher et al. 1996).
CASE STUDY
Two full-scale biogas plants operated with manure as main substrate and approx. 20%-30% of organic industrial waste from food industry, were used for studying the VFA behavior after inducing a perturbation done by changing the operation temperature. In one reactor the temperature was decreased from 55 to 52°C, while in the other the temperature was increased from 51 to 55°C.
66
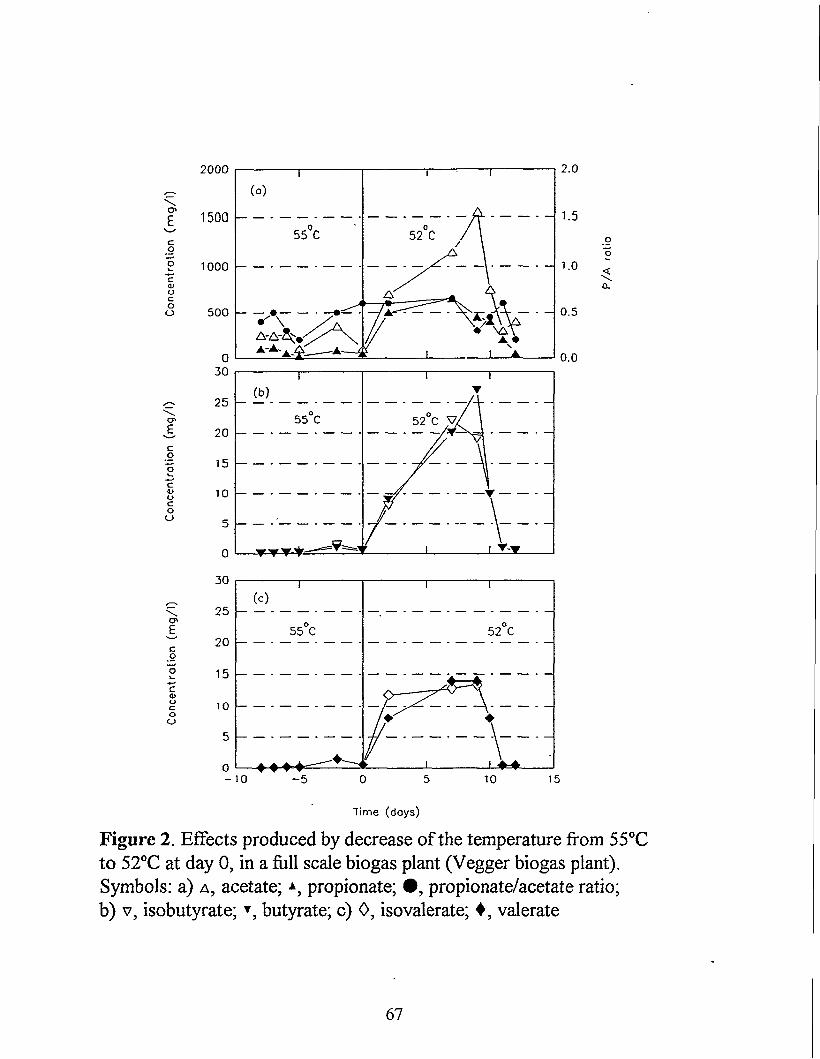
Time (doys)
Figure 2. Effects produced by decrease of the temperature from 55°C to 52°C at day 0, in a full scale biogas plant (Vegger biogas plant). Symbols: a) a, acetate; \ propionate; #, propionate/acetate ratio; b) v, isobutyrate; ▼, butyrate; c) 0, isovalerate; ♦, valerate
67
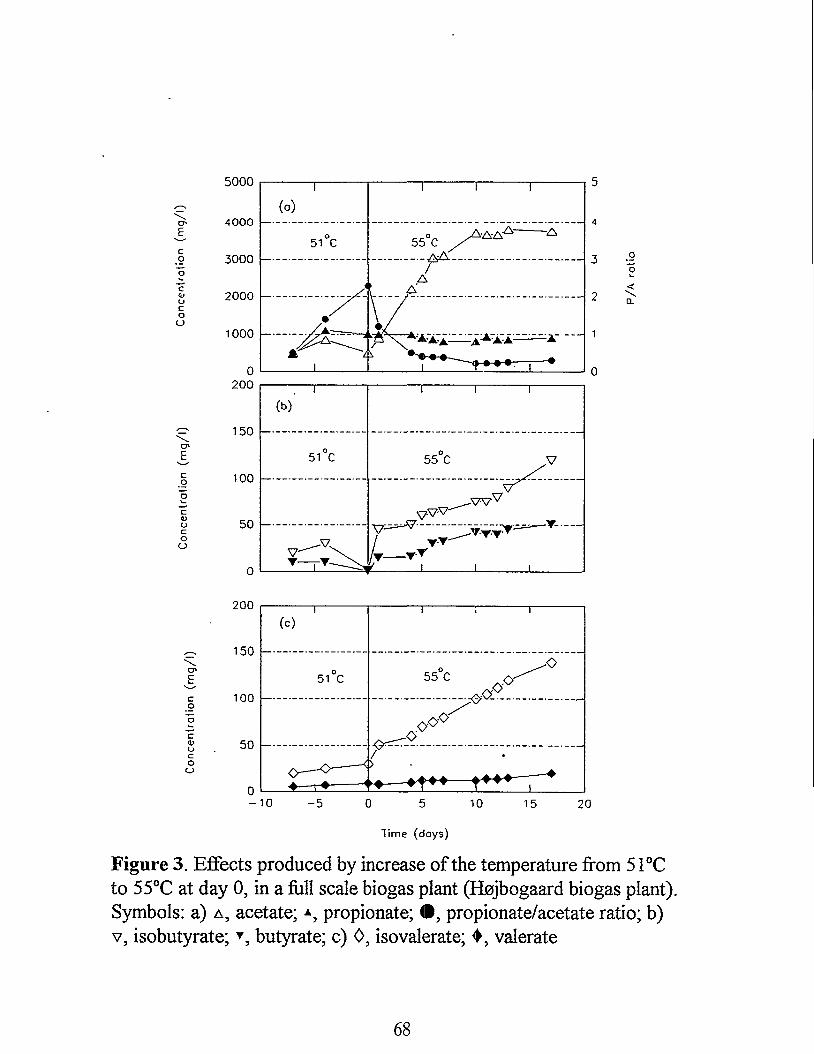
55000
O'£co"o"c:a»ucou
O'Eco
c4>Ocoo
O'Eco
c4>Ucoo
4000 —
3000
2000
1000
0200
I(°)
i i i
51 °C 55°C ^_______________vvx__________________________________
___________________
/L_.__ ____________ ________ _________ ______
Vi T-+
- 4
3
2
150 -
100
0
200
. i (b)
I I I
51°C .......... h":..................
V
r—tvi______ I_______I_______I_______
50 ------
150 -
100
50 -
I(c)
i , i
51 °C............ _
♦—r*-------< r ____
_i
-10 -50 5 10 15 20
lime (days)
.0
o
CL
Figure 3. Effects produced by increase of the temperature from 51°C to 55°C at day 0, in a full scale biogas plant (Hojbogaard biogas plant) Symbols: a) a, acetate; propionate; # propionate/acetate ratio; b) v, isobutyrate; ▼, butyrate; c) 0, isovalerate; ♦, valerate
68
VFA in both reactors were monitored before and after the perturbation (Fig.2 and Fig.3). When the temperature was decreased from 55 to 52°C, the concentration of all VFA increased. At the same time no significant changes in the biogas production were observed (data not shown). Acetate and propionate increased from average levels of 250 and 50 mg/1 to 750 and 500 mg/1 respectively, two days after the change in temperature (Fig.2). Acetate continued to increase for approx, a week to a level of 1500 mg/1 before it gradually decreased to the level found before the perturbation. Propionate stabilized at approx. 500 mg/1 before it returned to the level as before the perturbation (Fig.2a). The longer VFA (C4 and C5) increased from a very low level to approx. 10 mg/1, two days after the perturbation (Fig.2b,c). For butyrate and isobutyrate the increase continued for one week and reached a level of 25 mg/1 before it decreased again (Fig.2b). Although the absolute levels reached for the longer VFA (C4 and C5) were low, the relative increases were very high. The P/A ratio did not change significantly with the change of the temperature and was below unity during the whole experimental time, indicating that this parameter was useless for imbalance warning.
When the temperature was increased in the other reactor the concentration of acetate increased from an average level of 500 mg/1 to 1000 mg/1 the day after the perturbation. The increase continued for a week reaching a level of 3000 mg/1. However, propionate and valerate concentrations did not change significantly. The largest increase was observed for isobutyrate and isovalerate from an average level of approx. 25 mg/I to an approx. level of 50 mg/1 one day after the perturbation. The P/A ratio decreased after the perturbation from approx, unity to below 0.5. This shows again that this parameter could not detect any changes as found in previous studies (Ahring et al. 1995).
The results obtained for the two full-scale biogas plants showed that VFA was a good parameter for monitoring the biogas process. Of the individual VFA the higher VFA butyrate, isobutyrate and isovalerate provided very significant changes after the perturbation, although the absolute levels reached were still low. This is in accordance with previous reports that the isoforms of butyrate and valerate were the best indicators of process instability (Hill and Bolte, 1989; Hill and Holmberg, 1988). We had previously shown that these VFA, increased a significance level of 95% upon most cases of experimentally imposed imbalance. It was alsoevaluated that combination of butyrate and isobutyrate concentration would constitute a valuable process indicator.
CONCLUSIONS
Monitoring and control of the biogas process is necessary for optimal performance of biogas reactors. The present results from the full-scale biogas plants clearly demonstrate that VFA and especially butyrate, isobutyrate and isovalerate is a reliable tool for early detection of stress within the anaerobic digestion process, allowing operation adjustments and thus avoiding failure of the process. Information of the sate of the bacterial biomass in the reactor system further provide the operator of a biogas plant with valuable knowledge of the process. New promising molecular techniques based on antibodies or 16S rRNA could give important
69
information on the bacterial state of the art in the reactor. However, further work is needed before these techniques are fully developed as a robust and easy tool for routine analysis in a biogas reactor.
ACKNOWLEDGEMENTS
We thank Jens Ejbye Schmidt for helpful discussion. This work was supported by grants from the Danish Energy Research Program.
70
REFERENCES
1. Ahring, B.K. (1995). Methanogenesis in thermophilic biogas reactors. Antonie Van Leeuwenhoek67,91-102
2. Ahring, B.K., Angelidaki, I. and Johansen, K. (1992). Anaerobic treatment of manure together with organic industrial waste. Wat. Sci. Technol. 7, 311-318
3. Ahring, B.K., and Sandberg, M., and Angelidaki, I. (1995). Volatile acids as indicators of process imbalance in anaerobic digestion. Appl. Microbiol. Biotechnol. 43,559-565
4. Allison, M.J. (1978) Production of branched-chain volatile fatty acids by certain anaerobic bacteria. Appl Environ Microbiol 35, 872-877
5. Angelidaki, I., and Ahring, B.K. (1994). Anaerobic digestion of manure at different ammonia loads: effect of temperature. Wat. Res. 28, 727-731
6. Angelidaki, I., Ellegaard, L. and Ahring, B.K. (1993). A mathematical model for dynamic simulation of anaerobic digestion of complex substrates: focusing on ammonia inhibition. Biotechnol. Bioeng. 42,159-166
7. Archer, D.B., (1984). Detection and quantification of methanogens by enzyme-linked immuno assay. Appl. Environ. Microbiol. 48, 797-801.
8. Archer, D.B., Hilton, G.M., Adams, P., and Wiecko, H. (1986). Hydrogen as a process control index in a pilot scale anaerobic digester. Biotechnol. Lett. 8,197-202
9. Ashley, N.V., and Hurst, T.J. (1981). Acid and alkaline phosphatase activity in anaerobic digested sludge: A biochemical predictor of digester failure. Wat. Res. 15, 633-643
10. Conway de Macario, E., Wolin, MJ. and Macario, A.J.L. (1982) Antibody analysis of relationships among methanogenic bacteria. J Bacterial 149, 316-319.
11. Conway de Macario, E. and Macario, A.J.L. (1985) Immunologic probes for identification of methanogenic bacteria in anaerobic digesters. In: China State Biogas Association, (Ed.) Anaerobic Digestion 1985, Guangzhou, China: China State Biogas Association]
12. Chen, Y.R., Day, D.L. (1986). Effect of temperature change on stability of thermophilic fermentation of swine waste.Agricul. Wastes 16, 313-317
13. Chung, Y.-C., and Neethling J.B. (1988). ATP as a measure of anaerobic sludge digester activityJ. Wat. Pollut. Control Fed. 57,107-112
14. Chung, Y.-C., and Neethling J.B. (1989). Microbial activity measurements for anaerobic sludge digestion J. Wat. Pollut. Control Fed. 61, 343-349
15. Chynoweth, D.P., Mah, R.A. (1971). Anaerobic biological treatment processes. Adv. Chem. Sci. 105, 41-53
16. Dolfing, J. and Bloemen, G.B.M. (1985). Activity measurement as a tool to characterize the microbial composition of methanogenic environments. J Microbiol Methods 4,1-12.
17. Dolfing, J. and Mulder, J. (1985). Comparison of methane production rate and coenzyme F.l2o content of methanogenic consortia in anaerobic granular sludge. Appl Environ Microbiol 49, 1142-1145
18. Eirlich, L.D., Vogels, G.D., and Wolfe, R.S., (1978). Biochem. 17, 458319. Fannin, K.F. (1987). Start-up operation stability and control. In: D.P. Chynoweth and R. Isaacson
(eds), Anaerobic digestion of biomass. Elsevier Appl Science, 171-19620. Fischer, J.R., Iannotti, E.L., Porter, J.H., (1983). Anaerobic digestion of swine manure at various
influent concentrations. Biological Wastes 6,147-166
21. Fischer, M.E., Floriane, P.J., Nierzwicki-Bauer, S.A, (1996). Differential sensitivity of 16SrRNA targeted oligonucleotide probes used for fluorescence in situ hybridization is a result of ribosomal higher order structure. Can. J. Microbiol. 42, 1061-1071
22. Gujer, W., Zehnder, A.J.B. (1983). Conversion processes in anaerobic digestion. Wat. Sci. Technol. 15,127-167
23. Henson, J.M., Mclnerney, M.J., Shawn Beaty, P., Nickels, J. and White, D.C. (1988). Appl. Evniron. Microbiol. 54,1570-1574
24. Hickey, R.F., Vanderwielen J., and Switzenbaum M.S. (1987). Effects of organic toxicants on methane production and hydrogen gas levels during the anaerobic digestion of waste activated .sludge. Wat. Res. 21:1417-1427
25. Hill, D.T., Bolte, J.P. (1989). Digester stress as related to iso-butyric and iso-valeric acids. Biol Wastes 28, 33-37
26. Hill, D.T., Cobb, S.A., and Bolte, J.P. (1987). Using volatile fatty acid relationships to predict anaerobic digester failure. Trans ASAE 30, 496-501
27. Hill, D.T., Holmberg, R.D. (1988) Long chain volatile fatty acid relationships in anaerobic digestion of swine waste. Biological Wastes 23,195-214
28. Jekins, S.R.,Morgan, J.M. and Sawyer, C.L. (1983). Measuring anaerobic sludge digestion and growth by a simple alkalimetric titration. J. Wat. Pol. Contr. Fed. 55, 448-457
29. Kaspar, H.F, and Wuhrmann, K. (1978). Kinetic parameters and relative, turnovers of some important catabolic reactions in digesting sludge. Appl. Environ. Microbiol. 36,1-7
30. Lenhard, G. (1967). A standarized procedure for determination of dehydrogenase activity in samples from anaerobic treatment systems. Wat. Res. 2,161
31. McCarty, P.L., McKinney, R.E. (1961). Volatile acid toxicity in anaerobic digestion. J. Wat. Control. Fed. 33, 223-232
32. Mclnerney, M.J, Bryant, M.P., Stafford, D.A. (1980). Metabolic stages and energetics ofmicrobial anaerobic digestion. In: Stafford DA, Wheatley BI, Hudges DE (eds) Anaerobic digestion. Appl. Sci. ltd, London, pp 91-98
33. Peck, M.W., and Chynoweth, D.P., (1990). On-line monitoring of the methanogenic fermentation by measurements of culture fluorescence. Biotechnol. Lett. 12,17-22
34. Peck, M.W., and Chynoweth, D.P., (1991). On-line fluorescence measuring of the methanogenic fermenation. Biotechnol. Bioeng. 39,1151-1160
35. Powel, G.E., and Archer, D.B (1989) On-line titration method for monitoring buffer capacity and total volatile fatty acid levels in anaerobic digestion. Biotechnol. Bioeng. 33, 570-577
36. Pause, M., and Switzenbaum, M.S. (1984). An investigation of use of fluorescence to monitor activity in anaerobic treatment systems. Biotechnol. Lett. 6, 77-80
37. Raskin, L., Poulsen, L.K., Noguera, D.R., Rittmann, B.E. and Stahl D.A., (1994a). Quantification of methanogenic groups in anaerobic biological reactors by oligonucleotide probe hybridization. Appl. Environ., Microbiol. 60,1241-1248
38. Raskin, L., Stomley, J.M., Rittmann, B.E. and Stahl D.A., (1994b). Group-specific 16S rRNA hybridization probes to describe natural communities of methanogens. Appl. Environ., Microbiol. 60, 1232-1240
39. Raskin, L., Amann, R.I., Poulsen, L.K., Rittmann, B.E. and Stahl D.A. (1995a). Use of ribosomal RNA-based molecular probes for characterization of complex microbial communities in anaerobic biofilm. Wat. Sci. Technol. 31, 261-272
72
40. Raskin, L., Zheng, D., Griffin, M.E., Stroot, P.G., and Mirsa, P. (1995b). Characterization of microbial communities in anaerobic bioreactors using molecular probes. Antonie Van Leeuwenhoek 68, 297-308
41. Schmidt, J.E., Macario A.J.L., Ahring B.B., and Conway de Macario, E. (1992). Effects of magnesium on methanogenic subpopulations in a thermophilic acetate degrading granular consortium. Appl. Environ. Microbiol. 58,862-868
42. Speece, R.E. (1988). A survey of municipal anaerobic sludge digesters and diagnostic activity assays Wat. Res. 2, 365-372
43. Switzenbaum, M.S., Giraldo-Gomez, E., Hickey, R.F. (1990). Monitoring of the anaerobic methane fermentation process. Enzyme Microbiol. Technol. 12, 722-730
44. Sprensen, A.H., Ahring, B.K., (1993). Measurements of the specific methanogenic activity of anaerobic digestor biomass. Appl. Microbiol. Biotechnol. 40, 427-431
45. Sorensen, A.H., Ahring, B.K., (1997). An improved ELISA method for whole cell determination of methanogens in samples from anaerobic reactors. Appl. Environ. Microbiol. In press.
46. Sorensen, A.H., Torsvik, V.L., Tosvik, T., Poulsen, L.K., and Ahring, B.K., (1997a). Whole cell hybridization of Methanosarcina cells with two new oligonucleotide probes. Appl. Environ. In press.
47. Sorensen, A.H., Angelidaki, I., and Ahring, B.K., (1997b). Characterization of methanogenic subpopulations present in thermophilic biogas reactors and demonstration of the effect of adaptation to lipid degradation. Appl. Environ. Microbiol. Submitted for publication
48. Varel, V.H., Isaacson, H.R., and Bryant, M.P. (1977). Thermophilic methane production from cattle waste. Appl. Environ. Microbiol. 33, 298-307
49. Whitmore, T.N., Lazzari, M., and Lloyd, D. (1985). Comparative studies of methanogenesis in the thermophilic and mesophilic anaerobic digesters using membrane inlet spectrometry. Biotechnol. Lett. 7, 282-288
50. Whitmore, T.N., and Lloyd, D. (1985). Mass spectrometric control of the thermophilic anaerobic digestion process based on levels of dissolved hydrogen. Biotechnol. Lett. 8, 203-208
51. Zeeuw, W. de (1984). Ph.D. Thesis Agricultural University, Netherlands
73
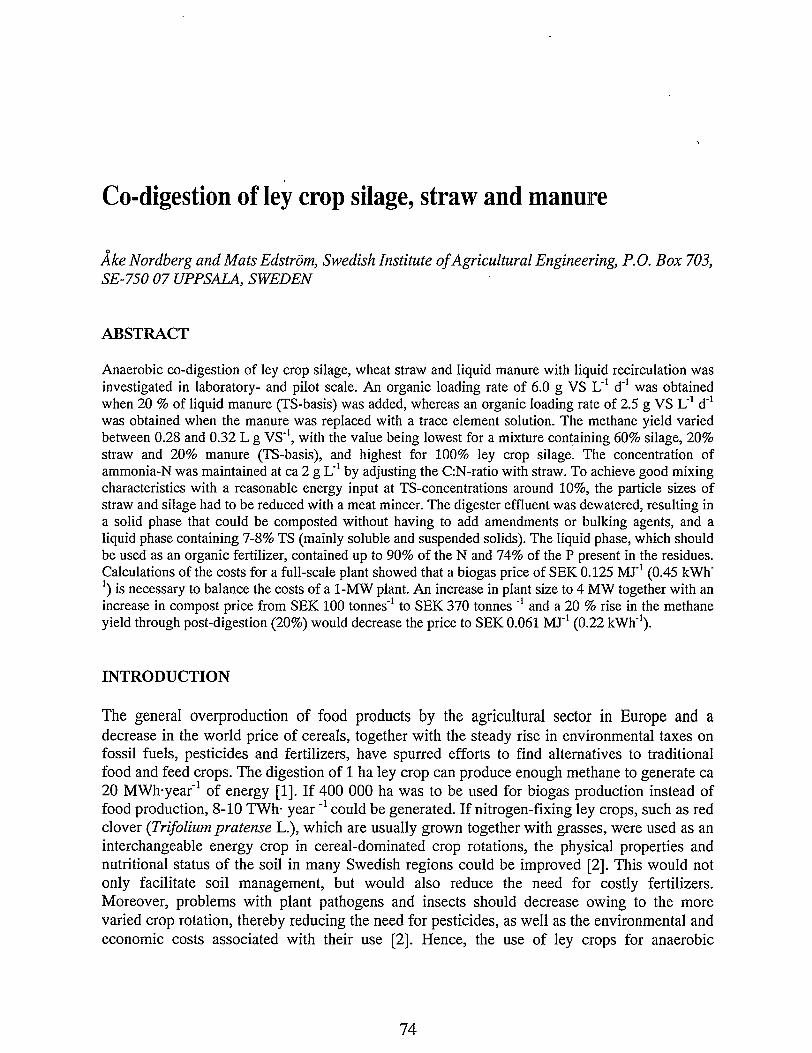
Co-digestion of ley crop silage, straw and manure
Ake Nordberg and Mats Edstrom, Swedish Institute of Agricultural Engineering, P.O. Box 703, SE-750 07 UPPSALA, SWEDEN
ABSTRACT
Anaerobic co-digestion of ley crop silage, wheat straw and liquid manure with liquid recirculation was investigated in laboratory- and pilot scale. An organic loading rate of 6.0 g VS L"1 d"1 was obtained when 20 % of liquid manure (TS-basis) was added, whereas an organic loading rate of 2.5 g VS L'1 d"1 was obtained when the manure was replaced with a trace element solution. The methane yield varied between 0.28 and 0.32 L g VS"1, with the value being lowest for a mixture containing 60% silage, 20% straw and 20% manure (TS-basis), and highest for 100% ley crop silage. The concentration of ammonia-N was maintained at ca 2 g L"1 by adjusting the C:N-ratio with straw. To achieve good mixing characteristics with a reasonable energy input at TS-concentrations around 10%, the particle sizes of straw and silage had to be reduced with a meat mincer. The digester effluent was dewatered, resulting in a solid phase that could be composted without having to add amendments or bulking agents, and a liquid phase containing 7-8% TS (mainly soluble and suspended solids). The liquid phase, which should be used as an organic fertilizer, contained up to 90% of the N and 74% of the P present in the residues. Calculations of the costs for a full-scale plant showed that a biogas price of SEK 0.125 MJ"1 (0.45 kWh" ’) is necessary to balance the costs of a 1-MW plant. An increase in plant size to 4 MW together with an increase in compost price from SEK 100 tonnes"1 to SEK 370 tonnes "1 and a 20 % rise in the methane yield through post-digestion (20%) would decrease the price to SEK 0.061 MJ"1 (0.22 kWh'1).
INTRODUCTION
The general overproduction of food products by the agricultural sector in Europe and a decrease in the world price of cereals, together with the steady rise in environmental taxes on fossil fuels, pesticides and fertilizers, have spurred efforts to find alternatives to traditional food and feed crops. The digestion of 1 ha ley crop can produce enough methane to generate ca 20 MWh-year"1 of energy [1]. If 400 000 ha was to be used for biogas production instead of food production, 8-10 TWh- year "1 could be generated. If nitrogen-fixing ley crops, such as red clover (Trifolium pratense L.), which are usually grown together with grasses, were used as an interchangeable energy crop in cereal-dominated crop rotations, the physical properties and nutritional status of the soil in many Swedish regions could be improved [2]. This would not only facilitate soil management, but would also reduce the need for costly fertilizers. Moreover, problems with plant pathogens and insects should decrease owing to the more varied crop rotation, thereby reducing the need for pesticides, as well as the environmental and economic costs associated with their use [2]. Hence, the use of ley crops for anaerobic
74
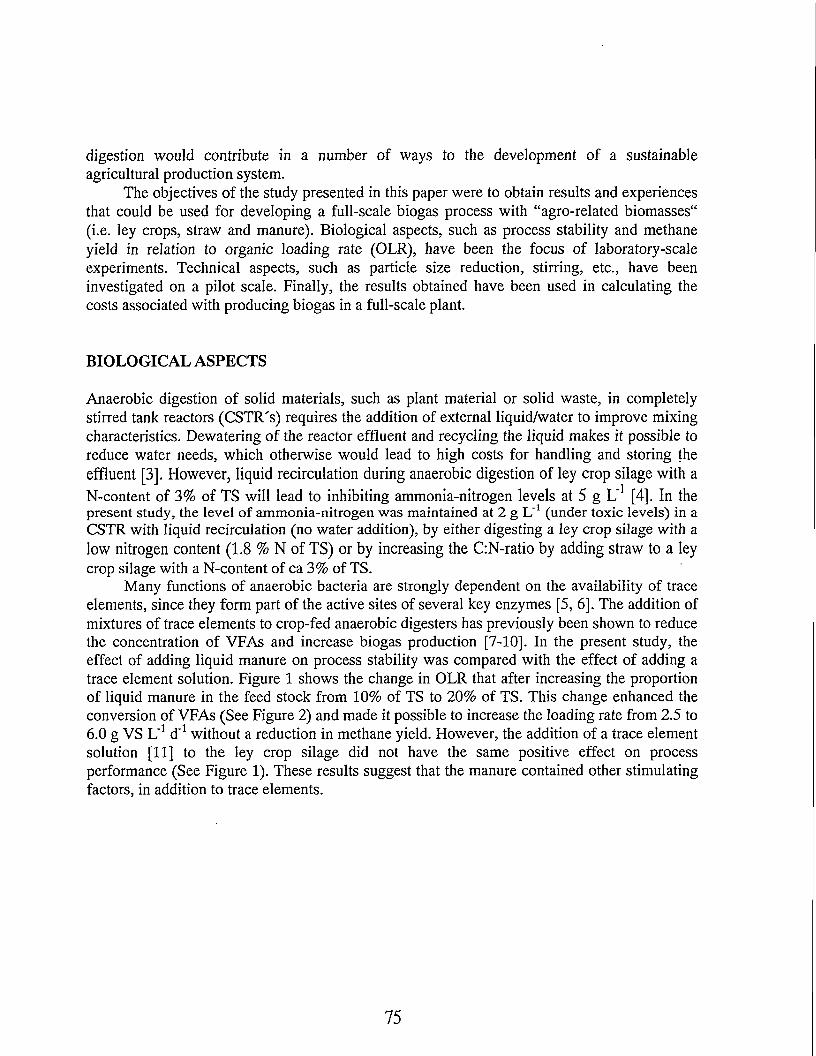
digestion would contribute in a number of ways to the development of a sustainable agricultural production system.
The objectives of the study presented in this paper were to obtain results and experiences that could be used for developing a full-scale biogas process with “agro-related biomasses" (i.e. ley crops, straw and manure). Biological aspects, such as process stability and methane yield in relation to organic loading rate (OLR), have been the focus of laboratory-scale experiments. Technical aspects, such as particle size reduction, stirring, etc., have been investigated on a pilot scale. Finally, the results obtained have been used in calculating the costs associated with producing biogas in a full-scale plant.
BIOLOGICAL ASPECTS
Anaerobic digestion of solid materials, such as plant material or solid waste, in completely stirred tank reactors (CSTR's) requires the addition of external liquid/water to improve mixing characteristics. Dewatering of the reactor effluent and recycling the liquid makes it possible to reduce water needs, which otherwise would lead to high costs for handling and storing the effluent [3]. However, liquid recirculation during anaerobic digestion of ley crop silage with aN-content of 3% of TS will lead to inhibiting ammonia-nitrogen levels at 5 g L’1 [4]. In the present study, the level of ammonia-nitrogen was maintained at 2 g L"1 (under toxic levels) in a CSTR with liquid recirculation (no water addition), by either digesting a ley crop silage with a low nitrogen content (1.8 % N of TS) or by increasing the C:N-ratio by adding straw to a ley crop silage with a N-content of ca 3% of TS.
Many functions of anaerobic bacteria are strongly dependent on the availability of trace elements, since they form part of the active sites of several key enzymes [5, 6]. The addition of mixtures of trace elements to crop-fed anaerobic digesters has previously been shown to reduce the concentration of VFAs and increase biogas production [7-10]. In the present study, the effect of adding liquid manure on process stability was compared with the effect of adding a trace element solution. Figure 1 shows the change in OLR that after increasing the proportion of liquid manure in the feed stock from 10% of TS to 20% of TS. This change enhanced the conversion of VFAs (See Figure 2) and made it possible to increase the loading rate from 2.5 to6.0 g VS L"1 d"1 without a reduction in methane yield. However, the addition of a trace element solution [11] to the ley crop silage did not have the same positive effect on process performance (See Figure 1). These results suggest that the manure contained other stimulating factors, in addition to trace elements.
75
♦ ' 8 0 % s Ha g + 2 0% m—b—1 0 0% silag
1 6 0 1 8 0 2 2 0 2 4 0 3 0 02 0 0 2 6 0 2 8 0 3 2 0 3 4 0 3 6 0T im .days
Figure 1. Organic loading rates in the two laboratory-scale processes. On day 165 the liquid manure in the feed stock was increased from 10 to 20% ofTS.
T Im e , d a y s
Figure 2. Total volatile fatty acids in the two laboratory-scale processes. On day 165 the liquid manure in the feed stock was increased from 10 to 20% ofTS.
The methane yield is an important economic factor in the anaerobic digestion of ley crop silage. Particle size has earlier been reported to affect the methane yield and degradation rate [12, 13]. The particle size of the silage was reduced with a meat-mincer containing different perforated steel plates. There was no difference in the methane yield of batch tests between silage minced with a hollow, perforated steel plate with holes of 9.5 mm diameter and silage minced with a steel plate with five spokes (Table I). However, straw whose particle size had been reduced with a hammer mill showed a higher methane yield than straw treated with a straw chopper (Table I). The methane yields obtained with different substrate mixtures, during
76
continuous operation, are also presented in Table I. Batch digestion tests of digester effluents showed that it was possible to increase the yield by 20% by “post-digesting" the effluent for 9 days.
Table I. Methane yields for different feed stocks and particle sizes during batch tests andcontinuous operation.
Feed stocks Particle size reduction Methane yield (LgVS-')
Batch tests Ley crop silage Mincing, 9.5 mm hollow plate 0.38Ley crop silage Mincing, 5-spoke plate 0.38Wheat straw straw chopper 0.25Wheat straw hammer mill 0.31Liquid manure - 0.31
Continuous operation 100% silage + trace elements Mincing, 9.5 mm hollow plate 0.3280% silage + 20% manure Mincing, 9.5 mm hollow plate 0.3160% silage + 20% straw + 20% manure Mincing, 9.5 mm hollow plate 0.2870% silage + 10% straw + 20% manure Mincing, 5-spoke plate 0.29
TECHNICAL ASPECTS
Earlier experiences, gained during anaerobic digestion of precision-chopped silage on a pilot- scale, showed that fibres floated in the digester when the TS-concentration was ca 4-5% [14]. In the present study, we were able to avoid fibre floating and scum-blanket formation at a TS- concentration of ca 10% by operating the process with minced feed stocks and continuous stirring. The digester was equipped with a top-mounted stirrer, rotating at 44 rpm with two separate propellers having three blades each.
Mincing had a large impact on the rheological properties of the digester slurry (See Figure 3). Thus, a “small” particle size, corresponding to mincing with a 9.5- mm, hollow perforated steel plate, results in better stirring and pumping properties than a “large” particle size, corresponding to mincing with a 5-spoke steel plate. Figure 3 also shows the large change in rheological properties after 9 days of batch digestion of the digester effluent during the period with “large” particles. Full-scale calculations showed that it was necessary to use a 9.5- mm, hollow, perforated plate in order to achieve satisfactory stirring. The electricity needed for mincing silage and straw, measured on a pilot scale, was estimated to correspond to ca 2% of the energy content of the methane produced by a 1 MW biogas plant. The electricity needed for stirring would correspond to ca 1% of the energy content of the methane produced.
77
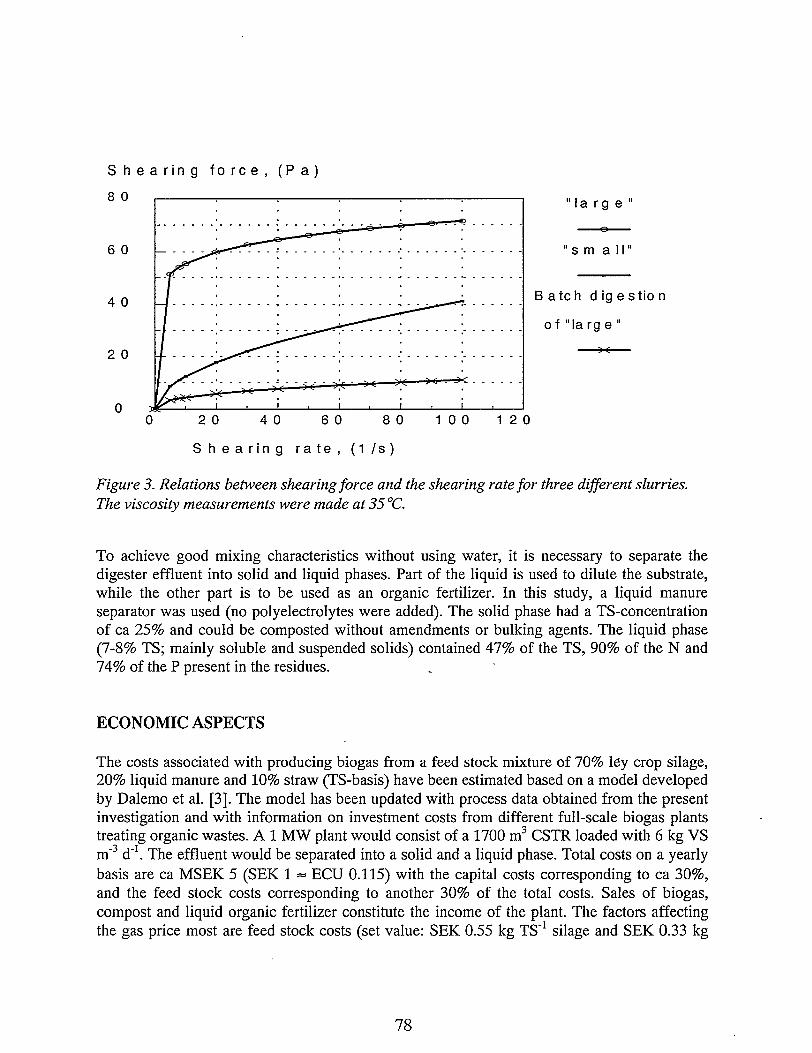
Shearing force, (Pa)
8 0 -------,-------;---- large
Figure 3. Relations between shearing force and the shearing rate for three different slurries. The viscosity measurements were made at 35 °C.
To achieve good mixing characteristics without using water, it is necessary to separate the digester effluent into solid and liquid phases. Part of the liquid is used to dilute the substrate, while the other part is to be used as an organic fertilizer. In this study, a liquid manure separator was used (no polyelectrolytes were added). The solid phase had a TS-concentration of ca 25% and could be composted without amendments or bulking agents. The liquid phase (7-8% TS; mainly soluble and suspended solids) contained 47% of the TS, 90% of the N and 74% of the P present in the residues.
ECONOMIC ASPECTS
The costs associated with producing biogas from a feed stock mixture of 70% l6y crop silage, 20% liquid manure and 10% straw (TS-basis) have been estimated based on a model developed by Dalemo et al. [3]. The model has been updated with process data obtained from the present investigation and with information on investment costs from different full-scale biogas plants treating organic wastes. A 1 MW plant would consist of a 1700 m3 CSTR loaded with 6 kg VS m"3 d"1. The effluent would be separated into a solid and a liquid phase. Total costs on a yearly basis are ca MSEK 5 (SEK 1 » ECU 0.115) with the capital costs corresponding to ca 30%, and the feed stock costs corresponding to another 30% of the total costs. Sales of biogas, compost and liquid organic fertilizer constitute the income of the plant. The factors affecting the gas price most are feed stock costs (set value: SEK 0.55 kg TS'1 silage and SEK 0.33 kg
78
TS"1 straw) and the sales prices of compost (set value: SEK 100 tonnes'1) and liquid fertilizer (set values: SEK 7-kg N'1, SEK 12-kg P'1 and SEK 3-kg K'1). According to this scenario, the gas price would have to be SEK 0.125 MJ'1 (0.45 kWh'1) in order to balance the costs incurred in the production of biogas.
If the compost price was increased to SEK 370 tonnes'1, and the methane yield could be increased by 20% through post-digestion in separate digesters, the price could be decreased to SEK 0.083 MJ'1 (0.30 kWh'1). If the size of the plant were to be increased to 4 MW, the gas price could be decreased to SEK 0.061 MJ'1 (0.22 kWh'1) assuming post-digestion and the increased compost price.
The estimated costs for producing biogas indicate that it would be difficult to develop financially competitive biogas plants that mainly digest ley crop silage. In Sweden, there is little incentive to generate electricity or heat from biogas because the electricity and heating sales price can be as low as <SEK 0.028 MJ'1 (0.10 kWh'1). By contrast, the price of petrol is ca SEK 0.222 MJ'1 (0.80 kWh'1; including taxes). Thus, the incentive to convert biogas to vehicle fuel is strong in Sweden. At present, there are seven plants currently operating that produce vehicle fuel. The costs of purifying and compressing methane to obtain a product of high enough quality to be used for vehicle fuel is estimated at ca SEK 0.028 MJ"1 (0.10 kWh'1) for a 4 MW plant (calculated from data in Brolin et al.[15]). With estimated production costs around SEK 0.061 MJ'1 (0.22 kWh'1) for a 4 MW plant, including the cost of producing vehicle fuel, the total cost will be ca SEK 0.089 MJ'1 (0.32 kWh'1). Thus, if no tax is placed on methane originating from renewable sources, the digestion of ley crop silage might become economically feasible.
CONCLUSIONS
* By adjusting the C:N-ratio with straw and including liquid manure (20% of TS) a stable biogas process could be obtained at an OLR of 6 g VS L'1 d'1.
* Substituting a trace element solution for liquid manure leads to a decrease in process performance.
* By post-digesting the effluent a 20% increase in methane yield can be obtained.
* The electricity needed to reduce the particle size of silage and straw at a 1-MW plant can be achieved with 2% of the energy content of the gas produced. *
* The electricity needed for stirring the digester slurry at a 1 MW plant corresponds to 1% of the energy content of the biogas produced.
79
* Phase separation of the effluent resulted in a solid phase, with 25 % TS and a liquid fertilizer (7-8 % TS), containing up to 90% of the N and 74% of the total phosphorus present in the residues.
* The factors affecting most the costs of gas production are feed stock costs and the values of the compost and liquid fertilizer.
* Estimation of the costs for a 1-MW plant digesting 70% ley crop silage, 20% liquid manure and 10% straw (TS-basis) showed that SEK 0.125 MJ'1 (0.45 kWh'1) would be needed to balance the costs.
* An increase in plant size to 4 MW, including post-digestion of the effluent and a higher price for the compost produced, would allow the gas price to be decreased to SEK 0.061 MJ'1 (0.22 kWh'1).
ACKNOWLEDGEMENTS
We thank A. Ringmar for skilfully controlling the pilot-plant. A. Levin and J. Ascue-Contrerasoffered expert technical assistance in the laboratory. Equipment was provided by SCABA AB,Svenska Neuero AB and Meat Meq AB. Financial support was provided by the Federation ofSwedish Farmers and the Swedish Board for Industrial and Technical Development.
REFERENCES
1. L. Thyselius, R. Andersson, A. Granstedt, W, Johansson, R. Jdnsson, B. Mathisen, L, Mattsson & L. Salomonsson. “Biogas fran lantbruket - En utredning om kunskap och forskningsbehov“. (“Biogas from agriculture - An inquiry into the present state of knowledge and research requirements11.) Report 137 (1991). Swedish Institute of Agricultural Engineering, Uppsala.
2. W. Johansson, L. Mattsson, L. Thyselius & B, Wallgren. “Energigrddor for biogas. Effekter pi odlingssystemet11. (“Energy crops for biogas. Effects on the cropping system11). Report 161 (1993), Swedish Institute of Agricultural Engineering, Uppsala.
3. M. Dalemo, M. Edstrom, L. Thyselius & L. Brolin. “Biogas ur vallgrodor11 (“Biogas from ley crops11). Report 162 (1993), Swedish Institute of Agricultural Engineering, Uppsala.
4. A. Nordberg. “One- and two-phase anaerobic digestion of ley crop silage with and without liquid recirculation11 (PhD thesis. Department of Microbiology, Swedish University of Agricultural Sciences, Uppsala, Sweden (1996).
5. J.A. Oleszkiewicz & V.K. Sharma. “Stimulation and inhibition of anaerobic processes by heavy metals - a review11. Biological Wastes 31 (1990): 45-67.
80
6. M. Kayhanian & D. Rich, “Pilot-scale high solids thermophilic anaerobic digestion of municipal solid waste with an emphasis on nutrient requirements “ Biomass and Bioenergy 8 (1995):433-444.
7. A. Jarvis, A. Nordberg, T. Jarlsvik, B. Mathisen and B.H. Svensson, “Improvement of a grass-clover silage-fed biogas process by the addition of cobalt", Biomass & Bioenergy (1997), inpress.
8. A. Wilkie, M. Goto, F.M. Bordeaux & P.H. Smith, “Enhancement of anaerobic methanogenesis from napier grass by addition of micronutrients“. Biomass 11 (1986): 135-146.
9. B.K. Richards, R.J. Cummings, WJ. Jewell & F.G. Herndon. “High solids anaerobic methane fermentation of sorghum and cellulose". Biomass & Bioenergy 1 (1991 a):47-53.
10. B.K. Richards, R.J. Cummings & W.J. Jewell, W.J, “High rate low solids methane fermentation of sorghum, corn and cellulose". Biomass & Bioenergy 1 (1991 b):249-260.
11. J. Orlygsson, F.P. Houwen & B.H. Svensson, B.H, “Anareobic degradation of protein and the role of methane formation in steady state thermophilic enrichment cultures". Swedish Journal of Agricultural Research 23 (1993):3-14.
12. D.J. Jerger & G.T. Tsao, “Feed composition", in: Anaerobic digestion of biomass., ed. D.P. Chynoweth & R. Isaacson. (London and New York, Elsevir Applied Science, 1987), 65-90.
13. S.K. Sharma, I.M. Mishra, M.P. Sharma & J.S. Saini, “Effects of particle size on biogas generation from biomass residues". Biomass 17 (1988), 251-263.
14. M. Edstrom, L. Thyselius and M. Blomberg, “Biogas ur organiskt avfall och vaxtbiomassa" (“Biogas from organic waste and biomass"), Swedish Institute of Agricultural Engineering (1992).
15. L. Brolin, M. Hagelberg, A. Nordstrom., ’’Biogas som drivmedel for fordon ”. (’’Biogas as vehicle fuel”), NUTEK R 1995:1, KFB-report 1995:3, (1995).
81
Farm-scale biogas development in Southern Germany
Erwin Koberle, Dipl.-Ing., Biogaskontor, Obermarchtal, Germany
ABSTRACT
This work provides a description of the development of farm-scale plants in Bayern and Baden-Wiirttemberg. The historical development is explained as well as the technical. Main topics are digester concepts, stirring system and co-generation with dual-fuel and gas-engines.
INTRODUCTION
In Germany around 400 biogas plants for the digestion of animal manure are in operation today. 200 of them have been built in the last 3 years. [1]
More than 90% of these are built on individual small farms with less than 10 m3 substrate per day.
Only in East and Northern Germany exist 11 individual farm plants of big dimensions, with more than 20 m3 substrate per day.
In Baden-Wiirttemberg 80 plants and in Bavaria around 200 plants are in operation. In the following we will focus on the situation in South Germany, which means Baden- Wiirttemberg and Bavaria, since the development in these counties is the most dynamique and most of the new designs are made here.
HISTORICAL DEVELOPMENT
The use of biogas is now more than 100 years old. The oldest plant in operation today was built in 1957. With a 20 m3 horizontal tube digester it is small, but it has influenced all the horizontal digesters that have been built until now. Its ability to digest manure with straw and a gas yield of up to 3 m3 / CE (Cow equivalent, 500 kg) per day is even today only reached by few plants.
The first boom in the 50"s and early 60's was stopped by the falling oil prices. The second boom came with the oil crises in 1973 till 1984. At that time about 70 plants were built, most of them in Bavaria.
Many different designs in concrete or steel, vertical or horizontal, were offered by companies, that suddenly appeared as manufactures of biogas plants on the market. In
82
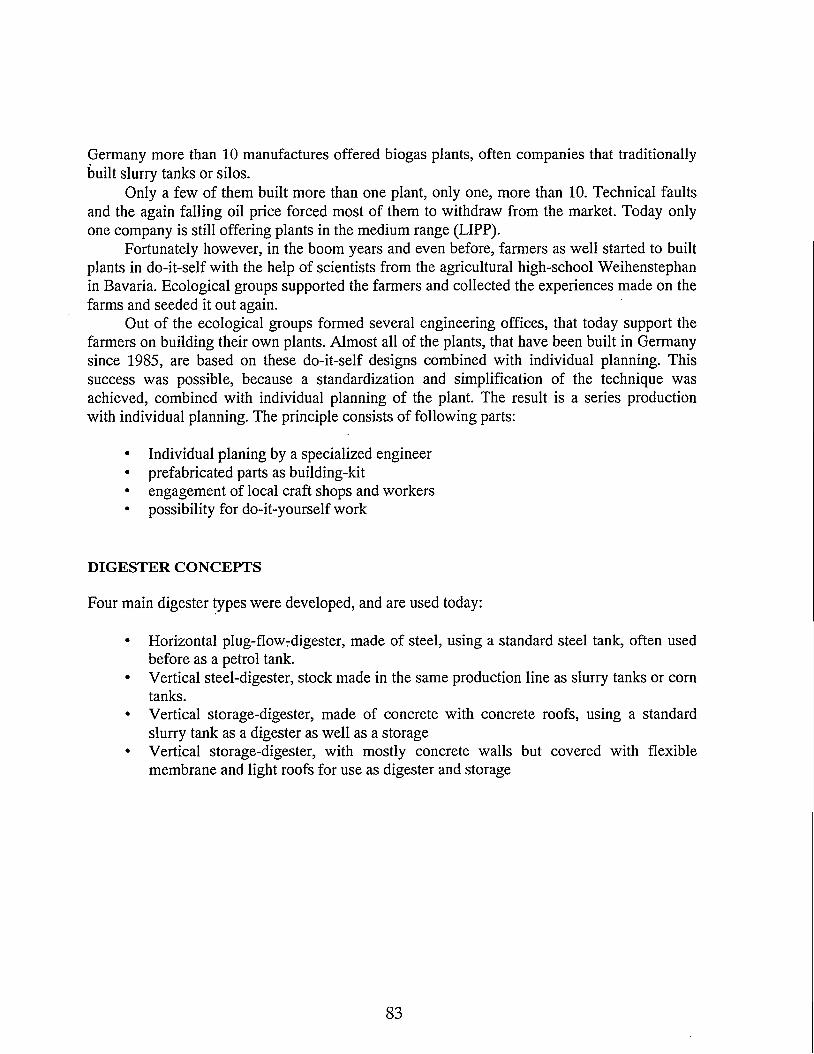
Germany more than 10 manufactures offered biogas plants, often companies that traditionally built slurry tanks or silos.
Only a few of them built more than one plant, only one, more than 10. Technical faults and the again falling oil price forced most of them to withdraw from the market. Today only one company is still offering plants in the medium range (LIPP).
Fortunately however, in the boom years and even before, farmers as well started to built plants in do-it-self with the help of scientists from the agricultural high-school Weihenstephan in Bavaria. Ecological groups supported the farmers and collected the experiences made on the farms and seeded it out again.
Out of the ecological groups formed several engineering offices, that today support the farmers on building their own plants. Almost all of the plants, that have been built in Germany since 1985, are based on these do-it-self designs combined with individual planning. This success was possible, because a standardization and simplification of the technique was achieved, combined with individual planning of the plant. The result is a series production with individual planning. The principle consists of following parts:
• Individual planing by a specialized engineer• prefabricated parts as building-kit• engagement of local craft shops and workers• possibility for do-it-yourself work
DIGESTER CONCEPTS
Four main digester types were developed, and are used today:
• Horizontal plug-flow7digester, made of steel, using a standard steel tank, often used before as a petrol tank.
• Vertical steel-digester, stock made in the same production line as slurry tanks or corn tanks.
• Vertical storage-digester, made of concrete with concrete roofs, using a standard slurry tank as a digester as well as a storage
• Vertical storage-digester, with mostly concrete walls but covered with flexible membrane and light roofs for use as digester and storage
83
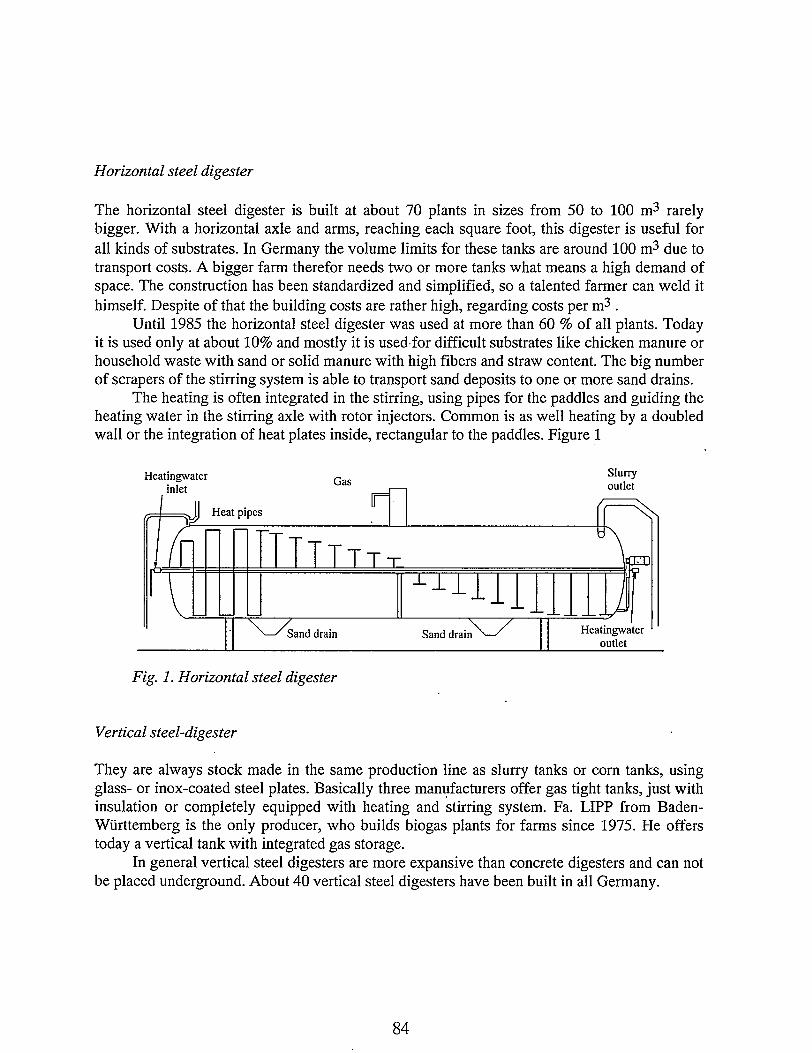
Horizontal steel digester
The horizontal steel digester is built at about 70 plants in sizes from 50 to 100 m3 rarely bigger. With a horizontal axle and arms, reaching each square foot, this digester is useful for all kinds of substrates. In Germany the volume limits for these tanks are around 100 m3 due to transport costs. A bigger farm therefor needs two or more tanks what means a high demand of space. The construction has been standardized and simplified, so a talented farmer can weld it himself. Despite of that the building costs are rather high, regarding costs per m3 .
Until 1985 the horizontal steel digester was used at more than 60 % of all plants. Today it is used only at about 10% and mostly it is used for difficult substrates like chicken manure or household waste with sand or solid manure with high fibers and straw content. The big number of scrapers of the stirring system is able to transport sand deposits to one or more sand drains.
The heating is often integrated in the stirring, using pipes for the paddles and guiding the heating water in the stirring axle with rotor injectors. Common is as well heating by a doubled wall or the integration of heat plates inside, rectangular to the paddles. Figure 1
Slurryoutlet
Heatingwaterinlet
Heat pipes
Heatingwateroutlet
Sand drain Sand drain
Fig. 1. Horizontal steel digester
Vertical steel-digester
They are always stock made in the same production line as slurry tanks or corn tanks, using glass- or inox-coated steel plates. Basically three manufacturers offer gas tight tanks, just with insulation or completely equipped with heating and stirring system. Fa. LIPP from Baden- Wiirttemberg is the only producer, who builds biogas plants for farms since 1975. He offers today a vertical tank with integrated gas storage.
In general vertical steel digesters are more expansive than concrete digesters and can not be placed underground. About 40 vertical steel digesters have been built in all Germany.
84
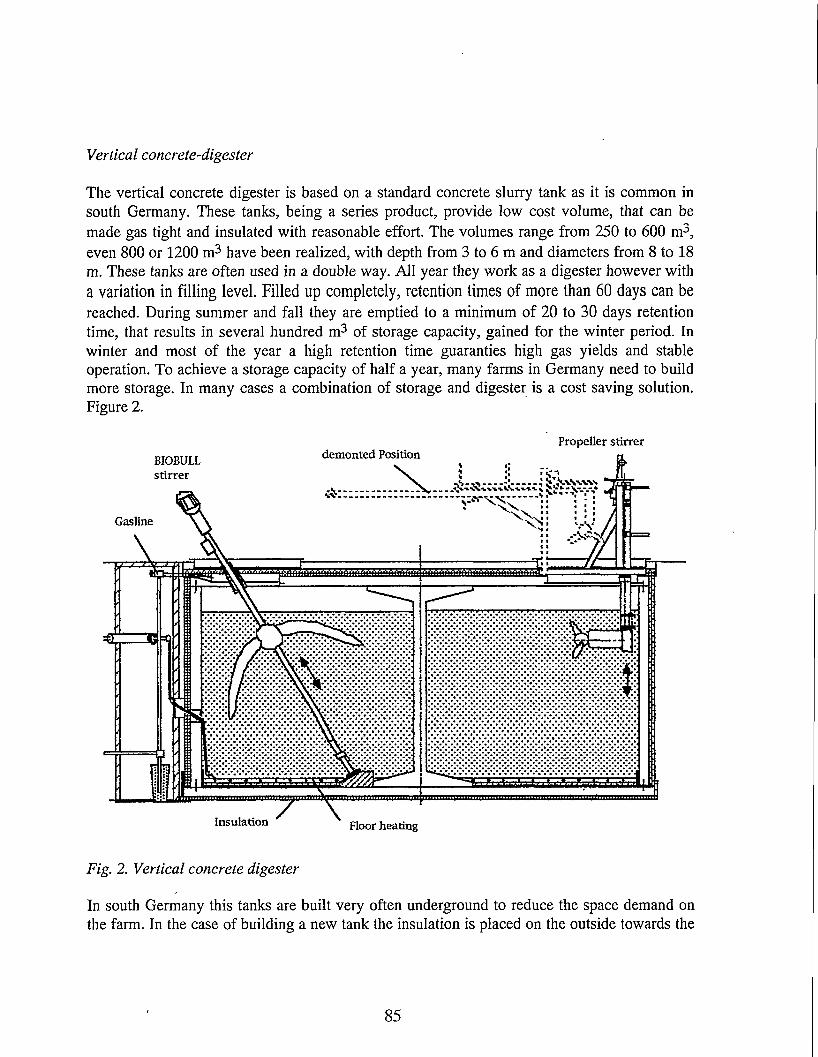
Vertical concrete-digester
The vertical concrete digester is based on a standard concrete slurry tank as it is common in south Germany. These tanks, being a series product, provide low cost volume, that can be made gas tight and insulated with reasonable effort. The volumes range from 250 to 600 m3, even 800 or 1200 m3 have been realized, with depth from 3 to 6 m and diameters from 8 to 18 m. These tanks are often used in a double way. All year they work as a digester however with a variation in filling level. Filled up completely, retention times of more than 60 days can be reached. During summer and fall they are emptied to a minimum of 20 to 30 days retention time, that results in several hundred m3 of storage capacity, gained for the winter period. In winter and most of the year a high retention time guaranties high gas yields and stable operation. To achieve a storage capacity of half a year, many farms in Germany need to build more storage. In many cases a combination of storage and digester is a cost saving solution. Figure 2.
Propeller stirrerdemented PositionBIOBULL
stirrer
Gasline
Insulation Floor heating
Fig. 2. Vertical concrete digester
In south Germany this tanks are built very often underground to reduce the space demand on the farm. In the case of building a new tank the insulation is placed on the outside towards the
85
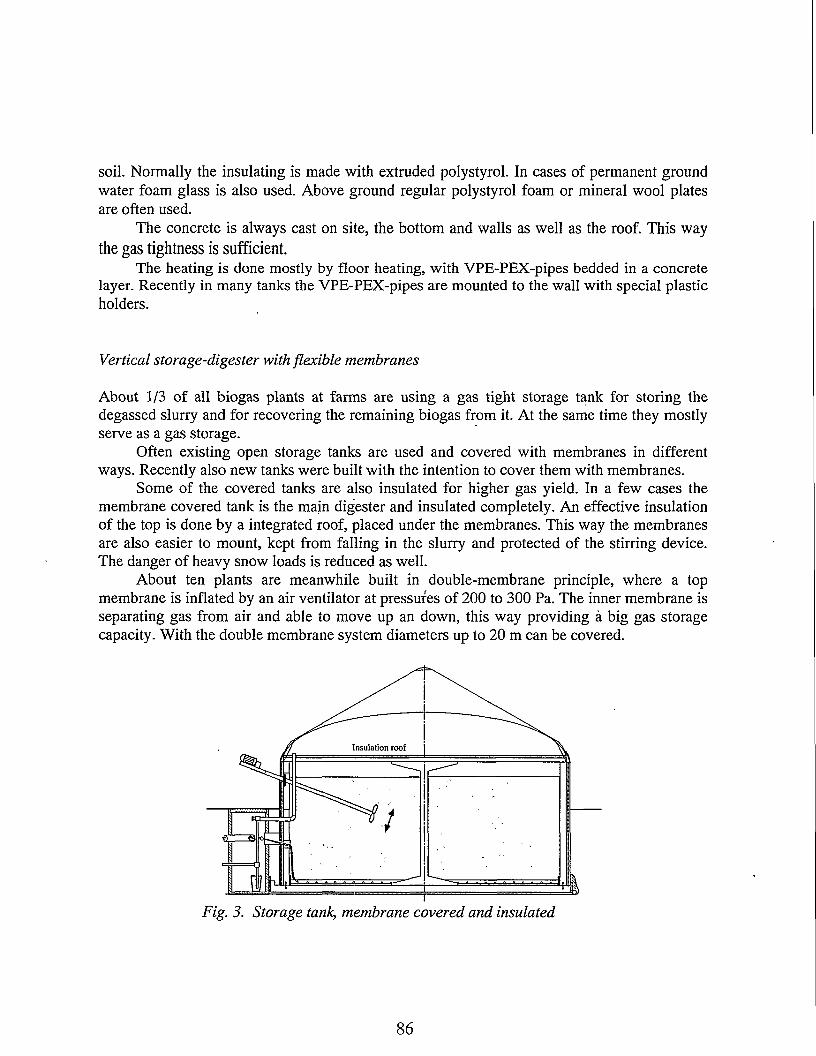
soil. Normally the insulating is made with extruded polystyrol. In cases of permanent ground water foam glass is also used. Above ground regular polystyrol foam or mineral wool plates are often used.
The concrete is always cast on site, the bottom and walls as well as the roof. This waythe gas tightness is sufficient.
The heating is done mostly by floor heating, with VPE-PEX-pipes bedded in a concrete layer. Recently in many tanks the VPE-PEX-pipes are mounted to the wall with special plastic holders.
Vertical storage-digester with flexible membranes
About 1/3 of all biogas plants at farms are using a gas tight storage tank for storing the degassed slurry and for recovering the remaining biogas from it. At the same time they mostly serve as a gas storage.
Often existing open storage tanks are used and covered with membranes in different ways. Recently also new tanks were built with the intention to cover them with membranes.
Some of the covered tanks are also insulated for higher gas yield. In a few cases the membrane covered tank is the main digester and insulated completely. An effective insulation of the top is done by a integrated roof, placed under the membranes. This way the membranes are also easier to mount, kept from falling in the slurry and protected of the stirring device. The danger of heavy snow loads is reduced as well.
About ten plants are meanwhile built in double-membrane principle, where a top membrane is inflated by an air ventilator at pressures of 200 to 300 Pa. The inner membrane is separating gas from air and able to move up an down, this way providing a big gas storage capacity. With the double membrane system diameters up to 20 m can be covered.
Insulation roof
Fig. 3. Storage tank, membrane covered and insulated
86
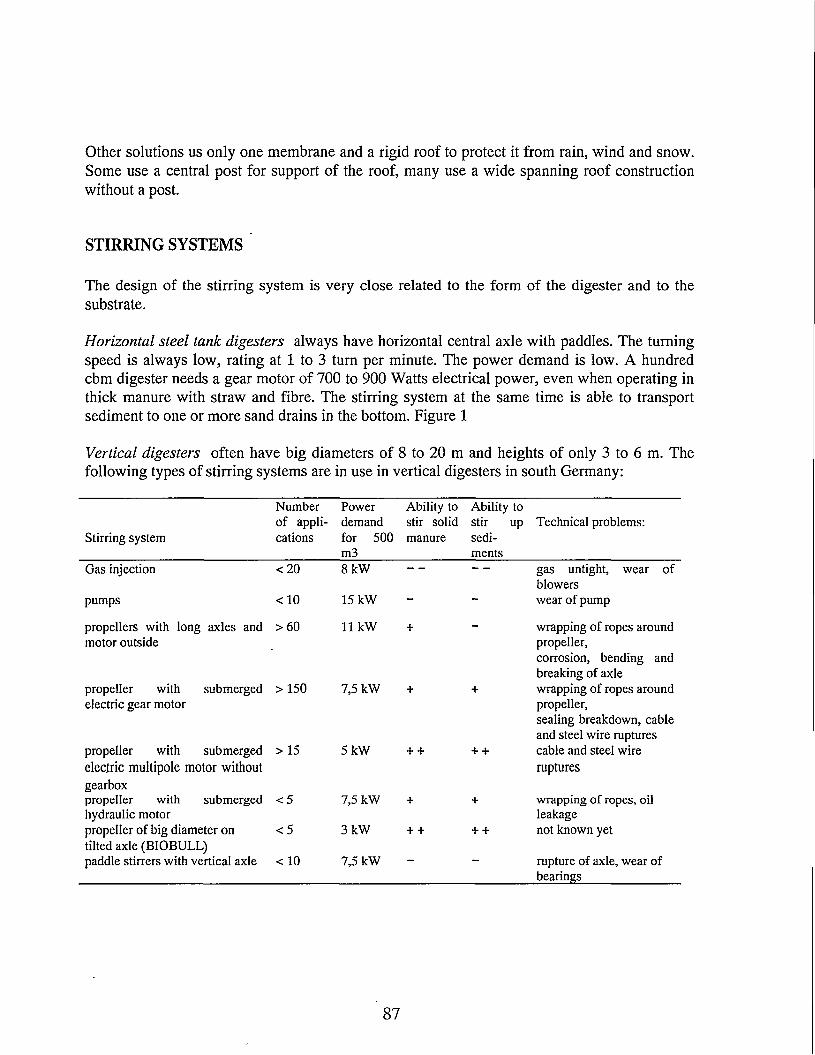
Other solutions us only one membrane and a rigid roof to protect it from rain, wind and snow. Some use a central post for support of the roof, many use a wide spanning roof construction without a post.
STIRRING SYSTEMS
The design of the stirring system is very close related to the form of the digester and to the substrate.
Horizontal steel tank digesters always have horizontal central axle with paddles. The turning speed is always low, rating at 1 to 3 turn per minute. The power demand is low. A hundred cbm digester needs a gear motor of 700 to 900 Watts electrical power, even when operating in thick manure with straw and fibre. The stirring system at the same time is able to transport sediment to one or more sand drains in the bottom. Figure 1
Vertical digesters often have big diameters of 8 to 20 m and heights of only 3 to 6 m. The following types of stirring systems are in use in vertical digesters in south Germany:
Stirring system
Number of applications
Power demand for 500 m3
Ability to stir solidmanure
Ability to stir up sediments
Technical problems:
Gas injection <20 8 kW gas untight, wear of blowers
pumps <10 15 kW — - wear of pump
propellers with long axles and motor outside
>60 11 kW + wrapping of ropes around propeller,corrosion, bending and breaking of axle
propeller with submergedelectric gear motor
> 150 7,5 kW + + wrapping of ropes around propeller,sealing breakdown, cable and steel wire ruptures
propeller with submerged electric multipole motor without gearbox
>15 5 kW + + + + cable and steel wire ruptures
propeller with submergedhydraulic motor
<5 7,5 kW + + wrapping of ropes, oil leakage
propeller of big diameter on tilted axle (BIOBULL)
<5 3 kW + + + + not known yet
paddle stirrers with vertical axle <10 7,5 kW rupture of axle, wear of bearings
87
Due to high power demand and poor stirring effect gas injection systems for stirring are not common. They derive from air stirring systems, that have already been in use in south Baden- Wiirttemberg for normal cow slurry.
In this area some farmers (Berchtold, Schnell) have built vertical storage type digesters with walls inside, to achieve a plug-flow like flow of the substrate and prevent short cuts. The gas stirring with many injection nozzles is the only way to stir the narrow channels.The separating walls are made of steel and wood and integrate the heating.
Most biogas plants are equipped with propeller stirrers. At the long-axle stirrers the motors are placed outside, which is an advantage in maintenance. However they are less effective due to the angle of the axle that doesn't allow the optimised horizontal position. Problems with corrosion and wrapping of plastic ropes and ropes of straw fibre did occur.
Propellers with submerged electric motors are the most used. Almost all use a patented system of gas tight post mounting, that allows to move the propel motor up and down and also to turn in any direction. This way these stirrers are very effective. Some designs have problems with wrapping of plastic and ropes of straw fibre. Two manufacturers (EISELE + FLYGT) have improved designs with low tendency for wrapping.
Problems with the electric cables and steel wires inside are not rare. These problems are solved with the new patented post design, which is shown in Figure 2. In this construction the post itself is moving up and down and turning around with the propel motor fixed on it. This way electric cables and steel wires inside are avoided completely. This system can be equipped with any kind of propeller and is able to stir in 5 m depth.
CO-GENERATION
Until 1985 most of the individual farm plant used the gas only for heating purposes. Today allots all plants use the gas in co-generation, with the electricity as the main product and heat only as a byproduct, however used as well for house heating and hot water.
The gas is stored in balloons, protected in containers, silos or shelter huts. The storagecapacity is in the range of 60 to 200 m3.
In Germany electricity by biogas can be sold to the grid for 0,152 DM per kWh. Heat available from the co-generation is mostly used to heat the farm house, replacing oil for 2000 to 4000 DM a year.
Two types of engines are use: - gas engine with Otto-principle- dual-fuel engines with Diesel- principle
About 70 % of all engines today on farm biogas plants are Diesel dual-fuel, the others are Otto-motors. [2] At one plant a Stirling engine is planed for testing.
88
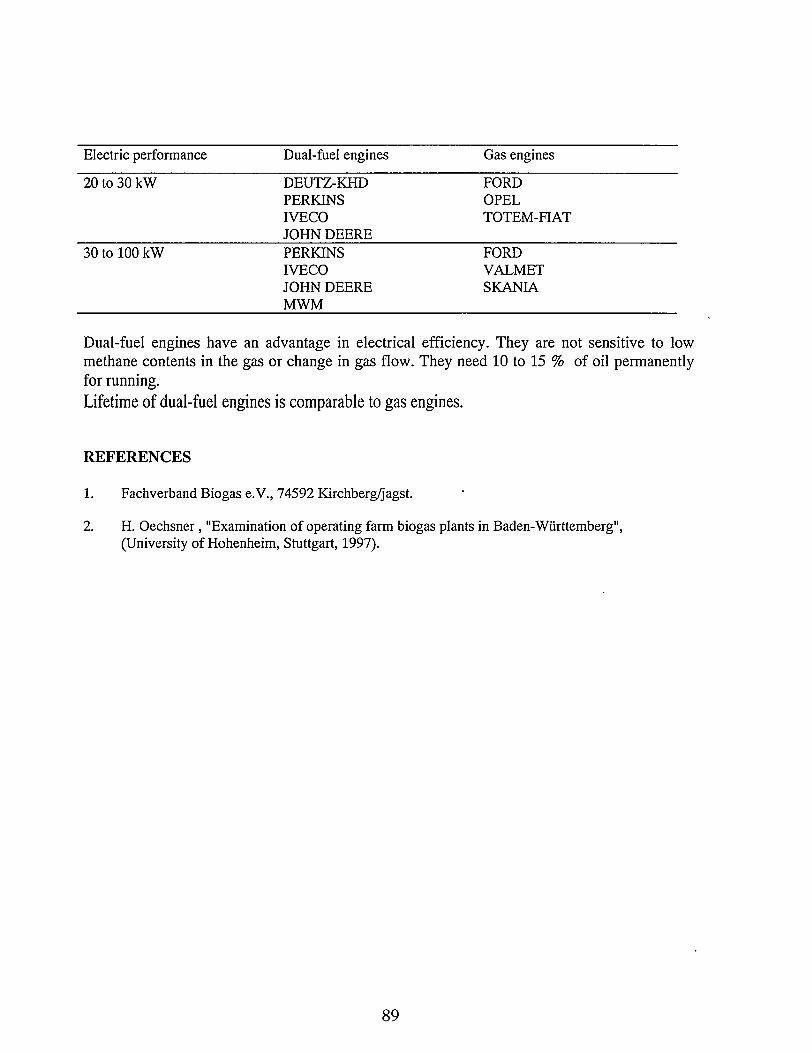
Electric performance Dual-fuel engines Gas engines
20 to 30 kW DEUTZ-KHD FORDPERKINS OPELIVECOJOHN DEERE
TOTEM-FIAT
30 to 100 kW PERKINS FORDIVECO VALMETJOHN DEEREMWM
SKANIA
Dual-fuel engines have an advantage in electrical efficiency. They are not sensitive to low methane contents in the gas or change in gas flow. They need 10 to 15 % of oil permanently for running.Lifetime of dual-fuel engines is comparable to gas engines.
REFERENCES
1. Fachverband Biogas e.V., 74592 Kirchberg/jagst.
2. H. Oechsner, "Examination of operating farm biogas plants in Baden-Wiirttemberg", (University of Hohenheim, Stuttgart, 1997).
89
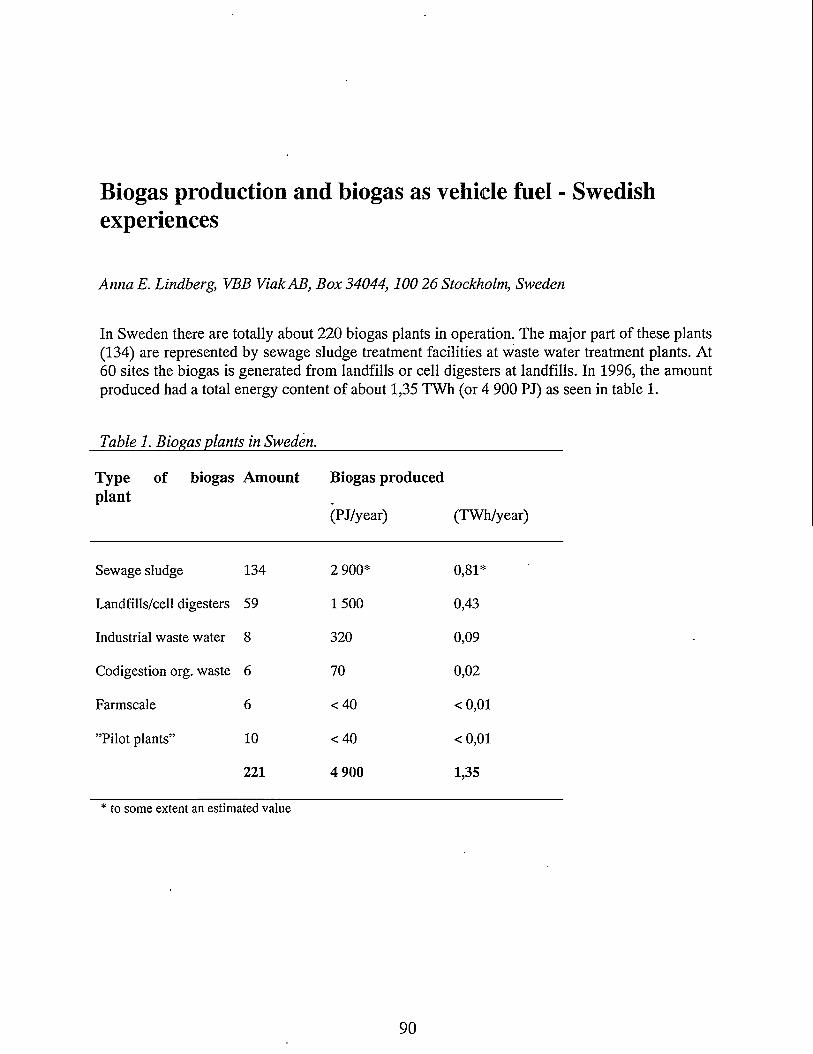
Biogas production and biogas as vehicle fuel - Swedish experiences
Anna E. Lindberg, VBB ViakAJB, Box 34044,100 26 Stockholm, Sweden
In Sweden there are totally about 220 biogas plants in operation. The major part of these plants (134) are represented by sewage sludge treatment facilities at waste water treatment plants. At 60 sites the biogas is generated from landfills or cell digesters at landfills. In 1996, the amount produced had a total energy content of about 1,35 TWh (or 4 900 PJ) as seen in table 1.
Table 1. Biogas plants in Sweden.
Type of biogas Amount plant
Biogas produced
(PJ/year) (TWh/year)
Sewage sludge 134 2 900* 0,81*
Landfills/cell digesters 59 1500 0,43
Industrial waste water 8 320 0,09
Codigestion org. waste 6 70 0,02
Farmscale 6 <40 <0,01
’’Pilot plants” 10 <40 <0,01
221 4 900 1,35
* to some extent an estimated value
90
SEWAGE SLUDGE DIGESTION
Sewage sludge treatment is in Sweden, as in other countries, to a great extent performed by anaerobic digestion. The generated biogas was for a long time considered as a problematic byproduct and not as a valuable energy source. The biogas was not used at all and just emitted to the atmosphere without former combustion. However the last ten to fifteen years the resulting biogas from these treatment operations has been taken care of and flared or used for heat generation or combined heat and power generation. Today, biogas extraction and utilisation takes place at almost all waste water treatment plants in Sweden. About 40 waste water treatment plants have some kind of combined heat and power generation facilities, together generating about 0,05 - 0,10 TWh (180 - 360 PJ) electricity per year.
LANDFILL GAS EXTRACTION
Landfill gas extraction is a rather new source of biogas in Sweden as in other countries. In Sweden the first landfill gas extraction facility was established in Malmo in the early 80’s. Today the environmental laws enforce that new landfills as well as extension of existing sites must include biogas extraction facilities. In addition, organic wastes has to be separately disposed in separate cells. As a result of this, different techniques for recycling of leachate and gas extraction from these cells have been developed and implemented at several facilities. Depending on the degree of compacting and the technique used, the degradation process can be more or less fastened compared with ordinary landfilling. The gas generation has in a few cases declined already after five years. It is more common, however, that half the methane potential is left after five years corresponding to about 70 m3 of biogas per metric ton of ordinary household waste.
FARM SCALE DIGESTION
Historically, the interest for biogas in Sweden increased in the beginning of the 70’s due to the ’’oil crisis”. Farmers began to plan or build their own digesters for treatment of manure and to produce their own heat and electricity. About ten farm scale digesters were built in Sweden but today only five of them are still in operation or under reconstruction. However, the oil price turned out to be lower than expected. This, in combination with high maintenance costs resulted in a declined interest in anaerobic digestion and biogas production as an energy source.
91
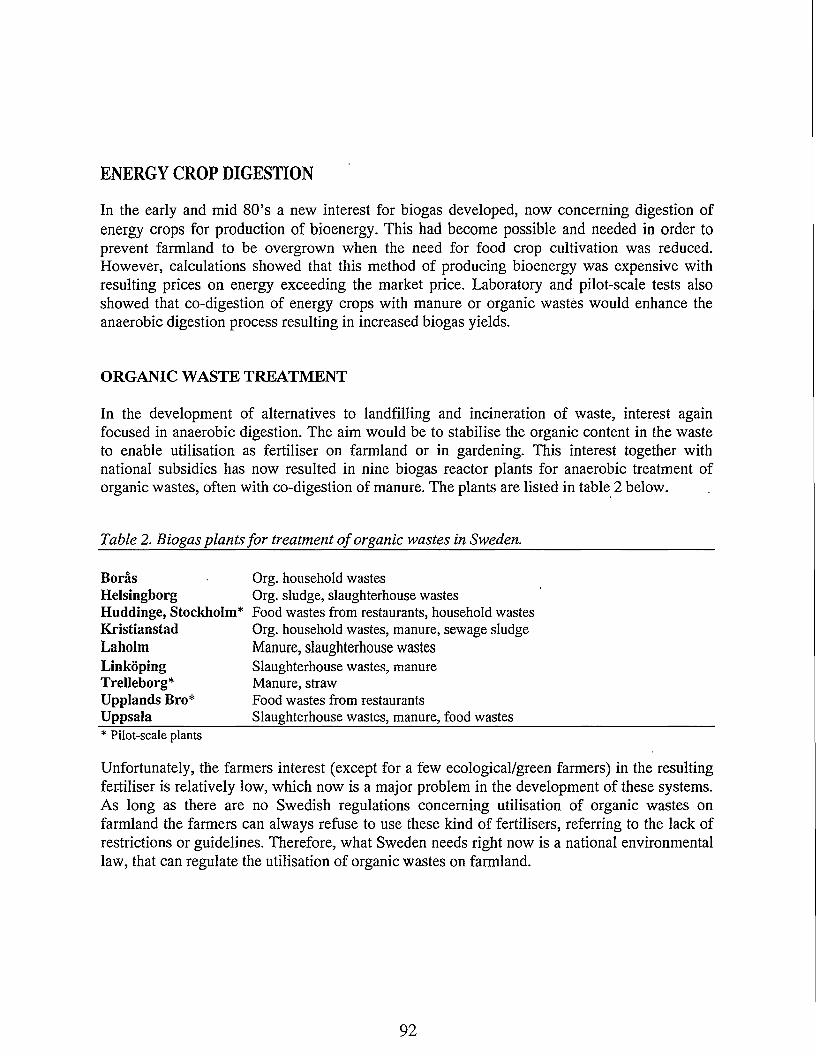
ENERGY CROP DIGESTION
In the early and mid 80’s a new interest for biogas developed, now concerning digestion of energy crops for production of bioenergy. This had become possible and needed in order to prevent farmland to be overgrown when the need for food crop cultivation was reduced. However, calculations showed that this method of producing bioenergy was expensive with resulting prices on energy exceeding the market price. Laboratory and pilot-scale tests also showed that co-digestion of energy crops with manure or organic wastes would enhance the anaerobic digestion process resulting in increased biogas yields.
ORGANIC WASTE TREATMENT
In the development of alternatives to landfilling and incineration of waste, interest again focused in anaerobic digestion. The aim would be to stabilise the organic content in the waste to enable utilisation as fertiliser on farmland or in gardening. This interest together with national subsidies has now resulted in nine biogas reactor plants for anaerobic treatment of organic wastes, often with co-digestion of manure. The plants are listed in table 2 below.
Table 2. Biogas plants for treatment of organic wastes in Sweden.
Boras Org. household wastesHelsingborg Org. sludge, slaughterhouse wastesHuddinge, Stockholm* Food wastes from restaurants, household wastes Kristianstad Org. household wastes, manure, sewage sludgeLaholm Manure, slaughterhouse wastesLinkoping Trelleborg* Upplands Bro* Uppsala
Slaughterhouse wastes, manure Manure, strawFood wastes from restaurants Slaughterhouse wastes, manure, food wastes
* Pilot-scale plants
Unfortunately, the farmers interest (except for a few ecological/green farmers) in the resulting fertiliser is relatively low, which now is a major problem in the development of these systems. As long as there are no Swedish regulations concerning utilisation of organic wastes on farmland the farmers can always refuse to use these kind of fertilisers, referring to the lack of restrictions or guidelines. Therefore, what Sweden needs right now is a national environmental law, that can regulate the utilisation of organic wastes on farmland.
92
BIOGAS AS VEHICLE FUEL
During the last two to three years, the interest for using biogas as vehicle fuel has increased significantly in Sweden. This has been possible since subsidies from the Swedish Transport and Communications Research Board have been used for investments in upgrading and filling stations for using biogas as vehicle fuel. The subsidies were part of a R & D program (total amount 30 million Swedish kronor = 260 million ECU) focusing in use of ethanol and biogas as vehicle fuel. The activities include both practical tests as well as analyses.
Today seven units for upgrading and filling of biogas are in operation. At least four more stations are planned (two in Stockholm, one in Kalmar and one in Kristianstad). The seven units in operation are located as follows:
EslovGoteborgHelsingborgLinkopingStockholmTrollhattanUppsala
When using biogas as vehicle fuel the demands on gas quality are high. In order to meet the vehicle fuel standards, the raw biogas has to be upgraded to:
■S have a high energy density to cover greater distance in driving,■S have an even quality to reach reliable operation,v' avoid problems with corrosion due to high content of hydrogen sulphide, ammonia and
water,■S prevent problems with particles,■S avoid problems with ice clogging due to high water content, v' get a documented gas quality with quality assurance.
In practice this means that carbon dioxide, hydrogen sulphide, ammonia, water and particles need to be separated from the raw biogas, leaving almost only methane in the upgraded biogas. In table 3 the Swedish quality specification for biogas as vehicle fuel is presented.
93
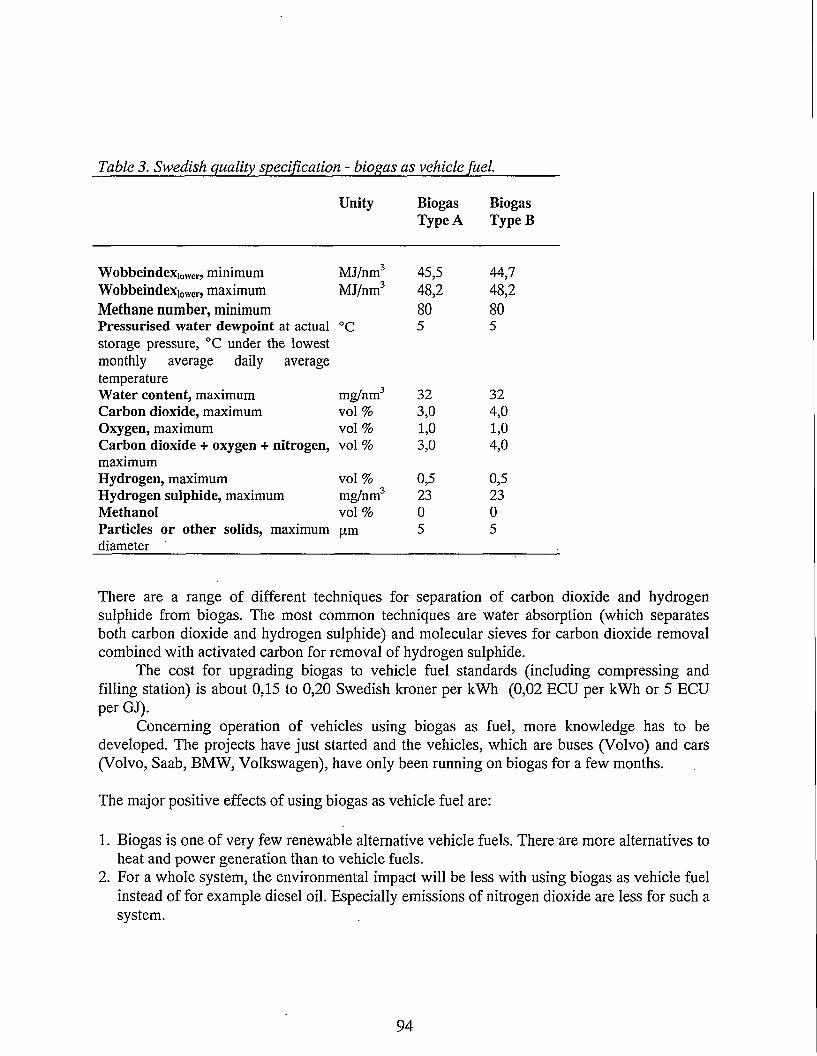
Table 3. Swedish quality specification - biogas as vehicle fuel.
Unity Biogas Biogas Type A Type B
Wobbeindexiowen minimum MJ/nm* 1 2 3 45,5 44,7Wobbeindexioweo maximum MJ/nm3 48,2 48,2Methane number, minimum 80 80Pressurised water dewpoint at actual °C 5 5storage pressure, °C under the lowestmonthly average daily averagetemperatureWater content, maximum mg/nm3 32 32Carbon dioxide, maximum vol % 3,0 4,0Oxygen, maximum vol % 1,0 1,0Carbon dioxide + oxygen + nitrogen, vol % 3,0 4,0maximumHydrogen, maximum vol % 0,5 0,5Hydrogen sulphide, maximum mg/nm3 23 23Methanol vol % 0 0Particles or other solids, maximum pm 5 5diameter
There are a range of different techniques for separation of carbon dioxide and hydrogen sulphide from biogas. The most common techniques are water absorption (which separates both carbon dioxide and hydrogen sulphide) and molecular sieves for carbon dioxide removal combined with activated carbon for removal of hydrogen sulphide.
The cost for upgrading biogas to vehicle fuel standards (including compressing and filling station) is about 0,15 to 0,20 Swedish kroner per kWh (0,02 ECU per kWh or 5 ECU per GJ).
Concerning operation of vehicles using biogas as fuel, more knowledge has to be developed. The projects have just started and the vehicles, which are buses (Volvo) and cars (Volvo, Saab, BMW, Volkswagen), have only been running on biogas for a few months.
The major positive effects of using biogas as vehicle fuel are:
1. Biogas is one of very few renewable alternative vehicle fuels. There are more alternatives to heat and power generation than to vehicle fuels.
2. For a whole system, the environmental impact will be less with using biogas as vehicle fuel instead of for example diesel oil. Especially emissions of nitrogen dioxide are less for such asystem.
94
These conclusions we can draw from a Swedish study is that from environmental aspects the best utilisation of biogas is for vehicle operation. Of course this comparison greatly depends on the alternatives to biogas studied. In the Swedish study a comparison was made betweena) generating heat and electricity and,b) utilisation as vehicle fuel.
Object in the study was the biogas produced from sewage sludge treatment in the city of Uppsala and assumed as alternatives to biogas: 50% nuclear power and 50% power from coal firing for production of electricity and mainly petroleum for heating. The alternative vehicle fuel was diesel oil in the study. When providing 31 buses with biogas and using above described alternatives for heat and power generation instead the yearly environmental gain expressed in monetary terms is larger than the economic loss due to investments in biogas upgrading facilities and filling station when using biogas as vehicle fuel.
REFERENCES
1. Lindberg A., Biogasanlaggningar i Sverige, VA-forsk rapport nr 1997:, 1997.
2. Lindberg A., Uppgradering av biogas till drivmedelkvalitet - teknik, ekonomi och miljokonsekvenser, NUTEK projekt nr P3041-1,1997.
95
Integration of Biogas in Municipal Energy Planning andSupply
Director Niels Nedergaard & Agronomist Henrik 0rtenblad, Herning Municipal Utilities, Enghavevej 10, 7400 Herning, Denmark
The first biogas plants in Denmark were based on local initiatives and a great deal of idealism. The break through with technically well functioning plants came at the end of the 80'ies. The plants were based on animal manure, and the development came together with the growing environmental demands and the legislation concerning storage capacity and distribution of the manure. This contributed to an increasing interest in joint biogas plants, mainly from the agricultural sector, but also from the industry.
Today Denmark has 19 biogas plants in operation, all based on manure co-digested with wastes from the food industry, and 15 farm-scale plants. Only three of the joint plants are owned by a municipality, one plant in Arhus and two in Herning.
ENERGY SUPPLY AND PLANNING IN HERNING
One of the first joint biogas plants was built in Herning. The plant is pla'ced near the village of Binding, 10 km north from Herning, and it was started on the base of a local initiative from the citizens of Sinding. The biogas plant treats about 40,000 tons-of manure annually, combinedwith 10,000 tons of different waste products.
With the experiences from Sinding, Herning Municipal Utilities has built a new biogas plant in 1996, treating about 110,000 tons of manure annually, combined with 20,000 tons of different waste products.
Herning Municipal Utilities supply about 12,500 households with district heat and water and 32,000 households with electricity. Today, 15-20 percent of the energy consumption come from renewable energy sources, but The City Council has decided that it must be increased to 35-40 percent.
Herning Municipal Utilities has built different energy plants, based on biomass:* a waste incineration CHP plant (4.7 MWei and 12 MWheat)* a straw incineration plant (1.0 MWheat)* a wood gasification plant (130 kWei and 180 kWheat)* a landfill biogas plant (2.2 MWei and 1.7 MWheat)* an incineration plant for energy crops/wood pellets (500 kWheat)* two joint biogas plants (2.2 MWei and 3.9 MWheat)* a wood-chip incineration plant (1.6 MWheat)
96
To fulfil the aims Herning Municipal Utilities is also distributing wood-pellets to citizens outside the district heating grid.
BIOGAS AND SOURCE SEPARATED HOUSEHOLD WASTE
In the beginning of the 90'ies it was planned that all households in Denmark should introduce source separation of their wastes, before 1996. For different reasons, this goal has not been reached and the plans for source separation of household waste has been dismissed.
In the beginning, the focus for reuse of the organic fraction was composting. But this gives no energy production and it seems to be an expensive solution. Furthermore, there is difficult to guarantee a compost without pieces of plastic or other non-organic items and to reach a sufficient hygienisation, so the compost can be spread on farmland as a fertilizer.
The conclusion from the Danish Environmental Agency is today, that biogas is the optimum way for recycling the organic household waste.
Consequently, the government has supported several demonstration projects for anaerobic digestion of household waste. One project was at Sinding biogas plant, where a pilot plant was built to collect experiences concerning co-digestion of household waste with slurry. On the background of positive results from the pilot plant, the Sinding plant was converted to receive and co-digest household waste together with slurry and other types of organic wastes. Two new biogas plants, in Studsgard near Herning and in Arhus, were built on the Sinding concept for reception of household waste. In 1996 a biogas plant to co-digest household waste and sewage sludge was also built in Grindsted.
QUANTITIES OF ORGANIC HOUSEHOLD WASTE
Refuse from private households amounts 13 percent of the waste in Denmark. Analysis of the refuse shows that vegetable and animal food waste makes up 40 percent, and together with wet-paper and garden waste it makes up almost 50 percent of the total.
The aim of the action programme for wastes and refuse 1993-97 was that 20-25 percent ofthe refuse should be treated biologically. This represents approximately 315,000 tons oforganic refuse, as it is shown in fig.l. The figure corresponds to collection from 1.4 mio. households.
97
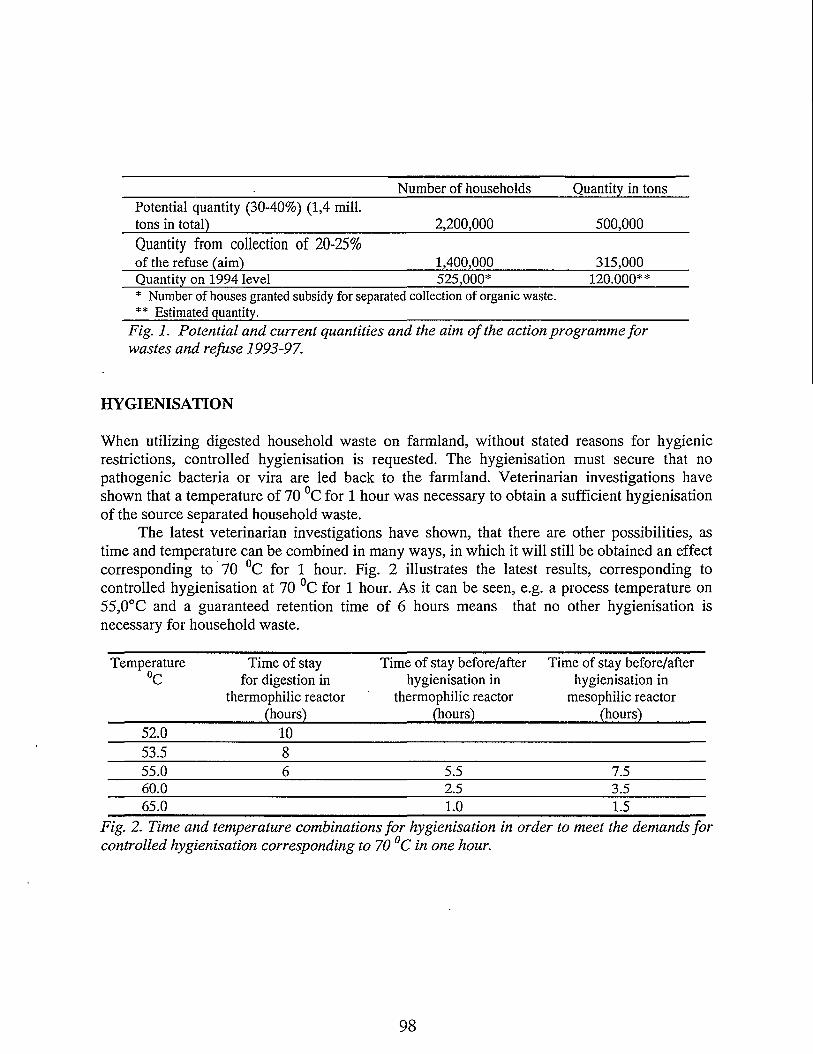
Number of households Quantity in tonsPotential quantity (30-40%) (1,4 mill, tons in total) 2,200,000 500,000Quantity from collection of 20-25%of the refuse (aim) 1,400,000 315,000Quantity on 1994 level 525,000* 120.000*** Number of houses granted subsidy for separated collection of organic waste.** Estimated quantity.
Fig. 1. Potential and current quantities and the aim of the action programme for wastes and refuse 1993-97.
H Y GIENIS ATION
When utilizing digested household waste on farmland, without stated reasons for hygienic restrictions, controlled hygienisation is requested. The hygienisation must secure that no pathogenic bacteria or vira are led back to the farmland. Veterinarian investigations have shown that a temperature of 70 °C for 1 hour was necessary to obtain a sufficient hygienisation of the source separated household waste.
The latest veterinarian investigations have shown, that there are other possibilities, as time and temperature can be combined in many ways, in which it will still be obtained an effect corresponding to 70 °C for 1 hour. Fig. 2 illustrates the latest results, corresponding to controlled hygienisation at 70 °C for 1 hour. As it can be seen, e.g. a process temperature on 55,0°C and a guaranteed retention time of 6 hours means that no other hygienisation is necessary for household waste.
Temperature°C
Time of stay for digestion in
thermophilic reactor (hours)
Time of stay before/after hygienisation in
thermophilic reactor (hours)
Time of stay before/after hygienisation in
mesophilic reactor (hours)
52.0 1053.5 855.0 6 5.5 7.560.0 2.5 3.565.0 1.0 1.5
Fig. 2. Time and temperature combinations for hygienisation in order to meet the demands for controlled hygienisation corresponding to 70 °C in one hour.
98
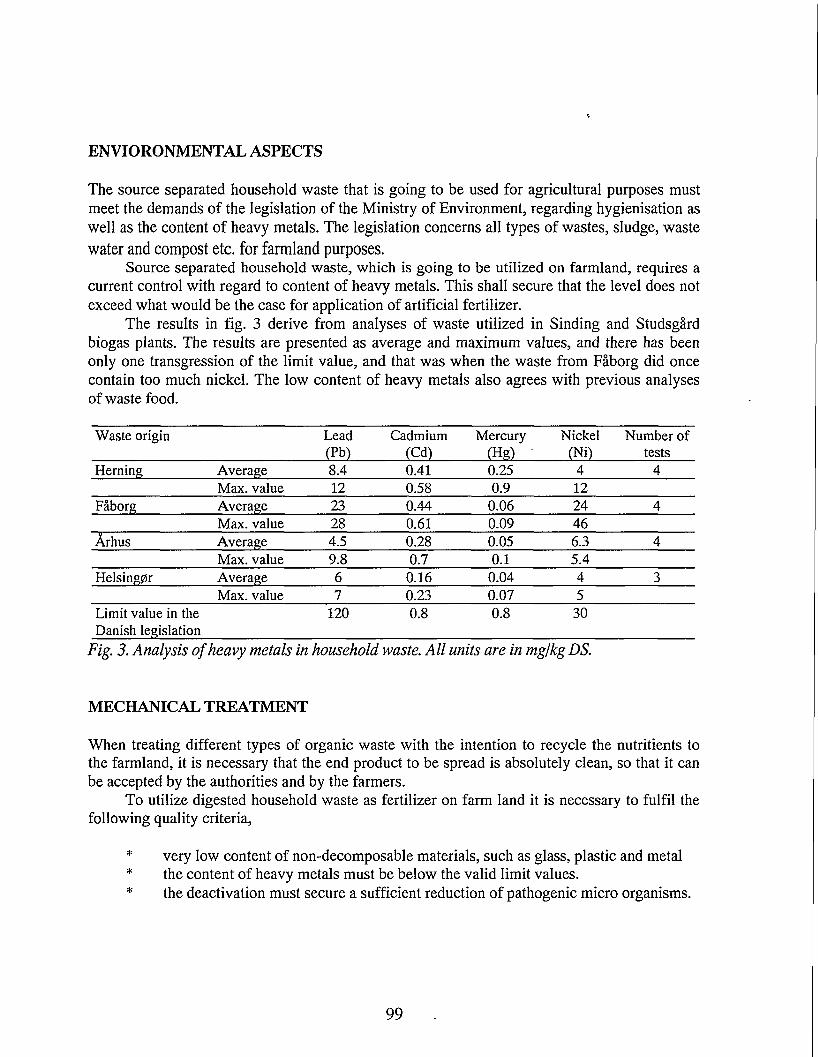
ENVIRONMENTAL ASPECTS
The source separated household waste that is going to be used for agricultural purposes must meet the demands of the legislation of the Ministry of Environment, regarding hygienisation as well as the content of heavy metals. The legislation concerns all types of wastes, sludge, wastewater and compost etc. for farmland purposes.
Source separated household waste, which is going to be utilized on farmland, requires a current control with regard to content of heavy metals. This shall secure that the level does not exceed what would be the case for application of artificial fertilizer.
The results in fig. 3 derive from analyses of waste utilized in Binding and Studsgard biogas plants. The results are presented as average and maximum values, and there has been only one transgression of the limit value, and that was when the waste from Faborg did once contain too much nickel. The low content of heavy metals also agrees with previous analyses of waste food.
Waste origin Lead Cadmium Mercury Nickel Number of(Pb) (Cd) (Hg) (Nil tests
Herning Average 8.4 0.41 0.25 4 4Max. value 12 0.58 0.9 12
Faborg Average 23 0.44 0.06 24 4Max. value 28 0.61 0.09 46
Arhus Average 4.5 0.28 0.05 6.3 4Max. value 9.8 0.7 0.1 5.4
Helsingpr Average 6 0.16 0.04 4 3Max. value 7 0.23 0.07 5
Limit value in the Danish legislation
120 0.8 0.8 30
Fig. 3. Analysis of heavy metals in household waste. All units are in mg/kg DS.
MECHANICAL TREATMENT
When treating different types of organic waste with the intention to recycle the nutritients to the farmland, it is necessary that the end product to be spread is absolutely clean, so that it can be accepted by the authorities and by the farmers.
To utilize digested household waste as fertilizer on farm land it is necessary to fulfil the following quality criteria, *
* very low content of non-decomposable materials, such as glass, plastic and metal* the content of heavy metals must be below the valid limit values.* the deactivation must secure a sufficient reduction of pathogenic micro organisms.
99
Even with a source separation at the individual households, there will be some non-decomposable materials in the waste, such as plastic bags and also some errors/mistakes in the source separating as well as a few people that just don't care. These "foreign elements" have to be sorted out, and most projects try to remove the non-decomposable material before processing the organic waste. But this sorting has in practice been very difficult. Either not all "foreign elements" are sorted out or too much of the organic material goes along with the non- decomposable material and has to be burned at an incineration plant or landfilled.
The "Binding concept" introduced a course pre-sorting where most of the plastic is removed. At the biogas plant, glass and metal are removed during sedimentation, before the digestion. The digestion convert the organic material to biogas and to a fluid containing the nutritients. After the digestion, the material passes a separator, where remaining plastic and other foreign elements are sorted out.
Fig. 4 illustrates the processing at the line for household waste at the biogas plant. Plastic and sediments are deposited or burned, while the remaining fractions are utilized for energy production and as fertilizer. With this concept, a total recycling percentage of 80%, based on total weight, is obtained. The recyclable end products consist of biogas and a liquid fertilizer product. The biogas is used for production of electricity and heat in a motor generator plant.
studsgArd biogas plant
Fig. 4 shows a block diagram of the plant. As it can be seen, the plant receives manure from agriculture, organic waste from the food industry and organic household waste.
After processing, these different types of waste have been turned into (per year): 4,2 mio Nm3 biogas, 129,000 tons liquid fertilizer for farmland, 1,000 tons sediments for deposit and 700 tons fibres for heat boilers.
The biogas is sold to Herning Municipal Utilities' District Heating Division to.be utilized in a gas engine for biogas and natural gas, with a capacity of 1.4 MW electricity and 1.8 MW heat. The electricity production of about 10,500 MWh/year is sold to the grid and the heat production of about 13,500 MWh/year is delivered to the district heating network.
The produced biogas consists of about 65% methane and 35% (C02) carbon dioxide. Furthermore, the raw gas consists of up to 2000 ppm H2S (0,2% hydrogen sulphide). Before compressing and sending the gas into pipelines, to the motor systems, it is cleaned for hydrogen sulphide in a filter plant. For utilization in a traditional gas motor, the content of the hydrogen sulphide in the biogas must not exceed 400-500 ppm (0,04-0,05%).
100
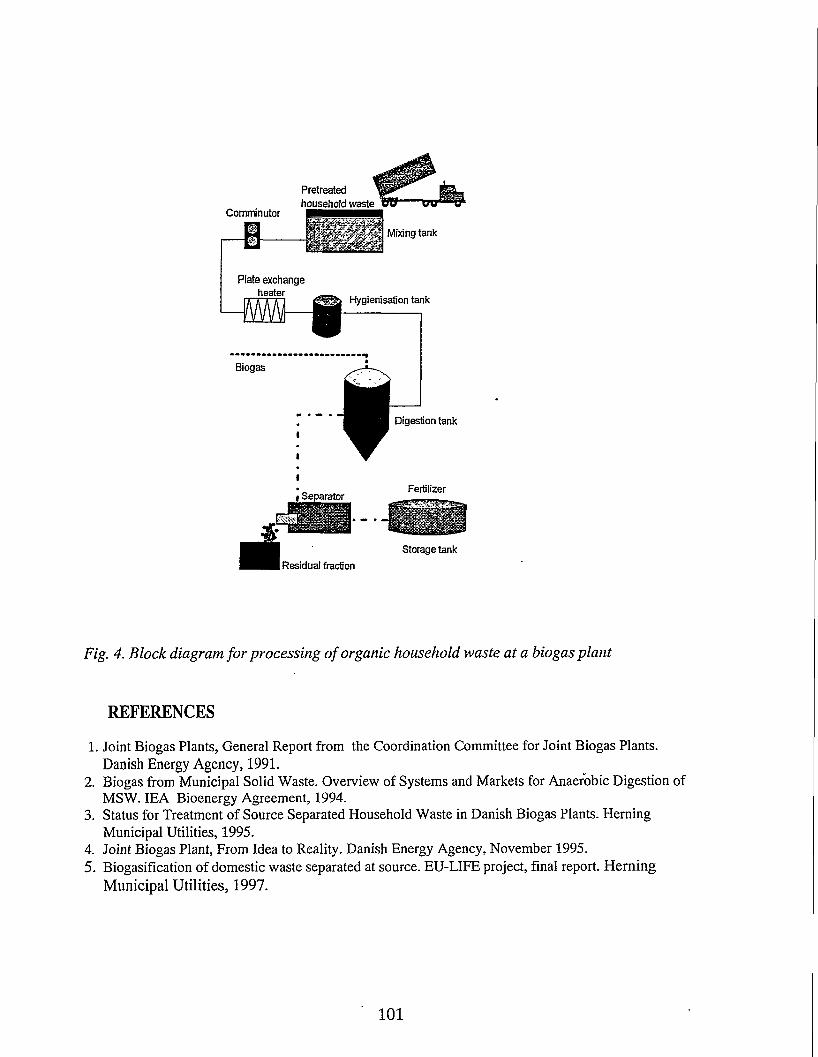
Plate exchange heater
Hygienisation tank
Biogas
lDigestion tank
I
i SeparatorFertilizer
Storage tank
Fig. 4. Block diagram for processing of organic household waste at a biogas plant
REFERENCES
1. Joint Biogas Plants, General Report from the Coordination Committee for Joint Biogas Plants. Danish Energy Agency, 1991.
2. Biogas from Municipal Solid Waste. Overview of Systems and Markets for Anaerobic Digestion of MSW. IEA Bioenergy Agreement, 1994.
3. Status for Treatment of Source Separated Household Waste in Danish Biogas Plants. Herning Municipal Utilities, 1995.
4. Joint Biogas Plant, From Idea to Reality. Danish Energy Agency, November 1995.5. Biogasification of domestic waste separated at source. EU-LIFE project, final report. Herning
Municipal Utilities, 1997.
101
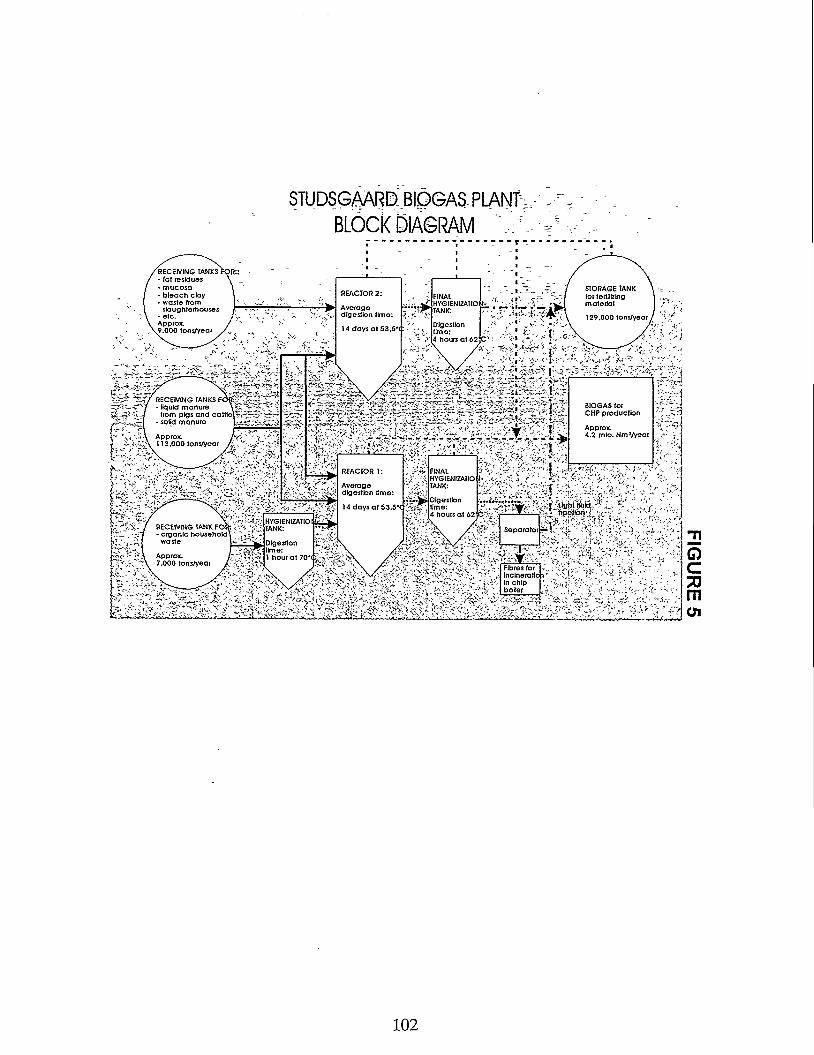
3TUDSGAARD BIOGAS PLANTBLOCK DIAGRAM V.--*V
RECEIVING TANKS - tot residues
STORAGE TANK for fertilizing material
REACTOR 2:bleach clay waste from slaughterhouses
FINALHYGIENIZATIO t- TANK: 7Average
digestion time: 129,000 tons/yearApprox.9.000 tons/year
Digestionlime:4 hours at 62 C*
14 days at 53.5'
RECEIVING TANKS FOR- • liquid manure X
from pigs and cattle] - solid manure
BIOGAS tor CHP production
Approx.4.2 mlo. NmVyear
113.000 lons/year
FINAL $HYGIENIZATIO I- TANK:
REACTOR 1
Average digestion time:
Digestion w time:4 hours at 62
14 days at 53.5'( (
HYGIENIZATIOITANK:RECEIVING TANK FOR
- organic householdSeparator ■»’
Digestion t time:1 hour at 70*( £Approx.
7.000 tons/year Fibres for C Inclneratic v In chip boiler
102
FIGU
RE 5
The co-digestion of animal manure and food industry residues in the UK; the role of the NFFO as a catalyst
Clare T Lukehurst, 52, Broadstairs Road, Broadstairs, Kent, CT102RJ, UK
ABSTRACT
The adoption of AD in the UK has been sporadic and limited to small installations or farms. In 1993 the North Tamar LEADER Project embarked on the first large scale community initiative to use AD as an instrument for environmental management and integrated rural development. At the same time a new turnkey construction company began to use the NFFO. process to stimulate AD adoption and sales. This paper examines the two approaches and their contribution of the NFFO process.
INTRODUCTION
The purpose of this paper is to highlight key issues affecting the optimal exploitation of animal manures and the residues from the agri-food processing industries in the United Kingdom. Attention therefore will focus not only on the AD process for energy production but also its main role as an instrument for integrated environmental management, economic growth and as the catalyst for encouraging cohesion in rural communities.
The two different approaches to the development of biogas plants have been taking place in parallel. The one by the North Tamar Leader Project group, a small rural community in South West England, and the other by a turn key developer promoting its own UK conversion technology. An attempt will be made to assess the role of the NFFO process in the progress of these two initiatives and, secondly, to consider the impact this may have upon future progress.
Before an attempt is made to describe the two approaches, it is worth identifying how the NFFO process operates. It is a competitive commercial bidding procedure whereby developers submit tenders to secure a contract to sell electricity to a regional electricity company (REC), albeit at a premium price.
The Secretary of State for Energy requires the RECs to purchase a prescribed percentage of their total power from one or more of the renewable sources (wind, small-scale hydro, solar, landfill gas, energy crops and forestry residues, municipal and industrial wastes. He has the power to determine which technologies are eligible for inclusion and, on the recommendation of the Department of Trade and Industry, to determine the limit for the premium price for each technology band. The aim is to reduce these prices annually as efficiencies of each technology increase until they converge with those from conventional generation. The output targets for each technology is also determined. As a competitive process, the price is not set until all the bids have been submitted and thus the tendering process for the developers is speculative.
103
In 1995/96 the anaerobic digestion of animal manures, supplemented by up to 20% (by dry matter content) from agri-food processing wastes, was permitted as a specific technology or ‘band’ for the first time. As far as it is known, in England and Wales 13 bids were submitted of which six were successful and fell into a price range of 5.1 - 5.2 p/kWh. Previously, there had been two other successful bids — the first in 1990 at 6.9 p/kWh for a 90 kW systems1 and the other in 1994 for a 300 kW plant at 5.23 p/kWh. In consequence, the developers in England and Wales seeking contracts in this Fourth Tranche were aware at the outset that the sale price must not exceed 5.23 p/kWh and, moreover, would be expected to be submitted at a lower level. In Northern Ireland three bids are known to have been submitted in 1995/6 of which one was successful at 7 p/kWh.
The significance of the NFFO procedures and particularly the method of determining the premium prices plays a central role in the development process and needs to be considered in any discussion of the future for AD in the UK. It is in this context that attention can now be turned to specific projects and the approach adopted by the successful ‘developers’ — the community in North Tamar and a newly-formed turn-key company.
THE COMMUNITY APPROACH
North Tamar as a Leader Project area is one of the poorest rural communities in England. It consists of a group of 29 parishes which lie astride the River Tamar, the county boundary between Devonshire and Cornwall. The area is remote, some 90 kms from the nearest mainline station,motorway and main service centres and it is peripheral even within the local administration of North Cornwall and Torridge District Councils The economy is based upon two main sectors — agriculture and tourism, the relative prosperity of which underpin the employment security of the service industries including health, education and leisure provision. Infrastructure costs are high, especially for energy where few businesses are large enough to negotiate favourable tariffs or delivery prices. It has a vulnerable and depressed economy.
Physically North Tamar is disadvantaged with a disproportionate area of lower grade farmland which limits the scope for diversification. At least 80% has required underdrainage in this high rainfall area where the drains flow for at least nine months a year. The failure of tributaries in the upper Tamar catchment to meet water quality standards has been attributed to run off from the fields . More than 84% of the area is under grass and supports over 80,000 dairy and beef cattle and 120,000 sheep. In addition there are over 20,000 pigs and over 1 million poultry, mainly laying hens. The disposal of animal manure had become a serious concern especially for the dairy, pig and poultry farmers and it was in response to these concerns that the North Tamar Business Network initiated the enquiries which led to the decision to build a biogas plant at Holsworthy3.
Despite the large quantity of animal manure in the locality (355 t/dry matter/day) in winter and 63 tonne per day in summer, it is produced on more than 450 farms where the average herd size is under 70 cows. There is clearly the potential to handle the manures as a resources rather than to regard them as problem waste for disposal. However, the small quantities at each farm
104
militate against its exploitation even though an ad process could be used as a multi-purpose approach to reduce pollution risk and odours and at the same time yield energy for on-site use.
Quite apart from the specific limitations on the individual farms, evidence shows that farmscale digesters are uneconomic to operate, of varying reliability and even with 50% grant for waste handling facilities between 1989 and 1994 were unlikely to be an attractive investment for an individual farmer4. In contrast, a large installation located centrally could serve a number of farms and moreover, if situated in Holsworthy, there could be a market for hot water in a nucleus of premises including a small hospital, schools, leisure complex, industrial estate, two residential care homes as well as in the town centre businesses.
Although there was no experience of building large scale or centralised digesters for handling animal manures in the UK, the potential environmental and socio-economic benefits arising for such a scheme in Holsworthy could be particularly attractive — an additional £l-1.5m entering the local economy5. In consequence, the local community through the LEADER project investigated. Danish experience in an intensive three day technical study tour. Visits were made to biogas plants at Ribe, Hodsager and Thorsp, to farms and local planning authorities as well as companies experienced in the design and construction of plants. Operating procedures, technology options, profitability, veterinary issues and financing were all part of the agenda.
The evidence gathered and its interpretation in the North Tamar context confirmed the potential for the construction of a biogas plant similar in size to Thorsp. Provided that the project proved feasible, there were indications that the leakage of expenditure from the area on the purchase of fossil fuels for space heating could be reduced by up to £300,000 if all the hot water output could be utilised. Further reductions could also be achieved through more effective use of the digestate in place of some of the mineral fertilisers.
Environmentally, the plant would be CO2 neutral. There would also be the potential to reduce pollution risk from slurry applications and accidents, less odour, less mileage of dirty roads, of disease risk from slurry spreading, etc. From the community viewpoint, it put into practice the Leader Project motto, “Together we can make it happen”, generating cohesion and understanding, not only in the Steering Group, but also in the wider community.
In fact, the potential contribution of this plant as an instrument for integrated environmental management and rural development had so much to offer this small community, that its progress could not be jeopardised by making it dependant upon speculative applications for funding or markets for the energy and other products. To commission a full feasibility study for the first project of its kind in the UK, the Steering Group secured leader funding matched by other contributions from government departments and agencies, local business people, including the farmers and the District and Town Councils.
Tenders were invited from companies with proven experience in large biogas plant planning and design. The brief specified that the consultants should establish the technical and economic feasibility of building a biogas plant for energy production in the Holsworthy area, such that it can operate on a financially sound basis, not necessarily dependant upon securing a contract under the conditions of the Non-Fossil Fuel Obligation.
As soon as the first stage of the study had indicated the optimum size of the plant, its potential viability and markets, discussions were opened with the local banks, prospective equity
105
partners and the Ministry of Agriculture which administered the Objective 5B Programme for theSouth West Region.
From this point onward the apparent security of obtaining a 15-year inflation-linked contract for the electricity sale through the nffo process assumed a major influence on the project. In so far as the local bank was concerned, its commitment to be associated with the financing of this innovative scheme was unwavering. However, there were risks which it had to take into account:
♦ This would be the first CAD scheme of its kind in the UK. There was no proven experience in such operations and all expertise had to brought into the area.
♦ AD had a poor performance record at the farm scale and even with the ■ performance guarantees which experienced companies could offer, risks were still high for this first project.
♦ The farmers themselves, local businesses, the local authority etc, would all need to show commitment as equity partners and grant aid from the Objective 5B programme would all be needed as evidence to reduce the risk to the bank.
In practice each potential investor was interdependent and each looked to the award of a 15-year inflation-linked power purchase contract to reduce risks. Thus the NFFO process was perceived by investors as virtually mandatory in the absence of any alternative experience. It reduced their risk. For the community, however, it increased the risk because there is no guarantee of a contract despite the time and cost of preparing the bid and, in the area of North Tamar, the feasibility study. Furthermore attention must focus entirely on targeting an electricity price which the dTi determines to be acceptable after all the submissions have been investigated by the Non-Fossil Fuel Purchasing Agency as able secure the prescribed output of renewable energy.
A cohesion develops in the local community as it progress the project and works under increasing pressure to meet the various deadlines for grant applications and the NFFO procedures. There are consequent expectations from being able to calculate the long-term effects offered for employment, reduced expenditure leakage, long-term stability for energy prices and some elements of business overheads, For the community, therefore, the risk of missing an electricity price acceptable to the dn and subsequently the loss of the long-term investment renders the use of the NFFO process in its present form a hazardous venture which few could begin to consider.
THE DEVELOPER’S APPROACH
The developer’s approach forms an interesting alternative. In this case, the company which secured four contracts in the NFFO process (1996) has somewhat different objectives. This is a turn-key company offering design and build facilities to potential customers. The projects are relatively simple in concept, approach to management and financing and designed to meet a growing demand for pollution abatement in areas of intensive livestock production. Their first
106
pilot plant is already operating to demonstrate the technology and test new processes in digestate handling6.
The sites for the plants were chosen strategically as models readily accessible to prospective customers. Feedstock for each is predominantly poultry manure, supplemented in some cases by cattle slurry and at each with the permitted level of agri-food processing residues.
The mesophylic process has been adopted with additional treatment for the control of pathogens, etc. Each plant size is related to the quantity of manure either on site or within a 10 km radius, but also takes into account the demonstration of a range of sizes (0.5, 0.6, 1.0, 2.0 MW). All hot water will be used for processes on the site or adjacent to the plant on agri-industrial estates in rural areas.
The company has three main objectives
♦ to change the negative attitude to AD in the UK♦ to make optimum use of farm manure while protecting the environment♦ to build a UK industry using local labour directly in the construction and
management
In this instance, the NFFO process has three advantages. As for North Tamar, a contract is bankable. The application process focuses the mind to plan around deadlines and the award of a contract is good publicity — a free advertisement. It also has disadvantages; it is a protracted (up to 18 months), expensive process, incurring outlays to register, for the estimates of grid connection charges, etc, and the award of a contract is virtually a lottery, dependent upon the cutoff price determined by the dn. In these circumstances, it limits company security in planning Research and Development strategies and scope for marketing its products.
DISCUSSION
The NFFO has raised the profile of AD for the first time and focused attention on the new initiatives within the UK. For a developer or turn-key company it provides a “shop window”. Furthermore with six successful schemes in England and one in Northern Ireland, it has stimulated government to put forward two more initiatives. Good Practice Guidelines have been prepared to assist prospective purchasers, planning authorities and environmental agencies7 and the national market developmental strategy has been commissioned from British Biogen to promote capture of the energy market.
For local communities seeking to use the AD process as an instrument for integrated environmental management and rural development, it has partially impeded progress towards the optimum exploitation of the process potential, In fact, the competitive, commercial tendering procedures were designed to stimulate renewable energy technologies for power production, not as instruments for rural development. In this respect, therefore, it is an inappropriate and high risk tool for use by rural communities seeking to optimise their own resources for sustainable long
107
term integrated rural development. An alternative approach capable of giving confidence to bankers is urgently required.
Current obstacles in the co-digestion of animal manures and local agri-food residues and their optimum exploitation for sustainable development could be lessened by increasing the flexibility of the NFFO process, publication of the target prices and a less prescriptive definition of feedstock combinations.
The current NFFO process has, in fact, stimulated interest in the AD process and enabled seven schemes to enter the energy market. However, the full exploitation of what ad has to offer requires an alternative approach whereby it is explored as a basis for integrated environmental management and long-term sustainable development. What is more, its adoption cannot be expected to be underpinned continuously by capital grants, subsidised energy prices or indeed the existence of a subsidy culture.
A third major UK initiative therefore has been crystallizing over the last two years whereby the conditions are identified:
♦ To enable the AD process for energy production to be used as a catalyst for integrated pollution control, environmental management and socioeconomic development without the need for subsidy;
♦ To bring together and apply the unique combination of Danish technological expertise and UK rural development experience so as to reverse the current approach to biogas plant sales where the customer pays the quoted price to where the construction company designs to capture a competitive energy market.
The county of Somerset in South West England was chosen as the model area because it has:
♦ Some of the highest concentrations of animal manure in the UK;♦ A concentration of agri-food processing industries;♦ Extensive tracts designated as Environmentally Sensitive Areas, Nitrate
Vulnerable Zones, Sites of Special Scientific Interest, etc, where there are already significant concerns about slurry management and water pollution;
♦ Large numbers of small isolated rural communities vulnerable to any increases in energy costs.
This project has already been approved by the altener Programme and is now awaiting the availability of the EU contribution to fund the beginning of its work.
108
REFERENCES
1. AJ. Brewer and DJ. Baldwin, Anaerobic digester performance at Hanford Farms, Dorchester (ETSU B/M3/00358/17/REP, 2994) 5
2. National Rivers Authority, The freshwater tributaries catchment management plan action plan (NRA South Western Region, 1996) 2-3
3. C.T. Lukehurst, "The economic and social implications of exploiting biomass resources in rural areas of the Northern States of the European Union" in Biomass for energy, environment, agriculture and industry, ed Ph. Chartier, A.A.C.M. Beenackers and G. Grassi (Oxford, Pergamon, 1993) 2135- 2140
4. D.J. Baldwin, Anaerobic digestion in the UK: a review of current practice (ETSU B/FW/00239/REP, 1993) 22-31
5. C.T. Lukehurst, "Agricultural waste products; a renewable energy study" (unpublished report prepared for the North Tamar LEADER Project, May 1994), 34-40
6. Information provided by courtesy of Agtech Ltd.7. British Biogen, Good practice guidelines. Anaerobic digestion of farm and food processing residues,
the development of a sustainable industry (British Biogen/ETSU, 1997)
ACKNOWLEDGEMENTS
The author would like to acknowledge the assistence provided by Jens Bo Holm-Nielsen and the Danish Energy Agency in organising the study tour (1995) and the North Tamar Business
Network for allowing the presentation of its project.
109
Treatment and Trade of Organic Manures in the Future
Ir. J.C.A.M. Verkuyten, President European Manure Association (EMA), Managing Director Mestbureau oost (MBO), P.O. Box 828, 7400 AVDeventer, The Netherlands
PREFACE
The agricultural cycle has become more and more complex. In the different European countries and regions strong specialisation has occurred. This specialisation leads to more by-products, that cannot be used by the producers themselves. Often producers do not look at these byproducts as products they have to market successfully, but as waste they have to get rid of.
In the past, technology has been focused on keeping waste disposal costs to a minimum, by keeping the amount of waste produced as low as possible and by discharging the waste against the lowest prices possible.
Today, investments related to treating organic manures can not deliver the required pay back without revenues from the produced derivates. This means that selling the derivates becomes important.
The manure market is dominated by both low prices and low quality. This current market does not favour the sustainable use of manures, nor does it favour innovation. First step in improving both manure quality and manure utilisation is optimizing the manure supply chain. A powerful instrument for this optimizing forms "certification of the links within the chain".
The successful marketing of the derivates requires technological and organisational innovation. A powerful instrument in successful marketing is "certification". Through certification of the supply chain, as well as certification of the products, upgrading of the products is possible, leading to economical viable investments in waste treatment. Product certification leads furthermore to the possibility of positioning the products. A positive positioning of the productsk, differentiating it from "waste", is essential for the desired investments by market parties.
In this paper new ideas and developments on the Dutch manure market are presented. A new technology (v. Aspert plant), including the marketing concept as the derivates produced are presented. A profile on a manure brokerage organisation (MBO) and ,on the last year founded, European Manure association (EMA) are added.
110
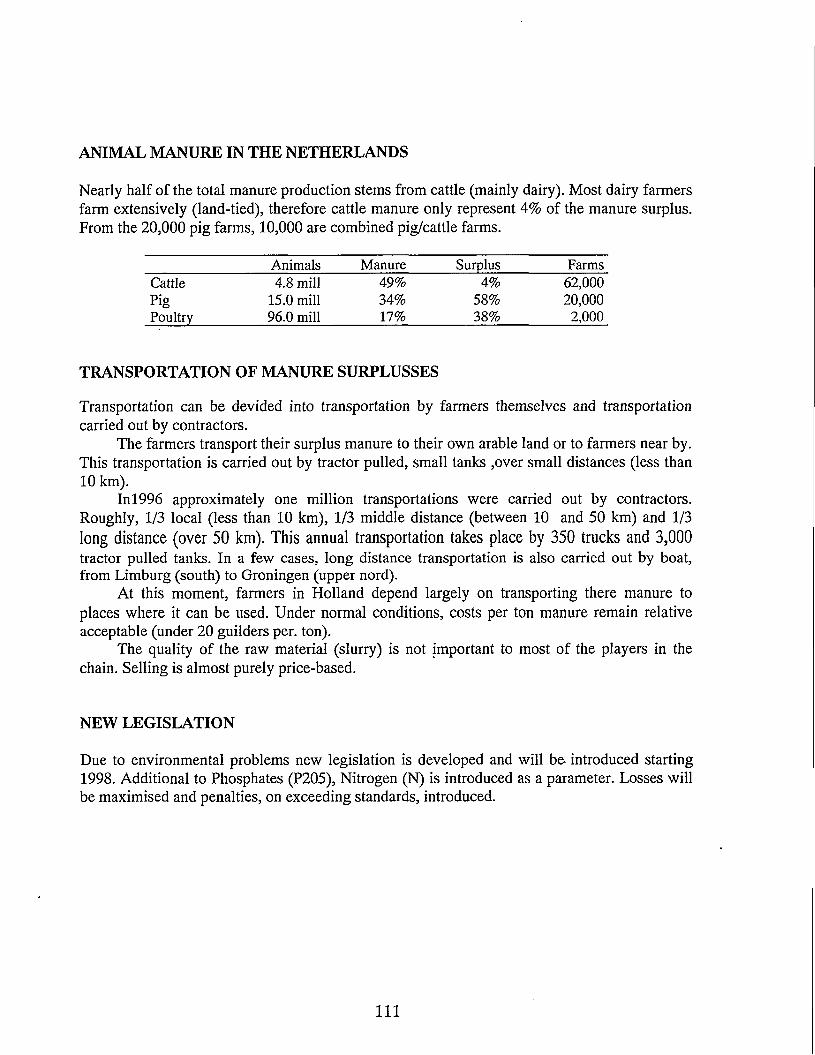
ANIMAL MANURE IN THE NETHERLANDS
Nearly half of the total manure production stems from cattle (mainly dairy). Most dairy farmers farm extensively (land-tied), therefore cattle manure only represent 4% of the manure surplus. From the 20,000 pig farms, 10,000 are combined pig/cattle farms.
Animals Manure Surplus FarmsCattle 4.8 mill 49% 4% 62,000Pig 15.0 mill 34% 58% 20,000
Poultry 96.0 mill 17% 38% 2,000
TRANSPORTATION OF MANURE SURPLUSSES
Transportation can be devided into transportation by farmers themselves and transportation carried out by contractors.
The farmers transport their surplus manure to their own arable land or to farmers near by. This transportation is carried out by tractor pulled, small tanks ,over small distances (less than 10 km).
Inl996 approximately one million transportations were carried out by contractors. Roughly, 1/3 local (less than 10 km), 1/3 middle distance (between 10 and 50 km) and 1/3 long distance (over 50 km). This annual transportation takes place by 350 trucks and 3,000tractor pulled tanks. In a few cases, long distance transportation is also carried out by boat, from Limburg (south) to Groningen (upper nord).
At this moment, farmers in Holland depend largely on transporting there manure to places where it can be used. Under normal conditions, costs per ton manure remain relative acceptable (under 20 guilders per. ton).
The quality of the raw material (slurry) is not important to most of the players in the chain. Selling is almost purely price-based.
NEW LEGISLATION
Due to environmental problems new legislation is developed and will be- introduced starting 1998. Additional to Phosphates (P205), Nitrogen (N) is introduced as a parameter. Losses will be maximised and penalties, on exceeding standards, introduced.
Ill
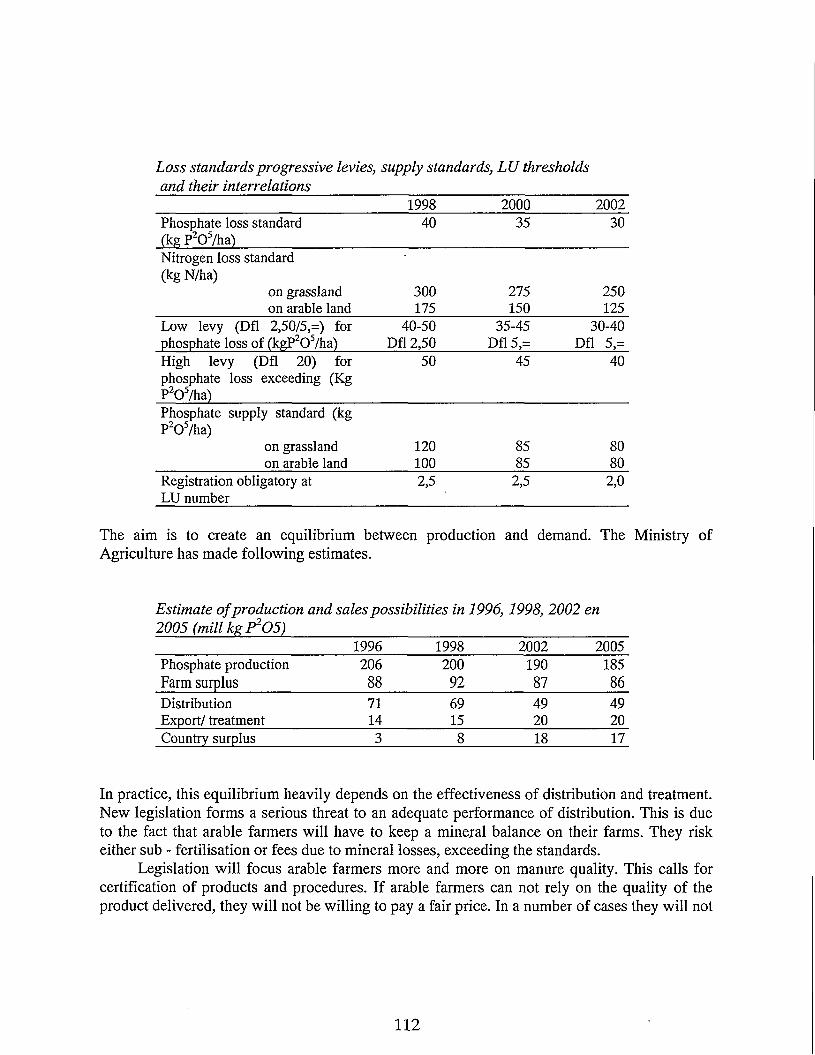
Loss standards progressive levies, supply standards, LU thresholds and their interrelations
1998 2000 2002
Phosphate loss standard 40 35 30(kg P205/ha)Nitrogen loss standard(kg N/ha)
on grassland 300 275 250on arable land 175 150 125
Low levy (Dfl 2,50/5,=) for 40-50 35-45 30-40phosphate loss of (kgP205/ha) Dfl 2,50 Dfl 5,= Dfl 5,=High levy (Dfl 20) for 50 45 40phosphate loss exceeding (KgP205/ha)Phosphate supply standard (kgP205/ha)
on grassland 120 85 80on arable land 100 85 80
Registration obligatory at 2,5 2,5 2,0
LU number
The aim is to create an equilibrium between production and demand. The Ministry of Agriculture has made following estimates.
Estimate of production and sales possibilities in 1996,1998, 2002 en 2005 (mill kg P205)
1996 1998 2002 2005Phosphate production 206 200 190 185Farm surplus 88 92 87 86Distribution 71 69 49 49Export/ treatment 14 15 20 20
Country surplus 3 8 18 17
In practice, this equilibrium heavily depends on the effectiveness of distribution and treatment. New legislation forms a serious threat to an adequate performance of distribution. This is due to the fact that arable farmers will have to keep a mineral balance on their farms. They risk either sub - fertilisation or fees due to mineral losses, exceeding the standards.
Legislation will focus arable farmers more and more on manure quality. This calls for certification of products and procedures. If arable farmers can not rely on the quality of the product delivered, they will not be willing to pay a fair price. In a number of cases they will not
112
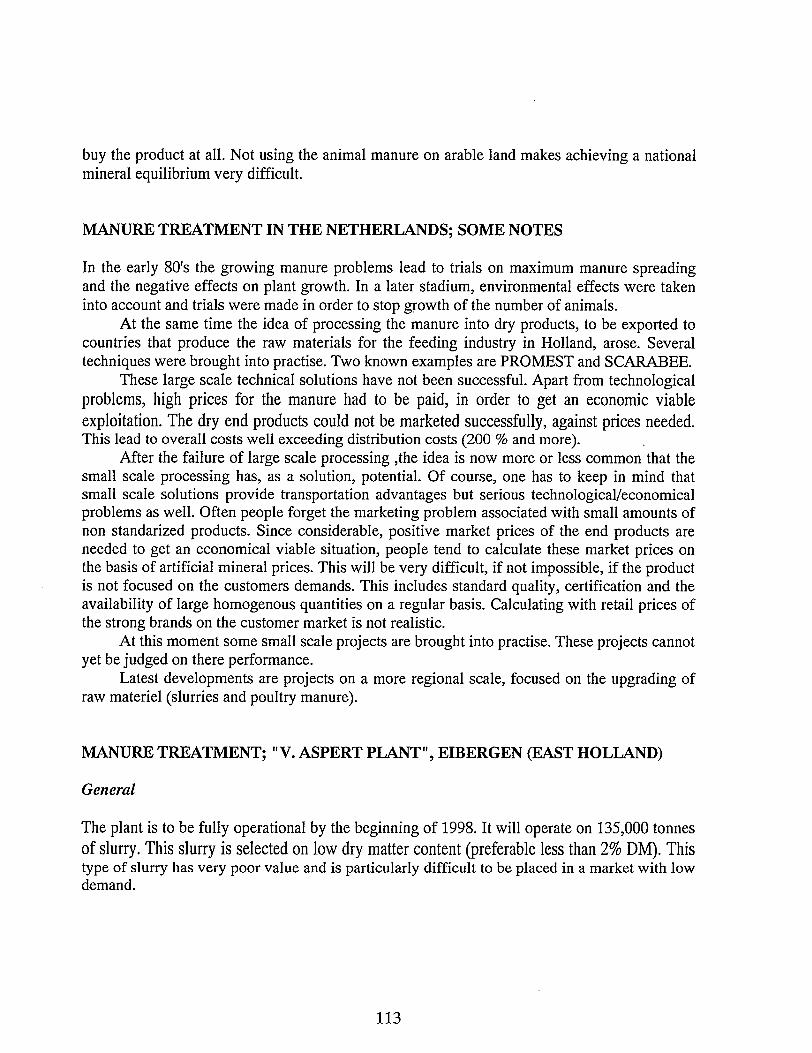
buy the product at all. Not using the animal manure on arable land makes achieving a national mineral equilibrium very difficult.
MANURE TREATMENT IN THE NETHERLANDS; SOME NOTES
In the early 80's the growing manure problems lead to trials on maximum manure spreading and the negative effects on plant growth. In a later stadium, environmental effects were taken into account and trials were made in order to stop growth of the number of animals.
At the same time the idea of processing the manure into dry products, to be exported to countries that produce the raw materials for the feeding industry in Holland, arose. Several techniques were brought into practise. Two known examples are PROMEST and SCARABEE.
These large scale technical solutions have not been successful. Apart from technological problems, high prices for the manure had to be paid, in order to get an economic viableexploitation. The dry end products could not be marketed successfully, against prices needed.This lead to overall costs well exceeding distribution costs (200 % and more).
After the failure of large scale processing ,the idea is now more or less common that the small scale processing has, as a solution, potential. Of course, one has to keep in mind that small scale solutions provide transportation advantages but serious technological/economical problems as well. Often people forget the marketing problem associated with small amounts of non standarized products. Since considerable, positive market prices of the end products are needed to get an economical viable situation, people tend to calculate these market prices on the basis of artificial mineral prices. This will be very difficult, if not impossible, if the product is not focused on the customers demands. This includes standard quality, certification and the availability of large homogenous quantities on a regular basis. Calculating with retail prices of the strong brands on the customer market is not realistic.
At this moment some small scale projects are brought into practise. These projects cannot yet be judged on there performance.
Latest developments are projects on a more regional scale, focused on the upgrading of raw materiel (slurries and poultry manure).
MANURE TREATMENT; "V. ASPERT PLANT ", EIBERGEN (EAST HOLLAND)
General
The plant is to be fully operational by the beginning of 1998. It will operate on 135,000 tonnesof slurry. This slurry is selected on low dry matter content (preferable less than 2% DM). Thistype of slurry has very poor value and is particularly difficult to be placed in a market with low demand.
113
The ingoing slurry is transported to the plant over an average of 15 kilometres, and is concentrated to 13,000 - 15,000 tonnes concentrate (depending on the ingoing dry matter content). The concentrate is a fluid, with a maximum of 20% DM. It therefore can be distributed using the extensive "fluid-distribution network", available in Holland.
The technology used consists of "Mechanical vapour recompression" combined with "reversed osmosis".
Marketing of the concentrate
MBO sells large volumes of pig slurry to crop growers in the northern part of Holland. This slurry is distributed either directly to the customer or through large storage facilities (2,500 m3) in the north.
The storage facilities create not only logistic advantages but also possibilities for upgrading the product quality.
Our customers become, influenced by legislation, more and more demanding concerning quality (guarantees). They want a homogenous product free of diseases and active seeds. The mineral content should be known, guaranteed and stable.
The concentrate will play an important role by mixing it with raw material in the storage facilities.
The potential value of the concentrate can only be cashed by certification and quality programmes. A first, relative simple way of improving manure quality is by optimizing the supply chain.
The manure is dominated by both low prices and low quality. This current market does not favour the sustainable use of manures, nor does it favour innovation. First step in improving both manure quality and manure utilisation is improving the relationships between the links in the manure supply chain. The different links in the chain have to be certified in order to get a reliable, overall optimal result.
114
Biogas/Fossil gas options: The future for integration of biogas in the natural gas sector in Denmark and in Europe
Anker Biering Jensen, Planner, Naturgas Midt-Nord, Vognmagervej 14, DK-8800 Viborg,Denmark
INTRODUCTION
Naturgas Midt-Nord is a company with the purpose of distributing and selling natural gas. The company is owned by 73 municipalities in the 4 counties in the northern part of Jutland. In this respect we cover almost 50% of the Danish farming areas. Since the company was established in 1983, almost 775 kilometres of 40 bar high-pressure pipes and 3,500 kilometres of 4 bar low-pressure pipes have been built. From time to time we have discussed the matter of biogas in the company. In relation to the distribution of natural gas, the integration of biogas could either be seen as a threat or a possibility to expand our business. It is still not quite clear for us, what part we should play with regards to biogas integration.
ENERGY 21" AND BIOGAS
In early Spring 1996, the Danish Government presented the fourth Danish energy plan - “Energy 21” - which aimed to reduce national CO2 emissions by 20% no later than year 2005 and by 50% no later than year 2030 compared to the 1988 level.
Today the production of biogas is around 2 PJ/year. In 1995 the government expected theproduction and exploitation of biogas and landfill gas to double before year 2000. After that itis expected that the production continues to expand in the same rate, corresponding to a total increase of 4 PJ/year in 2005. This could reduce the expected sale of natural gas by around 100 mil. m3/year in Denmark.
On July the 1st. 1997 the government decided to improve the possibilities of adjusting biogas production to the energy supply. To the natural gas companies this meant:
• That gas produced from biomass gained access to areas assigned to natural gas• That municipalities must give first priority to heating from biogas, landfill gas and gas
produced through other biomass• That single towns using both natural gas and biogas in its district heating systems today
should continue doing so until it is both technically and economically possibly to change to biomass produced CHP, or until the heating plants must be changed or renovated.
115
HOW CAN A GAS COMPANY TAKE PART IN IMPLEMENTING THE BIOMASS IN THE ENERGY SUPPLY?
This can be done by:
° delivering maps for planning ° mapping out energy needs ° planning district heating projects ° buying and selling the biogas ° undertaking cleaning and/or upgrading of the biogas ° delivering supplementary gas back-up• transporting biogas and running the gas net° ownership/part-ownership of biogas-/district heating plants• running biogas-/district heating plants• surveying biogas-/district heating plants
WHAT ARE THE POSSIBILITIES OF SELLING THE BIOGAS IN OUR DISTRICT?
Biogas heating can now be established in areas assigned to natural gas. Due to the Danish tax system it would however only be the district heating plants, that would be interested in exploiting the biogas. Almost all district heating plants could exploit biogas - the only exceptions are plants using turbines.
Some plants are so large, that it would be unrealistic to find sufficient biomass within a reasonable geographical area.In general the production of biogas is stable throughout the year, whereas the possibility for the district heating plants of selling the gas varies a lot from season to season. If adjustments are made regarding this fact, the sales potential is estimated to approx. 20% of the total district heating sales or approx. 100 mil. m3. The costs have not been calculated.
Furthermore around 25 mil. m3 gas/year could be sold directly to the natural gas net. This implies an upgrade to 95% CH4, and the costs of doing this are estimated to around 1 DKK/m3
gas.The need for superseding natural gas in the district heating systems could be reduced
considerably,-if biogas from pig manure is presumed used in pig farms and in the small villages with no joint heating system. It is estimated that 40 - 50 mil. m3 gas/year could be sold here.
BIOGAS AS A THREAT FOR THE NATURAL GAS COMPANY
If large quantities of natural gas are superseded by biogas, the profit of the natural gas company would be reduced. Naturgas Midt-Nord has a debt of approx. 2.9 billion DKK, and
116
this debt must be paid off. If this is not possible, the municipalities vouches for a possible deficit.
ECONOMIC CONSEQUENCES
The biogas supplier: The sales price for biogas is determined through individual agreements between the biogas supplier and the buyer. The price corresponds to the price of the fuel, that the biogas is replacing - in this instance natural gas. The State subsidy for electricity production from biomass is 0.27 DKK/KWh unlike the subsidy for electricity produced from natural gas which is between 0.07 and 0.10 DKK/KWh.
The economy: For society the biogas production would mean higher subsidies, and the income for the natural gas companies would be reduced proportionally to the reduction in sales of natural gas.
The gas company: For the gas company a substitution of natural gas with biogas would mean a reduced sales, and thus a deterioration of the total economy of the company. The natural gas companies in Denmark have made contracts with the district heating companies regarding their entire energy needs incl. needs at peak hours. When biogas is introduced at a district heating plant, it covers the basic needs. The sales potential covering the remaining needs inch needs at peak hours does not always reflect the effect needed.
The district heating plant: As the price for biogas is made with reference to natural gas, the district heating plant is normally not effected by the change in fuel.
End user: Is not effected by the change in fuel.
THE FUTURE ROLE OF THE NATURAL GAS COMPANY
Traditionally the natural gas company has looked upon other fuels as competitors. The goal for the company has been to pay back its debts as quickly as possible. That goal does not compare with the decision of the government to use biogas within the areas assigned to natural gas.We could chose being passive with the result that development in this area is happeningwithout our participation and influence.
We could also chose to look at it as a new business area, in which we actively contribute to increased use of biogas. This would no doubt affect the economy of the gas company as biomass project are much more risky than natural gas projects. Increased distribution of biogas requires comprehensive knowledge about organising, planning, marketing and mass production. We already have that knowledge. The gas company has the expertise. It only requires that we are willing and are allowed to participate.
117
FISCAL INSTRUMENTS FOR THE FINANCIAL SUPPORT OF RENEWABLES IN THE NETHERLANDS
Ir. Kees W. Kwant, J. Iepsma and ing. A.E. Pfeiffer, Novem, Netherlands Agency for Energy
and the Environment, P. 0. Box 8242, 3503 RE Utrecht, The Netherlands
INTRODUCTION
A new Dutch government came into office in 1993. A coalition of the Liberals (close to Conservatives in other countries), Democrats and Social Democrats decided on the one hand to reduce government spending such as subsidies on renewables and on the other hand to introduce an energy tax and other fiscal instruments, aimed at supporting the shift to ecologising the economy. To date, the following financial support instruments have been introduced:
1. Green Funds (started in 1995)Money are made available at a lower interest rate (about 1.5 percentage point) for so-called 'green projects'. Most renewable energy projects are seen as green projects. Since the end of 1996, the former called green funds can make partly (cheap) money available for energy efficient and sustainable buildings, as a green mortgage.
2a. Accelerated Depreciation on Environmental Investments (VAMIL)The VAMIL scheme offers to entrepreneurs a financial advantage, because accelerated depreciation is permitted on equipment which is given on the VAMIL list. The company can write off the investment at earlier date than normal, reducing the company profit and tax payments. Environmental friendly machinery and most renewable energies are on the VAMIL list.
2b. Energy Investment Relief SchemeInvestments in technologies on the EIA list may be offset against taxable profit at a rate varying from 40% to 52 % of the investment amount.
3. Energy Tax for small households and Small and Middle-sized EnterprisesHouseholds and Small and Middle-sized Enterprises (SME) pay an energy tax on electricity. (3.5 cents/kWhe) and natural gas, when the consumption exceeds a minimum demand. This tax is paid to the utility companies, who in turn pass this on to the taxation authorities (Ministry of Finance). However, utility companies are exempted from paying tax on
118
energy generated from renewables. The utility companies have to pay this money to the generator of renewable electricity, instead.
4. Green ElectricityGreen electricity is not a fiscal instrument, but rather a commercial way of selling renewableenergy. Some utility providers start selling green electricity at a premium rate of about 4 cents above the normal price of 28.5 cents/kWhe. The additional sum is used to pay the producers of renewable electricity.
5. Proposed Fiscal InstrumentsGreen VAT; Specific Renewable Energy equipment can be put at the low VAT tariff rate of 6
% instead of the regular 17.5 %. In its energy bill of December 1995, the government proposed putting 'green electricity' at the 'green VAT'. This would make the green electricity price for the consumer almost equal to the normal price.
1. GREEN FUNDS
In the Netherlands, the new green investment scheme became operational in January 1995. The idea is that private income from green investment, the dividend or interest on these specific green funds, should not be subject to income tax. This allows Green Funds to offer a lower interest rate to the public and thereby make the money available at a lower interest rate also to the green projects.
Green Funds are under the supervision of the Dutch Central Bank and they are obliged to invest a minimum of 70% of their capital in Green Projects. A maximum period of two years is allowed for the acquisition of the minimum of 70% target on capital in green projects. Green projects include the development of country estates, woodland and renewable energies. Table Igives an overview of the categories of energy-projects within green funding.
i
119
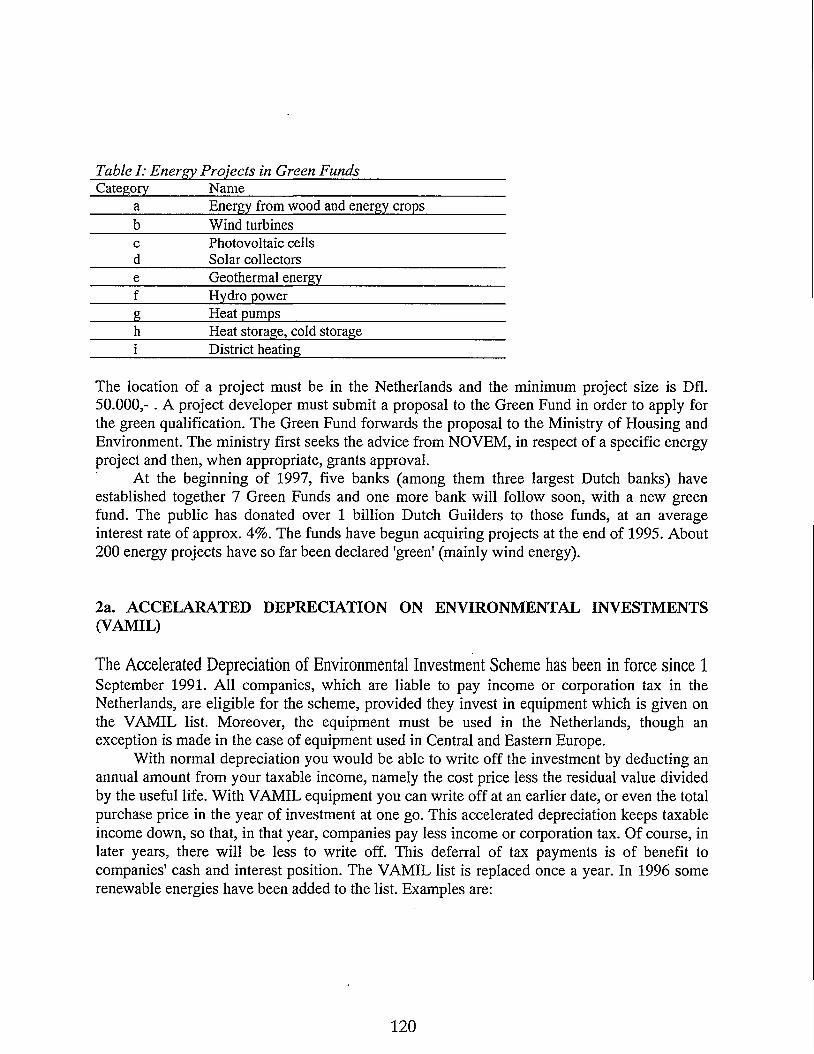
Table I: Energy Projects in Green FundsCategory Name
a Energy from wood and energy cropsb Wind turbinesc Photovoltaic cellsd Solar collectorse Geothermal energyf Hydro powerg Heat pumpsh Heat storage, cold storagei District heating
The location of a project must be in the Netherlands and the minimum project size is Dfl. 50.000,-. A project developer must submit a proposal to the Green Fund in order to apply for the green qualification. The Green Fund forwards the proposal to the Ministry of Housing and Environment. The ministry first seeks the advice from NOVEM, in respect of a specific energy project and then, when appropriate, grants approval.
At the beginning of 1997, five banks (among them three largest Dutch banks) have established together 7 Green Funds and one more bank will follow soon, with a new green fund. The public has donated over 1 billion Dutch Guilders to those funds, at an average interest rate of approx. 4%. The funds have begun acquiring projects at the end of 1995. About 200 energy projects have so far been declared 'green' (mainly wind energy).
2a. ACCELARATED DEPRECIATION ON ENVIRONMENTAL INVESTMENTS (VAMIL)
The Accelerated Depreciation of Environmental Investment Scheme has been in force since 1 September 1991. All companies, which are liable to pay income or corporation tax in the Netherlands, are eligible for the scheme, provided they invest in equipment which is given on the VAMIL list. Moreover, the equipment must be used in the Netherlands, though an exception is made in the case of equipment used in Central and Eastern Europe.
With normal depreciation you would be able to write off the investment by deducting an annual amount from your taxable income, namely the cost price less the residual value divided by the useful life. With VAMIL equipment you can write off at an earlier date, or even the total purchase price in the year of investment at one go. This accelerated depreciation keeps taxable income down, so that, in that year, companies pay less income or corporation tax. Of course, in later years, there will be less to write off. This deferral of tax payments is of benefit to companies' cash and interest position. The VAMIL list is replaced once a year. In 1996 some renewable energies have been added to the list. Examples are:
120
- biomass gasification systems- anaerobic digestion systems- photovoltaic power systems- solar water heaters- wind-turbines- heat pumps.
2b. ENERGY INVESTMENT RELIEF SCHEME
Tax relief on investments in energy conservation technologies and renewable energytechnologies (EIA) came into force on 1st January 1997. Provided they appear on a qualifyinglist, investments in these technologies may be offset against taxable profit at a rate varying from 40 to 52% of the investment amount. Each investment is subject to a maximum of 50 Dfl million. This therefore improves the return on investment. For small scale investments, the existing investment relief (VAMIL) may be applied in addition to the energy investment relief.
3. REGULATING ENERGY TAX
The Regulating Energy Tax came into effect on January 1st 1996. The tax applies to electricity, natural gas and some heating oils. Only small consumers and the SMEs pay this tax. Industry and farmers with greenhouses are exempt from payment for reason of international competition. A World wide or European Energy Tax could broaden the applicability in the future. The energy tax is paid to the utilities, who in turn pay to the taxation authority (Ministry of Finance). However, utilities are exempted from payment for energy generated from renewables. Instead, they have to pay this money to the generator of renewable energy; windmills, hydro or biomass.
Energy from waste is seen as renewable as long as it does not contain plastics. This means that waste incinerators are excluded from this scheme while energy from waste wood is seen as renewable energy. Also the conversion of waste to natural gas is seen as renewable energy.
At the moment negotiations have been started up between the Dutch government and theDutch waste processing association, dealing with the incineration of MSW and the RegulatingEnergy Tax. It is the intention the energy originating from the organic fraction of MSW will be seen as an renewable form of energy. Through this measure, it will be possible to promote efficiency improvements in the field of waste incineration. Examples are: combined heat and power, the application of heat pumps and organic, Rankine cylces and the integration of waste incinerators with fossil fired power plants.Households and SMEs pay the tax on amounts above a minimum demand of 800 kWhe and 800 m3 of natural gas. The truly energy-efficient household does not pay any tax at all! The energy tax is implemented in a fiscally neutral manner, by lowering the income tax for households and SMEs.
121
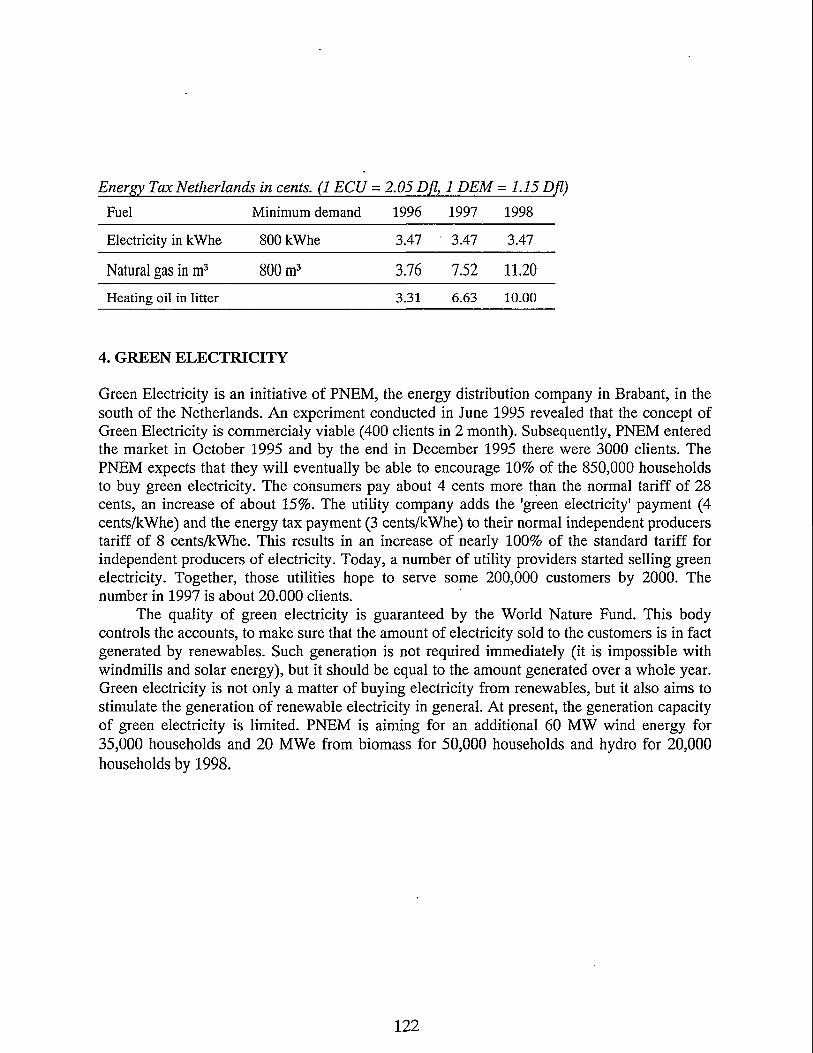
Energy Tax Netherlands in cents. (1 ECU = 2.05 Dfl, 1 DEM = 1.15 Dfl)
Fuel Minimum demand 1996 1997 1998
Electricity in kWhe 800 kWhe 3.47 • 3.47 3.47
Natural gas in m3 800 m3 3.76 7.52 11.20
Heating oil in litter 3.31 6.63 10.00
4. GREEN ELECTRICITY
Green Electricity is an initiative of PNEM, the energy distribution company in Brabant, in the south of the Netherlands. An experiment conducted in June 1995 revealed that the concept of Green Electricity is commercialy viable (400 clients in 2 month). Subsequently, PNEM entered the market in October 1995 and by the end in December 1995 there were 3000 clients. The PNEM expects that they will eventually be able to encourage 10% of the 850,000 households to buy green electricity. The consumers pay about 4 cents more than the normal tariff of 28 cents, an increase of about 15%. The utility company adds the 'green electricity' payment (4 cents/kWhe) and the energy tax payment (3 cents/kWhe) to their normal independent producers tariff of 8 cents/kWhe. This results in an increase of nearly 100% of the standard tariff for independent producers of electricity. Today, a number of utility providers started selling green electricity. Together, those utilities hope to serve some 200,000 customers by 2000. The number in 1997 is about 20.000 clients.
The quality of green electricity is guaranteed by the World Nature Fund. This body controls the accounts, to make sure that the amount of electricity sold to the customers is in fact generated by renewables. Such generation is not required immediately (it is impossible with windmills and solar energy), but it should be equal to the amount generated over a whole year. Green electricity is not only a matter of buying electricity from renewables, but it also aims to stimulate the generation of renewable electricity in general. At present, the generation capacity of green electricity is limited. PNEM is aiming for an additional 60 MW wind energy for35,000 households and 20 MWe from biomass for 50,000 households and hydro for 20,000 households by 1998.
122
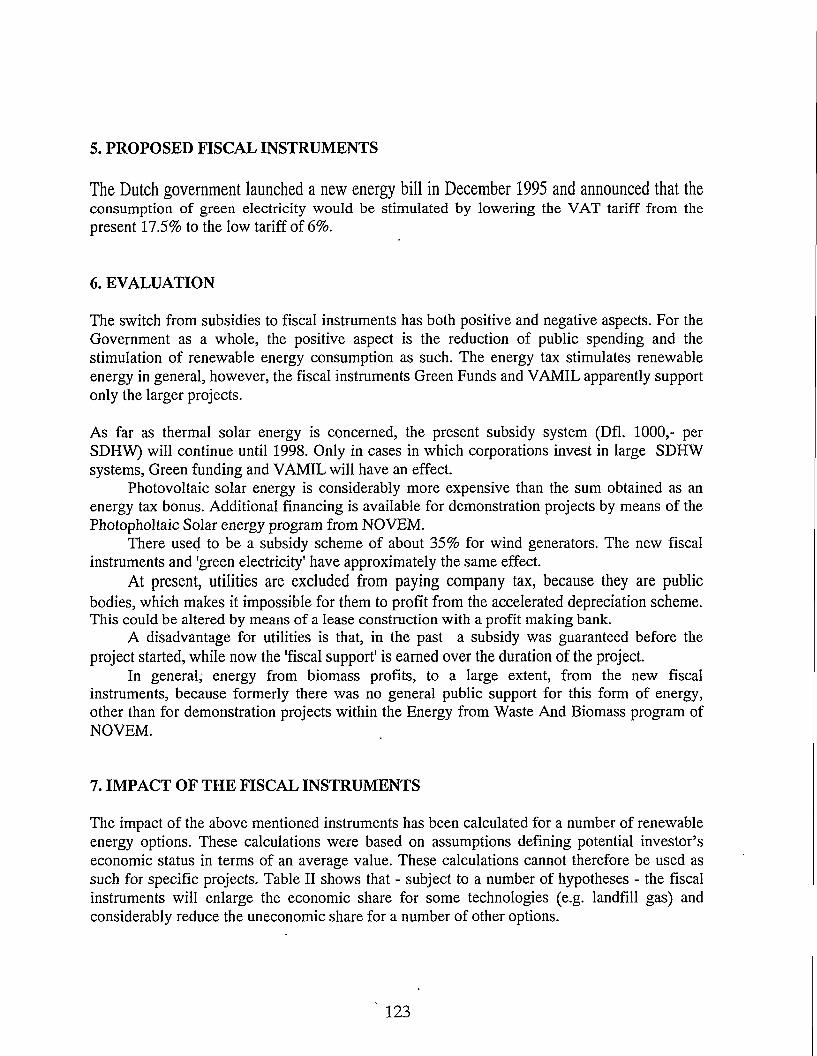
5. PROPOSED FISCAL INSTRUMENTS
The Dutch government launched a new energy bill in December 1995 and announced that theconsumption of green electricity would be stimulated by lowering the VAT tariff from the present 17.5% to the low tariff of 6%.
6. EVALUATION
The switch from subsidies to fiscal instruments has both positive and negative aspects. For the Government as a whole, the positive aspect is the reduction of public spending and the stimulation of renewable energy consumption as such. The energy tax stimulates renewable energy in general, however, the fiscal instruments Green Funds and VAMIL apparently support only the larger projects.
As far as thermal solar energy is concerned, the present subsidy system (Dfl. 1000,- per SDHW) will continue until 1998. Only in cases in which corporations invest in large SDHW systems, Green funding and VAMIL will have an effect.
Photovoltaic solar energy is considerably more expensive than the sum obtained as an energy tax bonus. Additional financing is available for demonstration projects by means of the Photopholtaic Solar energy program from NOVEM.
There used to be a subsidy scheme of about 35% for wind generators. The new fiscal instruments and 'green electricity' have approximately the same effect.
At present, utilities are excluded from paying company tax, because they are public bodies, which makes it impossible for them to profit from the accelerated depreciation scheme. This could be altered by means of a lease construction with a profit making bank.
A disadvantage for utilities is that, in the past a subsidy was guaranteed before the project started, while now the 'fiscal support' is earned over the duration of the project.
In general, energy from biomass profits, to a large extent, from the new fiscal instruments, because formerly there was no general public support for this form of energy, other than for demonstration projects within the Energy from Waste And Biomass program of NOVEM.
7. IMPACT OF THE FISCAL INSTRUMENTS
The impact of the above mentioned instruments has been calculated for a number of renewable energy options. These calculations were based on assumptions defining potential investor’s economic status in terms of an average value. These calculations cannot therefore be used as such for specific projects. Table II shows that - subject to a number of hypotheses - the fiscal instruments will enlarge the economic share for some technologies (e.g. landfill gas) and considerably reduce the uneconomic share for a number of other options.
123
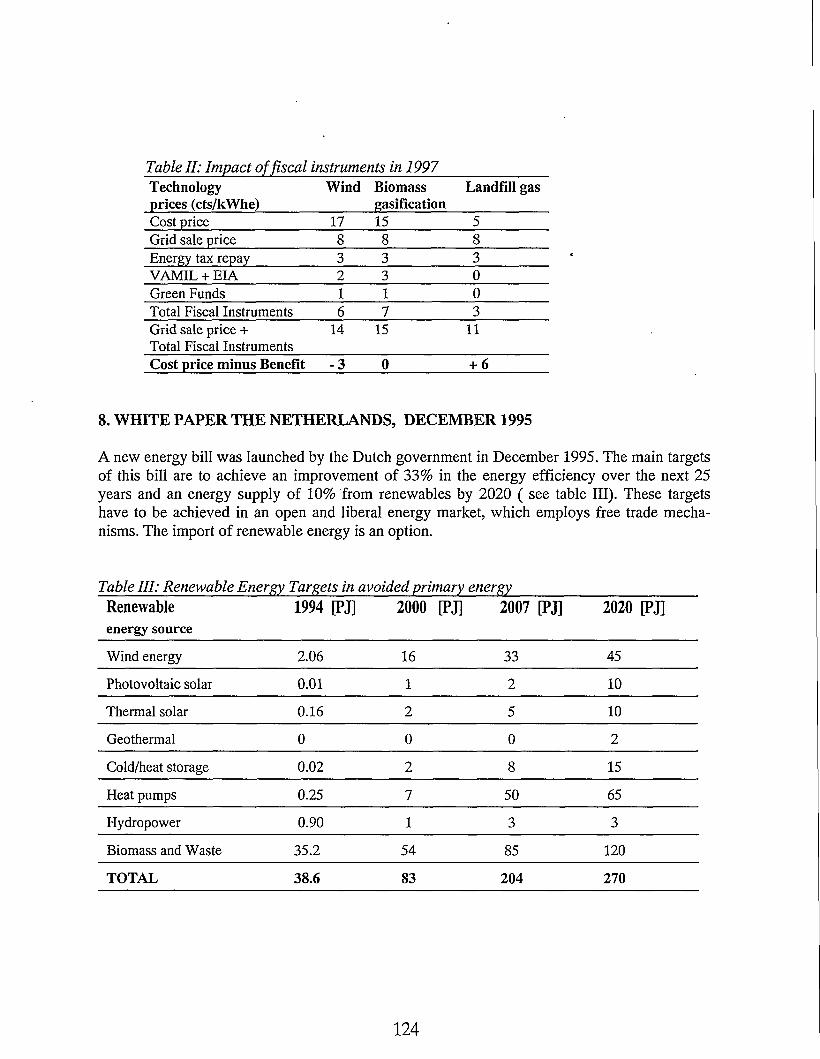
Table II: Impact of fiscal instruments in 1997
Technology prices (cts/kWhe)
Wind Biomassgasification
Landfill gas
Cost price 17 15 5Grid sale price 8 8 8Energy tax repay 3 3 3VAMIL + EIA 2 3 0Green Funds 1 1 0Total Fiscal Instruments 6 7 3Grid sale price +Total Fiscal Instruments
14 15 11
Cost price minus Benefit -3 0 + 6
8. WHITE PAPER THE NETHERLANDS, DECEMBER 1995
A new energy bill was launched by the Dutch government in December 1995. The main targets of this bill are to achieve an improvement of 33% in the energy efficiency over the next 25 years and an energy supply of 10% from renewables by 2020 ( see table III). These targets have to be achieved in an open and liberal energy market, which employs free trade mechanisms. The import of renewable energy is an option.
Table III: Renewable Energy Targets in avoided primary energy
Renewable
energy source1994 [PJ] 2000 [PJ] 2007 [PJ] 2020 [PJ]
Wind energy 2.06 16 33 45
Photovoltaic solar 0.01 1 2 10
Thermal solar 0.16 2 5 10
Geothermal 0 0 0 2
Cold/heat storage 0.02 2 8 15
Heat pumps 0.25 7 50 65
Hydropower 0.90 1 3 3
Biomass and Waste 35.2 54 85 120
TOTAL 38.6 83 204 270
124
An action plan for renewable energy has been formulated in the energy bill. This action plan includes the financial support, as mentioned above, the intensification of Research and Development and Demonstration Projects. The Dutch government has made additional financial means available for this policy. The fiscal incentives for renewables may reduce the government income by 175 million guilders per year, while additional 95 million Dutch guilders is available for Research, Development and Demonstration.
125