the full portfolio - eprimydocs.epri.com/.../assessmentbriefs/the_full_portfolio.pdf · assessment...
TRANSCRIPT

36 E L E C T R I C P E R S P E C T I V E S
o lessen the potential threats of climate change, many scientists and policymakers envision large-scale reductions in carbon dioxide (CO2) emissions—the goal is to ultimately stabilize global concentrations of CO2, the most common greenhouse gas (GHG). Achieving such reduc-tions, however, presents major technical, economic, regulatory and policy challenges. Reconciling those challenges with the continued growth in energy demand over the next 25 years calls for a diverse, economy-wide approach. EPRI’s most recent research focuses on a portfolio of seven advanced technologies—end-use energy effi ciency, renewable energy, advanced light water nuclear reactors, advanced coal power plants, CO2 capture and storage, plug-in hybrid electric vehicles (PHEVs), and distributed energy resources. EPRI found that, together, these technologies could reduce the estimated cost of CO2 emissions reductions to the U.S. economy by $1 trillion. But the technology development and deployment effort must be aggressive, and the em-phasis is on “together”: No single technology will provide a majority of CO2 emissions reductions.
THE FULL PORTFOLIO
o lessen the potential threats of climate change, many scientists and policymakers envision large-scale reductions in carbon dioxide (CO2) emissions—the goal is to ultimately stabilize global concentrations of
). Achieving such reduc-tions, however, presents major technical, economic, regulatory and policy challenges. Reconciling those challenges with the continued growth in energy demand over the next 25 years calls for a diverse, economy-wide approach.
s most recent research focuses on a portfolio of seven advanced technologies—end-use energy effi ciency, renewable energy,
An aggressive strategy to cut carbon dioxide emissions and meet electricity demand between now and
2030 requires equally aggressive research, development, and demonstration for several advanced technologies.
B Y R E V I S J A M E S
36 E L E C T R I C P E R S P E C T I V E S
T 1
23rf

J A N U A R Y / F E B R U A R Y 2 0 0 8 37
THE FULL PORTFOLIO
J A N U A R Y / F E B R U A R Y 2 0 0 8 37
38 E L E C T R I C P E R S P E C T I V E S
The EPRI analyses involve three re-lated studies, the third of which—a technology development pathways analysis—sketched out four areas on which the electricity sector needed to focus. More important, it identified the research, development, and dem-onstration (RD&D) activities the sec-tor would have to undertake to hit the required technology performance and deployment levels. The analysis also made preliminary estimates of what the RD&D capital investment would be.
Given the 20- to 30-year lead-time needed to fully research, develop, and commercially deploy technologies, the challenges are indeed great. And the
effort will involve a substantial and prolonged public-private RD&D effort.
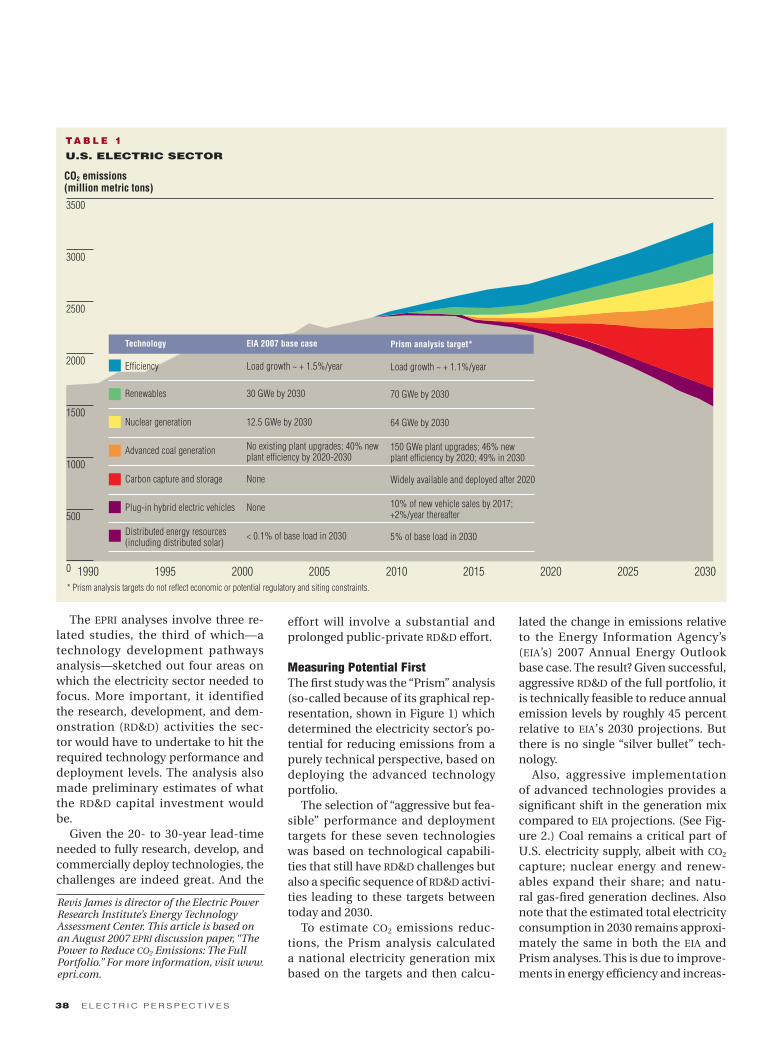
Measuring Potential FirstThe first study was the “Prism” analysis (so-called because of its graphical rep-resentation, shown in Figure 1) which determined the electricity sector’s po-tential for reducing emissions from a purely technical perspective, based on deploying the advanced technology portfolio.
The selection of “aggressive but fea-sible” performance and deployment targets for these seven technologies was based on technological capabili-ties that still have RD&D challenges but also a specific sequence of RD&D activi-ties leading to these targets between today and 2030.
To estimate CO2 emissions reduc-tions, the Prism analysis calculated a national electricity generation mix based on the targets and then calcu-
lated the change in emissions relative to the Energy Information Agency’s (EIA’s) 2007 Annual Energy Outlook base case. The result? Given successful, aggressive RD&D of the full portfolio, it is technically feasible to reduce annual emission levels by roughly 45 percent relative to EIA’s 2030 projections. But there is no single “silver bullet” tech-nology.
Also, aggressive implementation of advanced technologies provides a significant shift in the generation mix compared to EIA projections. (See Fig-ure 2.) Coal remains a critical part of U.S. electricity supply, albeit with CO2 capture; nuclear energy and renew-ables expand their share; and natu-ral gas-fired generation declines. Also note that the estimated total electricity consumption in 2030 remains approxi-mately the same in both the EIA and Prism analyses. This is due to improve-ments in energy efficiency and increas-
Revis James is director of the Electric Power Research Institute’s Energy Technology Assessment Center. This article is based on an August 2007 EPRI discussion paper, “The Power to Reduce CO2 Emissions: The Full Portfolio.” For more information, visit www.epri.com.
TA B L E 1
U.S. ELECTRIC SECTOR
* Prism analysis targets do not reflect economic or potential regulatory and siting constraints.
3500
3000
2500
2000
1500
1000
500
0
CO2 emissions (million metric tons)
Technology
Efficiency
Renewables
Nuclear generation
Advanced coal generation
Carbon capture and storage
Plug-in hybrid electric vehicles
Distributed energy resources (including distributed solar)
EIA 2007 base case
Load growth ~ + 1.5%/year
30 GWe by 2030
12.5 GWe by 2030
No existing plant upgrades; 40% new plant efficiency by 2020-2030
None
None
< 0.1% of base load in 2030
Prism analysis target*
Load growth ~ + 1.1%/year
70 GWe by 2030
64 GWe by 2030
150 GWe plant upgrades; 46% new plant efficiency by 2020; 49% in 2030
Widely available and deployed after 2020
10% of new vehicle sales by 2017; +2%/year thereafter
5% of base load in 2030
1990 1995 2000 2005 2010 2015 2020 2025 2030

J A N U A R Y / F E B R U A R Y 2 0 0 8 39
ing distributed generation, offset by increased electricity demand associ-ated with PHEVs.
Finding Value through MERGE AnalysisThe goal of the MERGE (model for esti-mating the regional and global effects of greenhouse gas reductions) analysis was to study—in terms of cost, avail-ability, and performance—the least-
cost technology mix that could reach specifi c CO2 emissions targets. MERGE
studies long time horizons to capture economic effects of potential climate change and encompasses all major GHGs and all sectors of the economy. It is a global model, with detailed sub-models of the United States and repre-sentative submodels of other regions of the world. MERGE is one of the principal modeling systems used for integrated assessment of international and U.S. climate policies.
The full portfolio represents sub-stantially more improvement in per-formance and costs for a range of technologies, thus allowing their wide-spread deployment. In the full port-folio, for example, the MERGE analysis assumed that by 2020 CO2 capture and storage would be commercially avail-able, nuclear power production could expand signifi cantly, and PHEVs would be widely available. None of these op-tions are available in the limited port-folio.
The MERGE analysis assumed a car-bon constraint which requires stabi-lization of annual CO2 emissions at 2010 levels through 2020 and then a 3-percent annual decline in emissions.
MERGE determined the constraint’s eco-nomic impact in terms of the change in gross domestic product, fi nding a $1.5 trillion impact associated with the lim-ited portfolio. For the full portfolio, the impact is $500 billion. (See Figure 3.)
The availability of technology has a large impact on wholesale electric-ity prices and the U.S. generation mix. For the limited portfolio, for example, emissions reductions require large re-ductions in electricity consumption, and wholesale electricity prices are extremely high to incent such reduc-tions. In contrast, the availability of carbon capture and storage and nu-clear generation in the full portfolio provide large-scale supply-side emis-sions reductions, protecting the elec-tricity market and limiting the rise in wholesale electricity prices. In the end, availability of advanced genera-tion technologies results in substan-tially lower wholesale electricity costs: For the full portfolio, costs increase 45 percent between 2000 and 2050, com-pared to a 265-percent increase for the limited portfolio.
The extent of advanced technology development and deployment also in-fl uences natural gas usage and pric-
F I G U R E 2
EIA BASE CASE*(5406 TWh)
*Base case from EIA “Annual Energy Outlook 2007”
ADVANCED TECHNOLOGY TARGETS(5401 TWh)
F I G U R E 3
CHANGE IN GROSS DOMESTIC PRODUCT DISCOUNTED THROUGH 2050*
0.0
-0.5
-1.0
-1.5Other fossil1.7%
Hydropower4.9%
Other fossil1.7%
Coal w/o CCS59.6%
Nuclear power16.6%
Natural gas13.5%
Hydropower5.6%
Non-hydro renewables3.0%
Other fossil 0.6%
Coal w/o CCS39.0%
Coal with CCS14.6%
Nuclear power25.5%
Natural gas8.7%
Non-hydro renewables6.7%
Limited PHEV Renewables Effi ciency Nuclear CCS Full portfolio only only only only only portfolio
■ Cost of policy ■ Reduction in policy cost with advanced technology
* In year 2000 dollars
($ trillions)
Value of R&D investment

40 E L E C T R I C P E R S P E C T I V E S
ing. In the limited portfolio scenario, achieving required emissions reduc-tions requires a significant amount of fuel switching to natural gas for elec-tricity generation, as well as large re-ductions in electricity demand. This drives up natural gas prices substan-tially. By 2050, natural gas consump-tion by electric companies in the limited portfolio scenario is more than five times higher than the full portfolio scenario.
One key insight from the MERGE analysis is the opportunity for elec-tricity to provide low-carbon energy throughout the economy. In particu-lar, advanced technology allows the electricity price to remain relatively
stable, which provides a “decarboniza-tion” option for other sectors of the economy—transportation, in particu-lar. This results in increased electrifica-tion in the economy.
Technology Pathway 1: Nuclear Power Deployment of advanced light water reactors, continued safe and economic operation of the existing nuclear fleet, and a viable strategy for managing spent fuel.
Nuclear power’s contribution to CO2 emissions reductions hinges on the continued safe and economic perfor-mance of the existing fleet, which in the United States currently accounts for more than 20 percent of all gen-
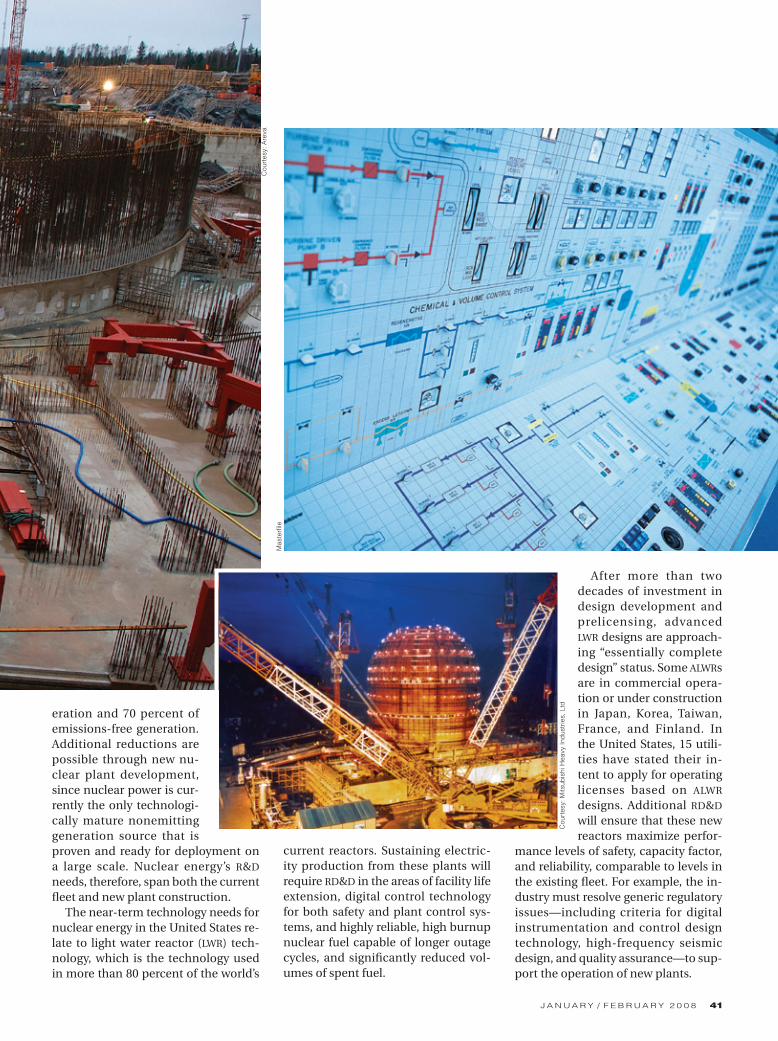
Light water reactor technology is used in more than 80 percent of the world’s cur-rent reactors, including the Tomari plant in Japan (inset). Third-generation nuclear power plants, such as the Olkiluoto 3 plant in Finland (above), will produce significantly reduced volumes of spent fuel and offer improved safety and plant control systems by using digital control technology.
J A N U A R Y / F E B R U A R Y 2 0 0 8 41
eration and 70 percent of emissions-free generation. Additional reductions are possible through new nu-clear plant development, since nuclear power is cur-rently the only technologi-cally mature nonemitting generation source that is proven and ready for deployment on a large scale. Nuclear energy’s R&D needs, therefore, span both the current fleet and new plant construction.
The near-term technology needs for nuclear energy in the United States re-late to light water reactor (LWR) tech-nology, which is the technology used in more than 80 percent of the world’s
current reactors. Sustaining electric-ity production from these plants will require RD&D in the areas of facility life extension, digital control technology for both safety and plant control sys-tems, and highly reliable, high burnup nuclear fuel capable of longer outage cycles, and significantly reduced vol-umes of spent fuel.
After more than two decades of investment in design development and prelicensing, advanced LWR designs are approach-ing “essentially complete design” status. Some ALWRs are in commercial opera-tion or under construction in Japan, Korea, Taiwan, France, and Finland. In the United States, 15 utili-ties have stated their in-tent to apply for operating licenses based on ALWR designs. Additional RD&D will ensure that these new reactors maximize perfor-
mance levels of safety, capacity factor, and reliability, comparable to levels in the existing fleet. For example, the in-dustry must resolve generic regulatory issues—including criteria for digital instrumentation and control design technology, high-frequency seismic design, and quality assurance—to sup-port the operation of new plants.
Mas
terfi
le
Cou
rtes
y: M
itsub
ishi
Hea
vy In
dus
trie
s, L
td
Cou
rtes
y: A
reva

42 E L E C T R I C P E R S P E C T I V E S
High-temperature gas reactors (HTGRs) may also have a significant bearing on the U.S. nuclear power sector—though the EPRI study did not specifically model them because they don’t exclusively reduce electricity CO2 emissions intensity. Operating at much higher temperatures (700º-950ºC) than conventional LWR technology (300ºC), HTGRs can generate both electricity and process heat for industrial pro-cesses. As such, they will provide a technology option to reduce CO2 emis-sions from large consumers of primary energy—chemical refiners, desalina-tors, etc. The “Next Generation Nuclear Plant” commercial demonstration project—the Department of Energy’s (DOE’s) application of HTGR technol-ogy—is already underway. But signifi-cant R&D is necessary to make an HTGR prototype and then have commercial introduction by the mid-2020s.
Technology Pathway 2: Advanced Coal with CO2 Capture and StorageDeployment of commercial-scale coal-based generation units operating with 90 percent CO2 capture and develop-ment of ways to transport and sequester the captured CO2.
Coal currently accounts for more than half of the electricity generated in the United States—most analyses project it to remain the backbone of U.S. electricity supply through 2050 and beyond. Sustaining coal as a viable option in a carbon-constrained world entails achieving two key objectives: increasing the efficiency and reducing the capital cost of pulverized coal and integrated coal gasification combined-cycle (IGCC) technologies; and bringing carbon capture and storage (CCS) to the point of cost-effective commercializa-tion. Large-scale demonstrations will be necessary to convince private in-
Overcoming technological challenges. High-temperature gas reactors, such as this one in China (inset), provide a tech-nology option to reduce CO2 emissions from large consumers of primary energy. An 8,000-foot well (above) has been com-pleted at FirstEnergy’s Burger plant near Shadyside, OH, in preparation for a geo-logic sequestration field test. In operation since 1996, Statoil’s Sleipner Vest project (opposite page) has successfully stored 8 million tons of CO2 beneath the North Sea.
Courtesy: Battelle

J A N U A R Y / F E B R U A R Y 2 0 0 8 43
Cou
rtes
y: S
tato
il

44 E L E C T R I C P E R S P E C T I V E S
dustry that technology commercializa-tion is feasible.
Signifi cant effi ciency gains for pul-verized coal can occur principally by increasing the peak temperatures and pressures of the steam cycle. A 10-percent effi ciency gain, for example, translates into a CO2 emissions reduc-tion of 25 percent. To accommodate these higher temperatures and pres-sures, advanced materials (such as cor-rosion-resistant nickel alloys) and new boiler and steam turbine designs will be necessary—as will the demonstra-tion of plants that are based on ultra-supercritical steam conditions.
Aggressive RD&D could serve to re-duce IGCC capital costs by 30 percent relative to current estimated costs, with effi ciencies climbing from 30 percent today to the 45-percent range (with CO2 capture). Technology advances in-clude the development of larger gasifi -ers, the integration of these gasifi ers with combustion turbines, and the use of low-energy-demand oxygen supply technologies, like ion transfer mem-
branes (to separate gases during the gasifying process). Over the longer term, warm-gas cleanup (which en-ables the system to separate gas con-taminants closer to the point of their production, instead of having to cool or superheat the gas) and membrane separation processes for CO2 capture will reduce energy losses in these ar-eas.
The greatest reductions in future U.S. electric sector CO2 emissions are likely to come from applying CCS technologies to nearly all new coal-based power plants coming online as soon as cost-effective CO2 capture and storage are commercially avail-able. Currently, adding CO2 capture, drying, compression, transportation, and storage capabilities to IGCC plant designs would increase the wholesale cost of electricity by 40-50 percent. If membrane technology for separating the CO2 from syngas becomes a robust option, however, it could enable a 50-percent reduction in both capital cost and auxiliary power requirements.
CO2 capture at pulverized coal plants is similarly costly. A 2000 EPRI-DOE study concluded that the energy needed by the monoethanolamine process (the principal capture process currently available) would reduce a generator’s net power output by 29 percent and raise the production cost of electric-ity by 65 percent. Right now, there is extensive research to test and develop better solvents, such as chilled ammo-nia—this may reduce power output by only 10 percent, with an electricity pro-duction cost increase of about 25 per-cent. The equipment supplier Alstom and EPRI are conducting a 5-megawatt pilot scale test of a chilled ammonia process at We Energies’ Pleasant Prai-rie Power Station.
CO2 sequestration is discussed pri-marily in terms of storage in geo-logic formations (saline aquifers, for example). Geologic CO2 storage has been proven effective by nature, as evidenced by the numerous natural underground CO2 reservoirs in Colo-rado, Utah, and other western states.
AP
Imag
es
J A N U A R Y / F E B R U A R Y 2 0 0 8 45
CO2 also is found in natural gas reser-voirs, where is has resided for millions of years. The petroleum industry has substantial experience injecting CO2
into existing fi elds to enhance oil and gas recovery. [See “Carbon Control,” by Dennis Wamsted in November/De-cember 2006 Electric Perspectives.] But no one has demonstrated large-scale CO2 injection and storage from electric-ity generation. The U.S. Department of Energy has launched “Regional Carbon Sequestration Partnerships” to identify suitable geologic formations and con-duct pilot projects. [See November/December 2007 Electric Perspectives, page 14.]
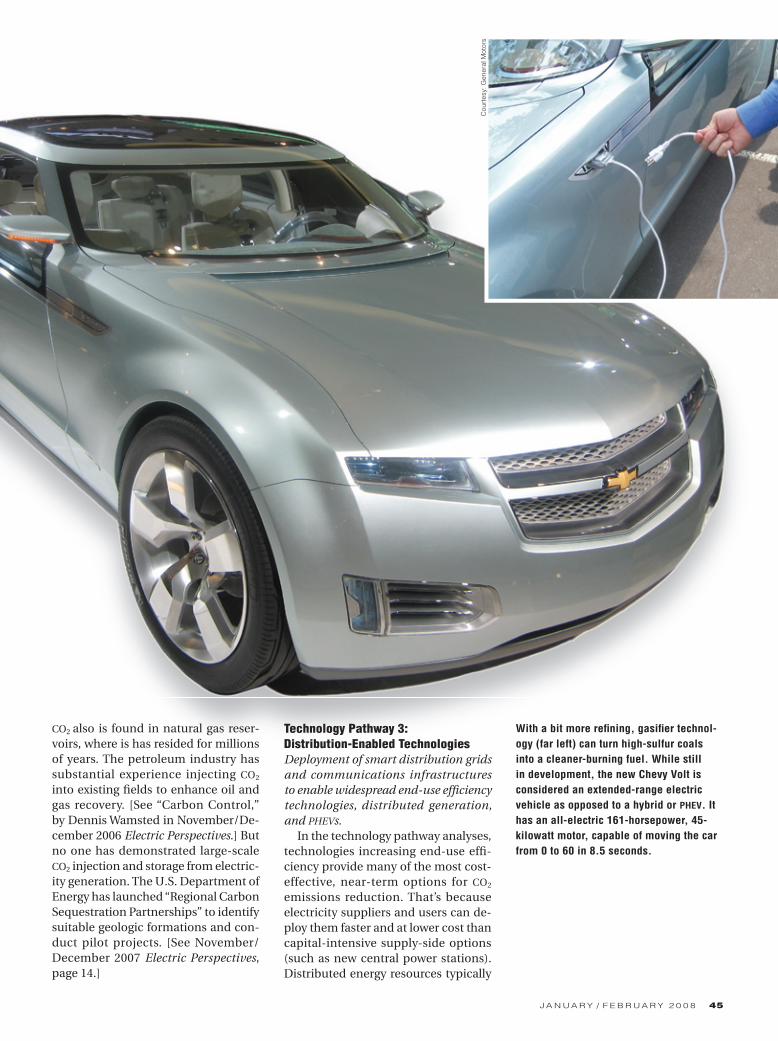
Technology Pathway 3: Distribution-Enabled TechnologiesDeployment of smart distribution grids and communications infrastructures to enable widespread end-use effi ciency technologies, distributed generation, and PHEVs.
In the technology pathway analyses, technologies increasing end-use effi -ciency provide many of the most cost-effective, near-term options for CO2 emissions reduction. That’s because electricity suppliers and users can de-ploy them faster and at lower cost than capital-intensive supply-side options (such as new central power stations). Distributed energy resources typically
With a bit more refi ning, gasifi er technol-ogy (far left) can turn high-sulfur coals into a cleaner-burning fuel. While still in development, the new Chevy Volt is considered an extended-range electric vehicle as opposed to a hybrid or PHEV. It has an all-electric 161-horsepower, 45-kilowatt motor, capable of moving the car from 0 to 60 in 8.5 seconds.
Cou
rtes
y: G
ener
al M
otor
s

46 E L E C T R I C P E R S P E C T I V E S
have lower CO2 emissions intensities than the coal-dominated mix of central stations. But while active RD&D and commercial development continues for energy-efficient devices and distributed energy resources, their widespread deployment requires a smart, interactive infrastructure, in-cluding the ability to integrate new technologies all along the distribution system. Greater penetration of these technologies depends on advances in interoperability standards, advanced metering infrastructure (AMI) capabili-ties, real-time data acquisition, and dynamic energy management.
Many expect that PHEVs will build on the engineering experience and mar-
ket acceptance of traditional hybrids, enter the U.S. market around 2010, and gain market penetration through 2050 because of their superior fuel perfor-mance and environmental benefits. With parallel advances in smart vehi-cles and the smart grid, PHEVs could become an integral part of the distri-bution system itself within 20 years, with their batteries providing electric-ity storage, emergency supply, and grid stability (the latter also achieved by off-peak charging, which thereby lev-els load). PHEV research needs include advanced onboard chargers capable of
Analytical and visualization tools (above) can help operators more accurately fore-cast renewable energy output and its impact on grid operations. All distributed devices must have high levels of intel-ligence—computers (inset)—built into their basic operating structure. On the transmission side, advanced energy-stor-age technologies (page 48) foster reli-ability improvement, peak-load shaving, and the ability to store energy from re-newable sources to supplement noninter-mittent generation resources.
Cou
rtes
y: E
mer
son
Pro
cess
Man
agem
ent

48 E L E C T R I C P E R S P E C T I V E S
handling two-way power flow. There also must be demonstrated integration into the smart distribution system to meet peak loads and provide ancillary services (like voltage regulation).
Distribution-enabled technologies such as energy efficient-devices, dis-tributed energy resources, and PHEVs share several common attributes. First, they have or will have high levels of distributed intelligence—comput-ers—built into their basic operating structure, allowing them to become “smart resources” that interact with their digital environment. Second, they incorporate standardized communi-cation protocols, affording high levels of interoperability with other devices through AMI. Third, they are designed
to integrate with a smart electricity in-frastructure at multiple levels—distri-bution, energy management systems, and grid operations and planning. These technologies already benefit from RD&D, but transforming the dis-tribution system into a smart enabling infrastructure will also require RD&D efforts into interoperability standards, optimization, and system integration.
Technology Pathway 4: Transmission-Enabled TechnologiesDeployment of transmission grids and associated energy storage infrastruc-tures with the capacity and reliability to operate with 20-30 percent intermit-tent renewables in specific regions of the United States.
Because wind, solar, and many other nonhydroelectric renewable resources are intermittent, integrating them into the transmission system on a large scale will mean significant enhancements to the system itself. These include large-scale energy storage technologies, bet-ter grid control tools, and additional transmission infrastructure. The goal is to enable integration of as much as 20-30 percent renewable generation in the overall generation portfolio in specific regions.
Electric energy storage is a critical solution, because it separates inter-mittent generation from demand. The ability to store energy on a large scale and dispatch it as needed allows inter-mittent renewable resources to operate

50 E L E C T R I C P E R S P E C T I V E S
during periods of maximum efficiency. Energy storage options such as ad-vanced compressed-air technologies (where the generator pressurizes air in underground storage, to be released later to spin a turbine) and nano-su-percapacitors (which combine the high-speed capabilities of capacitors with the energy storage of batteries) could support widespread integration of wind turbines and other renewable energy solutions.
Analytical and visualization tools can help operators more accurately forecast renewable energy output and its impact on grid operations—this provides greater confidence in sched-uling adequate capacity to meet en-ergy requirements. In turn, this will help with regulation, reserves, and
load-following requirements and facil-itate higher penetration of non-emit-ting resources.
Advanced transmission systems, novel materials, and advanced power electronics can also support increased renewable energy generation. Incorpo-rating superconducting materials into a “supercable,” for example, could pro-vide not only a low-loss transmission medium, but also an energy storage medium if the coolant is hydrogen.
RD&D Funding NeedsAll these advanced technologies will require an expanded and multi-de-cade RD&D program in both the public (government) and private sectors. Ad-vances are needed all along the RD&D chain—basic science, applied research,
High-temperature superconductor wires (HTS, inset) can conduct more than 150 times the power of copper or aluminum wires of the same dimensions, allowing HTS cables to carry more power in existing rights-of-way than conventional cables or overhead lines. EPRI estimates that, for all technologies in the portfolio, the average RD&D expenditure the country must make between now and 2030 is $1.4 billion- $2.0 billion annually.
Cou
rtes
y: A
rgon
ne N
atio
nal L
abor
ator
y
Courtesy: American Superconductor Corp.
J A N U A R Y / F E B R U A R Y 2 0 0 8 51
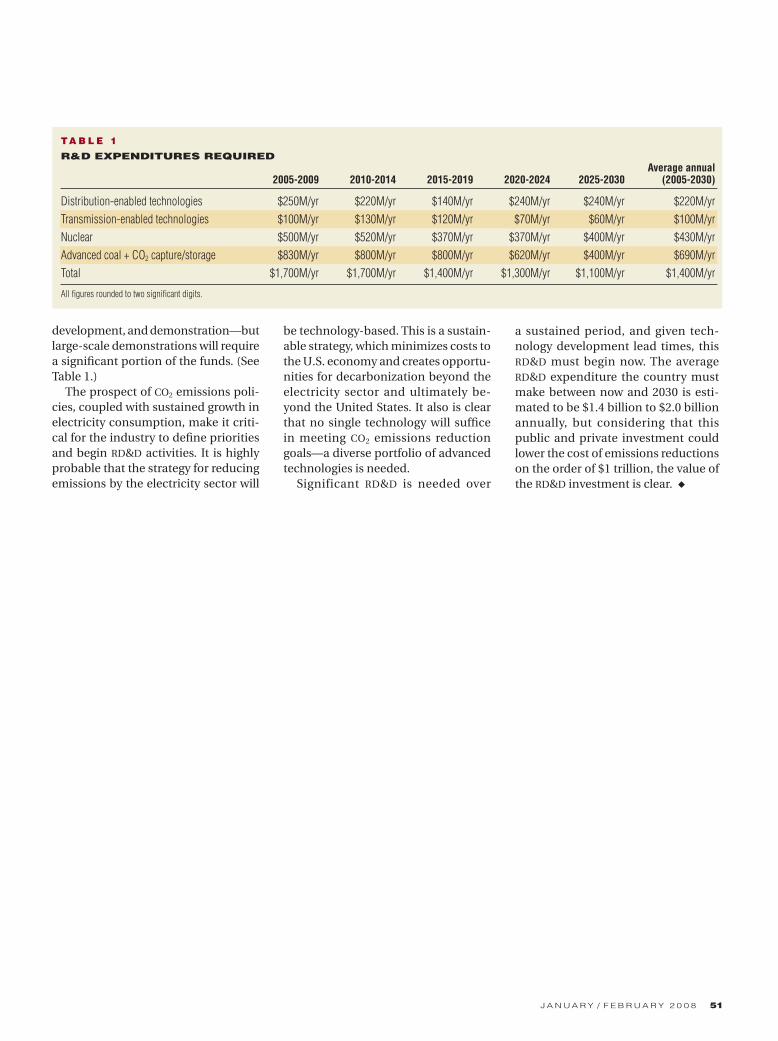
development, and demonstration—but large-scale demonstrations will require a significant portion of the funds. (See Table 1.)
The prospect of CO2 emissions poli-cies, coupled with sustained growth in electricity consumption, make it criti-cal for the industry to define priorities and begin RD&D activities. It is highly probable that the strategy for reducing emissions by the electricity sector will
be technology-based. This is a sustain-able strategy, which minimizes costs to the U.S. economy and creates opportu-nities for decarbonization beyond the electricity sector and ultimately be-yond the United States. It also is clear that no single technology will suffice in meeting CO2 emissions reduction goals—a diverse portfolio of advanced technologies is needed.
Significant RD&D is needed over
a sustained period, and given tech-nology development lead times, this RD&D must begin now. The average RD&D expenditure the country must make between now and 2030 is esti-mated to be $1.4 billion to $2.0 billion annually, but considering that this public and private investment could lower the cost of emissions reductions on the order of $1 trillion, the value of the RD&D investment is clear. ◆
TA B L E 1
R&D EXPENDITURES REQUIRED Average annual 2005-2009 2010-2014 2015-2019 2020-2024 2025-2030 (2005-2030)
Distribution-enabled technologies $250M/yr $220M/yr $140M/yr $240M/yr $240M/yr $220M/yrTransmission-enabled technologies $100M/yr $130M/yr $120M/yr $70M/yr $60M/yr $100M/yrNuclear $500M/yr $520M/yr $370M/yr $370M/yr $400M/yr $430M/yrAdvanced coal + CO2 capture/storage $830M/yr $800M/yr $800M/yr $620M/yr $400M/yr $690M/yrTotal $1,700M/yr $1,700M/yr $1,400M/yr $1,300M/yr $1,100M/yr $1,400M/yr
All figures rounded to two significant digits.