the fracture mechanics properties of epoxy powder … · the fracture mechanics properties of epoxy...
TRANSCRIPT

Loughborough UniversityInstitutional Repository
The fracture mechanicsproperties of epoxy powder
coatings for corrosionprotection
This item was submitted to Loughborough University's Institutional Repositoryby the/an author.
Additional Information:
• A Doctoral Thesis. Submitted in partial fulfilment of the requirementsfor the award of Doctor of Philosophy of Loughborough University.
Metadata Record: https://dspace.lboro.ac.uk/2134/13979
Publisher: c© Abdul-Hadi M. Al-Hassani
Please cite the published version.

This item was submitted to Loughborough University as a PhD thesis by the author and is made available in the Institutional Repository
(https://dspace.lboro.ac.uk/) under the following Creative Commons Licence conditions.
For the full text of this licence, please go to: http://creativecommons.org/licenses/by-nc-nd/2.5/

/
)
LOUGHBOROUGH UNIVERSITY OF TECHNOLOGY
LIBRARY
AUTHOR/FILING TITLE ·
-----------~-'=-:.~A~~~Lt---~--!:\--~-------- __ •
3~~u~~ ~ 5 JUL 1991
3JU~ . - 2 C'Jllf993
\
',;'.c,·-
. 000 0959 02 -
~~~~~~~~~~~~~~~~~~(\l~ll~l~lllllllll~llllll~l- I
I


The Fracture Mechanics Prcperties of
Epoxy Powder Coatings used for
Corrosion Protection
by · .
. Abdul-Hadi M. Al-Hassani, B.Sc.
A Doctoral Thesi~ submitted in partial
fulfilment of the requirements for the
award of Doctor of .Philosophy of the
Loughborough University of Technology.
1983
Supervisor: Dr. M.O.W. Richardson
@ by Abdul-Hadi _M. Al-Hassani, 1983


ACKNOWLEDGEMENTS
I wish to express my appreciation and thanks to my
Supervisor, Dr. M.O.W. Richardson, for the invaluable
contributions, encouragement and active involvement with
the project.
I would like to thank Professor I.A. Menzies for his
encouragement during the course of this work and for the
provision of research facilities.
I am grateful to Mr. D.H. Herbert for his co-operation
and assistance. Also my thanks to Mr. S. Beet, Mr. J. Bates
and all other technical staff of the Mechanical Engineering
Department and Materials Engineering and Design Department.
I am greatly indebted to Mr. F. tHller for his
assistance.
Finally, my deepest thanks to Mrs. C. Bartrop for her
speedy and efficient typing of .this thesis •
.•.

In the name ot 9od, mo~t g~aciou~,
mo~t me~ci/.ul,
By (the 7oken ot) 7ime (th~ough the
age~). Ve~ily man i~ in eo~~. except
tho~e who have Taith, and do ~ighteou~
deed~. and (join togethe~) in the mutual
teaching ot t~uth, and ot patience and
con~tancy,
9LORI0/1S Q/lRAN (11~~. o~ 7ime th~ough
the age~)
. . . ' in malice ee ye child~en, eut in • unde~~tanding ee men.•
I eo~. I4, v. 20,
K,J,V, Holy Bitle

1
2
2.1
2.2
2.3
2.4
CONTENTS:
CHAPTER 1
Introduction
CHAPTER 2
2 .1.1
2.1. 2
2.1. 3
2.1. 4
2.2.1
2.2.2
2.2.3
2. 3.1
2. 3.2
2. 3. 3
2. 4.1
2. 4. 2
Theoretical Considerations
Some Fracture Mechanics Concepts
Historical Review of Fracture Mechanics
Plane-stress and Plane-strain Plastic Zone
Plastic Deformation Zone
The Effect of Specimen Thickness on Fracture Energy ·
Epoxy Powder Coating Chemistry
Epoxy Resins
Acid Anhydride
Cross-linking
Historical Review of the Study of Crazes
Background of Crazes
Crazes from a Fracture Mechanics Aspect
Craze Morphology
.Electronic Speckle Pattern Interferometry (ESP!)
Introduction
Theory of Laser Speckle
Page:
1
4
4
4
11
13
16
18
18
20
26
28
28
30
32
34
34
36

3
4
3.1
3.2
3. 3
3.4
CHAPTER 3
Experimental Work
Introduction
Mechanical Testing of the (TDCB) Specimen
Specimen Preparation
Optical Arrangement of outof-Plane Displacement using ESPI
3.5 Test Procedures
3.6 Transition Te~peratures
3.6.1 Introduction
3.6.2 Thermo-analysis Procedure
3.7 Mechanical and Physical Properties
4.1
4.2
4.3
4.4
3.7.1 Density
3.7.2 Hardness
3.7.3 Impact Strength
3.7.3.1 Introduction
3.7.3.2 Impact Strength Process
3.7.4 Modulus Measurements
CHAPTER 4
4.1.1
4.1. 2
4.1. 3
Results
Fracture Surface Energy
Introduction
Berry's Analysis
Gurney's Analysis
General Comments
The Variation of Fracture Energy with Bond Thickness
The Effect of Hardener Concentration
Page:
40
40
41
43
45
47
49
49
50
51
51
52
53
53
54
55
56
56
56
57
58
59
60
62

5
4.5
4.6
4.7
4.8
5.1
5,2
5. 3
5.4
CHAPTER
5.2.1
5.2.2
5.2.3
5.2.4
5.2.5
5. 3.1
5.3.2
5. 3. 3
5.4.1
5. 4. 2
Effect of Testing Speed
The Curing Temperature and Curing Time
The Thermo-Mechanical Analysis
Electronic Speckle Pattern Interferometry Results
5
Discussion
General Comments
Mechanical and Fracture Properties of "Epikote" 1055/TMA .
Introduction
The Variation of the Plastic Deformation Zone with the Bond Thickness
Plastic Deformation Zone Measurement utilizing the ESP! Technique
The Effect of Post-Cure Temperature
The Effect of Testing Speed on th~ Mechanical arid Fracture Propeities
Crack and Craze Morphology
General Comments
Crack Morphology
Craze Morphology
Fracture Surface Features and their Relation to Mechanical Properties
Introduction
Qualitative and Quantitative Examiriati~n of Fracture Surfac.es
Page:
65
66
67
68
70
70
72
72
73
75
79
81
84
84
85
86
88
88
89

6
5.4.2.1 Qualitative Observations
5.4.2.2 General Comments
5,4.2.3 Fabrication Process
5.4.2.4 Quantitative Analysis of Fracture Surfaces
5. 5 Mechanisms of Failure
5.6 General Comments
CHAPTER
6. 1
6.2
APPENDICES
Appendix 1
Appendix 2
Appendix 3
Appendix 4
REFERENCES
TABLES
FIGURES
6
Conclusions and Suggestions for Further Work
Conclusions
Suggestions for Further Work
Concepts of Fracture Hechanics
The Limitations of Electronic Speckle Pattern Interferometry
Statistical Analysis of Fracture Energy
The Evalution of Fracture Surface Energy " ~ by using lrwin-Kies equation. (Computer Program)
Page:
88
91
92
94
96
98
100
100
103
105
114
118
123
1 26
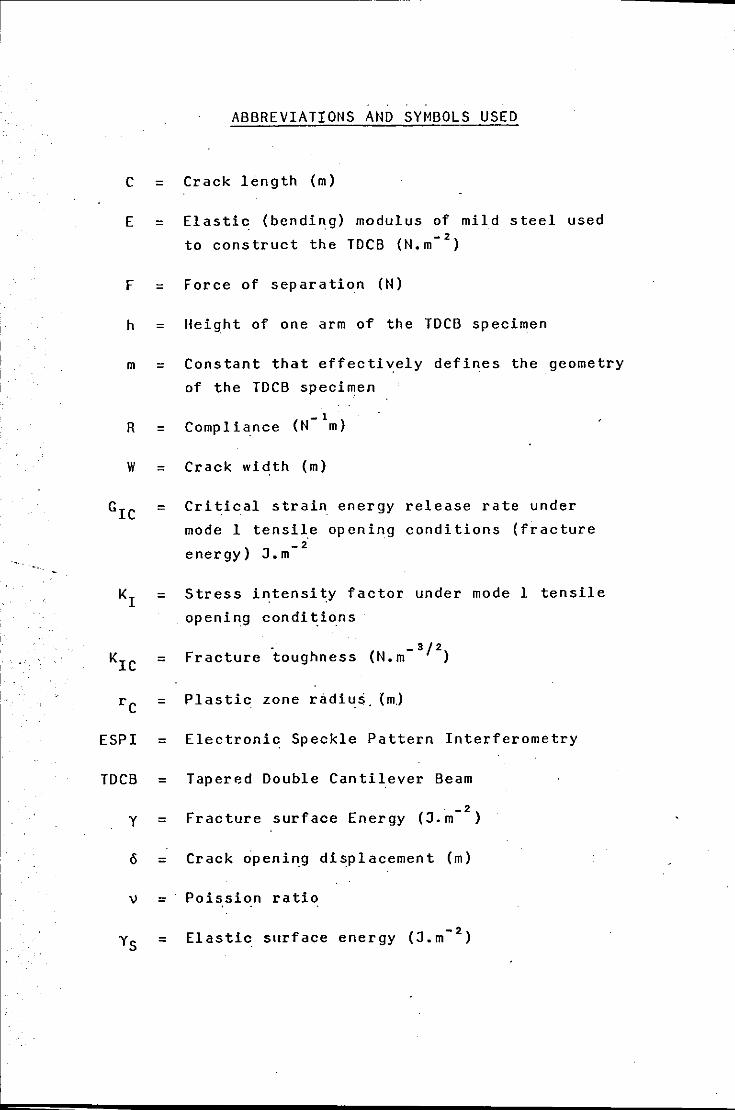
ABBREVIATIONS AND SYMBOLS USED
c = Crack length (m)
E = Elastic (bending) modulus of mild steel used
the -2
to construct TDCB (N.m )
F = Force of separation (N)
h = Height of one arm of the TDCB specimen
m = Constant that effectively defines the geometry
of the TDCB specimen
- 1 R = Compliance (N m)
W = Crack width (m)
GIC = Critical strain energy release rate under
mode 1 tensile opening conditions (fracture
) -2
energy J.m
K1
= Stress intensity factor under mode 1 tensile
opening conditions
=
=
ESPI =
TDCB =
y =
=
\) =
=
Fracture toughness (N.m-3
/2
)
Plastic zone r~diu~ (m) ..
Electronic Speckle Pattern Interferometry
Tapered Double Cantilever Beam
. -2 Fracture surface Energy (J.m )
Crack opening displacement (m)
Poission ratio
Elastic surface energy (J.m- 2)

I
i
I
I
SUMHARY
Although epoxy paints are widely and increasingly used
very little information is available concerning the conditions
that affect stable (adhesive) failure or unstable (cohesive)
'crack jumping' failure. Consequently the parameter of
fracture surface energy (y) has been chosen to characterise the
fracture properties of five epoxy resins based on diglycidyl
ether bisphenol A 'DGEBA' cured with trimellitic anhydride 'TMA'.
Principles of fracture surface energy measurement previously
applied to structural adhesive have been applied here to epoxy
powder coatings.
The fracture behaviour of a range of paints with system-
atically varied cross-link density has been examined using a
tapered double cantilever beam (TDCB) technique. The cross-
linking density is increased by increasing the amount of the
hardener (TMA) in the epoxy resin. However the cross-linking
concept alone does not sufficiently explain the variation of
fracture surface energy. The effect on y by changing strain
rate and cure conditions has also been examined. It has been
found that the fracture surface energy is rate sensitive (i.e.
Y is decreased as the cross-head speed is increased). The
mechanical and fracture properties also appear to be very
dependent on post cure time for times less than one hour. The
variation of fracture surface energy with changes in coating
thickness have been.monitored and interpreted using Irwin-Kies,
Berry, Gurney, Mostovoy, Ripling and Bascom's methods of
analysis which are briefly compared and found to indicate good
correlation. Linear Elastic Fracture Mechanics (LEFM) has been

applied in the theoretical analysis to describe the stress
field around crack tips of various sizes and shapes.
The deformation and fracture behaviour of the paint poly
mer and how it is affected by the presence of crazes has also
been studied. For resin compositions less than that of the
stoichiometric composition H~ 3 the failure mechanism reveals'
the existence of crazing phenomena. The dimensions of the
deformation zone at the head of the crack tip in each of test
samples has been determined using a specially developed form
of electronic speckle pattern interferometry (ESP!). The
relationship of the deformation zone diameter to the mechanism
changeover from continuous mode failure to discontinuous mode
failure, at a bond thickness of 200 urn, is discussed in terms
of previous work carried out on epoxy adhesives and the differ
ences are highlighted. Some indication of the practical sig
nificance of the work in aiding the selection of epoxy powder
coating for gas pipeline and similar corrosion protection
applications is given.

CHAPTER 1

-1-
1. INTRODUCTION
Epoxy resins are very widely used in the industrial world.
Typical applications include casting, potting of electrical
components, sealing, laminating, adhesives and coatings.
Thermosetting powder coatings have become one of the most
rapidly growing types of protective materials used for steel
and similar substrates. Over the last six years the United
Kingdom market for such materials is said to have grown by an
average of 25% per annum. One of the latest applications for
epoxy powders is on gas pipelines - both for underground and
underwater (especially sea) end uses. These pipelines require
a protective coating system to combat the multitude of aggres
sive environments encountered between the supply field and the
consumer.
The advantages of epoxy resin coatings over traditional
coal tar/glass fibre or .extruded polyethylene coatings are
their increased resistance to mechanical damage and abrasion,
superior adhesion, lower risk of cathodic debonding and im
proved flexibility. Primarily an exter~al coating must prevent
corrosion by establishing a barrier between the pipe and its
immediate environment. In order to achieve this the (thermo-
setting polymeric powder coating) material must possess the
necessary physical, chemical and mechanical properties. This
present investigation is concerned with mechanical properties
or, more specifically, the fracture mechanics aspect. Many
techniques have been used to study the fracture behaviour of a
wide variety of materials but one of the more recent develop
ments in the use of the tapered double cantilever beam (TDCB)
technique.

-2-
Although epoxy paints are widely and increasingly used,
very little information is available concerning the conditions
that affect stable (adhesive) failure or unstable (cohesive)
'crack-jumping' failure in such systems.
The failure analysis of structural adhesives and powder
coatings must be based on reliable fracture criteria since the
resins are generally brittle materials that fail by crack
initiation and instability. In the case of painted pipelines
a typical means of testing impact resistance is by a falling 1 2 3
weight method, of which there are several types, to ensure 4
that the paint coating is not susceptible to brittle fracture.
Impact resistance and fracture toughness, although not directly
related, nevertheless both involve the process of crack move-
ment through the material structure at some stage in their
determination. In the present work chemical composition, bond
thickness and curing cycles are investigated in terms of their
effect on the fracture behaviour of thermosetting epoxy powder
coatings. The parameter used to characterise the behaviour of
these materials was the fracture surface ener~y (y). The linear
elastic fracture mechanics approach (LEFM) is applicable in the
theoretical analysis since the specimens are assumed to deform
elastically.
Cross-linking of epoxy resins is achieved by a chemical
curing process after the addition of a curing agent, e.g.
trimellitic anhydride (TMA). The fracture behaviour of a range
of such paint systems with systematically varied cross-link
densities has been examined. The variation of fracture surface
energy (y) with changes in coating thickness were also moni-
tored. Earlier work has suggested that, in the case of carboxyl-

-3-
terminated butadiene-acrylonitrile (CTBN) modified adhesives,
when the plastic deformation zone diameter is of the same
order of magnitude as the bond thickness then a change-over
of failure mechanism occurs. From an interpretive point of
view, it.has been seen that if there is a mechanism change
over, then it could be linked with the size of plastic de-
formation zone at the crack tip. This deformation zone -
ahead of the crack tip is examined using the new technique of
electronic speckle pattern interferometry (ESPI).
In addition, the studies have included the examination
and characterisation of the cured products by means of stan
dard mechanical tests. The physical morphology of a typical
resin system and the behaviour of the structural features of
the system under stress have also been examined.

CHAPTER 2

-4-
2. THEORETICAL CONSIDERATIONS
2.1 Some Fracture Mechanics Concepts
2.1.1 Historical Review of Fracture Mechanics
The theoretical fracture strength of any solid material
can be cal~ulated from the forces of interaction between its
constituent atoms. The maximum cohesive strength {am) ls 5
interpreted as approximately am = 0.1 E as shown by Orowan
where E is the Young's Modulus. Although several theoretical
approaches have been used to determine the magnitude of am,
they all produce fairly similar results. However, practical
measurements of cohesive strength give results lower than the
theoretically determined values by two or three orders of mag-6
nitude. To explain this great discrepancy Griffith postu-
lated that solids must contain very fine cracks or flaws, no 7
matter how much care is taken during their production. He e
used a solutiorr developed earlier by Inglis who considered
the stress distribution near the end of the major axis of an
elliptical hole in the centre of an infinite plate, in order
to determine the strain energy released as a crack propagated
{see Fig. 1 and Appendix 1).
However, application of this theory to the behaviour of
metals is complicated due to the definition of the surface
energy term. The true fracture surface energy of metals is
considerably smaller than the energy absorbed per unit area
during cracking. The discrepancy here is accounted for by
local plastic deformation adjacent to the fracture surfaces. 9 1 0
Berry was the first to associate the high fracture tough-
-5-
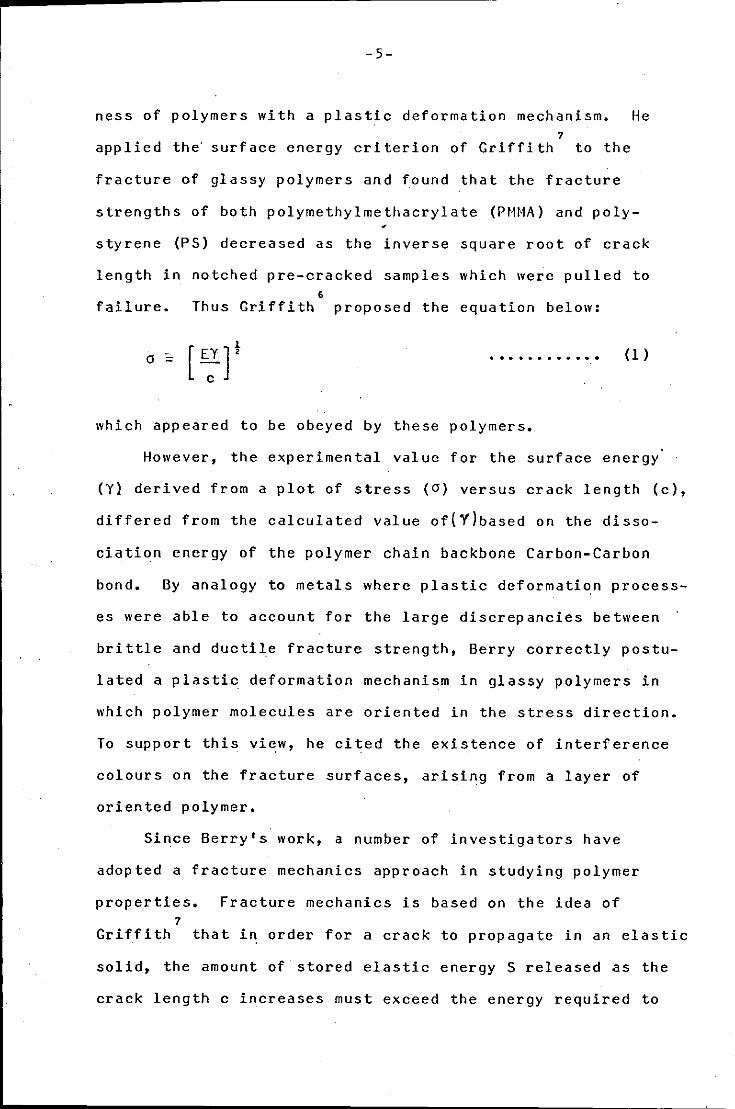
ness of polymers with a plastic deformation mechanism. He 7
applied the' surface energy criterion of Griffith to the
fracture of glassy polymers and found that the fracture
strengths of both polymethylmethacrylate (PMMA) and poly-
styrene (PS) decreased as the inverse square root of crack
length in notched pre-cracked samples which were pulled to 6
failure. Thus Griffith proposed the equation below:
(1)
which appeared to be obeyed by these polymers.
However, the experimental value for the surface energy
(Yl derived from a plot of stress (O) versus crack length (c),
differed from the calculated value of(Ylbased on the disso-
elation energy of the polymer chain backbone Carbon-Carbon
bond. By analogy to metals where plastic deformation process-
es were able to account for the large discrepancies between
brittle and ductile fracture strength, Berry correctly postu-
lated a plastic deformation mechanism in glassy polymers in
which polymer molecules are oriented in the stress direction.
To support this view, he cited the existence of interference
colours on the fracture surfaces, arising from a layer of
oriented polymer.
Since Berry's work, a number of investigators have
adopted a fracture mechanics approach in studying polymer
properties. Fracture mechanics is based on the idea of 7
Griffith that in order for a crack to propagate in an elastic
solid, the amount of stored elastic energy S released as the
crack length c increases must exceed the energy required to

-6-
create two new surfaces.
. . 1 rdSJ Thus -- - ~ 2y iV .de
............ (2)
This is the criterion for crack propagation in an elastic
solid where W is the width of the specimen and the term -
is the strain energy release rate. Most materials are not
dS dC
perfectly elastic and the work of crack propagation includes
not only the surface energy term but also some work of in-
elastic deformation. Fracture mechanics formulae are easily
modified by including a plastic work term (for plastic, visco-
elastic, etc. energy dissipative processes around the crack
tip). This parameter is the fracture toughness (denoted by 1 1
the symbol GC) and GC = 2y + yp . . . . . . . . . . . . (3)
wh~re yp represents the work of plastic deformation. This has 12 13 14
been suggested independently by both Irwin and Orowan,
thus the modified Griffith equation is expressed as
·[EGC1 t . ac -= --ne
............ (4)
where the subscript C has been added to indicate that the
equation reflects the critical condition for crack advance.
Naturally enough GIC is called the critical strain energy
release rate or plane-strain toughness associated with
cleavage (mode I failure).
The principal drawback of the Griffiths energy balance
approach to fracture mechanics is that one needs to know the
value of y, -a quantity which is difficult to measure and even
more difficult to calculate. A different approach is that
-7-
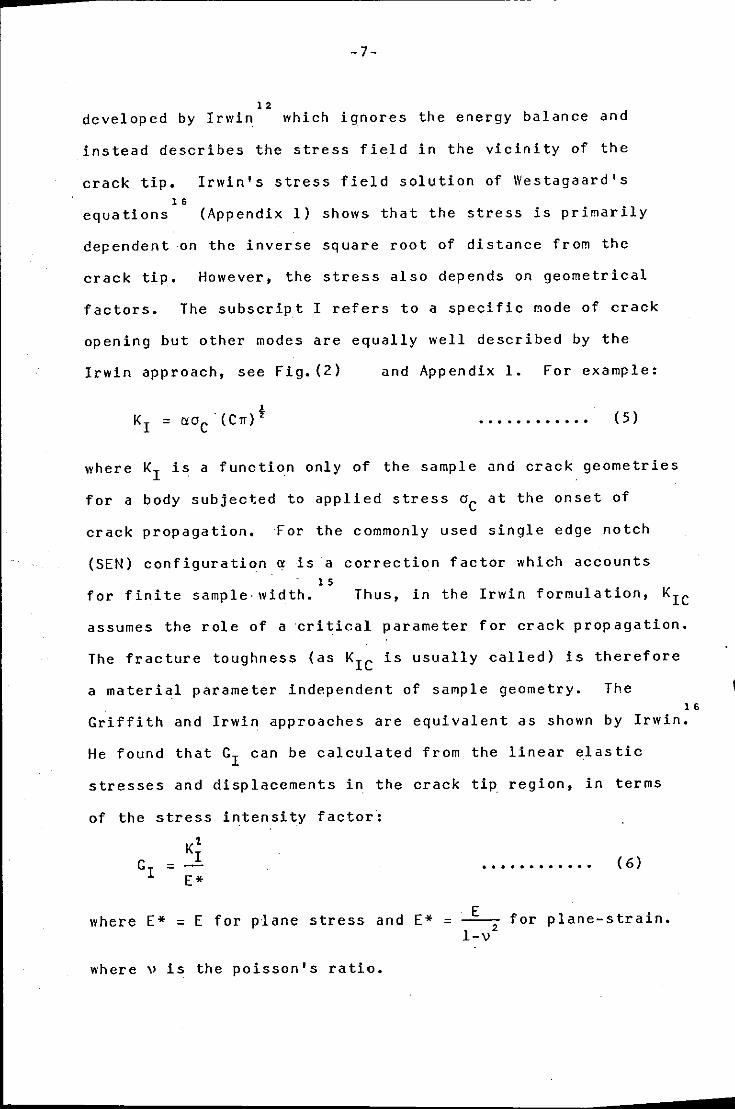
1 2 developed by Irwin which ignores the energy balance and
instead describes the stress field in the vicinity of the
crack tip. Irwin's stress field solution of Westagaard's 1 s
equations (Appendix 1) shows that the stress is primarily
dependent on the inverse square root of distance from the
crack tip. However, the stress also depends on geometrical
factors. The subscript I refers to a specific mode of crack
opening but other modes are equally well described by the
Irwin approach, see Fig.(2) and Appendix 1. For example:
............ ( 5)
where K1 is a function only of the sample and crack geometries
for a body subjected to applied stress oC at the onset of
crack propagation, For the commonly used single edge notch
(SEN) configuration ~ is a correction factor which accounts 1 5
for finite sample·width. Thus, in the Irwin formulation, KIC
assumes the role of a critical parameter for crack propagation.
The fracture toughness (as KIC is usually called) is therefore
a material parameter independent of sample geometry. The 1 s
Griffith and Irwin approaches are equivalent as shown by Irwin.
He found that G1
can be calculated from the linear elastic
stresses and displacements in the crack tip region, in terms
of the stress intensity factor:
Kt I
E*
where E* = E for plane stress and E* =
where v is the poisson's ratio.
. . . . . . . . . . . . ( 6)
E 2
1-v for plane-strain.

-8-
The difficulties involved in the use of the stress
intensity factor {K) can be avoided by using the equation
developed by Irwin and Kies for a crack of unit width, W
{see Appendix 1).
dA f_
2
[dR] W dC
.......... {7) = 2y = 1 F 2 dR = 1 2 2
where F is the load required for crack propagation and R is
the compliance of the specimen. Thus the slope of the
straight line ~~~~ determined from a plot of R versus C is
constant, i.e. independent of specimen geometry, see Figs. {3-5)
Further and more important, for an infinitesimally
small amount of crack growth this equation is equally valid
for a cracked body under fixed displacement {5) or constant
load {F), {see Appendix. 1). 17 18 19
Mostovoy et al developed a tapered double canti-
lever beam test specimen design for Mode I failure such th~t
the compliance decreases linearly as crack length increases.
The explicit form of the equation {2) for the double canti-
lever beam is
= 2y = .......... {8)
where h = beam height
E = bending modulus
Fe = applied load
w = width of the specimen
c = crack length

-9-
Note that the specimen is contoured such that
[~C2
+ ~]= t1 = Geometry factor constant . . . . . . . . . . ( 9)
This approach has been used successfully during the
current study of crack propagation at constant load where the
fracture energy is independent of crack length !· The
Mostovoy equation became
............. ( 10)
Thus, by measuring Fe and E the value of GIC can be determined.
From this it is clear that measurement of the crack length (C)
is not required. Thereby lies the main advantage of this geo-
metry as the crack length cannot be measured accurately -
especially when testing at non-ambient temperatures.
However, there are of course many values of M that can be
used in designing the specimen. For bulk polymers the speci-1
mens are made quite stiff (M = 3cm ) to minimise bending
stresses and hence arm break off. A convenient contour for 1
testing adhesives is M = 90 cm Fig. (6). Contoured specimens
of this type are referred to as tapered-double-cantilever bea~
(TDCB) specimens. ·It is worth noting that for large values of 1
M the expression for GIC is exact, i.e. M = 90 cm However, 1
at M values approaching 1 cm , corrections made using calibra-
tion techniques alter the calculated M value by as much as 30 2 0
percent.

-10-
An alternative approach has been reported by Bascom et 2.1
al, where the fracture energy (G!C) is almost independent
of the crack velocity. They proposed a uniquA failure criter
ion for fracture by considering the plastic zone size (2 r 1cl
et the tip of a crack in an elastic-plastic material.
In plane strain, GIC is given by
............ (11)
Now the yield"strain ey' of polymers is frequently insAnsitive 22
to strain rate and thus equation 11 may be simplified hy the
substitution
0 = E A y y ............ ( 12)
Therefore
2 2
GIC = I)TT(l - \) ) e E riC y ............ ( 13)
GIC can be calculated from equation 13 when the electronic
speckle pattern interferometry technique is used, ThusriC
becomes the controlling parameter in the equation 13. Assuming
that within the deformation zone there is a wedge of material
at the yield stress (o ) but at the failure strain (ef). . y
Surrounding this area is a region where the ~aterial is at the
yield stress and strain (e ). This region extends to the . y
elestic-plastic boundary which envelopes a region having a
diameter of 2 rrc·

-11-
2.1.2 Plane-Stress and Plane-Strain Plastic Zone
If the plane-strain condition prevails the crack propa-
gation with its associated triaxial stress field (ox' cry• oz)
exists in the interior of the body and, for plane-strain, the
strain normal to the surface must be zero while for plane-2 3 2 4
stress the stress normal to surface must be zero. However,
these two regions are never clearly defined and intermediate
stress states may exist. even though the fracture surface which
appears flat. Hence the plastic deformation zone size may be
expected to decrease gradually as the constraint changes from
plane-stress· to plane strain Fig. (7). The physicial signif-
icance of this constraint and specimen thickness on crack bond
toughness has been explained in terms of plastic flow. However,
the amount of elastic contraction (Poisson's Ratio) is small
compared to the plastic contraction at the crack tip. A
restriction to plastic flow arises when the plastic zone is
large compared with the thickness of the specimen and yielding
can occur freely in the thickness direction Fig. {8). In this
case plane-strain is nnver achieved. Nevertheless when the
plastic zone is small the surrounding elastic material contains
the yielrling and the through thickness strain is reduced to
zero. However, the constraint at the tip of the crack is
!~creased as the thickness of the specimen increases and it
reaches a maximum constraint when the thickness is sufficiently
1 ar ge. -- ---- --------- - ---- ---- . 2 3
The minimum thickness has been established by ASTM
and given by
. • .......... . (14)

-12-
The variation of the plastic zone diameter (2rcl with thickness
is one reason for the imposition of size requirements in the
testing procedures developed, This ensures that fracture takes
place under plane-strain conditions and has dominated the crack
propagaqon.
The plastic deformation pattern at the tip of the crack
under plane-stress conditions is quite different-from that
under plane-strain. This is because in plane-stress a 45°
shear pattern is predominant, while in plane-strain a hinge 2 4 r 2.0
type of plastic deformation is developed.
Thus, the similarity of the plastic deformation zone shape
could be considered as another criterion of the plane-strain
domination.
-13-
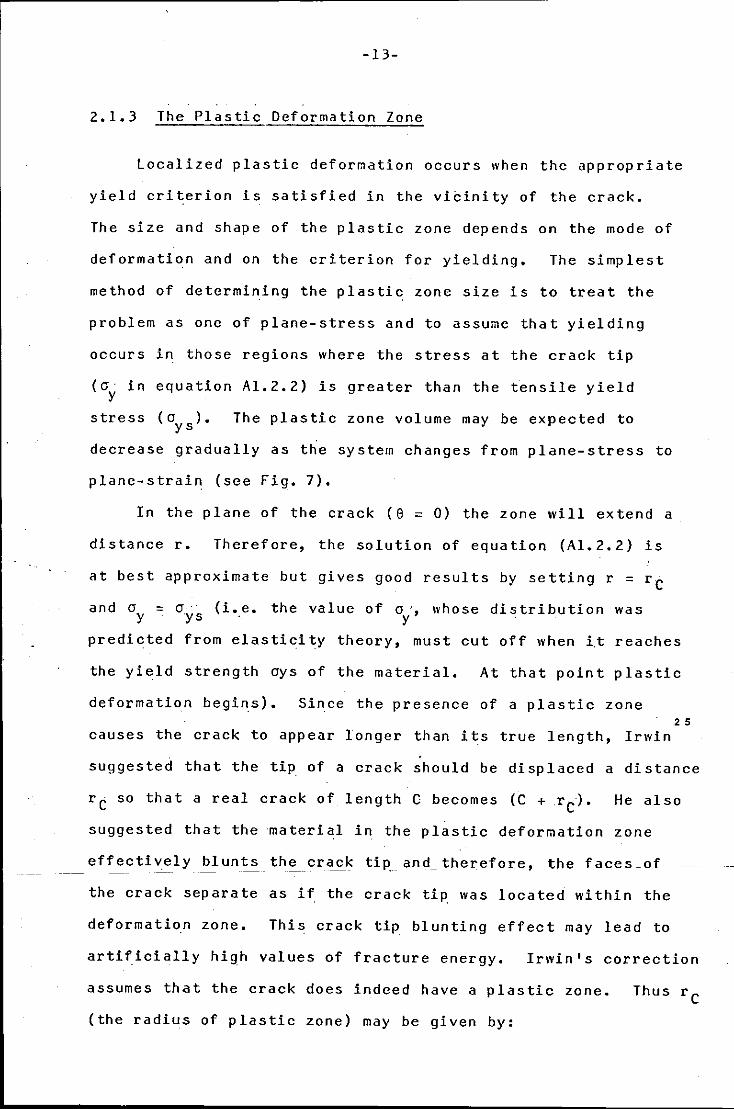
2.1.3 The Plastic Deformation Zone
localized plastic deformation occurs when the appropriate
yield criterion is satisfied in the vicinity of the crack.
The size and shape of the plastic zone depends on the mode of
deformation and on the criterion for yielding. The simplest
method of determining the plastic zone size is to treat the
problem as one of plane-stress and to assume that yielding
occurs in those regions where the stress at the crack tip
(o in equation Al.2.2) is greater than the tensile yield y
stress ( oys). The plastic zone volume may be expected to
decrease gradually as the system changes from plane-stress to
plane-strain (see Fig. 7).
In the plane of the crack (9 = 0) the zone will extend a
distance r. Therefore, the solution of equation (Al. 2. 2) is
at best approximate but gives good results by setting r = re
and o = o ·· (i.e. the value of o ·, whose distribution was y ys . y . .
predicted from elasticity theory, must cut off when Lt reaches
the yield strength oys of the material. At that point plastic
deformation begins). Since the presence of a plastic zone 2 5
causes the crack to appear longer than its true length, Irwin
suggested that the tip of a crack should be displaced a distance
re so that a real crack of length C becomes (e + r~). He also
suggested that the material in the plastic deformation zone
effectively blunts the crack tip and_ therefore, the faces _of
the crack separate as if the crack tip was located within the
deformation zone. This crack tip blunting effect may lead to
artificially high values of fracture energy. Irwin's correction
assumes that the crack does indeed have a plastic zone. Thus re
(the radius of plastic zone) may be given by:

-14-
1
KI = (J (21! r ) ' ys c • • • • • • • . • • .. • ( 15 )
<'
r:~ r 1 so re = (for condition of plane-stress)
21! ys
If plane~strain conditions prevail (i.e. the major portion
of the structure is flat), a smaller degree of plastic
deformation occurs than when plane stress prevails. Con-
sequently the energy required for crack propagation decreases
as the extent of plane-strain behaviour is increased.
The plane-strain plastic zcne radius is normally taken
as one third of the plane-stress value. Thus, in plane-
strain, r 1 C is given by:
By
= 1
61!
re-arranging
2 K IC = 61!
[:IC]
2
ys
(16a) and
2
riC 0 ys
............ ( 16a)
camp ar ing with equation (6) gives:
E GIC = 2 . . . . . . . . . . . . ( 16b)
1 - V
where E is the bending modulus of elasticity and v the
Poisson's Ratio.
As a result a lower value of fracture toughness is
obtained under plane-strain conditions than when the plane-
stress contribution dominates. 2 6
Mostovoy and eo-worker _<>bser_ved an_inverse relationship
between GIC and both the tensile modulus and the tensile
strength of an epoxy resin (DGEBA) cured with hexahydropthalic
anhydride (HHPA). This is clearly unexpected from equation 16.

-15-
Therefore more work was required to establish the inter
relationship between resin tensile properties and fracture
energy. They considered an Irwin correction (under plain-
strain conditions) but took no account of the inelastic
deformation near the tip of a crack and relied on the assump
tion of perfect elasticity or small scale yielding up to the
point of fracture. Indeed the circumstances are that the non-
linear (or plastic) zone may be regarded as embedded well
within a surrounding elastic region.
-16-
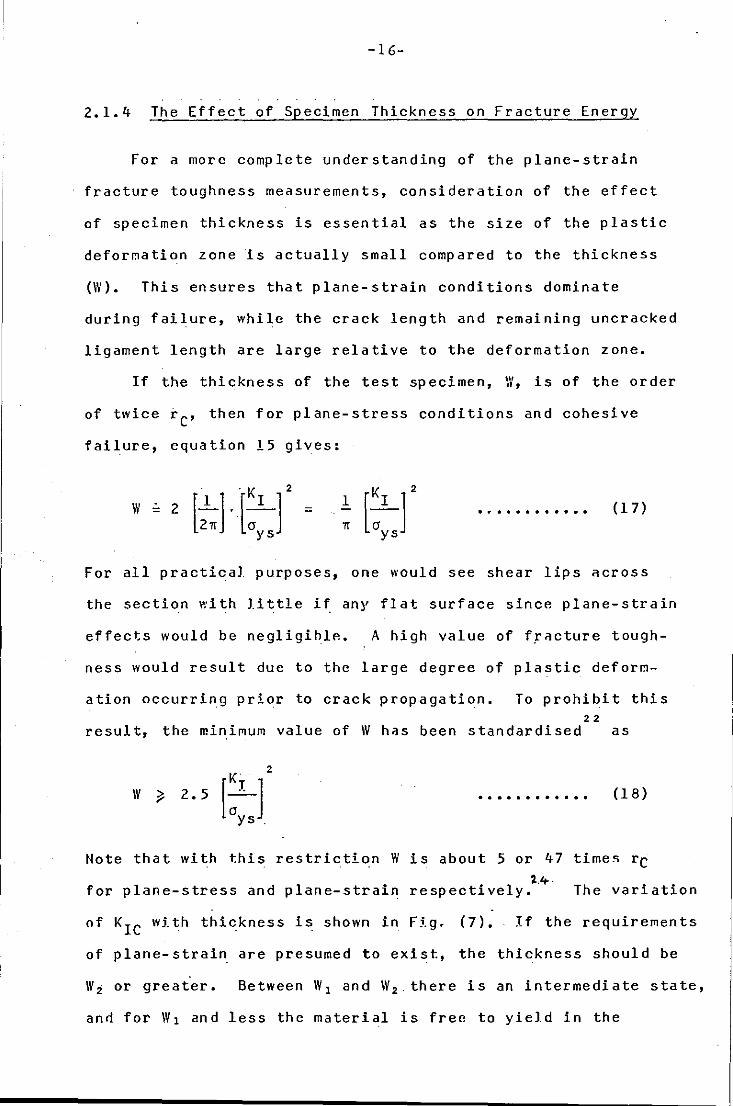
2.1.4 The Effect of Specimen Thickness on Fracture Energy
For a more complete understanding of the plane-strain
fracture toughness measurements, consideration of the effect
of specimen thickness is essential as the size of the plastic
deformation zone is actually small compared to the thickness
(W). This ensures that plane-strain conditions dominate
during failure, while the crack length and remaining uncracked
ligament length are large relative to the deformation zone.
If the thickness of the test specimen, I, is of the order
of twice re, then for plane-stress conditions and cohesive
failure, equation 15 gives:
IV- 2 [LJ·C:J2 = • p • • • • • • • • • • ( 1 7)
For all practical purposes, one would see shear lips Rcross
the section with little if any flat surface since plane-strain
effects would be negligible. A high value of fracture tough-
ness would result due to the large degree of plastic deform
ation occurring prior to crack propagation. To prohibit this 22 result, the minimum value of IV has been standardised as
[OKJ: ]
2 IV ~ 2.5
ys .
. . . . . . . . . . . . (18)
Note that with this restriction IV is about 5 or 47 times re 1.4
for plane-stress and plane-strain respectively. The variation
of KIC wj_ th thickness is shown in F5.g. (7). If the requirements
of plane-strain are presumed to exist, the thickness should be
\Vi or greater. Between W1 and W2 there is an intermediate state,
and for IV 1 and less the material is free to yield in the

-17-
thickness direction, i.e. it is in the plane-stress state.
The plane-strain restrictions which have been described are
very severe and ensure that the plane-stress regions at the
surface are small compared with the overall dimensions.
However, the fulfilment of plane-strain conditions in high
yield strength materials can be achieved with much thinner
specimens whereas very large sections of low yield strength
material may never bring about a fully plane-strain condition. 28
Tetelman and Robinson. showed that even for the mild steel
Charpy tests (IV = 10 mm) plane-strain is prevalent over the
central third of the specimen.

-18-
2.2 Epoxy Powder Coatinq Chemistry
2.2.1 Epoxy Resins
The resins are aliphatic aromatic polyethers with term-
inal epoxy groups and secondary hydroxyl groups. These
products are not hardcnable on their own. They are stable to
0 a large extent up to a temperature of about 200 C. This means
that under these conditions the functional epoxy and hydroxyl
groups do not react to any extent with each other or them-
selves. In the presence of a curing agent a three dimensional
network can be formed by reaction with the hydroxyl groups.
The resulting thermosetting resin is a hard, infusible, inert
solid with excellent adhesive properties.
An epoxy resin molecule has been defined as containing
more than one reactive epoxide group, which is a three membered
oxide ring. The simplest epoxy configuration is called a-epoxy
or 1,2 ethylene oxide,
0
I \ H- c--c-H a, epoxy
I I H H
The epoxy resins are usually prepared by polymerisation
reactions of bisphenol A with epichlorhydrin in the presence
of excess caustic soda (NaOH). Two reactions of the phenolic
hydroxyl group bring about the polymerization:
(1) Condensation with chlorine to eliminate HCl,
(2) Terminal epoxide groups "addition" react with the
phenolic hydroxyl group to open the epoxide ring thus producing 2 9
one hydroxyl group.

-19-
!1) CH s I
CH2-CHCH2Cl+HO-@ c-@-oH
\/ ~Hs epichlordyrin
(2)
bisphenol A
diglycidyl ether of bisphenol A
(epoxy resin)
The reactivity of epoxy resins arises because of the
epoxy groups at the ends of t~e structure. The phenolic
hydroxyl groups (which lead to poor colour in phenolic resins)
are entirely converted to ether links in epoxy resins (which
are of good colour). The hydroxyl groups are responsible for
polarizing the resin and ensuring good adhesion to polar or
metallic surfaces; Epoxy adhesive resin chains contain only
carbon-carbon and ether linkages. Both are very stable. The
resins on their own are brittle after polymerization, due to
the introduction of benzene rings. Rigidity and thermal
strength are achieved by cross-linking with other molecules.
The cross-linking takes place between the reactive epoxide
rings and hydroxyl groups. The resulting flexibility of cured

-20-
epoxy resins arises because the cross-links are not tightly
packed (close together). The highly cross-linked nature of
epoxy resins causes them to exhibit excellent dimensional
stability and good chemical ~esistance. Epoxy resins also
show negligible shrinkage on curing and this results in a
good surface finish.

-21.-
2.2.2 Acid Anhydride
Anhydride hardeners are well known in epoxy technology
as excellent curing agents for high temperature applications.
Tricarboxylic (trimcllitic) anhydride (TMA) is a very
reactive acid anhydride due to the free carboxyl group which
tends to accelerate cure (cross-linking) with epoxy resins.
TMA is a white crystalline powder of molecular weight 192 and
has a melting point of l68°C. In this project it was dissolved
In the epoxy resin at 125°C in order to function as a curing
agent. It is generally post cured at temperatures around 180°C
0 and yields heat distortion points at about 200 C.
HO-C 11 0
trimellitic anhydride (TMA)
The reaction between epoxy resins and the acidic anhydrides
are complex and are dependent on gel time and temperature,
post-cure time and temperature, type of accelerator, hydroxyl
group content, resin-anhydride ratio and amount of free-acid.
Epoxies cured in the presence of acid anhydrides (e.g.
TMA) produce extensively cross-linked products which exhibit
good mechanical and electrical properties high chemical resist-
ance, dimensional stability and high strength compared with
unmodified epoxy resins.
In order to understand the curing mechanism it is import-
ant to appreciate that the anhydride will only react directly 3 0
with the epoxide group in the presence of an accelerator.

-? 2-
However, in the presence of the hydroxyl groups of the
epoxy resins, the anhydride will react to form a monoester.
The carboxylic acid portion of the monoester can then react
with an epoxy group to form a hydroxy diester. The hydroxyl
qroup of the diester can undergo reaction with anhydride to
form ~nother carboxyl group eventually yielding exclusively
diester groups. An anhydride curing age11t is preferred to a
carboxylic acid to avoid the formation of volatile by-products. 3 1
Also, solid acid anhydrides prevent caking of the resin powders.
Rapid curing is possible with H1A modified (with "11odaflow"
which is an Acrylic resin, see Table l) epoxy resins in the 32
presence of stannous octoate because this is multifunctional
and gives rise to the desirable high cross-link density in a
powder coating.
Carboxyl and hydroxyl groups react very readily with the
epoxide ring whereas the anhydride group interacts only slug-
gishly at 200°C in the absence of a catalyst. The first
reaction whicl1 takes place is the fast reaction bet~een the
anhydride ring and the epoxide causing the anhydride ring to
open and yield a monocarboxylic ester
(l) $ ~
H-C-OH
i
Subsequent to this reaction, seven other reactions can occur.
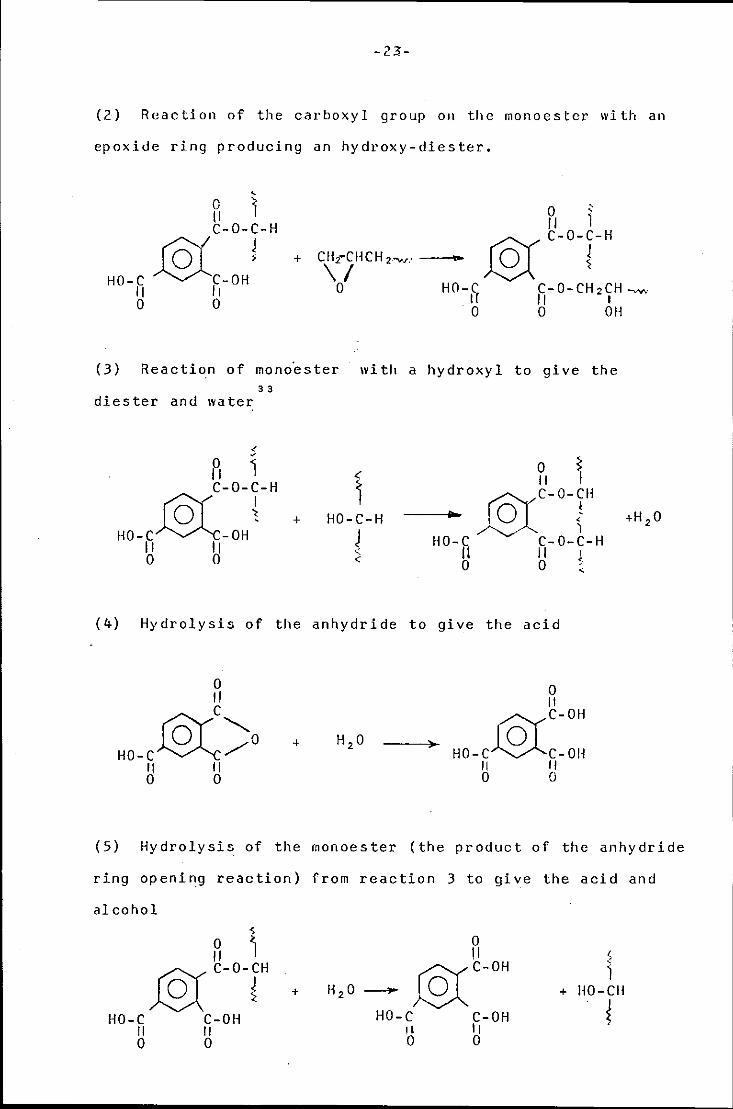
-23-
(2) Reaction of the carboxyl group on the monoester with an
epoxide ring producing an hydroxy-diester.
0 11 C-0-C-H
0 ~ 11 1
J§:(C-OH~ 11
+ CH2~CHCH 2-w.· _ __,,. \I
@( C-0-r-H
HO-C 11 0 0
0 HO-C C-O-CH2CH -vw I [ 11 t 0 0 OH
(3) Reaction of mono~ster witlt a hydroxyl to give the 3 3
diester and water
5
R I ~C-0-~-H +
HO-C~-0H, 11 11 0 0
HO-C-H
J <
0 11
~C-0-JH
~)__ ) HO-C C-0-C-H
11 11 ) 0 0 '
(4) Hydrolysis of the anhydride to give the acid
0 11
~c"HO-c~/0
11 11 0 0
+
0 11
~C-OH
HO-C~C-OH 11 11 0 0
(5) Hydrolysis of the monoester (the product of the anhydride
ring opening reaction) from reaction 3 to give the acid and
alcohol ~
A ~ JSCC-0-r +
HO-C C-OH 11 11 0 0
0 !I
H20- J§:(C-OH
HO-C C-OH ll 11 0 0
~ I
+ HO-CH
{

-24-
(6) Reaction of the epoxide qroup with an anhydride carboxyl
group catalysed by the presence of acid (the product of
reaction 12). The cross-linking in cured products would
ther~fore consist exclusively of triester groups.
0 11 r,::;y C-0-C-H
~ ~ + HO-C CoCH 2 -CH~,_., /I 11 I .
0 0 OH
(7) Reaction between the hydroxyl and carboxyl groups
(esterification of secondary hydroxyl groups on high molecular
weight resins)
~ 1
H-C-OH + J ~
HO-C@ 11 0
(8) It was established beyond doubt that reaction between
epoxide and hydroxyl groups under catalytic conditions
yielded ether links
l z 1 H H
I I
H-C-OH + CH2 CHCH2-.,J - c H-0-C-C -v-'V-
f \I . t I I
0 H OH

-25-
In practice, it is found that reactions 1, 2, and 8 are of
principal concern and that ester and ether linkages occur at
about eqtJal frequency in the cured structure.
The etherification reaction (8) proceeds rather independ-
ently in an acid medium. However, the etherification takes
place to a negligible extent in the pure resin. In the
presence of the anhydride, etherification proceeds under the
catalytic influence of the anhydride and, even more, the free
carboxyl groups.
Analytical studies of the curing process in resins has
confirmed that in every case the disappearance of the epoxy
groups is much more rapid than is the appearance of diester
groups and triester groups. It seems therefore that the epoxy-
group must be involved in fur~her reactions apart from reactions
2 and 6. It is established that etherification takes place 3 4
between epoxy groups and hydroxyl groups (reaction 8). Welger
has expressed the view that one cyclic group per epoxy group
is necessary for complete cross-linking. At the same time he
has derived a formula for the cured resin in which ester groups 3 5
occur exclusively. Other workers have shown that, apart
from esterification, etherification occurs almost to a similar
extent even when equimolecular quantities of glycidyl ether
resin and trimellitic anhydride interact in the absence of
hydroxyl groups since the cross-linking is based on diester
and ether bridges in all circumstances.
-26-
2.2.3 Cross-Linking
The difference between thermoplastic and thermosetting
resins is that the latter group of materials are inherently
highly cross-linked. The cross-linking between the epoxy
resin molecules is achieved through the epoxide or hydroxyl
groups of the resin via the curing agents. In general,
highly cross-linked polymers exhibit excellent three-dimensional
stable networks held together by covalent bonds. When a polymer
is cross-linked the molecular mobility is reduced. Plastic flow
is therefore less likely to occur at the tip of a propagating 30
crack, reducing the effective fracture energy. Berry has
confirmed this by preparing a cross-linked PMMA (polymethyl
methacrylate) copolymer using 10% ethylglycol dimethacrylate
as a cross-linking agent. The fracture surface energy of this
material was _2
as compared to"l20::Jm for uncross-linked 3 6
PMMA. However, Griffith and Holloway have used Araldite
CJ200 and hardener HT901-phthalic to study the effect of vary-
ing the ratio of hardener agents to resin. They found that the
lightly cross-linked epoxy resin had a fracture energy of _2
1.0 ::Jm while the highly cross-linked epoxy had a value of _2
100 ::Jm In addition they measured the inherent flaw size of
these materials and found that their size also decreased with 37
increasing cross-link density.· Broutman et al · used two
thermosetting resins, (1) an epoxy resin and (2) a polyester
resin (with styrene as cross-linking agent) and found that the _2
epoxy resin fracture energy was 43 ::Jm , but a slight increase
in fracture energy was obtained by increasing the styrene
content up to about 50% by weight in the polyester resin system. 38
Selby used Epikote 828/Epikure DDM (20-40 part DDM) cured

-2 7-
~ystems to study the effect of variation of the hardener (DDM)
content on the fracture properties. He reported that the
simple concept of cross-link density alone cannot explain the
variation in fracture energy. He observed a peak in the
fracture,energy versus DDM content curves at approximately 35
parts DDM. In this work it was confirmed that even for highly
cross-linked polymers, a large amount of plastic deformation
or flow takes place at the crack tip.
Relating the number of cross-links to the fracture
behaviour relies upon assuming that the main factor contribut-
ing to the total fracture energy is the energy dispersed during
deformation of material around the crack tip. 3 0
(See Berry ) •
In this work it has been confirmed that fracture and
mechanical parameters can be related to the topographical
changes in epoxy resins.
However, phenomena such as crazing are also believed to
be involved in the fracture of cross-linked materials although
the cross-linked network structure greatly inhibits its extent.
-28-
2.3 Historical Review of the Study of Crazes
2.3.1 Background of Crazes
The crazing that is associated with fracture in amorphous
polymers has been known for many years from simple observations.
Indeed fracture is usually preceded by the appearance of one or
more crazes. However, the correct interpretation of the role
which crazes play in leading to fracture could not be fully
developed until their morphology and mechanical behaviour were
understood.
The earliest ideas were that crazes were simply stable
micro cracks and that fracture would occur when the longest
craze reached a critical size. This view was abandoned after 39
Spurr and Neigisch showed that crazes were not simple cracks. 9 1 0 3 0
The work of Berry put the deformational aspect of craz-
ing on a quantitative basis. More importantly, he observed
that each fracture surface was covered with a thin layer of 40
crazed material. Kombour confirmed Berry's observation by 4 0 41
applying his refractive index technique to PMMA and demon-
strated that the refractive index of the deformed layers on
the fracture surface was very similar to that measured in a 41 42
craze ir. bulk PMMA. Kambour further demonstrated that a
variety of glassy polymers exhibit interference colours on
their fracture surfaces and using values of craze refractive
indices from his earlier work, he was able to calculate the
thickness of the deformed layers.
In an extended series of experiments and observations, 43 44
Hull and eo-workers developed a comprehensive picture of
fracture processes in glassy polymers. Their work is based

-29-
on optical and scanning electron microscopy (SEM) of fracture
surfaces and transmission electron microscopy (TEM) of crazes
in polystyrene thin film.
- ·~ ..
-30-
2.3.2 Crazes from a Fracture Mechanics Aspect
Although LEFM has been used to determine craze mechanical
properties, the actual value of such an approach is sometimes 45
questionable. Some workers have tried to establish craze
growth criteria in terms of a critical value of K1 (in thermo
plastic polymers). Although from a practical point of view
this approach may be useful when dealing with craze growth
from a crack tip, it is certainly less fundamental than
establishing a critical stress or strain criterion. Other 4 6 4 7
workers have tried to apply the fracture mechanics approach
to crazes by representing a craze as an 'equivalent crack' of
constant length, the only requirement being that the craze and
its equivalent crack produce the same stress concentrations at
their tips. As well as being of a non-physical nature, this
approach leads to problems in defining GC. This is because a
craze can dissipate energy by thickening without any attendant
inc_rease in length, thus giving rise to an infinite GC.
One of the more notable successes in the attempt to treat
crazes from a fracture mechanics point of view has been the use 48
of the Dugdale model to describe the geometry and stress dis-
tribution of the craze at a crack tip. The Dugdale model was
developed to describe yielding in steel sheets containing thin
cracks (slits). It assumes that the crack is embedded in an
ideal elastic-plastic material. The total crack length is 2c
(see Fig. 9) which includes narrow yielded zones of length Ac
at each end of the crack. The crack is in an infinite sheet
which is subject to a uniform tensile stress, a m. The stress
in the yielding zones is just the yield stress ay, and the

-31-
stress over the boundaries Df th~ rest of the crack is, of 49
course, zero. Dug dale makes use of · Mushelishvili 's solu-
tion of an anlogous stress problem and, with the constraint
that no stress exists at the crack tip, finds
t:.C 2 1T aoo = 2 sin . . . . . . . . . . . . ( 19)
c 4a y
or, for t:.C << c
2 2
t:.C 1T a "" c = Sa 2
............ ( 20)
y
Thus, the length of the yielding zone is determined (for a
given crack length C and applied stress (a) by the yield stress
acting over the zone length. An analytical expression for the
opening displacements in the yielded zones has also been 50
derived.
If the Dugdale crack with a plastic zone model is taken
to represent a crack and craze, then the equilibrium craze
length as well as the craze thickness profile should be deter-
mined by the applied stress, crack length, and yield stress in 47
the craze. Andrews and Bovan found good agreement between
measured craze thickness profiles in PMMA and the Dugdale
plastic zone shape. The Dugdale model is only suitable for
crazes, since the model can give no information about the
mechanical properties ofthe craze fibrils themselves. Such
information of overall craze mechanical properties is important. 51
Gerberich uses a modified Dugdale model in which the single
yield zone is replaced by two zones characterised by different
(but constant) stresses and this model agrees well with --
practical results. see Fig. (36) •

-32-
2.3.3 Craze Morphology
Crazes are a type of defect, common to amorphous and
semicrystalline polymers, which develop in response to a
tensile component of stress and represent a mode of very
localized plastic deformation. Crazes are crack-like in
appearance when observed with the naked eye. Closer examin-
ation, however, reveals a crucial difference between crazes
and true cracks. Although both features are planar and
separated from the defect-free bulk'material by sharp inter-
faces, crazes can be load bearing by virtue of a network of
fine fibrils which span the craze and connect one interface
to the other. The degree to which a craze may be load bearing
is determined by both the volume fraction of fibrils within
the craze and the physical state of the polymer molecules
which form the individual fibrils.
In isotropic polymers the craze plane is invariably
found to be perpendicular to the direction of the maximum
principal ten~ile stress. The craze fibrils are drawn in the
direction of the maximum stress and are thus oriented perpen
dicular to the craze/polymer interfaces.
Most crazes are typically thin (they are less than a
micron wide when grown to a length of several millimetres).
A detailed understanding of craze microstructure cannot be
gained without the aid of electron microscopy techniques. 52
Klempera earlier assumed that crazes were true cracks,
albeit very fine ones. The first report, written by Marine, 53
and Hsaio demonstrated the inadequacy of the above assumption
i.e. of the true crack view point, by using x-ray diffracto-
metry. They found that their polymer samples retained some
-33-
degree of structural integrity even when crazed across their
entire cross-sections and they found evidence for molecular
orientation in crazed samples. It was postulated that crazes
develop by separation of molecular chains in domains oriented
perpendicular to the applied stress direction. It is inter
esting to note that the formation of crazed material involves
major structural re-arrangements of the molecules. Such re-
arrangements would be associated with massive fracture if the
molecule chains were connected by cross-links. However, 54
Kambour and his eo-workers have developed a technique for
quantitatively determining the volume fraction of voids within
a craze. The technique makes use of the fact that the refrac-
tive index of a material is a function of its density.
Kambour was able to apply this technique to several
different polymers and found that all the crazes studied had
a void content of between 40% and 60%. He also found that the
void content of crazes was not very sensitive to environmental
conditions.

-34-
2.4 Electronic Speckle Pattern Interferometry (ESPI)
2.4.1 Introduction
For 12 years laser speckle was considered an unfortunate
consequence of worklng with coherent light. A group of
articles appearing in vario~s journals in the late 1960's 55 56 57
written by Leendertz, Archbold and Ennos, and Butters,
however, proved that the speckle phenomena, present with all
sources of coherent radiation, could benefit the stress analyst,
Recent advances in the field of experimental stress
analysis have been via the utilisation of coherent optics
through development of holographic and laser speckle interfer-
ometry. These optical techniques have been applied to the
measurement of surface displacement of deformable objects
having optically ~ough surfaces,
Holographic interferometry is a very powerful tool in the
measurement of su~face displacement. A holographic interfero-5 8- 6 1
gram has fringes which represent the relative displacement
of the object surface when a load is applied to it. Difficul-
ties exist in holography because of the sensitivity of the
measurements which require vibration isolation and the ability
to separate displacement components from a single hologram.
However, although the analysis-of such a fringe pattern is very 63
complex, several so-called speckle techniques have been
developed in which the relationship between the fringes ob-55~57 64
tained and the surface displacement i• fairly simple.
Electronic speckle pattern interferometry (ESPI) is one of
these. In addition, this technique is a direct measure of in-
plane and out-of-plane displacement components. It has the

. I ~
-35-
advantage that it uses a television recording system for
detection and processing. One disadvantage of ESPI compared
with holographic interferometry is that the video system has
relatively low spatial resolution. Since the speckle pattern
is the information carrier a small aperture viewing lens must
be used in order that the speckle be resolved by the video
system.
The speckles are clearly visible in the final fringe
pattern but the clarity of the fringes is considerably less
than that of good quality holographic fringes. ESPI techniques
are straight forward and easy to apply. The method uses the
scattered light speckle pattern produced when an optically
rough surface is.illuminated by coherent light. Static
measurements can be made by recording and comparing the speckle
pattern before deformation and after deformation of the object.
The displacement or the magnitude of the deformation can be
found from these speckle patterns. The method is non-contact
ing.
It is capable of handling dynamic problems. A general
theory of laser speckle interferometry which includes the out
of-plane deformation is developed and"discussed in Section
(2.4.2). The objective of this work was to extend the use of
ESP! techniques to measure the size of the plastic deformation
zone at the tip of a propagating crack in epoxy resins. A
tapered double cantilever beam (TOCB) was used in the investi
gation. Using this method, the plastic zone can be related
directly via fracture mechanics to the applied stress, which
can be obtained directly from the test jig, see Fig. (39).

-36-
2.4.2 Theory of Laser Speckle
(Basic principles of the technique)
The laser phenomenon has been observed ever since the 6 5
introduction of lasers in the early 1960's. When an opti-
cally rough surface is illuminated by a coherent source and
is imaged by a lens, the intensity of the image varies ran-
domly across the surface. This phenomenon is known as the 66
speckle effect. To characterize a laser "speckle pattern'',
a diffusely reflecting surface can be defined as one with a
roughness of the order of several wavelengths of the incident
coherent light (A) •. This phenomenon occurs because the light
arriving at a point in the image is scattered not from one
point but from an area on the surface of the object due to the
limited resolution of the lens. These speckles are a direct
consequence of interference and diffraction and can be thought
of as point sources attached to the object surface and describ-67
able by the mathematics of coherent optical theory.
The phase of the components of light scattered from
different parts of ,the resolution area to a point in the image
plane vary by 2u or .more and when these components are added
together, the resultant amplitude varies randomly in both
amplitude and ph~se and hence the intensity also varies random-
ly.
If the surface is displaced or deformed, the phase of an
individual component of light (i.e. of an object beam) scat-
tered from the resolution area to a given point in the image
plane is changed provided, however, that the displacement or
the deformation is not too large,· The relative phases of all
-37-
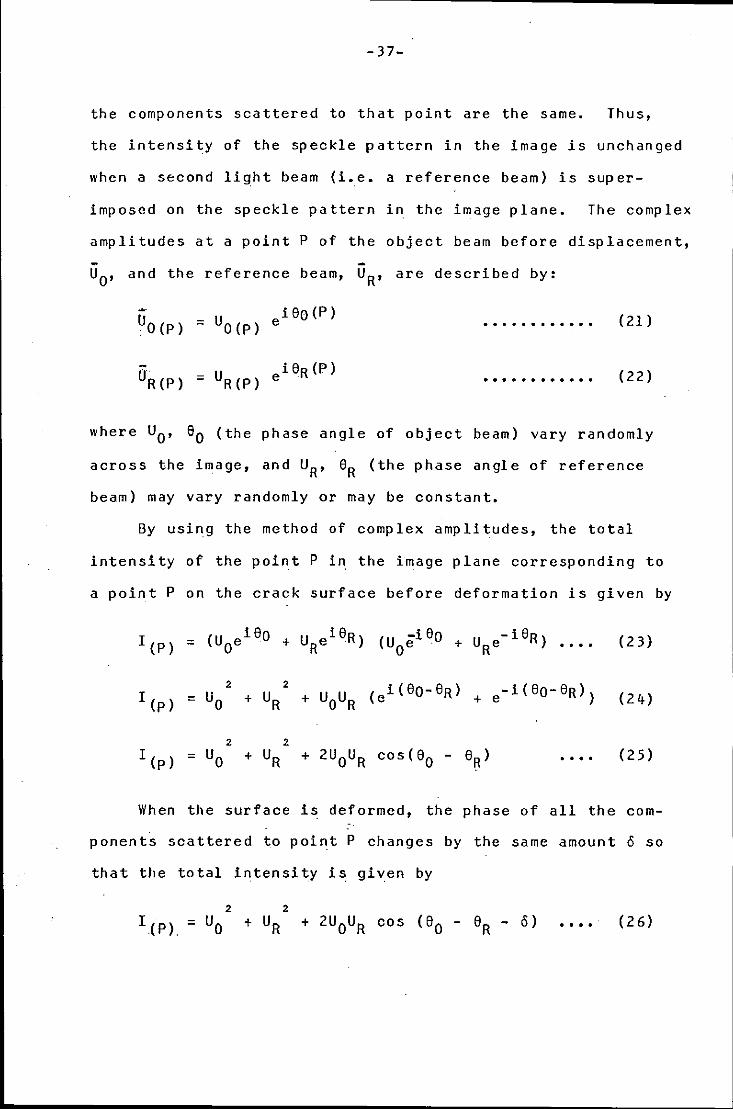
the components scattered to that point are the same. Thus,
the intensity of the speckle pattern in the image is unchanged
when a second light beam (i.e. a reference beam) is super-
imposed on the speckle pattern in the image plane. The complex
amplitudes at a point P of the object beam before displacement,
u0 , and the reference beam, UR' are described by:
. . . . . . . . . . . . (21)
. . . . . . . . . . . . (22)
where U0 , 60 (the phase angle of object beam) vary randomly
across the image, and UR' eR (the phase angle of reference
beam) may vary randomly or may be constant.
By using the method of complex amplitudes, the total
intensity of the point P in the image plane corresponding to
a point P on the crack surface before deformation is given by
( 2 3)
( 2 4)
2
+ UR + 2U 0 UR cos(e0 - eR) .... (25)
When the surface is deformed, the phase of all the com
ponent~ scattered to point P changes by the same amount 6 so
that the total intensity is given by
2
I(P) = UO •••• ( 2 6)

-38-
By comparing these two intensities (i.e. equations 25 and 26)
it follows that when
6 = 2nrr for n = 1, 2, 3 etc. . . . . . . . . . . . . (27)
the speckle patterns will be correlated (i.e. will remain at
the same intensity) and therefore will have high contrast and
a preponderance of black speckles. In regions where
6=(2n+l)rr ............ ( 2 8)
the speckle pattern will have low correlation and therefore 6 3
low contrast.
In the ESP! technique, the image plane of the system eo-
incides with the face plate of a television camera. The image
of the object in its undeformed state is recorded on a video
store (or tape recorder). The object is then deformed and the
live picture electronically substracted from the stored pic
ture. Thus the mean intensity and also the contrast of the
speckle pattern varies across the subtracted speckle imag~,
and this variation results in a fringe pattern mapping the
variation of o. The phase change 6 is a function of the deform-
ation of the surface. Information about the relative deform-
ation of different parts ofthe surface can be obtained from
the position of these lines. The intensity difference at the
camera is therefor~ dependent on the 6 (the localiz~d phase
shift in the object b~am due to th~ obj~ct deformation) term
which is a maximum when ·6 =rr and a minimum when 6 = 0. If
the object deforms a distance 6Z, the relative phase of the 6 8 6 9
two fields (objective and reference beam) will change by
6 = 211 ( 1 + COS 1jJ) 6 Z
A . . . . . . . . . . . . ( 2 9)
•

-39-
where 1)1 is the angle of illumination, n a phase difference.
Now it can be shown the phase difference is
6 = 4rr6z
A
(30)
Since the illumination is normal to the object surface (i.e.
1)1 the angle of illumination is zero and cos 1)1 is unity) it
can be shown that the fringe interval (the distance between
the centres of adjacent pairs-of dark fringes which show up
on the final processed image) are equivalent to out-of-plane-
surface displacement intervals of A in the z direction. In 2
other words, the observed dark fringes map out the deformation
in units of A. where A = wavelength of Argon laser light = 2
0.514 )Jm. An ESP! fringe pattern is shown in Figs. (40-44).
The fringes represent the correlation between the two
images and are often referred to as correlation fringes of
the out-of-plane displacement, where the interval between them
is about 0.27 )Jm.

CHAPTER 3

-40-
3. EXPERIMENTAL WORK
3.1 Introduction
The tapered double cantilever beam (TDCB) technique was
used in the current work to study the fracture properties of
a range of paint systems with systematically varied cross'
link densities (produced by altering the hardener content).
The method chosen to relate the chemical characteristics of
epoxy resins to their mechanical properties was the fracture
surface energy parameter (y). Fracture tests were carried out
to show that y could be used to differentiate between the
resins of different hardener content. The variation of
fracture energy with changes in coating thickness were also
monitored.
Further information from ESP! work is presented to illus-
trate the mechanical change-over at the fracture energy maximum.
The change-over mechanism has been linked with the deformation
zone diameter at the crack tip.
In addition, in order to establish that materials produced
by the above methods were of adequate quality and homogenity a
series of tests were done which involved simple procedures and
which could be relied upon to prove the suitability of the
material and the method of production. For this purpose scan-
ning electron microscopy (SEM) was used, as well as optical
examination, to supply the information concerning the topography
of fracture surfaces.

-41-
3.2 Mechanical Testing of the (TDCB) Specimen
The epoxy resin may be considered as di-glycidylether of
biphenol A (DGEBA, see Section 2.2.1). The epoxy resin has a
molar mass of 800-900 and molecular weight Mw of 1350. This
value of AR means that n is the generalised epoxy molecule
has a value 2.
A range of epoxy powder coatings, whose stoichiometry
varied from 80% to 120% (their formulations are described in
Table 1) were studied in terms of fracture toughness using the
TDCB technique. The chemical structures of both the.epoxy
resin (Epikote 1055) and the trimellitic anhydride (TMA) as
cross-linking agent (curing agent) are given in Fig. {10).
The beams were constructed from mild steel shown in Fig.(6).
Shims of length about 0.038 m, width 0.01 m and of a wide range
of thickness (100-600 urn), were used at each end of the speci-
mens to control the bond thickness of the applied epoxy resins.
The shims also facilitated the initiation of cleavage in the
paint adhesive specimen. Springs at each end of the TDCB
specimens-were applied initially to hold the apparatus in place
as the resins cured, since bond pressure is desirable during
this stage. All the tests were carried out in tensile mode
(Mode I) on an Instron universal testing machine with a type
2511-312 load cell, Fig. (46). The main tests were carried out -1
at three different cross-head speeds (0.5, 1.0 and 2.0 mm min ).
Load versus extension curves were obtained for various specimens
in the usual way and are typified by Fig. (11). The experi-
mental parameters, i.e. the force (F), the deflection (o), the
width (W) and the crack length (C), were recorded at points
when the crack was in equilibrium.

-42-
The (TDCB) specimens prepared to be tested under constant
load at a range of curing temperature (170-260°C) and at
different curing time (0.25-3 hrs.). The fracture specimens
were tested under standard laboratory conditions, i.e. 21 ± 2°C
temperature and 60 ± 5% relative humidity.
Observation of the pre-cracked epoxide paint coating was
facilitated by an illumination technique. When the crack
reached its critical length, final separation then takes place
abruptly. Details of the testing and calculation procedure
are given in Chapter (2).
When the ESPI technique was used to measure the deform
ation zone around the crack tip, a specially designed jig was
used to (a) hold the TDCB specimen rigid and (b) to act as a
mode 1 loading device. This is shown in Fig. 09). Further
details concerning the design drawings and the equipment des
criptions are given in Appendix 2.

-43-
3.3 Specimen Preparation
In order to make reproducible samples with high precision,
attention was focussed on the cleanliness of the specimen
surface. Chemical ways of cleaning the substrate described by S6;
other workers have a number of drawbacks. It was found that
mechanical methods were more efficient, simple and economical.
(a) Chemical methods:
A typical schedule would involve soaking the specimens in
acetone (for typically six hours) and scraping with the sharp
edge of an aluminium blade to remove the previous coating and
then soaking in "Genklene" (1, 1, 1 trichlorethylene). A fine
grit emergy paper was used to remove any rough remainder.
Finally a light pickling solution was applied to remove
trace contaminants still adhering. Other solvents have also
been tried, instead of acetone, but without success (e.g.
methylene dichloride; dimethyl formamide). etc.
(b) Mechanical methods:
A typical schedule involved:
1) stowing the specimens at, 0 .
or near 250 C for 0.25 hr •. to .burn
off most of the epoxy resin;
2) using an aluminium or copper scraper to loosen remaining
debris;
3) subjecting the surfaces to light grit emergy paper to
remove any trace of the pre~ious coating.
N.B. Grit blasting directly was found to be impractical.

-44-
The procedure for powder coating application is detailed
below.
(1) Preheat the specimens for about foUr and a half minutes
in a preheated air circulating oven at a temperature of 250°C.
The two adherents were taken out of the oven with the faces to
be coated uppermost. Shims (according to the working bond
thickness required) were placed at each end of the adherent
surface. A thin layer of powder was sprinkled over the surface
through a fine mesh sieve. The powder fused quickly to form a
semi~transparent molten layer, confirming that the adherents
had reached the required temperature.
(2) Sprinkle further epoxy powder onto the substrate to build
up the required coating thickness. In. this proces~ the heat
is transferred from the substrate to the first mono-layer of
epoxy resin and then on to further layers in turn. It must
be noted that each powder layer will therefore have a slightly
different thermal histo~y. Finally springs at each end of the
TDCB specimens were used to hold the specimen during the curing . .
period.
Further details of sample preparation and mechanical
test were given in Section (3.2).
-45-
3.4 Optical Arrangement of Out-of-Plane Displacement
using ESP!
The following interferometric optical arrangement utilises
speckle phenomena which is sufficiently sensitive to detect
out-of-plane-surface displacement over areas of only a few
hundred microns. Thus the plastic deformation zone at the
tip of the crack, propagating under tensile forces, can be
investigated. This technique has now proved that fringes can
be obtained over a very small area using a microscope object-
ive, provided that the necessary differential surface move
ment is present. However, because of the small depth of focus
the working distance in front of the object lens is very
limited and because the measurement of solely out-of-plane-
surface displacement necessitates both normal illumination and
normal viewing the technique is not without its problems.
An optical arrangement to look at small surfaces is shown
in Fig. (12). The unexpanded laser beam is divided by a
beam splitter resulting in two beams (the object beam and the 70
reference beam). The expanded and spatially filtered object
beam is passed through a lens which could be translated in the
direction of its axis thus facilitating control over the size
of the illuminated object area. The laser beam is then
reflected off a semi-silvered mirror (80/20) through the view-
ing objective and thus on to the object surface. The reflected
object "speckle pattern'' caused by this illumination is then
imaged by the lens and mirror down to the camera face plate by
the viewing objective. The reference beam, also expanded and
spatially filtered by a pinhole centered on the mirror, is
simultaneously directed onto the camera face plate by reflection
-46-
off a glass wedge (with one uncoated face and one face anti
reflection coated to eliminate any additional reflected beam).
The combined speckle pattern and reference beam was imaged
on the camera tube by a glass wedge. The image plane of the
system coincides with the faceplate of a television camera and
the image of the object in its underformed state is recorded
in a digital video store (or a video tape recorder). The
object is then deformed. The speckle pattern, characteristic
of the deformed state, Fig. (46b) is then compared with that
of the undeformed state, Fig. (46a) by replaying the recorded
image over the live image and electronically substracting the
speckle pattern intensity distributions of the two signals.
It is found that the contrast of these fringes is consider
ably enhanced if the substracted signal is high pass filtered
and rectified. The fringe pattern, which represents contours
of. constant out-of-plane displacement in the object surface, is
formed on the faceplate of the television camera.
It is worth noting that as in conventional ESP!, the point
of divergence of the reference beam is made to be approximately
conjugate with the centre of the imaging objective (i.e. the
reference beam should appear to diverge from the centre of the
viewing objective when viewed from the camera position through
the wedge). This is necessary since the interference between
the object and reference beam must not be allowed to fluctuate
at spatial frequency which would be too high to be resolved by
the television camera.

-47-
3.5 Test Procedures
T~e production of out-of-plane displacement fringes by
the ESPI method at relatively high magnification ranges on a
stressed surface is achieved by using a constructed jig to
hold the TDCB specimens rigidly (i.e. to prevent the rigid
body motion of the object). An exploded diagram of the
specially manufactured and designed stress jig can be seen in
Fig.(39). Detailed drawings of the jig are included in
Appendix (2). The load was applied bi use of a Budenberg
Dead Weight Tester which enabled the load to be applied in a
controlled manner in discrete steps.
The actual load applied was obtained directly via pre
calibrated strain gauges, Figs. (13-15) attached to the two
main loading arms of the jig, Fig.(l6) to make a Wheatstone
Bridge circuit. The Wheatstone Bridge circuit was used to
connect the temperature compensating strain gauges. However,
to provide temperature compensation when two gauges are
employed, two separate dummies are required. Thus, when the
two gauges in the upper grips are active, the gauges in the
lower grips act as dummies and vice-versa, see Fig.(47)
As can be seen in Figure (48) the load was applied to
the axis of a vertical scissor-type arrangement via a yoke,
the rear of which was acted upon by the hydraulic piston
arrangement which was, in its turn, being activated by the
Dead Weight Tester.
The front end of the "yoke" pushed the "scissor arms'' of
the arrangement against the vertical wall shown, which in turn
pulled the actual tensile force application bars attached to
the TDCB in opposite directions, thus subjecting the crack tip
i ' ~- )

-48-
to a crack opening force, A practical arrangement of jig and
optics is shown in Fig_. (49), It was found to be extremely
difficult to obtain fringes at the crack tip. Light inten-
sities falling on the face plate of the camera from both the
object and the reference beam were found to be critical.
No measurement of the actual ratios, however, could be ob-
tained and one had to resort to trial and error until the
correct levels were obtained, Much of the difficulty in ob-
taining the fringes was due to through objective illumination
and viewing. This could easily be avoided by using a long
range working distance microscope adapted for use in the ESPI
technique. However, this technique yielded results which can
~used to quantify the size of the plastic deformation zone
which is related directly to the fracture energy (GIC) via
fracture mechanics para~eters, The parameter selected to
analyse was the mode I stress intensity factor variation along
the crack front in an ASTME E399-78a standard compact tension 2 3
specimen. The applied load was monitored with a double-
cantilever slip on displacement gauge, This gauge measured
the crack opening displacement at the mouth of the crack.
The TDCB specimen is universally used to measure the
plane-strain fracture toughness (KIC) of materials - looking
at Fig; (50) it ea~ be seen that the plastic deformation zone
is shown up by the correlated speckle fringes at the crack tip.
The ~ifference in the fringe patterns obtained under the same
loading conditions indicates differences in material strength.

-49-
3.6 Transition Temperature
3.6.1 Introduction
The temperature at which amorphous materials change
reversibly from hard, brittle, glassy soilds to softer, pli-
able and resilient solids is called the glass transition
temperature (Tg). This temperature for epoxy resins is
dependent on resin purity, curing agent, cure conditions and
the properties of the coating materials. The glass transition
temperature is indicated by discontinuous changes in physical
properties, e.g. thermal expansion, heat capacity, density or . 71 72
refractive index.
It has been shown that amorphous soilds are not in thermo-
dynamic equilibrium below their transition tempetatures and
thus can be regarded as solid ~upercooled liquids. As the
temperature is raised towards the Tg glassy mat~rials tend
toward the equilibrium point. At temperatures above the Tg
the toughness behaviour is similar to that of a rubbery plastic.
At this temperature any internal strains in the polymer are
r.el eased. Therefore, the Tg may be considered as the lowest
temperature at which annealing can occur, Fig. (17) and
Table (2).
Generally, the crazing stress ocraze depends strongly
upon temperature, decreasing as the test temperature is
~ncreased towards the glass transition temperature, Tg.

-50-
3.6.2 Thermo-Analysis Procedure
A Dupont 941 Thermo mechanical-analyser, linked to 990
thermal-analyser, was fitted with a p~netrometer so that '
thermo-mechanical analysis (TMA) could be carried out. A
relatively small sample of thickness (0.005 m) was required
to study the effect of variation in the composition and in
cure conditions (i.e. post-cure time and temperature) of the
epoxy resins~ The penetrometer (with a load of 0.01 kg) was
lowered until almost in contact with the sample at the base of
the sample holder tube. A heater positioned round the sample
was used to increase the temperature at a rate of (10°C/min).
The penetrometer measures directly the softening, or decrease
in modulus, which occurs in the glass transition region of the
polymer. The transition temperature was then estimated from
the change in slope of the displacement-temperature graph as
shown in Fig. (17). It is worth noting that the transition
temperature referred to is not necessarily the.glass-
transition temperature since evidence for more than one glass
like transition has been accumulating for some time, Fox and 73
Flory.

-51-
3.7 Mechanical and Physical Properties
3.7.1 Density
A density column is prepared from mixtures of two mix-
able solvents of different densities, or two solutions of
different concentration. This density column has a uniform
density gradient ranging from the density of the heaviest
solvent or solution at the bottom to that of the highest at
the top. Densities of solid samples may then be determined
from the position at which they float in the column. For
our purposes a density column covering the range 1 to 1.23 was
prepared as shown in calibration graph. 2
Samples were cut to 4x4 mm without rough edges and were
freed of grease. When the samples are gently dropped into
the density column, the height at which they come to rest can
be read using a travelling microscope. The density was then
determined from the calibration graph, see Fig. (18). The
results of this work are given in Table (2).
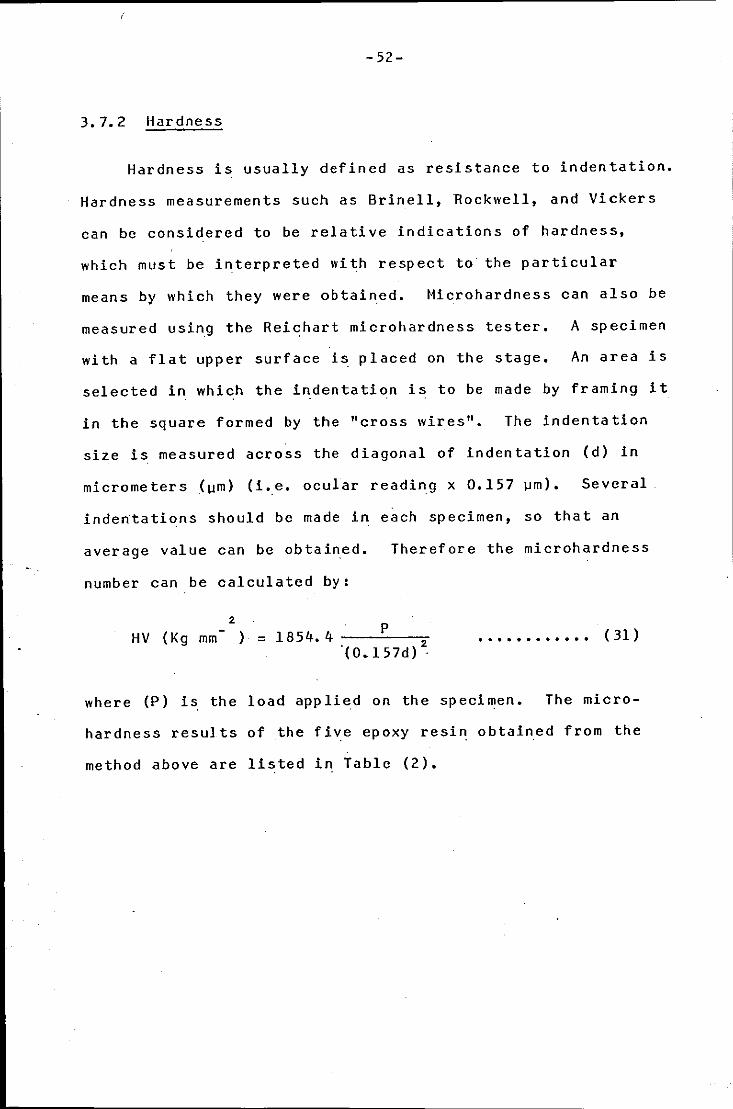
-52-
3.7.2 Hardness
Hardness is usually defined as resistance to indentation.
Hardness measurements such as Brinell, Rockwell, and Vickers
can be considered to be relative indications of hardness,
which must be interpreted with respect to the particular
means by which they were obtained. Microhardness can also be
measured using the Reichart microhardness tester. A specimen
with a flat upper surface is placed on the stage. An area is
selected in which the indentation is to be made by framing it
in the square formed by the "cross wires''· The indentation
size is measured across the diagonal of indentation (d) in
micrometers (urn) (i.e. ocular reading x 0.157 urn). Several
indentations should be made in each specimen, so that an
average value can be obtained. Therefore the microhardness
number can be calculated by:
2 p ) = 1854. 4 2
"(O.l57d) ·· • • • • • • • • • • • • ( 31 ) HV (Kg mm
where (P) is the load applied on the specimen. The micro
hardness results of the five epoxy resin obtained from the
method above are listed in Table (2).

-53-
3.7.3 Impact Strength
3.7.3.1 Introduction
Impact strength (or toughness) of materials can be
determined using conventional impact test methods, Fig. (51).
The impact energy is the product of the mass of the falling
weight (Kg) and its initial height above the test piece (m).
The falling weight impact test is repeated, increasing the
impact energy, until the sample fails. The toughness of the
material is defined as the energy absorbed (Kg. m) before
failure occurs. Thus, toughness is a measure not only of
the strength of the material, but also its ductility.

-54-
3.7.3.2 Impact Strength Procedure
To determine the toughness or the fracture resistance of
a thin layer of epoxy paint coating on sheet steel, a drop-
weight impact, or tubular impact tester, was used. The test
specimen shown in Fig.{52a) was used to determine the minimum
energy required to initiate a crack in the middle of the speci-
men. This figure shows a specimen before and after testing in
the apparatus shown in Fig. (51). The specimen is placed over 2
a tubular hole of internal diameter 2.54 x 10 m and a weight 3
of 1.0 Kg containing a 9,5 x 10 m radius ball is dropped from
increasing heights until failure occurs. The blow must be
normal to the surface of the specimen. Thus the minimum energy 2
required to crack the specimens of 5 x 10 m x 0.16 m can be 74
determined (B. S •. 1391 :1952). This procedure was used to
compare the toughness of .the five cured epoxy resins of dif
ferent bond thicknesses in the range lOO - 600 ~m. These were
applied to a mild steel substrate 250 ~m thick.
Impact testing is at best an approximate procedure and
serious doubts have been expressed about its reliability.
The toughness results of these epoxy resins obtained from the
method above are listed in Table (3). It has been found that
the toughness values determined by impact tests correlate well
with values obtained by conventional tensile testing.
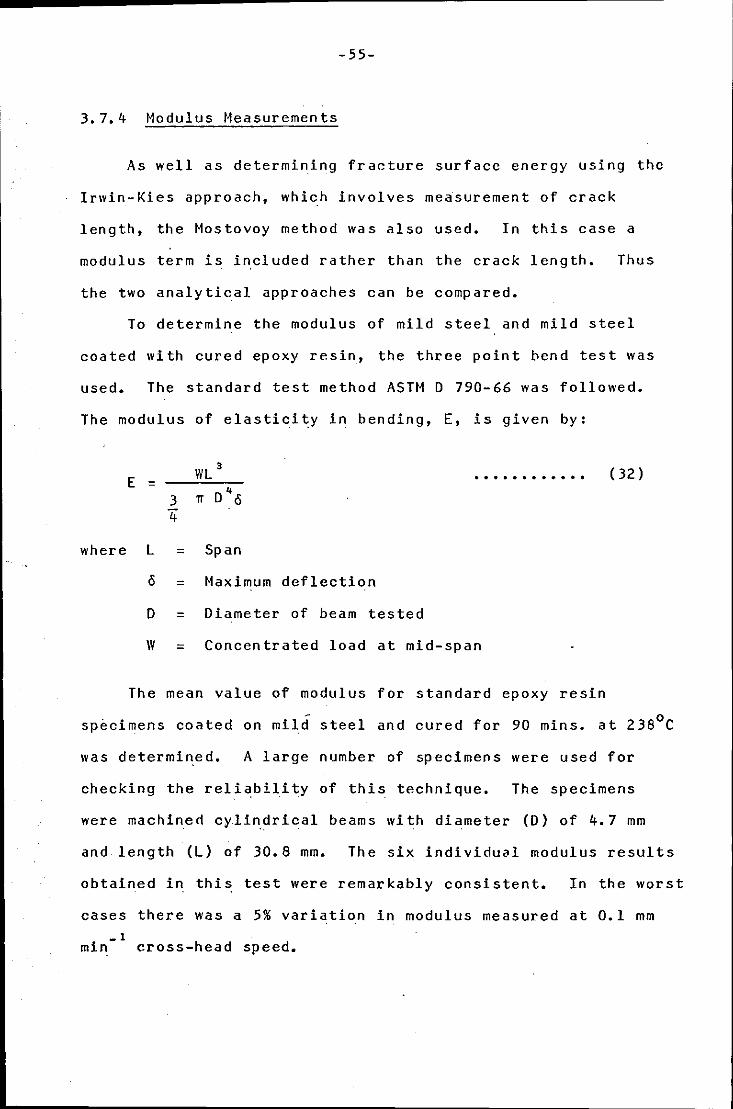
-55-
3.7.4 Modulus Measurements
As well as determining fracture surface energy using the
Irwin-Kies approach, which involves measurement of crack
length, the Mostovoy method was also used. In this case a
modulus term is included rather than the crack length. Thus
the two analytical approaches can be compared.
To determine the modulus of mild steel and mild steel
coated with cured epoxy resin, the three point bend test was
used. The standard test method ASTM D 790-66 was followed.
The modulus of elasticity in bending, E, is given by:
E = 3 4
4 IT 0 6
where L = Span
6 = Maximum deflection
0 = Diameter of beam tested
. . . . . . . . . . . .
W = Concentrated load at mid-span
(32)
The mean value of modulus for standard epoxy resin
specimens coated on mild steel and cured for 90 mins. at 238°C
was determined. A large number of specimens were used for
checking the reliability of this technique. The specimens
were machined cylindrical beams with diameter (D) of 4.7 mm
and length (L) of 30.8 mm. The six individu~l modulus results
obtained in this test were remarkably consistent. In the worst
cases there was a 5% variation in modulus measured at 0.1 mm
• - 1 m~n cross-head speed.

CHAPTER 4

--------------------------------------, -56-
4. RESULTS
4,} Fracture Surface Energy
4.1.1 Introduction
The fracture surface energy (y) of brittle glassy
thermo-setting resins has been studied by several workers,
(BP.rry, Irwin-Kies,_ Gurney, Mostovoy and Boscom, etc.)
In this work a tapered double cantilever beam (TDCB)
approach is adopted, using principles previously cited for
measuring the y value of epoxy adhesives. The various
alternative theoretical analyses (i.e. Berry, Gurney, etc.)
that can be used to process the data from a TDCB specimen
are described in Sections 4.1.3 and 4.1.4. The dimensions
of the. TDCB are described in Fig, (6)·.where it may be
noted that the epoxy powder coating effectively joins the
two halves of the mild steel beam together.

-57-
4.1.2 Berry's Analysis
The fracture surface work of a material can be obtained
by the cleavage technique, in which a crack is propag~ted
along the median plane of a TDCB specimen by a force applied
at the free ends. One of the most important features of 75"
Berry's method is that under conditions of constant deflec-
tion the system is inherently stable (i.e. the crack will grow
until the energy balance is re-created). The relationship
between the length of the crack in the sample (c), the force
(f) applied to the (TDCB) specimen, and the total deflection
(o) (up to the elastic limit) can be represented by the
equation
f = -n (ac )o
where a and n are constants.
. . . . . . . . . . (33)
Berry has established that plots of log f/o ~·log c
and of fo/w v.c (where w is the width of the crack plane)
should be linear. See Figs. (19-24). From the slopes of the
two linear plots, a value ofYcan be calculated
y = slope (f/s v.log c) x slope (fo/w v.c)
4
See Appendix (3).
(34)

-58-
4.1.3 Gurney's Analysis
Referring to Fig. (11). the load-deflection curve, the
area under the curve is a measure of the elastic and plastic
work done as the deflection increases with the loading and
rupture of the specimen. 76
Gurney and his eo-worker proposed
an approach to determine the fracture surface energy which has
advantages over other approaches. First, the physical explan-
ations involved are simpler and more direct than the stress
intensity factor concept. Second, the simplicity of the
method makes it very attractive for fracture studies. However,
there are cases when the approach can give rise to misleading 3 8
results since at any instant, the strain energy stored in
the body is directly equivalent to the area under the loading
line. He has established that if the area corresponding to
crack propagation is measured and converted acoordingly to an
energy value, then the fracture surface energy (y) can be cal-
culated by dividing the energy value by the fracture surface
area.
y =
Area under.load-deflection.graph.X.work conversion factor
Area of fracture surface
. . . . . . . . . . . . ( 3 5)
where the area under the load-deflection graph was calculated
from the general relation
Area of triangle ABC = 1 ab sin c •••••••••••• ( 36) 2
where the upper and lower case letters have the usual mathe-
matical significance. See Appendix (3).

-59-
4.2 General Comments
The analyses due to Irwin-Kies, to Mostovoy and to
Bascom have been selected to determine the fracture toughness
and fracture surface energy of five thermosetting epoxy resins
of different compositions (see Section 2.1.1). The fracture
surface energy results for stable failure (continuous propa-
gation) during the TDCB cleavage test show little scatter
provided that the crack propagates at constant speed. The
continuous propagation made dominates the low bond thickness
coating (100-200 ~m). However, higher bond thicknesses
(300-600 ~m) give rise to dis-continuous failure (crack
jumping). The load deflection graphs of typical specimens
are given in Fig. (11). The first part - a line with constant
slope - shows that the deformation to fracture is perfectly
elastic.
In the cleavage technique the speci~en was loaded using
.the crack opening mode of crack propagation, Fig. (11). The
peak value of force (f) corresponds to an initiation energy
y, and the valley to an arrest energy y. The effect of vari-2
ation in testing speeds (in the range of 0.5- 2 mm min ) was
evaluated experimentally. The effects of change in cure tem-
o peratures (150-260 C) and cure times (0.25- 3 hrs.) have also
been determined exp~rimentally and are shown in Figs. (25) and
(26). The crack lengths (m), measured accurately using a
travelling microscope, with width of crack surface (w) and the
force (f), were used to calculate the fracture toughness using
the Irwin-Kies equation (Appendix 1) and Mostovoy, Ripling and . . . .
Bascom et al equation, see Chapter (1).
-60-
4.3 The Variation of Fracture Energy with Bond Thickness
The effect of changing the coating thickness was invest
igated using the tapered double cantilever beam (TDCB) specimen.
The results in Figs.27-32 &35 show that a large variation in
fracture energy occurs and substantial doubt therefore appears
to be cast on the possibility of measuring a single value (y)
which would indicate the resistance of a material to fast
fracture. In this work the first case to be examined was that
for the stoichiometric resin (J 43 ) in order to determine the
effect of coating thickness. In first region, which is con
fined to"bond thickness less than 200 ~m, stable propagation
and low fracture toughness dominated the process. This low y
value is a result of increasing constraint on plastic deform
ation of the resin. In the second region, which is terminated
at the stable-unstable transition (at a bond thickness of
200 ~m), a high value of y was observed due to the deformation
zone being approxi.mately equal to the bond thickness. In the
last region of 300 - 600 ~m bond thickness, there is a further
decrease in fracture toughness,
The non-stoichiometric hardener resin compounds did not
show large distinctive areas of plastic deformation relative
to their bond thicknesses as has been shown for the stoichio
metric blend. The ~ize of the plastic deformation zone is
therefore unlikely to be related to bond thickness for the non
stoichiometric blends. The tip region.of the crack and the
region around the crack tip (plastic deformation zone) are
shown using a sequence of video-tape pictures for a crack prop
agating in an epoxy resin, Fig. (53). It is worthwhile noting

-61-
that for the epoxy resin of stoichiometric composition at a
bond thickness of 200 ~m, the crack tips are obviously blunt
and have a relatively large plastic deformation zone ahead
of the crack tip., Fig. ( 54c).

-62-
4.4 The Effect of Hardener Concentration
Crack propagation in the epoxy resins, cured with differ-
a ent amounts of TMA hardener and post cured for 1.5 h at 238 C,
was studied at 21±2°C using a range of cross-head displacement
rates. The variation in fracture energy with the THA/resin
ratio is one striking feature that can be illustrated using
the term cross-link density. It has been seen that increasing
the TMA/resin ratio up to the stoichiometric amotint increases
the cross-link density and toughens the resin. For TMA/resin
ratios greater than the stoichiometric value the fracture
energy (~) is not increased. The excess hardener in this
case has a plasticising effect which may inhibit development
of the plastic zone at the crack tip. In addition the gross
excess of THA in the resin will lead to some particles of THA
remaining unreacted inside the cured system, Fig. (55).
The variation in the thermo-mechanical transition temperature
with the TMA/resin ratio confirms that the highest cross-link
density is achieved in the non-stoichiometric resin L,a. The
stability of crack propagation is known to vary with amount of
curing agent. Large amounts of curing agent (i.e. greater than
100% stoichiometry) tend to promote unstable propagation at all
rates of testing while stable crack propagation dominated for
low amounts of curing agent (i.e. less than 100% stoichiometry).
In this work it was found that the tendency for cracks to jump
increased as the curing agent content was increased (i.e. the
length of the jump increased as the amount of cross-linking
agent was increased).
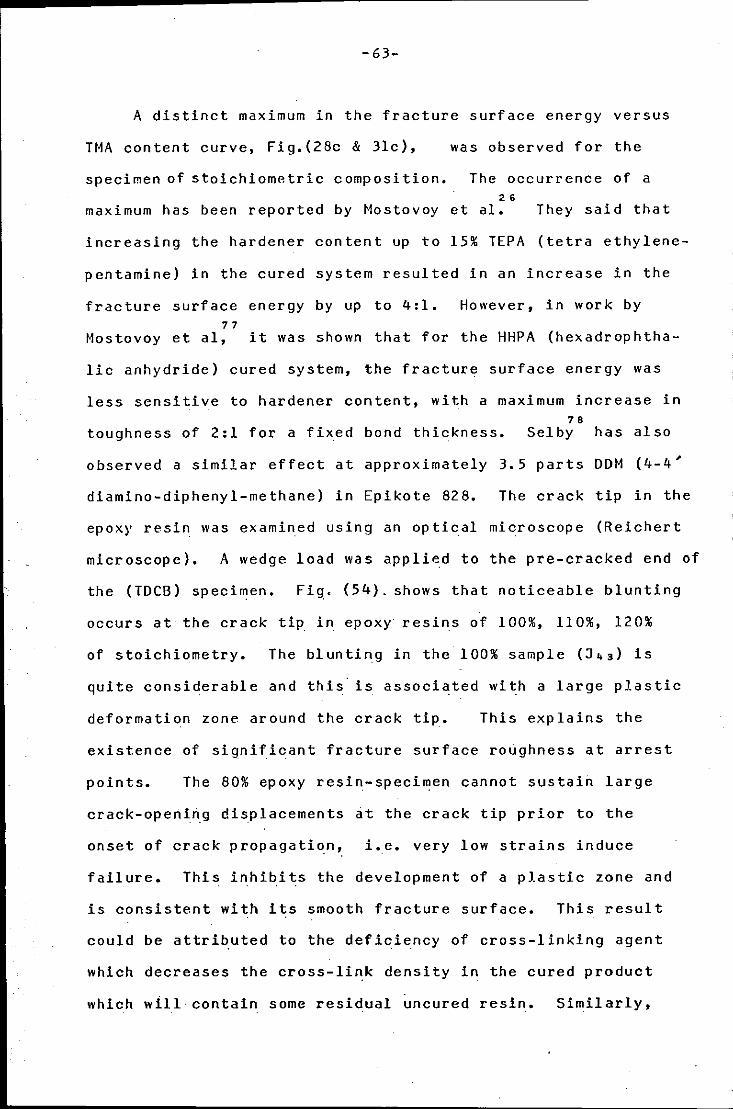
-63-
A distinct maximum in the fracture surface energy versus
TMA content curve, Fig.(28c & 3lc}, was observed for the
specimen of stoichiometric composition. The occurrence of a 2 6
maximum has been reported by Mostovoy et al. They said that
increasing the hardener content up to 15% TEPA (tetra ethylene-
pentamine} in the cured system resulted in an increase in the
fracture surface energy by up to 4:1. However, in work by 7 7
Mostovoy et al, it was shown that for the HHPA (hexadrophtha-
lie anhydride} cured system, the fracture surface energy was
less sensitive to hardener content, with a maximum increase in 78
toughness of 2:1 for a fixed bond thickness. Selby has also
observed a similar effect at approximately 3.5 parts DDM (4-4'
diamino-diphenyl-methane} in Epikote 828. The crack tip in the
epoxy resin was examined using an optical microscope (Reichert
microscope). A wedge load was applied to the pre-cracked end of
the (TDCB} specimen. Fig. (54}. shows that noticeable blunting
occurs at the crack tip in epoxy resins of 100%, 110%, 120%
of stoichiometry. The blunting in the 100% sample (J,,} is
quite considerable and this is associated with a large plastic
deformation zone around the crack tip. This explains the
existence of significant fracture surface roughness at arrest
points. The 80% epoxy resin-specimen cannot sustain large
crack-opening displacements at the crack tip prior to the
onset of crack propagation, i.e. very low strains induce
failure. This inhibits the development of a plastic zone and
is consistent with its smooth fracture surface. This result
could be attributed to the deficiency of cross-linking agent
which decreases the cross-link density in the cured product
which will contain some residual uncured resin. Similarly,

-64-
if an excess of TMA is added the fracture energy is decreased.
This is due to the excess cross-linking agent existing in
solid particle form within the cured resin matrix.

-65-
4.5 Effect of Testing Speed
The effect of cross-head displacement rate on the
fracture behaviour of five epoxy resins was studied using
the double cantilever beam (TDCB) technique at 21±2°C, In
the main three cross-head speeds, i.e. 0. 5, 1. 0 and 2. 0 mm 1
min were used, see Fig. (33), but preliminary experiments
were carried out at speeds less than 0.5 and greater than 1
2.0 mm min • The materials were found to be strain rate
sensitive and their fracture energy increased as strain rate
decreased. This is due to the degree of localised plastic
deformation which develops around the tip of the crack sub~
jected to the opening-mode loading (Mode 1) condition, Fig~
(2a}. The plastic zone is regarded as the controlling fea-
ture as it plays the role of crack tip blunting. It is worth
noting that crack growth in ·amorphous polymers is tradition-
ally viewed as comprising two distinct stages, i.e. firstly
initiation and then propagation. These terms are used to
describe both continuous and discontinuous crack growth.

-66-
4.6 The Curing Temperature and Curing Time
The purpose of the second stage of the work was to
determine the effect of curing conditions (i.e. varying the
number of cross-links) on fracture toughness. A series of
experiments were carried out to determine the effect of
changing the post-curing temperature and curing time on the
fracture toughness of five thermosetting epoxy resin polymers.
A wide range of curing temperatures were used ranging from
170°C to 260°C (i.e. above the gel temperature) cured for 1.5
hours. A series of curing times were used ranging from 0.25
to 4 hours at a post-curing temperature of 238°C. The extent
of cure and cure schedule are important in determining the
ultimate properties of an epoxy resin. The cure schedule
determines the transition temperature and residual heat of
reaction (extent of cure) both of which are indicative of
paint properties. However, the results of these experiments
tended t~ indicate that the post-curing temperature did not
have a great influence on the mechanical properties of the
epoxy anhydride system. However, a significant dependence
of fracture surface energy on curing time has been observed
as shown in Fig. (26). This is not unexpected as it is
known that a lower curing te~perature and a longer curing :· 9.,
time yield a stron~er epoxy resin.

-67-
4.7 The Thermo-Mechanical Analysis
The range of transition temperatures of the five epoxy
resins as a function of hardener composition (TMA) is shown
in Fig. (34). For each composition distinctive transition
0 temperatures in the range 90 to 125 C were observed.
In general terms increases in cross-link density in the
epoxy resin lead to an increase in the transition temperature
by restricting molecular motion. It is worth while noting
that an epoxy/anhydride system can be regarded as fully cured.
(cross-linked) when the reaction temperature is above the 80
transition temperature as has been found by Gillham et al,
Fig. (17), Table (2).
The variation of transition temperature as a function of
post-curing time might be interpreted as due to the decrease
in mobility of molecules, with a corresponding decrease in
cure time, Fig. ( 25). However, the effect of post-cure tern-
perature variation did-not show a significant change on the
transition temperatures of these epoxy resins.

-68-
4.8 Electronic Speckle Pattern Interferometry Results
Typical results of an ESP! fringe pattern are shown in
Figure (50). The .fringes represent the correlation between
the two images (often referred to as correlation fringes),
which were obtained when using a x4 imaging objective lens
enabling a real magnification up to approximately xlOO to be
obtained. As both the illumination and viewing directions
were normal to the object surface the fringe interval indicates
an out-of-plane surface displacement equivalent to ~ . 2
of the e 1
incident light. Therefore each fringe interval represents
an out-of-plane displacement of about 0.27 ~m as an Argon
source (A = 0.540 ~m) was used.
It is found that speckle decorrelation effects become
much more apparent as the applied stress is increased, as
shown in Fig.($0,4) and that only a few fringes could be
obtained o.ver the specimen surface before the onset of quite
large decorrelation effects resulting in low contrast fringes).
Decorrelation effects are well known in conventional speckle
pattern interferometry and arise when the i~-plane movements
of the surface being investigated are of the order of the
diameter of the resolution element in the object (i.e. the
area which can be considered_to illuminate a single point in
the image). Cleaily this will occur much sooner when higher
power objectives are used where this diameter becomes extremely
small (<1 ~m). It is therefore expected that movements of this
order will cause large decorrelation effects and this, indeed,
was found to be the case.

-69-
Total dccorrelation of the fringes will occur when the
in-plane movement is equal to the diameter of the resolution
element since in this case a completely different area will
illuminate a given point in the image plane after the dis
placement. Although no specific measurements of the lateral
extent of the surface movements were made, or1e could reason
ably assume that this would be of the order of a few microns.

CHAPTER 5

-70-
5. DISCUSSION
5.1 General Comments
The essential steps in applying the concepts of linear
elastic fracture mechanics (LEFM) to the calculation of -
fracture surface energy or fracture toughness are well
established, One obvious advantage of such an approach is
that it combines the analytical solution which is accurate
near the crack tip, but not remote from it, with the finite
element solution which is accurate remote from the crack tip
but not close to it.
The creation of fresh surface depends on energy absorbing
processes which take place in linear polymeric materials with 82 83
high hardener contents as has been shown by Berry and 8 4 8 5
Kambour. Epoxy resins, however, are highly cross-linked
materials which suggests that molecules just in front of the
crack tip cannot reorientate themselves. Therefore w_e expect
a reduction in the plastic flow at the crack tip. Consequently
we also expect a corresponding decrease in fracture surface
energy (y), which is a consequence of the greater number of
cross-links per unit area as the hardener control is increased.
This is associated with a decrease in the energy absorbing
processes (as the number of cross-links in the resin is 8 3 3 6
increased). Griffiths and Holloway have also reported
that the fracture energy for crack initiation of "Araldite"
CT200 and Hardener HT901 was somewhat lower at the higher
hardener contents.

-71-
The ~Doss-linking reaction of a thermosetting polymer
does not produce an homogenous network, but rather separate
regions of high and low cross-link density. The size and
distribution of these regions are influenced by the curing 8 6
conditions. Optical and scanning electron microscope
techniques have been used to illustrate the existence of
such regions (i.e. nodules, microvoids) in various amorphous
thermosetting polymers (i.e. the five epoxy resins).
The effect of varying the hardener/resin ratio using 87
various amines as curing agent h~s been studied by Anderson.
The effect of cross-link density on the properties of epoxy 88
resin systems has been investigated by Rich and Balnar.
They found that the yield strength increases with decreasing
amount of hardener. This was attributed to a more densely
cross-linked structure resulting from an increased particular
reaction rate.

-72-
5.2 Mechanical and Fracture Properties of Epikote 1055/TMA
5.2.1 Introduction
In this work, the principles of fracture energy measure-59 91
ment previously applied to structural adhesives have been
applied to epoxy powder coatings. The fracture behaviour of
a range of paints with systematically varied cross-link densi-
ties is examined using the TDCB technique. The variation of
the fracture surface energy, y, with changing composition is
determined and interpreted. The fracture energy of these
epoxy resins is dependent on the relative amounts of hardener
and resin (i.e. cross-linking agent or curing agent) used.
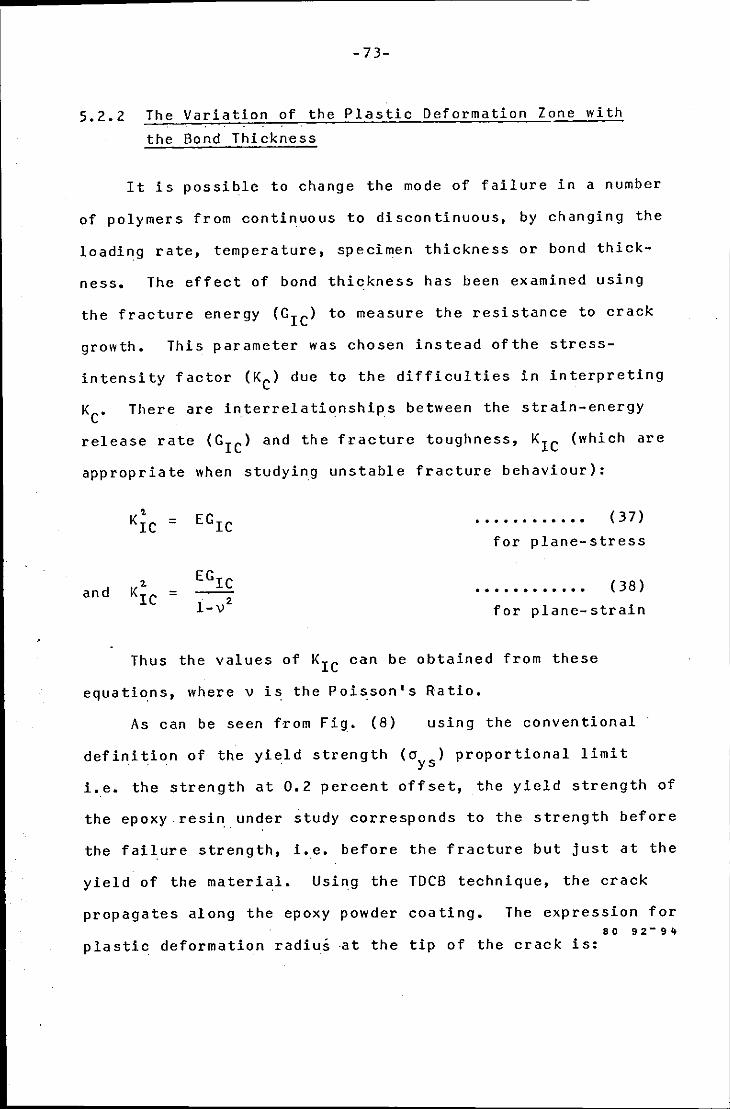
-73-
5.2.2 The Variation of the Plastic Deformation Zone with
the Bond Thickness
It is possible to change the mode of failure in a number
of polymers from continuous to discontinuous, by changing the
loading rate, temperature, specimen thickness or bond thick
ness. The effect of bond thickness has been examined using
the fracture energy (G 1c> to measure the resistance to crack
growth. This parameter was chosen instead ofthe stress-
intensity factor (KC) due to the difficulties in interpreting
KC. There are interrelationships between the strain-energy
release rate (G1
c> and the fracture toughness, KIC (which are
appropriate when studying unstable fracture behaviour):
K' IC = EGIC ............ (37)
for plane-stress
2 EGIC (38) and KIC = ............ 2 1-v for plane-strain
Thus the values of KIC can be obtained from these
equations, where v is the Poisson's Ratio.
As can be seen from Fig. (8) using the conventional
definition of the yield strength (cr ) proportional limit ys
i.e. the strength at 0. 2 percent offset, the yield strength of
the epoxy resin under study corresponds to the strength before
the failure strength, i.e. before the fracture but just at the
yield of the material. Using the TDCB technique, the crack
propagates along the epoxy powder coating. The expression for
plastic deformation radiui at the tip of the crack is:
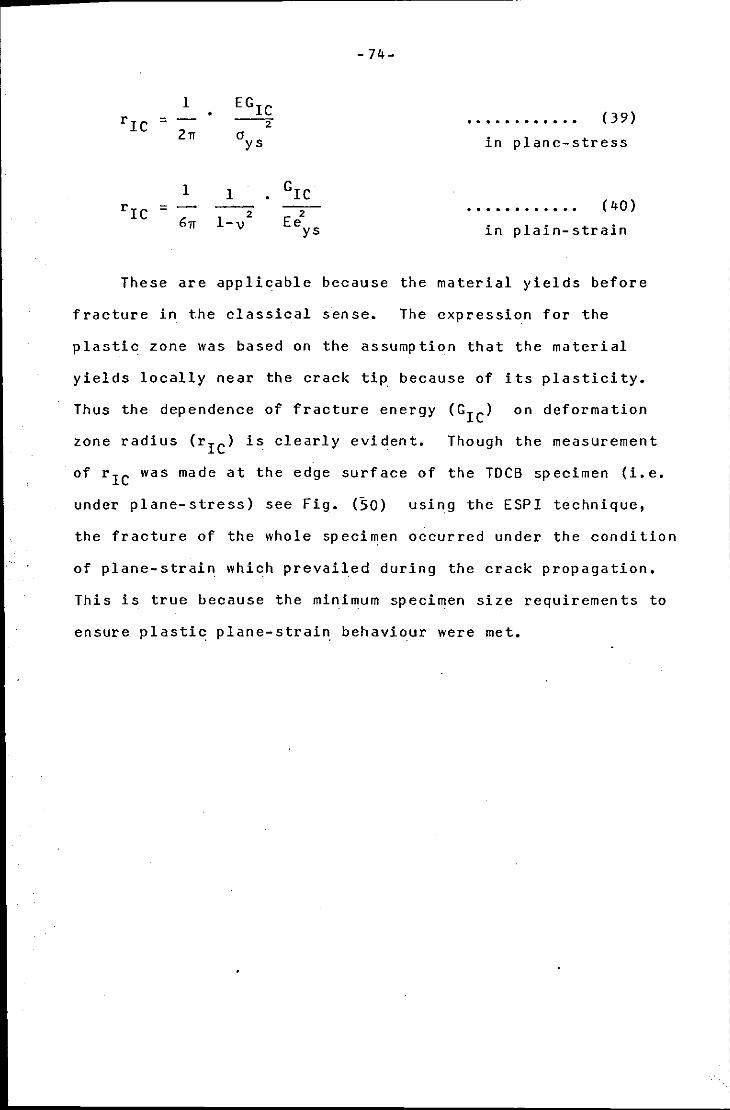
-74-
1 EGIC • rrc = --2
211 a ys
............ (39)
in plane-stress
1 1 GIC riC =
El 611 1-v 2
ys
............ (40)
in plain-strain
These are applicable because the material yields before
fracture in the classical sense. The expression for the
plastic zone was based on the assumption that the material
yields locally near the crack tip because of its plasticity.
Thus the dependence of fracture energy (Grc> on deformation
zone radius (r 1c> is clearly evident. Though the measurement
of r 1C was made at the edge surface of the TDCB specimen (i.e.
under plane-stress) see Fig. (50) using the ESPI technique,
the fracture of the whole specimen occurred under the condition
of plane-strain which prevailed during the crack propagation.
This is true because the minimum specimen size requirements to
ensure plastic plane-strain behaviour were met.

-75-
5.2.3 Plastic Deformation Zone Measurement Utilizing
ESPI Technique
Data analysis using ESPI yields a map of surface deform
ation along the contour of a region of interest (i.e. the crack
tip region). These experimental values are used to calculate
the fracture toughness, using the fracture energy parameter,
of a range of epoxy powder coatings of notionally stoichio
metric hardener/resin proportions as described in Table (1).
As may be seen in Figs. (40-44), the values of GIC for the
five epoxy resin coatings are highly dependent on the bond
thickness (h). The fracture energy of 100% stoichiometric
epoxy resin (i.e. J•a) exhibits a distinctive toughness maxi
mum at around 200 ~m bond thickness. Below 200 ~m bond thick-
ness the cracking mode is in the form of continuous ''tearing''
once a critical load is reached, while for a bond thickness
above 200 ~m the cracking mode reverts to non-continuous
"crack jumping" beh~viour which is characteristic of brittle
materials.
The ESPI technique has been used to examine the dimen
sions of the deformation zone·. at the head of the crack tip
just prior to exhibiting both modes of propagation. The
relationship of the deformation zone diameter (2r 1 c> to the
mechanism changeover from continuous to discontinuous crack
propagation is discussed in terms of fracture toughness.
Fig. (42b) indicates that in the case of the notionally
stoichiometric hardener/resin combination a distinctive
fracture energy occurs around 200 ~m bond thickness. There-
after, in the thickness range 300 - 600 ~m the value of
fracture energy remains approximately constant in the range
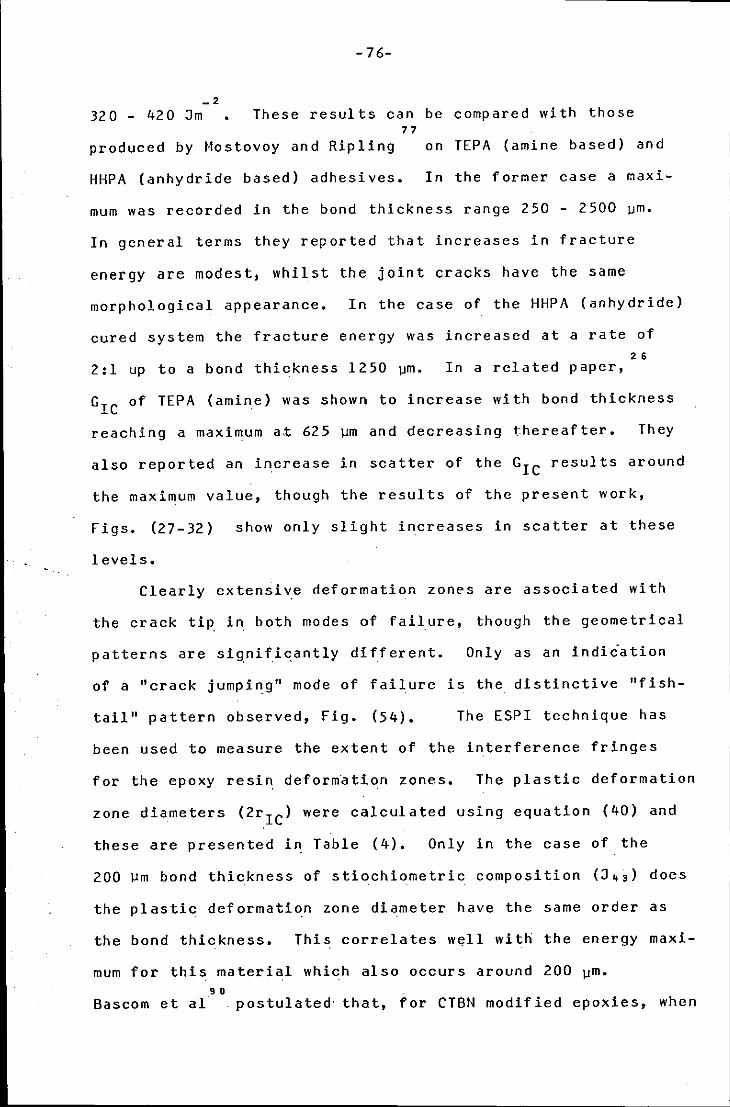
_2
32 0 - 42 0 ::Jm
-76-
These results can be compared with those 77
produced by Mostovoy and Ripling on TEPA (amine based) and
HHPA (anhydride based) adhesives. In the former case a maxi-
mum was recorded in the bond thickness range 250 - 2500 ~m.
In general terms they reported that increases in fracture
energy are modest, whilst the joint cracks have the same
morphological appearance. In the case of the HHPA (anhydride)
cured system the fracture energy was increased at a rate of 2 6
2:1 up to a bond thickness 1250 ~m. In a related paper,
GIC of TEPA (amine) was shown to increase with bond thickness
reaching a maximum at 625 ~m and decreasing thereafter. They
also reported an increase in scatter of the GIC results around
the maximum value, though the results of the present work,
Figs. (27-32) show only slight increases in scatter at these
levels.
Clearly extensive rleformation zones are associated with
the crack tip in both modes of failure, though the geometrical
patterns are signifiqantly different. Only as an indiiation
of a "crack jumping" mode of failure is the distinctive "fish-
tail" pattern observed, Fig. (54). The ESPI technique has
been used to measure the extent of the interference fringes
for the epoxy resin deform~tion zones. The plastic deformation
zone diameters (2r 1c> were calculated using equation (40) and
these are presented in Table (4). Only in the case of the
200 ~m bond thickness of stiochiometric composition (::1 43 ) does
the plastic deformation zone diameter have the same order as
the bond thickness. This correlates well with the energy maxi-
mum for this material which also occurs around 200 ~m. g 0
Bascom et al postulated that, for CTBN modified epoxies, when

-77-
the deformation zone diameter is approximately equal to the
bond thickness then a fracture mode changeover occurs. This
transition (from stable to unstable crack propagation)
occurred between bond thickness of 250 and 2500 urn (for 15% 9 3
CTBN). Kinlock et al, using similar material, which effec-
tively c~nsisted of 2 to 5 urn diameter elastomeric spheres
in the resin matrix, produced similar results. The observed
changes in fracture energy were explained in terms of plastic
deformation zone size and bond thickness.
The ESPI technique, used in this work, clearly indicates
the importance of the deformation zone in determining the
fracture energy, (Figs. 27-32 tf 35). For low bond thickness
(<200 Urn) the development of the deformation zone is hindered
by the mild steel adherends and, since the toughness is mainly
derived from the energy dissipated in forming the plastic-zone,
then the adhesive fracture energy is steadily reduced and
failure occurs between the adherend and the adhesive (adhesive
fair"ure). As the bond thickness is increased (up to 200 urn),
the fracture energy increases because the restriction exerted
by the adherend decreases. When a moderate degree of con-
straint exists, at a given value of joint width, W, commen
surate with the condition that there is ~o restriction on the
development of the plastic-zone due to the presence of the
high-modulus substrates. At bond thicknesses greater than
200 urn the fracture energy decreases. This may be due to the
decreasing degree of constraint in the epoxy layer as its
thickness increases (up to 600 urn) which results in a reduction
of the length (and hence volume) of the deformation zone.
Some evidence has been presented that the decrease in GIC in
the 'thick bond' region is the result of a change from plane-

-78-
strain conditions at the maximum to conditions approaching 9 0
plane-stress as the bond is thickened. Therefore, the
distinctive peak in fracture energy for a bond thickness of
200 ~m (for J 43 ) arises because, at this thickness, the
deformation zone attains its maximum size and its diameter is
approximately equal to the bond thickness. Other variables,
such as yield strength (oys) and bending modulus of elasticity
(E), are known to affect the fracture energy. The tensile
strength actually decreases and also the change in bending 94
modulus is too small to account for this change in fracture
energy. Therefore, all the evidence supports the controlling
role of the plastic deformation zone diameter (2r 1 c> in the
enhancement of the fracture energy.

-79-
5.2.4 The Effect of Post-Cure Temperature and Period
The results of Section (4.4) indicate that the fracture
toughness of the five epoxy resins was relatively insensitive
to changes in the post-cure temperature as long as the reaction
of curing agent and a resin had taken place above the gel
temperature. At the gel temperature about 70% of the reaction 9 5
has been completed. The system can only be regarded as fully ..
cured when the reaction takes place above the maximum possible
T g
since at Tg the cross-linking process will be frozen out. 9 6
Stein, in an investigation on rubber, suggested that the
existence of regions or domains of differing cross-link
density will affect the bulk mechanical properties. The cross-
linking might increase the transition temperature by restrict-
ing molecular motion in the opoxy resin which is a highly
cross-linked material. Illustration of cross-linking as a
function of composition V. the transition temperature is shown
inqg. (34).' The more highly cross-linked parts of the net-
work will deform less than the rest. This indicates that the
fracture surface energy, y, decreased as the plastic deform-
ation zone at the tip. of crack decreases, Fig. ( 26). The
apparent insensitivity of the system to changes in post cure
temperature (170, 200, 238, 250, 260°C) might be explained by
consider~ng that the number of cross-links did not change
(i.e. thete w~s no change in the plastic deformation zone at
the tip of crack) as a function of post cure temperature.
The fracture behaviour of these epoxy resins was affected
by changes in the curing time. The increase of the fracture
surface energy with an increase in the curing time up to 1
hour, might be explained in terms of increasing cross-link

-80-
density. Curing times less than 1 hour (0.25 to 1 hour) show
a considerable lowerng of the fracture energy and the crack
propagates under the adhesive failure mechanism. Curing at
or above 1 hour did not give rise to any significant change
in the fracture energy. This indicates that reaction is in-
complete if a cure time of less than 1 hour is used, see Fig.
(56) and that it is fully reacted at 1 hour or more (at
However, it has been found that a lower curing tern-
perature and a longer curing time will yield stronger epoxy 9 7
resins.
A fast cure, providing little opportunity for flow to
take place, results in unreacted curing agent particles in
the matrix which act as weak spots for the crack to propagate
through, see Fig. (57). This will give rise to a lowering
of fracture toughness. It. is worth noting that complete
hardening did not occur when the reaction temperature was
below the maximum transition temperature or when the curing
time was less than 1 hour (i~e. it can be seen that incr~asing
the post-curing period beyond about 1 hour, does not signifi-
cantly affect the crack propagation behaviour or the fracture
energy values.

-81-
5.2.5 The Effect of Testing Speed on the Mechanical and
Fracture Properties
Crack growth may occur at a constant load with the rate
of crack propagation being dependent upon the rate of cross
head displ.acement. The main crack propagation was unstable,
due to the rate dependence of plasticity, i.e~ once a crack
was initiated it propagated at a faster rate than the cross-
head speed until the strain energy in the specimen is insuf-
ficient to affect further propagation. At such points crack
arrest occurs and a typical force-displacement graph showing
crack growth at constant load (F) (see Fig.ll) exhibited
both F initiation and F arrest features. The F initiation
part of the graph is usually used to calculate the fracture
energy (G1c>· However, it is debatable whether the arrest
energy is a material characteristic. Unlike the initiation
fracture energy (i~e. c1 c>· which is defined at a critical
condition of the Irwin-Kies equation (7), the arrest energy
is associated with crack propagation, and is independent of
strain rate (and curing agent content) since the fracture
energy remained roughly constant when either was varied. The
degree of rate sensitivity can be defined by the jump length
of an initially stationary crack. Thus, Bn epoxy resin which
exhibited a small jump-length, would be less sensitive than
one in which the crack jump is large. A rate sensitive· material
would show a ''zig-zag" shape of F initiation and F arrest,
i.e. there is a large difference between the loads associated
with fracture energies for crack initiation and crack arrest.
For a rate insensitive material, there will be little differ-
ence between initiation fracture energy and arrest fracture

-82-
energy, hence its force-deflection graph will be flat (stable),
and the rate of crack growth is proportional to the cross-head
speed.
The energy input for a crack initiated and propagated in
a stable manner (continuous propagation) was high particularly
for the mechanism of boundary failure (Section 5.5). The rate
of energy loss was too low to halt the crack propagating the
length of the beam thereby prohibiting the chance of finding
the arrest energy. For discontinuous propagation (a stick-slip
manner), the rate of strain energy loss from the specimen was
great enough to allow crack arrest. This led to two distinct
regions. In the region of fast cracking, the strain rate was
too high to allow any significant plastic flow because the
relaxation time for plastic flow was exceeded by the crack
propagation rate. This leads to a comparatively low value of
fracture energy. The degree of plastic deformation decreased
to an imperceptible level at very high cross-head speeds.
Indeed moderate increases in cross-head speed have shown that 90
fracture energy is strain rate sensitive (Bascom et al ).
However, the large amount of strain energy available prior to
rapid crack propagation at low cross-head speeds produced crack
branching with a .parabolic rough plastic zone on the fracture
surface. The formation of a plastic zone at the crack tip
should be easier at low cross-head speeds. 9 3
Kinloch has
recently discussed the development of plastic deformation.
He said that as the yield stress of the material decreases,
the severity of crack tip blunting increases. This is due to
the large region of plastic deformation around the crack tip.
-83-
In other words, the lower stress-concentrating effect of the
blunt crack means that a higher external force is needed to
attain the critical stress value. This in turn means that a
high value of fracture energy is associated with a large
blunting effect. Therefore, since the yield stress decreases
with decreasing strain rate an increase in fracture energy
would be expected. This has been shown to be true (see Fig.33).
An alternative explanation is a plane-stress, plane-
strain transition. For an epoxy resin specimen of bond thick-
ness 300 - 600 ~m plane-stress may be attained if the loading
rate is sufficiently low, but at higher loading rates the
plane strain condition may be approached due to the increase 22
in yield stress. Meanwhile in the present work a transition
to stability at higher cross-head speeds was not observed but
may-have been expected in some systems at high cross-head
speed due to the decrease in fracture energy.

-84-
5.3 Crack and Craze Morphology
5.3.1 General Comments
It is clear that changes in the amount of curing agent
in epoxy.resins changes their mechanical properties. Little
work has been done on relating the morphological structure of
such stoichiometrically varied resins to their mechanical
properties. The purpose of the present study is to relate
the fracture energy changes with morphological changes
brought about in the structure of the cured resin by varying
composition. These changes were examined using the optical,
scanning electron and low and medium dispersive electron dif
fraction microscopes or the ESPI technique.
If it is accepted that the evidence produced by the ESP!
technique, see Fig. (44) indicates the presence of crazes in
epoxy resins then it can be said that these will form a
natural path for crack propagation. An explanation of this
mechanism of crack propagation is discussed in Section (5.-5).

-85-
5.3.2 Crack Morphology
In order to study the crack ti~ process in detail and
examine the fracture surface carefully to provide information
on the behaviour of the crack front, the essential character
istics of the fracture surface of the resins were examined
using the optical and 54,10 Cambridge (stereo ~can) scanning
electron microscopes (SEM). A Reichert ''meF2" (universal
camera microscope) was used for optical examination, and the
JEOL-lOOOCX electron microscope equi~ment for transmission
electron examination,

-86-
5.3.3 Craze Morphology
In general the initial stages of crack propagation in
epoxy resins entail a slow growth process in which the crack
propagates through the middle of the mature craze leaving
behind a relatively smooth fracture surface. This is followed
by a region of increasing crack growth velocity in which 6 5
separation occurs at the craze/solid polymer interface.
As the crack propagates, regions of the craze immediately
ahead of the advancing crack front experience a sudden and
large increase in applied surface stress. In Fig. (36) the
change in the surface stress profile due to the growth of a
crack in the craze is shown schematically. As was demonstrated
above, the craze attempts to thicken in response to this in-
creased strain energy by continued drawing at the craze boun-
dary, but now this drawing occurs at very high stress levels,
and hence craze fibrils with high extension ratio are produced.
At some point, it becomes energetically more favourable for
the crack to advance through the highly drawn new craze zone
at the craze/solid boundary than to continue to propagate
through the middle. Now material separation begins to occur
at the interface between the highly drawn fibrils and the
craze surface.
Dramatic confirmation that both the mechanisms postulated
give rise to the patch pattern and the high stress drawing
process outlined above, can be seen in Fig. (37). This is
the act of fracturing. The two craze/polymer boundaries have
become widely separated. There is a layer of highly drawn
fibrils at both the craze surfaces (even more highly drawn
than those in the middle) and crack propagation occurs at the
-87-
boundary of this layer. The inherent ''interconnectedness''
of the craze fibril structure is evidenced by the fact that
the craze not only remains intact laterally, but apparently
supports some amount of stress. In fact when the craze
material separates, it appears to do so rather viscousiy.
It is evident that when the craze matter does finally separ-
ate, the patch pattern left on the fracture surface will
include "tails" precisely as described by Beahan, Bevis and 9 8
Hull.

-88-
5.4 Fracture Surface Features and their Relation to
Mechanical properties
5.4.1 Introduction
The plastic deformation zone of the stoichiometric resin
around the tip of cracks is shown in Fig. (42b). It appears
feasible that the high values of fracture energy are associated
with the work done in plastically deforming the material in this
zone ahead of the crack tip. The cleavage crack was broken up
into many cleavage planes near the crack tip, Fig. (59).
The steps between different planes form a ''river pattern" see 9 9
Fig. (60) called river lines. The optical microscope was
used to determine the distribution of voids (i.e. number and
size). This correlates well with values determined by
Cambridge Quantimet ,QTM (for partical size measurement)
analysis of void distribution, Figs.61,69 & 62a of STEM
technique. Examination of the tensile fracture surface under
SEM confirmed the optical analyses. The SEM technique provides
topographic evidence that is highly suggestive of the occur
rence of plastic deformation in the area of the crack tip.
Fig. (63) shows views in the region of an arrest mark of a
cohesive failure (i.e. the epoxide is attached to both of the
mild steel adherends) of the epoxide paints. The general
direction of crack propagation is from the smooth toward the
rough regions in the individual photographs. The occurrence
of plastic deformation is strongly suggested by the rough
regions of the SEM micrographs, Fig. (64).

-89-
5.4.2 Qualitative and Quantitative Examination of
Fracture Surface
5.4.2.1 Qualitative Observation
Despite the many methods available for the study of the
fracture surface of the epoxy paint coating, there are not
many methods which permit the straight forward study of the
unimpaired bond. The light mocroscope technique cannot be
used because of its very shallow depth of focus at high mag-
nification. Therefore, examination of the fracture surface
is not possible except at very low magnifications. In order
to obtain better information and a good understanding of the
fracture mechanisms, the electron microscope was used as its
depth of field and resolution are superior to those of the
light microscope. Many topographical fracture surface
features were observed using the scanning electron microscope
(SEM) technique, Even the (SEM) te?hnique is not without its
problems· since the paint coating (plane surface) is in isol a-
tion and tends to become changed, In order to get good SEM
photographs the epoxy surface must be coated with a thin film
(200°A) of a conductor (such as gold or a gold-palladium
alloy) by vacuum evaporation. Non-dispersive x-ray emission
analysis may be accomplished in the SEM but often the compo-
nents which can be detected are restricted to elements 1 0 0
heavier than fluorine, Elements such as carbon and oxyg~n,
which are of most concern in the investigation of epoxy bond-
ing, produce x-ray emission spectra which. are of too long a
wave length to be detected by conventional detectors.
Special TEM techniques can provide some structural information

-90-
but do not provide any chemical information. However, in
this work the SEM technique was adopted to examine the
fracture surface directly without damaging the bond coating,
thereby obviating the need for replica preparation which
would have been necessary for TEM examination.

-91-
5.4.2.2 General Comments
Optical examination of the fracture surfaces of the
cracked specimens revealed parabolic step features of small
curvature. The major portion of the crack plane appeared
relatively smooth from visual inspection except at or near
arrest points where rough bands, approximately parallel to
the arrested crack front, were observed. It was clear that
some localized plastic deformation had taken place in these
regions, though not sufficient to invalidate the Irwin-Kies
equation. Close examination revealed areas of porosity within
the resin which appeared to be not only a function of the fab-
rication process, but also an inherent feature of these resins.
Microscopic examination of the materials used in this
work, although revealing the existence of pores in all systems,
did not indicate the presence of solid secondary phases.
However, any material consisting of a gas and a solid has been
universally described as a 'two-phase material'. Papers by 2 1
Bascom et al discuss the dependence of fracture toughness in
adhesive systems on.the secondary phHse, e.g. spherical parti
cles in the range 2 to 5 ~m diameter of elastomer. However,
there was relatively high scattering in fracture toughness
values.
Inhomogeneity· effects are considered to be of primary
importance and attempts to relate structural features to
toughness variation are the subject of muP.h discussion. There
is also some doubt as to whether this defect is due to the fab-
rication process.or is part of the real structure of these
materials.
-92-
5.4.2.3 Fabrication Pror.ess
In real structures there are several different causes of
flaws or cracks. The main concern in this work is the defect
in the material caused by a microcrack. This could be intro
duced during the first stage of specimen preparation (i.e. the
preheating of the TDCB specimen before applying the epoxy
powder to the mild steel substrates). In view of the powder
nature of the system and the trimellitic anhydride (TMA) being
dispersed, and perhaps only partially dissolved in the epoxy
resin it is important to apply the powder to a preheated steel
substrate. This ensures optimum homogenous reaction and there-
fore the best network structure. When the powder coating is
applied to a preheated substrate, the TMA particles can melt
and dissolve in the resin before reaction is complete. Appli-
cation of the powder coating to a cold substrate necessitates
post-curing in an oven (since the substrates have not been pre
heated sufficiently). Using this approach the reaction of the
TMA with epoxy resin might start at a low temperature (i.e.
below the TMA melting point), resulting in a TMA particle with
a cross-linked shell that cannot dissolve any further. This
clearly indicates the importance of using high temperature sub-
strates which were, therefore used in this work. In the case
of the post-cured resin, the unreacted residual TMA particle
is a \'leak spot and a possible crack initiator. Fig. ( 55a)
and Fig. ( 62) show the residual TMA particle inside a hole of
high composition of hardener {i._e. K43 and L43). This effect
72 has been observed by .Klaren. He has also demonstrated that
high heating rates result in a better levelling of a coating.
The reduction of viscosity during the pre-gelation period

-93-
presents a chance for entrapped air to be released and gives
suitable wetting of the substrate. Industrially this is put
to use by keeping the substrate temperature at around 250°C
(a temperature recommended by the Shel1 company), depending
on the system used. The procedure adopted in this work is
described in detail in Section (3.3).

-94-
5.4.2.4 Quantitative Analysis of Fracture Surfaces
Air or volatile by-products of the curing process may be
entrapped in the finished polymer resulting in a degree of
porosity which even for a well made specimen may be as high as 1 0 0
6 - 10%, Baun reported, after detailed analysis of his
micrographs, that the actual joint contained nearly 50% voids
and such air entrapment, especially in supported adhesives is
not unusual. The presence of these voids, which is difficult
to determine quantitively, introduces another source of vari-
ability in physical properties and it is probable that the
relatively large scatter of experimental data for basically
similar polymers is due ~o the presence of these voids. The
effect of microvoids on fracture toughness was examined at
considerable length in the current programme of work. In
order to establish firmly that the exi.stence of microvoids is
an inherent property of this epoxy resin and does not consti-
tute a solid second phase, the SEM technique was used to in-
vestigate the fracture surface topography and the distri
bution of microvoids,. Figs 61 & 69. In addition to examining the
fracture surface it is equally important to determine what
elements exist in and around the microvoids. The scanning
transmission electron microscope {STEM) and transmission
electron microscope {TEM) have been used to investigate the
chemical composition of particles around and inside the micro
voids, These particles are respon~ib}e for initiation of the
microvoids which in their turn, will be thi source of micro
cracks or crazes. Thin sections {1.3 vm thick obtained using
an ultramicrotome) from different areas of the specimen, were
examined using the TEM technique, These showed one diffraction
. ·-
-95-
pattern for material from the matrix and another for material
nround the microvoids, The Bragg diffraction equationtOJ was
used to comparP. their lattice spacing Id). As can be seen in
Fig~. (65~,65b), the diffrction patterns of these amorphous
epoxy resins are not easy to analyse and the evidence produced
does not positively confirm the existence of a second phase
(i.e. elastomer).
X-ray-detector instrumentation on the STEM is capable of
probing very small areas. This is done by using the signal
generated by a particular x-ray peak detected by the x-ray
energy disperasive analyses to modulate the brightness of the
STEM/SEM image, thus obtaining a map of the concentration of
the element in the sample. It is often possible to identify
the composition of particles responsible for microvoid initi
ation and with this information, it may be possible to select
a different curing procedure so as to suppress the void initi-
ation process. However, this technique cannot be used for
elements l~wer in atomic number than sodium, and also there
are no x-ray index files for this epoxy resin.

-96-
5.5 Mechanisms of Failure
When a TDCB specimen is loaded in uniaxial tension,
until failure occurs, optical examination of the failure
surfaces can be used to determine the mode of failure. The
main concern in identifying the mechanics of epoxy failure
is in the region of fracture. These types of epoxy coating
joint failure were observed:
(1) cohesive fracture (centre of the bond);
(2) adhesive failure (mild steel/epoxy interface);
or (3) mixture of failure modes.
1 0 2 Bikerman has reported that true interfacial failure seldom
occurs and need not be treated in any theory of adhesive
joints. He said that apparent failures in adhesion are quite
common but they take place in weak boundary layers so close
to the interface that the epoxy remaining on the substrate
after the failure is not visible, see Fig. ({, 6:). There
are other obstacles in identifying the location of failure,
particularly in adhesive failure and the interpretation.of
mixed modes of failure is not easy. The SEM technique has
been used extensively e~pecially in cohesive failures, in
attempts to determine the mechanism by which failure takes
place. Plastic and brittle failure mechanisms are easily
distinguished from the polymer surface (initial and final
flaws may be visible and are important in the assessment of
the epoxy fracture behaviour).
Comprehensive analysis at high magnification using the
SEM technique is always essential to determine the exact mode
of failure and to get the utmost profit from electron micro-
scope investigation. Some fracture surfaces look easy to
-97-
analyse, but on close examination are not as might be
expected.
Brittle fractures usually occur by cleavage, where the
tensile stresses literally pull apart adjacent planes of
atoms. This mechanism is observed in Fig. ( 67). Often
cleavage steps appear as ''river patterns'' where fine steps
are seen to merge progressively into large ones. It is gen-
erally believed that the flow of the "river pattern'' is in
the direction of microscopic crack propagation and arises due
to the propagation of the crack on more than one level. The
appearance of the "river pattern" on the crack jump fracture
surface of high bond thickness (i.e. at bond thickness greater
than 200 ~m), was probably brought on by the movement of a
cleavage crack across a high-angle fracture boundary. The
microfracture of the crack plane represents an accommodation
process as .the advancing crack is re-oriented in search of
cleavage planes in the new surface. In this sort of crack '
propagation· the microvoids will tend to form in association
with fractured particles. The source of microcracks in front
of the advancing crack is regarded, in its turn, as a path of
crack propagation. The tear microcrack points can be seen on
both halves of the fracture surface, Fig. (63).
Close examination of the epoxy resin (J 43 ) surface of
specimen thickness 200 ~m, shows that epoxy joints, which
appeared to fail at the metal epoxy interface, actually
failed in a far more complicated way with the crack propagat-
ing near to, but not quite at, the interface (i.e. mixed mode
of failure). The crack propagated by a boundary shear pro-
cess as a result of high differeritial shear stress in the
region close to the epoxy/adherend boundary. The prohibition

-98-
of microcrack initiation and propagation is due to the
development of a large plastic deformation zone at the tip
of the crack prior to local microcracks becoming one and
stepping forward the main crack front.
As has been explained earlier, cracks in epoxy resin
could not only be made to grow by jumping from one position
to the next, due to microcrack initiation and propagation,
but also that the crack could be propagated continuously in
a stable manner (adhesive failure). In this case the major
portion of the crack plane appeared smooth on visual inspec-
tion. Further investigation using the SEM technique has
shown certain features which could be regarded as indications
of adhesive failure. The regions of crack arrest and initi-
ation can be seen on the surface of the fracture, as slightly 2 1
curved lines, called ''finger nail marking'', which can be
seen clearly at the edges of the specimen, Fig. (60), Apart
from that the surfaces were relatively featureless. In spec-
tion of these regions u~ing the SEM technique exhibited a
form of tear characteristic. This sort of crack propagation
has been observed at bond thickness coatings less than 200 ~m.
It was clear that little localised plastic deformation had
taken place. However, at a bond thickness of 200 ~m massive
plastic deformation produced distinguishing marks on the
fracture surface, Fig. (64). Inspection of the rough zones
of the fractured surface revealed holes which generally had a
spherical shape. Half of these holes appear to be empty. It
has already been confirmed that there is a strong link between
the changeover mechanism and the size of the plastic deform
ation zone at the crack tip which might be due to the existence
of these empty ·spherical features, see section (5.4) and Figs.
(55 & 68),
-99-
5.6 General Comments
Using ESP! it has been shown that before the crack propa-
gates there are microcracks or crazes ahead of the crack tip
particularly for the low hardener content resins, (H, 3 ).
Another technique, called double exposure holographic
interferometry (DEHI) can be used to determine the fracture
energy (G1
c> of methanol crazes growing from cracks in poly-1 0 3
styrene as described by Krenz et al. A contradictive 10'
observation has been reported by Kinloch et al. It is said
that the localized plastic deformation zone around the crack
tip probably occurs via a shear-yielding (rather than a crazing)
mechanism certainly for simple well-cured epoxy materials. 1 0 5
These views have also been supported by examination of
replicas of fracture surfaces of the simple epoxy materials
(molecular weight between cross-links about 400) using trans-
mission electron microscopy. However, while there is definite 106
proof of cra~e formation in rubber-modified epoxide materials,
the evidence for craze formation in simple epoxide materials 107
at room temperature is less positive and no real evidence
of craze formation has been found in the present studies.
Therefore the only explanation is that an unstable microcrack
is formed at the tip of the crack and the number of microcracks
increases with increasing plastic strain. Consequently, the
material around the crack tip undergoes a large amount of
microscopic plasticity, Fig. (60).

CHAPTER 6

-lOO-
6. CONCLUSIONS AND SUGGESTIONS FOR FURTHER WORK
6.1 Conclusions
1. The mechanical and material property aspects are equally
important in determining the fracture behaviour of a given
system since the fracture surface energy (y) is highly depen
dent on the amount of cross-linking agent, i.e. trimellitic
anhydride (THA), in the resin (''Epikote" 1055).
2. The increase in fracture surface energy (y) of stoichio
metric epoxy resin ("Epikote'' 1055/THA) powder coating around
200 ~m bond thickness can be related to the increased ability
of the material to undergo deformation in the vicinity of the
crack tip. It has been found that the optimum fracture energy
is achieved for a bond thickness of approximately 200 ~m.
Further, it is also found that the plastic deformation zone
diameter at this thickness is approximately 200 ~m. This in
fact is the usual coatin~ thickness specified in adhesive bond
technology.
3. The mechanical and fracture properties of the epoxy resin
(''Epikote'' 1055/THA) are rate sensitive. Thus, relatively
fast testing rates are generally preferred so that 'stable'
crack propagation ~ccurs. However, this gives rise to a corn-
paratively low value of fracture energy. 'Unstable' crack
propagation (resulting in higher values of fracture energy)
occurs at slow testing rates. The transition from unstable to
stable propagation can be induced by increasing the testing
rate.

-101-
4. The post-cure temperature and time only slightly influence
the fracture energy of ''Epikote'' 1055/TMA resins, especially
at cure times above 1 hour, At cure times up to 1 hour it has
been shown that there is a big influence on the mechanical and
fracture properties of this resin.
5. The cross-link de~sity concept alone does not sufficiently
explain the variation in mechanical and fracture behaviour of
the •Epikote'' 1055/TMA system.
The relationshi~ between chemical and physical morphology
is not clear, and all the evidence from the present work sug-
gests that a two-phase structure does not unequivocally exist.
6. The failure mechanism in the ''Epikote'' 1055/TMA system
tested at the normal range of cross-head displacement (e.g.
- 1 0.5 to 2 mm,min ) does not appear to be closely related to
crazing phenomena, except for resin compositions·less than
that of the stoichiometric composition, (e.g. H•a).
7. The fracture .surface energy parameter (y) of epoxy paint
coating, (''E~ikote'' 1055/TMA) is a very useful and sensitive
indicator of chemical changes in epoxy paint systems.
8. It has been proved that out-of plane displacement fringes
can be obtained over very small areas using the Electronic
Speckle Pattern Interferometry (ESP!) technique.
It seems that no real limit exists to the technique,
other than that of the obvious practical one of producing a
specimen which will yield the required differential surface
displacement over the area under investigation. Fringes have
been obtained over very small areas at real surface magnifi-

-102-
cation of - XlOO and it seems that this magnification is
most suitable for practical applications. Hopefully the
technique will find further application in this field since
ESP! provides a facility for an immediate and continued up
date of the initial reference state, thus enabling one to
'build up' a picture of the deformation of a plastic zone
right through to ultimate fracture.

-103-
6.2 Suggestions for Further Work
For a more complete characterisation of the "Epikote''
1055/TMA coating system there are some parameters which
require further detailed investigation. Therefore some
suggestions for further work are made, in the following
areas:
1. The kinetics of cross-linking reactions, which affect
the morphology and mechanical properties of the system, are
an important feature and require further attention.
2. The effect of various environmental conditions (simulat-
ing those experienced in·service) on the performance of the
coatings requires examination.
3. The mechanism of failure should be examined more closely.
It was not possible to study this quantitatively by x-ray
techniques as there was not an index-file available. However,
the electron energy-loss spectroscopy (EELS) technique can be
used to examine the inner shells of the constituent atoms in . .
order to determine the bond-shifting and chemical structure.
4. Chemical etching of polymer composites (e.g. deformed
epoxy/fibre composites) can be used to indicate how well some
of the theoretical assumptions about the mechanics of deform-
ation agree with the real situation. This technique could be
employed in the examination of epoxy paint coating systems to
determine their response to deformation.

-104-
5. The value of the electronic speckle pattern interfero-
metry (ESPI) technique has been demonstrated in this work.
It could be used in further work to study structure deform
ation, e. g. crazes.
In addition, it appears that the technique could be used
to much greater advantage in vibration monitoring, contouring·
and roughness.
6. The dynamic structure toughness (Kid)' as determined
using impact (high) loading rates, could be investigated.
The ESPI technique would again be beneficial in determining
precisely the diameter(2 r 1c> of the plastic deformation zone.
7, Simple variables such as hardener content, bond thickness
and cure schedule sh6uld be examined further in other systems.

APPENDICES

-105-
APPENDIX 1
Al Concepts of Fracture Mechanics
In order to cover the background to this work, it is
necessary to explain some terms and concepts of fracture
mechanics.
Al.l Griffith Theory
G 8 Griffith used a solution developed earlier by Inglis
who considered the stress distribution near the end of the
major axis of an elliptical hole in the centre of an infinite
plate in order to determine the strain energy released as the
crack propagates. Fig. (1) shows the type of specimen used
to investigate the above postulate. The original paper which
included the erroneous derivation of the increase in strain
energy due to the presence of a crack, was later corrected by 7
Griffi th. He .has adopted the energy-balance approach to
crack extension.
For a thin crack of width W and of length 2c in an
infinite plate of unit thickness subjected to a uniform stress
a, the strain energy S released during crack propagation (when
2c>>2d and t>>2c) is
s =
2.2 nc a IV
E
.......•.... (1.1.1)
where E is the elastic modulus, t is the overall specimen
depth and d is the crack depth.
•
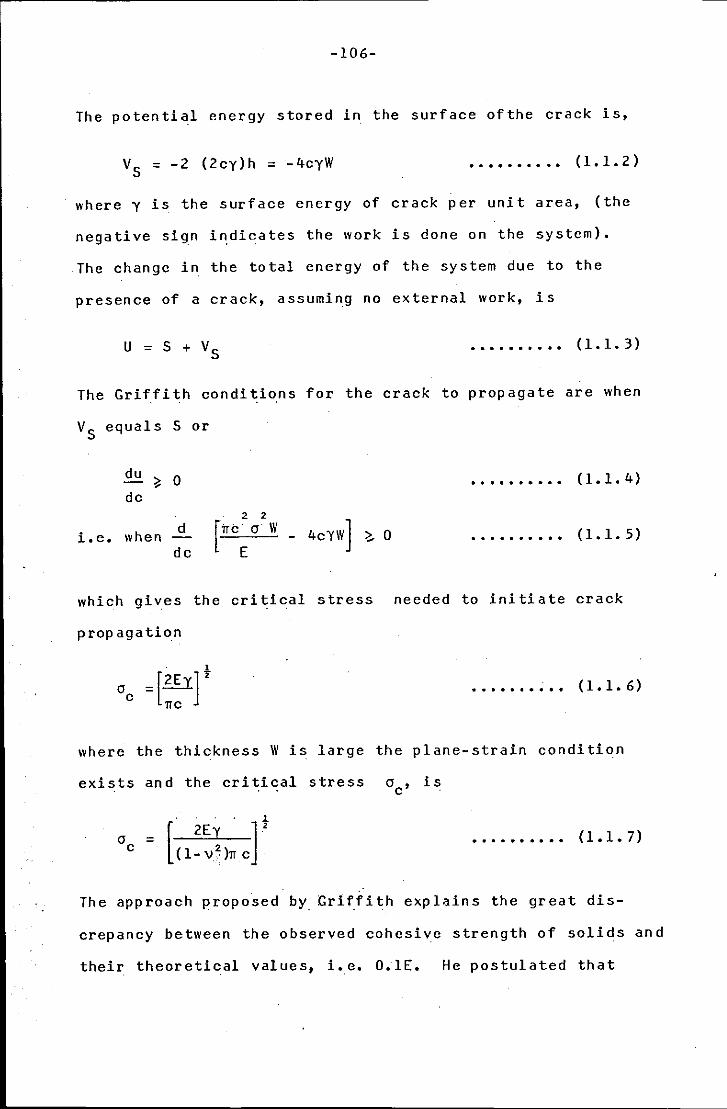
-106-
The potential energy stored in the surface ofthe crack is,
VS = -2 (2cy)h = -4cyW •.•......• (1.1.2)
where y is the surface energy of crack per unit area, (the
negative sign indicates the work is done on the system).
The change in the total energy of the system due to the
presence of a crack, assuming no external work, is
u = s + vs ······•··· (1.1.3)
The Griffith conditions for the crack to propagate are when
VS equals S or
i.e.
du ~ 0
de
when d
de
.....••... (1.1.4)
.......... (1.1.5)
which gives the critical stress needed to initiate crack
propagation
....... ~ .. (1.1.6)
where the thickness W is large the plane-strain condition
exists and the critical stress o , is c .
Oc = [ 2Ey . ] t
(1-v~)n c •••••••••• (1.1. 7)
The approach proposed by_ Griffith explains the great dis-
crepancy between the observed cohesive strength of solids and
their theoretical values, i.e. O.lE. He postulated that

-107-
solids must contain very fine cracks or flaws no matter how
much care is taken in producing these solids. The size of
these intrinsic flaws can be determined from equation 1.1.6.
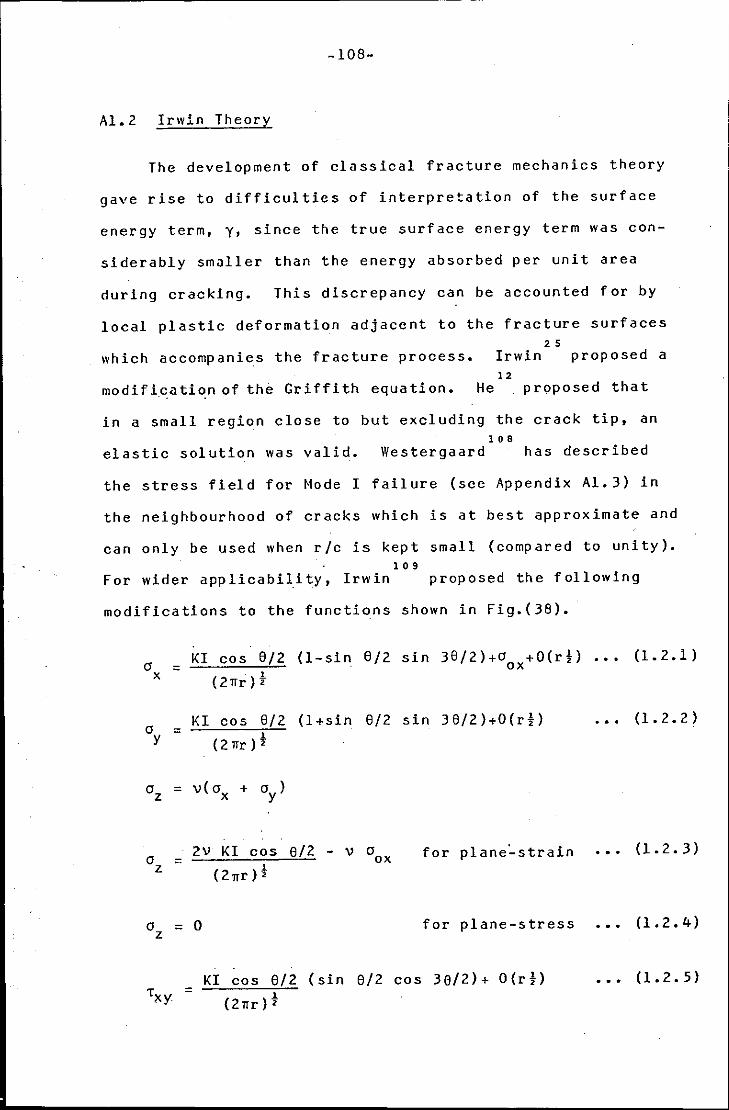
-108-
Al.2 Irwin Theory
The development of classical fracture mechanics theory
gave rise to difficulties of interpretation of the surface
energy term, y, since the true surface energy term was con-
siderably smaller than the energy absorbed per unit area
during cracking. This discrepancy can be accounted for by
local plastic deformation adjacent to the fracture surfaces 2 5
which accompanies the fracture process. Irwin proposed a 12
modification of the Griffith equation. He . proposed that
in a small region close to but excluding the crack tip, an 1 0 8
elastic solution was valid. Westergaard has described
the stress field for Mode I failure (see Appendix Al.3) in
the neighbourhood of cracks which is at best approximate and
can only be used when r/c is kept small (compared to unity). 1 0 9
For wider applicability, Irwin proposed the following
modifications to the functions shown in Fig.(38).
cr X
cr z
crz
T1<Y
= KI cos B/2 (1-sin B/2 sin 36/2)+0 +O(ri) ••• ox 1
(2nr)z
V.I cos B/2 (l+sin B/2 sin 36/2)+0(d) 1
(21fr) 2
2V KI cos B/2 - " cr for plane:..strain . . . .. ox !
( 2nr ) •
= 0 for plane-stress
KI cos B/2 (sin B/2 cos 3e/2) + O(d) ... = !
(2nr) 2
(1.2.1)
(1.2.2)
(1.2. 3)
(1.2. 4)
(1.2. 5)

-109-
............. (1.2.6)
where ox' ay' az and 'xy' Tyz' 'zx are tensile stresses and
shear stresses respectively in cartesian co-ordinates, r and
e are polar co-ordinates referring to the crack tip, and
where a is usually neglected. It is now established that OX
KI is related to the applied stresses and crack length c
.! i.e. KI = uo (Tic) 2 . .......... . (1.2.7)
where the fun~tional coefficient, a, depends on the geometry
of the body, subjected to stress o, and the crack itself.
It should be clear that K is a stress-field parameter
independent of the material and Kc is a measure of material
properties which are dependent on temperature, degree of prior
work, strain rate and the plate thickness. 16 25 110
Irwin and Orowan suggested replacing Y with
Y + Yp in the Griffith equation, where Yp is the plastic dis-
sipation of energy per unit area as the crack propagated.
The developed Griffith equation is expressed as
............ (1. 2. 8}
where Yp is the plastic work required for the onset of crack
propagation. This. is true provided the local plastic zone
at the crack tip does not significantly disturb the elastic
stress field (see equation 1.1.6}.

-llO-
16 Irwin and Kies measured Y experiment~lly by consider-
ing the strain energy, S, at either constant deflection o or
constant applied load F. They also assumed that the resist-
ance to crack propagation is the non-recoverable strain energy
regardless of where the energy goes.
The strain energy
s = ! Fo 2
o = FR = constant
where R is compliance.
.......... (1.2.9)
•.•....... (1. 2.10)
Differentioning equation 1.2.10 w.r.t. area, 'thus
RE.£·+ FdR = O dA dA
i.e. RdF FdR ........•. (1. 2.11) =
dA dA
Similarly, since s = ! Fa 2
r:!t = ! 0 dF 1 FR dF
= 2 dA 2 dA
.......... (1.2.12)
[ dS] = 1 F do
dA F 2 dA ....•....• (1.2.13)
By combining equation (1.2.11) with equation (1.2.12) we get
1 2 dR Fe .-
2 dA
1 Fc2
dR =---de
= 2y = GC (1.2.14)

-111-
Or by combining equation (1.2.11) with equation (1.2.13)
to give
I::IF
1 2 dR = Fe
2 dA
2 1 Fe dR 2y Gc (1.2.15) = = = . . . . . . . . . . 2 w de
where w is the width of specimen and c the crack length.
As an alter native a pp ro a eh, an energy balance for the
geometry has been carried out.
i.e. Fdo + dS = dV + dE .......... (1.2.16)
de de de de
dV where = Cleavage fracture rate de
dE
de
dS
de
=
=
Rate of change of kinetic energy of crack propagation
strain energy release rate ••••• (1.2.17)
6 is the displacement at the point of application of the load F.
do For the conditions of unstable fracturing-= 0 and in the de
instance of instability (i.e. at the initiation position),
dS and dV must be equal or only very slightly different. As de de
fracturing continues they are unlikely to differ
widely.
At the initiation point where the arrest of unstable
fracturing occurs
r- F2
R J de = de = de L -2-dV dS d .......... (1.2.18)
where S, the strain energy term, is a negative quantity so that
ds the the release rate will be positive. de
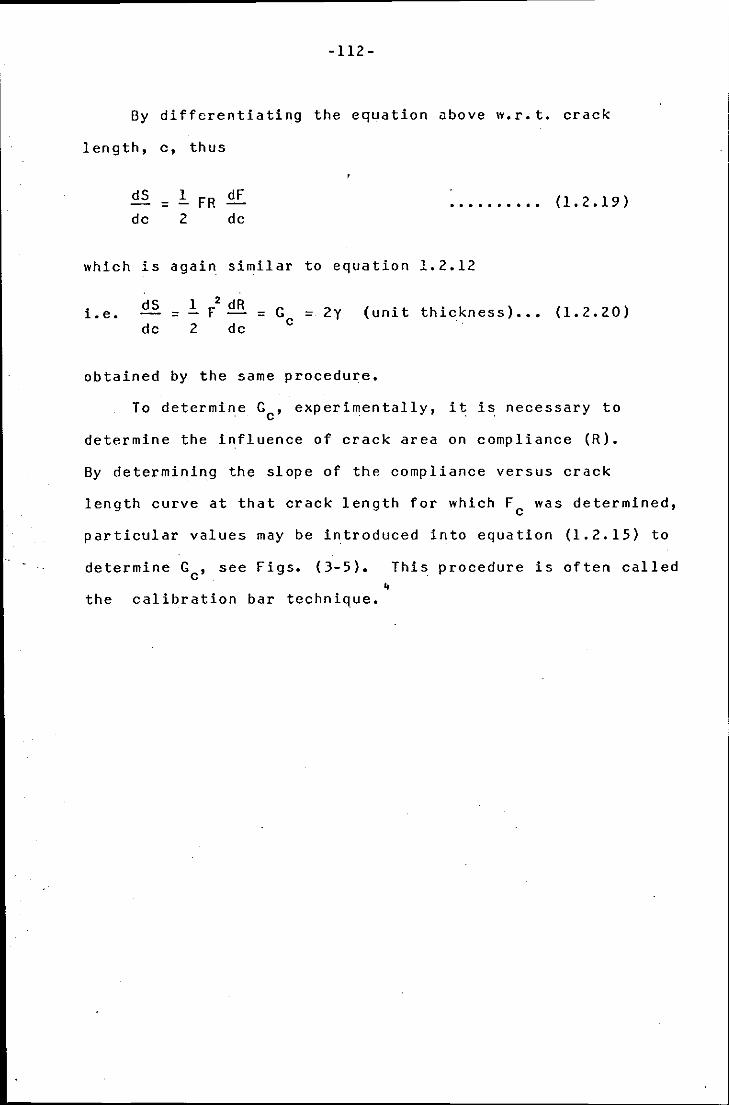
-112-
By differentiating the equation above w.r.t. crack
length, c, thus
dS
de
l dF = FR
2 de ..........
which is again similar to equation 1.2.12
(1.2.19)
dS -- 1 F2 dR -- Gc -- 2y ( . k ) ( ) i.e. unit th1c ness ••• 1.2.20 de 2 de
obtained by the same procedure.
To determine G , experimentally, it is necessary to . c .
determine the influence of crack area on compliance (R).
By determining the slope of the compliance versus crack
length curve at that crack length for which F was determined, c
particular values may be introduced into equation (1.2.15) to
determine Gc' see Figs. (3-5). This procedure is often called 4
the calibration bar technique.
-113-
Al.3 Loading Modes used in (LEFM) Analysis
Two dimensional elasticity theory is capable of describ-
ing the magnitude and distribution of stresses and displace-
ments in the immediate vicinity of a crack tip as a function
of applied stress, crack size and shape, and a parameter
called the stress intensity factor (K), for conditions of
plane-strain, generalised plane-stress, anti~lane shear and
axisymmetry.
There are three possible loading modes for the in-plane
situation. Two modes of crack extension are possible: Mode I
which is a crack opening case; Mode II in which there is in-
plane sliding of one crack face over another. The anti-plane
shear case is referred to as Mode III as shown in Fig. (2)
and the stress intensity factors for these modes are denoted
The importance of K is that it describes
the stress field, not simpJ y the largest single stress, and
when it reaches a critical value K , crack extension is . c
imminent.

-114-
APPENDIX 2
A2 The Limitations of the Electronic Speckle Pattern
Inter f e romet.!:_t
A2.1 Speckle Size
The ESPI technique is limited to measuring displacements
greater than one speckle diameter. This speckle diameter can
be calculated using the Rayleigh criterion of resolution.
This gives the mean speckle diameter in the image plane
of
...........• (2.1.1)
where F is the numerical aperture of lens and
A is the wave length of coherent light •
F = distance of image plane
aperture diameter
.........•.. (2.1.2)
The corresponding speckle size in the obje6t is
s - 1. 2 AF •........... (2.1. 3)
m
where m is the magnification (the ratio of image to object
size).
For an Argon ion laser (A= 0.514 ~m), F = 4.0 and m=
10.0. ,.As a result, only motions greater than 0.2 ~m are
measurable and when t~e fringe spacing and speckle size are
equal no fringes are observed. Using ESPI is limited by
speckle pattern correlation requirements between the two
speckle patterns. In practice, the maximum deformation

-115-
measurable using the ESPI technique depends on the type of 1 1 3
problem and body being investigated. It can be shown that
the inspection of very small areas is difficult because a
relatively large deforming load is required to obtain a given
number of fringes, rigid body translation and displacements
other than that to which the interferometer is sensitive are
likely to arise, causing decorrelation of the speckle pattern
and hence a reduction in fringe visibility.

-116-
A2.2 Intensity
In ESPI the basis of the technique is comparison of the
intensity of a particular speckle from one exposure to the
next. The technique relies on determining regions where it
is not well correlated. The intensity of a particular
speckle is a function of the relative phase difference between
the lights scattered from various scattering sites within a
speckle cell. If the phase of the two illumination beams
changes by different amounts between exposure, the intensity
of the speckle will change. Thus, the method relies on the
changes in speckle intensity, not speckle motion. Shifting
of the speckle will make it more diffic11lt to view the speckle
correlation fringes, but the information about speckle cor
relation ~ill be unaffected while the changes in the intensity
of the speckles due to the optical retardation change will
destroy speckle correlation in this particular region. This
destruction of speckle correlation will lower the contrast of
the speckle correlation fringes as they enter the affected
region.
-117-
A2. 3 Resolution
To observe static displacements a video store must be
used to record the speckle pattern of the object in its
reference state. This may be a video tape recorder, disc or
solid state store. The quality of the correlation fringes
is very dependent on the quality of the store (a video tape
recorder has been used). The spatial resolution should be as
good as possible so that the speckle pattern correlates well
at the image plane. The video signal is processed electron-
ically and then displayed on the television monitor. The
television camera must be able to resolve the speckle pattern
if correlation fringes are to be observed. If the separation
of the maximum and minimum of Cos <eo - eR> in eq.(~5) is less
than the spatial resolution of the camera, the last term in
that equation will be averaged to zero and no variation in
correlation will be observed. Therefore a relatively small
aperture viewing Je~s must be used to give speckled which are
large enough to be resolved by the television camera. The
aperture of the imaging system should be small to guarantee
sufficient speckle size as has been discussed in Section (A2.1)
The relationshi~ between speckle size and viewing lens aper~ 6 6
ture is discussed by Goodman.
Syrichrdniz~tion between the live and stored responses is
very important. If this is not achieved then 'noise' arises
in the fringe pattern because the live response is not in
phase with the stored (reference) response (i.e. the substrac
tion of the fringe patterns is no longer between equivalent 11 4
point in these two fringe patterns).
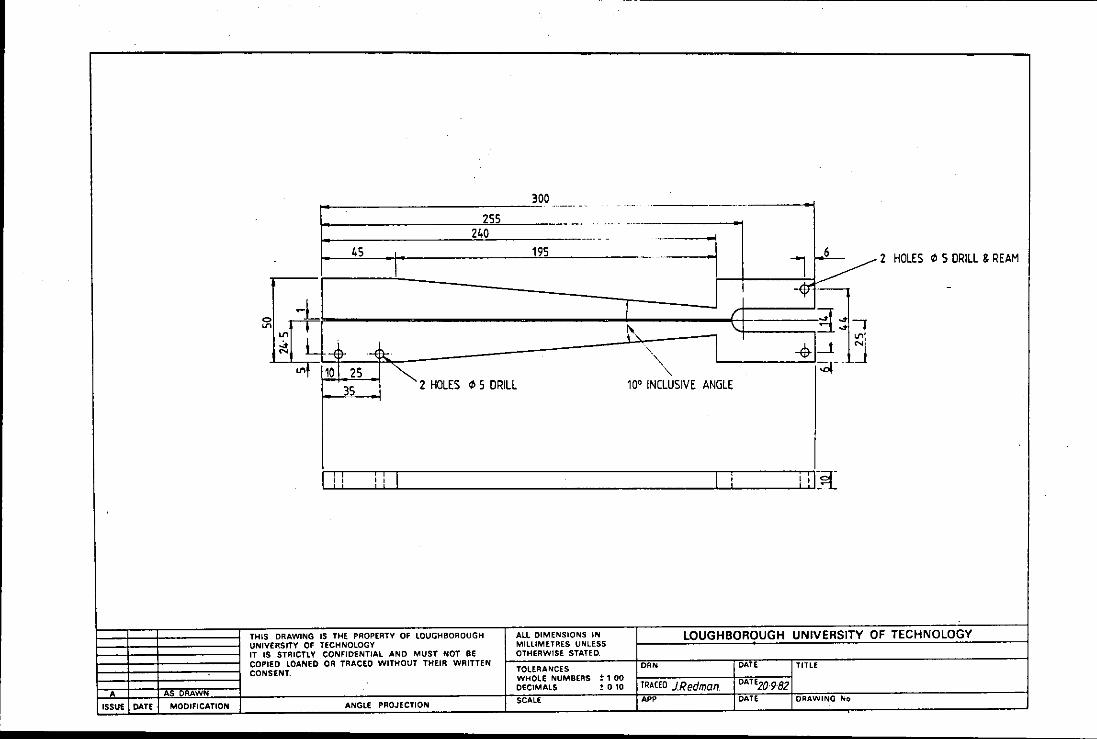
300
I~ ···--·-. - --- --·--·
2S5 - ------240 ·---·- ·- --···=l 45
I 195 ..L
l 2 HOLES ~ 5 DRILL & REAM
I ~~~ -
~L 0
"' L "' 1', ~ > -<&- ·~ !l;;. " I -$- _! N
"'' ~2 HOLES " ;:,r
10 25 " 35 ~ 5 DRILL 10' INCLUSIVE ANGLE
I: I' I I : '<~
THIS DRAWING IS THE PROPERTY OF LOUGHBOROUGH ALL DIMENSIONS IN LOUGHBOROUGH UNIVERSITY OF TECHNOLOGY UNIVERSITY OF TECHNOLOGY MILLIMETRES UNLESS IT IS STRICTLY CONFIDENTIAL AND MUST NOT BE OTHERWISE STATED. COPIED LOANED OR TRACED WITHOUT THEIR WRITTEN
TOLERANCES DRN DATE TITLE CONSENT.
WHOLE NUMBERS ! 1 00 DATE20·9B2
• AS DRAWN DECIMALS ! 0·10 TRACED J.Redman.
ISSUE DATE MODIFICATION ANGLE PROJECTION SCALE APP DATE DRAWING No

350 344
fl-/5 DRILL AND REAM
~ i 17 rl-~r "' I
/ Ll ~ ~
I T
~ R 4' ~6 95 205 300
328 16 ----1 1 R15 18 310 -·
~t 51 I i-I 1-----1
l I :X I ~ .,.,,
I -! 'J'._ .T ~I
' ' _J \ R6
THIS DRAWING IS THE PROPERTY OF LOUGHBOROUGH All DIMENSIONS IN LOUGHBOROUGH UNIVERSITY OF TECHNOLOGY UNIVERSITY OF TECHNOLOGY MILLIMETRES UNLESS IT IS STRICTLY CONFIDENTIAL AND MUST NOT BE OTHERWISE STATED. COPIED LOANED OR TRACED WITHOUT THEIR WRITTEN
TOLERANCES ORN DATE TITLE CONSENT.
WHOLE NUMBERS :!: 1-00 OATEz0·98Z
A DRAWN DECIMALS :!: 0·10 TRACED J. RBdman
ISSUE DATE MODIFICATION ANGLE PROJECTION SCALE APP DATE DRAWING No
·-

A ~ -11
_w -
I I :~,1 I I I !lc:--J -r--~ ~ I E I I '""("-\ , I I '-1-- ~ I ! i (\ L-; -T
~ t-
I+ +I _) L ~ ,_
""' --
NOTE!
I I J 1 -Bit-TOP LINKS NOT TO SCALE LENGTH
( I I
THIS DRAWING IS THE PROPERTY OF LOUGHBOROUGH ALL DIMENSIONS IN LOUGHBOROUGH UNIVERSITY OF TECHNOLOGY UNIVERSITY OF TECHNOLOGY MILLIMETRES UNLESS IT IS STRICTLY CONFIDENTIAl AND MUST NOT BE OTHERWISE STATED. COPIED LOANED OR TRACED WITHOUT THEIR WRITTEN DRN DATE TITLE CONSENT. TOLERANCES
WHOLE NUMBERS ! 1·00
A AS DRAWN DECIMALS :!: 0·10 TRACED JRedman DAT£20·982
ISSUE DATE MODIFICATION ANGLE PROJECTION SCALE APP DATE DRAWING No.

432 100
130 300 _L_
A ~
60 ,¥'
--ffi - i ~ :-;-
I ' I ~-- '7 ' IL
I ,-
~ .~=<F ·I
I~ I I
~ 0 0
~ 0 ... m ~~ m
~
!l "' I ~ ~ m "'
m lfl I
m \ i I Jfl "' I I I I
~t~ "' L r1 r+~ r ' -
I 532 0 ·---"'
, , ,,,,,, , ,
THIS DRAWING IS THE PROPERTY OF LOUGHBOROUGH ALL DIMENSIONS IN LOUGHBOROUGH UNIVERSITY OF TECHNOLOGY UNIVERSITY OF TECHNOLOGY MILLIMETRES UNLESS IT IS STRICTLY CONFIDENTIAl AND MUST NOT BE OTHERWISE STATED. COPIED LOANED OR TRACED WITHOUT THEIR WRITTEN ORN DATE TITLE CONSENT. TOLERANCES
WHOLE NUMBERS :t 1·00 DATE17·9B DRAWN DECIMALS :!: 0·10 TRACED. J.Redman.
ISSUE DATE MODIFICATION ANGLE PAOJECTION SCALE APP DATE DRAWING No.
·-
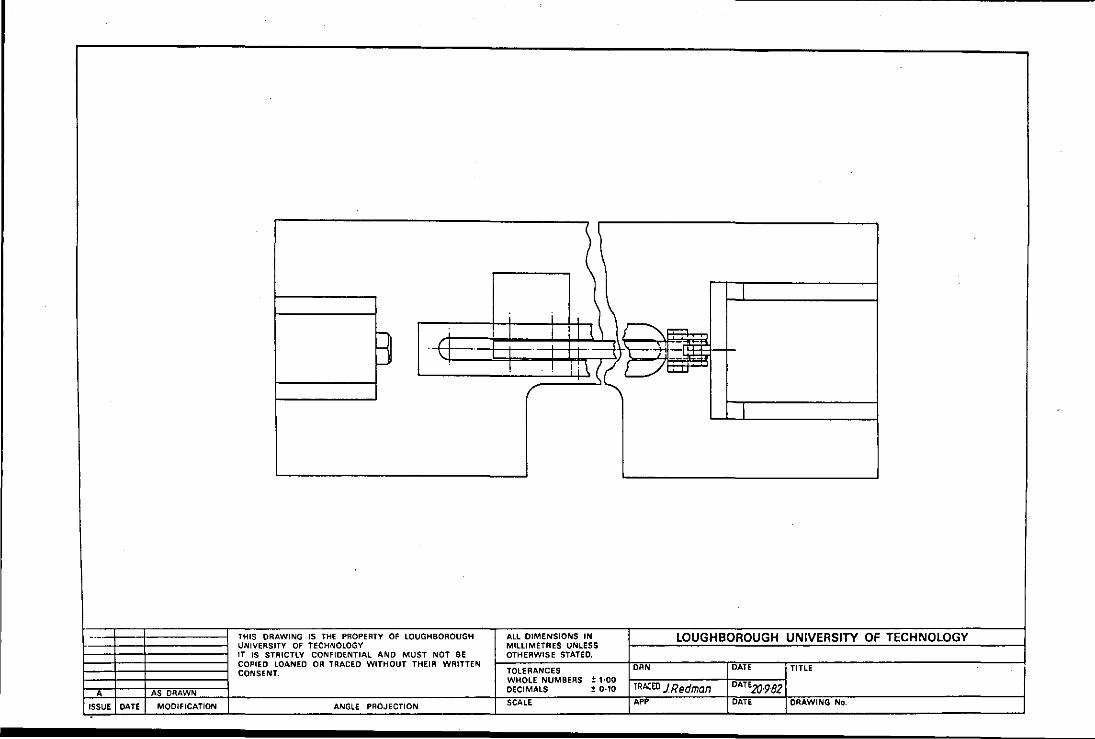
I
i i ·~1\ 8
I I I 1 1l .2-! . I I i \ (, C/=.
I
--- THIS DRAWING IS THE PROPERTY OF LOUGHBOROUGH UNIVERSITY OF TECHNOLOGY
ALL DIMENSIONS IN MILLIMETRES UNLESS
LOUGHBOROUGH UNIVERSITY OF TECHNOLOGY IT IS STRICTLY CONFIDENTIAL AND MUST NOT SE OTHERWISE STATED. COPIED LOANED OR TRACED WITHOUT THEIR WRITTEN DAN DATE TITLE CONSENT. TOLERANCES
WHOLE NUMBERS :!: 1·00 TRIICED JRedman DATE20·9·82
A AS DRAWN DECIMALS ! 0·10
ISSUE DATE MODIFICATION ANGLE PROJECTION SCALE APP DATE DRAWING No.

--
2 HOLES 5mm DRILL AND REAM
42 27
..lQ._
.R .5...r-
;r >-- H- -$; f.! ~ 32 _I
2 OFF SYM No
11 ~~m -@J_j[ tl- -01
;
2 OFF SYM No
UNIVERSITY OF TECHNOLOGY MILLIMETRES UNLESS IT IS STRICTLY CONFIDENTIAL AND MUST NOT BE OTHERWISE STATED. COPIED LOANED OR TRACED WITHOUT THEIR WRITTEN TOLERANCES
CONSENT. WHOLE NUMBERS !: 1 ·00 DRN
.ffl=~ t==il~
L 49 1---· _,6.,_5 __ .,.
,___ 65 ·---< I I
~-'--- _45 _._20--- 32 - 133--
[~~;'---~ ~£~~ - ·- ----- --- .--
1 OFF SYM No
1 OFF SYM No
LOUGHBOROUGH UNIVERSITY OF TECHNOLOGY
DATE TITLE l~~@~~~~-~-~~~i]TH:I~S;Ol,RjA~W[I1NG~I~S THE PROPERTY OF LOUGHBOROUGH ALL DIMENSIONS IN
DECIMALS ! 0·10 TRACED J Red man DATE18·982 ASORAWN -------~~~---------+-ia~~----~~2--h ... ~~~~~tn""~~tn~~0.~-----------------------1 ISSUE DATE MODIFICATION ANGLE PROJECTION SCALE APP DATE DRAWING No,

I 35~ ~ t .. - <(_=-"1::
-j~ -j.L 1r --ir-w WI~ ,tll
0 ~
"' "' "' ... I
m m ., n m m n r:J m j1o~ J1oL J1oL -11oL
I
'- l'
~.1 t t m m
0 0 "' _,
I
t ·~ A~~. I ! l .... ~, ~L
~ "6 HOLES 5mm DRILL AND TAP
~ ljl ~" """ , .. ""'" "" 15 mm EFF. DEPTH. TAP 15mm EFF. DEPTH 5
so l
C=-s:o=:J 1 OFF SPECIMEN SUPPORT BLOCK MAi'L M.S.
1 OFF SUPPORT BLOCK SYM MATt MS
THIS DRAWING IS THE PROPERTY OF LOUGHBOROUGH All DIMENSIONS IN LOUGHBOROUGH UNIVERSITY OF TECHNOLOGY UNIVERSITY OF TECHNOLOGY MILLIMETRES UNLESS IT IS STRICTLY CONFIDENTIAL AND MUST NOT BE OTHERWISE STATED. COPIED LOANED OR TRACED WITHOUT THEIR WRITTEN DRN DATE TITLE CONSENT. TOLERANCES
WHOLE NUMBERS :t: 1·00 DATE20982
A AS DRAWN DECIMALS :!: 0·10 TRACED JRedman ISSUE DATE MODIFICATION ANGLE PROJECTION
SCALE APP DATE DRAWING No.

ISSUE DATE
S DRAWN
MODIFICATION
90 -r
' '
THIS DRAWING IS THE PROPERTY OF LOUGHBOROUGH UNIVERSITY OF TECHNOLOGY IT IS STRICTLY CONFIDENTIAL AND MUST NOT BE COPIED LOANED OR TRACED WITHOUT THEIR WRITTEN CONSENT,
ANGLE PROJECTION
!
' l ! 1\ T
6mm TAPPED
1 OFF SYM No M.S. WELDED FABRICATION
All DIMENSIONS IN MILLIMETRES UNLESS OTHERWISE STATED.
TOLERANCES WHOLE NUMBERS t 1·00 DECIMALS t 0·10
SCALE
LOUGHBOROUGH UNIVERSITY OF TECHNOLOGY
DRN DATE TITLE
TRACED J Redman DATE20·9-82 APP DATE DRAWING No.
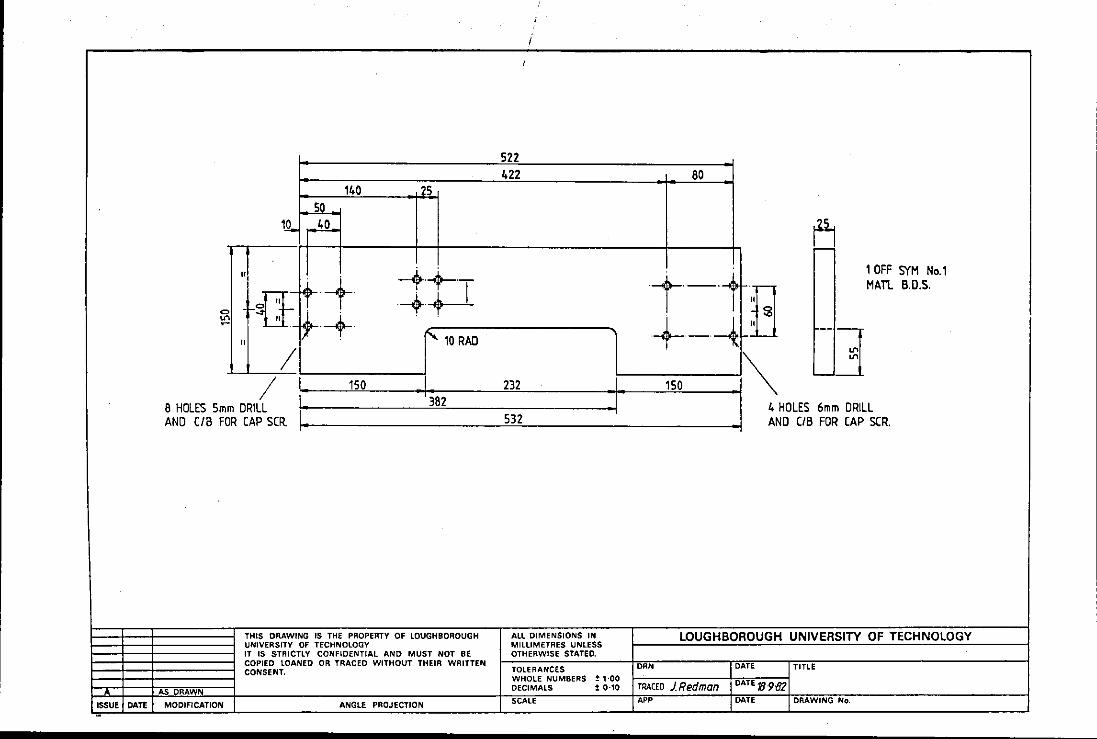
AS DRAWN
140
50
11
0 1-::iGr,·.~ -rt-lt-· + \'J li[ __ +
11 .
I
JS
'- 10 RAD
THIS DRAWING IS THE PROPERTY OF LOUGHBOROUGH UNIVERSITY OF TECHNOLOGY IT IS STRICTLY CONFIDENTIAL AND MUST NOT BE COPIED LOANED OR TRACED WITHOUT THEIR WRITTEN CONSENT.
ISSUE DATE MODIFICATION ANGLE PROJECTION
522 422
232
80
-t-·-< fJ +-·~JJ ---:r
!------l"' _ _j J 150 I "'
1 OFF SYM No.1 MATI. B.D.S.
All DIMENSIONS IN MILLIMETRES UNLESS OTHERWISE STATED.
LOUGHBOROUGH UNIVERSITY OF TECHNOLOGY
TOLERANCES WHOLE NUMBERS ~ 1·00 DECIMALS 1 0·10
SCALE
DRN DATE
TRACED lRedman DATE'I'J9·8Z APP DATE
TITLE
DRAWING No.
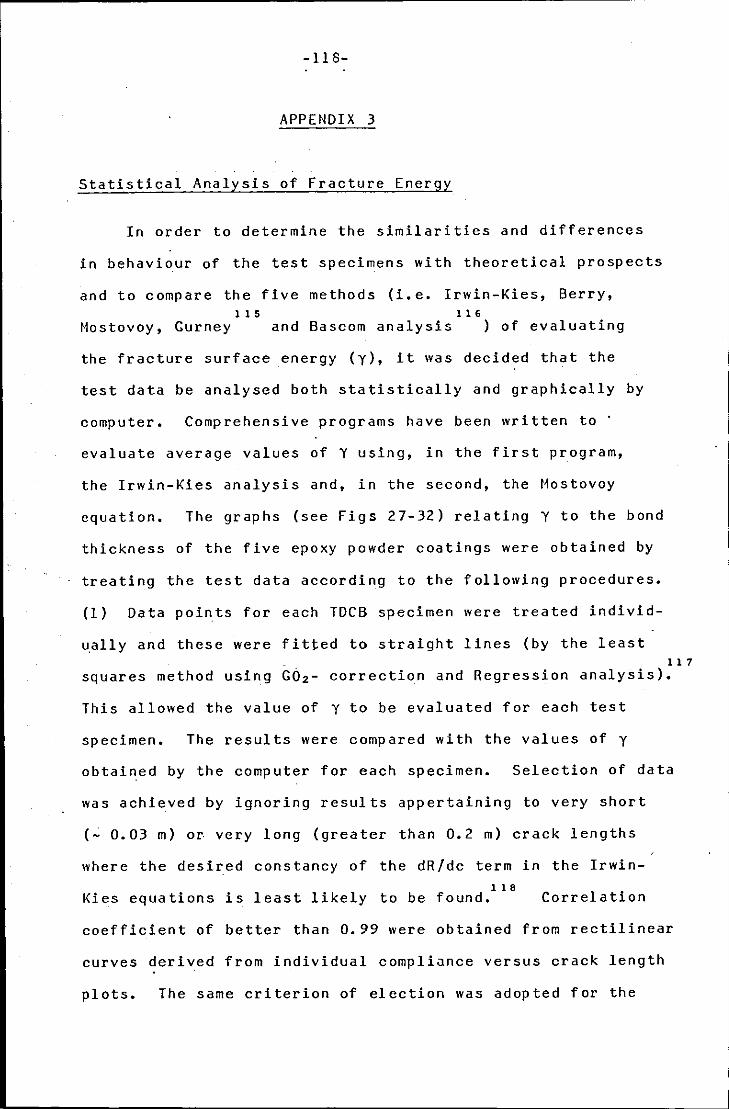
-llS-
APPENDIX 3
Statistical Analysis of Fracture Energy
In order to determine the similarities and differences
in behaviour of the test specimens with theoretical prospects
and to compare the five methods (i.e. Irwin-Kies, Berry, 1 1 5 1 1 6
Hostovoy, Gurney and Bascom analysis ) of evaluating
the fracture surface energy (y), it was decided that the
test data be analysed both statistically and graphically by
computer. Comprehensive programs have been written to ·
evaluate average values of Y using, in the first program,
the Irwin-Kies analysis and, in the second, the Hostovoy
equation. The graphs (see Figs 27-32) relating y to the bond
thickness of the five epoxy powder coatings were obtained by
treating the test data according to the following procedures.
(1) Data points for each TDCB specimen were treated individ-
~ally and these were fitted to straight lines (by the least 11 7
squares method using G6 2 - correction and Regression analysis).
This allowed the value of y to be evaluated for each test
specimen. The results were compared with the values of y
obtained by the computer for each specimen. Selection of data
was achieved by ignoring results appertaining to very short
(~ 0.03 m) or very long (greater than 0.2 m) crack lengths
where the desired constancy of the dR/dc term in the Irwin-1 1 e
Kies equations is least likely to be found. Correlation
coefficient of better than 0.99 were obtained from rectilinear
curves derived from individual compliance versus crack length
plots. The same criterion of election was adopted for the
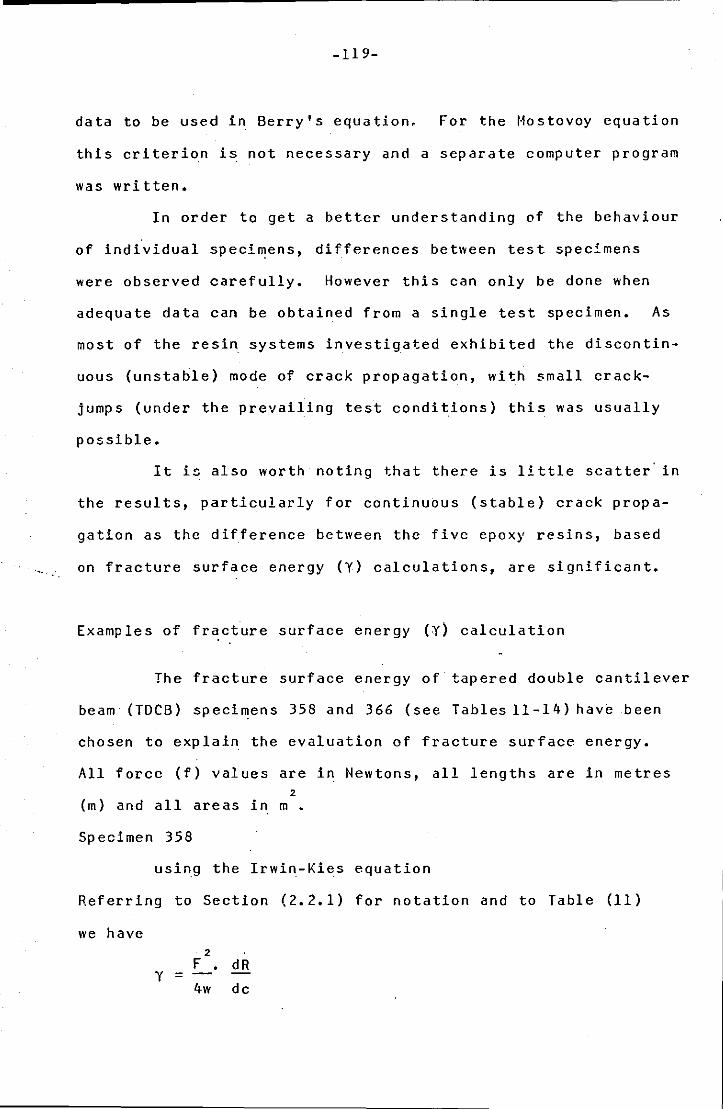
-119-
data to be used in Berry's equation. For the Hostovoy equation
this criterion is not necessary and a separate computer program
was written.
In order to get a better understanding of the behaviour
of individual specimens, differences between test specimens
were observed carefully. However this can only be done when
adequate data can be obtained from a single test specimen. As
most of the resin systems investigated exhibited the discontin
uous (unstable) mode of crack propagation, with small crack-
jumps (under the prevailing test conditions) this was usually
possible.
It is also worth noting that there is little scatter in
the results, particularly for continuous (stable) crack propa-
gatlon as the difference between the five epoxy resins, based
on fracture surface energy (Y) calculations, are significant.
Examples of fracture surface energy (y) calculation
The fracture surface energy of tapered double cantilever
beam (TDCB) specimens 358 and 366 (see Tables 11-14) have been
chosen to explain the evaluation of fracture surface energy.
All force (f) values are in Newtons, all lengths are in metres 2
(m) and all areas in m •
Specimen 358
using the Irwin-Kies equation
Referring to Section (2.2.1) for notation and to Table (11)
we have 2
F • dR y =
4w de

-120-
y = (403.17) 2 - 6 4. 42 9 X 10
4 X 0. 01
y = 179.98 _2
J.m
using the Mostovoy equation
Referring to Section (2.2.1) and T~ble (12) we have
y =
2 2 X (403.17)
(0.01) 2 X 203 X 10 11
y = 144.13 -2 J.m
X 9000
Specimen 358
using the Berry method
Referring to Section (4.1.2) for notation and Table (13) we
have
y
y
y
= slope (log f/o v.log c) x slope (fo/w v.c)
4
= 1.01 X 582.0
4
-2 =146.86J.m
using the Gurney method
Referring to Section (4~1.3) and Table (14) we have
... ~ . . . . . -2 y = Area under load-deflection gr~ (m)x work constant factor (Jm )
Area of fracture surface (m~

-121-
y = 7.6 X 10-4
X 183 X 10-2
l. 58 X 10-5
y = 88.62 -2
J.m
For (H43) specimen with bond thickness = 0.1 mm.
using the plastic zone size equation
Referring to Section (2.2.1) and Table (4) we have
2 _e 2 11 GIC = 2Y = 611 X (1-(0. 35) )x(9, 6lxl0 ) x 2.03 x 10
X 0,4 X 10-B
2
Y = 63. 57 J. m-
Repeating the exercise for specimen 366 we have
for the Irwin Kies method,
Y = 488 • 98 X 2.656 X 10-
6
4x0. 01
y = 158.76 J.m~ 2
for the Berry method,
y = l. 02 X 39. 9
4
J -2 Y = 99.93 .m
for the Gurney analysis,
y 54.9 X 10- 4 X l. 83 X
= 5' 2 7 X 10- 5
196. 2 9 J.m -2 y =
10- 2
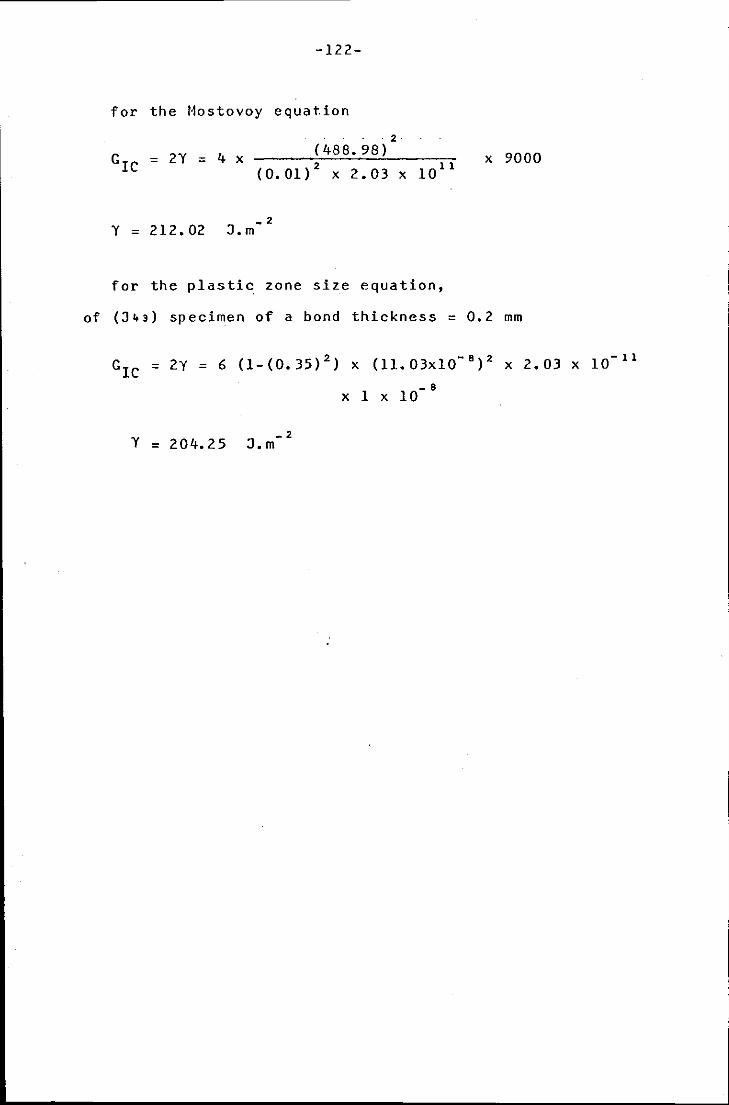
-122-
for the Mostovoy equation
. 2
(488.98) GIC = 2Y = 4 x
(0.01)2
X 2.03 X 1011
J -2
Y = 2 J. 2. 02 • m
for the plastic zone size equation,
X 9000
of (J~3) specimen of a bond thickness = 0.2 mm
GIC = 2Y = 6 (1-(0.35) 2) x (11.03xl0- 8
)2 x 2.03 x 10-
11
- 8
y = 204.25 -2 J.m
X 1 X 10

-123-
APPENDIX 4
The Evalution of Fracture Surface Energy (y} by using lrwin-Kies equation
LIBRARY(ED,SUBGROUPNAGF) LIBRARY(ED,SUBGROUPGINO) PROGRAH(AMAL188) COMPRESSINTEGERANDLOGICAL INPUT l=CRO OUTPUT 2=LPO TRACE 2 END MASTER HADIS REAL C(l5,10),R(l5,10),RESULT(20),DELTA(l5,10),TOTGAM,
lF(l5,10),W,AVF(lO),GAMA(l0),AVGAMA,X(l5),Y(15),AVV(20) INTEGER N,IFAIL,M NGRAF=O IFAIL=O W=O.Ol CALL C1051N CALL WINDOW(2) K=l
100 READ(l,21)M 21 FORIIAT(IO)
AVGAMA=O TOTGAM=O DO 4 J=l,M WRITE(2,10)J
10 FORMAT(2X,'J=',I5) AVF(J)=O READ(l,22)N
22 FORMAT(IO) DO 2 I=1,N WRITE(2,ll)I
11 FORMAT(2X,'I=',I5) READ (1, 23 )DELTA (I ,J) ,F (I ,J) ,C (I ,J) ,GPG
23 FORMAT(3FO.O,T50,F1.0) C(I,J)=C(I,J)+GPG/100.0 WRITE(2,200)DELTA(I,J),F(I,J),C(I,J)
200 FORMAT(1X,3E15.6) X(I)=C(I,J) R(I,J)=DELTA(I,J)/F(I,J) Y(I)=R(I,J) AVF(J)=AVF(J)+F(I,J)
2 CONTINUE AVF(J)=AVF(J)/N CALL G02CAF(N,X,Y,RESULT,IFAIL) GAMA(J)=(AVF(J)**2)*RESULT(6)/(4.0*W) TOTGAM=TOTGAM+GAMA(J) WRITE (2,50) ·
50 FORMAT(//lX,'EVALUATION OF GAMA BY IRWIN-KIES EQUATION') WRITE(2,51)
51 FORMAT(//4X, 'DELTA' ,16X, 'F' ,15X, 'R' ,15X, 'C') DO 57 I=1,N WRITE(2,52)DELTA(I,J) ,F(I,J) ,R(I,J) ,C(I,J)
52 FORMAT (/1X,E16. 8, 2X,El6. 8, 2X,E16. 8, 3X,E16. 8) 57 CONTINUE
WRITE(2,53)AVF(J),RESULT(6),RESULT(8),GAMA(J),RESULT(7)

-124-
53 FORMAT(/1X,El6.8,2X,'SLOPE=',El6.8,2X,'R-COEF=',El6.8, l2X,'GAMA=',El6.8,2X,'INTER=',El5.8)
AVGAMA=TOTGAM/J WRITE(2,59)AVGAMA
59 FORMAT(/lX,'AVERAGE GAMA=' ,El6.8) CALL ERRMAX(500) CALL PAPENQ(XP,YP,I) CALL MOVT02(0.,0.) CALL LINT02(XP,O.) CALL LINT02(XP,YP) CALL LINT02(0.,YP) CALL LINT02(0.,0.) CALL AXIPL0(0,200.0,150.0,3,3,10,10,0.0,0.200,0.0,0.00001,'CRACK L
lENGHT (X) ',17,'COMPLIANCE (M/N) I ,17) CALL GRASYM(C(l,J) ,R(l,J) ,N,7,0) CALL GRAMOV(C(l,J) ,RESULT(7)+RESULT(6)*C(l,J)) CALL GRALIN(C(N,J) ,RESULT(7)+RESULT(6)*C(N,J)) CALL PENSEL(l,O.O,O) CALL GRAMOV(0.05,0.000012) CALL CHAHOL(46HT*LHE SLOPE OF COMPLIANCE VERSE CRACK LENGHT*.) CALL PICCLE NGRAF=NGRAF+l IF(NGRAF.LE.lS)GO TO 4 CALL DEVEND CALL Cl051N CALL WINDOW ( 2) NGRAF=O
4 CONTINUE AVV(K)=AVGAMA WRITE(2,26)AVV(K)
26 FORMAT(lX,'AVV=',El6.8) K=K+l IF(K.LE.6) GO TO 100· WRITE(2,25) (AVV(I) ,I=l,6)
25 FORMAT(/lX,'AVV GAMA=',El6.8) X(l)=O.l X(2)=0.2 X(3)=0.3 X(4)=0.4 X(5)=0.5 X(6)=0.6 CALL PAPENQ(XP,YP,I) CALL MOVT02(0.,0.) CALL LINT02(XP,O.) CALL LINT02(XP,YP) CALL LINT02(0.,YP). CALL LINT02(0.,0.) CALL AXIPL0(0,70.00,60.00,3,3,6,5,0.0,0.6,0.0,350.0,'BOND THICKNES
lS (MM) ',2l,'FRACTURE SURFACE',l6) CALL GRASYM(X,AVV,6,7,0) CALL GRACUR(X,AVV,6) CALL PENSEL(l,O,O,O) CALL GRAMOV(0.05,370.0) CALL CHAHOL(l9HE*LNERGY (J/(M)2)*.)

****
-125-
CALL GRAMOV(O.l,SOO.O) CALL CHAHOL(85HT*LHE EFFECT OF BOND THICKNESS ON FRACTURE SURFACE
!ENERGY USING IRWIN-KEIS EQUATION*.) CALL DEVEND STOP END FINISH
-126-
REFERENCES
1. ASTM Gl4-77 test for impact resistance of pipeline coating.
2. BS 1391 Tubular impact testing, London, (1952).
3. DEF 1053 Ml7a, falling block impact testing.
4. J.F. Knott, Fundamental of fracture mechanics, :Butterworth, London, (1973).
5. E. Orowan, Nature, 54, 341, (1944).
6. A.A. Griffith, Phi!. Trans. Roy. Soc., A 221, 161, (1920).
7. , A. A. Griffith, Proc. Intern. Congr. Appld. Mech., (Delft), 55, (1924).
8. C.E. Inglis, Proc. Inst. Naval Architects, 55, 219, (1913).
9. J.P. Berry, J. Pclym. Sci •.• 50, 107, (1961).
10. J.P. Berry, J. Polym. Sci •.• 50, 313, ( 1961 ) •
11. R.M. Caddell, De-formation and fracture of soild, Prentice-Hall, Inc. Eng1ewood, Cliff, New Jersey, U.S.A. (1980).
12. G.R. Irwin, ''Analysis of stresses and strain near the end of a crack traversing a plate". Transactions, Am. Soc. Mechanical Engs. J. Appld. Mechanics 24, 361, 1957.
13. E. Orowan, Trans. Inst. Eng. Shipbuild. Scotland, 89, 165, (1945).
14. E. Orowan and D. K. Fe1beck, Welding Journal Res. Suppl. 570, 1955.
15. G.R. Irwin, Fracture, Handbuch der physik, Vol. 6, Springer, Berlin, (1958), P. 551.
16. G.R. Irwin and J.A. Kies, Welding J. Res. Suppl. 33, (1954), 1935.
17. s. 11ostovoy and E.J. Ripling, J. Appl. Poly. ScL, Vol. 10, 1351, (1966).

-127-
18. S. Mostovoy and E. J. Rip ling, J. Appl. Polym. Sci., Vol. 13, 1083, (1969).
19. S. Mostovoy and E.J. Ripling, J. Appl. Polym. Sci., Vol. 15, 641-661, (1971).
20. A.S. Tetelman and A.J. McEvily, Fracture of structural materials, John Wiley and Sons, Inc. U.S.A., (1967).
21. W.D. Bascom, R.L. Cottington, R.L. Jones and P. Peyser, J. Appl. Pol. Sci. (1975), 19, 2545.
22. B.W. Cherry and K.W. Thomson, Fourth Int. Conf. Cambridge. The Plastic and Rubber Institute, London, (1979). 3.1-3.6.
23, ''Standard method of test for plane-strain fracture toughness ofmetallic materials", ASTM Designation. E399-78a. ·
24. Richard IV. Hertzberg, Deformation and fracture mechanics of engineering materials (1976), John \Viley and Sons, Inc. U.S.A.
25. G. R. Irwin, ''Fracturing of metals'' (Cleveland, Ohio, ASEM 1949), pp. 147-166.
26. S. Mostovoy, E.J. Rip ling and C. F. Bersch, J. Adhesion, Vol. 3, 125, (1971).
27. S. T. Rolfe and J. M. Barsom, Fracture and fatigue control in structures, Prentice-Hall, Inc. Englewood Cliffs, New Jersey, U.S.A. (1977).
28. A. S. Tetelman and T. S. Robinson, Strengthening mechanism in solid ASM, Clevdel, p. 217, (1972).
29. G.P.A. Turner, ''Introduction to paint chemistry", Chapman and Hall, London (1967).
30. J.P. Berry, J. Poly. Sci., AI, 993.
31. G. Rossa, Brit. Patent. 1, 165, 657, (Oct. 1, 1969).
32. R. A. All en and IV.L. Lantz, (U.S. patent 3477971; No. 11, 1969).
33. H. Lee and K. Neville, Epoxy Resin (their ·applications and technology, 1957), p. 49, McGraw-Hill Book, U. S.A.

-128-
34. Weg1er R. Angew, Chem. 67, 587, (1955).
35. IV. Fisch, E. Hoffmann and :J. Koskhikallio, :J. Appl. Chem. (London), 6, 429, (1965).
36. R. Griffiths and D.G. Ho1loway, :J. Material ScL, 5, 302-309, (1970).
37. L.:J. Broutman and F.:J. McGarry, :J. Appl. Poly. Sci., 9, 609-626, (1965).
38. K. Se1by and L. Miller, :J. Mat. ScL, J.O, (1975), 12-24.
39. 0. K. Spurr and IV. D. Niegisch, :J. Appl. Polym. Sci., 6, 585, (1962).
40. R.P. Kambour, :J. Po1ym. Sci._, A.2, 4, 17, (1966).
41. R; P. Kambour, Nature, 195, 1299, (1967).
42. R.P. Kambour, Polymer, 5, 143, (1964).
43. P. Beahan, M. Bevis, and D. Hull, Phil. Mag., 24, 1267, (1971),
44. P. Beahan, M. Bevis, and D. Hull, :J. Mat. ScL, 8, 162, (1972).
45. G.P. Marshal!, L.E. Culver, and :J.G. \Villiams, Proc. Ray. Soc. Land. A319, 165, (1970).
46. E.H. Andrews and L. Bovan, Polymer, 13, 337, (1972).
47. E.H. Andrews and L. Bovan, Polymer, 15, 599, (1974).
48. D.S. Dugdale, :J. Mech. Phys. Solids, 8, 100, (1960).
49. N.I. Muskhelishvili, "Some basic problems of mathematical theory of elasticity''• N.U.P. Noordhoff, Groningen, Holland (1953) p. 340.
50. :J.N. Goodier and F.A. Field, Proc. of I~tPrnational Conference 011 Fracture of Soi1d, ed, by D.C. Drukucker and :J.:J. Gilman. Mat. Soci. ccnferences Vol. 20, intersciences, New York, (1963), p. 103.
51. IV. IV. Gerberich, Intl. :J. Fracture, 13, 535, (1977).

-129-
52. IV. B. Klemperer, In Theojore von Karman Anniversary Volume 1, Appl. Mech., 328, (1941).
53. :J. t1arin, and C. C. Hsiao, :J. Apld. phys., 21, 1071, (1950).
54. R.P. Kambour, Nature, 195, 1299, (1962).
55. :J.A. Leendertz, :Journal of physics E: scientific instruments, Vol. 3, 214-218, Great Britain, (1970).
56. E. Archbod, and A. E. En nos, Optica Acta, Vol. 19, No. 4, 253-271, (1972).
57. :J.N. Butters, and :J.A. Leendertz, :Journal of physics E: scientific instruments, Vol. 4, 277-279, Great Britain, (1971).
58. R.L. Powell and K.A. Stetson, :J. Opt. Soci. At1, 55, 1593-8. (1965).
59. R.E. Brooks, L.O. Heflinger and R.F. Wuerker, Applied physics letters 7, 248-9. (1965).
60. R. ::J. Collier, E. T. Doherty and K. S. Penning ton, Applied physics letters 7, 223-5, (1965).
61. ::J. M. Burch, A. E. En nos and R. ::J. \Vil ton, Nature, 209, 1015-1016. (1966).
62. B.P. Hildebrand and K.A; Haines, Applied Optics 5, 595-602. (1966).
63, ::J.D. Briers Optical and Quantum Electronics 8, 469-501. (1976).
64, ::J. G. Groh, The Enqineering uses of Holography, Cambridge University Press, 483-497. (1970).
65. ::J.D. Rigden and E.I. Cordon, Proc. IRE Vol. 50. 2367-2368, (1962).
66. ::J. \V. Goodman, Chapter 2, Laser speckle and related phenomena, Sprinqer-Verlag, (Berlin). (1975).
67. ::J.C. Dainty, Editor, Topics in Applied Physics, Vol. 9, Springer-Verlag, Berlin, (1975). ·
68. C.t1. Vest, 'Holographic interferometry', ::John Wiley, New York, (1979),
-130-
69. P~S. Theocaris, "Optical meth~ds in mechanics solids", ed. Alexis Lagarde, Haryland, U.S.A. (1981), · 395.
70. H.J. Tizian, "Speckle Metrology", editor R.K. Erf, Academic Press Inc., U.S.A. (1978),
71. P.F. Boyer, Rubb, Chem. Tech. (Rubber Reviews) 36, 1303, 1963.
72. G.H.J. Klaren, J. Oil Col. Chem. Assoc, 60, 205-213, (1977).
73. T.G. Fox and P.J. Flory, J. Appl. Phys. 21, (1950), 281.
74. D. Hull, J. Mat. Sci., 5, 157-363, (1970),
75. B. Harris, Polymer Engineering Composites, Editor M.O.W. Richardson, Applied Science Publishers Ltd., London, Chapter 2, (1977).
76. C. Gurney, ''Physical Basis of Yield and Fracture'', Oxford Conf. 1966.
77. S. Mostovoy and E.J. Ripling, J. Appl. Pol. Sci. (1971), 15, 661.
78. K. Selby, Ph.D. Thesis, University of Loughborough, England, (1976).
79. K, Kanari, Jap. pJ.ast, 6, (2), (1972), 6-12.
80. J.K. Gillham, J.A. Benci and A. Noshay, J. Polym, Sci. Symposium No. 46, 279-289, (1974).
81. C. Froehly, Optical methods in mechanics of solids, ed, Prof. A. Lagarde, Maryland, U.S.A., Sijhcff and Noordhoof, (1981},
82. J.P. Berry, Nature, 135, 91, (1963).
83. J,P. Berry, Fracture processes in pclymeric solids, p. 221, ed. B. Rosen, Inter science, New York, (1964).
84, R.P. Kambour, J. Polym, Sci., 4A-2, 17, (1966),
85, E.J. Kramer, Developments in polymer fracture, ed. by E.H. Andrews, Applied Science Publishers, London, (Ltd. 1979).

-131-
86. A. G. A. ~1i tchell, M.Sc. dissertation, University of Loughborough, England, (1979). .
87. H. Anderson, J. Soc. Plast, Eng, 16, 1241, (1960).
88. W.E. Rich and M. Balnar, J. Appl. polym. sci., 3, 296, (1960).
89. R.P. Kambour, Macromol Rev, J. pol. sci, 7 (1973), 1.
90. W.D. Bascom, R.L. Cottington and C.O. Timmons, ''Fracture design criteria for structural adhesive bonding promise and problems", J. Naval. Eng. August 1976, pp. 73-85.
91. W.D. Bascom and J.L. Bituer, J. Mat. Sci, 12, (1977), 1401.
92. A.J. Kinloch and S.J. Shaw, ''In development in adhesives 2", edited by A.J. Kinloch, (Appl. Sci., London, ·1981 ).
93, A.J. Kinloch, S.J. Shaw and D.L. Hunston, lnt. conf. Churchill College, Cambridge, HMSO, London, 1982. .
94. R.A. Gledhill and A.J. Kinloch, polymer, 17, 727, (1976).
95. A.M. Noath, Essay, Chemic., 4, l, (1972).
96. R.S. Sterin, J. polymer, Sci., 87, (1969) 657.
97, L.I. Trepelkova, G. G. Grush, M. I. Palei, A. N. Shabadash, and N.N. Molotkva, plast. t1ass. l, (1976)44-46.
98. P. Beaham, M. Bevis and Hull, J. Mat. Sci., 8, 162-168, (1972).
99. Metals Handbook, 8th Edition, Vol. 10, Failure Analysis and Prevention, (Metal park, Ohio; American Society for Metals, 1975).
100. N.L. Baun, Application of surface science 4 (1980), 291-306.
101. Electron optical instrumentation in the study of materials, Loughborough University, Loughborough, England, ''Electron diffraction and crystallographic analysis", (1981).

-132-
102. J. Bikerman, Recent advances in adhesion, ed. L.H. Lee (Cordon and Breach, New York, 1973).
103. H.G. Krenz, O.G. Ast and E.J. Kramer, J. ~lat. Sci. 11, (1976), 2198-2210.
104. A.J. Kinloch, J. ~lat. Sci. 14, (1980).
105. A.J. Kinloch and J.G. Williams, J. Mat. Sci. 15, (1980), 987-996.
106. A.J. Kinloch and S.J. Shaw, Internal conferences adhesion and adhesive, Durham, Sept. (1980).
107. C. B. Bucknall and T. Yoshii,
108.
in ''Tou9hness plastics'', Applied science publisher, London (1977). ·
H.M. Westergaard, "Bearing pressures and cracks'', Trans. Asin. E.J. Appld. Mech. 61, pp. A49-A53, (1939).
11.0. E. Orowan, ''Fracturing and strength of solids" Rep. prog. in phys. soc. London, 12, 185-232, (1949).
111. Lie bowitz, Fracture, Vol. 2, Material Fundamental Academic Press, (1968).
112. W. T. Evans and A. Luxmoore, Eng. Fracture, Mech. 6, (1974), 725.
113. R. Jones and C. Wykes, Optica Acta, 24 (1977), 537-550.
114. G. A. Slettemoen, Laser speckle and related phenomena, Applied optics, Vol. 19, no. 4, 1980.
115. C. Gurney and J.W. l·lai, En g. Fract. 14ech. 4, (1972), 853.
116. M.O.W. Richardson and A.H.M. Al-Hassani, Trans. Met. Fin. Vol. 59, 1981.
117. G02 - Correlation and Regression Analysis NAGFLIB: 801/715: Mks: Nov. 1974.
118. M.O.W. Richardson and A.H.M. Al-Hassani and D.P. Herbert, Trons. 14et. Fin., Vol. 60, 1982.
*109. H. Tada, P. Paris and G. R. Irwin.
The stress analysis of Cracks (handbook), Hellertown,
Pennsylvania, (1973) .

TABLES

Table 1. E~oxy Powder CoatinQ
Component {parts by weight)
Epikote 1055 Epoxy Resin
Trimellitic Anhydride
Stannous Octoate
"Modaflow" acrylic resin
Stoichiometry %
-
Formulation
H' 3 1,3
100 100
8. 95 1 o. 0
1.5 1.5
0.5 o. 5
80 90
s
POWDER CODE
lOO lOO 100
8 11.20 12.32 13.44
1.5 1.5 1.5
0.5 0.5 0.5
lOO 110 120

Table 2. Physical DATA of the Epoxy Re$in
Specimen Glass Transition and Density temperature tiy Micrchardness
powder -3 (TI·1A) method -2
code g.m <oc l (Kg mm )
L.!. 1.139 100.0 14.20 ( H 4 3)
L 1.143 107.0 15.211 (I 4 3)
s 1.148 109.0 16. 03 (J 4 3)
H 1.149 111.0 16. 85 ( K 4 3)
Hh 1.165 119.0 18.17
(L 4 3)
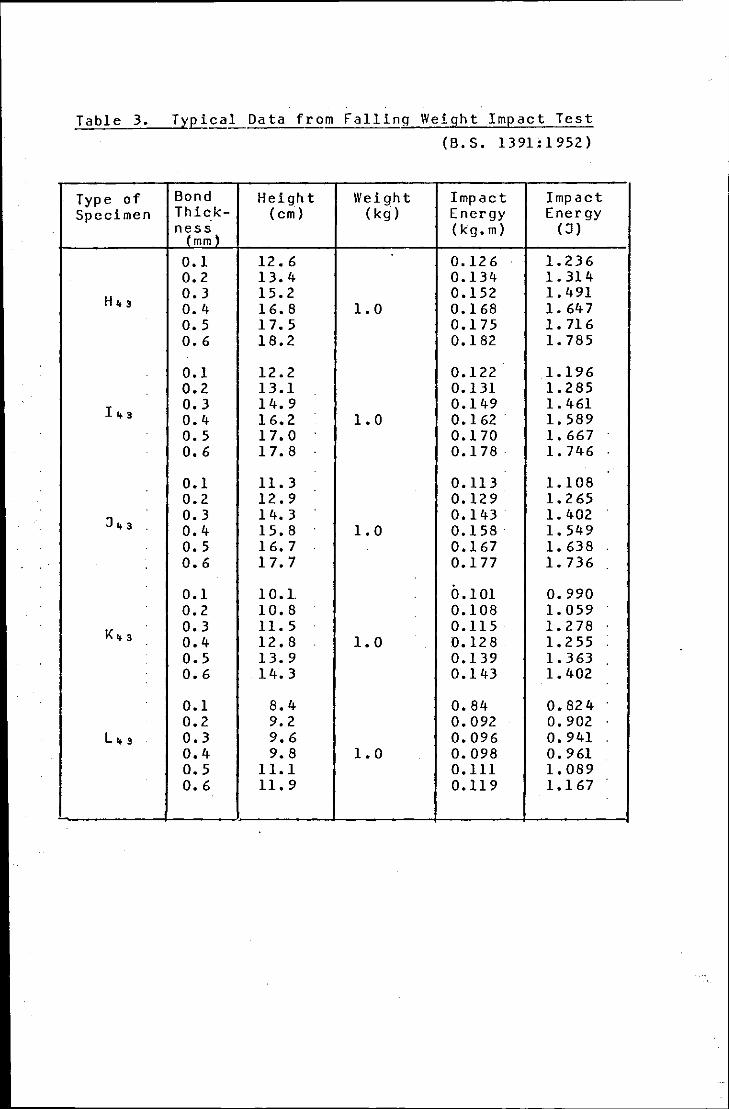
Table 3. Ty~cal Data from Falling Weight Impact Test
(B.S. 1391!1952)
Type of Bond Height Weight Impact Impact Specimen Thick- (cm) (kg) Energy Energy
n~~~) (kg. m) (J)
D.l 12. 6 0.12 6 1.236 0.2 13.4 0.134 1. 314
H43 0.3 15.2 0.152 1. 491 0.4 16. 8 1.0 0.168 1.647 o. 5 17. 5 0.175 1. 716 0.6 18.2 0.182 1. 785
0.1 12.2 0.122 1.196 0.2 13.1 0.131 1.285
I 4 • 0.3 14. 9 0.149 1. 461 0.4 16.2 1.0 0.162 . 1. 589 o. 5 17.0 0.170 l. 667 0.6 17. 8 0.178 1. 746
0.1 11.3 0.113 1.108 0.2 12.9 0.129 l. 265
J43 0.3 14. 3 0.143 l. 402 0.4 15. 8 1.0 0.158. l. 549 o. 5 16. 7 0.167 l. 638 0.6 17.7 0.177 1. 736
0.1 10.1. 0.101 0.990 0.2 10.8 0.108 1. 059
K43 0.3 11.5 0.115 l. 278 0.4 12.8 1.0 0.128 1.255 0.5 13.9 0.139 1.363 0.6 14. 3 0.143 1. 402
0.1 8.4 0.84 o. 824 0.2 9.2 0.092 0.902
l43 0.3 9.6 o. 096 o. 941 0.4 9.8 1.0 0.098 o. 961 0.5 11.1 0.111 1. 089 0.6 11.9 0.119 1.167

Table 4. Typic~l Data for evaluating Fracture Surface Energy
(Y) by Plastic Zone Measurement
Type Bond l~ean of l~ean of Mean of Average of thick- plastic plastic the fracture
spec- ne ss deform-· deform- yield surface imen a tion at ion strain energy
zone zone
2 diamet'Sr radius c xl0 8 (h)mxlO (2r 1C)xl0 m (r1Jxl0 8 m (y)Jm -2
y
*0.1 0.81 o. 41 9. 61 63. 57* 0.2 1. 76 0.88 9.50 133.34 0.3 2.28 1.14 9.30 165.53
H43 0.4 2.88 1. 44 8. 20 162.56 0.5 3. 24 1. 62 8.10 180.54 0.6 3. 44 1.72 8. 25 196.54
0.1 0.79 0.395 9. 45 59.22 0.2 1.72 0.86 9.83 139.13
I 4 3 0.3 2.12 1. 01 9. 2 7 145. 71 0.4 3.00 1. 50 9.02 204. 08 0.5 3.12 1. 56 8.86 205.59 0.6 3.40 1. 70 8.46 203. 78
0.1 0.80 o. 40 9.44 59.84 *0.2 2.00 1. 00 11.03 204. 2 5
J 4 3 0.) 2.04 1. 02 9.22 145. 57 0.4 2.80 1. 40 9.03 191. 65 0.5 2. 96 1. 48 8.79 191. 98 o. 6 2. 72 1. 36 8.58 168.08
0.1 o. 77 0.38 9. 41 57.23 0.2 1. 68 0.84 9. 76 131.59
K43 o. 3 2.56 1. 28 9.20 181.89 0.4 2.36 1.18 9.18 166. 95 o. 5. 2.64 1. 32 8. 51 160. 49 o. 6 3. 20 1. 60 8. 42 190.44
0.1 ·0.82 o. 41 9. 61 63.57 0.2 1. 88 0.94 &.68 147.87
l43 0.3 2.28 1.14 9.12 159.19 o. 4 2.76 1. 38 8. 96 186.00 0.5 2. 96 1. 48 8.63 185.05 o. 6 2. 40 1. 70 8.33 198.04
* See Appendix. 3

Table 5. Fracture Surface Energy, Y, v. crosshead speed
Stoichiometry Symbol
L9.
80%
Bond Thickness
(mm)
0.1
0.2
0.3
0.4
0.5
0.6
Crosshead Speed
_1 (mm.s )
0.0083 o. 0167 0.0333
0.0083 o. 0167 0.0333
0.0083 0.0167 0.0333
0.0083 0.0167 0.0333
0.0083 o. 0167 0.0333
0.0083 o. 0167 o. 0333
Fracture surface Energy
Irwin- Mostovoy Kies Method Method
2 y(J.m- )
176. 69 168. 73 106.70
145. 75 149.2 7 157.19
186. 50 170. 17 148. 84
150.53 147.01 159.28
22 4. 51 181.22 155.11
148. 61 203.00 156.46
2 y(J.m- )
190.33 205.09 177. 94
207.92 197. 41 200. 18
219.370 214.87 201. 63
205.17 2 01. 94 178.28
2 38. 06 242. 94 233.53
2 3 3. 30 224. 71 193. 62
~--------~------~--------~----------L-----------~·
All cured at 238°C for 1.5 hours and tested at
atmosphere humidity 65% ± 5.

Table 6. Fracture Surface Energy, Y, v. cross-head speed
Stoichio- Bond Cross- Fracture surface Energy me try Thick- head Symbol ne ss Speed Irwin- Mostovoy
Kies Method t1e tho d
- 1 - 2 - 2
L (mm) (mm.s ) Y(J.m ) y(J.m )
0.0083 14 7. 91 221. 74 0.1 o. 016 7 136.16 195.53
0.0333 185.91 202.67
0.0083 207. 82 242.18 0.2 0.0167 156.86 203.68
0.0333 188.13 240. 88
0.0083 169.24 228.56 143 0.3 0.0167 156.83 18 6. 15
0.0333 149.33 187.78
90% 0.0083 165.54 225.69 o. 4 0.0167 171. 48 200.50
0.0333 169. 32 210.68
0.0083 214. 4 7 2 71. 79 0.5 0.0167 165. 30 224.59
0.0333 173. 03 243. 01 '
0.0083 188.60 260.08 . 0. 6 0.0167 188. 92 230.23
0.0333 171.12 200.71
All cured at 238°C for 1.5 hours and tested at
atmosphere humidity 65% ± 5,

Table 7. Fracture Surface Energy, Y, v. cross-head speed
Stoichio- Bond Cross- Fracture surface Energy me try Thick- head Symbol ne ss Speed Irwin- 11ostovoy
Kies 1·1etho d Method
- 1 - 2 - 2
s (mm) (mm.s ) Y(:J.m ) Y(:J.m )
0.0083 170. 48 211.57 0.1 0. 016 7 160. 04 208. 68
0.0333 146. 81 174. 86
0.0083 235.18 2 64. 52 0.2 0.0167 2 94. 2 9 2 82. 49
o. 0333 211. 30 208.85
:J•s 0.0083 1 64. 82 2 34. 61
0.3 0.0167 159.23 211.54 0.0333 . 193.82 209. 41
100% 0.0083 214. 72 212. 45 o. 4 0.0167 165.19 210.11
o. 0333 15 7. 81 225.05 2 .c...~
0.0083 194.84 2 68. 99 0.5 0.0167 175. 71 210.01
0.0333 175.02 199.39
0.0083 189.99 212.15 o. 6 0.0167 18 9. 61 223.05
0.0333 147.03 214.67 .
All cured at 238°C for 1.5 hours and tested at
atmosphere humidity 65% ± 5.
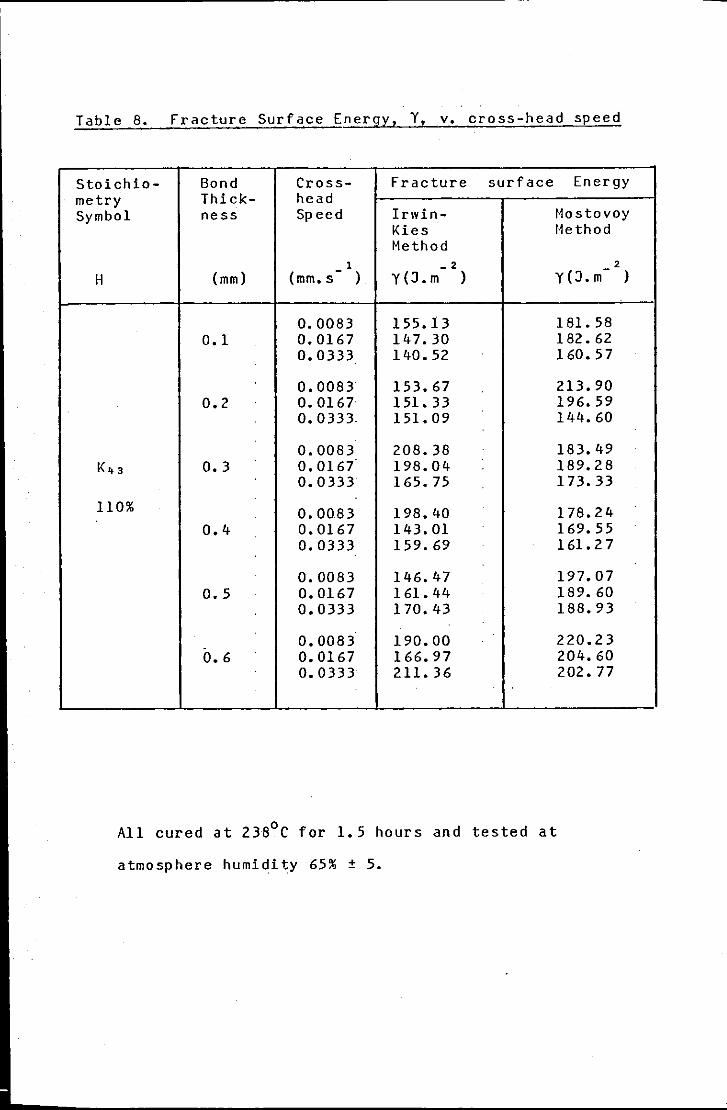
Table 8. Fracture Surface Energy, Y, v. cross-head speed
Stoichio- Bond Cross- Fracture surface Energy me try Thick- head Symbol ne ss Speed Irwin- Hostovoy
Kies Hethod Hethod
- 1 -2 - 2
H (mm) (mm.s ) y(J.m ) y(J.m )
0.0083 155.13 181. 58 0.1 o. 0167 14 7. 30 182. 62
0.0333 140. 52 160. 57
0.0083 153.67 213. 90 0.2 0.0167 151. 33 196. 59
o. 0333. 151. 09 144.60
0.0083 208.38 183.49 K43 0.3 0.0167 198.04 189.28
o. 0 333 165. 75 173.33
110% 0.0083 198. 40 178.24 0.4 0.0167 143. 01 169.55
0.0333 159.69 161.2 7
0.0083 146.47 197.07 0.5 0.0167 161. 44 189. 60
0.0333 170. 43 188.93
0.0083 190.00 220.23 0.6 0.0167 166. 97 204.60
0.0333 211.36 202.77
All cured at 238°C for 1.5 hours and tested at
atmosphere humidity 65% ± 5.

Table 9. Frac:ture Surface Energy, Y, v. cross-head speerl.
Stoichio- Bond Cross- Fracture surface Energy me try Thick- head Symbol ne ss Speed Irwin- t1ostovoy
Kies Method t1ethod
- 1 - 2 - 2
H {mm) {mm.s ) Y{J.m ) Y{J.m ) h
0.0083 156.44 182. 79 0.1 0.0167 153.35 175.32
0.0333 154.13 173. 88
0.0083 171. 81 202.89 0.2 0.0167 172. 75 180. 71
0.0333 162.2 6 191. 70
0.0083 148.07 175.12 l43 0.3 0.0167 144.38 163. 51
o. 0 333 142.2 9 170.2 8 120%
0.0083 191.97 175.80 0.4 0.0167 153.35 191. 88
0.0333 152. 40 2 01. 70
o. 0083 168.34 207. 62 o. 5 0. 0167 172. 20 189.99
0.0333 166.55 186.99
0.0083 168. 72 220.19 o. 6 0.0167 168.93 196. 59
o. 0333 167.22 190.35
All cured at 238°C for 1;5 hours and tested at
atmosphere humidity 65% ± 5.
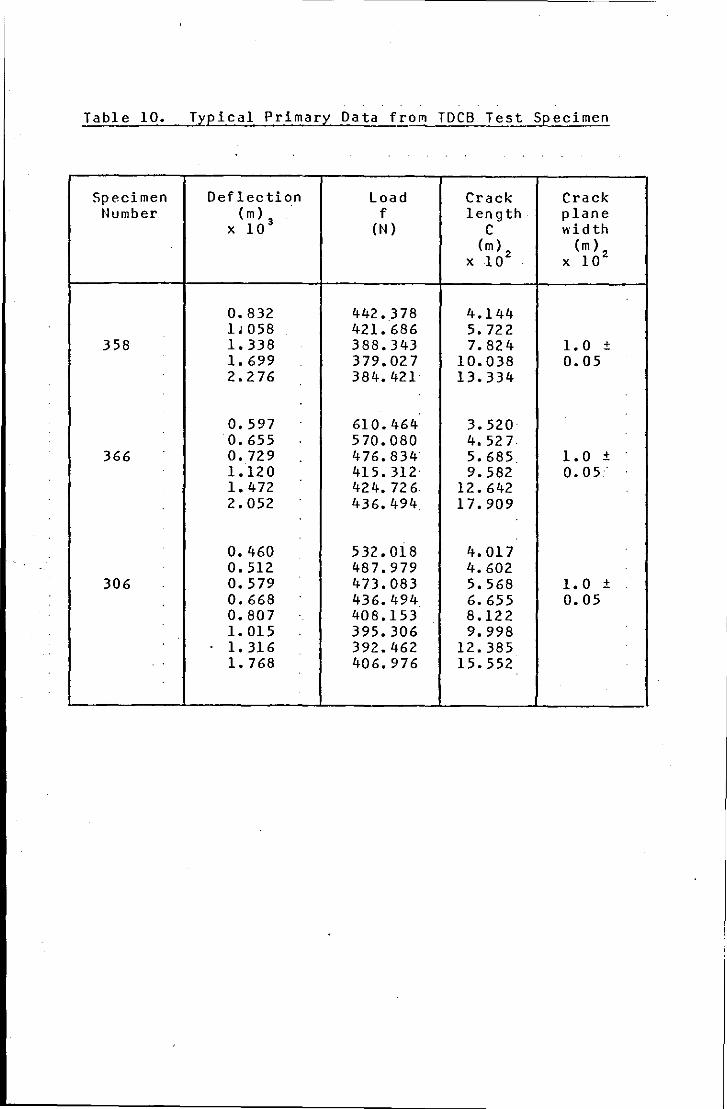
Table 10. Typical Primary Data from TDCB Test Specimen
Specimen Deflection Load Crack Crack Number (m) 3 f length plane
X 10 (N) c width (m) 2
X 10 (m) 2
X 10
0.832 442.378 4.144 1J058 421.686 5. 722
358 1. 338 388.343 7. 824 1.0 ± 1. 699 379.027 10.038 0.05 2.276 384. 421 13.334
0.597 610.464 3.520 0.655 570.080 4. 52 7
366 o. 729 476.834" 5.685. 1.0 ± 1.120 415. 312· 9.582 0.05 1. 472 424.726 12.642 2.052 436. 494_ 17.909
0.460 532.018 4.017 0.512 487.979 4.602
306 0.579 473.083 5.568 1.0 ± 0.668 436.494 6.655 0.05 0.807 408.153 8.122 1. 015 395. 306 9.998 1. 316 392. 462 12.385
.. 1. 768 406.976 15.552

Table 11. Typinal Data for evaluating Y hy !rwin-Kies equation
Specimen Compliance Crack length dR Average Crack width Fracture surface Number R c dC load w enerF y (mN- 1
) X 10 6 (m) X 10 2 ('N- 1) X 10 6 f ( N) (m) X 10 3 ( Jm- )
1. 881 4.144 2. 518. 5. 722
358 3. 444 7.089 4. 42 9 403.17 1.0 ± o. 5 179. 98 4.484 10.083 5. 921 13. 334
0.977 3.520 1.149 4. 52 7
366 1. 528 5,685 2.656 2.697 9.582 48 8. 98 1.0 ± 0.5 158.76
3.346 ·12. 642 4. 699 17.909
0.865 4.017 1. 050 4. 602 1. 22 6 5.568
306 1. 530 6.655 3.035 1. 976 8.122 441. 56 1.0 ± o. 5 147.94
2.568 9.998 3.353 12.385 4.345 15.552.

Table 12. Typir.al. Data for evaluating Y by Mostovoy's Method
Specimen Load Average Geometry Crack Bending Franture Number load constant width modulus Surface
'. . 2 w E Ener~) f(N) f(N) . m x 10 . m x 10 2 (Nm- 2
) X 10 ( :J m-
442.378 421. 886
358 388.343 403.17 90 1.0±0.05 203 144. 13 379.027 384. 421
610.464 .570.086
366 476.835 488.98 415.312 90 1.0±0.05 203 212.02
424.726 436.494
532.018 487.979 473.083
306 436.494 441. 56 90 1.0±0.05 203 172. 88 408.153
395.306 392.462 406.976

Specimen Number
358
366
306
Table 13. Typical Data for evaluating Y by Berry's Method
(See Section 4.1.2)
log f J6 log c f 6j\V c d(log f /C) d(f 6/W) (N) (m) X 10 d(log c)· d(c)
.
5. 726 J. 382 36.801 4.144 5. 601 i. 242 44. 614 5. 722 5 •. 463 i.150 51. 960 7. 082 1. 01 582.0 5.356 o. 965 63.298 10.083 5.228 0.875 87.494 13.334
6.010 i. 453 36.444 3.520 5. 940 i.344 37. 3 40 4.527 5. 816 i.245 34.761 5.685 1. 02 391. 9 5.569 i. 018 46. 515 9.582 5.460 0.898 62.520 12.642 5.328 0.747 89.568 1 7. 90 9
6.063 i.396 24. 4 73 4. 017 5.978 i. 337 24.994 4.602 5, 912 i. 254 2 7. 42 9 5.568 5.815 i.183 2 9.149 6.655 1. 23 394.4 5. 704 i.178 32. 918 8.122 5.590 i. 090 40.12 0 9.998 5. 475 !.001 51. 640 12.385 5. 362 0.808 71. 961 15.552
.
Fracture surface en~>,rgy
(Jm~~)
146. 96
' 99.93
121.13
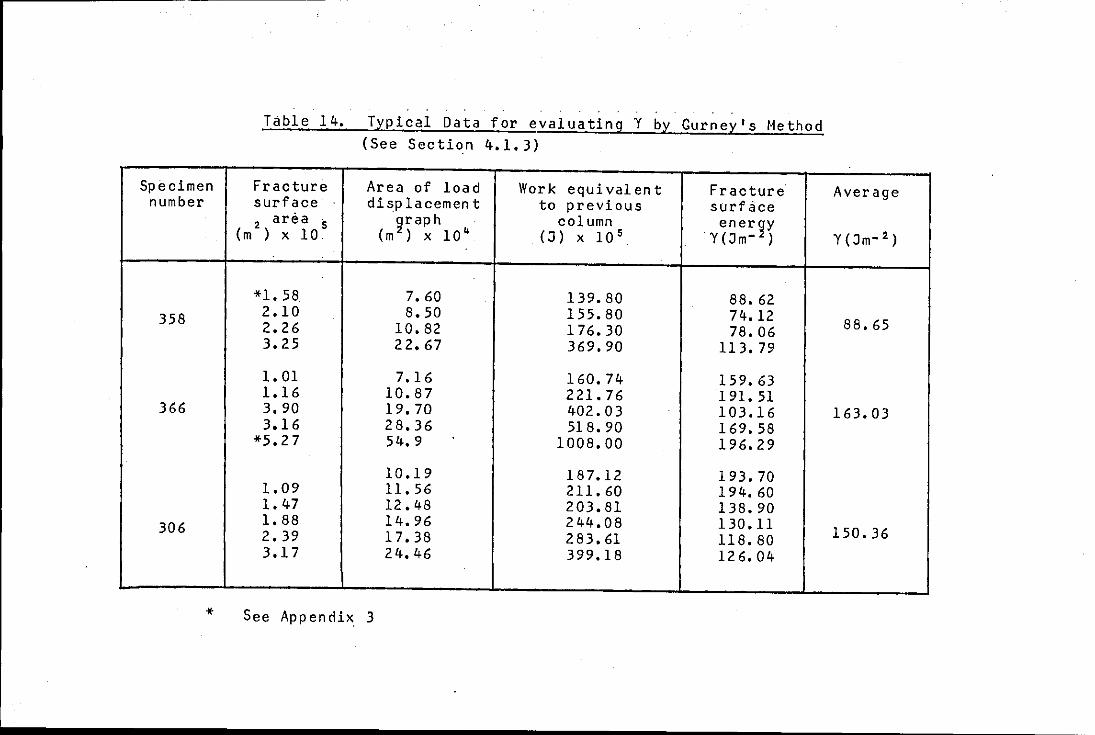
Specimen number
358
366
306
*
Table 14. Typical Data for evaluating Y by Gurney's Method (See Section 4.1.3)
Fracture Area of load Work equivalent Fracture surface displacement to previous surface
(m2) area 5 ~raph column enerF
X 10. (m ) x 10 4 (:J) X 10 5 Y(:Jm- ) .
*1. 58. 7. 60 139.80 88. 62 2.10 8.50 155.80 74.12 2.26 10. 82 176. 30 78. 06 3.25 22.67 369.90 113. 79
1. 01 7. 16 160.74 15 9. 63 1.16 10.87 221.76 191. 51 3.90 19.70 402.03 103.16 3.16 28.36 518. 90 169. 58
*5. 2 7 54. 9 1008.00 196.29
10.19 187.12 19 3. 70 1. 09 11. 56 211. 60 19 4. 60 1. 47 12.48 203.81 138.90 1. 88 14. 96 2 44.08 130.11 2.39 17.38 2 8 3. 61 118.80 3.17 24.46 399.18 12 6. 04
See A pp en dix 3
Average
Y(:Jm- 2)
88.65
163.03
150.36

Table 15.· Effect of TMA Content Stoichiometry on and the Comparison of
Ir~Kies, 11ostovoy' s and Bascom' s Analyses for Evaluation
of Fracture Surface Energy of Bond Thickness 0.2 mm.
Stoichiometric 80% 90% 100% 110% 120% Comp.ositions ·
.
IRWIN- KIES llf.9.27 156.86 2 94.2 9 151. 33 172. 75 METHOD
FRACTURE SURFACE ENERGY NOSTOVOY (:Jm-2) AND 197. 41 203.68 2 32. 49 196.59 180.71
BASCOM METHOD
All cured 1.5 hours at 238°C. -2 0.0167 mm.s cross-head speed tested at room temperature
and humidity 65% ± 5. See also Appendix 3 and Fig.

Table 16, Typical primary calibration data for the
ESPI loading J1g
Reading Load Load ( N) Strain Strain no. (top (bottom)
(kg) F E X 106
E X 10 6
1 0 0 0 0
2 l. 05 10.297. 13. 5 . 11.2 5
3 3.05 29.910 42. 75 36.00
4 6.15 60. 311. 74.25 69. 75
5 11.25 110.325 137.25 123.75
6 16. 35 160.339 204.75 182. 2 5
7 21.45 210. 353 272.25 2 3 6. 2 5
8 2 6. 55 260.366 335.25 2 90. 2 5
9 31.65 310.380 2 98.2 5 348.75
10 36. 75 360.394 456.75 407.2 5
11 41.85 410.408 537.75 452.2 5
12 46. 95 460. 401· 600. 75 515.2 5

Table 17. Typir.al correlated data for ESPI loading jig
Reading Load (N) Mean Strain no~· . F e:· X io 6
1 o.oo o.oo 2 12.36 22.50
3 36.00 78.75
4 72.36 144. 00
5 32.36 2 61. 00
6 192. 36 387 .. 00
7 252.48 508.50
8 312. 48 62 5. 50
9 372. 48 747.00
10 432.00 864.00
11 492. 48 990.00
12 552.00 1116.00 .

FIGURES

t
F
~~ ___:_h~--ill
I I I
zd I .... --:~1 ~,,?-=AI
Elliptical f I crack 1
1- 2C __..JJ I I
l ---- --.., --- -........ ~c--- '
FIG. (1) SCHEt1ATIC DIAGRAM FOR THE GRIFFJTHS' ANALYSIS
w

z
X
z
z
{a) t1ode I Opening, KI
(b) Mode 11 Sliding, KII
(c) Mode Ill Tearing, Kill
FJG.(2) THE THREE BASIC MODES OF CRACK EXTENSION USED IN LINEAR ELASTIC FRACTURE MECHANICS ANALYSIS
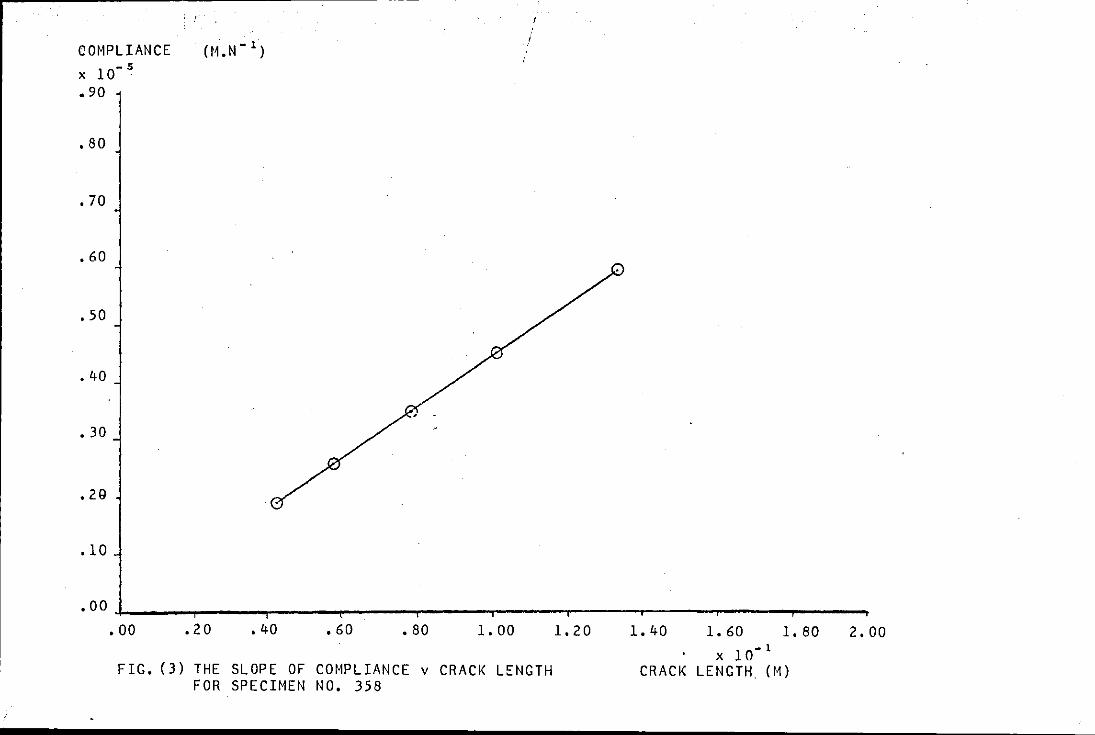
COMPLIANCE X 10- S
• 90
.80
• 70
.60
,50
• 40
• 30
.2G
.10
.oo .oo
FIG. (3)
.20 • 40
THE SLOPE OF FOR SPECIMEN
,60 • 80 1. 00 1. 20 1. 40 1. 60 1. 80 2. 00 X 10- l
COMPLIANCE v CRACK LENGTH CRACK LENGTH (M) NO, 358

•
COMPLIANCE x 1o- s
• 90
• 8 0
• 70
• 60
• 50
• 40
• 30
.20
.10
.oo .20 • 40 • 60 • 80 l. 00
FIG.(4) THE SLOPE OF COI1PLIANCE v CRACI< LENGTH FOR SPECIMEN NO. 366
1. 20 1. 40 1. 60 1. 80 1
x 1 a-CRACK LENGTH (M)
2.00
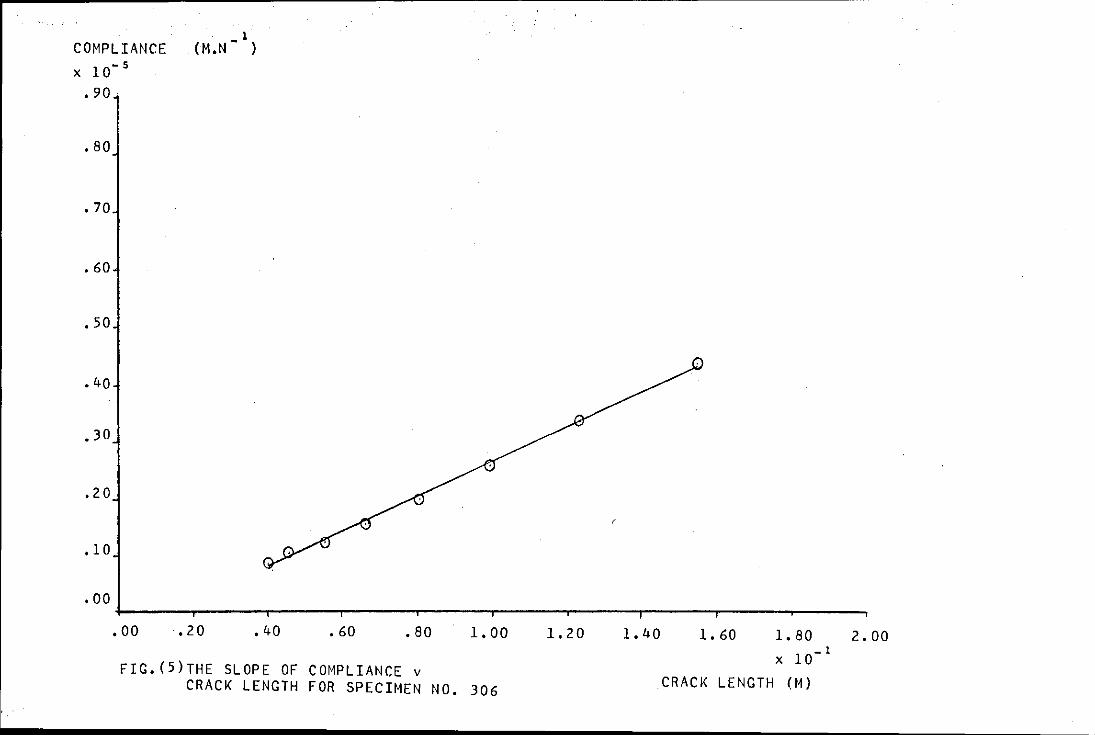
1 COMPLIANCE (M.N- )
X 10- 5
• 90 .
• 80
• 70
• 60
.50
• 40
,30
.20
. 1 0
.ooL---~--~--~----~--~--~--~~--~~~=-~ 1.20 1.40 1.60 1.80 2.00 .oo .20 1. 00 • 40 • 60 .80
FIG.(S)THE SLOPE OF COMPLIANCE v CRACK LENGTH FOR SPECIMEN NO. 306
- 1 X 10
CRACK LENGTH (M)
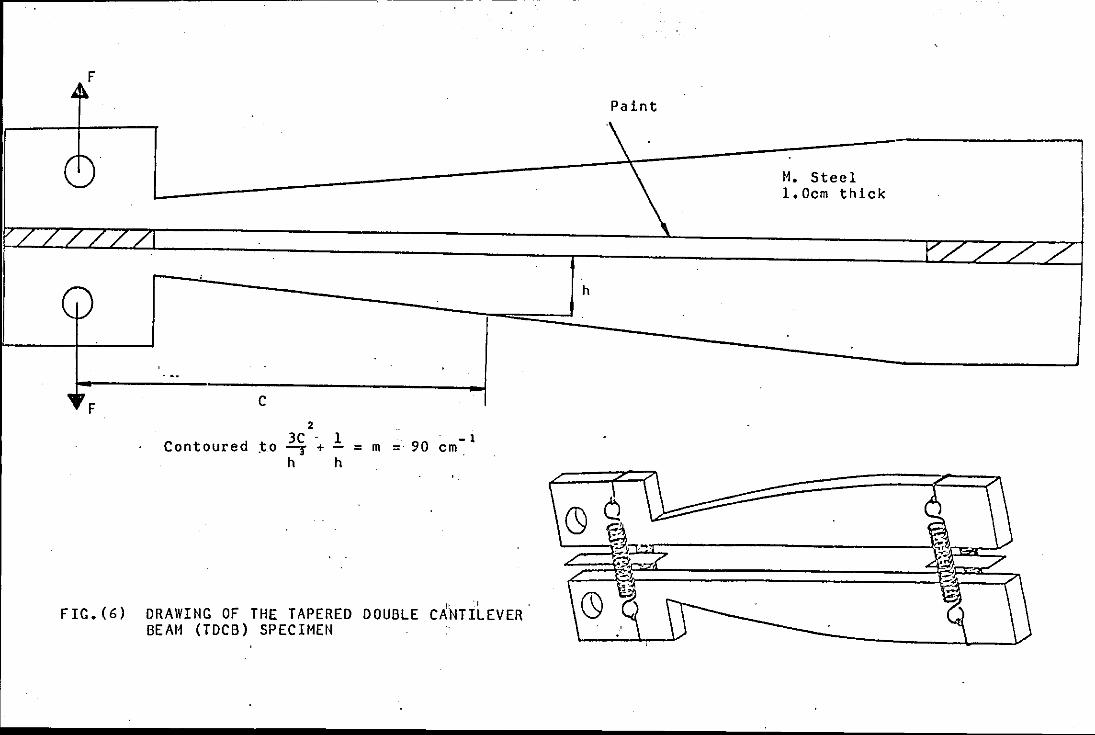
'
F
" ~ Paint
\
\ M. Steel 1. Ocm thick
////// r/// /
' h I
- .. ~VF c
2
Contoured 3C - 1 90 - I _to - 3 +- = m - cm
h h
6 % ~ \C) i
~ ~~- ! ' ~-_.il;,-., . .,-{' L / I
-...... -le) FIG. (6)
1• 'I ~ t) \) DRAWING OF THE TAPERED DOUBLE CANTILEVER BEAt1 (TDCB) SPECIMEN I l

Stress Intensity Factor
KIC (fracture toughness)
,
Plane
< Stress
I I I
' I ' I
1 I I I I I
I I I I I I Mixed I
)t < >--:;..Plane I Mode I Strain I I I I I I I I I I
---------- L __ --------------- -~-.... '----I I I I I
Specimen thickness (W)
FIG. (1) THE EFFECT OF SPECIMEN THICKNESS UPON THE CRITICAL STRESS INTENSITY FACTOR

V
f 0
\ y
'· \ 0 -1Di--y
I J
)Le_ ! / -
~ ' /
/
/
Crack p
~ ~Plastic . deformation
zone
c r r 0 c c
c
FIGl8) FORMAL CYLINDRICAL REPRESENTATION OF THE PLASTIC ZONE AT THE CRACK TIP FOR SMALL-SCALE YIELDING
'xy
ox
X

..4 ~
~ lr
FIG. (9)
~ .. ~ ~ .. ~ ..4 ~
y
l I I
o I o
~-~--X --lilc~/
I
z' 2C
~ .. ~ lr "l • , •
GEOMETRY OF OUGDALE PLASTIC ZONE MODEL

H0-[--'--11 0
TRIMELLITIC ANHYDRIDE
EPOXY RESIN
FIG. (10) CHEMICAL STRUCTURES OF EPOXY RESIN AND TRIMELLITIC ANHYDRIDE CURING AGENT
n
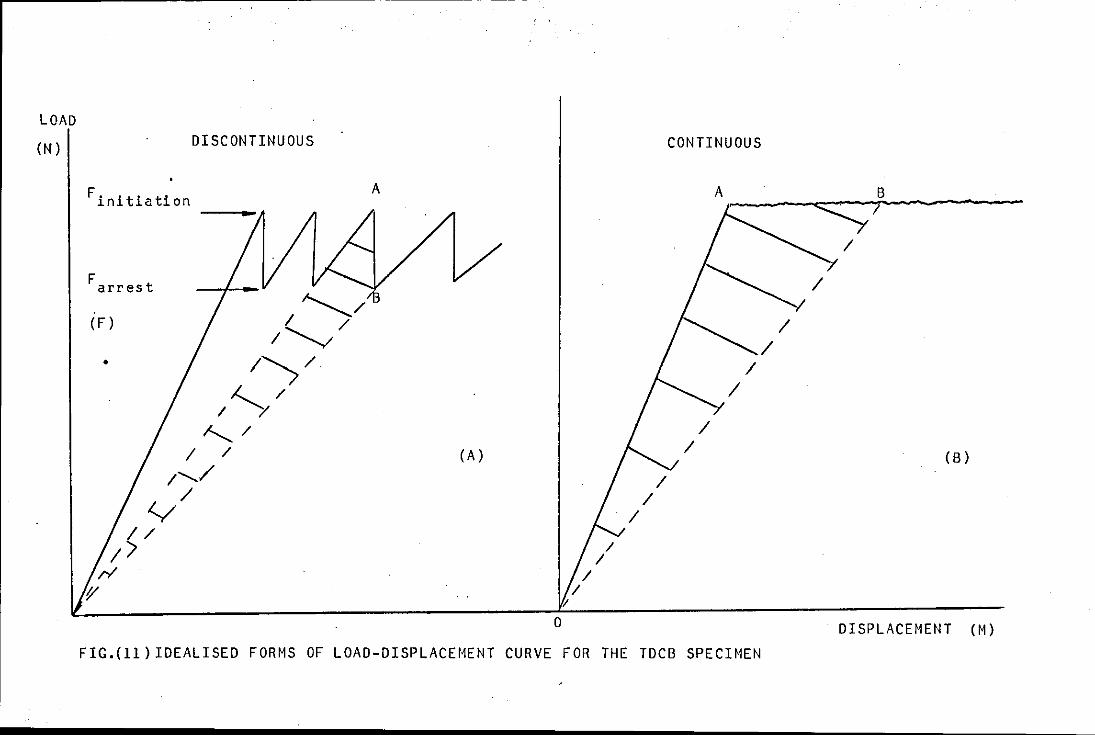
LOAD
(N)
Finitiation
F arrest
(F)
•
DISCONTINUOUS
A _ __,_
(A)
V
0
CONTINUOUS
/
I /
/
FIG.(ll)IDEALISED FORMS OF LOAD-DISPLACEMENT CURVE FOR THE TDCB SPECIMEN
I
(B)
DISPLACEMENT (M)

Incoming 0bject illumination he am
-..;;;-.---=4-( I
Ro<oey / I \ohole attenuator Expanding ·
lens
Rotary Expanding
Incoming reference beam
• I
-.---Illumination and viewing objective
~Semi silvered mirror
Centre line of optics
tube
FIG.~ ·(·12) OPTICAL ARRANGEMENT TO LOOK AT SMALL SURFACES USING F.S.P. I.
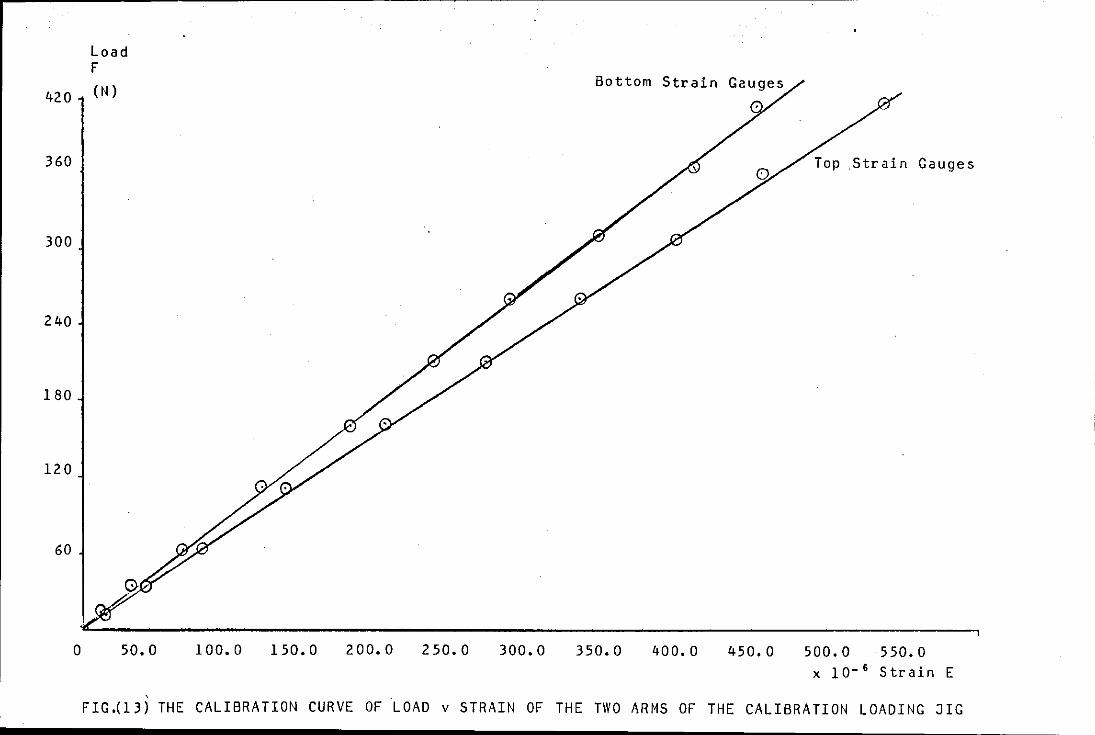
420
360
300
240
180
120
60
0
Load F
(N)
50.0 100.0 150.0 200.0 250.0
Bottom Strain
300.0 350.0 400.0
Top .Strain Gauges
450.0 500.0 550.0 x 10- 6 Strain E
FIG.(13) THE CALIBRATION CURVE OF LOAD v STRAIN OF THE TWO ARMS OF THE CALIBRATION LOADING JIG

420
360
300
240
180
120
60
LOAD F
( N)
lOO 200 300 400 500 600 700 800
FIG.(l4)THE COMBINED CALIBRATION OF LOAD v STRAIN OF THE TWO ARMS OF THE LOADING JIG.
900 1000 1100 1200
x 10-s Strain E

490
420
350
280
210
140
70
0
Applied Load F
(N)
lOO 200 300 400 500 600 700 800
FIG. (15)THE CORRECTION CURVE OF THE APPLIED LOAD v YIELD STRAIN OF THE TWO ARMS OF THE LOADING 3IG
900 1000 1100 6
x 10 Yield Strain E

----------------------------
12.5k
+
R3
(A)
y y
B G
G
B
FIGJl6) WHEATSTONE BRIDGE CIRCUIT OF THE LOADING JIG STRAIN GAUGES
s
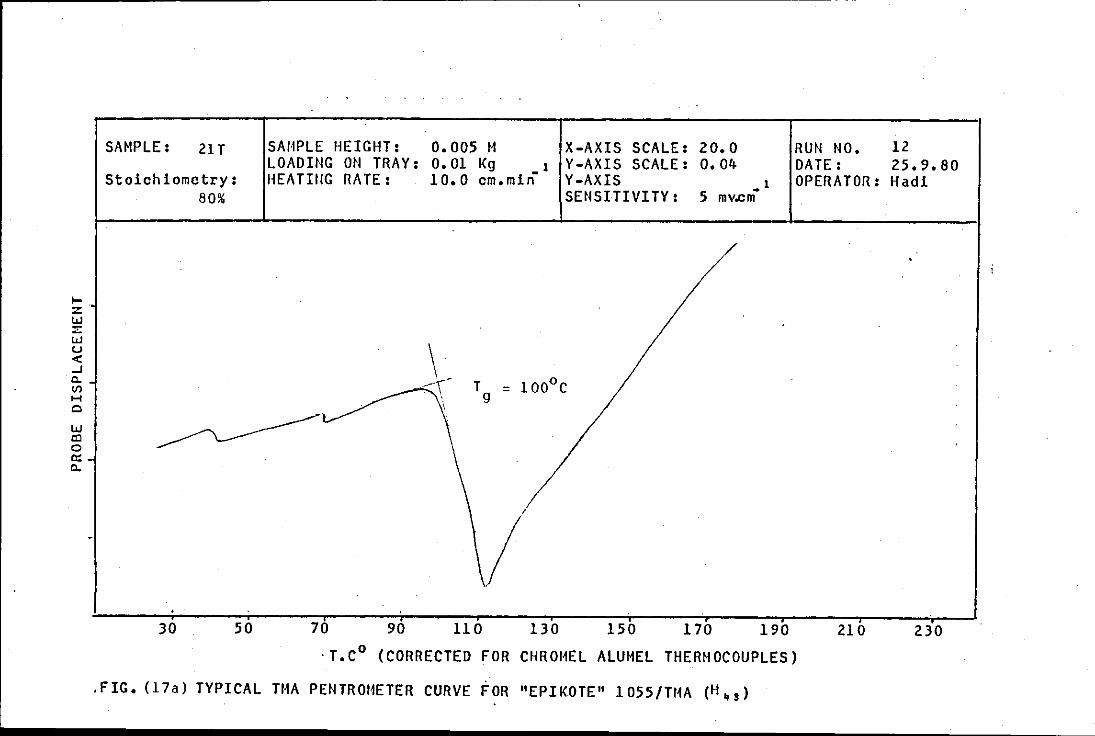
~. z w
w u < ..J a. Vl H 0
w cc 0 c:: a.
SAMPLE: 21 T
Stoichiometry: 80%
30 50
SM1PLE HEIGHT: LOADING ON TRAY: HEATIUG I"!ATE:
70 90
0,005 M O, 01 Kg 1 10.0 cm.min-
\ \ -
<\
110 130
X-AXIS SCALE: 20,0 V-AXIS SCALE: 0.04 V-AXIS 1 SENSITIVITY: 5 mv.cm-
150 170 190
RUN NO. DATE: OPERATOI"!:
210
·T.C0
(CORRECTED FOR CHROMEL ALUMEL THERMOCOUPLES)
.FIG, (17a) TYPICAL TMA PENTR0t1ETER CURVE FOR "EPIKOTE" 1055/TMA (H- 3 )
12 25.9.80 Hadi
230

... z LJ.J ::;: LJ.J u < ..J c.. en ..... 0
LJ.J c:l 0 a:: c..
SAMPLE: 22T
Stoichiometry:
90%
30 50
' '
SAI1PLE HEIGHT: 0.005 M LOADING ON TRAY: HEATING RATE:
0.01 Kg 1 10.0 cm.min-
X-AXIS SCALE: 20,·0 V-AXIS SCALE: 0.04 V-AXIS 1 SENSITIVITY: . 5 mv.cm-
70 90 llO : 130 150 170 190
RUN NO. DATE: OPERATOR:
210
T, C0
(CORRECTED FOR':'CHROI~EL ALUMEL THERMOCOUPLES)
.FIG,(17b) TYPICAL TMA PENTROHETER CURVE FOR "EPIKOTE" 1055/TI1A (I ~ 3 )
14 25.9.80 Had!
230

IJ.J (.)
< ...J c. V) H 0
IJ.J CO 0 a:: c.
SAMPLE: 23T
Stoichiometry: lOO%
30 50
SAt1PLE HEIGHT: LOADING ON TRAY: HEATING RATE:
.. , ..
70 90
0.005 M 0.01 Kg 1 10.0 cm.min-
110 130
X-AXIS SCALE: 20.0 Y-AXIS SCALE:. 0.04: Y-AXIS 1 SENSITIVITY: . 5 mv.cm-
po 170 190 ·T,C 0 (CORRECTED FOR CHROMEL ALUMEL THERMOCOUPLES)
.FIG,(l7c) TYPICAL THA PENTROMETER CURVE FOR "EPIKOTE'' 1055/THA (J~ 3 )
RUN NO. DATE: OPERATOR:
210
15 25.9.80 Hadi
230

1-:z: w ::::: w u ...; ..J 0.. V) H Q
w CJ 0 er: 0..
SAMPLE: • 24T
Stoichiometry:
110%
30 50
i
SAI1PLE HEIGHT: 0,005 M LOADING ON TRAY: HEATING RATE:
0,01 Kg 1 10.0 cm,min-
X-AXIS SCALE: 20,0 · Y-AXIS SCALE: ·o.04·, Y-AXIS _1 SENSITIVITY: 5 mv.cm
70 90 uo 130 l50 . ·. 170 190
·T,C0
(CORRECTED FOR CHROMEL ALUMEL THERMOCOUPLES)
.FIG, (17d) TYPICAL TI1A PENTROMETER CURVE FOR "EPIKOTE" 1055/TI1A (K_,)
RUN NO, DATE: OPERATOR:
210
19 25.9,80 Had!
230
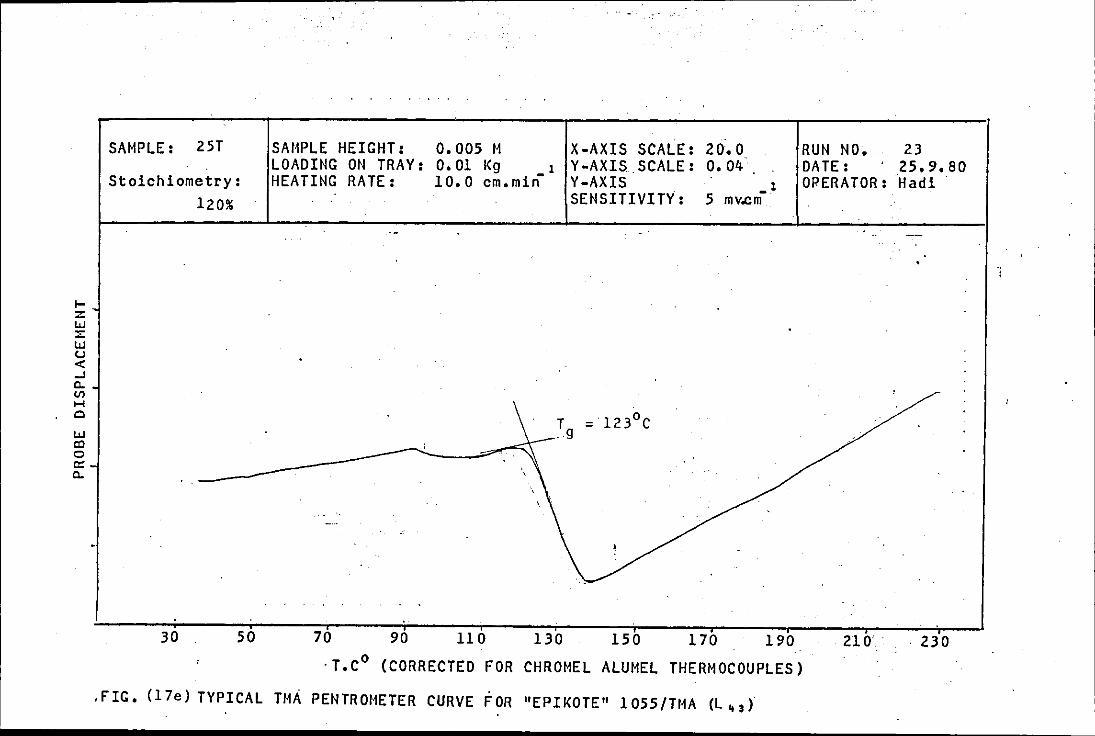
1-:z: IJ.J ::::: IJ.J (.)
< ...J c. 1./)
H 0
IJ.J c:l 0 c:: c.
SAMPLE: 25T
Stoichiometry:
120%
30 50
SAI1PLE HEIGHT: 0,005 M LOADING ON TRAY: HEATING RATE:
0. 01 Kg 1 10.0 cm.min-
X-AXIS SCALE: 20.0 Y-AXIS.SCALE: 0.04 Y-AXIS 1 SENSITIVITY: 5 mv.cm-
70 90 110 130 150 170 190
·T,C0
(CORRECTED FOR CHROMEL ALUMEL THERMOCOUPLES)
.FIG, (17e) TYPICAL THA PENTR011ETER CURVE FOR "EPIKOTE" 1055/TI1A (L ~ 3 )
RUN NO, 23 DATE: 25,9,80 OPERATOR: Hadi
210'. . 230

Height (cm)
60
50
40
30
20
1. os 1. 07 1.09 1.11 1.13 1.15 1.17 1.19
Density (g.cm- 3)
FIG.(iS)DENSITY COLUMN GRAPH USED TO MEASURE THE EPOXY RESINS DENSITY
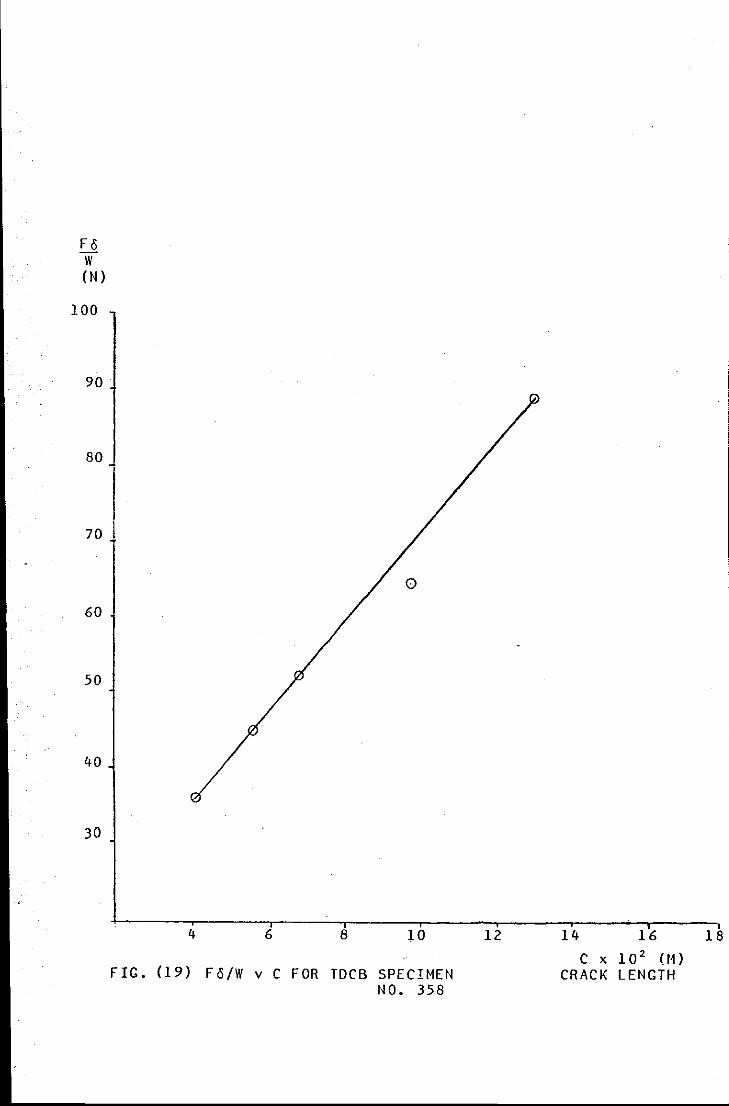
Fo w (N)
100
90
80
10 I
60
50
40
30
4 6 8 10
FIG. (19) Fo/W v C FOR TDCB SPECIMEN NO. 358
12 14 16 18
C X 10 2 (t1) CRACK LENGTH

LOG F 6
5.9
5.8
5.7
5. 6
5.5
5.4
5.3
5.2
0
1.5 I.4 I.3 I.2 I.l I.o 5. 9
FIG,(20) LOG F v LOG C FOR TDCB SPECIHEN NO. 358 6
5. 8
LOG C

Fo w (N)
100
90
80
70
60
50
40
30
G
4 6 8 Hi 12
FIG.(21) FO/W v C FOR TDCB SPECII1EN NO. 366
14 16
C X 10 2 (M) CRACK LENGTH
0
18

LOG F 6
6.1
6.0
5.9
5.8
5.7
5. 6
5.5
5. 4
5.3
5.2
1.5
0
1.4 1.3 1.2 1.1 1.0 0.9
F!G.(22) LOG F/6 v LOG C FOR TDCB SPECIMEN NO. 366
0.8
LOG C
0.7

Fo w (N)
100
90
80
70
60 .
so
40
30 0
4
0
0
0
6 8 10 12
FIG. (23) Fo/W v C FOR TDCB SPECIMEN NO. 306
14
0
16
C X 102
(11) CRACK LENGTH
18

LOG F 6
6.1
6.0 0 0
5. 9 0
5. 8
5. 7
5. 6
5.5
5. 4
5.3
~.2
1.5 1.4 1.3 1.2 1.1 1.0 0. 9 o. 8 LOG C
FIG.(24) LOG F'/6 v LOG C FOR TDCB SPECIMEN NO. 306

Transition Temperatur
Tg (°C)
110
100
90
80
70
1.0 1.5
Curing Time (Hour)
FIG. (25) THER110-11ECHANICAL TRANSITIONS v. CURING TIME

FRACTURE SURFACE ENERGY
(Y) -2 J.m
200
150
100
50
0 0
0
0.5 1.0 1.5 2.0 2. 5 3.0 3.5 4. (
FIG. (26) CURING TIME (HOUR~·
THE FRACTURE SURFACE ENERGY v CURING TIME AT BOND THICKNESS 300 UQ OF 90% STOICHIOMETRIC (loa) AT CROSS-HEAD SPEED 1 mm.min- 1
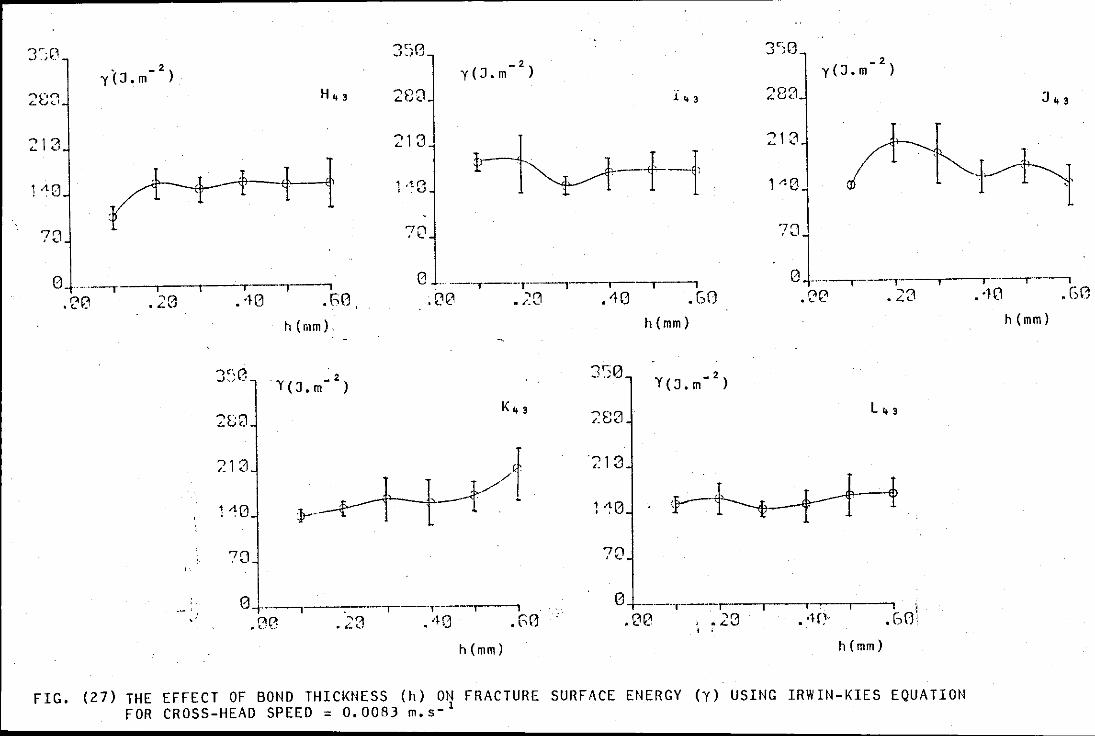
213
""' • L(J
'
-·~ ' ' ..
l 4 3
213
0 -"- --·-·-.. ---,------,---.-• ·lO .00 .;o .10 .GO
h (mm). h(mm)
"""0 .. ~ .) Y(:J.m-
2)
280 K43
~83
~13 vi '213
1~0 r-·
7Q 70
283
213
-2 y(:J.m )
1 ~~l ''"l 0 -------r·--,----.----r·-----,----, .0e .23 .40 .GO
h(mm)
l43
0 +·-----,--,-----,----,- 0 +------,-----,---,------,...,-~----, ) .0e .• 20 .·w .c,rJi .80 .23 .•10 .GO . '
h(mm) h(mm)
FIG. (27) THE EFFECT OF BOND THICKNESS (h) ON FRACTURE SURFACE ENERGY (y) USING IRWIN-KIES EQUATION FOR CROSS-HEAD SPEED = 0.0083 m.s- 1

3'50
''8:1] '· u
"'0 I I -1
I
. Y -2
(J.m ) 350
280
213
110
70
0 ~·------,---...----.-----,,---.,----, • 00 . 20 • 'lG • 60
01 ·····-r--···r--.--.--.---, 0 ,····--·--r·---,---1---,-----,----, • P.l(l • 20 . 10 .60 . .00 .20 .40
h(mm)
3'30 350 _2
280 y(J.m )
_2 y(J.m )
210 210
70 70
0 f------r--.-----.- r-----.,---, ! .00 .20 .·10 .GG
0 ' ·-----.--.----.~-.--y---, . 00 . 20 . 40 . GO
hlmm) h(mm)
FIG. (28) THE EFFECT OF BOND THICKNESS (h) ON FRACTURE SURFACE ENERGY (Y) USING IRWIN-KIES EQUATION FOR CROSS-HEAD SPEED = 0.0167 m.s- 1
h(mm)
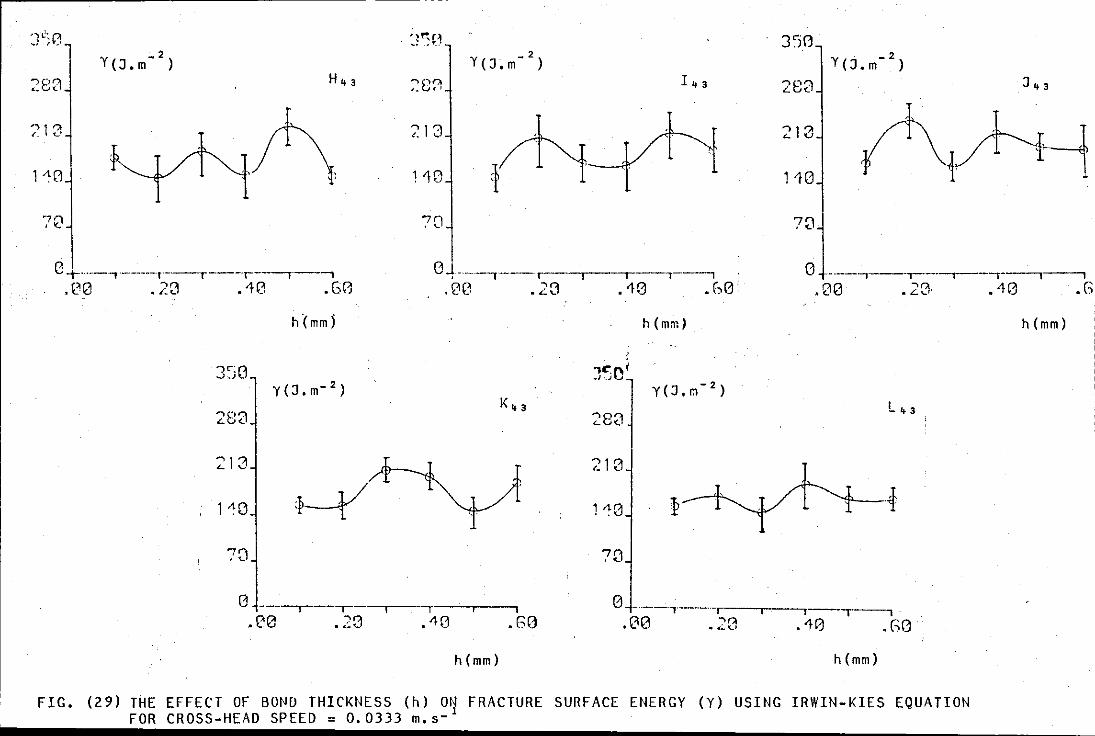
'1 ,, C'l ._, I ·' :~~ '-~ J'"jr:J
Y(J.m-2
) y -2 (J~m )
288 H43 ~8~ I 4 3 283
713 A 218
1~ 1A() 1'10
213
110
"7 C1 ' <- 7D
0-t-····--,-------r--r---r----.,---, 0 . -·--··--·--r--.....,-....... --,--·--, 0 ------..,---,----,---·-r------.---, .e0 .20 .40 .Ge .m~ .20 .10 .r~0: .00 .2B .40 .G
h(mm) h(mm)
283 K 4 3
213 213
1-:0
70
0 --.--·· ----,,----..,.-----.---, . 00 .20 .40 .GO
0 ----.,.------r·--.---, .,----, . .00 .20 .48 .GO
h(mm) h(mm)

'7~;
2 y(J.m- )
·--, .-~ r ~)
h(mrn)
2 y(J.m )
")0, . _~,...,
h(nm) n +--.---.--.--.- ·-,----,
. -18 .h8
I 4 3
h ~'!'i!!.L, • -~li; • r~1c
21:3
0
2 y(J.m- )
( - 2 Y,J.m )
280
213
70
n h(m,n) "' ---,---,---,--__:.:r.:::=-<-r---. .00 .20 .10 .50
h(mm)
• ·10 • [)()
FIG. (30) THE EFFECT OF BOND THICKNESS (h) ON FRACTUR~ SURFACE ENERGY (y) USING MOSTOVOY 1S EQUATION FOR CROSS-HEAD SPEEfl = 0.0083 m.s-

''7 •''\ ' ,, .
2 y(J.m- )
; '' ~ I • 1(... ~ ~ .2~
::13
?0.
h(mm)
'r-• Ql ~
2 y(J.m- )
21 G.
i4G
?C
_2 y(J.m )
h(mm) 0+---.--.---.--.-~--~ ' . .,_ D~ ;·n, ' .u1 .. ~ .'HJ .!18
213
''!,.., ' '-' .
G----~-.---.---.---.~h~(_m~m~)~ .CO , .l2 ' .'ID .GC
J " r< ... ...) ,; -
2fs3_
r+--vt+l 212
1 ,, <A ' . l.,.'j-
7G.
(3 +----.---.-----,,---.--,-h..:.( .,..m r:.....l :..> _
.l:C .. ~·~o .•HJ .50
FIG. (31) THE EFFECT OF BOND THICKNESS (h) ON FRACTUR~ SURFACE ENERGY (y) USING MOSTOVOY'S ;.~ crm "'"'c:c:-HFAO SPEEI1 0.0167 m.s-

') 1 c~ ./. v-
1 ·HJ
2 y(J.m- )
"} c ·~ _,,;U_
28J
713
78
_2 y(J.m ) I 4 a
-," r~ .,.j ·-·' • .i-
'21 3.
1 ·! o_
2 y(J.m- )
(J -t--,---.---.--.--h (mm) . (!(1 • 2:J . . ~)0
_2 y(J.m ) " 1\ '+ 3
~13
1 ·1 0-
h(mm) e +---.---.---,.,.---,---,-----,
• ·f(j . ()0
1 .! 0.
2 y(J.m- )
U +----.----r--...,.---,---hr(_m-'m-'--.) .t?l) ' .2.2 .··)0 . .CO
FIG, (32) THE EFFECT OF IJOtiD THICKNESS (h) ON FRACTUflE SURFACE ENERGY (y) USING MOSTOVOY'S EQUATION FOR CROSS-HEAD SPEED = 0.033 m.s- 1
• ()I]

FRACTURE SURFACE ENERGY
y 300
-2) (J.m
200
lOO
0.01 0. 02 0.03 0.04 CROSS-HEAD SPEED (mm sec- 1
)
FIG. (33) EFFECT OF STRAIN RATE ON FRACTURE SURFACE ENERGY FOR H•s OF BOND THICKNESS =lOO um.

Transition Temperature
T9
(°C)
130
120
110
100
90
80
0
90
0
lOO 110 120
Stoichiometric Composition of the resin
FJG.(34) THERMO-MECHANICAL TRANSITIONS v STOICHIOMETRY
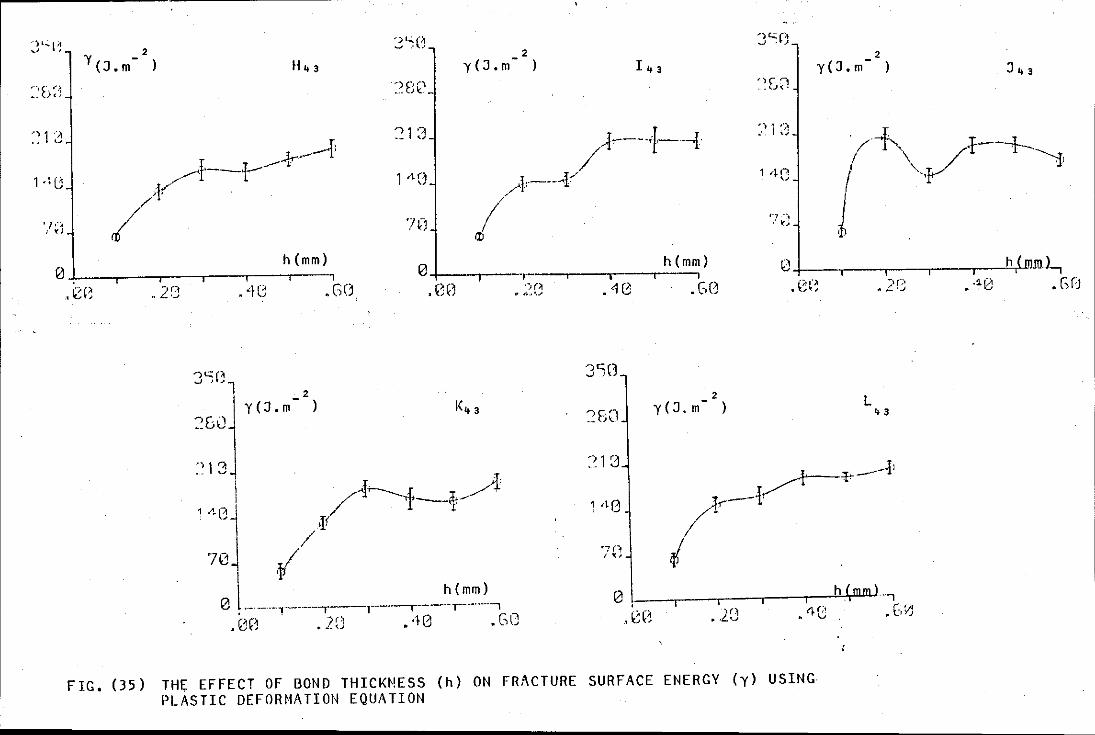
. , .. :. I ~;
2 y(J.m- )
70
2 y(J.m- )
n h(mm) ~+---~---· ·---r---r---r~~
h(mm) 0+---~---.---.---.---.---,
,12(~ . 2:.3 .48 .GO, .. 2(~ .4G .GO
2
y(J.m )
') 1 ')I ··- ....... ., I A,__----.t ;r, -~
1 -'·Gj / 'I--.t~ ¥
/ 70 1 l h(mm)
0 , ··-··-·--r····-··-··---,------.-----···y-----·-, (>(~ 2'~ ,,(~ ')("
s '(j 1:" ~ ~ • (J " \,:.; • \..~ J
J'lO 2
y(J.m- )
718
I
.28
') > ') .• \..J(•
'} ~j
_2 y(J.m )
. /~\ ~:r-----t-----........... " 'l' ., .
'.
0+---.---~--~---.--~h ~mJ, .. 2C .·~0 .Gr1
L ~ 3
1 h(mmL.,
.-1c .c~
FIG. (35) THt;: EFFECT OF BOND THICKNESS (h) ON FR;\CTURE SURFACE ENERGY (y) USING PLASTIC DEFORMATION EQUATION

(a)
stress
------------ -------------------crack tip craze tip
I I c - 11C c
Crack length
(b)
stress
-------~-----------------------
/crack tip ;craze tip
C - !1C C Crack Length
FIG.(36) DISTRIBUTION OF SURFACE STRESS ALONG A CRACK AND CRAZE (a) Dugdale Model (b) Modified Dugdale Model
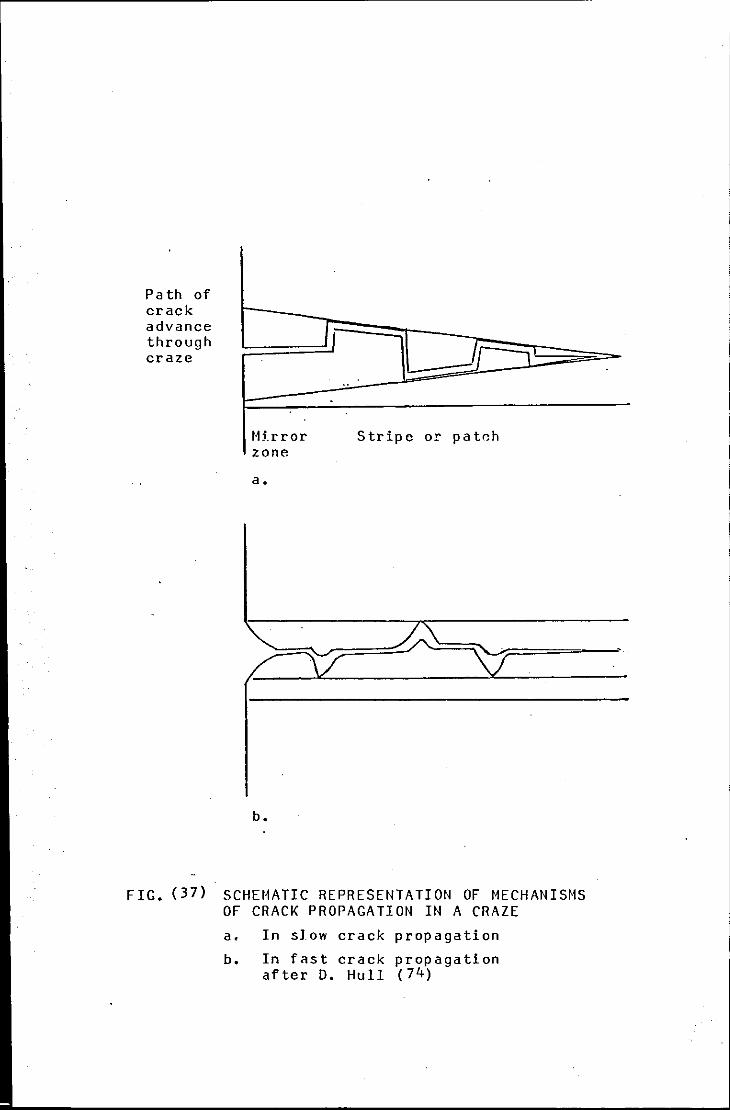
Path of crack advance through craze
Mlrror zone
a.
b.
)j l
Stripe or patr:h
FIG. (37) SCHEI~ATIC REPRESENTATION OF MECHANISMS OF CRACK PROPAGATION IN A CRAZE
a. In slow crack propagation
b. In fast crack propagation after D. Hull (74)

y
r
0 X
Tip of crack
FIG. (38) STRESS STATE IN THE VICINITY OF A CRACK TIP IN 3-- COORDINATES.
X
z

I 1
I I '
I z r __ , .
···r·· '! \
'l
l I l
\ j
' \ \ l
~ \ ~
\\ \ ;_ ~ :t
% \i 1 I
1
' ·,
\ 1
' 1
1
\ \ \
\ \ ) ~,
\
\
~----... i : ~ j··
i . \. ;.
~ h \ 1' !:
t l' ' ,., __ ,'
\· 1
d L I\ I,
t \' \ 1 '. I I'
\ I I \
\ I
\ \ I I
FIG. (39) JIG APPARATUS USED TO HOLD THE TDCB SPECH1ENS RIGID AND TO ACT AS A MODE I LOADING DEVICE

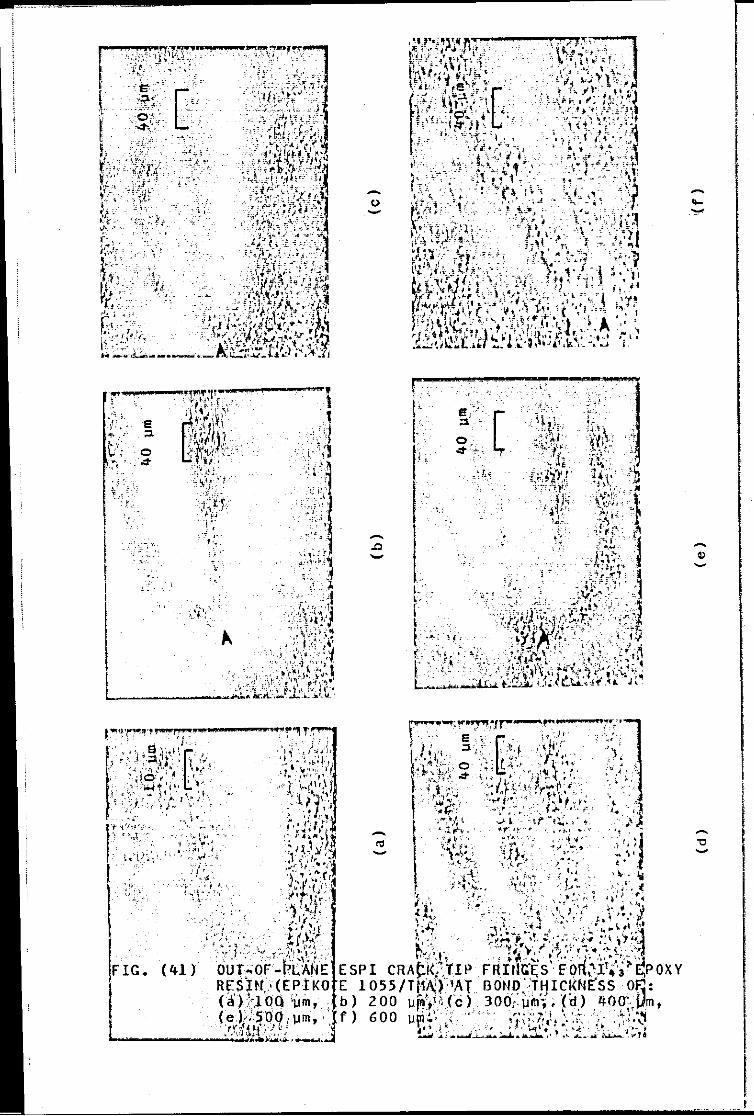
.{.',.
"' ·'' t·, .. . . , ~
. ~.
e ;:1
0 <I"
FIG.
0 -
(41)
r
r !' e>~
( I ::1
0,
i ~ <I" '·.
' .

rr J;'·t <t-·
--~ ' ' ' 'i'
.. ;:
:) -·
,,-!!; .
• ! .. •• 0
·;i -· .: ) 7
1.-.----(""-"i:_~l ~ .... ~
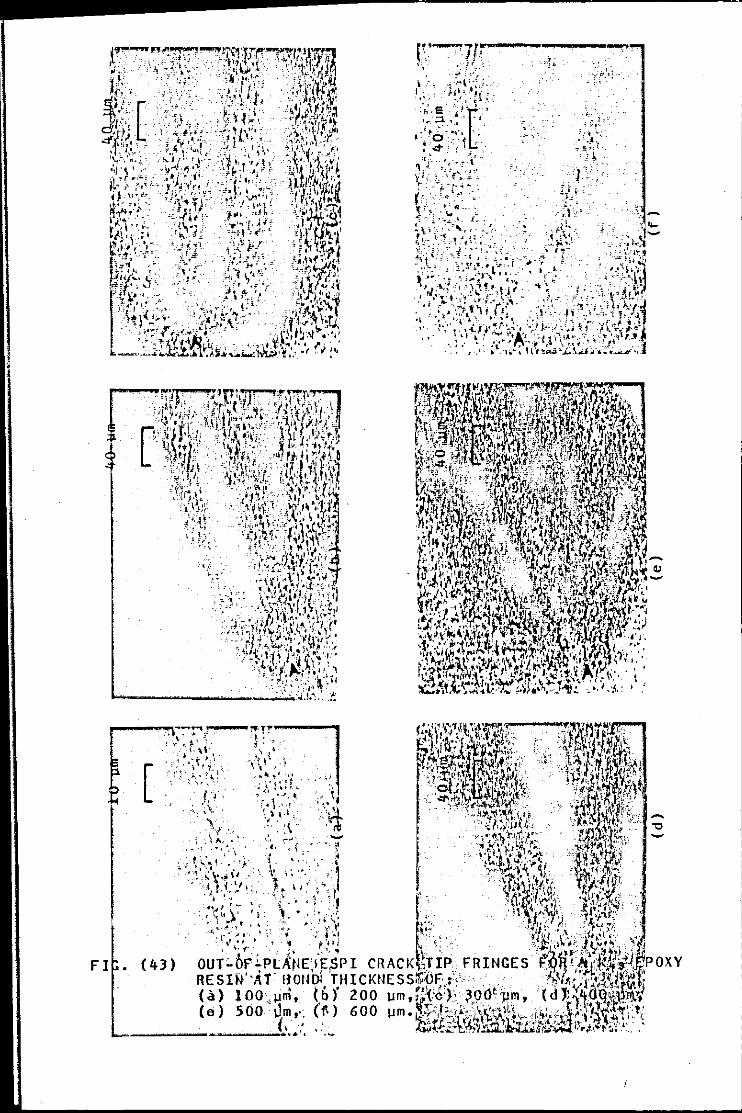
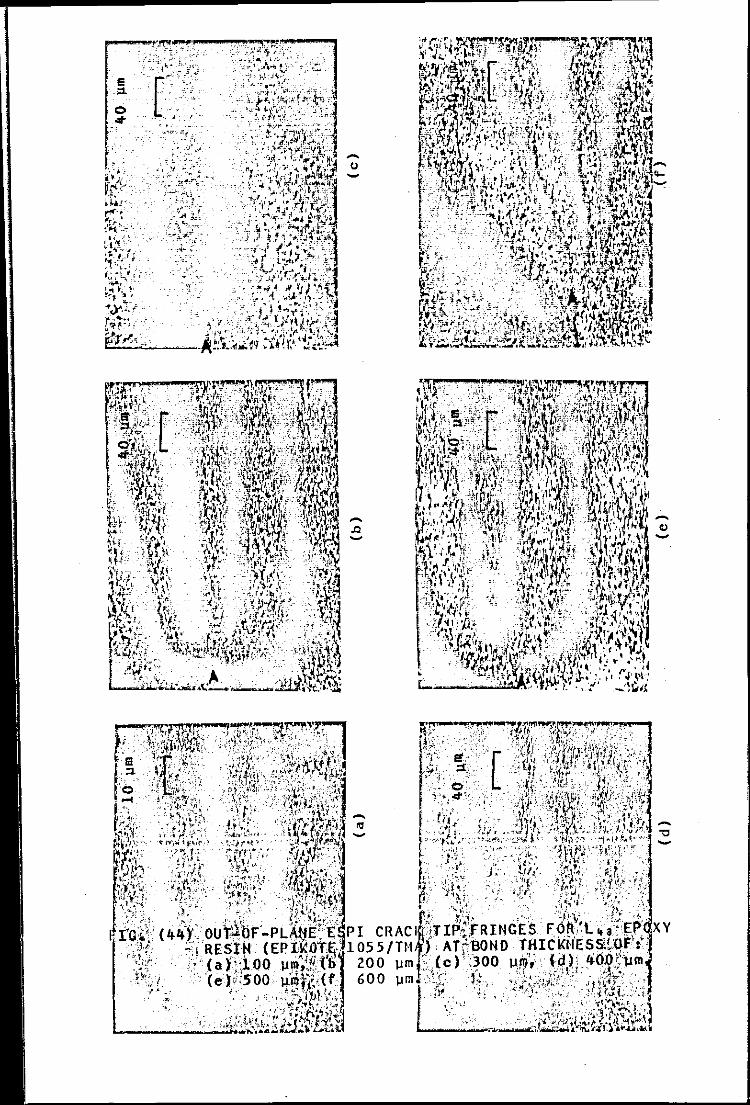

-
--. ...,........ -
._,,._ .. ~~ ....... -. - __,-: .
FIG. (45) A TDC£l SPECII1Eil IN THE INSTRON
~ I
l j I l
I I
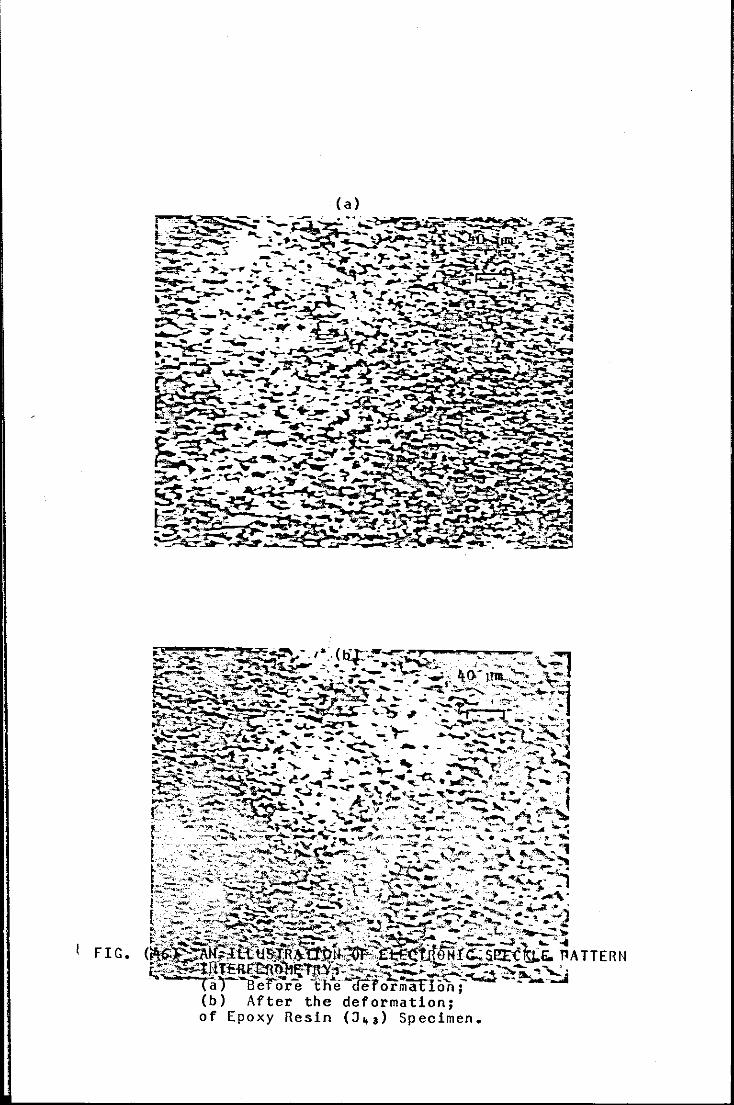
(a)
FIG.

--!
/,/ .,-
<lf .' . '.f
- _ .. ,. -._.·. l
! )_
f . / ' i . ., -
j
'
t .. \
:,\ \ l
\
---------------- ,\,_ _ _.
·~·· .. ra\[-ci,e3c~ .. ;~("1{1,:) .. · .. ·.1-~ .-.fa · ... ~~. 1·1·-·~ i
. . f - ----- ~~ . ..__..£._,~ r' -- - ·j
\.> . I - r~~lj
. ~ ~
\ !
f'\ l I ' ' 1 l l , I '
. ' ·. ~ . %.
1 I i I l f
. ' d
1..-1=-.J.l,; _ •. (42)-IHLERE-CAI IBB.AI.£0 STRAIN GAUG.f:S AITACtlEJLJ TWO MAIN ARMS OF THE LOADING JIG.
. '
I I
. \ I \
• i j l - ..... ..,
l
. \
I !
I I
J
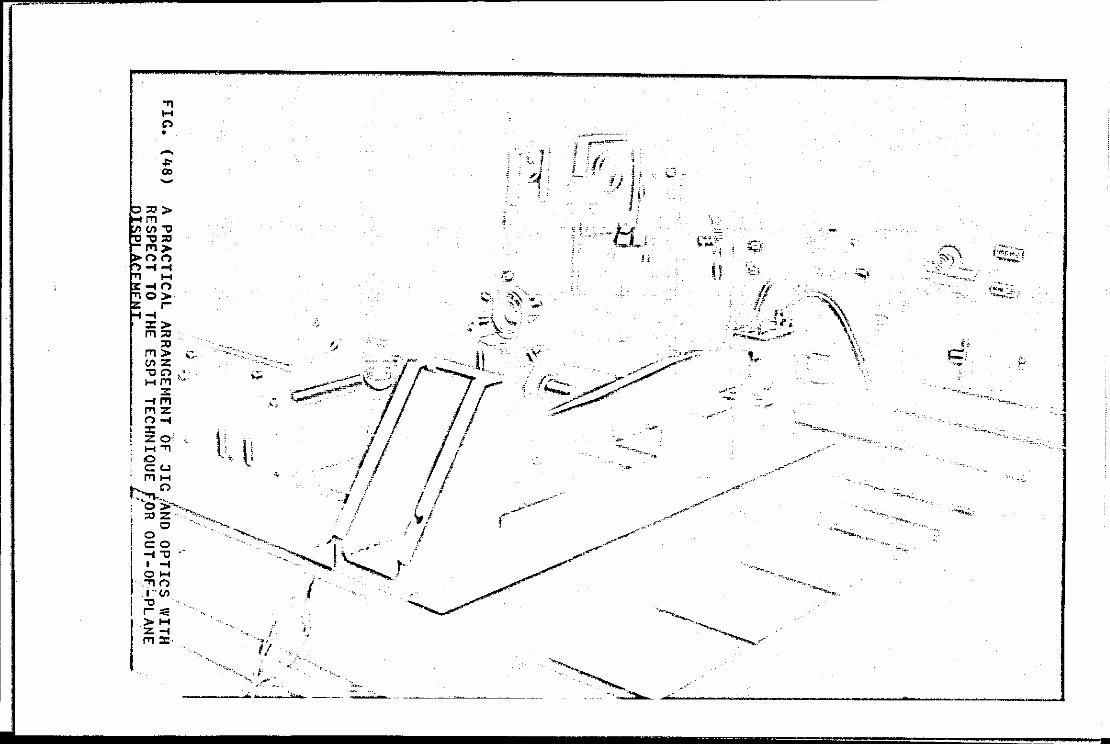
., ""' · ... / I!
·I --""" ..
,. .. _
·';,,i
., __
o_--
~ - • . i• l . ·-- ... :::: ..
~ .......... ; -- ~--~:.:.2::,.
.. -.......... ;-"' ;,. .. _]
·.,_ __
·~ - --~ .....;;. __________ ..._ _____ _.__j
----------------------------------------~~========~=----

,, '
I . _o---.~ q 4
"'~--.-~---~- . , ..
' '
·,
• 'I
'
'l ~ r: ·-------------------------------~---·· L"-.:_:
' .. ' •<'
,.
i _.
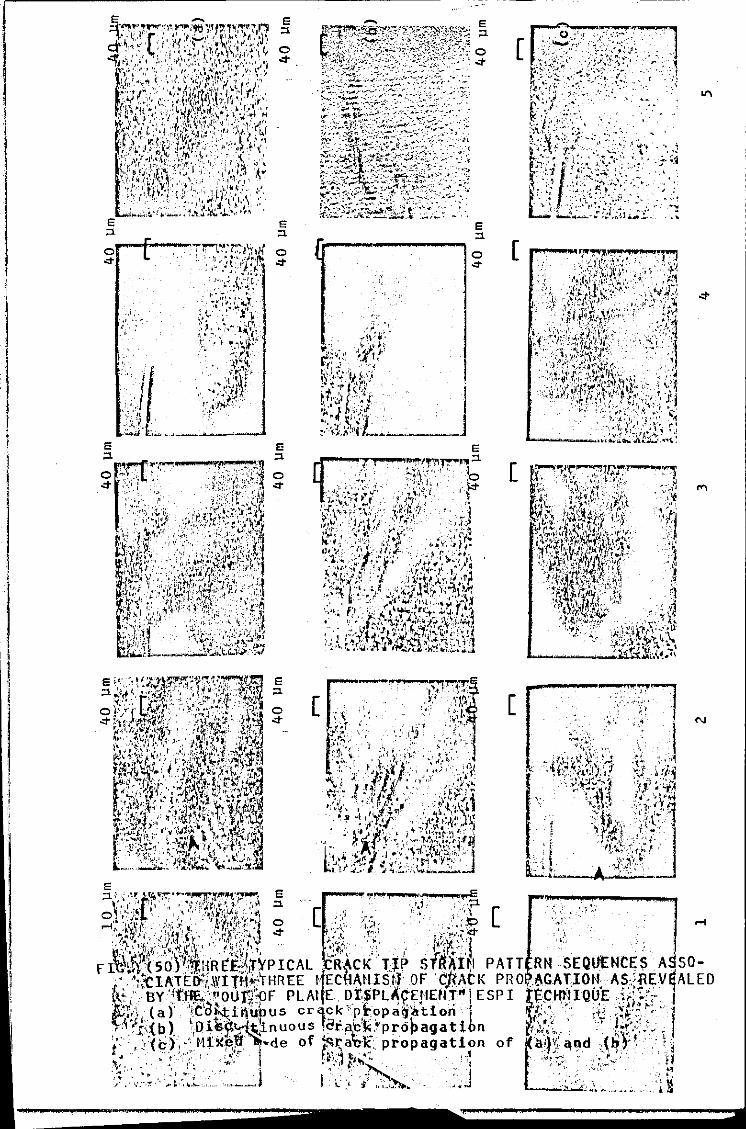
E ~ E ::r~"'r~:n"i 1'1""':,; ~·,,~~-,~·.,..,?l, :1 ~· .. ·.~} (·' ''/•. ,;.;.•. ''lr.''''··l' . ...,!,.~. -·· , •'fr ,., .. •'h.•' -'t/.".,r.r.
'-'_, .. .,';._' •':.,,;,CI't'U,·~•-\''I.,,.,~·i~ 0 • • I • ·. ' • ' i F'l· • ~ .::t r-'J,' ,i j .f·' ':.'. ·~.\,_::.~·.· ·.'-'\1! t';"i; ,, .,· •. '' ·, •• .:t
~\·•;· •',,' ·~.-- ;': ~·,_:.:',\~~·~~.·~-l:::_v· ~·-:1 ~,,'_~~"'! t_-.·,h., ·,/,.:~.;!r\1 ·t 1 ,_: J·,·r .. ;.. :.;_ ,".. , -~~-~r~··r:.r}'·T:'". j 1.\j t{: .. ~ ~ .....• _ •• :, 1 ,1.x·~r.~l.r-, 1,, .... , • ~t .. ;-~ ... ~- '.·: •frli n~··-.', ~·_,,. •. ,. J ~~- !t -"< ~ (···.4·~r. , ~~~ ... , ~ ~ ';_ ;,i'-o:l "'
t,:t~'i::·. :,'_1~:!\t. ~' •. 1;;_··;; <: ;f;(."l ·,I,,. I.;'• -~f~~;,.~J'~!•:,·:-~"N•(-~ c J ~<llt'.f~>: ~ rl(fi ·.-:; ·: '·" ~ ~~ .. , :,r~::-'.:it-.'1\~ r.'Tl.·:.~'.: ;;>~· _. ......... ".
~', ... , •.• k "'·· ..• ' ',\. •"• ,r,. ,1h\' .,-,.,-,. ·-- '! · . ,, · •
... :•t.~ .~;1 ; .. ··'···* .• ~--••11(, ' . .., .• 1\ ,.~:,':i~! .~-· )---)~j ;_,~_ ' ~--~l~('_' .-. ' I I '' ' '' '· '· 't· · 1
•• 1,· (• ~I I>' ,, ' i"·' \' ·:.;_;'.~--:~-~~· .. :....: 1~~}~i.i\Y:~~-
e e ~ ~
o• .:t
.. i,. .. •',· ·'
,~:Jf
1""""'1""' ,. ... I,~' I~· 0 ' ,, ' ~.' f •• , 'J' ' . ~ • ~-· ,, f·• .::t .. ., •. •\' ~".!. l ·"'
' ' "' ... .,_ f, ',.- . .'·'' _:; ...
''. ,• I, L. ~. ''~-'";'
... ~ \'?:~:-~~~-; ; V '· ~ "l I :~. '. ~ " .. ~-~· ·' ' ... :~' .... _,, 'i.-··-~; \ .-~~~:~ ... \. :~·;;,.
'I)'~ . ' . .,. .:-.,~~~ - ·1 '~.vr ..,;~ t:.~JJr
. ·.~~~-. 'f.'/~~·.·
~!·· ~~ '' c.-' .·.t I ~t:. .......... it
E E
~~~·---1~ 0 I' ~ ~ ,- '"
• '!•'' ,, ·~ 0 .::t ,.,. 'I c. .... :- ,,, . ~~ •" . ....
r ,:ir:.~ • ;,r , ... '\ , ~- ' -- •.•• -:~t'! ·~,~·}- ··~ c~;+··~·. #1!1:
\. ·;::. , •''. .. .. .,. ,_:;.;~ :~c:: . .f'J:'>. .: ;;···::. '. ·-t ,!·-;if.''\1
~·~:·t~'· ., 1 ·: .: •\>'·~·'·' l', ~~,Y~··" -~ >' · ~ -,.,:-:~;-~.-'(14.}.:·
~~i\1~\,~· ·.; ··.-;}0\·''"'¥t·,·.,n_, ~··,"· \,' .. ·.··,·(tf~··-'.f.lf,,-;,.~ ;._:~ ... :: ~
.<J!r- ji·'··~-' ~----~ O•' "14 '• { ~·,.; l - _,; ·····ii-~·'':f'·'""::"J •':~: ·:. ;,_,_, t~-~~;· -~·."!_;_~~~-tv ~'-5-t::.> '---~; :-~·;-.~~
~,( •1
t· , ~·\W•W'.•>'.' .. ·-~ ,,.~ t1.{_/i:.:_}' '·--~)?~<<~,~-_}:·;~i
~';·!; i~~ .. _r'r·_t...,-: · r•.Jo' ,._.~.,,t.t lf}r;-t ·~·-.'--'~·"\·;--
- ~t.L-~ti.:t.c..,U..-·.~
E \':,::~ ~ ::;;J''t~~·;-v~~·~~~~-· E ;:1 ~tf ~ ,,. ·~- ·- ··.( '~ 11-'•,( -··!?)~' :::::1 ~ .. /,·,' ·~~~~ -~.>:1~~:!"/i_ ~·:;:~:
0 i'f r t~r.r_: ::: '. c·.:·t':c._1 . -,~;; 0 .:t ,, •.• ~k' . . <jj' ,,~; .,..~ .:t
k,~.'t:i~(. ~·,~\ .: · ,_;r~·~~~ .:;{~,;, ~:··jf_ ... ..,d·f .. ~,~- .i.-.• ·-){~~'2' i~; ,?-~-1 J, '·~ ,. ' r ,. • -'·'·I ·ilt •' r~- ;; .. ~r.-~~··_.i .. ;·.,;[!;~- --~;1<~~t-J~~ f~;it~·'.l.: ~~\~''. :;t,."]~~< f~'~,_ .. k':t<. :Jfjlj\j~-,lt~~~t~i .t-_
'1i'!l ~-\: ·,..,! '!Jl::.'~---~;ta, "lll•l'. ,, _l r . ,n,;:_ .t·~---~~·'"'"
···'' .,.,,. "··~"'···· ' ··f.J~ '· './;> :. ·, , •. •'••··' .·,- ..• o• ~, ·,, L ~f, j /• i./ ,)': !I ;r.,.,i{,. 0 :A•\ \ ,, .. ~(;. ·><
r, •"'•· > ... """" t ' •• ·':'M~
.
_, ... ~ ~-. j .•. l ~.~··'l. •. :-" ,..J-t't ·'~" : . -t·{-t~~-. ' ~· -/1:-f":' ·_·! ~ ~-..;.-~11'. j~ .. ~ •. ,t~','~' .. -~'1!.'-{J-:,. ,• '•'-~~~·Lr~-"-~- .•A.to~ .. ..,...._,,_j,,'!Jf,
-~.: __ :~:r~~};~ft{~--~:-~~:-r.:~,L~-~-~~ ',q\!~k ... "''b'':'·. · ... ,
i~ffJ~Y;l '!;
'i ... : ': ,. __.I\ ~·
ot·~ ~ I'~ r.~';: l'j, t
[1;i .•. ··c; j ~\·-.t--o: 'If~··'/ ~-t.,-~~~r~ . . . ~t .. ) <'i: ·. I ;, .. ' ,,,,,, ' . J ::.r-~. <rt·t:i· . .
··-J .~ .· ' ' ~-,.j,/1·~'-·-· -.-; ....
E ~
0 .:t
E ~ ......--.. ~ -~~!.'1'-rr", .. · ·w···.·· b
~)}~:~~·~-~./ •, ;.-:t~f; ~- (-f 1i':• 'fl" *'f .. ·~ ~''--' ~ . ! ~ -..r -"-\· •· .. :-', · -· ,, E·:l!-_r'_ , . .J
~,.,\...,-.r· "~, :\'r·J',.'--· ·-j ,. 4j 'j "'t ( 1 '• • !'t :', · ' ': I,/ ;.li, ''1',r .-:J•It .,;,..:;;.'-~· . ,_.,r;.~ j.,.. ! " -."!, : ., • : ~-·.-·\' ,... h:.~h ,o, ~··-t' ·.~ ... '1 .. 1(r
I • - ., I . ... . ' • .. •~...::_.·" ,•,l ;-K-, ..... -.-lt n··;.·i-f.
"'~· .,, :.•· ... "•', ' • l >~·{ ~~-~ ....... ·~· ·P ,\t,\. .. ,-)t-~'1• ~·.l-4 t'···tN.'it,.~ ;~'Jl' :-,~· :'>i"'•f I. ',.t. ' •• ,. •.• '. ' ., •j : .... , ';. ,, •• 1
1·'1--~ ~ •. ,j; • ~' "'"'..':. f• .-:.;·:·' ,'' .~ ., .·.:• J ·''i_ y,..,, '"~ '•• ~~ ' • .. ., t ._·~ I • f;. • ' ' ·o'' ':\<i : ... ' ·" -·:- -, ~·f:.IW:o't\~•.',""'~ •. • •.: •I., I'~ .. ,=·, _. t "·•·~;'t1~ ... o..-.~.t, 1 •• . ( • .- 1=-',:f. ~ ·~ J. ~~~- ·'- •\:•··,·_,_tt.
.- '.' t- ..... ~'\.f'.' . i:l'f':'-'1!·\:.:, · . · ·. v'"·J1 ~:~H·,.,"f,·" '" ;., .. 1 ~ • .-1 r~-r.-J-t;.'J·tr~-~"~·h~:'th · "~·~. r .. • ~~.,~~ :.{ .fio"..:.J.~2.,..h~ *'h~.o..·
~'• .ml"T". ':'•·.-····• ..
[ ,.. ..· .. ~~-: .j -' ~ ! ;_' !.'
! --:y' 'l!'.",.' ' ' \: J~s.; ·~· (~
f:f~< '. ;~' .\,: ;:~: . ~: ;.~:';. ', '·." ',}1· ~. t. .. ·''' .. ·.·.~;t ~.I ~- .· :f'1 'b#', q'·J - •' ,, .
"1, •. h;'.j'•·· l'~~;t~~~ l"l:".' ·~ .. ,.,.,. -;," ·i'"'"i 1 i'~~-~ .~-- ·-·~· r.,~.ftl' . · ·--~ -i.·1-~~ . ~ 11' ~~. jl /£.-,' - ,·-~.~.(;. .. ;,1. ·~· ' -. ·l ~... ' '1"i5;~ ...... ,, . :·I'' f'•.: •' ,., ... ,.,,.,,,,,, .. ,
'" ~ ;&;j c ~- '. , ... \.t,&;•''';"l·'. "
L. . . . ..... -,!" \'''"' '1 1 ~ . .:· 1(- ',J 11- ~' 'r .- .... ~ • .,.,,, ·'
;.o~1 ·1 ·j•L ·.: 11 '-;;~::•t: 'I'Y~;:_' Lu .J.,•I, . .J"toL~•'I~~-J
E ;l.~. •r ~~ltf':""··~ .... ~:-c"'"t'~ e 'P--- 4"f41i't'.E
r' ::~.x·:z.::r~ J:.":"<'?;:.t" .• ·-:.:_,~_-,_~:.;:';. -~- ~ .. -1
Pli~'"20 .······ .]
[
•"~' r~··. ,. ,,.; ··;,., ' ...... ,_, ~ .;:·, • .. -: ~ --,.--.·,::- . \-·- ' .. · ,,.,.,, ................. ·";1 t..: ~1 t,· \ ,, • • -r • ·
l :; :_>~:>>> ' : . ~~~~? ;~(~; .~~~: _·· < -~i
~~~~~~~ ,' ,_,.·_)'_(•,;:~.~.:~:''' .o .; 4.~
'.:·~,\:;>·.;:l~j~·· .;,:.~. ·-~, .• : ·t~·hf11':,,·!~'/'' .... ·.': ,r--1
!'~.f:~;~.' ~-~/l~-~··-. <~~;.f~ ,';~''"",t,\~'-.ii.;, .. _,.,','>''·~ i;:-0 .; !!-J . .r.~.!L,.F·~~,-r·: · ' • ~1.1 'i· \';-1~-:i;:_. _!:.':-t,';;~;;.,-.;_. ,.•;/·.~
··r:''t'''·~·fl.''"'',. . ,,~ ·~,;yj\~~~~i{~,;; ... ·.·· .... iJ
. ' ,l. ¥.,{., .• \~!,ii '1''' ; ,,, ;-/~_;·.·.'i:,V:_ ... l;(f~·~-~1:-~-,-~,\.f. \l;..'.'~- -~ ~~ 1
--...,~~ .. J_,~·;..r-t-•1-'} ·· (i~'rJ 1 ·' ,I j
L----·-'_;_·.:._··· ;;~i~i~;~i:::~1 [
ID,__,~··-~·'l'Jm"' ··.'1 ~t'.. ,,, ~~f. ,: 1,.,. ~ ' \ '---~ --('-' .,•\•' r., ' . '".'~
r ;-~ '~·~. .. r \'):' f·\• ·.k 1~·r. {f~1,t -~·~··.·~ . ,:, .''A~~~r« ,,,t ··tlj ~it;~ ~ ~-<~of.?, ':} :.t • ··-
[
t:~"i-~trl~~ ·V~J1.\-'f'"· · :.;-' l·"t"'' ·~r~~n~~~·;: .... "' "''·~'·'·~, . .,. ·~ ·,1 ·._l;21_ ,. ,, ·J.'!lPit' .-_, :,.,.,.,~ :.1\f~~r ' .. ~ . ~. ···- ··x··· t ., ·~ >;(·~ ~"' " ,, ' ' .. · ~-~ ~ I I ,'-< \'' (.\ ·r. 1/U; \, .·;
·~ I lt.·J ''" ·: '~I ~.,,11,;-r;,, , .'. ·~. ' 1t-~~~ .;'·"1'~ ')',{1;•'"' ... "11' ----. ·'\'.'· ~U'
·'1'J _ ... ~ ·,_~J.i;h'~n·-~~·-~ · . . . """\"'~' .....
'-:"•f·:; •. <i ~ :\' ~' I - i'•PN!.w~t-.\~ .. ~\
_,. .... . ,; ~
-':"' .. l···· ,. . ' ., ._ .... ,., ··'· <;~:. ,. -. .
'
j' , •• ~J~' .. .. _,.I ' ·,ill ".1'.}-t.'~"~\...--\ •t''' ~~·'1 -~b". ·~")J,i:f :o-J ~ ri-i
~!'~:.r:,. .. .,'il ;., ··", .. ,01"'• ~ ·--~·· ,, . "'"
:;., ;'\: \ ;j' :·• --...J;., ,j. rJ-~ l T J\_< 1 ,!tr' i._,~· ~ 'I ""' ~ j
f rf'~/~_,c -~~·
I I;.. ·<:•. ~ ;~'< "
L:.:~
·:; ... "'·' ·~r~~ ' '·,:;~r;..;lt~~\1 ;,)\ ::1 ' r.,i ? ~·"·~·t·~ .. , · ·s·-"r,li~· .. ~ 0 . ~--. , ~ .. ~
) ~\.~ j - ', ' ..... ~ ~~ ,/.; !, .::t ' ·'· l or' 1 ~ • '~ '
"'
.:t
""
N
..... 01 ,'·,.•. ' , ' . 'I'''•· •', ·•J [ , ;. .. ' • , '1 [
'i.\1.'·· d~l h' ... ~t· .. t· ,:... ~: 1)f'-j ,' fi~~ftf5~~~~;~R~~;(,~\'PICAL ~:~CK TJP sf#tr·tl PATT RN SEQUENCE$ ASSO-
~·.·';{CIATE&'/ .. WIT!1•"THREE tfEcftA.HISt:J OF 'Cft.ACK PRO .~GAT.IOH. AS·iREV~ALED
1 tlY 'jf~~"OlJ]iJ,CoF PLAlfE D!.SPL/;£[11EIIT"lESP I f:.CmiiQUE ~/~~;· j ;.~.(a) '.·C'o~il~ubus crfck' phpaij'atiori t).' • .. ;, ."t1:': • j ~·;;\{b) c.Diti~td~inuous .C!ra,.ic'l<i.'propagati n h:;~. · -~ l>,.::;_. i
r' '.'(c),·'·t-lfl(~~"lltl~de of ~~a'O~ propagation of a•};:(\nd J~t~ ''i ':\; ,~ ~ t ' ~ t . .,.,,-,1 t 1"' ~ ~ ~· ...... , " ,. , H
j_·<:~ · ,';/L ·,, __ J l < .~ }";~~- j -~;;;; l·~-~-... j

\
---~· ------------! \ ---~~--!..1-=--===:~~-:--'J ,:c -·---- --~-
' i l 1 I i
~-~--~' --~Ji ____ ~·--c--·--------__ 1,, __ _..:...1---:' _ _:..;-H_,I_ ---~-
-'·-~r~-~·--,--'~---~ -H!---;-1 -'·'----~ ---
--~~'--.-~~~---=~-----~~---~-'-..,..-_!_l_r-_:_i -1-il-~' -,;-. --~--· ~~--~'--:-~1~.-~.-----·----~
i I --"~'----·--_ ____.:_' __ ....: _ _;,.,:----'- -· . 1 ___ ...;.1;__-;-j--"1}··-1'--~-''· ---:---
- ~ l I 1 ·
_.1 __ l __ l,_ -~--l ... --:-, -!jj]--, .. :·~~--='~--=-~·.-~~~--_ -----------~~·'--
1 I ! · ---.-~·-::----L-...--..1---,--'---:-t ' .. , 1-----' , "' ~ ~--J! ___ ;:_! __:· __ ~.._· +"'-I'-----"'---~:.__~..!, ..... ,;;-, >i1 ·-
!-
d ' r ' -
(! ~-.r·~····· .. -.J
FIG. (51) H1PACT TESTING 11ACHINE ([l.S. 1391: ;952)

' I I
I
1r, -~-~~~--(~t--~-~-~--.... ~ 0,007 um
-------· ----~--
(b)
0.007 um
L.-------~------~~----
FIG, (52)
,·_,
IMPAC) TEST SPECIMEN OF EPOXY (a) Oefore impact (b) After impact (unbroken) (c) After impact (broken)
i

,, .. ,': ..., ____ -- "'- .,_,._:' .. ":r,';~;;:-:·1~.:::, .~. '"· ____ , ·-:;; .. ··e·
". ::1
.0
--~-
I ,
I ....
[ "" --
.·.·~
... ·
---· '
._,_,
. " .. ,,._
.e ::1
0 ....
I A
' ~· . ··-<':'. '
' .~
f . ····~ l ~·~ I . ·~
SEQUENCE Or S • ILLS~ FROM THE VIDEO RECORDI~2LF A PI ASTI.c.....llf. ATION .. ZONE-IN- FR~A CRAct PROPAGATE THROUGH AN EPOXY RESIN (H~3) OF OOND THICKNESS = lOO pm AS OBSERVED THROUGH A TRAVELLING MICROSCOPE, THE CROSS-HEAD SPEED IS 1 mm/min.

(a)
40 ]Jm
'-, -:. ' -. "· i ... . -.. -.. . ----lillo-
..
I !
(b)
40 ]Jm l
•
r:--~-~~ ~_.,~~~-:::~--~-.... _,_......,...,....__ #,~_" __ '-:_...,..._""""·"-"--~,.-- --~"·""":_·:.:··-.:::.';~ .. -·- .. ;··-.---~--- "" " ... __ : __ ·-.·-.
·-•. -~·-., •
(c)
FIG. (54) "' THE PLASTIC D~FORMATION ZONE OF-EPOXY RESIN PROPAGATINGLIN: -- -(a) contin ous.mode (b) discon"tinuous mode "' ~-(c) mixed mode of (a) and-(b)~---- "' ..;r· •

0.6 ].Jffi
- . I r,..
. -- .-
FIG. (55) (a)
(b)
(c)
·- ...
0.6 ].Jffi
/~·/ • /_. I • r ~ ~
SURFACE !'F HIGH HARDEN~R (L,,) CONTENT RES!~ SHOWS TH UNREACTED HARDENER (TMA) PARTICLES FULL SPH RICAL FEATURES CORRESPONDING TO TRIANGUL R FEATURES IN (a) EMPTY SP.ERICAL FEATURES CORRESPONDING TO TRIANGULAR FEATURES IN (a)
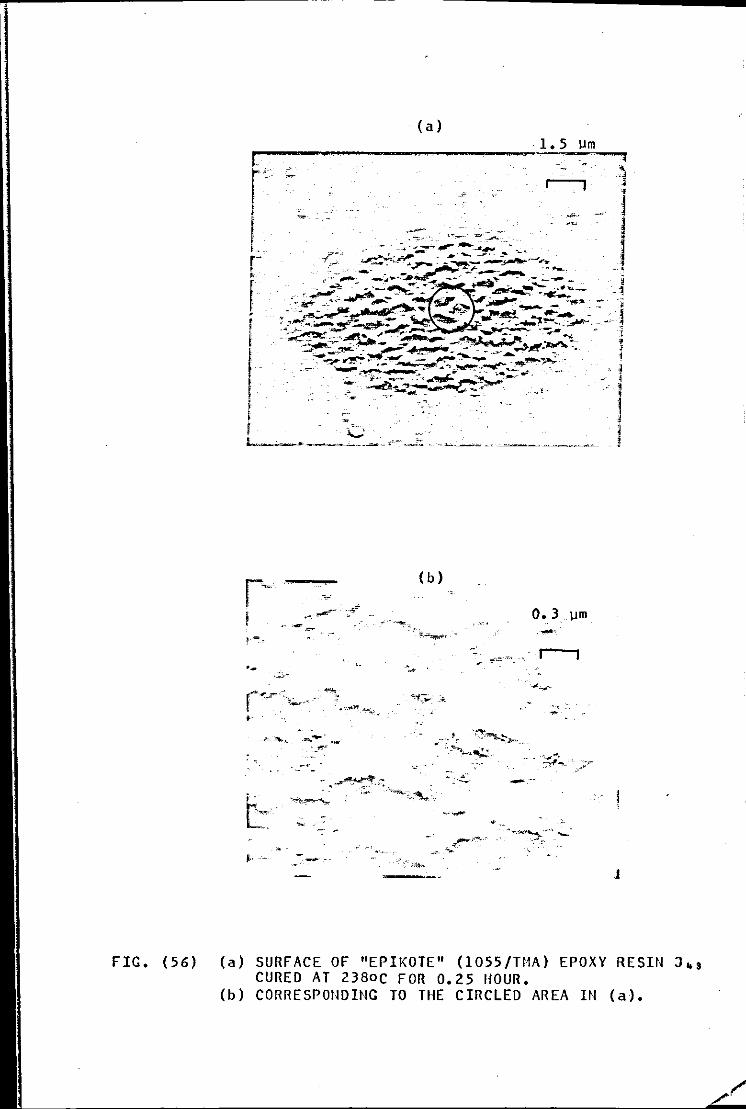
FIG. (56)
-
--[
r •
I
I I C L ..... &O ... ; •••••• , ...... _-~
--·-
!"--"""-.. ----. ~":~ -·· ~
- ---
I· -_ ..
(a)
(b)
·-· _, s . --
0. 3. urn
----
J
(a) SURFACE OF "EPIKOTE" (1055/TMA) EPOXY RESIN J~ 3 CURED AT 238oC FOR 0.25 HOUR.
(b) CORRESPONDING TO THE CIRCLED AREA IN (a).

Jo-,, ... f ,;.;··_
~ J_ ., •
1,"·-
FIG, (57) (a) SEM MICROGRAPH OF A FRACTURE SURFACE EXHIBITING RIVER PATTERNS OF "EPIKOTE" (1055/TMA) EPOXY RESIN (I- 3 ) SPECIMEN OF 400 um BOND THICKNESS.
(b) STEREOSCAtt MICROGRAPH OF "EPIKOTE" (1055/TMA) EPOXY RESIN (K43) SHOWS RIVER PATTERNS OF THE FRACTURE SURFACE OF 400 um BOND THICKNESS SPECIMEN AFTER THE CRACK JUIIP ING,

FIG. (58)
FIG. (59)
OUT-OF-PLANE ESP! CRAZE FRINGES SHOWING PRIOR TO CRACK PROPAGATION IN FRONT OF THE CRACK TIP OF EPOXY RESIN (H-3)
~..::-.~--·~~----~ .. :,...,.. w .... . _,..,.--.
SURFACE OF CRACK WAS BROKEN UP INTO MANY CLEAVAGE PLANES IN (H, 3) RESIN OF BOND THICKNESS = 500 urn.

•
.. (
1 ~
!(a)
{b)

.. 0
0
0 oO O 0 o • • 0 ·,O. 0 •
,, ~· -
• •
Cl
0 Cl
0
0
0
c 0
;t
o·t"'\ .,.- o '':dO · - o •. 0_ Otfll
·. _(') . ~ -. . • () 0 • ...... ., ..
. ' .. 0 ·•
eo r· . o ;:1 ,..._,, ~" ) • -· 'l!- r
• ~. • 0 0 I· - l) ~ ~
0" OC" • ~ 0 ·• 0 j) I .· 0 " •0 . (')
., 0 •. ~ 0 • 0 -
0 " • 6.:,0 ({)) 0
0 eo. ..
" 0 0 0 0
"'q, _oe 0 u a
""' ©--0 d .
0
• .. . -·
•
' tf') ._..
, ... ()
·r() -:.) ' 0
. :,'") 0 •
o - o·o F~. (Ja~ TtfE t!9,IDS DISTRIBUTIOtJ OF THE FIVE EPOXY RESINS ' 9 . • (l(,l55(l:r1Ar,) ~URED AT 2)8°C FOR 90 BINS, •o · 0 ··a..a> H,., (b) t_, (c) J,., (d) K,. 3 and (e) L,. 3 • .. (\). .:oo
0 ·
- ft ~ ...
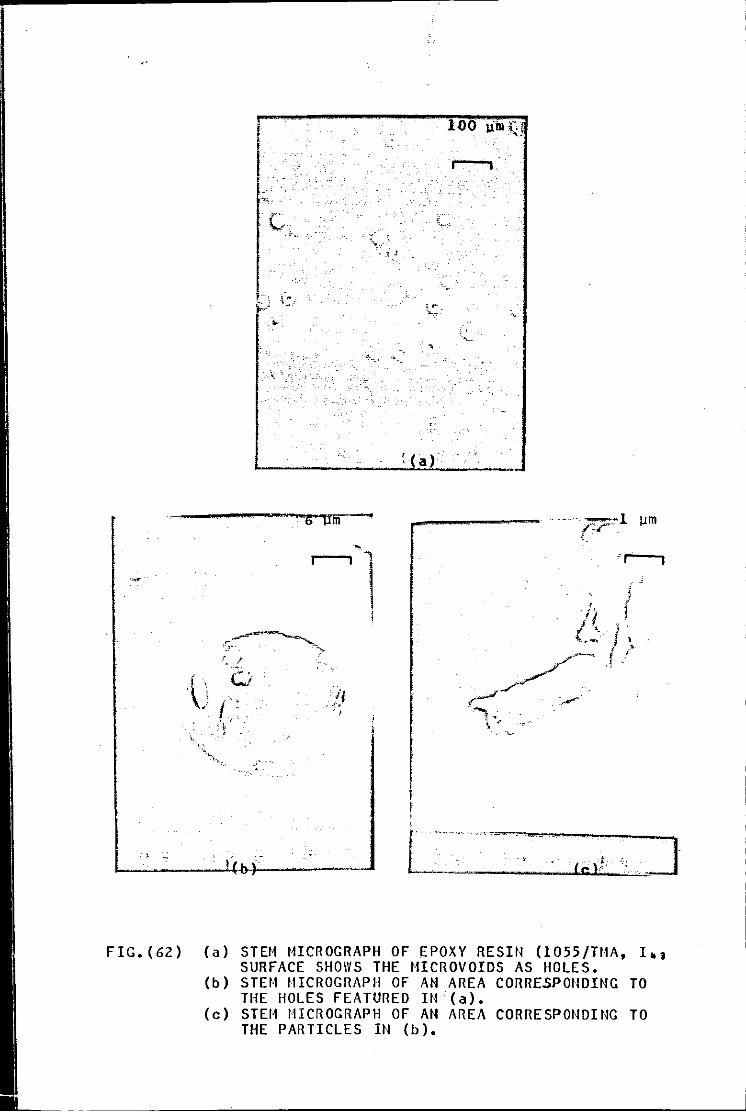
1· -·-i
'" .... ' ...... -·
il .--'.'··· .,
:(a)
'' ·~
··r---,
l,_· _· _-.. _ ... _-·_-·_· __ · _· '_.w_._..Ll.cc..Ll'::.;.f _·.::c· • .. ~:l
FIG.(62) (a) STEM MICROGRAPH OF EPOXY RESIN (1055/TMA, I. 3 SURFACE SHOWS THE MICROVOIDS AS HOLES.
(b) STDI tHCROGRAPH OF AH AREA CORRESPONDING TO THE HOLES FEATURED IN (a).
(c) STEM MICROGRAPH OF AH AREA CORRESPONDING TO THE PARTICLES IH (b).
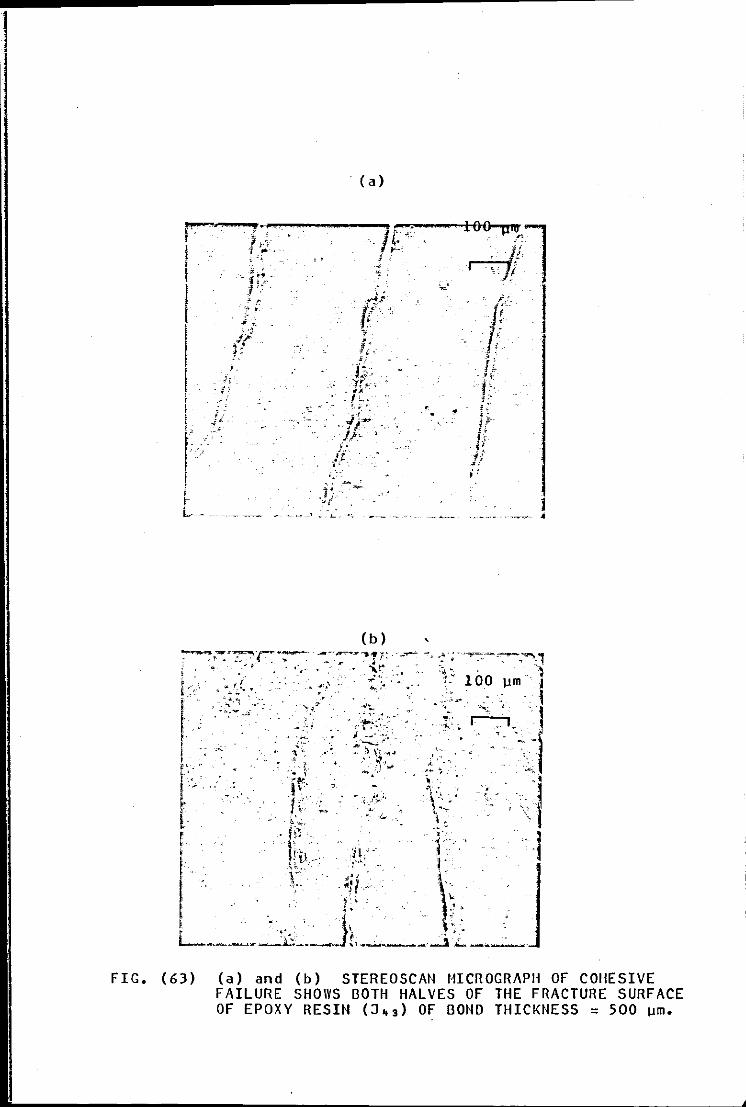
1· i
I .· I ~\ l ~.
. {a)
(b) '
FIG. {63) {a) and {b) STEREOSCAN IHCROGRAPH OF COHESIVE FAILURE SHOWS BOTH HALVES OF THE FRACTURE SURFACE OF EPOXY RESIN (J~3) OF BOND THICKNESS = 500 urn.
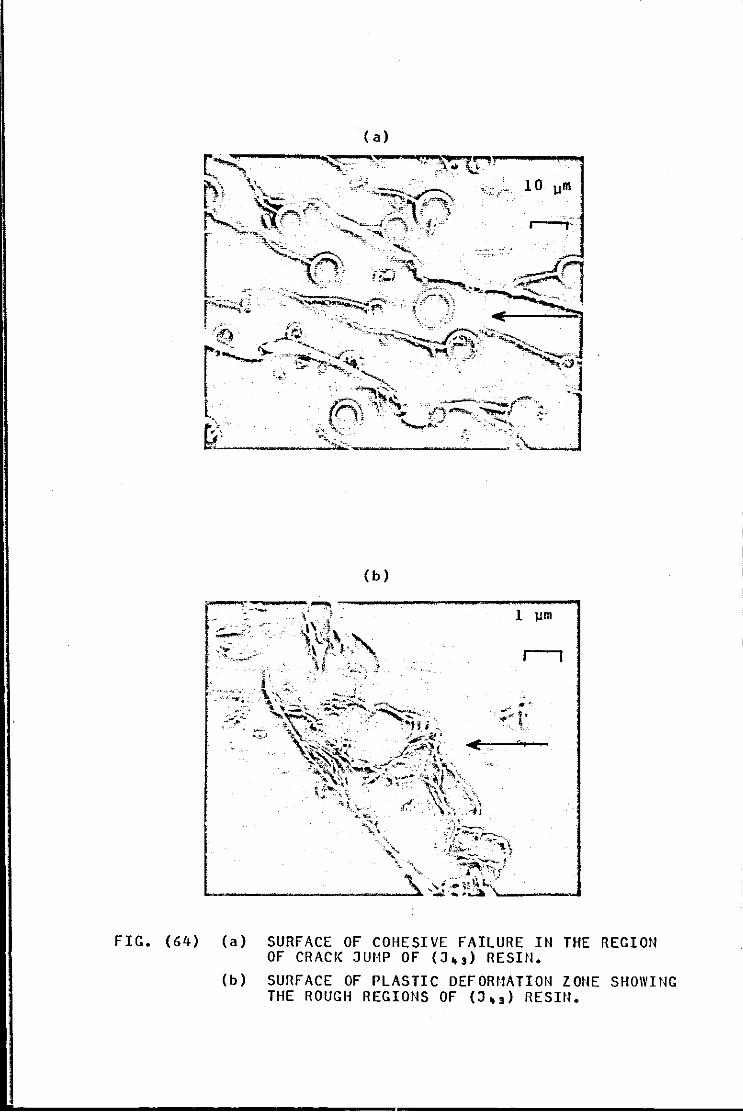
(a)
(b)
.. .. """:, :t. • I
'-- ''"
FIG. (64) (a) SURFACE OF COHESIVE FAILURE IN THE REGION OF CRACK JUMP OF (J~ 3 ) RESIN.
(b) SURFACE OF PLASTIC DEFORMATION ZONE SHOWING THE ROUGH REGIONS OF (J-,) RESIN.
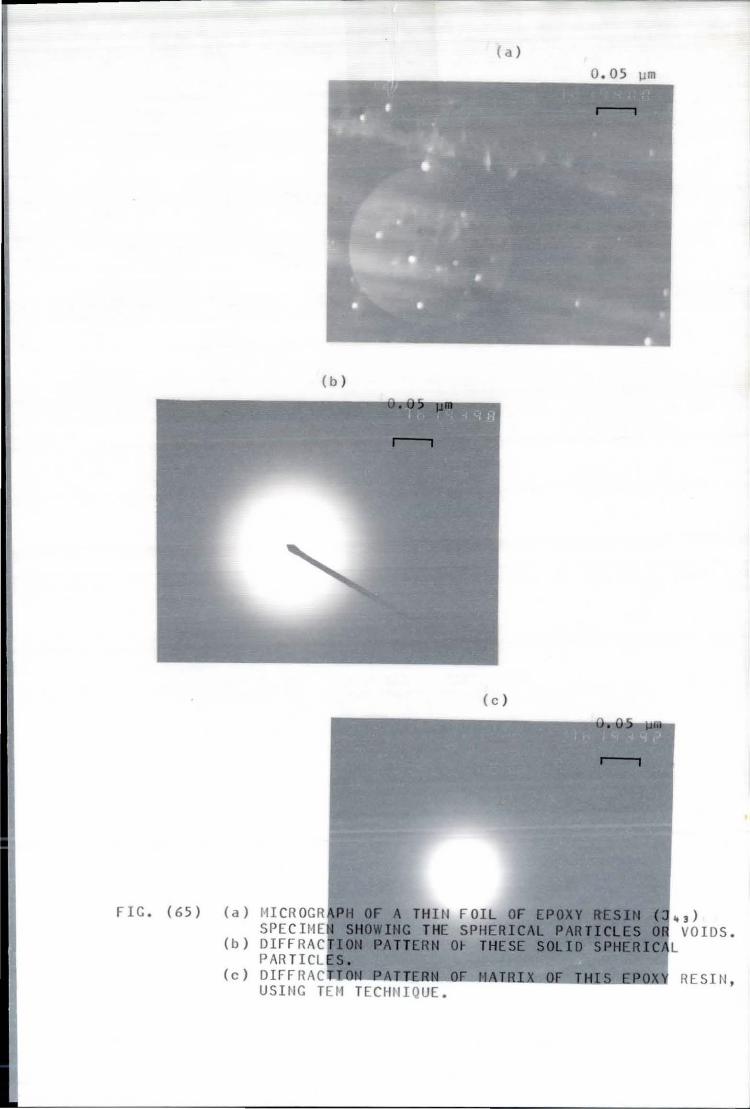
ric. (65) (a)
(b)
(c)
a)
(b )
(c )
11I CROGR PH OF A THitl FOI L Of EPGXY I£SIH ( SPEC !liE SHOWING THE SPHERICAl PARTJCLES DIFFRAC 10. PATTERN 0~ THESE SOLID SPHERIC PAR TICL ES. DIFFRAC T.~~~~~~.~~~~~~cu USING TCI1 TECHIIIQUE.
.. 3 )
VOIDS. L
RES IN,

FIG. ( 67) STEREOSCAil 11ICROGRAPH OF FRACTURE SURFACE OF EPII<OT[ (1055/T lA) EPOXY RESIN 3~t 3 AT OOND THICKNESS 200 un .
fiG. (68) STEREOSCAtl 11ICR OG RAPH OF FRA CTURE SURFACE FOR K~t3 RESIN SHOWS OOTII THE Et·1PTY AND FULL SPHERICAL PARTICLES AND TH[ HOLES LEFT BEHltlD AFTCR DISPLACC11EtH.
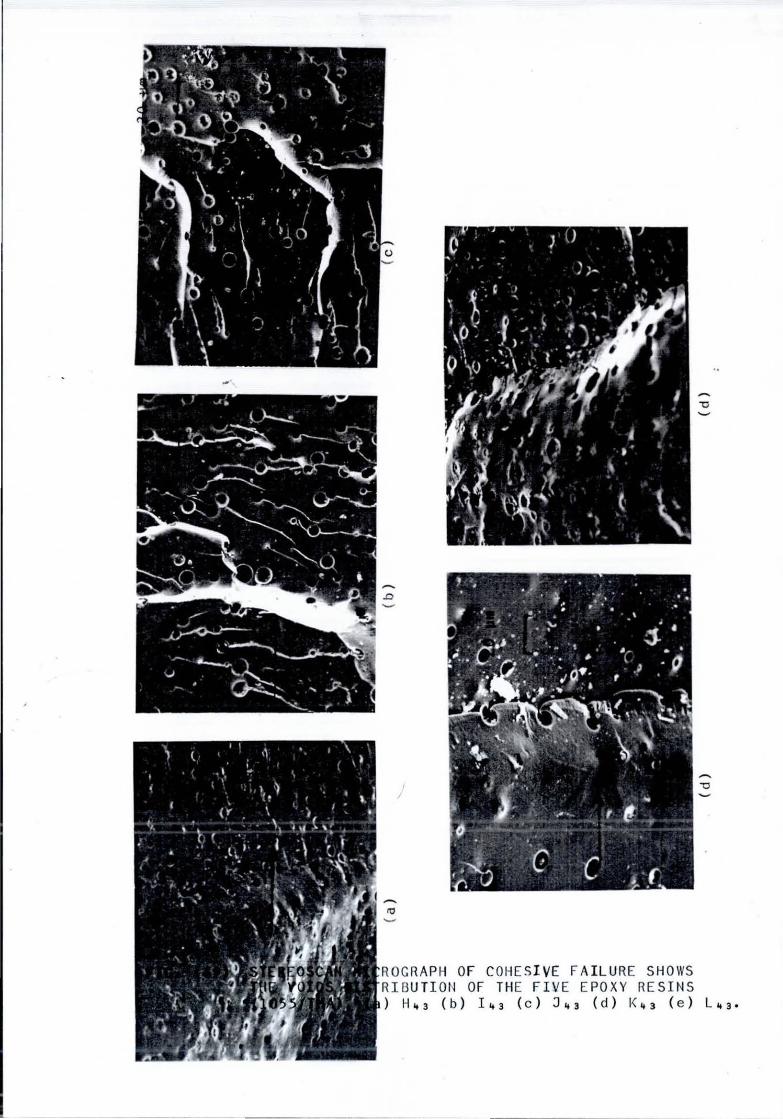
ROGRAPH OF COHESIVE FA ILUR E SHOWS RIO UTI ON OF THE FIV E EPOXY RESINS ) H~3 (b) !~3 ( c ) J~3 (d) K43 ( e ) L~3·
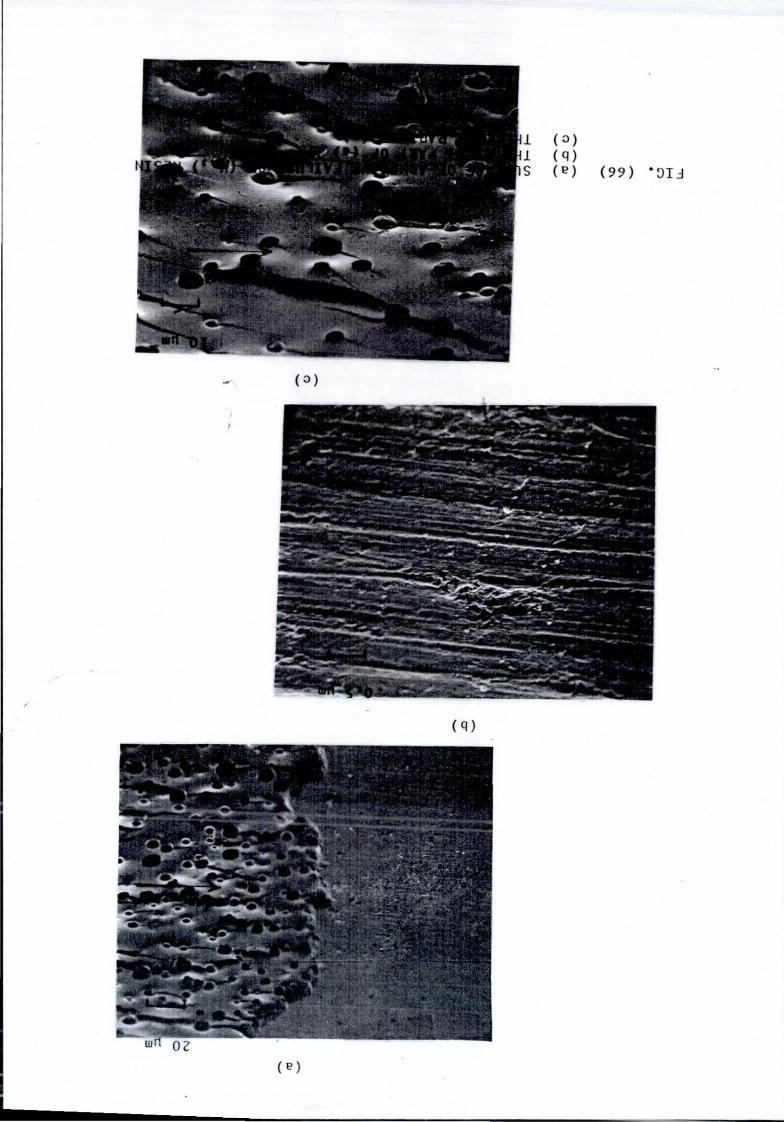
(0)
( q)
l (0) l (q) s (e) (99) ·~n.::J
