the fourth quarter (october – december) 2019
TRANSCRIPT

مسح القوى العاملة بالعینةالربع الرابع
(أكتوبر – دیسمبر) 2019
Labor Force Sample Survey The Fourth quarter
(October – December) 2019

- 2 - LF_Q4_2019_AE-2020
رقمالصفحة
رقمالجدول
رقمالشكل
PageNo
TableNo
FigureNo
4Prefaceتقدیم
5Introductionمقدمة
8Executive Summaryملخص تنفیذي
121Population and labor force by sexالسكان والقوى العاملة حسب الجنس
132Population (15 years and above) by relation to labor force, nationality & sexالسكان (15 سنة فأكثر) حسب العلاقة بقوة العمل والجنسیة والجنس
& 141Population (15 years and above) economically active/inactive by nationalityالسكان (15سنة فأكثر) النشیطون وغیر النشیطین اقتصادیاً حسب الجنسیة والجنسsex
152Qatari (15 years and above) economically inactive by reason & sexالقطریون (15سنة فأكثر) غیر النشیطین اقتصادیاً وأسبابھ حسب الجنس
163Population (15 years & above) by relation to labor force & age groupsالسكان (15 سنة فأكثر) حسب العلاقة بقوة العمل وفئات العمر
174Males population (15 years & above) by relation to labor force & age groupsالذكور من السكان (15 سنة فأكثر) حسب العلاقة بقوة العمل وفئات العمر
185Females population (15 years & above) by relation to labor force & ageالإناث من السكان (15 سنة فأكثر) حسب العلاقة بقوة العمل وفئات العمرgroups
196Economically active population (15 years & above) by nationality, sex & ageالسكان النشطون اقتصادیا (15 سنة فأكثر) حسب الجنسیة والجنس وفئات العمرgroups
207Workers in paid employment (15 years & above ) by sex and averageالمشتغلون بأجر ( 15 سنة فأكثر ) حسب الجنس ومتوسط الأجر الشھري ( بالریال القطري )monthly wage (Q.R)
218Unemployed (15 years & above) by nationality, sex & age groupsالمتعطلون (15 سنة فأكثر) حسب الجنسیة والجنس وفئات العمر
229Unemployed (15 years and above) by nationality, sex and reasons ofالمتعطلون (15 سنة فأكثر) حسب الجنسیة والجنس وسبب التعطلunemployment
233Unemployed (15 years and above) by nationality and reasons ofالمتعطلون (15 سنة فأكثر) حسب الجنسیة وسبب التعطلunemployment
Tableالجدول
CONTENTS المحتویات

- 3 - LF_Q4_2019_AE-2020
رقمالصفحة
رقمالجدول
رقمالشكل
PageNo
TableNo
FigureNo
Tableالجدول
CONTENTS المحتویات
244Qatari unemployed persons (15 years and above) by sex and reasons ofالقطریون المتعطلون (15 سنة فأكثر) حسب الجنس وسبب التعطلunemployment
2510Unemployed (15 years & above) by nationality, sex & duration ofالمتعطلون (15 سنة فأكثر) حسب الجنسیة والجنس ومدة البحث عن عمل بالشھورEmployment search in Months
265Unemployed (15 years and above) by nationality, sex and duration ofالمتعطلون (15سنة فأكثر) حسب الجنسیة والجنس ومدة البحث عن عمل بالشھورemployment search in months
المتعطلون القطریون (15 سنة فأكثر) الحاصلون على الثانویة وملتحقون بالدورات التدریبیة حسب 2711Qatari unemployed persons (15 years and above) with secondary educationالجنس ونوع التدریب
who attended training program by sex and type of training
المتعطلون القطریون (15 سنة فأكثر) الحاصلون على الثانویة وملتحقون بالدورات التدریبیة حسب 286Qatari unemployed persons (15 years and above) with secondary educationالجنس ونوع التدریب
who attended training program by sex and type of training
2912Qatari unemployed persons (15 years & above) by sex & willingness to workالمتعطلون القطریون (15 سنة فأكثر) حسب الجنس والرغبة للعمل فى القطاع الخاصIn private sector
307Qatari unemployed persons (15 years & above) by sex & willingness to workالمتعطلون القطریون (15 سنة فأكثر) حسب الجنس والرغبة للعمل فى القطاع الخاصIn private sector
المتعطلون القطریون (15 سنة فأكثر) الحاصلون على الثانویة وأسباب عدم الرغبة للعمل في القطاع 3113Qatari unemployed (15 years and above) with secondary education notالخاص
willing to work in private sector by reasons
المتعطلون القطریون (15 سنة فأكثر) الحاصلون على الثانویة وأسباب عدم الرغبة للعمل في القطاع 328Qatari unemployed (15 years and above) with secondary education notالخاص
willing to work in private sector by reasons
3314Population (15 years and above) out of labor force by nationality, sex andالسكان (15 سنة فأكثر) خارج قوة العمل حسب الجنسیة والجنس وفئات العمرage groups
349Population out of labor force (15 years and above) by nationality and ageالسكان خارج قوة العمل (15 سنة فأكثر) حسب الجنسیة وفئات العمرgroups
3510Qatari population out of labor force (15 years and above) by sex and ageالقطریون خارج قوة العمل (15 سنة فأكثر) حسب الجنس وفئات العمرgroups
3615Population (15 years and above) out of labor force by nationality, sex andالسكان (15 سنة فأكثر) خارج قوة العمل حسب الجنسیة والجنس والحالة التعلیمیةeducational attainment
3711Population out of labor force (15 years and above) by nationality andالسكان خارج قوة العمل (15 سنة فأكثر) حسب الجنسیة والحالة التعلیمیةeducational attainment
3812Qatari population out of labor force (15 years and above) by sex andالقطریون خارج قوة العمل (15 سنة فأكثر) حسب الجنس والحالة التعلیمیةeducational attainment

- 4 - LF_Q4_2019_AE-2020
Prefaceتقدیـم
ختاماً نود أن نعبر عن شكرنا وتقدیرنا لجمیع أسر العینة التي كان لتجاوبھا وتعاونھا
الأثر البالغ في إنجاح ھذا المسح، وكذلك الشكر موصول لجمیع الذین عملوا في ھذا
المسح من داخل الجھاز أو خارجھ.
We would like to express our thanks and appreciation to all sample households for their co-operation and positive response which made this task a success. We also thank all those who worked on this survey, whether from inside or outside the PSA (Planning and Statistics Authority).
یسر جھاز التخطیط والإحصاء أن یقدم نتائج الربع الرابع من العام 2019 لمسح
القوى العاملة بالعینة. ونظراً للدور الرئیسي لإحصاءات سوق العمل في عملیة التخطیط
الاجتماعي والاقتصادي، فإن جھاز التخطیط والإحصاء یتولى تنفیذ مسح القوى العاملة
بالعینة بشكلٍ دوري للوقوف على حجم وتركیبة القوى العاملة في دولة قطر ، حیث
یوفر المسح بیانات ھامة حول العلاقة بین سوق العمل والخصائص الدیموغرافیة
والاجتماعیة والاقتصادیة للسكان مثل التعلیم والمھن.
The Planning and Statistics Authority is hereby pleased to present the results of Labor Force Survey by Sample Q4, 2019 .Due to the central role of labor market statistics in a country’s socioeconomic planning process, the PSA (Planning and Statistics Authority) carried out a national labor force survey periodically to provide measures of the size and structure of the labor force in Qatar. The survey provides important information on the relation between the labor market and the sociodemographic and economic characteristics of the population, such as education and occupation.
جرى تنفیذ المسح آخذین في الاعتبار توصیات منظمة العمل الدولیة . علاوة على
ذلك فقد استند المسح على عینة مصممة بشكل علمي سلیم والتي أتاحت المجال لعمل
تقدیرات موثوق بھا للمجتمع.
The survey was implemented taking into account the recommendations of the International Labor Organization. Moreover, it is based on sound, scientific sample design, which allowed the calculation of reliable estimates of the population parameters.
Dr. Saleh Bin Mohammed Al Nabitد. صالح بن محمد النابتPresident , Planning and Statistics Authorityرئیس جھاز التخطیط والإحصاء

- 5 - LF_Q4_2019_AE-2020
.11.
.22.
.33.
.44.
.55.
.66.
Introductionمقــدمــة
: Survey objectivesأھداف المسح :
تقدیر حجم قوة العمل في دولة قطر.
دولة قطر ھي إحدى الدول التي تولي تنفیذ مسح القوى العاملة بصورة دوریة منتظمة اھتماماً كبیراً ، وترصد لھ المیزانیات والجھود وذلك لتوفیر نظام إحصاءات شامل عن
السكان النشیطین اقتصادیاً لیكون أساساً لمراقبة الاتجاھات والتغیرات في سوق العمل ، كما یشكل قاعدة لتقدیم وتحلیل السیاسات الاقتصادیة الكلیة للدولة ، فضلاً عن توفیر مؤشرات
العمالة والبطالة التي تستخدم كمؤشر عام حول الأداء الاقتصادي للدولة. إن البیانات التي یوفرھا مسح القوى العاملة الذي ینفذه جھاز التخطیط والإحصاء بدولة
قطر ، تعتبر مادة دسمة للعدید من الدراسات التحلیلیة المتعلقة بسوق العمل والبطالة والأجور في دولة قطر ، ولعل من أھم تلك الدراسات ما یتعلق بالتغیرات التي تحدث في
التركیب الاقتصادي للسكان من فترة إلى أخرى ، الأمر الذي یساھم ویساعد بشكل كبیر
ومباشر في رسم خطط التنمیة البشریة والاقتصادیة والتي ھي جزء من رؤیة قطر الوطنیة
التي تسعى دولة قطر لتنفیذھا بحلول العام 2030.
The State of Qatar is one of the leading countries that attach great importance to the implementation of Labour Force Survey on regular basis, and allocate for this purpose budgets and efforts in order to provide a comprehensive statistics system for the economically active population as a basis to monitor trends and changes in the labour market. This system is further a base for the provision and analysis of the state’s macro-economic policies, as well as employment and unemployment indicators which are used as a general index on the economic performance of the state. The data provided by the labour force survey implemented by PSA (Planning and Statistics Authority) is considered a rich material for many analytical studies related to labour market, unemployment and wages in Qatar. Perhaps the most important of these studies are those related to changes in the population’s economic structure from one period to another. This would significantly and directly contribute to shaping human and economic development plans which are part of Qatar's National Vision that Qatar is seeking to implement by 2030.
Estimate the size of the labor force in Qatar.
توزیع قوة العمل حسب الخصائص المختلفة : فئات العمر، النوع، المستوى التعلیمي، الحالة الزواجیة، الحالة العملیة، النشاط الاقتصادي، المھنة، القطاع .. إلخ.
قیاس مستوى الاستخدام والبطالة في دولة قطر.Study the relationship between the educational profession and specialization.
Build a modern database and provide all the data and informationبناء قاعدة بیانات حدیثة وتوفیر كافة البیانات والمعلومات اللازمة للقیام بالدراسات.necessary to carry out studies.
دراسة السكان المصنفین خارج قوة العمل من حیث: فئات العمر، النوع، الجنسیة، المستوى التعلیمي، الحالة الزواجیة، الرغبة في العمل، أسباب العزوف عن العمل،
وأسباب ترك العمل السابق.
Study population labeled outside of the labor force in terms of: categories of age, gender, nationality, educational level, marital status, willingness to work, the reasons for reluctance to work, and reasons for leaving previous work.
Measuring the level of use and unemployment in the State of Qatar.
دراسة العلاقة بین المھنة والتخصص التعلیمي.
Distribution of the labor force by selected characteristics( age groups, gender, educational level, marital status, employment status, economic activity, occupation, sector .. Etc ).

- 6 - LF_Q4_2019_AE-2020
.II.
.IIII.
.IIIIII.
.IVIV.
Qatari householdsالأسر القطریة.Non-Qatari householdsالأسر غیر القطریة.
: Sample Designتصمیم العینة :
(PSU) یستند تصمیم العینة على عینات مستقلة تم سحبھا من وحدات معاینة أساسیةخاصة، كل وحدة تغطي كل الدولة وقد تم تصمیمھا لتشمل عدداً من الأسر المستھدفة من
نوع معین :
The sample design is based on independent samples drawn from distinct sets of especially constructed PSUs, each set covering the entire nation and designed to include a target number of households of given type :
Small labor gatheringsالتجمعات العمالیة الصغیرة.Large labor gatheringsالتجمعات العمالیة الكبیرة.
تم تصمیم عینة ذات مرحلتین، المرحلة الأولى تحدید وحدات المعاینة الأولیة ، وفي المرحلة الثانیة یتم اختیار عینة من الأسر المعیشیة داخل وحدة المعاینة المحددة . الوحدة المختارة في المرحلة الأولى تسمى وحدة المعاینة الأولیة، والوحدة المختارة في المرحلة
الثانیة تسمى وحدة المعاینة الثانویة. وحیث أن التعداد قد أجري في أبریل 2015 ، فقد تم تحدیث إطار وحدات المعاینة الأولیة المحددة وذلك قبل العد الفعلي.
A two-stage sample design is used, selecting Primary Sampling Units at the first stage and a sample of households within each selected PSU at the second stage. The unit chosen at the first stage is called the Primary Sampling Unit and the unit selected at the second stage is called the Secondary Sampling Unit. As the census was conducted in April 2015 an updated listing of the selected PSUs was carried out before the actual enumeration.
: Universeنطاق المسح :
یتكون نطاق المسح من جمیع الأسر المعیشیة العادیة القطریة وغیر القطریة وكذلك التجمعات العمالیة في دولة قطر.
The universe consists of all the regular Qatari, non-Qatari households and the labor gatherings in the state of Qatar.
: Sampling Frameإطار المعاینة :
یعتمد إطار المعاینة المستخدم لھذا المسح على تعداد السكان والمساكن والمنشآت 2015 . وقد أخذ جھاز التخطیط والإحصاء بالإعتبار مناطق جغرافیة صغیرة تسمى مربعات العد
وھي مناطق العد المستخدمة في التعداد. ومن ھذه المناطق تم انشاء وحدات المعاینة الأولیة .(PSUs)
The sampling frame used for this survey is based on 2015 Census of population, housing and establishments. The Planning and Statistics Authority has divided the whole country into small geographical areas called Census blocks. These were enumeration areas during the Census. These Blocks were combined to create Primary Sampling Units (PSUs).
: Sampling Unitوحدة المعاینة :
وحدة المعاینة في كل مرحلة من مراحل الاختیار تشیر إلى الكیانات التي یتم اختیارھا للمسح . في ھذا المسح، كانت وحدات المعاینة النھائیة ھي الأفراد الذین یقیمون داخل
الأسرة المعیشیة التي تم اختیارھا.
The sampling unit in each stage of selection refers to the entities that are selected for the survey. In this survey, the ultimate sampling units are the household individuals residing within the selected household.
- 7 - LF_Q4_2019_AE-2020
: Domain of Estimationمجال التقدیر :
مجموعة فرعیة من السكان من المقرر إجراء تقدیرات منفصلة بشأنھا في المسح.المسح یھدف الى توفیر تقدیرات موثوقة عن أفراد الأسر المعیشیة القطریة، وكذلك تقدیم
تقدیرات موثوقة لأفراد الأسر المعیشیة غیر القطریة.
A domain is any subset of the population for which separate estimates are planned in the survey design. The survey aims to provide reliable estimates for Qatari and non-Qatari populations separately.
: Sample Sizeحجم العینة :
حجم العینة المستھدفة یقدر بحوالي 9200 أسرة معیشیة للعام الكامل حیث یتم تغطیة ربع العینة الكلیة في كل فصل.
The target sample size for the whole year is around 9200 households out of which forth will be covered in each quarter.
تتاح النتائج الفصلیة في موقع جھاز التخطیط والإحصاء ، ولن تتضمن بیانات البلدیة. أما النتائج السنویة فستكون متاحة في وسائل النشر وسوف تشمل بیانات البلدیة .على أمل أن
یتم توفیر البیانات الفصلیة في الوقت المناسب لمستخدمي البیانات ومتخذي القرار.
The quarterly results are made available only on the Planning and Statistics Authority website and will not include municipal data. Annual results will be made available in a publication and will include municipal data. It is hoped quarterly results will provide timely information for data users and decision makers.
: Data Collectionجمع البیانات :
قسمت العینة الى أجزاء متساویة یتم تجمیعھا كل شھر ، یتم جمع 3/1 البیانات الفصلیة في أول أسبوعین من كل شھر .ثم ترمیز البیانات ومراجعتھا في الأسبوعین التالیین من الشھر،
وبعد ذلك تجمع بیانات الشھور الثلاثة لاستخراج النتائج الفصلیة.
The sample was divided into equal parts to collect data monthly. Each month 1/3 of the quarterly data were collected during the first two weeks of the month. The data were coded and reviewed during the following two weeks and all three months were totalled to produce quarterly results.
: Resultsالنتائج :

- 8 - LF_Q4_2019_AE-2020
( Q4 2018 .. Q4 2019 ) شكل 1/ تطور أعداد السكان حسب الجنس خلال الفترةFigure 1/ Evolution of the Population by Sex, during (Q4 2018 .. Q4 2019)
Executive Summaryملخص تنـفـیـذي
Population increased by 3.8% as compared to the Q3 2019ارتفع عدد السكان بنسبة 3.8% عن الربع الثالث 2019
ارتفع إجمالي السكان في الربع الرابع من العام 2019 قرابة 102 ألف نسمة ، وبنسبة %3.8
عن إجمالي السكان في الربع الثالث من العام 2019. وارتفع عدد الإناث قرابة 7 آلاف نسمة
وبنسبة 1.1% عن إجمالي الإناث في الربع الثالث 2019 أما الذكور فقد ارتفع عددھم قرابة
95 ألف نسمة وبنسبة 4.7% عن إجمالي الذكور في الربع الثالث 2019.
وبمقارنة أعداد السكان في الربع الرابع 2019 مع ذات الفترة من العام الماضي ، تُظھر النتائج
ارتفاعاً في إجمالي السكان قرابة 42 ألف ، وقد بلغت نسبة الارتفاع للذكور 2.8% عن الربع
الرابع من 2018 ، أما الإناث فقد انخفضت نسبتھم في الربع الرابع 2019 عن نفس الربع
للسنة الماضیة بمقدار %2.3.
Total population increased in the fourth quarter of 2019 by some 102 thousand people, increased by 3.8% compared to the total population in the third quarter of 2019. Females number increased by 7 thousand people, by 1.1% of the total female population compared to Q3 2019, while males increased by 95 thousand people, increased by 4.7% as compared to total male population in the third quarter 2019.Comparing the numbers of population in Q4 of 2019 with the same period last year, the results show an increase in the total population of about 42 thousand people. Males have increased by 2.8% compared to Q4 of 2018, while females have decreased in Q4 of 2019 by 2.3% compared to the same quarter in 2018.
2051 2092 2022 2013 2108
668 688 639 646 653
2719 2780 2661 2659
۲۷٦۰
0
500
1000
1500
2000
2500
3000
Q4 Q1 Q2 Q3 Q4
Quarters ۲۰۱۹أرباع Quarters ۲۰۱۸أرباع
Tho
usan
ds
ف
لأل با
Totalمجموع Femalesإناث Malesذكور

- 9 - LF_Q4_2019_AE-2020
( Q4 2018 .. Q4 2019 ) شكل 2/ تطور أعداد النشیطین اقتصادیاً حسب الجنسیة خلال الفترةFigure 2 / Evolution of the Economically Active by Nationality, during ( Q4 2018 .. Q4 2019 )
Economically-active population increased by 3.6%ارتفع عدد النشیطین اقتصادیاً بنسبة %3.6
ارتفعت أعداد السكان النشیطون اقتصادیاً في الربع الرابع من العام 2019 قرابة 75 ألف
فرد بنسبة 3.6% عن الربع الثالث 2019 ، ومعظمھم من الأفراد غیر القطریین حیث ارتفع
العدد بنسبة 3.8% عن الربع الثالث 2019.
ارتفع السكان القطریون النشیطون اقتصادیاً خلال الربع الرابع 2019 قرابة 679 فرد
وبنسبة 0.6% عن الربع الثالث 2019.
The number of economically active population rose during Q4 of 2019 by 75 thousand people (3.6%) compared to Q3 of 2019 - most of them are non-Qataris. The number of non-Qatari economically active population increased by 3.8% compared to the third quarter 2019.The number of Qatari economically active population rose during Q4 of 2019 by 679 people, a 0.6% increase compared to the third quarter 2019.
107 108 109 109 110
1986 2043 1943 1948 2022
2093 2151 2052 2057 2132
0
500
1000
1500
2000
2500
3000
Q4 Q1 Q2 Q3 Q4
Quarters ۲۰۱۹أرباع Quarters ۲۰۱۸أرباع
Tho
usan
ds
ف
لأل با
Totalمجموع Non-Qatariغیر قطریین Qatariقطریون
- 10 - LF_Q4_2019_AE-2020
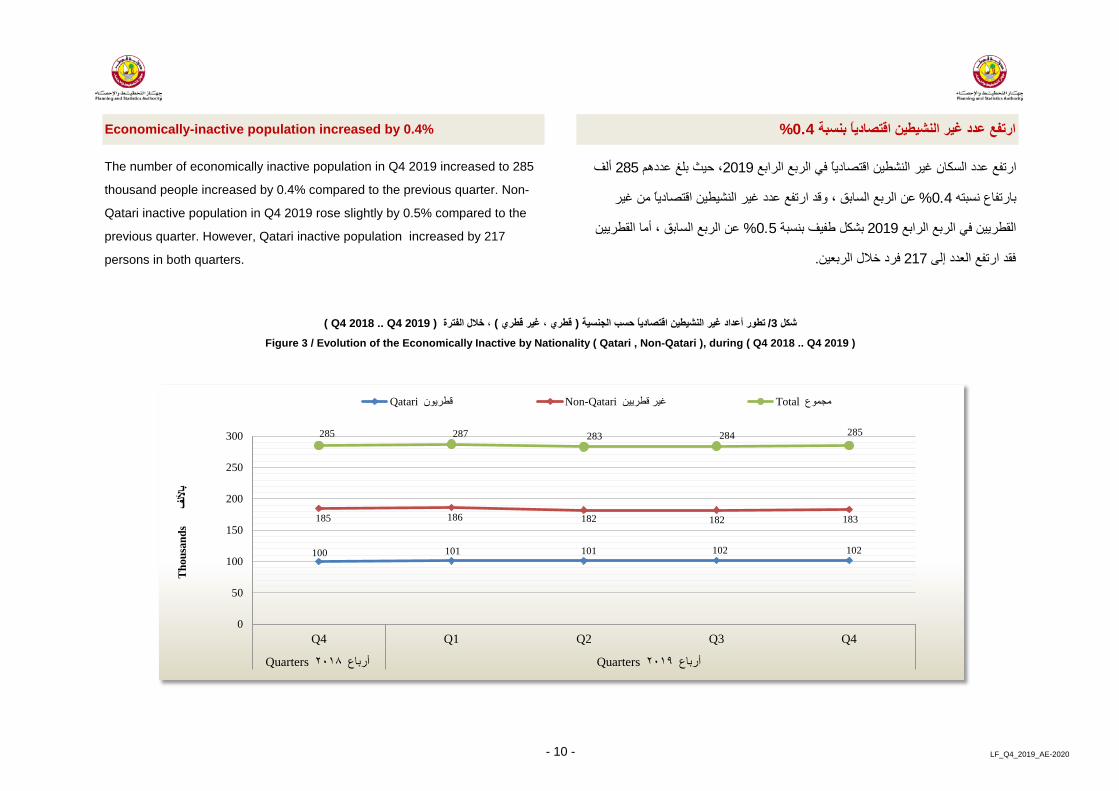
( Q4 2018 .. Q4 2019 ) شكل 3/ تطور أعداد غیر النشیطین اقتصادیاً حسب الجنسیة ( قطري ، غیر قطري ) ، خلال الفترةFigure 3 / Evolution of the Economically Inactive by Nationality ( Qatari , Non-Qatari ), during ( Q4 2018 .. Q4 2019 )
Economically-inactive population increased by 0.4%ارتفع عدد غیر النشیطین اقتصادیاً بنسبة %0.4
ارتفع عدد السكان غیر النشطین اقتصادیاً في الربع الرابع 2019، حیث بلغ عددھم 285 ألف
بارتفاع نسبتھ 0.4% عن الربع السابق ، وقد ارتفع عدد غیر النشیطین اقتصادیاً من غیر
القطریین في الربع الرابع 2019 بشكل طفیف بنسبة 0.5% عن الربع السابق ، أما القطریین
فقد ارتفع العدد إلى 217 فرد خلال الربعین.
The number of economically inactive population in Q4 2019 increased to 285
thousand people increased by 0.4% compared to the previous quarter. Non-
Qatari inactive population in Q4 2019 rose slightly by 0.5% compared to the
previous quarter. However, Qatari inactive population increased by 217
persons in both quarters.
100 101 101 102 102
185 186 182 182 183
285 287 283 284 285
0
50
100
150
200
250
300
Q4 Q1 Q2 Q3 Q4
Quarters ۲۰۱۹أرباع Quarters ۲۰۱۸أرباع
Tho
usan
ds
ف
لأل با
Totalمجموع Non-Qatariغیر قطریین Qatariقطریون

- 11 - LF_Q4_2019_AE-2020* معدل البطالة : نسبة المتعطلین عن العمل إلى القوى العاملة من السكان.
*Unemployment rate: Ratio of unemployed persons to the labor force population.
وصل عدد الباحثین عن عمل في دولة قطر حسب تعریف منظمة العمل الدولیة 2,580 شخصاً في الربع الرابع من العام 2019، بلغت نسبة الذكور منھم 43.2% و بینما بلغت نسبة الإناث 56.7%، لیستقر معدل البطالة على 0.1% من الربع الرابع 2018 وحتى الربع الرابع للعام
.2019أما على مستوى الجنس فقد بلغ المعدل 0.1% للذكور مقابل 0.5% للإناث خلال الربع الرابع
2019. وبلغ معدل البطالة للقطریین 0.5%، بواقع 0.2% للذكور ، و 1.1% للإناث. وسُجلت أعلى معدلات بطالة لإجمالي المتعطلین في الفئة العمریة (15- 24) سنة حیث بلغت
0.5% في الربع الرابع 2019.
The number of job seekers in Qatar, according to ILO definition, reached 2,580 people in Q4, 2019, accounting for 43.2% were males and 56.7% were females. The unemployment rate settled at 0.1% from Q4, 2018 to Q4, 2019. According to gender, the rate reached 0.1% for males versus 0.5% for females during Q4, 2019. The unemployment rate for Qataris reached at 0.5%, of which 0.2% were males and 1.1% were females. The highest unemployment rates of the total unemployed in the age group (15-24 years) were recorded and reached 0.5% in Q4, 2019.
The Number of Salaried Workers increased by 3.5%ارتفع عدد المشتغلین بأجر بنسبة 3.5%
ارتفع عدد المشتغلین بأجر في السوق القطري من 2,050,052 مشتغلاً بأجر في الربع الثالث 2019 لیصبح 2,122,136 مشتغلاً بأجر في الربع الرابع 2019، حیث بلغت نسبة المشتغلین
بأجر من الذكور 86.7%، مقابل 13.3% من الإناث. وقد بلغ متوسط الأجر الشھري للمشتغلین بأجر 11,351 ریالاً قطریاً، حیث بلغ المتوسط للذكور 11,818 ریالاً قطریاً، مقابل
10,287 ریالاً قطریاً للإناث.
The number of salaried workers in the Qatari market increased from
2,050,052 workers in Q3, 2019 to 2,122,136 workers in Q4, 2019 accounting
for 86.7% males versus 13.3% females. The average monthly wage of
salaried workers reached QR 11,351, accounting for QR 11,818 for males,
compared to QR 10,287 for females.
Unemployment Rate Among Participants in Labor Force Reached 0.1%بلغ معدل البطالة من بین المشاركین في القوى العاملة 0.1%
Labor force participation rate among individuals aged 15 years andبلغت نسبة المشاركة في القوى العاملة بین الأفراد 15 سنة فأكثر 88.2%above reached 88.2%
أظھرت نتائج مسح القوى العاملة بالعینة للربع الرابع 2019 الذي نفذه جھاز التخطیط والإحصاء أن عدد المشاركین في القوى العاملة ارتفع من 2,057,219 عاملاً للربع الثالث من
العام 2019 إلى 2,131,861 عاملاً للربع الرابع 2019، حیث بلغت نسبة الذكور منھم 86.7% ، مقابل 13.3% للإناث.
وتشیر البیانات إلى أن معدل المشاركة الاقتصادیة للسكان (15 سنة فأكثر) بلغ 88.2%، حیث كانت بالنسبة للذكور 95.9%، مقابل 57.9% للإناث. وتمثل الفئة العمریة (25 - 34 سنة) من السكان أعلى معدل للمشاركة الاقتصادیة بنسبة 94.2% وفقا لتلك البیانات. في حین بلغ
معدل الإعالة الاقتصادیة 29.6% لھذا الربع.وتشیر النتائج إلى أن معدل المشاركة الاقتصادیة للقطریین بلغ 51.8% من مجموع السكان القطریین بعمر 15 سنة فأكثر. حیث تمثل مشاركة الذكور القطریون 67.0% من إجمالي
الذكور القطریین 15 سنة فأكثر، وتمثل الإناث القطریات 37.1% من إجمالي الإناث القطریات 15 سنة فأكثر.
The results of the Labor Force Sample Survey for Q4 2019, conducted by the Planning and Statistics Authority, showed an increased in the number of participants in labor force from 2,057,219 workers in Q3, 2019 to 2,131,861 workers in Q4, 2019, accounting for 86.7% males versus 13.3% females.The data indicates that the economic participation of the population aged (15 years and above) reached at 88.2%, accounting for 95.9% for males versus 57.9% for females. According to the same data, the age group (25-34 years) of the population represented the highest rate of economic participation with 94.2%, while the economic dependency rate reached at 29.6% for that quarter. The results indicate that the economic participation rate of Qataris reached 51.8% of the total Qatari population aged 15 years and above, Where Qatari males represent 67.0% of the total Qatari males aged 15 years and over and Qatari females represent 37.1% of the total Qatari females aged 15 years and over.

- 12 - LF_Q4_2019_AE-2020
Table No. (1)جدول رقم (1)
غیر النشیطین اقتصادیاًالمشتغلونالنشیطون اقتصادیاًالسكان (15 سنة فأكثر)السكانPopulationPopulation
(15 Years & above)Economically ActiveEmployedEconomically
Inactive
2,107,6501,926,7051,847,8601,846,74578,845Malesذكور
652,691490,556284,001282,536206,555Femalesإناث
2,760,3412,417,2612,131,8612,129,281285,400Totalالمجموع
السكان والقوى العاملة حسب الجنس Population and Labor Force by Sex
مسح القوى العاملة بالعینة - الربع الرابع 2019Labor Force Sample Survey - The fourth quarter of 2019
العلاقة بقوة العمل
الجنس
Relation to labor force sex

- 13 - LF_Q4_2019_AE-2020
Table No. (2)
مشتغلEmployed
متعطل لم یسبق لھ العمل Seeking Work forfirst time
متعطل سبق لھ العمل
Unemployed with
previousemployment
المجموعTotal
التفرغ لأعمال المنزل
Homemaker
متفرغ للدراسةStudent
عاجزDisabled
متقاعدRetired
أخرىOther
المجموعTotal
69,360858569,530020,4001,36011,0501,44534,255103,785Malesذكور
39,610425040,03529,41027,3702,1256,5452,38067,830107,865Femalesإناث
108,97051085109,56529,41047,7703,48517,5953,825102,085211,650Totalمجموع
1,777,38594501,778,330040,6151,04002,93544,5901,822,920Malesذكور
242,926780260243,966103,50530,9951,55002,675138,725382,691Femalesإناث
2,020,3111,7252602,022,296103,50571,6102,59005,610183,3152,205,611Totalمجموع
1,846,7451,030851,847,860061,0152,40011,0504,38078,8451,926,705Malesذكور
282,5361,205260284,001132,91558,3653,6756,5455,055206,555490,556Femalesإناث
2,129,2812,2353452,131,861132,915119,3806,07517,5959,435285,4002,417,261Totalمجموع
Qatari قطریون
جدول رقم (2)
Totalالمجموع
Non-Qatariغیر قطریین
السكان (15 سنة فأكثر) حسب العلاقة بقوة العمل والجنسیة والجنسPopulation (15 years and above) by Relation to Labor Force, Nationality & Sex
Labor Force Sample Survey - The fourth quarter of 2019
الجنسیة
مسح القوى العاملة بالعینة - الربع الرابع 2019
الجنس
النشیطون اقتصادیاًEconomically Active
غیر النشیطین اقتصادیاًEconomically Inactive
المجموع العام Grand
TotalSexNationality

- 14 - LF_Q4_2019_AE-2020
شكل (1) / السكان (15سنة فأكثر) النشیطون وغیر النشیطین اقتصادیاً حسب الجنسیة والجنسFigure (1) / Population (15 years and above) Economically Active/Inactive by Nationality & Sex
مسح القوى العاملة بالعینة - الربع الرابع 2019Labor Force Sample Survey - The fourth quarter of 2019
��%
��%
317�7��} �1�£�}Qatari Males
7 #5Active
7 #5 �7�Inactive
��%
��%
~ *7�7��} �*5³ }Qatari Females
~ *7 7#5Active
~ *7 7#5 �7�Inactive
��%
�%
377�7��} �7� �1�£�}Non-Qatari Males
7 #5Active
7 #5 �7�Inactive ��%
��%
~ *7�7��} �7� �*5³ }Non-Qatari Females
~ *7 7#5Active
~ *7 7#5 �7�Inactive

- 15 - LF_Q4_2019_AE-2020
شكل (2) / القطریون (15سنة فأكثر) غیر النشیطین اقتصادیاً وأسبابھ حسب الجنسFigure (2) / Qatari (15 years and above) Economically Inactive by Reason & Sex
مسح القوى العاملة بالعینة - الربع الرابع 2019Labor Force Sample Survey - The fourth quarter of 2019
20,400
1,360
11,050
1,445
0
5,000
10,000
15,000
20,000
25,000
�̂}�$�� 9��"1 Student
¥℗*7 Disabled
$7*�"1 Retired
3 �$} Other
غیر النشیطین اقتصادیاً وأسبابھ) سنة فأكثر ۱٥( الذكور القطریون Qatari males age (15+) economically inactive by Reason
29,410 27,370
2,125
6,545
2,380
0
5,000
10,000
15,000
20,000
25,000
30,000
35,000
�*17¹ �̂ ��"�}�¥51�}
Homemaker
�̂}�$�� 9��"1 Student
¥℗*7 Disabled
$7*�"1 Retired
3 �$} Other
غیر النشیطات اقتصادیاً وأسبابھ) سنة فأكثر ۱٥( الإناث القطریات Qatari females age (15+) economically inactive by Reason

- 16 - LF_Q4_2019_AE-2020
Table No. (3)جدول رقم (3)
العلاقة بقوة العمل
فئات العمر
النشیطون اقتصادیاًEconomically Active
غیر النشیطین اقتصادیاً Economically Inactive
المجموع الكليGrand Total
Relation to labor force
Age Groups
24 - 15276,034119,050395,08415 - 24
34 - 25797,37549,010846,38525 - 34
44 - 35661,58645,340706,92635 - 44
54 - 45307,80630,550338,35645 - 54
+5589,06041,450130,51055 +
2,131,861285,4002,417,261Totalالمجموع
مسح القوى العاملة بالعینة - الربع الرابع 2019Labor Force Sample Survey - The fourth quarter of 2019
السكان (15 سنة فأكثر) حسب العلاقة بقوة العمل وفئات العمرPopulation (15 years & above) by Relation to Labor Force & Age groups

- 17 - LF_Q4_2019_AE-2020
Table No. (4)جدول رقم (4)
العلاقة بقوة العمل
فئات العمر
النشیطون اقتصادیاًEconomically Active
غیر النشیطین اقتصادیاً Economically Inactive
المجموع الكليGrand Total
Relation to labor force Age Groups
24 - 15235,49757,830293,32715 - 24
34 - 25692,0173,525695,54225 - 34
44 - 35566,8501,290568,14035 - 44
54 - 45272,0361,540273,57645 - 54
+5581,46014,66096,12055 +
1,847,86078,8451,926,705Totalالمجموع
الذكور من السكان (15 سنة فأكثر) حسب العلاقة بقوة العمل وفئات العمرMales Population (15 years & above) by Relation to Labor Force & Age groups
مسح القوى العاملة بالعینة - الربع الرابع 2019Labor Force Sample Survey - The fourth quarter of 2019

- 18 - LF_Q4_2019_AE-2020
Table No. (5)جدول رقم (5)
العلاقة بقوة العمل
فئات العمر
النشیطات اقتصادیاًEconomically Active
غیر النشیطات اقتصادیاً Economically Inactive
المجموع الكليGrand Total
Relation to labor force Age Groups
24 - 1540,53761,220101,75715 - 24
34 - 25105,35845,485150,84325 - 34
44 - 3594,73644,050138,78635 - 44
54 - 4535,77029,01064,78045 - 54
+557,60026,79034,39055 +
284,001206,555490,556Totalالمجموع
الإناث من السكان (15 سنة فأكثر) حسب العلاقة بقوة العمل وفئات العمرFemales Population (15 years & above) by Relation to Labor Force & Age groups
مسح القوى العاملة بالعینة - الربع الرابع 2019Labor Force Sample Survey - The fourth quarter of 2019

- 19 - LF_Q4_2019_AE-2020
Table No. (6)جدول رقم (6)
المجموعإناثذكورالمجموعإناثذكورالمجموعإناثذكورMalesFemalesTotalMalesFemalesTotalMalesFemalesTotal
24 - 1513,3456,20519,550221,63733,472255,109234,98239,677274,65915 - 24
34 - 2522,69515,64038,335668,97789,373758,350691,672105,013796,68525 - 34
44 - 3516,06510,79526,860550,61583,941634,556566,68094,736661,41635 - 44
54 - 4512,4955,95018,445259,54129,820289,361272,03635,770307,80645 - 54
+554,8451,0205,86576,6156,58083,19581,4607,60089,06055 +
69,44539,610109,0551,777,385243,1862,020,5711,846,830282,7962,129,626Totalالمجموع
Not including persons seeking work for the first timeلا یشمل المتعطلین الذین لم یسبق لھم العمل
مسح القوى العاملة بالعینة - الربع الرابع 2019
السكان النشیطون اقتصادیا (15 سنة فأكثر) حسب الجنسیة والجنس وفئات العمرEconomically Active Population (15 years & above) by Nationality, Sex & Age groups
Labor Force Sample Survey - The fourth quarter of 2019
الجنسیة والجنس
فئات العمر
قطریونQatari
غیر قطریینNon-Qatari
المجموعTotal Nationality &
sex
Age Groups

- 20 - LF_Q4_2019_AE-2020
Table No. (7)جدول رقم (7)
Totalالمجموع
Workers in Paid Employment are those whose status in employment = paid employment ** المشتغلون بأجر ھم الذین تكون حالتھم العملیة = یعمل بأجر
متوسط الأجر الشھري Average Monthly
Wage
متوسط الأجر الشھري Average Monthly
Wage
المشتغلون بأجر Paid Employment
Workers
10,287 282,366 1,839,770
المشتغلون بأجر Paid Employment
Workers
2,122,13611,351
متوسط الأجر الشھري Average Monthly
Wage
11,818
المشتغلون بأجر Paid Employment
Workers
المشتغلون بأجر ( 15 سنة فأكثر ) حسب الجنس ومتوسط الأجر الشھري ( بالریال القطري )Workers in Paid Employment ( 15 Years And Above )* By Sex And Average Monthly Wage (Q.R)
مسح القوى العاملة بالعینة - الربع الرابع 2019Labor Force Sample Survey - The fourth quarter of 2019
ذكــــــــــــــــــــــورMales
إنـــــــــــــاثFemales
المجمــــــــــــوعTotal

- 21 - LF_Q4_2019_AE-2020
Table No. (8)جدول رقم (8)
المجموعإناثذكورالمجموعإناثذكورالمجموعإناثذكورMalesFemalesTotalMalesFemalesTotalMalesFemalesTotal
24 - 151703405104305209506008601,46015 - 24
34 - 250858534526060534534569025 - 34
44 - 3500017026043017026043035 - 44
1704255959451,0401,9851,1151,4652,580Totalالمجموع
المتعطلون (15 سنة فأكثر) حسب الجنسیة والجنس وفئات العمرUnemployed (15 years & above) by Nationality, Sex & Age groups
مسح القوى العاملة بالعینة - الربع الرابع 2019Labor Force Sample Survey - The fourth quarter of 2019
الجنسیة والجنس
فئات العمر
قطریونQatari
غیر قطریینNon-Qatari
المجموعTotal Nationality &
sex
Age Groups

- 22 - LF_Q4_2019_AE-2020
Table No. (9)جدول رقم (9)
عدد تكرارالذكــور
عدد تكرارالإنــاث
مجموعالتكرارات
عدد تكرارالذكــور
عدد تكرارالإنــاث
مجموعالتكرارات
عدد تكرارالذكــور
عدد تكرارالإنــاث
مجموعالتكرارات
No. OfRepetition
No. OfRepetition
No. OfRepetition
No. OfRepetition
No. OfRepetition
No. OfRepetition
No. OfRepetition
No. OfRepetition
MalesFemalesTotalMalesFemalesTotalMalesFemalesTotal
00026002602600260
0008526034585260345
858517085260345170345515
8585170260260520345345690
8585170255260515340345685
85851708508517085255
0008508585085
0858500008585
3404257651,1151,0402,1551,4551,4652,920
1704255959451,0401,9851,1151,4652,580
Dischargedاستغناء من جھة العمل
Lack of Adequate Academicعدم وجود مؤھلات علمیة مناسبةQualifications
Search for a Better Job
Low Wageقلة الأجر
Lack of Experienceنقص الخبرة
Lack of Suitable Workعدم وجود العمل المناسب
البحث عن عمل أفضل
Total personsمجموع الأفراد
مجموع التكرار(یمكن أن یكون أكثر من واحد)
Total Repetitions(could be more than 1)
Othersأخرى
Lack of Job Opportunitiesقلة فرص العمل
المتعطلون (15 سنة فأكثر) حسب الجنسیة والجنس وسبب التعطلUnemployed (15 years & above) by nationality, sex and reasons of unemployment
مسح القوى العاملة بالعینة - الربع الرابع 2019Labor Force Sample Survey - The fourth quarter of 2019
قطريQatari
غیر قطريNon - Qatari
المجموعTotal
Reasons for unemployment أسباب التعطل

- 23 - LF_Q4_2019_AE-2020
شكل (3) / المتعطلون (15 سنة فأكثر) حسب الجنسیة وسبب التعطلFigure (3) / Unemployed (15 years & above) by Nationality and Reasons of Unemployment
مسح القوى العاملة بالعینة - الربع الرابع 2019Labor Force Sample Survey - The fourth quarter of 2019
�18�} � �� �̂� Lack of Job
Opportunities
�℗¹ } �̂� Low Wage
��§$�} � �5 Lack of
Experience
�17 37 �° §�}�5 �}
Search for a Better Job
�18�} $1℗1 �$7† �*51�}
Lack of Suitable Work
~ ⁶ 9� 1 $1℗1 �$7§̂�*51 7̂1�7 Lack of
Adequate Academic
Qualifications
0̂℗ 31 �*5�"�}�18�}
Discharged
3 �$} Others
5 �7 � �7� Non-Qatari 260 345 345 520 515 85 85 0
5 �7 � Qatari 0 0 170 170 170 170 0 85
0
100
200
300
400
500
600

- 24 - LF_Q4_2019_AE-2020
شكل (4) / القطریون المتعطلون (15 سنة فأكثر) حسب الجنس وسبب التعطلFigure (4) / Qatari Unemployed Persons (15 years & above) by Sex and Reasons of Unemployment
مسح القوى العاملة بالعینة - الربع الرابع 2019Labor Force Sample Survey - The fourth quarter of 2019
�18�} � �� �̂� Lack of Job
Opportunities
�℗¹ } �̂� Low Wage
��§$�} � �5 Lack of
Experience
�5 �} �17 37 �° §�} Search for a Better Job
�18�} $1℗1 �$7† �*51�}
Lack of Suitable Work
~ ⁶ 9� 1 $1℗1 �$7§̂�*51 7̂1�7
Lack of Adequate Academic
Qualifications
�18�} 0̂℗ 31 �*5�"�} Discharged
3 �$} Others
�1�£ Males 0 0 85 85 85 85 0 0
�*5} Females 0 0 85 85 85 85 0 85
0
10
20
30
40
50
60
70
80
90

- 25 - LF_Q4_2019_AE-2020
جدول رقم (10)
ذكورMales
اناثFemales
المجموعTotal
ذكورMales
اناثFemales
المجموعTotal
ذكورMales
اناثFemales
المجموعTotal
85255340345260605430515945
851702553455208654306901,120
000255260515255260515
1704255959451,0401,9851,1151,4652,580
Table No. (10)
المتعطلون (15 سنة فأكثر) حسب الجنسیة والجنس ومدة البحث عن عمل بالشھور Unemployed Persons (15 years & above) by Nationality, Sex and Duration of Employment Search in Months
مسح القوى العاملة بالعینة - الربع الرابع 2019Labor Force Sample Survey - The fourth quarter of 2019
مدة البحث عنعمل بالشھور
قطريQatari
غیر قطريNon-Qatari
المجموعTotal
Duration of Employment Search in Months
07-12 months
13+ months
أقل من 7 شھر
Total المجموع
Less than 7 month
13+ شھر
07 - 12 شھر

- 26 - LF_Q4_2019_AE-2020
شكل (5) / المتعطلون (15 سنة فأكثر) حسب الجنسیة والجنس ومدة البحث عن عمل بالشھورFigure (5) / Unemployed Persons (15 years & above) by Nationality, Sex and Duration of Employment Search in Months
مسح القوى العاملة بالعینة - الربع الرابع 2019Labor Force Sample Survey - The fourth quarter of 2019
0 0
255 260
85
170
345
520
85
255
345
260
0
100
200
300
400
500
600
Femalesإناث Malesذكور Femalesإناث Malesذكور
Non-Qatariغیر قطري Qatariقطري
شھر+ ۱۳۱۳ +months
شھر ۱۲ -۰۷۰۷-۱۲ months
أشھر ۷أقل من Less than 7 month

- 27 - LF_Q4_2019_AE-2020
Table No. (11)جدول رقم (11)
ذكورنوع التدریبMales
إناثFemales
المجموعTotalType of Training
85170255English languageاللغة الإنجلیزیة
85170255Computerحاسب آلي
مجموع الدورات( یمكن أن تكون أكثر من دورة )
170340510Total classes(could be more than 1)
85170255Total personsمجموع الأفراد
Labor Force Sample Survey - The fourth quarter of 2019
المتعطلون القطریون (15 سنة فأكثر) الحاصلون على الثانویةوملتحقون بالدورات التدریبیة حسب الجنس ونوع التدریب
Qatari Unemployed Persons (15 years & above) with Secondary Educationwho Attended Training Program by Sex and Type of Training
مسح القوى العاملة بالعینة - الربع الرابع 2019

- 28 - LF_Q4_2019_AE-2020
Table No. (12)جدول رقم (12)
المجموعإناثذكورMalesFemalesTotal
85085Willingراغـــــــــــــــب
85425510Not Willingغیــــــر راغــــــــــــــب
170425595Totalالمجموع
المتعطلون القطریون (15 سنة فأكثر) حسب الجنس والرغبة للعمل فى القطاع الخاصQatari Unemployed Persons (15 years & above) by Sex & Willingness to Work In Private Sector
مسح القوى العاملة بالعینة - الربع الرابع 2019Labor Force Sample Survey - The fourth quarter of 2019
الجنس
الرغبة للعمل فى القطاع الخاص
sexWillinginess To Work In Private Sector

- 29 - LF_Q4_2019_AE-2020
شكل (6) / المتعطلون القطریون (15 سنة فأكثر) الحاصلون على الثانویةوملتحقون بالدورات التدریبیة حسب الجنس ونوع التدریب
Figure (6) / Qatari Unemployed Persons (15 years & above) with Secondary Educationwho Attended Training Program by Sex and Type of Training
مسح القوى العاملة بالعینة - الربع الرابع 2019Labor Force Sample Survey - The fourth quarter of 2019
85 85
170 170
0
20
40
60
80
100
120
140
160
180
7̂¥7�℗5³ } �̂��} English language
6�] † �*° Computer
�1�£Males �*5�Females

- 30 - LF_Q4_2019_AE-2020
شكل (7) / المتعطلون القطریون (15 سنة فأكثر) حسب الجنس والرغبة للعمل في القطاع الخاصFigure (7) / Qatari Unemployed Persons (15 years & above) by Sex and Willingness to Work in Private Sector
مسح القوى العاملة بالعینة - الربع الرابع 2019Labor Force Sample Survey - The fourth quarter of 2019
0
85
425
85
0
50
100
150
200
250
300
350
400
450
�*5� Females
�1�£ Males
† � }�Willing † � }� �7�Not Willing

- 31 - LF_Q4_2019_AE-2020
Table No. (13)جدول رقم (13)
مجموع التكرارات
No. Of RepetitionTotal
170Low wageقلة الأجـــــور
85Hours of workساعات الدوام
170Days of workأیــام العمــــل
170Social Statusالوضع الاجتماعي
مجموع التكرار( ممكن ان تكون اكثر من واحدة )
595Total repetitions(could be more than 1)
255Total personsمجموع الأفراد
المتعطلون القطریون (15 سنة فأكثر) الحاصلون على الثانویة وأسباب عدم الرغبة للعمل في القطاع الخاصQatari Unemployed (15 years & above) With Secondary Education not Willing to Work in Private Sector by Reasons
مسح القوى العاملة بالعینة - الربع الرابع 2019Labor Force Sample Survey - The fourth quarter of 2019
أسباب عدم الرغبة للعمل فيالقطاع الخاص
Reasons for not willing to workin private sector
- 32 - LF_Q4_2019_AE-2020
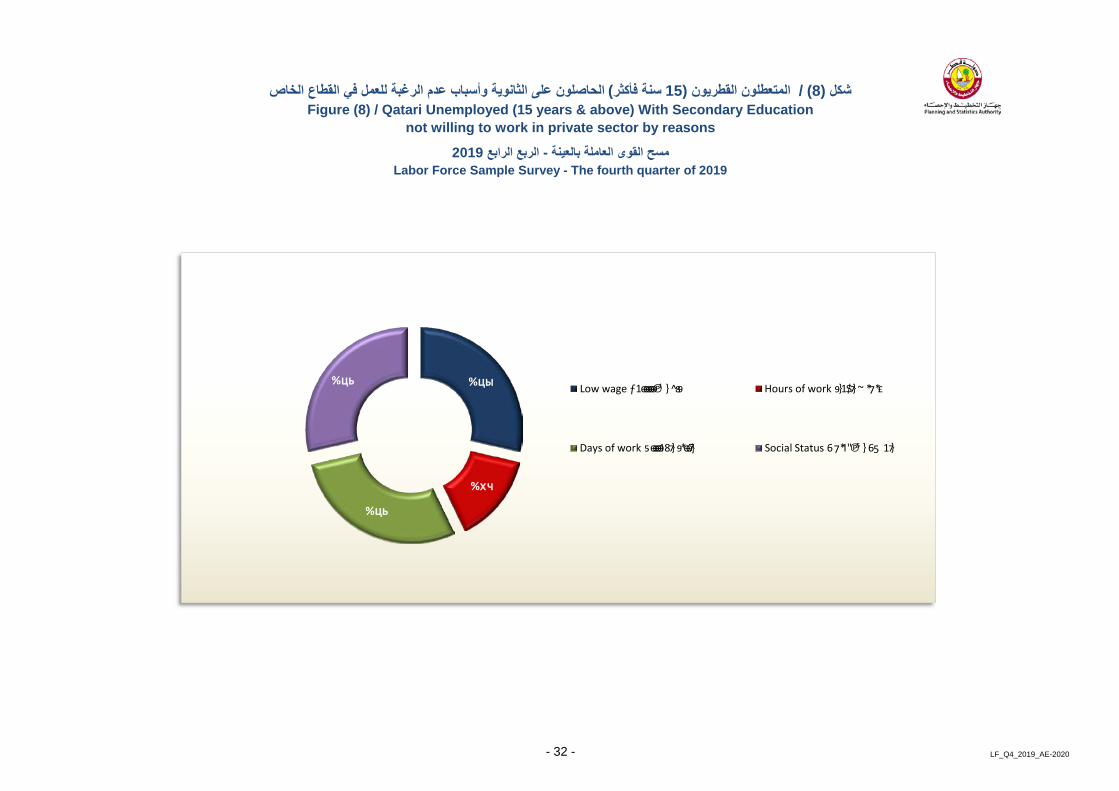
شكل (8) / المتعطلون القطریون (15 سنة فأكثر) الحاصلون على الثانویة وأسباب عدم الرغبة للعمل في القطاع الخاصFigure (8) / Qatari Unemployed (15 years & above) With Secondary Education
not willing to work in private sector by reasons
مسح القوى العاملة بالعینة - الربع الرابع 2019Labor Force Sample Survey - The fourth quarter of 2019
��%
��%
��%
��% �1�����℗¹ } �̂�Low wage �}1$�} ~ *7*�Hours of work
�����18�} �*��7}Days of work 67*1"℗⁵ } 65 1�}Social Status

- 33 - LF_Q4_2019_AE-2020
Table No. (14)جدول رقم (14)
المجموعإناثذكورالمجموعإناثذكورالمجموعإناثذكورMalesFemalesTotalMalesFemalesTotalMalesFemalesTotal
24 - 1519,29527,28546,58038,53533,93572,47057,83061,220119,05015 - 24
34 - 251,36010,28511,6452,16535,20037,3653,52545,48549,01025 - 34
44 - 355105,6106,12078038,44039,2201,29044,05045,34035 - 44
54 - 451,0209,18010,20052019,83020,3501,54029,01030,55045 - 54
+ 5512,07015,47027,5402,59011,32013,91014,66026,79041,45055 +
34,25567,830102,08544,590138,725183,31578,845206,555285,400Totalالمجموع
السكان غیر النشیطین اقتصادیاً (15 سنة فأكثر) حسب الجنسیة والجنس وفئات العمرEconomically Inactive Population (15 years & above) by Nationality, Sex & Age groups
مسح القوى العاملة بالعینة - الربع الرابع 2019Labor Force Sample Survey - The fourth quarter of 2019
الجنسیة والجنس
فئات العمر
قطریونQatari
غیر قطریینNon-Qatari
المجموعTotal Nationality &
sex Age Groups

- 34 - LF_Q4_2019_AE-2020
شكل (9) / السكان غیر النشیطین اقتصادیاً (15 سنة فأكثر) حسب الجنسیة وفئات العمرFigure (9) / Economically Inactive Population (15 years & above) by Nationality and Age groups
مسح القوى العاملة بالعینة - الربع الرابع 2019Labor Force Sample Survey - The fourth quarter of 2019
46,580
11,645
6,120
10,200
27,540
72,470
37,365 39,220
20,350
13,910
0
10,000
20,000
30,000
40,000
50,000
60,000
70,000
80,000
�� - �� �� - �� �� - �� �� - �� ��+
5 �7 �Qatari 5 �7 � �7�Non-Qatari

- 35 - LF_Q4_2019_AE-2020
شكل (10) / القطریون غیر النشیطین اقتصادیاً (15 سنة فأكثر) حسب الجنس وفئات العمرFigure (10) / Qatari Economically Inactive (15 years & above) by Sex and Age groups
مسح القوى العاملة بالعینة - الربع الرابع 2019Labor Force Sample Survey - The fourth quarter of 2019
19,295
1,360 510 1,020
12,070
27,285
10,285
5,610
9,180
15,470
0
5,000
10,000
15,000
20,000
25,000
30,000
�� - �� �� - �� �� - �� �� - �� ��+
�1�£Males �*5�Females

- 36 - LF_Q4_2019_AE-2020
Table No. (15)جدول رقم (15)
ذكورMales
إناثFemales
المجموعTotal
ذكورMales
إناثFemales
المجموعTotal
ذكورMales
إناثFemales
المجموعTotal
5102,2952,8052609501,2107703,2454,015
4,1655,95010,115858,9008,9854,25014,85019,100
3,6556,88510,5405,45513,68019,1359,11020,56529,675
8,41516,32024,73516,28522,15038,43524,70038,47063,170
11,56018,02029,58018,52547,23065,75530,08565,25095,335
1,5303,1454,6755156,8407,3552,0459,98512,030
4,42015,21519,6353,46538,97542,4407,88554,19062,075
34,25567,830102,08544,590138,725183,31578,845206,555285,400 Totalالمجموع
Illiterateأمي
یقرأ ویكتب
Diplomaدبلوم
University and aboveجامعي فما فوق
السكان غیر النشیطین اقتصادیاً (15 سنة فأكثر) حسب الجنسیة والجنس والحالة التعلیمیةEconomically Inactive Population (15 years & above) by Nationality, Sex and Educational Attainment
مسح القوى العاملة بالعینة - الربع الرابع 2019Labor Force Sample Survey - The fourth quarter of 2019
ثانوي
الحالة التعلیمیة
قطريQatari
غیر قطريNon-Qatari
المجموعTotal
Education Attainment
Secondary
Read and Write
Primaryابتدائي
Preparatoryإعدادي

- 37 - LF_Q4_2019_AE-2020
شكل (11) / السكان غیر النشیطین اقتصادیاً (15 سنة فأكثر) حسب الجنسیة والحالة التعلیمیةFigure (11) / Economically Inactive Population (15 years & above) by Nationality and Educational Attainment
مسح القوى العاملة بالعینة - الربع الرابع 2019Labor Force Sample Survey - The fourth quarter of 2019
2,805
10,115 10,540
24,735
29,580
4,675
19,635
1,210
8,985
19,135
38,435
65,755
7,355
42,440
0
10,000
20,000
30,000
40,000
50,000
60,000
70,000
61} Illiterate
† "�71 }��7 Read and Write
6]}$"§} Primary
5 $}$7� Preparatory
5 15*@ Secondary
�1�§$ Diploma
� 1� *1� 681*℗ University and above
5 �7 �Qatari 5 �7 � �7�Non-Qatari

- 38 - LF_Q4_2019_AE-2020
شكل (12) / القطریون غیر النشیطین اقتصادیاً (15 سنة فأكثر) حسب الجنس والحالة التعلیمیةFigure (12) / Qatari Economically Inactive (15 years & above) by Sex and Educational Attainment
مسح القوى العاملة بالعینة - الربع الرابع 2019Labor Force Sample Survey - The fourth quarter of 2019
510
4,165 3,655
8,415
11,560
1,530
4,420
2,295
5,950 6,885
16,320
18,020
3,145
15,215
0
2,000
4,000
6,000
8,000
10,000
12,000
14,000
16,000
18,000
20,000
61} Illiterate
† "�71 }��7 Read and Write
6]}$"§} Primary
5 $}$7� Preparatory
5 15*@ Secondary
�1�§$ Diploma
� 1� *1� 681*℗ University and
above
�1�£Males �*5�Females