the fish by-product sub-sector and livelihoods in uganda
TRANSCRIPT

RESEARCH REPORT
GLOBALISATION AND FISH UTILISATION AND MARKETING STUDY
THE FISH BY-PRODUCT SUB-SECTOR AND LIVELIHOODS IN UGANDA
SOCIO-ECONOMICS SECTION
FISHERIES RESOURCES RESEARCH INSTITUTE
Jinja, Uganda
Submitted to Mike Dillon Associates Limited, United Kingdom
June, 2003

THE RESEACH TEAM Konstantine Odongkara Team Leader Mercy Kyangwa Researcher Jonah Wegoye Researcher Anne Nyapendi Research Assistant Richard Jawoko Driver CONTACT ADDRESS Fisheries Resources Research Institute National Agricultural Research Organisation P.O. Box 343, JINJA Uganda Tel. 256-43-120484 Fax: 256-43-120192 e-mail: [email protected]

ii
DEFINITIONS By-product: Parts of fish that remain after the fillets have been removed. Fish frame/Carcass: Main skeleton of the fish to which the head and fin
remain attached when the fillets are removed. Fish maws: Swim bladders locally known as Nnuni which help fish move
vertically in water. Fish skins: Thin outer layer covering the flesh on fish Trimmings: Off cuts of red meat and belly flaps from the fillets

iii
ABBREVIATIONS AND ACRONYMS
EPRC: Economic Policy Research Centre MFPED: Ministry of Finance and Economic Development UBOS: Uganda Bureau of Statistics DFR: Department for Fisheries Resources DRC: Democratic Republic of Congo CAWODISA: Children and Widows of Disabled Soldiers Association IMF: International Monetary Fund GDP: Gross Domestic Product

iv
EXECUTIVE SUMMARY 1. Fish by-products account for nearly 60% of the whole fish, consisting of
fish frames, skins, trimmings, fats, fish maws and guts. Of these, only fish guts, which constitute 2% of the whole fish are discarded. The fish frames, skins, trimmings and fats are sold in local markets whereas the fish maws are exported to overseas markets.
2. The by-product market has provided a saving to fish factories for costs that would otherwise have been incurred in disposing off the by-products.
3. By-products are a significant source of revenue to fish processing factories as revealed by average weekly earnings, which is estimated at Shs. 7,000,000 per factory.
4. The local demand for by-products is high relative to supply as indicated by the fact that factories no longer discard by-products and individual traders cannot access the product on a daily basis and have to follow factory supply schedules.
5. The by-product sub-sector is an extensive network consisting of wholesale pick-up traders supplying numerous local traders and processors at various urban, rural and roadside markets, thus contributing towards employment and livelihood sources.
6. Urban markets, which are largely distribution centres operate on a daily basis and handle larger quantities whereas rural markets mainly operate on specific weekdays.
7. By-product operations require low capital investments with the exception of pick-up traders. The major assets employed include smoking kilns, bicycles and frying pans.
8. The pick-up traders spend more money on operating expenses (fuel and hire of pick-up) as compared to other traders, whose input costs are mainly firewood and transport.
9. By-product operations are profitable as indicated by the positive net revenues of all types of enterprises. Pick-up traders have low profit levels because they incur substantially higher operating costs.
10. The cost of the raw product accounts for nearly 85% of the total costs implying that by-product operations are very sensitive to changes in product prices, which are largely determined by the factories.
11. Fish frames and skins are mainly consumed in smoked form whereas trimmings are mainly deep-fried and consumed as snacks. Consumers living adjacent to by-product markets on the average consume the products 3 times a week.

v
12. By-products are mainly consumed by low-income groups, with average monthly incomes of Shs 36,000 and weekly expenditures on by-products of Shs 2,800 respectively for non-traders of by-products.

vi
TABLE OF CONTENTS Page
DEFINITIONS ii ABBREVIATIONS AND ACRONYMS iii EXECUTIVE SUMMARY iv TABLE OF CONTENTS vi LIST OF TABLES vii LIST OF FIGURES AND MAP viii 1. INTRODUCTION 1 2. OBJECTIVE OF STUDY 3 3. METHODOLOGY 4 4. STRUCTURE OF THE BY-PRODUCT SUB-SECTOR 5 5. CHARACTERISTICS OF BY-PRODUCT TRADERS 9 6 INPUTS AND COSTS 9 6.1 Capital Costs 9 6.2 Operating Costs 10 6.3 Outputs and Incomes 11 6.4 Enterprise Revenues 12 7 CONSUMPTION OF BY- PRODUCTS 13 7.1 Consumers Characteristics 13 7.2 Consumption Levels and Trends 13 8. CONCLUSIONS AND RECOMMENDATIONS 14 9. REFERENCES 15 APPENDIX 1 PRINCIPAL PERSONS MET 17 APPENDIX 2 DATA COLLECTION INSTRUMENTS 18

vii
LIST OF TABLES
Page
Table 1.1: Number of Industrial Fish Processing Firms, Total
Approved Capacities, Fish Purchases and L. niloticus Prices, 1990 – 1998
2
Table 3.1: Distribution of Respondents by Market and District
4
Table 4.1: Quantities, Prices and Values of By-products from Factories
6
Table 4.2: Estimated Weekly Quantities of By-products by Market
8
Table 5.1: Distribution of Respondents by Type of Trader 9 Table 6.1: Average Capital Costs by Type of Enterprise 10 Table 6.2: Average Weekly Costs (Shs) per Unit. 10 Table 6.3 Quantities, Buying and Selling Prices of Traders 11 Table 6.4: Weekly Costs and Revenues by Enterprise 12 Table 7.1: Consumption Levels and Prices of By-products 13

viii
LIST OF FIGURES AND MAP
Page
Figure 4.1: Fish By-product Distribution Channels 5
Map 1: Fish By-product Distribution Areas of Uganda ix
ix
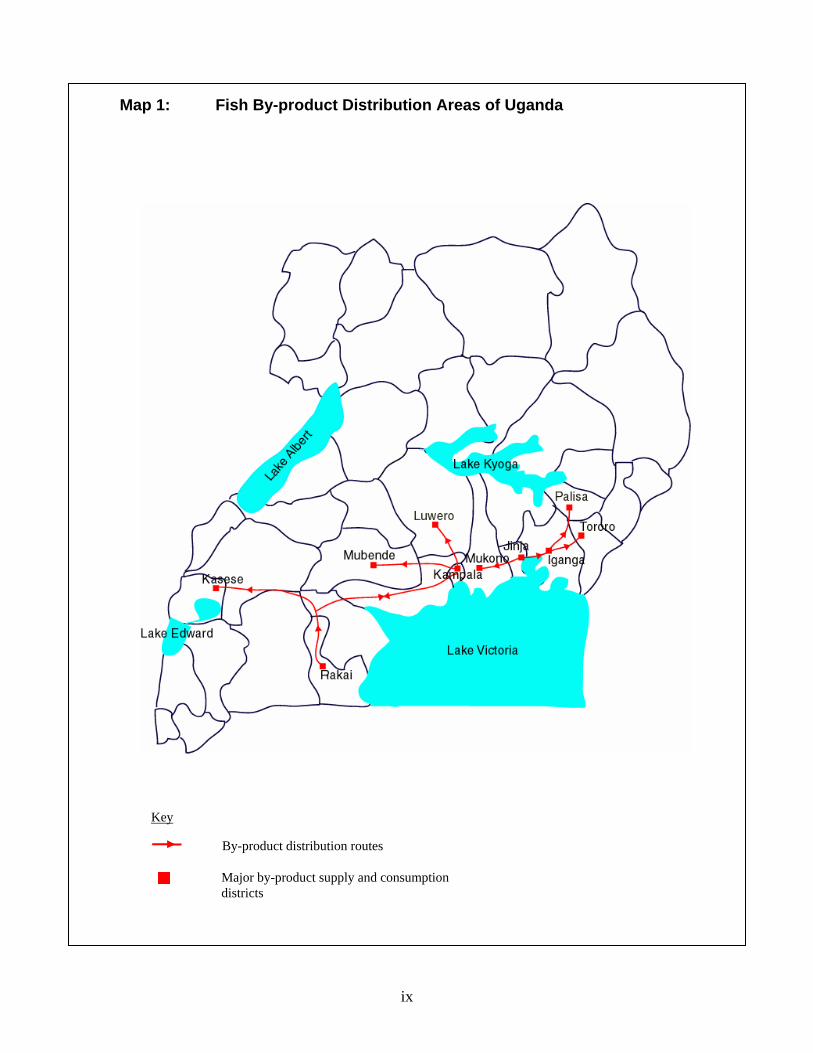
Map 1: Fish By-product Distribution Areas of Uganda
Key
By-product distribution routes
Major by-product supply and consumption districts
1
1. INTRODUCTION The considerable economic success reported to have been achieved by Uganda since the late 1980s have been attributed mainly to the Structural Adjustment Program pursued over the period, supervised and supported by IMF and the World Bank. A key element of the program involved instituting economic policies to promote investments, trade liberalisation and privatisation of business enterprises. The measures have resulted in steady growth in GDP, estimated at about 5.5% per annum for 1997/98 and in the manufacturing sector which stood at 13% over the same period, with its share of the GDP rising from 0.3% in 1992 to 9% in 1997 (MFPED 1998). Exports have risen markedly during this decade before the recent decline set in, due to other factors. The supply of the various consumer goods on the domestic market has been boosted, eliminating the shortages that characterised the economy in the 1970s and much of the 1980s. The fisheries sector experienced its share of growth, with its contribution to GDP rising from Shs 46.0 billion in 1990 to Shs 58.1 billion in 1997, valued at constant 1991 prices (MFPED 1998). Fish exports have risen markedly, making the sector to became Uganda's second highest foreign exchange earner and fetching US $ 86 million in 2001 (MFPED 2002). On the domestic scene, it has continued to provide employment and income and act as a source of animal protein to the people in many parts of the country. The key policies include privatisation, liberalization and investment promotion. The privatisation policy was intended to transfer the ownership of business enterprises from public to private hands for greater efficiency (EPRC 1999). Its effect within the fisheries was that Government withdrew from its earlier role of supplying inputs, which had moderated their prices to the fishers. Fishers are now faced with the full market prices for outboard engines and fishing gears, some of which are often beyond their reach. The market liberalisation policy reduced controls over the domestic as well as the export trade, aimed at creating a conducive environment for business. Although this led to increase of fishery inputs on the market, the policy resulted in rises in foreign exchange and interest rates, resulting in higher costs for imported inputs and of interests on loans (MFPED 2000, UBOS web site). Liberalization policy has led to the export of substantial quantities of fish, with implications for domestic traders and consumers. The investment promotion policy, laid down within the Investment Code of 1991, was aimed at encouraging private investment through tariff reduction and provision of tax incentives (Government of Uganda 1991). Other provisions included relaxation of restrictions on profit repatriation for foreign investors and assurances of the security of their assets against any forms of expropriation. The policy, in conjunction with the other measures, has stimulated rapid growth of industrial fish processing capacity on Lake Victoria.

2
Table 1.1: Number of Industrial Fish Processing Firms, Total Approved Capacities, Fish Purchases and L. niloticus Prices, 1990 – 1998*.
Year No. of Firms
Approved Capacity (Tonnes/Year)
Fish Purchases (Tonnes/Year)
L. niloticus Prices (U. Shs/kg)
1990 3 14,300 4,992 300
1991 6 30,680 14,061 400
1992 7 31,980 14,553 500
1993 9 39,780 18,414 400
1994 9 39,780 19,692 800
1995 12 50,180 48,138 800
1996 13 51,480 39,300 1,000
1997 9 35,880 30,840 1,000
1998 9 35,880 24,000 1,000
Source: MFPED 1998, DFR & Fish Processing Industries records * Annual estimates based on 260 working days in a year. As indicated in Table 1.1, industrial fish processing has existed in Uganda since 1990, producing mainly fillets for the international market and in the process generating substantial quantities of by-products. Earlier studies within this project have examined the impact of fish processing and export on the livelihoods of the artisanal operators and consumers within the fish sub-sector. The studies revealed that: a) The country has been able to realise increased foreign exchange earnings
as a result of fish export. b) The districts involved have benefited from increased revenues attributed
to the presence of refrigerated trucks and insulated vessels at the beaches. Sources of such revenues include specific tax charged on trucks and vessels and market fees earned through tendering of the beaches.
c) Fish exports have resulted in higher income levels for boat owners and crewmembers targeting Nile perch. This is attributed to the high prices paid for Nile perch by the industrial processors.
d) Because of reduced fish supply on the domestic market due to the export of Nile perch, the prices of other species have also increased.

3
e) Fish exports have resulted in substantially decreased levels of artisanal fish processing, and in some cases virtually eliminating it from the beaches, especially on Lakes Victoria and Kyoga.
f) The levels of local fish marketing have significantly declined due to export and only a small proportion of local traders have continued to deal in Nile perch because they cannot compete with factory trucks in securing raw supplies of the fish.
g) Fish exports have greatly reduced fish consumption levels even at the beach level. The average buying price of Nile perch by the local consumers is significantly lower than for factory agents indicating that the local population consumes low quality Nile perch, namely rejects and juveniles.
The emergence of the by-product sub-sector in Uganda has been considered a major indicator of the impact of globalisation on the livelihoods and consumption of the local communities. At the onset of industrial fish processing, most of the by-products were disposed off by the fish processing factories as waste. As the scarcity of fish supply on the domestic market intensified due to globalisation, increasing numbers of artisanal processors and traders shifted from dealing in fish to the fish by-products. Similarly, many local consumers, either unable to access fish or afford the high prices, have shifted from consuming fish to the by-products. It is also the policy of Government that products be diversified to meet the needs of the different consumers and waste be minimised. The industrial processors’ immediate concern is to generate revenues from the by-products and avoid the cost of disposing of them. In the long run, they would like to develop value added products from the by-products in order to maximise their profits, in view of the declining trend in fish supply. Some factories have plans to make fish burgers from the trimmings while others intend to export the fish heads and skins. 2. OBJECTIVE OF STUDY The overall objective of the study was to assess the impact of Uganda’s trade in fish by-products on local livelihoods. The specific objectives were: a) To establish the structure and organisation of the fish by-product sub-
sector in Uganda, describing the trade from fish processing factories to consumers.
b) To estimate the quantities and values of by-products supplied by factories. c) To assess the economic importance of the by-product trade in terms of
income levels, employment and consumption.
4
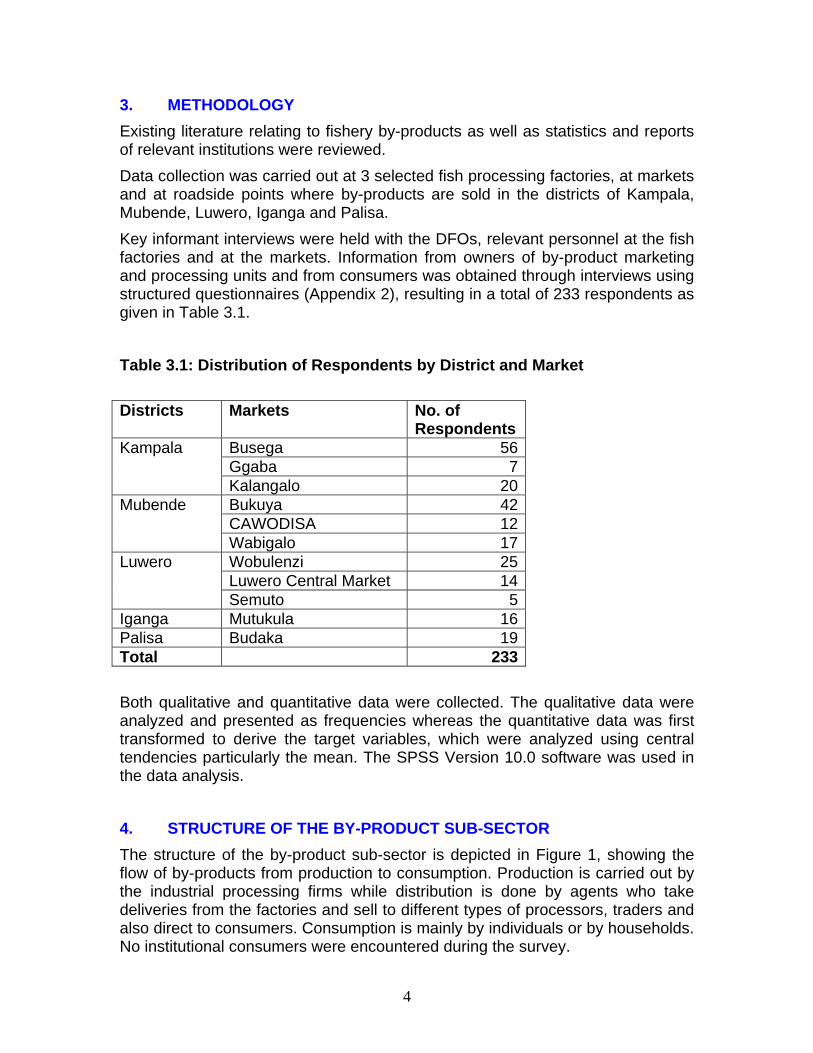
3. METHODOLOGY Existing literature relating to fishery by-products as well as statistics and reports of relevant institutions were reviewed. Data collection was carried out at 3 selected fish processing factories, at markets and at roadside points where by-products are sold in the districts of Kampala, Mubende, Luwero, Iganga and Palisa. Key informant interviews were held with the DFOs, relevant personnel at the fish factories and at the markets. Information from owners of by-product marketing and processing units and from consumers was obtained through interviews using structured questionnaires (Appendix 2), resulting in a total of 233 respondents as given in Table 3.1. Table 3.1: Distribution of Respondents by District and Market Districts Markets No. of
Respondents Busega 56Ggaba 7
Kampala
Kalangalo 20Bukuya 42CAWODISA 12
Mubende
Wabigalo 17Wobulenzi 25Luwero Central Market 14
Luwero
Semuto 5Iganga Mutukula 16Palisa Budaka 19Total 233 Both qualitative and quantitative data were collected. The qualitative data were analyzed and presented as frequencies whereas the quantitative data was first transformed to derive the target variables, which were analyzed using central tendencies particularly the mean. The SPSS Version 10.0 software was used in the data analysis. 4. STRUCTURE OF THE BY-PRODUCT SUB-SECTOR The structure of the by-product sub-sector is depicted in Figure 1, showing the flow of by-products from production to consumption. Production is carried out by the industrial processing firms while distribution is done by agents who take deliveries from the factories and sell to different types of processors, traders and also direct to consumers. Consumption is mainly by individuals or by households. No institutional consumers were encountered during the survey.

5
Substantial quantities of smoked by-products are also transported to Kikolongo Market in Kasese District, from where it is exported to the Democratic Republic of Congo (DRC). Figure 4.1: Fish By-product Distribution Channels
Source: FIRRI Survey data 2003 The fish factories supply various types of by-products, which include carcasses, skins, fats, trimmings, fish maws, and rejected fish/ fillets from the processing line. Overall, by-products constitute 60% of the whole fish with carcasses accounting for 40%, trimmings (2%), fats (2%), skins (8%), fish maws (2%) and others (6%). a) The maws are usually not sold on the domestic market. They are cleaned,
fats removed, sun-dried and exported to the Asian countries (EPRC 1999).
b) The carcasses are sold either fresh or decapitated and smoked or deep-fried before they are sold.
Pick
-up
Trad
er
Dee
p Fr
yer
Who
lesa
le
Smok
er
Ret
ail
Smok
er
Con
sum
er
Fish
Pro
cess
ing
Fact
orie
s
Bic
ycle
Tr
ader
Ex
port
to D
RC

6
c) The trimmings are usually rolled into fish balls and then fried for direct consumption.
d) The skins are descaled, rolled and then smoked or deep-fried before they are sold.
e) The fats are used for frying the fish balls. Table 4.1 provides information on quantities sold, prices and values at the factory gate level. For purposes of confidentiality, the names of fish factories are not stated and instead the alphabets are used. Table 4.1: Quantities, Prices and Values of By-products from Factories Quantities (kgs) Prices Shs/ kg Values Factory A (Shs/ day) (Shs/ wk) Daily tonnage of raw fish 20,000 Fillets 8,000 By-products Carcasses 8,000 210 1,680,000 10,080,000 Trimmings 400 480 192,000 1,152,000 Fats 400 170 68,000 408,000 Skins 1,600 40 64,000 384,000 Fish maws 400 * Others e.g. guts 800 ** Total value 2,004,000 12,024,000 Factory B Daily tonnage 13,000 Fillets 5,200 By-products Carcasses 5,200 110 572,000 1,716,000 Trimmings 260 200 52,000 156,000 Fats 260 100 26,000 78,000 Skins 1,040 80 83,200 249,600 Fish maws 260 * Others e.g. guts 520 ** Total value 733,200 2,199,600 Factory C Daily tonnage 13,750 Fillets 5,500 By-products Carcasses 5,500 140 770,000 5,390,000 Trimmings 275 400 110,000 770,000 Fats 275 330 90,750 635,250 Skins 1,100 40 44,000 308,000
7
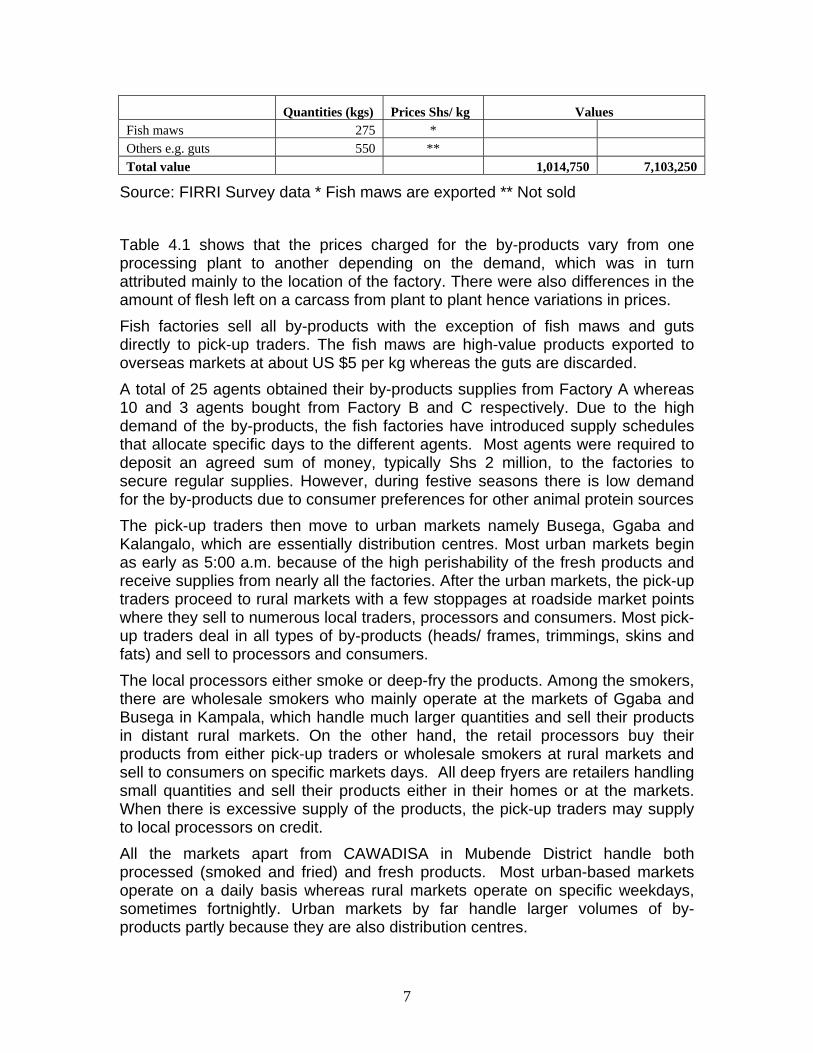
Quantities (kgs) Prices Shs/ kg Values Fish maws 275 * Others e.g. guts 550 ** Total value 1,014,750 7,103,250
Source: FIRRI Survey data * Fish maws are exported ** Not sold Table 4.1 shows that the prices charged for the by-products vary from one processing plant to another depending on the demand, which was in turn attributed mainly to the location of the factory. There were also differences in the amount of flesh left on a carcass from plant to plant hence variations in prices. Fish factories sell all by-products with the exception of fish maws and guts directly to pick-up traders. The fish maws are high-value products exported to overseas markets at about US $5 per kg whereas the guts are discarded. A total of 25 agents obtained their by-products supplies from Factory A whereas 10 and 3 agents bought from Factory B and C respectively. Due to the high demand of the by-products, the fish factories have introduced supply schedules that allocate specific days to the different agents. Most agents were required to deposit an agreed sum of money, typically Shs 2 million, to the factories to secure regular supplies. However, during festive seasons there is low demand for the by-products due to consumer preferences for other animal protein sources The pick-up traders then move to urban markets namely Busega, Ggaba and Kalangalo, which are essentially distribution centres. Most urban markets begin as early as 5:00 a.m. because of the high perishability of the fresh products and receive supplies from nearly all the factories. After the urban markets, the pick-up traders proceed to rural markets with a few stoppages at roadside market points where they sell to numerous local traders, processors and consumers. Most pick-up traders deal in all types of by-products (heads/ frames, trimmings, skins and fats) and sell to processors and consumers. The local processors either smoke or deep-fry the products. Among the smokers, there are wholesale smokers who mainly operate at the markets of Ggaba and Busega in Kampala, which handle much larger quantities and sell their products in distant rural markets. On the other hand, the retail processors buy their products from either pick-up traders or wholesale smokers at rural markets and sell to consumers on specific markets days. All deep fryers are retailers handling small quantities and sell their products either in their homes or at the markets. When there is excessive supply of the products, the pick-up traders may supply to local processors on credit. All the markets apart from CAWADISA in Mubende District handle both processed (smoked and fried) and fresh products. Most urban-based markets operate on a daily basis whereas rural markets operate on specific weekdays, sometimes fortnightly. Urban markets by far handle larger volumes of by-products partly because they are also distribution centres.

8
Table 4.2: Estimated Weekly Quantities of By-products by Market
District Markets Fresh Processed Head/
frames Trimmings Skin Fats Head/
frames Trimmings Skin Fats
Kampala Busega 28 3.5 7 3.5 -- -- -- -- Ggaba 140 14 14 10.5 -- -- -- -- Kalangalo 2.8 2.1 -- 0.4 -- -- -- -- Mubende Bukuya* 2.0 0.5 0.5 0.5 2.0 0.5 0.5 - CAWODISA* -- -- -- -- 1.0 0.5 -- 0.2 Wabigalo* 4.0 0.7 6 1.0 -- -- -- -- Luwero Wobulenzi 4.0 0.5 0.5 0.2 -- -- -- -- Luwero
Central -- -- -- 0.35 7 0.7 0.7 --
Semuto 3.0 0.5 0.3 1.0 -- 0.5 -- Iganga Mutukula 21 0.9 0.9 0.09 -- -- -- -- Palisa Budaka 10.5 1.5 1.5 0.45 -- -- -- --
Source: FIRRI Survey data, 2003 *Fortnightly market-day quantities Development of the by-product sub-sector has been hindered by some factors. The main constraint has been the poor perception of the public, whereby some degree of stigma has been associated with dealing in and consuming the by-products. It is considered a matter of shame that the best parts of the fish should be sent to foreign consumers and Ugandans left to eat carcasses, skins, trimmings etc. In the extreme case, one Local Authority has placed an outright ban on marketing of the by-products in the district and one dealer was reported to have been fined Shs 300,000 for being found selling fish frames in the district. Despite the increasing trade in by-products, very limited efforts have been made by the various authorities to provide the facilities for handling. In most markets, the wet by-products are not allowed into the areas allocated for fresh fish, where some facilities may already exist. As a result traders of fresh by-products have to sell at various undesignated marketing points along the roads and when they reach the markets, they are hosted outside. The processed by-products are, however, more acceptable and traders are seen occupying stalls together with other smoked fish dealers. 5. CHARACTERISTICS OF BY-PRODUCT TRADERS Most traders interviewed were male (68%) and their mean age was 32 years. The majority were of the Ganda tribe (63%) and the rest belonged to other tribes such as Soga, Baruli and Banyoro. A majority of the traders (70%) were married with an average family size of 6 members. About 61% of the traders had attained primary education, 28% secondary and the remaining 1% had not gone to school at all. Overall, the traders had spent an average of 5 years in the by-product business. Table 5.1 shows the distribution of sample respondents by type of trader.

9
Table 5.1: Distribution of Respondents by Type of Trader Type of Traders Number Percentage
Pick-up trader 14 7Wholesale smoker 49 26Retail smoker 32 17Deep fryer 94 50Total 189 100Source: FIRRI Survey data 2003 6 INPUTS AND COSTS 6.1 Capital Costs With the exception of pick-up traders, the capital requirements for by-product operations are low and involve simple assets such as low-technology smoking kilns, bicycles and frying pans. (See table 6.1).

10
Table 6.1: Average Capital Costs by Type of Enterprise (Shs)
Type of Trader Asset Pick-up trader Wholesale
smokerRetail smoker Deep fryer
Pick-up 4,000,000 . . .Market stall . 5,000 . .Smoking kiln . 99,810 35,304 .Bicycle . 49,765 33,000 42,667Frying pan . . . 5,711Total 4,000,000 154,575 68,304 48,378
Source: FIRRI Survey data 2003 6.2 Operating Costs Large variations in the operating costs of the different enterprises exist. Overall, pick-up traders had the highest operating costs by far, with fuel costs and hire of pick-up each accounting for about 40% of the total costs. Other types of enterprises incurred relatively low but significant costs, with firewood, labour and transport costs as the major costs (See Table 6.2).

11
Table 6.2: Average Weekly Costs (Shs) per Unit.
Type of Trader Cost items Pick-up trader Wholesale
smoker Retail smoker Deep fryer
Depreciation 10,417 317 194 132Hire of kiln . 9,914 5,357 .Firewood . 9,976 7,854 5,155Fats . . . 8,040Fuel 112,754 . . .Transport 106,667 12,083 16,979 17,407Ice 30,125 . . .Labour 30,357 12,200 7,263 6,271Total costs 245,188 22,964 22,395 21,478Source: FIRRI Survey data 2003 6.3 Outputs and Incomes Pick-up traders deal in all by-products while wholesale and retail smokers primarily process heads, skins and frames. In contrast, deep friers mainly process skins and trimmings and occasionally melt fish fats for sale to other deep fryers (See Table 6.3). There was an inverse relationship between quantities traded and average price margins with deep fryers having the highest price margins (Shs. 233) and pick-up traders and wholesale smokers having the least (100 Shs/ kg). Table 6.3 Quantities, Buying and Selling Prices of Traders
Type of Trader Pick-up trader Wholesale
smoker Retail smoker Deep fryer
Heads Quantities (Kg) 1,121.4* 430.5 148.9 58.3 Buying price (Shs/kg) 183 296 367 346 Selling price (Shs/kg) 249 434 532 531 Frames Quantities (Kg) . 500.0 6.0 15.0 Buying price (Shs/kg) . 263 450 300 Selling price (Shs/kg) . 350 550 550 Skins Quantities (Kg) 163.6 891.3 95.5 102.5 Buying price (Shs/kg) 64 143 158 208 Selling price (Shs/kg) 115 213 300 478 Trimmings Quantities (Kg) 162.5 . 15.1

12
Buying price (Shs/kg) 400 . 596 Selling price (Shs/kg) 535 . 956 Fats Quantities (Kg) 48.8 . . 18.0 Buying price (Shs/kg) 281 . . 100 Selling price (Shs/kg) 394 . . 200 Source: FIRRI Survey data 2003 * Pick-up trader buys the heads complete with carcasses but the wholesale smoker separates them 6.4 Enterprise Revenues All the various types of by-product traders earned positive net revenues indicating the by-product marketing operations are profitable (See Table 6.4). Overall, wholesale smokers realized the highest profits due to a combination of the larger quantities of product handled and low input costs. On the other hand, pick-up traders despite trading in the largest quantities, incurred considerable operating costs (fuel and vehicle hire). The cost of the raw products was considerably higher than the total cost of inputs implying that by-product operations are very sensitive to changes in product prices. Table 6.4: Weekly Costs and Revenues by Enterprise
Type of Trader Costs and Revenues Pick-up
trader Wholesale
smoker Retail
smoker Deep fryer
Gross revenue 1,060,857 554,564 243,796 134,973Cost of raw product
783,286 400,725 163,552 82,645
Cost of inputs 245,188 22,964 22,395 21,478Net revenue 62,740 142,701 65,112 37,036Source: FIRRI Survey data 2003 7 CONSUMPTION OF BY- PRODUCTS 7.1 Consumers Characteristics Most consumers interviewed (69%) were male and their mean age was 32 years. The majority of the respondents were of the Baganda tribe (60%). Other significant tribes included the Basoga, Baruli and Banyoro. Most consumers (72%) were married with an average household size of 6 members. About 63% of the consumers had attained primary education, 25% secondary and the remaining 10.3% had not gone to school at all. The consumers were grouped into by-product traders and those who do not deal in by-products. The average incomes of consumers who do not deal in by product was Shs. 36,000.

13
7.2 Consumption Levels and Trends By-products particularly the heads, frames and skins are mainly consumed in the smoked form (46%) and constitute a major part of the local diets whereas trimmings are largely eaten as snacks in a deep fried form (40%). The differences in the by-product consumption levels between by-product traders and non by-product trading consumers are largely due to differences in the frequencies of consumption rather than the quantities consumed (See Table 7.1). Furthermore, by-product traders spend less per kg on the products because they directly buy from wholesale traders. Table 7.1: Consumption Levels and Prices of By-products
By-product Trading Consumers
Non-By-product Trading Consumers
Household size (No.) 5.8 5.8
Household daily consumption (Kg) 1.7 1.5
Per capita daily consumption (Kg) 0.3 0.3
Frequency of consumption/week (Kg) 4 2
Per capital weekly consumption (Kg) 1.3 0.6
Household weekly consumption (Kg) 7.3 2.5
Average price (Shs/kg) 481 913
Household weekly expenditure (Shs) 3,461 2,284
Average monthly income (Shs) 36,000
Source: FIRRI Survey data 2003 Most of the respondents (96%) reported that over the years the prices of by-products have been increasing. The main substitutes for by-products include beans (51%), ground nuts (22%), vegetables (14%) and meat (9%). Nearly 60% of the respondents did not experience any problems with the supply and prices of by-products whereas 27% and 9% of the respondents cited high buying prices and scarcity respectively as the main constraints limiting the consumption of by-products.

14
8. CONCLUSIONS AND RECOMMENDATIONS The study has shown that at the early stages of industrial fish processing in Uganda, by-products were treated as waste and measures were being taken to dispose of them appropriately. However, as a result of growing fish scarcity and rising fish prices on the domestic market due to increasing fish export, by-products have been utilized for human consumption. A network of by-product distribution has developed, with authorized agents taking deliveries from the fish factories for further distribution by other dealers. Two main distribution centers have developed, namely Busega and Ggaba Markets, from where the by-products leave for up-country destinations. Kampala, Luwero, Mubende and Iganga are the main destinations for the by-product trade but smoked products are ferried to Kikolongo in Kasese District, mainly for onward export to the Democratic Republic of Congo. Supplies to some of the distant districts like Tororo and Palisa have declined as result of increased consumption within the nearby districts. By-product marketing is carried out by four categories of traders, namely pick-up traders, wholesale smokers, retail smokers and deep fryers. Average weekly net revenues for the different categories of traders range from Shs 37,000 for the deep fryer to Shs 143,000 for the wholesale smoker. Many Ugandans have taken to consumption of by-products as a result of shortage and high prices for fish on the market. Consequently, by-products now fill a major gap on the fish market in Uganda. Development of the sub-sector has reduced the environmental dangers of disposing of the by-products as wastes and the costs associated with it. However, business in by-products is hindered by the negative attitude of the community towards dealing in and consuming the by-products, the high factory costs of by-products and lack of facilities for the trade. Furthermore, there is lack of clarity in the policy towards marketing and consumption of by-products and as a result, some Local Authorities have not allowed by-product trade in their districts. On the basis of the findings of the study, the following recommendations are made: a) There is need to come out with clear policy towards marketing and
consumption of by-products at national and district levels to guide development of the sub-sector.
b) The contribution of the by-product sub-sector as a source of income and food should be recognized and the communities sensitized to take advantage of the opportunities it presents.
c) Appropriate standards for producers and dealers in by-products should be developed and implemented to ensure minimum food contents and hygiene.
d) Statistics should be maintained on the sub-sector activities.

15
e) There is need to provide facilities for by-product marketing at the different stages.

16
9. REFERENCES Abila, R.O. and E.G. Jansen, 1997: From local to global markets: the fish
processing and exporting industry on the Kenyan part of Lake Victoria - its structure, strategies and socio-economic impacts; Imprint: Centre for Development and the Environment. University of Oslo, Oslo.
Carney D, 1998: Implementing the sustainable rural livelihood approach. In Carney D. Sustainable rural livelihoods. What contribution can we make? Papers presented at the Department for International Development’s Natural Resources Advisors’ Conference, July 1998. DFID.
EPRC (Economic Policy Research Centre), 1999: Environmental impacts of trade liberalization and policies for the sustainable management of natural resources: a case study on Uganda’s fisheries sector. UNEP. United Nations. New York and Geneva.
FIRRI (Fisheries Resources Research Institute), 2002: Economic profiles of selected landing sites on Lake Victoria. Research report, Jinja Uganda.
MFPED, 1998: Background to the Budget 1998/99 Odongkara, K., J. Wegoye, M. Kyangwa and a. Nyapendi, 2003: Economic
impacts of globalisation at the district, landing site and sub-sector enterprise levels on Lakes Kyoga, Albert and Victoria. In FIRRI, 2003: Interim workshop report: Globalisation and fish utilization and marketing study; Windsor Lake Victoria Hotel, Entebbe 21 Feb., 2003:
Odongkara, O.K., 1999: Commercialization of the fisheries of Lake Victoria; opportunity for greater food security. In: Proceedings of the IUCN Workshop on ‘The Lake Victoria Fisheries and Food Security; Consequences for Security and Sustainability.’ IUCN Eastern Africa Regional Programme, IUCN. Nairobi.
Odongkara, O.K., 2001: Poverty in the fisheries: a framework for analysis and intervention for Lake Victoria, Uganda. PhD Thesis, The University of Hull, UK.
SEDAWOG (Socio-economic Data Working Group), 1999: Marketing study. LVFRP Technical Document No. 2. LVFRP.TECH/99/02.
Steen-Johnsen, T., 2000: Livelihoods under pressure: a study of the informal by-product sector of the Lake Victoria fisheries. A case from Obunga, Kenya. Working Paper 2000 4. center for Development and the Environment (SUM), University of Oslo.
UBOS, 2001: National Accounts. GDP industry group, GDP time. http://www.ubos.org/nsdfirst.html

17
APPENDICES APPENDIX 1 PRINCIPAL PERSONS MET Mr. Kiri Andrew Quality Assurance Manager, Byansi Fisheries
Company Limited Mr. Mwase Godfrey Operations Manager, Greenfields (U) Limited Mr. Badru Lugolobi Quality Assurance Manager, Greenfields (U) Limited Mr. Luswata Charles Supervisor By-products Section, Greenfields (U)
Limited Mrs. Amongin Matlida Quality Assurance Manager, Ngege Limited Mrs. Imaculate Sentengo Wholesale trader, Byansi Fisheries Company Limited Mr. Kalyango Ben Wholesale trader, Byansi Fisheries Company Limited Mr. Sempa Benard Wholesale trader, Greenfields (U) Limited Mr. Ddumba Ronald Wholesale trader, Ngege Limited Mr. Mutyaba D. District Fisheries Officer, Mubende Mr. Musozi, D. Assistant Fisheries Officer, Wobulenzi Mr. Musisi Ibrahim Member of the BMU, Ggaba Market Mr. Kimumwa Chairman Fish Mongers’ Association, Luwero Mr. Kafumbe Paul Secretary, Akugoba Fish Traders group, Busega Mr. Sentongo Charles In-charge, Kalangalo Market Mr. Kami Katono Ali, Health Inspector, Bukuyu Mr. Kasujja Chairman Fish Traders, Wabigalo Mr. Musoke Assistant Fisheries Officer, Semuto

18
APPENDIX 2 DATA COLLECTION INSTRUMENTS KEY INFORMANT INTERVIEW WITH FACTORY MANAGER Background information
Date _______________________________________________
Name of enumerator _________________________________
District_____________________________________________
1. Name of Factory _____________________________________
2. Job description of respondent __________________________________ 3. Describe the different types of factory by-products ________________________________________________________________________________________________________________________________ 4. Describe the different buyers of your by-products ________________________________________________________________________________________________________________________________________________________________________________________________ 5. Mention the problems you encounter in the sell of by-products _________________________________________________________________________________________________________________________________________________________ 6. Provide information on future plans for your by products __________________________________________________________________________________________________________________________________________________________ Questions Type of by product
Fish frames
Off-cuts Fats Skin Fish maws
Other
7. Average units for each sell per day/week
8. Average price per unit
9. Average number of times of supply per day/week
10. Main destination of your by-products

19
Key Informant Interview with Market Tenderer/Master A. Background information
1) Date _____________________________________________
2) Name of enumerator _________________________________
3) District ____________________________________________
4) Sub county ______________________________ __________
5) Name of market _____________________________________
6) Title of respondent ___________________________________
B. Infrastructure/facilities in support of fish marketing (No. and description) 7) Fish stalls in the market a) Fish stalls ______________________________________________________ b) Weighing shade _________________________________________________ c) Raised platform __________________________________________________ d) Ice boxes ______________________________________________________ Fill in the information below about fish species, rank and quantities brought per week Type of By-product Rank Qty. Brought per week/Per
market day 8) Heads 9) Frame 10) Trimmings 11) Skin 12) Others Fill in the information below about number by category, assets and rank of fish trader Type of trader Rank No 13) Bicycle trader 14) Truck trader 15) Other 16) State the problems faced with fish marketing _________________________ 17) Suggest solutions _______________________________________________

20
Unit Questionnaire for By-product Marketing Sub-Sector
Name of enumerator _____________________
Date _____________________
1. District _____________________
2. Market/roadside point _____________________
A. PERSONAL DATA
3. Name of respondent ____________________________
4. Age _____ years
5. Sex [1] Male [2] Female
6. Tribe: [1] Ganda [2] Soga [3] Mugungu [4] Munyoro [5] Teso
[6] Mukenye [7] Acholi [8] Adhola [9] Alur [10] Other_____________
7. Marital Status: [1] Married [2] Single [3] Divorced [4] Separated
[5] Widowed [6] Other (Specify) _______________
8. What is your level of education? [1] No schooling [2] Primary [3] Secondary [4] Tertiary [5] University [6] Other______________
9. How long have you traded in by products? _____________ Years B. INPUTS/ COSTS Capital
10. What type of trader are you? [1] Retailer Smoker [2] Pick-up trader [3] Wholesale trader [5] Other (Specify) ____________________
11. What fish trading assets do you own?
ASSET YEAR OF ACQUISITION
COST PRICE EXPECTED USEFUL LIFE
SALVAGE VALUE
[1] Bicycle [2] Basket [3] Ice boxes [4] Truck [7] Stall/slab [8]

21
12. What other inputs do you use and what are their costs?
INPUT QTY UNIT COST
Fuel Ice Transport Others
13. How many days a week do you operate? ___________ Labour
14. What sources of labour do you use? [1] Self-employment [2] Family labour [3] Hired labour [4] Other ___
15. Provide the information below:
SOURCE OF LABOUR NUMBER UNIT COST/ DAY/ WK/MONTH [1] Self-employment [2] Family labour [3] Hired labour [4] Other C. OUTPUT/ INCOME
16. What type(s) of by-product do you deal in? [1] All by-products except fish maws [2] heads [3] Skins [4] Frames [5] Trimmings [6] Other ______________________________________
17. Provide the information below:
TYPE OF BY-PRODUCT
AVERAGE WEEKLY QUANTITY TRADED
BUYING PRICES (KG)
SELLING PRICES (KG)
Heads Frames Skins Trimmings Other
18. To whom do you sell your products? [2] Retailer [3] Consumer [4] Other ____
19. If to consumers, approximately how may consumers do you sell to each day you operate?
__________
20. In what form do you sell your products? [1] Fresh [2] Processed-smoked [3] Processed – fried [4] Other ___
21. What problems do you face with marketing of your by-products ___________

22
UNIT QUESTIONNAIRE FOR BY-PRODUCT CONSUMERS
Name of enumerator _____________________
Date _____________________
3. District _____________________
4. Market/roadside point _____________________
A. PERSONAL DATA
3. Name of respondent ____________________________
4. Age _____ years
5. Sex: [1] Male [2] Female
6. Tribe: [1] Ganda [2] Soga [3] Mugungu [4] Munyoro [5] Teso
[6] Mukenye [7] Acholi [8] Adhola [9] Alur [10] Other __
7. Marital Status: [1] Married [2] Single [3] Divorced [4] Separated [5] Widowed [6] Other (Specify) _______________
8. What is your level of education? [1] No schooling [2] Primary
[3] Secondary [4] Tertiary [5] University [6] Other____
9. How long have you consumed by- products? _____________ Years
10. What is your main source of income? [1] Farming [2] Trading [3] Salaried employment
11. How much do you earn per day/week/month/year
12. Household size _________ B. CONSUMPTION
13. What type of by-product do you most commonly eat at home? [1] Head [2] Skeleton [3] Skins [4] Trimmings [5] Others _______
14. What form of by-products do you consume?
[1] Fresh [2] Processed – smoked [3] Processed – fried [4] Other _______
13. How much by-products does your family eat each day? ______ Kgs
14. How often does your family eat fish by-products per week? _______
15. At what price per kg do you buy by-products? Shs. _______________
16. Over the past year, has there been change in price at which you buy products for consumption? [1] Yes [2] No
17. If yes, what change? [1] Increased [2] Decreased
18. What is your substitute for fish? 1] Beans [2] Meat [3] Vegetables [4] Chicken [5] Other___
19. State problems associated with consumption of by-products? _____________