the fifth-year interim report - dalton state college · the fifth-year interim report name of...
TRANSCRIPT

THE FIFTH-YEAR INTERIM REPORT
Name of Institution:
Dalton State College
Address of the Institution:
650 College Drive, Dalton, GA 30720
Name, title, contact numbers of person(s) preparing the report:
Henry M. Codjoe, Ph.D. Director of Institutional Research and Planning 706-272-4406

Part I: Signatures Attesting to Integrity
(Applicable to all institutions)
UDirections: U Please include Part I with Parts II, III, and V on the same electronic
device or with the same print document. It should UnotU be combined with Part IV.
By signing below, we attest that Dalton State College has conducted an honest assessment
of compliance and has provided complete and accurate disclosure of timely information
regarding compliance with the identified Core Requirements, Comprehensive Standards, and
Federal Requirements of the Commission on Colleges.
Date of Submission: September 14, 2018
Accreditation Liaison
Name of Accreditation Liaison
Henry M. Codjoe, Ph.D.
Director, Institutional Research and Planning
_________________________________________________
Signature
Chief Executive Officer
Name of Chief Executive Officer
Margaret Venable, Ph.D.
_______________________________ Signature

1
Section 8: Student Achievement
8.1 The institution identifies, evaluates, and publishes goals and outcomes for
student achievement appropriate to the institution’s mission, the nature of the students it serves, and the kinds of programs offered. The institution uses multiple measures to document student success.
(Student achievement) [CR]
13TIn support of its institutional effectiveness program with respect to the assessment of educational programs, Dalton State evaluates student success on a regular basis. Indeed, the evaluation of student success is a critical element in determining how Dalton State is fulfilling a 13T47Tcore value of its mission13T47T: “we believe all of our students can succeed and achieve their full potential.” As such, the College has created a detailed and comprehensive system that tracks and monitors student achievement data. The Office of Institutional Research and Planning maintains a 13T47TWebsite13T47T that regularly and systematically collect and disseminate 13T47Tstudent achievement data13T47T and other measures on a wide variety of dimensions. In addition, data produced by the 13T47TUniversity System of Georgia Board of Regents 13T47T are used as part of a comprehensive program of institutional research and assessment. All these data include retention and graduation rates, course completions, 13Tgrade distribution in individual courses13T, 13Tdegrees and certificates awarded, distance education completion rates, completion rates of learning support courses,13T state licensing examinations as well as other 13Texternal measures such as the CAAP test for general education assessment and ETS Major Field Test in Business, 13Tjob placement rates13T, and transfer reports13T. 13TThe institution further evaluates student success with Graduating Senior, Alumni, and Employer surveys13T. These measurements of student success are used within a culture of continuous improvement and institutional effectiveness that establishes student learning and program outcomes, assesses results, and uses results for improvement and decision-making at the institution, program, and student support services levels. Enrollment Headcount Enrollment Dalton State initially measures its level of student achievement via enrollment data. The College’s growing reputation for quality education at low cost attracts greater numbers of students each year. As shown in Table 8.1-1, non-duplicated headcount enrollment has risen every year but four for the 47Tpast 10 years47T (see Enrollment History), from 4,957 in Fall 2008 to 5,164 in Fall 2017 [2].
Table 8.1-1 Headcount Enrollment, Fall Semester
Fall 2008 – Fall 2017
Year 2008 2009 2010 2011 2012 2013 2014 2015 2016 2017
Enrollment 4,957 5,722 5,988 5,485 5,047 5,015 4,854 5,044 5,188 5,164
Source: Office of Institutional Research and Planning [47TQuick Facts/Enrollment History 47T]

2
New Student Enrollment The number of new students enrolled has remained relatively stable over the last 10 years.
Table 8.1-2
New Student Enrollment, Fall Semester Fall 2008 – Fall 2017
Year 2008 2009 2010 2011 2012 2013 2014 2015 2016 2017
New Students
1,475 1,614 1,571 1,336 1,122 1,336 1,214 1,415 1,498 1,429
Source: Office of Institutional Research and Planning [47TQuick Facts/Enrollment History 47T]
Beginning Freshmen: Enrollment of First Generation Students, Pell Grant Recipients, and Non-Traditional Students The numbers of Dalton State’s beginning freshmen who are First Generation, receiving Pell Grants, and non-traditional have, however, declined in the past 6 years. This is evidence that the College is attracting more traditional age students.
Table 8.1-3 Beginning Freshmen: Enrollment of First Generation Students, Pell Grant Recipients, and
Non-Traditional Students 2010/11 – 2016/17
AY 1st Gen Pell 25+
2010-11 1,367 1,095 304
2011-12 1,039 820 215
2012-13 819 714 120
2013-14 961 725 89
2014-15 878 612 55
2015-16 668 789 20
2016-17 609 434 17
Source: Office of Computing and Information Services Student Information Data
Enrollment by School A 2012 reorganization of Dalton State’s academic schools moved several health-related programs from the former School of Natural Sciences and Mathematics and the former School of Technology and combined them with the former School of Nursing to create the School of Health Professions. In addition, the School of Social Work was reorganized as a department within the School of Health Professions. Generally, the 2012 shifts in enrollment data reflect these transitions as shown in Tables 8.1-4 to 8.1-9 below. Also, the consolidation and merging of programs into new ones mean data for some earlier years are non-existent.

3
Table 8.1-4 Enrollment by All Academic Schools
Fall 2013 – Fall 2017
School 2013 2014 2015 2016 2017
Business 981 993 1,042 997 950
Education 401 408 438 457 443
Health Professions 1,555 1,361 1,298 1,276 1,141
Liberal Arts 894 923 927 922 1,027
Sci. Tech. & Math 1,021 986 1,093 1,130 1,195
Source: Office of Computing and Information Services Fall Enrollment Data Files, Dalton State College
On the whole, enrollments have risen in all the academic schools; however, there have been some slight declines in latest year in the C. Lamar and Ann Wright School of Business, School of Education, and School of Health Professions. The reorganization seems to have affected overall enrollments in the School of Health Professions. This may be temporary since programs in the health area are very popular, and as the years go by, enrollments will increase in the school. Also, since some reorganizations are fairly recent (e.g. Health Professions and Science, Technology, and Mathematics), it may take some time to grow student populations in these schools. It is expected that as more baccalaureate degree programs are offered in the schools with the increased number of traditional college-age students, enrollments in the schools will increase.
0
200
400
600
800
1000
1200
1400
1600
1800
2013 2014 2015 2016 2017
Enrollment by All Academic Schools
Business Education Health Professions Liberal Arts Sci. Tech. & Math

4
Table 8.1-5 Enrollment by Undergraduate Majors
C. Lamar and Ann Wright School of Business Fall 2008 – Fall 2017
Major 2013 2014 2015 2016 2017
BBA Finance & Applied Economics 0 0 5 71 74
BAS Technology Management 21 33 38 40 43
BBA Accounting 223 213 227 209 203
BBA Logistics and Supply Chain 0 0 0 0 17
BBA Management 322 358 382 369 376
BBA Management Info Systems 85 77 89 85 65
BBA Marketing Systems 132 133 142 99 103 Source: Office of Computing and Information Services Fall Enrollment Data Files, Dalton State College
Student enrollments in programs in the C. Lamar and Ann Wright School of Business have fluctuated over the last five years, with some majors growing and some declining. Most growth in enrollment has occurred in management and technology management (which was moved to the School of Science, Technology, and Mathematics in January 2018). The degree programs in Finance and Applied Economics and Logistics & Supply Chain are fairly new. The Finance and Applied Economics degree keeps growing. In recent years, the BBA program in Industrial Operations Management, two associate’s degrees (e.g., Associate of Applied Science in Supervision and Associate of Science in Business), and the certificate programs in the school have been deactivated/suspended – affecting overall student enrolment. The degree in Industrial Operations Management was reformatted into the Logistics and Supply Chain Management degree to reflect industry and current technology.
0
50
100
150
200
250
300
350
400
450
2013 2014 2015 2016 2017
Enrollment by Undergraduate MajorsSchool of Business
BA Finance &Applied Economic BAS Technology Management Bba Accounting
BBA Logistics and Supply Chain BBA Management BBA Management Info Systems
BBA/BS Marketing Systems

5
Table 8.1-6 Enrollment by Undergraduate Major
School of Education Fall 2013 – Fall 2017
2013 2014 2015 2016 2017
Elementary Education, B.S.Ed. 369 359 384 402 150
Elementary Education, A.S., pathway 32 49 54 55 293
Source: Office of Computing and Information Services Fall Enrollment Data Files, Dalton State College
Enrollment in the B.S.Ed. in elementary education experienced growth in 2015 and 2016 but declined in 2017. This decline was offset by increased growth in the A.S. pathway in elementary education and is somewhat artificial. Changes in financial aid funding now require colleges that have selective admissions standards to identify an alternative/complementary degree program that students select and can graduate from in the event they do not get admitted into the selective degree program. The A.S. pathway in elementary education was selected as the complementary major for the B.S.Ed., which requires students to pass specific state of Georgia exams and achieve a requisite GPA for admission.
0
50
100
150
200
250
300
350
400
450
2013 2014 2015 2016 2017
Enrollment by Undergraduate MajorSchool of Education
Associate's Programs BSEDEarly Childhood Education

6
Table 8.1-7 Enrollment by Undergraduate Majors
School of Health Professions, 2005-2015 Fall 2013 – Fall 2017
Programs 2013 2014 2015 2016 2017
Associate's Programs 1,007 908 986 828 790
Certificate Programs 249 155 116 93 87
BS Organizational Leadership 10 45 63 86 98
BS Health Information Management 0 0 13 35 31
BS Respiratory Therapy 0 0 11 6 10
BSN Nursing (RN-BSN) 79 122 114 98 90
BSW Social Work 147 130 113 116 109 Source: Office of Computing and Information Services Fall Enrollment Data Files, Dalton State College
Consolidation and moving of programs as well as the addition of new programs to form the new School of Health Professions have shifted enrollment growth in the school. Still, its programs in allied health, including the Associate of Science in Nursing program, are quite popular, fueling growth in these areas. Enrollment in social work has remained quite stable. The bachelor’s programs in health information and respiratory therapy are recent additions and will take time to grow. On the whole, given the popularity of health programs, the school should see enrollment growth in the years to come.
0
200
400
600
800
1000
1200
1400
1600
2013 2014 2015 2016 2017
Enrollment by Undergraduate MajorsSchool of Health Professions
Associate's Programs Certificate Programs BS Orgnztl. Leadershi
Bs Health info Mgmt BSRespiratory Therapy BSN Nursing (RN-BSN)
BSW Social Work

7
Table 8.1-8 Enrollment by Undergraduate Majors
School of Liberal Arts Fall 2013 – Fall 2017
Programs 2013 2014 2015 2016 2017
Associate's Programs 320 229 200 167 155
BA Communication - - - 37 87
BA English/Secondary Cert 156 132 130 135 120
BA History/Secondary Cert 178 153 151 155 153
BA Interdisciplinary Studies 6 29 42 32 29
BS Criminal Justice 216 200 200 186 190
BS Psychology - 173 203 196 201 Source: Office of Computing and Information Services Fall Enrollment Data Files, Dalton State College
The addition of new bachelor’s degree options and the deactivation of several associate’s- degree programs explain the decline in enrollment at the associate’s level. The fluctuations in English and history can be explained through the activation of the secondary certification option within both programs. The baccalaureate programs in psychology and criminal justice have grown and remained strong, while enrollment in the new bachelor’s degree in interdisciplinary studies began to decrease when the new bachelor’s degree in communication was approved in 2016.
0
200
400
600
800
1000
2013 2014 2015 2016 2017
Enrollment by Undergraduate MajorsSchool of Liberal Arts
Associate's Programs BA English BA English/Secondary Cert
BA History BA History/Secondary Cert BA Interdisciplinary Studies
BS Criminal Justice BS Psychology

8
Table 8.1-9 Enrollment by Undergraduate Majors
School of Science, Technology and Mathematics Fall 2013 – Fall 2017
Programs 2013 2014 2015 2016 2017
Associate's Programs 419 400 468 477 512
Certificate Programs 52 39 20 14 9
BS Biology/Secondary Cert 381 376 432 446 494
BS Chemistry/Secondary Cert 82 97 103 118 110
BS Mathematics/Secondary Cert 76 72 68 68 68 Source: Office of Computing and Information Services Fall Enrollment Data Files, Dalton State College
Some associate’s and certificate programs were also deactivated in the School of Science, Technology, and Mathematics or moved to other schools – explaining the enrollment declines. However, the baccalaureate programs have grown, especially in Biology. Growth in chemistry has been modest, but there was a slight decline in mathematics in the last year. The secondary certification options in math and the sciences have been stable, though low, and provide opportunities for growth.
0
100
200
300
400
500
600
2013 2014 2015 2016 2017
Enrollment by Undergraduate MajorsSchool of Science, Technology and Mathematics
Associate's Programs Certificate Programs BS BiologyBS Biology/Secondary Cert BS Chemistry BS Chemistry/Secondary CertBS Mathematics BS Mathematics/Secondary Cert
9
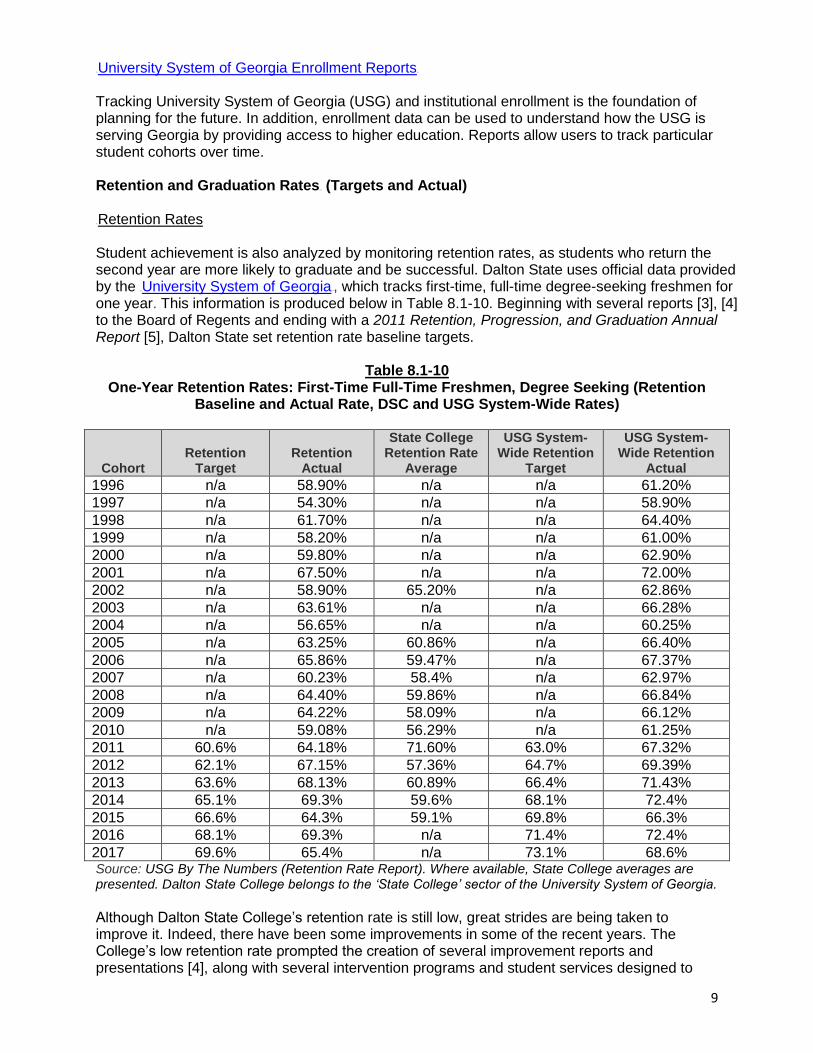
47TUniversity System of Georgia Enrollment Reports 47T Tracking University System of Georgia (USG) and institutional enrollment is the foundation of planning for the future. In addition, enrollment data can be used to understand how the USG is serving Georgia by providing access to higher education. Reports allow users to track particular student cohorts over time. Retention and Graduation Rates13T (Targets and Actual) 13TRetention Rates Student achievement is also analyzed by monitoring retention rates, as students who return the second year are more likely to graduate and be successful. Dalton State uses official data provided by the 47TUniversity System of Georgia47T, which tracks first-time, full-time degree-seeking freshmen for one year. This information is produced below in Table 8.1-10. Beginning with several reports [3], [4] to the Board of Regents and ending with a 2011 Retention, Progression, and Graduation Annual Report [5], Dalton State set retention rate baseline targets.
Table 8.1-10 One-Year Retention Rates: First-Time Full-Time Freshmen, Degree Seeking (Retention
Baseline and Actual Rate, DSC and USG System-Wide Rates)
Cohort
Retention
Target
Retention
Actual
State College Retention Rate
Average
USG System-Wide Retention
Target
USG System-Wide Retention
Actual
1996 n/a 58.90% n/a n/a 61.20%
1997 n/a 54.30% n/a n/a 58.90%
1998 n/a 61.70% n/a n/a 64.40%
1999 n/a 58.20% n/a n/a 61.00%
2000 n/a 59.80% n/a n/a 62.90%
2001 n/a 67.50% n/a n/a 72.00%
2002 n/a 58.90% 65.20% n/a 62.86%
2003 n/a 63.61% n/a n/a 66.28%
2004 n/a 56.65% n/a n/a 60.25%
2005 n/a 63.25% 60.86% n/a 66.40%
2006 n/a 65.86% 59.47% n/a 67.37%
2007 n/a 60.23% 58.4% n/a 62.97%
2008 n/a 64.40% 59.86% n/a 66.84%
2009 n/a 64.22% 58.09% n/a 66.12%
2010 n/a 59.08% 56.29% n/a 61.25%
2011 60.6% 64.18% 71.60% 63.0% 67.32%
2012 62.1% 67.15% 57.36% 64.7% 69.39%
2013 63.6% 68.13% 60.89% 66.4% 71.43%
2014 65.1% 69.3% 59.6% 68.1% 72.4%
2015 66.6% 64.3% 59.1% 69.8% 66.3%
2016 68.1% 69.3% n/a 71.4% 72.4%
2017 69.6% 65.4% n/a 73.1% 68.6%
Source: USG By The Numbers (Retention Rate Report). Where available, State College averages are presented. Dalton State College belongs to the ‘State College’ sector of the University System of Georgia.
Although Dalton State College’s retention rate is still low, great strides are being taken to improve it. Indeed, there have been some improvements in some of the recent years. The College’s low retention rate prompted the creation of several improvement reports and presentations [4], along with several intervention programs and student services designed to

10
improve retention and graduation at Dalton State College. The 47TFirst-Year Experience program47T, 47Tacademic advising program47T, 47TTutoring and Supplemental Instruction47T, and 47TSummer Bridge47T were all formed in direct response to the College’s retention statistics. Dalton State Retention Rates by Program Retention in Dalton State bachelor’s- and associate’s-degree programs is another measure of student achievement. Targets have not been established for these rates; however, the actual retention rates are used as a way to determine how Dalton State is doing in retaining bachelor’s- and associate’s-degree students. The College has focused on improving student retention by providing intrusive 47Tcareer 47Tand 47Tprogram/course advising47T and monitoring students’ progress throughout semesters. As Tables 8.1-11 and 8.1-12 below show, recent improvements in retaining bachelor’s- and associate’s-degree students are promising.
Table 8.1-11 One-Year Retention Rates
First-Time Full-Time Freshmen Bachelor’s-Degree Seekers
Academic Year
DSC
Retention Rate
State College Retention Rate
Average
USG System-Wide
Retention Rate
2001-02 72.73% n/a 72.73%
2002-03 70.00% n/a 75.00%
2003-04 67.65% n/a 79.41%
2004-05 37.50% n/a 39.3%
2005-06 61.82% n/a 64.55%
2006-07 67.91% n/a 70.15%
2007-08 61.21% n/a 64.66%
2008-09 67.86% n/a 70.92%
2009-10 70.33% n/a 72.00%
2010-11 64.86% n/a 66.86%
2011-12 61.98% n/a 65.50%
2012-13 71.24% 63.76% 73.91%
2013-14 71.17% 66.78% 75.68%
2014-15 74.60% 80.2% 78.00%
2015-16 73.7% n/a 76.9%
2016-17 68.4% n/a 72.8% Source: University System of Georgia Retention Rate Reports – USG by the Numbers. Where available, State College averages are presented. Dalton State College belongs to the ‘State College’ sector of the University System of Georgia.

11
Table 8.1-12 One-Year Retention Rates
First-Time Full-Time Freshmen Associate’s-Degree Seekers
Academic Year
DSC
Retention Rate
State College Retention Rate
Average
USG System-Wide
Retention Rate
1996-97 59.41% n/a 62.16%
1997-98 58.15% n/a 63.73%
1998-99 64.04% n/a 67.07%
1999-00 61.38% n/a 64.09%
2000-01 61.75% n/a 65.21%
2001-02 66.50% n/a 72.34%
2002-03 62.79% n/a 67.21%
2003-04 65.91% n/a 68.40%
2004-05 61.06% n/a 65.63%
2005-06 64.65% n/a 68.23%
2006-07 67.10% n/a 68.61%
2007-08 61.46% n/a 64.41%
2008-09 64.25% n/a 66.93%
2009-10 64.66% n/a 66.81%
2010-11 58.88% n/a 61.53%
2011-12 68.27% n/a 71.24%
2012-13 65.47% 55.69% 67.77%
2013-14 66.59% 55.83% 69.85%
2014-15 69.19% n/a 73.00%
2015-16 67.0% n/a 70.4%
2016-17 62.1% n/a 66.4% Source: University System of Georgia Retention Rate Reports – USG by the Numbers. Where available, State College averages are presented. Dalton State College belongs to the ‘State College’ sector of the University System of Georgia.
47TUniversity System of Georgia Graduation Rates Report Increasing graduation rates is one of the Board of Regents' 47Tstrategic goals47T. Factors that affect graduation rates include the student's academic preparation for college, motivation and study habits, finances, work, interaction with faculty, amount of financial aid available, and degree of fit between the student and institution. The graduation rate is the proportion of students who enter as first-time, full-time, degree-seeking students in a given summer or fall who earn a degree within 150 percent of the normal time needed to complete the degree. Bachelor’s degree graduation rates are calculated over six years; associate’s degree rates are calculated over three years [6]. Graduation Rates The graduation rates of students in baccalaureate- and associate’s-degree programs are principal indicators by which Dalton State measures student success and achievement. Aggregate “Bachelor’s Degree Six-Year Rates” and “Associate’s Three-Year Rates” tables are derived from data provided by the 47TUniversity System47T (see Graduation Rates), and made available in the Quick Facts (Retention and Graduation Rates) [7]. As examples, Tables 8.1-13 and 8.1-14 of the College’s Bachelor’s and Associate’s Degree graduation rates are shown below for convenience.

12
As can be seen in Tables 8.1-13 and 8.1-14, Dalton State’s graduation rates need improvement as they lag behind those of the University System, and it has been quite a challenge to meet its ambitious targets. There are many reasons for this. Part-time students with jobs—who comprise a significant percentage of Dalton State students—may be finding it difficult to fulfill some of their course requirements if courses are offered at times they cannot attend, substantially delaying their graduation. Therefore, the College is examining its course scheduling practices. Many students who are unable to complete bachelor’s degrees in their major at Dalton State also transfer to other colleges after completing their core classes, even before they complete an associate’s degree.
Table 8.1-13 Six-Year Bachelor’s Graduation Rates: First-Time Full-Time Freshmen, Degree Seeking
(Graduation Baseline and Actual Rate, DSC and USG System-Wide Rates)
Fall Cohort Year
DSC
Graduation Target
DSC
Graduation Actual
State College
Graduation Rate Average
USG System-Wide
Graduation Target
USG System-Wide
Graduation Actual
2005 16.5% 16.4% 18.92% 23.6% 23.6%
2006 17.5% 14.9% 15.85% 24.6% 20.9%
2007 18.5% 20.7% 24.49% 25.6% 18.1%
2008 19.5% 20.4% 23.47% 26.6% 26.5%
2009 20.5% 21.3% n/a 27.6% 32.3%
2010 21.5% 20.3% n/a 28.6% 15.0%
2011 22.5% 24.9% 21.0% 29.6% 23.6%
Source: USG By The Numbers (Graduation Rate Report). Where available, State College averages are presented. Dalton State College belongs to the ‘State College’ sector of the University System of Georgia.
13
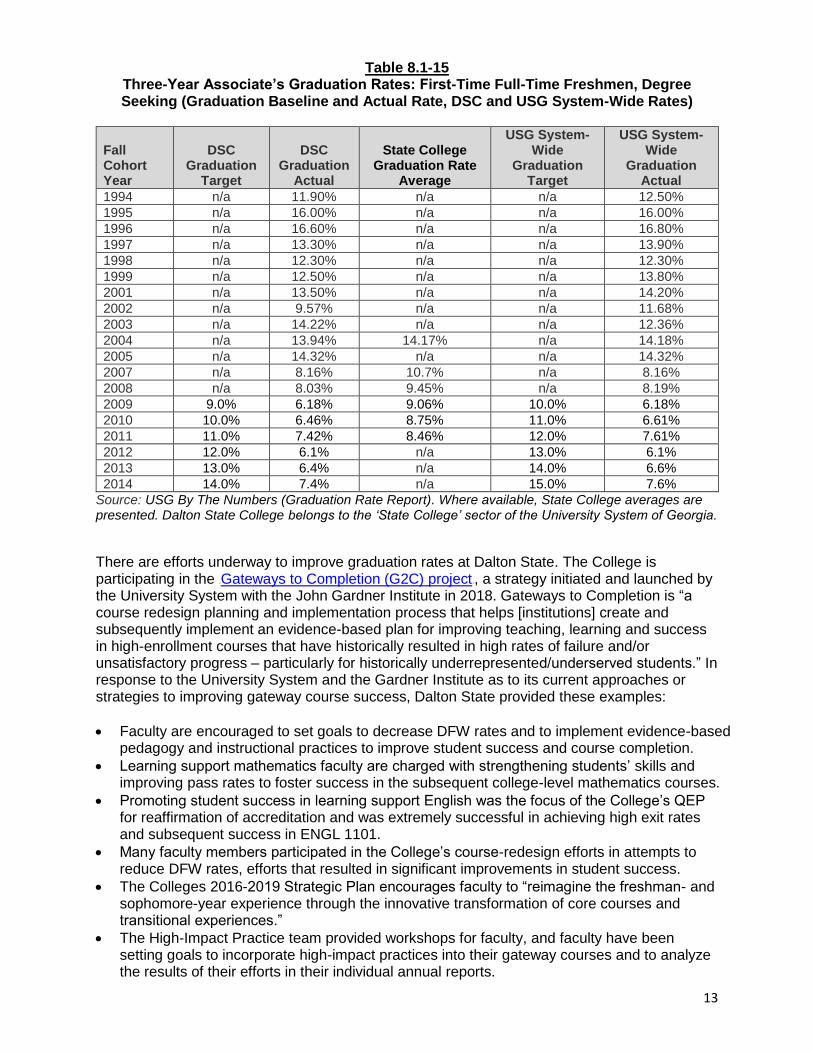
Table 8.1-15 Three-Year Associate’s Graduation Rates: First-Time Full-Time Freshmen, Degree Seeking (Graduation Baseline and Actual Rate, DSC and USG System-Wide Rates)
Fall Cohort Year
DSC
Graduation Target
DSC
Graduation Actual
State College
Graduation Rate Average
USG System-Wide
Graduation Target
USG System-Wide
Graduation Actual
1994 n/a 11.90% n/a n/a 12.50%
1995 n/a 16.00% n/a n/a 16.00%
1996 n/a 16.60% n/a n/a 16.80%
1997 n/a 13.30% n/a n/a 13.90%
1998 n/a 12.30% n/a n/a 12.30%
1999 n/a 12.50% n/a n/a 13.80%
2001 n/a 13.50% n/a n/a 14.20%
2002 n/a 9.57% n/a n/a 11.68%
2003 n/a 14.22% n/a n/a 12.36%
2004 n/a 13.94% 14.17% n/a 14.18%
2005 n/a 14.32% n/a n/a 14.32%
2007 n/a 8.16% 10.7% n/a 8.16%
2008 n/a 8.03% 9.45% n/a 8.19%
2009 9.0% 6.18% 9.06% 10.0% 6.18%
2010 10.0% 6.46% 8.75% 11.0% 6.61%
2011 11.0% 7.42% 8.46% 12.0% 7.61%
2012 12.0% 6.1% n/a 13.0% 6.1%
2013 13.0% 6.4% n/a 14.0% 6.6%
2014 14.0% 7.4% n/a 15.0% 7.6%
Source: USG By The Numbers (Graduation Rate Report). Where available, State College averages are presented. Dalton State College belongs to the ‘State College’ sector of the University System of Georgia.
There are efforts underway to improve graduation rates at Dalton State. The College is participating in the 47TGateways to Completion (G2C) project 47T, a strategy initiated and launched by the University System with the John Gardner Institute in 2018. Gateways to Completion is “a course redesign planning and implementation process that helps [institutions] create and subsequently implement an evidence-based plan for improving teaching, learning and success in high-enrollment courses that have historically resulted in high rates of failure and/or unsatisfactory progress – particularly for historically underrepresented/underserved students.” In response to the University System and the Gardner Institute as to its current approaches or strategies to improving gateway course success, Dalton State provided these examples:
Faculty are encouraged to set goals to decrease DFW rates and to implement evidence-based pedagogy and instructional practices to improve student success and course completion.
Learning support mathematics faculty are charged with strengthening students’ skills and improving pass rates to foster success in the subsequent college-level mathematics courses.
Promoting student success in learning support English was the focus of the College’s QEP for reaffirmation of accreditation and was extremely successful in achieving high exit rates and subsequent success in ENGL 1101.
Many faculty members participated in the College’s course-redesign efforts in attempts to reduce DFW rates, efforts that resulted in significant improvements in student success.
The Colleges 2016-2019 Strategic Plan encourages faculty to “reimagine the freshman- and sophomore-year experience through the innovative transformation of core courses and transitional experiences.”
The High-Impact Practice team provided workshops for faculty, and faculty have been setting goals to incorporate high-impact practices into their gateway courses and to analyze the results of their efforts in their individual annual reports.

14
The Department of Technology and Mathematics began offering all three gateway mathematics classes (MATH 1001, 1101, and 1111) to provide alternative mathematics pathways for non-STEM majors.
Mathematics and English faculty developed co-curricular support classes to provide just-in-time remediation for at-risk mathematics and English students.
13TFurthermore, to improve its graduation rates, Dalton State has been expanding its 13T47Tdistance learning offerings13T47T—online and hybrid courses which are especially effective at addressing the needs of part-time, working students, and 13T47Tadult learners13T47T. The College has also steadily increased the number of 13T47Tbaccalaureate degrees13T47T it offers, with degree selections based on student and employer demand. For example, the College has increased its baccalaureate offerings from 6 programs in 2003 to 24 in 2018. Also, in her presidential address to open the fall 2015 semester, the president listed improving graduation and retention rates as a top campus priority – with the formation of campus-wide retention, progression, and graduation committee to address issues and recommend strategies to improve retention and graduation rates [8]. Dean’s List The Dean’s List, published at the end of each term, is community-wide acknowledgement of high academic performance. Student recipients must have earned a GPA of at least 3.5, carried 12 or more semester credit hours, and received no grade of WF or U during the term. Since its inception, Dalton State has publicized the names of recipients, either in local newspapers, campus newsletters, emails, and, more recently, 47TInternet postings47T. As a percentage of student enrollment, the Dean’s List has grown very steadily; especially strong has been growth in summer and spring terms. Summer progress is nearly twice as large as it was four years ago. At 75% growth, spring is only three percentage points from being twice the size it was in 2011, while fall term has grown by nearly 50%.
Table 8.1-15 Percentage of Enrolled Students on Dean’s List
Calendar Year Fall Summer Spring
2011 12.7% 2.5% 12.4%
2012 15.2% 2.7% 13.9%
2013 17.3% 3.6% 16.3%
2014 18.0% 3.2% 18.5%
2015 19.8% 4.5% 21.4%
2016 19.0% 3.0% 20.1%
2017 19.7% N/A 20.3%
Source: 47TOffice of the Vice President for Academic Affairs 47T

15
Degrees and Certificates Awarded The number of degrees and certificates awarded reflects an institution's productivity and student success as well as the institution's mission, purposes, and objectives. Completion data for baccalaureate and associate’s degree programs and certificates are reported annually and published by the Office of Institutional Research and Planning in its 47TDashboard Fact Book (See “Student Achievement” – Awards and Degrees)47T, which also includes a 47TStudent Achievement: Graduation Statistics Fact Finder47T by major and other student attributes. In the 2016-2017 school year, the College awarded 843 degrees and certificates — a 7.8% increase from the previous year. In 2017-2018, the number of degrees awarded decreased to 810. Course Completion Grade Distribution in Individual Courses Every semester, the Office of Institutional Research and Planning
47T
publishes 47T
a table showing Grade Distribution by Course which provides course completion data, identifying courses in which more than 25% of students withdrew or received a grade of D, F, Incomplete, or Unsatisfactory, or where more than 33% of the students (including withdrawals) did not complete the course with a grade of A, B, C, or Satisfactory [9]. This information is used by the provost and vice president for academic affairs and the deans to discuss the success rate of individual courses and to concentrate attention and corrective action on courses with lower success rates [10]. The grade distribution reports and other student achievement data are archived at the
47T
Student Achievement Data webpage
47T
on the Institutional Research website. Course Completion Rates Schools also show evidence of course completion by producing data on the percentage of students who successfully complete all course requirements. For example, as part of its Annual Report [11], the School of Liberal Arts uses course completion rates as success indicators for its courses [12]. Tables 8.1-17 to 8.1-20 below shows the School’s English Composition (ENGL 1101) completion rates:
Table 8.1-16 Percentage of Students Completing ENGL 1101 with a C or Better
Fall Semester 2016, Spring 2017, and Summer 2017, Excluding Withdrawals (High levels of student achievement)
Course (A, B, C, D, F Only) Total # of Students
(A, B, C Only) % Passed with C or Better
% Failed (D, F, and/or WF)
Fall 2016 789 686 (87%) 103 (13%)
Spring 2017 343 280 (82%) 63 (18%)
Summer 2017 15 15 (100%) 0 (0%)
Total 1,147 981 (86%) 166 (14%)
Source: School of Liberal Arts Annual Report, 2016-2017, p. 135 [12] *Some percentages may not total 100% because of rounding.

16
Table 8.1-17 Percentage of Students Completing ENGL 1101 with a C or Better
Fall Semester 2016, Spring 2017, and Summer 2017, Including Withdrawals (High levels of student achievement)
Course
Total # of Students (including Ws)
% Passed with C or Better
% Failed (D, F, and/or WF)
W
Fall 2016 820 686 (84%) 103 (13%) 31 (4%)
Spring 2017 360 280 (78%) 63 (18%) 17 (5%)
Summer 2017 15 15 (100) 0 (0%) 0 (0%)
Total 1,195 981 (82%) 166 (14%) 48 (4%)
Source: School of Liberal Arts Annual Report, 2016-2017, p. 135 [12] *Some percentages may not total 100% because of rounding.
Table 8:1-18
Percentage of Students Completing ENGL 1101 with a C or Better, Fall, Spring, and Summer Terms (Excluding Withdrawals), 2006 through 2017
(High levels of student achievement)
Course # of Students % Passed with C or Better % Failed (D, F, or WF)
2006-2007 753 590 (78%) 163 (22%)
2007-2008 1,041 829 (80%) 212 (20%)
2008-2009 1,492 1,212 (81%) 280 (19%)
2009-2010 1,693 1,390 (82%) 303 (18%)
2010-2011 1,561 1,229 (79%) 332 (21%)
2011-2012 1,404 1,130 (80%) 274 (20%)
2012-2013 1,228 1,037 (84%) 191 (16%)
2013-2014 1,230 1,040 (85%) 190 (15%)
2014-2015 1,060 876 (83%) 184 (17%)
2015-2016 1,171 993 (85%) 178 (15%)
2016-2017 1,147 981 (86%) 166 (14%)
Source: School of Liberal Arts Annual Report, 2016-2017, p. 136 [12] *Some percentages may not total 100% because of rounding.
17
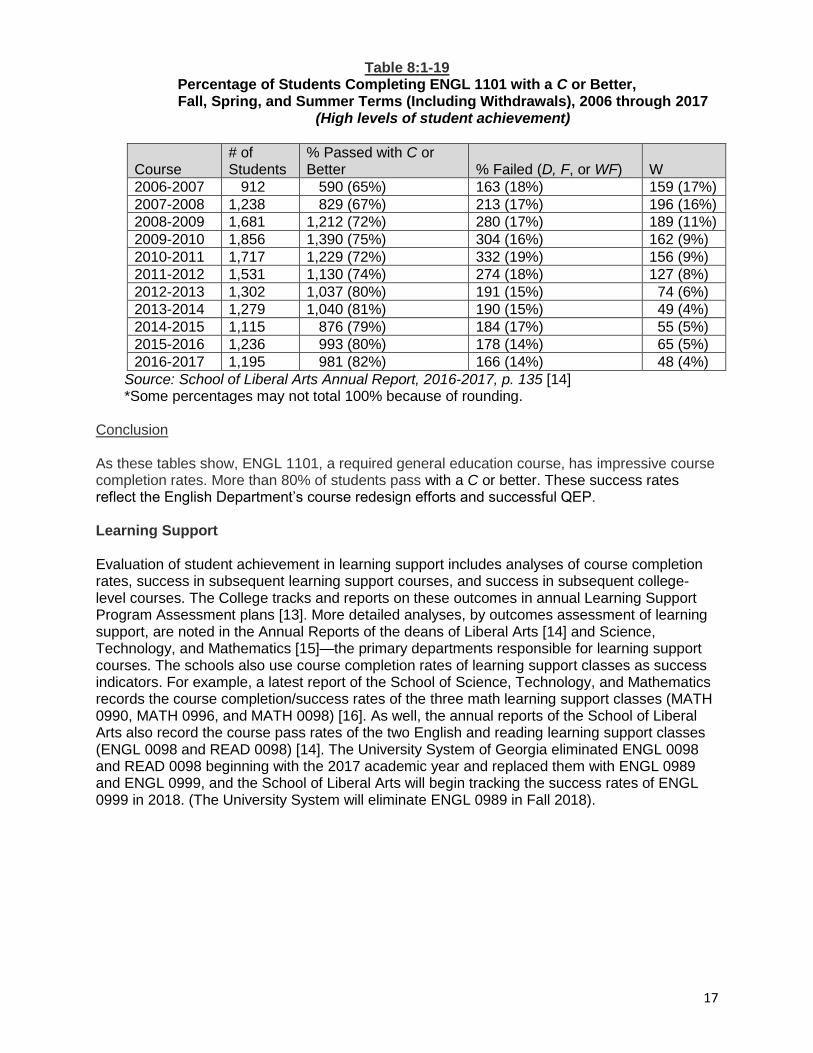
Table 8:1-19 Percentage of Students Completing ENGL 1101 with a C or Better, Fall, Spring, and Summer Terms (Including Withdrawals), 2006 through 2017
(High levels of student achievement)
Course
# of Students
% Passed with C or Better
% Failed (D, F, or WF)
W
2006-2007 912 590 (65%) 163 (18%) 159 (17%)
2007-2008 1,238 829 (67%) 213 (17%) 196 (16%)
2008-2009 1,681 1,212 (72%) 280 (17%) 189 (11%)
2009-2010 1,856 1,390 (75%) 304 (16%) 162 (9%)
2010-2011 1,717 1,229 (72%) 332 (19%) 156 (9%)
2011-2012 1,531 1,130 (74%) 274 (18%) 127 (8%)
2012-2013 1,302 1,037 (80%) 191 (15%) 74 (6%)
2013-2014 1,279 1,040 (81%) 190 (15%) 49 (4%)
2014-2015 1,115 876 (79%) 184 (17%) 55 (5%)
2015-2016 1,236 993 (80%) 178 (14%) 65 (5%)
2016-2017 1,195 981 (82%) 166 (14%) 48 (4%)
Source: School of Liberal Arts Annual Report, 2016-2017, p. 135 [14] *Some percentages may not total 100% because of rounding. Conclusion As these tables show, ENGL 1101, a required general education course, has impressive course completion rates. More than 80% of students pass with a C or better. These success rates reflect the English Department’s course redesign efforts and successful QEP. Learning Support Evaluation of student achievement in learning support includes analyses of course completion rates, success in subsequent learning support courses, and success in subsequent college-level courses. The College tracks and reports on these outcomes in annual Learning Support Program Assessment plans [13]. More detailed analyses, by outcomes assessment of learning support, are noted in the Annual Reports of the deans of Liberal Arts [14] and Science, Technology, and Mathematics [15]—the primary departments responsible for learning support courses. The schools also use course completion rates of learning support classes as success indicators. For example, a latest report of the School of Science, Technology, and Mathematics records the course completion/success rates of the three math learning support classes (MATH 0990, MATH 0996, and MATH 0098) [16]. As well, the annual reports of the School of Liberal Arts also record the course pass rates of the two English and reading learning support classes (ENGL 0098 and READ 0098) [14]. The University System of Georgia eliminated ENGL 0098 and READ 0098 beginning with the 2017 academic year and replaced them with ENGL 0989 and ENGL 0999, and the School of Liberal Arts will begin tracking the success rates of ENGL 0999 in 2018. (The University System will eliminate ENGL 0989 in Fall 2018).

18
Table 8.1-20 Percentage of Students Completing All Course Requirements in Math Course and
Earning a Passing Grade
Spring 2017 Summer 2017 Fall 2017
Course Expected** Attained Expected** Attained Expected** Attained
Math 0997* 50% 33.33% 50% N.A. 50% 50%
Math 0998* 50% 30% 50% 25% 50% 44.71%
Math 0999* 50% 45.74% 50% 66.67% 50% 57.45%
Math 0989* 67% 66.67% 67% N.A. 67% 74.6%
Source: Coordinator for Learning Support * The above learning support courses came into effect in Fall 2015. Also, MATH 0989 will be terminated at the end of Spring 2018. ** Based on results from Spring 2014 through Fall 2016 including predecessor course MATH 0098.
Table 8.1-21 Reading Pass Rates for READ 0098
Fall Semester 2016 and Spring Semester 2017
Semester
Total Number of
Students
% Exited
% Did Not
Exit*
Fall 2016 172 152 (88%) 20 (12%)
Spring 2017 41 34 (83%) 7 (17%)
Total 213 186 (87%) 27 (13%)
Source: School of Liberal Arts Annual Report, 2016-2017, p. 133 [14] *Includes withdrawals.
Table 8.1-22 Exit Rates for READ 0098 Over Time
Year Exit Rate for Reading 0098
2010-2011 67%
2011-2012 69%
2012-2013 77%
2013-2014 92%
2014-2015 84%
2015-2016 76%
2016-2017 87%
Source: School of Liberal Arts Annual Report, 2016-2017, p. 133 [14]

19
Table 8.1-23 End-of-Term Essay Pass Rates for ENGL 0098
Fall Semester 2016 and Spring Semester 2017 (High levels of student achievement)
Term
Course
Total Number of
Students Who Qualified
% Passed
Essay
% Failed
Fall 2016 ENGL 0098 162 147 (91%) 15 (9%)
Spring 2017 ENGL 0098 51 44 (86%) 7 (14%)
Total 213 191 (90%) 22 (10%)
Source: School of Liberal Arts Annual Report, 2016-2017, p. 134 [14]
Table 8.1-24
End-of-Term Essay Pass Rates for ENGL 0098 and ENGL 0975:
2004/2005 through 2016/2017*
Year Exit Essay ENGL 0975 Exit Essay ENGL 0098
2004/2005 53% 75%
2005/2006 45% 82%
2006/2007 50% 82%
2007/2008 75% 82%
2008/2009 n/a 74%
2009/2010 n/a 79%
2010/2011 n/a 80%
2011/2012 n/a 80%
2012/2013 n/a 90%
2013/2014 n/a 93%
2014/2015 n/a 91%
2015/2016 n/a 88%
2016/2017 n/a 90%
Source: School of Liberal Arts Annual Report, 2016-2017, p. 134 [14] *Includes only those students who were eligible to write the end-of-term essay. Conclusion Overall, these data indicate the College’s success with its learning support programs, especially in English. These data help the College strengthen its efforts on improving student success in Learning Support classes, particularly in Mathematics. Distance Education The Office of Academic Affairs publishes annual Distance Education Data, including analysis of student course completion and comparison of course outcomes with traditional courses. These data are published in the College’s annual Profile of Distance Learning [17] and are available on the Office of Institutional Research and Planning's Website. The latest example of the College’s Distance Education data analysis is included below. As shown in Table 8.1-26, the 2016-17 completion rate for Distance Learning courses are similar to the completion rate for traditional courses, suggesting that Distance Learning courses are approximately equal to the education quality experienced in traditional courses.

20
Table 8.1-25 2016-2017 Distance Education Data
2016-2017 Distance Education Data
Fall 2016
Spring 2017
Summer 2017
Total
Total Online Sections 27 42 34 103
Total Online Students 482 763 609 1,854
Non-duplicated headcount 392 586 421 1,399
Total hybrid sections 52 48 22 122
Total hybrid students 1,187 1,126 239 2,552
Non-duplicated headcount 1,014 918 210 2,142
Number of Students Taking Only DL Courses, 2016-2017
132 161 333
Completion Rate for DL Courses, 2016-2017 97% 93% 95%
Completion Rate for Traditional Courses, 2016-2017
97% 94% 97%
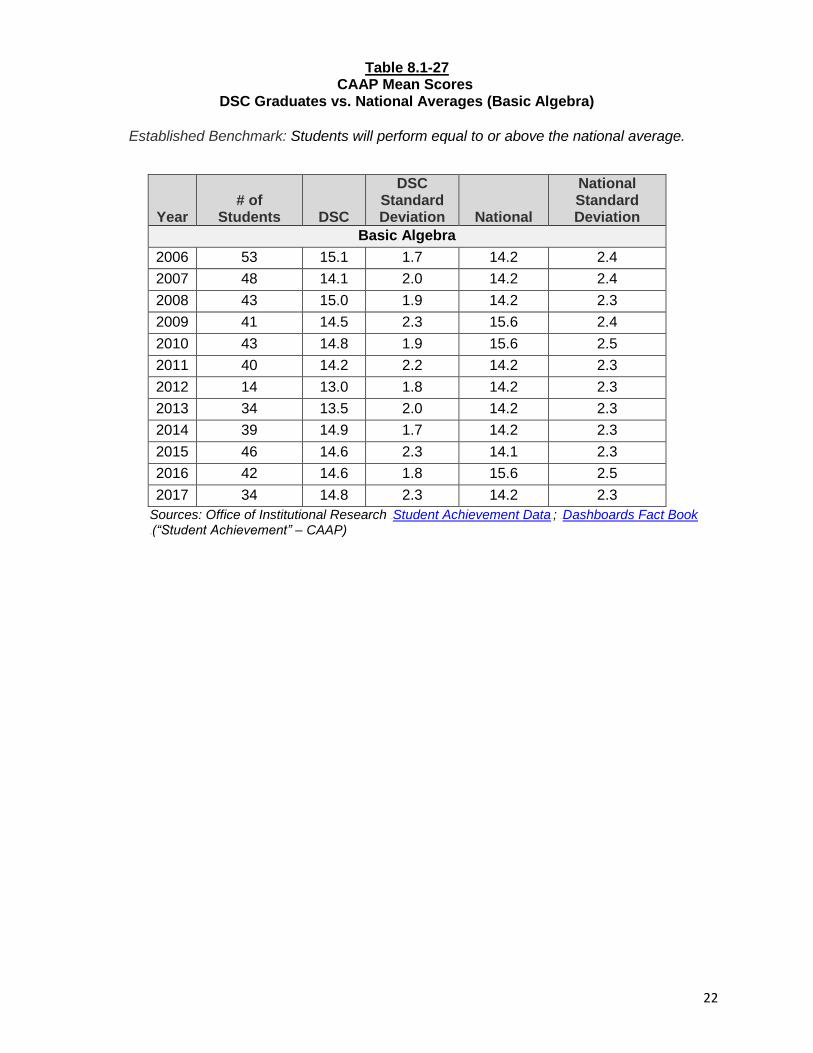
Source: BANNER Student Information System, Office of Computing & Information Services Performance on External Examinations Dalton State also tracks student achievement by performance on external examinations, including licensing and certification exams, administered for each respective program/school. Target pass rates are set for each area by the program; however, most aim to exceed the national average. Student Achievement in General Education As per 47TUniversity System of Georgia guidelines47T, Dalton State identifies general education competencies in the areas of Communication Outcomes, Humanities/Fine Arts, Social Sciences, and Quantitative Reasoning and Scientific Reasoning (Natural Science, Technology, and Mathematics) [18]. The extent to which graduates attain these competencies as a measure of student achievement is assessed in part through externally developed, validated, and normed instruments for their alignment with the College’s general education competencies. The College adopted the Collegiate Assessment of Academic Proficiency (CAAP) tests to determine student competency in Reading (Arts/Literature, Social Sciences), Mathematics (Basic Algebra, College Algebra), Science Reasoning, and Critical Thinking. Results of these tests are published 47Tonline as part of student achievement data47T (see Collegiate Assessment of Academic Proficiency) and summarized in the College's 47TDashboards Fact Book (See “Student Achievement” – CAAP). As shown in Tables 8.1-27 to 8.1-32, in the general education arena, DSC’s students continue to do well on the CAAP graduating students’ test. Of the 6 CAAP subtests reported below for 2017, DSC students scored above the National Mean. Specifically, in Reading (62.1 vs 59.4), Mathematics (56.9 vs 56.1), Basic Algebra (14.8 vs 14.2), Science (60.0 vs 59.1), and Critical Thinking (62.1 vs 59.4). These scores provide administration and faculty with important feedback relevant to continual improvement in each student competency.

21
Table 8.1-26 CAAP Mean Scores
DSC Graduates vs. National Averages (Mathematics) Established Benchmark: Students will perform equal to or above the national average.
Year
# of
Students
DSC
DSC Standard Deviation
National
National Standard Deviation
Mathematics
1999 211 54.0 3.3 57.9 3.7
2001 23 57.3 3.2 58.4 4.0
2002 40 58.6 3.1 58.5 4.1
2003 44 57.1 3.5 56.2 3.5
2004 51 57.1 2.5 56.2 3.5
2006 53 57.9 2.6 56.1 3.6
2007 48 56.6 3.1 56.1 3.6
2008 43 57.4 2.9 56.2 3.5
2009 41 57.1 3.9 58.5 4.0
2010 43 56.9 2.7 58.5 4.1
2011 40 55.5 3.6 56.1 3.6
2012 14 54.4 2.6 56.1 3.5
2013 34 54.7 3.3 56.1 3.5
2014 39 56.7 2.5 56.0 3.5
2015 46 56.4 3.6 56.0 3.6
2016 42 56.7 3.1 58.7 4.3
2017 34 56.9 3.5 56.1 3.5
Sources: Office of Institutional Research 47TStudent Achievement Data47T; 47TDashboards Fact Book 47T(“Student Achievement” – CAAP)
22
Table 8.1-27 CAAP Mean Scores
DSC Graduates vs. National Averages (Basic Algebra)
Established Benchmark: Students will perform equal to or above the national average.
Year
# of
Students
DSC
DSC Standard Deviation
National
National Standard Deviation
Basic Algebra
2006 53 15.1 1.7 14.2 2.4
2007 48 14.1 2.0 14.2 2.4
2008 43 15.0 1.9 14.2 2.3
2009 41 14.5 2.3 15.6 2.4
2010 43 14.8 1.9 15.6 2.5
2011 40 14.2 2.2 14.2 2.3
2012 14 13.0 1.8 14.2 2.3
2013 34 13.5 2.0 14.2 2.3
2014 39 14.9 1.7 14.2 2.3
2015 46 14.6 2.3 14.1 2.3
2016 42 14.6 1.8 15.6 2.5
2017 34 14.8 2.3 14.2 2.3
Sources: Office of Institutional Research 47TStudent Achievement Data47T; 47TDashboards Fact Book 47T(“Student Achievement” – CAAP)

23
Table 8.1-28 CAAP Mean Scores
DSC Graduates vs. National Averages (College Algebra)
Established Benchmark: Students will perform equal to or above the national average.
Year
# of
Students
DSC
DSC Standard Deviation
National
National Standard Deviation
College Algebra
2007 48 14.0 1.7 14.0 2.1
2008 43 14.7 1.8 14 2.1
2009 41 14.2 2.3 15.4 2.7
2010 43 14.0 1.9 15.4 2.8
2011 40 13.5 2.1 14.0 2.1
2012 14 13.1 1.5 14.0 2.1
2013 34 12.9 1.9 14.0 2.1
2014 39 13.6 1.7 13.9 2.1
2015 46 14.1 2.2 13.9 2.1
2016 42 14.0 2.1 15.7 2.9
2017 34 14.0 2.3 14.1 2.0
Sources: Office of Institutional Research 47TStudent Achievement Data47T; 47TDashboards Fact Book 47T(“Student Achievement” – CAAP)

24
Table 8.1-29 CAAP Mean Scores
DSC Graduates vs. National Averages (Critical Thinking)
Established Benchmark: Students will perform equal to or above the national average.
Year
# of
Students
DSC
DSC Standard Deviation
National
National Standard Deviation
Critical Thinking
1999 205 60.5 5.0 62.3 5.3
2001 21 63.3 4.1 62.4 5.3
2002 28 63.8 5.0 62.4 5.4
2003 45 64.2 4.4 60.5 5.5
2004 51 64.2 4.9 60.5 5.5
2006 48 63.1 4.5 60.7 5.3
2007 48 62.5 5.1 60.9 5.4
2008 43 62.0 5.4 60.9 5.4
2009 40 61.3 4.5 62.3 5.4
2010 42 62.0 4.7 62.0 5.4
2011 41 59.7 5.7 60.7 5.4
2012 15 61.3 6.4 60.6 5.4
2013 32 62.3 4.5 60.6 5.4
2014 39 62.8 4.6 60.8 5.3
2015 42 62.3 4.6 60.6 5.4
2016 39 63.2 5.2 59.7 5.5
2017 34 62.1 6.2 59.4 5.2
Sources: Office of Institutional Research 47TStudent Achievement Data47T; 47TDashboards Fact Book 47T(“Student Achievement” – CAAP)

25
Table 8.1-30 CAAP Mean Scores
DSC Graduates vs. National Averages (Reading)
Established Benchmark: Students will perform equal to or above the national average.
Year
# of
Students
DSC
DSC
Standard
Deviation
National
National
Standard
Deviation
Reading
1999 207 59.0 4.6 62.9 5.2
2001 22 62.8 5.8 62.9 5.1
2002 28 63.4 3.8 62.9 5.4
2003 44 63.5 4.5 60.6 5.4
2004 53 62.8 4.5 60.6 5.4
2006 51 63.0 5.4 60.4 5.5
2007 48 62.8 4.7 60.5 5.4
2008 43 62.5 4.9 60.5 5.4
2009 41 61 3.9 62.5 5.1
2010 42 62.7 4.1 62.5 5.2
2011 42 61.6 5.4 60.3 5.5
2012 15 59.7 4.7 60.1 5.4
2013 34 62.2 5.5 60.1 5.4
2014 38 61.7 5.2 60.2 5.6
2015 45 60.5 4.5 60.1 5.5
2016 41 62.6 4.8 61.3 5.6
2017 34 62.1 6.2 59.4 5.2
Sources: Office of Institutional Research 47TStudent Achievement Data47T; 47TDashboards Fact Book 47T(“Student Achievement” – CAAP)

26
Table 8.1-31 CAAP Mean Scores
DSC Graduates vs. National Averages (Science)
Established Benchmark: Students will perform equal to or above the national average.
Year
# of
Students
DSC
DSC
Standard
Deviation
National
National
Standard
Deviation
Science
1999 206 57.9 3.7 60.7 4.5
2001 19 61.5 4.1 61.0 4.6
2002 41 61.0 4.1 61.1 4.6
2003 45 60.6 3.9 59.0 4.2
2004 53 60.3 4.1 59.0 4.2
2006 51 59.6 4.0 59.0 4.1
2007 43 60.5 3.8 59.1 4.1
2008 44 60.6 3.7 59.2 4.1
2009 39 59.8 4.2 61.7 4.4
2010 42 60.0 4.1 61.7 4.5
2011 40 58.7 3.6 59.1 4.1
2012 14 60.1 3.7 59.2 4.1
2013 37 59.9 3.5 59.2 4.1
2014 40 60.3 3.1 59.2 4.2
2015 47 59.4 3.7 59.2 4.2
2016 39 60.8 3.9 61.0 4.9
2017 34 60.0 4.7 59.1 4.1
Sources: Office of Institutional Research 47TStudent Achievement Data47T; 47TDashboards Fact Book 47T(“Student Achievement” – CAAP)
13TUntil December 2014, general education competencies were also assessed using the internally developed Graduating Student Survey (i.e., graduates reported how much their Dalton State education had contributed to their acquisition of specific knowledge, skills, and behaviors) [19]. In 2015-2016, the College began using a newly adopted external instrument, 13Tthe 47TCollege Senior Survey,47T administered by the 47THigher Education Research Institute (HERI),47T to measure student perceptions of their general education competencies. Additional questions from the College’s previous survey instrument concerning general education attainment were added to existing questions on general education in the HERI survey instrument to continue the tradition of assessing general education competencies through an exit survey of graduating seniors [20]. And 13Tas previously noted, annual reports produced by, for example, the School of Liberal Arts 13T[21] 13Tare also used to determine the extent to which graduates have attained the student learning outcomes in general education. Finally, faculty teaching general education courses also assess the competencies attained by students using Weave [22], including an assessment of the general education program in Weave by deans with general education responsibilities [23].

27
ETS Major Field Test in Business As a measure of student success, 27TC. Lamar and Ann Wright School of Business27T administers the external 47TETS Major Field Test in Business47T to its graduates. The ETS Major Field Test is a comprehensive undergraduate outcomes assessment designed to measure the critical knowledge and understanding achieved by business majors. This test offers comprehensive national comparative data, enabling the School to evaluate its graduates’ performance and compare its programs’ effectiveness to programs at similar institutions nationwide. A summary of graduates’ scores is presented in the College 47TDashboard Fact Book47T (see “Student Achievement” – Professional and Licensure Exams) and shown below in Table 8.1-3327T.
Table 8.1-32 ETS Major Field in Business Test Scores
C. Lamar and Ann Wright School of Business Baccalaureate Students
Established Benchmark: Seventy percent of students will score in the 75P
thP percentile on the ETS.
Date
Students Tested
Scale Range for Total Score
Scale Score Mean
Standard Deviation
Nov. 2000 51 120-200 146.3 11.5
Jan. 2002 74 120-200 148.7 10.3
May 2002 24 120-200 149.7 10.4
Fall 2002 26 120-200 148.3 9.1
Fall 2003 49 120-200 155.0 14.9
Spring 2004 45 120-200 159.3 13.7
Spring 2005 25 120-200 161.0 10.7
Spring 2006 39 120-200 162.0 11
Spring 2007 27 120-200 160.4 12.2
Spring 2008 31 120-200 159.0 11
Spring 2009 31 120-200 157.0 16
Spring 2010 61 120-200 158.0 12
Spring 2011 29 120-200 162.0 14
Spring 2012 39 120-200 160.0 12
Spring 2013 43 120-200 157.0 12
Spring 2014 39 120-200 157.0 11
Spring 2015 52 120-200 156.0 11
Spring 2016 65 120-200 155.0 12
Spring 2017 72 120-200 155.0 16
Sources: Annual Report, C. Lamar and Ann Wright School of Business [24]; Office of Institutional Research 47TStudent Achievement Data 47T; 47TDashboards Fact Book47T (“Student Achievement”’ – Professional and Licensure Exams)
13TDuring spring 2017, 72 business students took the ETS, and the College’s institutional mean was 155, which was in the 80P
thP percentile of all participating institutions.
Licensing Examinations Graduates of some programs at Dalton State take certification exams. These students are deemed successful when they graduate and successfully pass their state and national exams to qualify for professional licensure. Indeed, the percentage of students passing these exams is an indication of student achievement and academic program effectiveness in preparing students to obtain the necessary credentials for employment. Often, these scores are incorporated into program reviews and annual program assessment reports for academic degree and certificate programs. The College’s Licensing Examination pass rates are published each year in the 47TDashboard Fact Book47T (see “Student Achievement” – Professional and Licensure Exams), and

28
at the Institutional Research office’s 47TStudent Achievement webpage47T. pass rates from licensure examinations are provided below. School of Education The NCATE-accredited baccalaureate Early Childhood Education program is highly regarded for its quality as evidenced in pass rates of graduates who take the 47TGeorgia Assessments for the Certification of Educators (GACE) 47T. Candidates who have completed the School of Education’s professional teacher education program in early childhood are required to pass the state-required GACE exam for licensure in Georgia. As seen in Table 8.1-34, the school had a 100% pass rate in 2015. Reports from GACE indicate DSC’s pass rate is similar to the state of Georgia pass rates. The Georgia Professional Standards Commission (GaPSC) reports pass rates and considers a score as passing if the test is passed within a given amount of attempts and if it is passed within a certain time frame from completion of the program. This has been a new stipulation in recent years. In other words, the Educator Preparation Provider (EPP) can count the test as passed only if the candidate passes it by meeting the criteria mentioned. For certification purposes, the candidate can take the test as many times as needed to pass; however, the EPP will not be able to count the score as passing at this point. In the last three academic years, the GaPSC reported separate pass rates for GACE Test 1 and GACE Test 2. This is the reason for the two percentage scores reported in the last three academic years.
Table 8.1-33 Georgia Assessments for the Certification of Educators (GACE)
Early Childhood Content - Graduates' Post-Test Pass Rates
Year Tested Passed/Tested
Success Benchmark
DSC Pass Rate
State Pass Rate
2007 63/63 80% 100% N/A
2008 64/64 80% 100% N/A
2009-2010 68/68 80% 99% 93
2010-2011 68/71 80% 98% 91
2011-2012 58/59 80% 97% 92
2012-2013 57/59 80% 96% 96
2013-2014 55/58 80% 95% 99
2014-2015 64/66 80% 97%/97% 99/96
2015-2016 49/49 80% 100%/100% 100/100
2016-2017 61/61 80% 100%/100% 100/100
Sources: Annual Report, School of Education [25]; Dalton State 47TDashboards Fact Book 47T(“Student Achievement” – Professional and Licensure Exams)
47TSchool of Health Professions RN (2-Year) Nursing (A.S.N.) The Associate of Science in Nursing program (RN) measures its effectiveness in relation to student achievement by the first-attempt pass rates of its graduates on the National Council for Licensure Examinations-Registered Nurse (NCLEX-RN), administered by the National Council of State Boards of Nursing. The 2014 ASN graduates taking the NCLEX-RN examination within one year of graduation had a 2015 pass rate of 69% as noted Table 4.1-35 below. Because of the recent drop in program pass rates, the faculty from the Department of Nursing and the dean of Health Professions explored ways to return success rates to their previously high levels. Some strategies adopted have included using the flipped classroom model for ASN courses, accepting fewer than 70 students per cohort, decreasing clinical group size to 5-to-7 students per clinical instructor, utilizing Assessment Technologies Institute (ATI) resources, utilizing more simulations in

29
each course, having nurse preceptors for students in their last semesters, instituting an Electronic Health Records (EHR) program beginning fall 2016, developing an online process for student portfolios, and developing four new Nursing committees (Curriculum Committee, Exam/Test Writing Committee, Grievance Committee, and Faculty Bylaws and Diversity Committee). All of these improvements have been implemented. In 2017, the first-time NCLEX-RN pass rates for Dalton State graduates increased to 93.44%.
Table 8.1-34 RN (2-Year) Nursing Program NCLEX Scores/Pass Rates
Established Benchmark: Students will pass on the first try at or above the national average.
Year of Graduation
DSC Pass Rate
GA State Average
National Average
#DSC Pass/Takers
2003 85% 87% 87% 45/53
2004 88% 88% 84% 42/48
2005 87% 89% 87% 45/51
2006 86% 90% 88% 42/49
2007 82% 88% 85% 45/55
2008 87% 91% 87% 66/76
2009 93% 92% 88% 51/55
2010 78% 90% 87% 42/54
2011 89% 90% 88% 55/61
2012 89% 91% 88% 55/62
2013 97% 92% 90% 59/61
2014 66% 84% 81% 40/61
2015 69% 86% 79.3% 49/71
2016 72.04% 85.4% 84.57% 44/56
2017 93.44% 87.31% 87.11% 57/61
Sources: Annual Report, School of Health Professions [26]; Dalton State 47TDashboards Fact Book 47T(“Student Achievement” – Professional and Licensure Exams)
Radiologic Technology (A.A.S.) In 2017, Dalton State graduated 14 Radiologic Technology students who sat for the 200-question national exam the same year. Thirteen out of the 14 students (93%) passed the examination. Dalton State’s Radiologic Technology program tracks graduate pass rates on the American Registry of Radiologic Technologists (ARRT) examination. For 18 years of its 20-year history, Dalton State’s Radiologic Technology program achieved a 100% pass rate on the national certification exam, the ARRT (Table 8.1-36). Solid long-term performance on this professional exam positions Dalton State’s Radiologic Technology program among top performing Radiologic Technology programs in the United States.

30
Table 8.1-35 Radiologic Technology Program ARRT Registry Examination Pass Rates
Year
Established Benchmark
DSC Pass
Rate
Total
Pass/Takers
DSC Average
Score
National Average
National
Pass Rate
1998 80% 100% 5/5 90 84 90%
1999 80% 100% 6/6 89 83 89%
2000 80% 100% 10/10 87 83 91%
2001 80% 100% 7/7 88 84 90%
2002 80% 100% 6/6 89 84 88%
2003 80% 100% 6/6 91 83 89%
2004 80% 100% 13/13 90 84 89%
2005 80% 100% 13/13 91 85 89%
2006 80% 100% 13/13 91 85 89%
2007 80% 100% 15/15 91 85 91%
2008 80% 100% 15/15 87 85 91%
2009 80% 100% 15/15 90 88 88%
2010 80% 100% 17/17 89 88 91%
2011 80% 100% 16/16 84 85 90%
2012 80% 100% 17/17 88 89 91%
2013 80% 100% 16/16 89 84 90%
2014 80% 100% 13/13 86 84 89$
2015 80% 100% 14/14 85 84 88%
2016 80% 93% 13/14 84 83 87%
2017 80% 93% 13/14 81 84 89%
Sources: Annual Report, School of Health Professions [26]; Dalton State 47TDashboards Fact Book 47T(“Student Achievement” – Professional and Licensure Exams)
Respiratory Therapy (A.A.S.) The Respiratory Therapy program tracks graduate pass rates on the Certified Respiratory Therapists (CRT) examination. For the eighth year running, Dalton State’s Respiratory Therapy graduates have achieved a 100% pass rate—exceptional work when compared with the 64.4% average of the national pass rate for the same period (Table 8.1-37).
Table 8.1-36
Respiratory Therapy Program Certification Examination Pass Rates
Year
Established
Benchmark
DSC Pass
Rate
Total
Pass/Takers
National Pass
Rate
2008 80% 100% 5/5 79.5%
2009 80% 100% 8/8 79.6%
2010 80% 100% 8/8 80.1%
2011 80% 100% 9/9 77.8%
2012 80% 100% 9/9 Not calculated
2013 80% 100% 12/12 60%
2014 80% 100% 13/13 80.5%
2015 80% 100% 14/14 73%
2016 80% 100% 14/14 84%
2017 80% 100% 12/12 81.7%
Sources: Annual Report, School of Health Professions [26]; Dalton State 47TDashboards Fact Book 47T(“Student Achievement” – Professional and Licensure Exams

31
Medical Laboratory Technology (A.A.S.) The Medical Laboratory Technology (MLT) program tracks graduate pass rates on the American Medical Technologists (AMT) examination. For 17 of its 21-year existence, the Medical Laboratory Tech program has scored a 100% pass rate on its licensure exams. Once again in 2017 (Table 8.1-38), 100% of Dalton State’s Medical Laboratory Technology graduates passed their licensing certification examination on the first attempt. This compares to a 2017 National Pass Rate of 81.1%. Since its first graduating class was tested 19 years ago, Dalton State’s MLT mean licensure exam pass rate is 95.6%. For that same period, the national mean pass rate is 69%. Table 8.1-37 Medical Laboratory Technology Program Licensure Examination Scores/Pass Rates
Year
Number of Students
Established Benchmark
DSC Pass Rate
National Exam Pass Rate for MLT Programs
1997 9 80% 91% 72%
1998 4 80% 100% 69%
1999 8 80% 50% 76%
2000 7 80% 100% 66%
2001 6 80% 100% 71%
2002 1 80% 100% n/a
2003 4 80% 100% 70%
2004 0 80% n/a n/a
2005 5 80% 80% 75%
2006 6 80% 100% 78%
2007 5 80% 100% 78%
2008 2 80% 100% 81%
2009 5 80% 100% 69%
2010 5 80% 100% 72%
2011 9 80% 100% 72%
2012 4 80% 100% 69%
2013 8 80% 100% 76%
2014 7 80% 100% 66%
2015 8 80% 100% 82.8%
2016 9 80% 100% 81.8%
2017 13 80% 100% 81.1% Sources: Annual Report, School of Health Professions [26]; Dalton State 47TDashboards Fact Book 47T(“Student Achievement” – Professional and Licensure Exams
Licensed Practical Nursing The certificate program in Licensed Practical Nursing (LPN) tracks the success of its graduates by the first-attempt pass rate on the National Council for Licensure Examinations-Licensed Practical Nurse (NCLEX-LPN). As shown in Table 8.1-39, recently graduated Licensed Practical Nursing students from Dalton State College have achieved a 90% pass rate on the National Council Licensure Exam for Practical Nurses (NCLEX-LPN). Beginning with available 2013 results, graduates of Dalton State’s Licensed Practical Nurse program have performed above the national average on their NCLEX exams. It is more than noteworthy that for the past 19 years, Dalton State’s LPN graduates have performed very well on the NCLEX-LPN. The mean pass rates from 1997 through 2017 averages 94.4%.

32
Table 8.1-38 Licensed Practical Nursing Program NCLEX Scores/Pass Rates
Benchmark:
Students will pass on the first try at or above the national average.
Year
Total Pass/Takers
DSC Pass Rate
National Pass Rate
1997 24/ 26 92.3% n/a
1998 12/ 12 100% n/a
1999 18/19 94.7% n/a
2000 7/ 8 88.9% n/a
2001 8/ 8 100% n/a
2002 17/ 17 100% n/a
2003 20/ 21 90.4% n/a
2004 31/32 97% n/a
2005 32/ 34 94.1% n/a
2006 40/ 41 97.6% n/a
2007 20/21 95% n/a
2008 32/ 35 91.4% n/a
2009 31/ 34 91.2% n/a
2010 31/35 89% n/a
2011 22/22 100% n/a
2012 48/51 94% n/a
2013 42/46 91.3% 84.2%
2014 19/20 95% 83%
2015 19/20 95% 80.6%
2016 28/29 95.55% 83.73%
2017 18/20 90.0% 83.84%
Sources: Annual Report, School of Health Professions [26]; Dalton State 47TDashboards Fact Book 47T(“Student Achievement” – Professional and Licensure Exams
Job Placement Rates As these examples show, Dalton State assesses graduate employment via its Graduate Surveys [27] [28] and Follow-up Surveys [29] [30] [31]. Graduate employment information is also reported on the 47TDashboards Fact Book47T (see “Student Achievement” – Graduates Employed or Furthering Education) as shown in Tables 8.1-40 to 8.1-64 below. The Schools of Business, Education, Health Professions, Liberal Arts, and Science, Technology, and Mathematics have all set established benchmarks for the job placement rates of their graduates. Not all data is available for reporting. There are some years where no data is available. The schools have been working hard to rectify the situation by working to gather their own information about the job placement of their graduates. It has not been easy, but attempts are continually being made as shown in the tables below. Some of the graduate surveys have shown improved job and graduate school placement rates over the last two years.

33
C. Lamar and Ann Wright School of Business
Table 8.1-39 Percentage of B.B.A Graduates Employed
within 6 Months of Program Completion All B.B.A Graduates
Benchmark:
Seventy-five percent (75%) or more of B.B.A. graduates will be employed within six months in their respective fields.
Year Job Placement Rate
2006-2007 94%
2012-2013 80%
2013-2014 86%
2014-2015 75%
2016-2017 86%
Source: C. Lamar and Ann Wright School of Business Annual Report
Table 8.1-40 Percentage of Accounting B.B.A Graduates Employed
within 6 Months of Program Completion Accounting
Benchmark:
Seventy-five percent (75%) or more of B.B.A. Accounting graduates will be employed within six months upon graduation.
Year Job Placement Rate
2009-2010 80%
2010-2011 70%
2011-2012 70%
2012-2013 85%
2013-2014 87%
2014-2015 88%
2015-2016 88%
2016-2017 90% Source: C. Lamar and Ann Wright School of Business Annual Report

34
C. Lamar and Ann Wright School of Business
Table 8.1-41 Percentage of Finance and Applied Economics B.B.A Graduates Employed
within 6 Months of Program Completion Finance and Applied Economics
Benchmark:
Seventy-five percent (75%) or more of B.B.A. Finance and Applied Economics graduates will be employed within six months upon graduation.
Year Job Placement Rate
2016-2017 82%
Source: C. Lamar and Ann Wright School of Business Annual Report
Table 8.1-42 Percentage of Management B.B.A Graduates Employed
within 6 Months of Program Completion Management
Benchmark:
Seventy-five percent (75%) or more of B.B.A. Management graduates will be employed within six months upon graduation.
Year Job Placement Rate
2008-2009 97%
2009-2010 81%
2010-2011 81%
2011-2012 78%
2012-2013 73%
2013-2014 73%
2014-2015 74%
2015-2016 74%
2016-2017 88%
Source: C. Lamar and Ann Wright School of Business Annual Report

35
C. Lamar and Ann Wright School of Business
Table 8.1-43 Percentage of Management Information Systems B.B.A. Graduates Employed
within 6 Months of Program Completion Management Information Systems
Benchmark:
Seventy-five percent (75%) or more of B.B.A. Management Information Systems graduates will be employed within six months upon graduation.
Year Job Placement Rate
2008-2009 97%
2009-2010 81%
2010-2011 81%
2011-2012 78%
2012-2013 73%
2013-2014 85%
2014-2015 84%
2015-2016 84%
2016-2017 87%
Source: C. Lamar and Ann Wright School of Business Annual Report
Table 8.1-44 Percentage of Marketing B.B.A Graduates Employed
within 6 Months of Program Completion Marketing
Benchmark:
Seventy-five percent (75%) or more of B.B.A. Marketing graduates will be employed within six months upon graduation.
Year Job Placement Rate
2009-2009 78%
2009-2010 75%
2010-2011 75%
2011-2012 75%
2012-2013 92%
2013-2014 92%
2014-2015 89%
2015-2016 89%
2016-2017 90%
Source: C. Lamar and Ann Wright School of Business Annual Report

36
C. Lamar and Ann Wright School of Business
Table 8.1-45 Percentage of Technology Management B.A.S. Graduates Employed
within 6 Months of Program Completion Technology Management
Benchmark:
Seventy-five percent (75%) or more of B.A.S. Technology Management graduates will be employed within six months upon graduation.
Year Job Placement Rate
2009-2010 67%
2016-2017 76.9%
Source: C. Lamar and Ann Wright School of Business Annual Report
*Note we estimate the placement rates for the BAS degree mirror those of MIS and many of these majors were working during their degree program and needed the bachelor’s degree to be promoted into a managerial/supervisory position at their same company.

37
School of Education
Table 8.1-46 Percentage of School of Education Graduates Employed
within 12 Months of Program Completion
Benchmark: Seventy percent (70%) or more of the candidates completing the programs and receiving state certification will be employed in their profession within 12 months of program completion.
Graduation Term
Job Placement Rate (Early Childhood Grads)
Job Placement Rate (Secondary Ed Grads)
Spring 2009 71% n/a
Spring 2010 86% n/a
Spring 2011 82% n/a
Fall 2011 70% n/a
Spring 2012 67% 69%
Fall 2012 61% n/a
Spring 2013 58% 67%
Fall 2013 52% n/a
Spring 2014 78% 88%
Fall 2014 57% n/a
Spring 2015 51% 50%
Fall 2015 78% n/a
Spring 2016 86% 85%
Fall 2016 92% n/a
Spring 2017 76% 71%
Sources: School of Education Annual Report; Snapshot Data, School of Education

38
School of Health Professions
Table 8.1-47 Percentage of Licensed Practical Nursing Graduates Employed
within 12 Months of Program Completion Licensed Practical Nursing
Benchmark:
Within three months of passing the NCLEX-LPN, 75% of Dalton State College graduates will be employed as staff nurses in hospitals and similar agencies.
Year Job Placement Rate
2008-2009 97%
2009-2010 97%
2010-2011 82%
2011-2012 100%
2012-2013 92%
2013-2014 92%
2014-2015 91%
2015-2016 89%
2016-2017 89%
Source: School of Health Professions Annual Report
Table 8.1-48 Percentage of Medical Laboratory Technology Graduates Employed
within 12 Months of Program Completion Medical Laboratory Technology
Benchmark:
Within 12 months of graduation, 85% of students will be employed.
Year Job Placement Rate
2003-2004 100%
2004-2005 100%
2005-2006 100%
2006-2007 100%
2007-2008 100%
2008-2009 100%
2009-2010 100%
2010-2011 100%
2011-2012 100%
2012-2013 100%
2013-2014 100%
2014-2015 100%
2015-2016 100%
2016-2017 100%
Source: School of Health Professions Annual Report

39
School of Health Professions
Table 8.1-49 Percentage of B.S. Organizational Leadership Graduates Employed
within 12 Months of Program Completion Organizational Leadership (B.S.)
Benchmark:
Within 12 months of graduation, 70% of students will be employed.
Year Job Placement Rate
2015-2016 100%
2016-2017 93.8%
Source: School of Health Professions Annual Report
Table 8.1-50 Percentage of Radiologic Technology Graduates Employed
within 12 Months of Program Completion Radiologic Technology
Benchmark:
Within six months of graduation, 75% of students will be employed.
Year
Job Placement Rate
2002-2003 100%
2003-2004 100%
2004-2005 100%
2005-2006 100%
2006-2007 95%
2007-2008 90%
2008-2009 80%
2009-2010 76%
2010-2011 77%
2011-2012 85%
2012-2013 92%
2013-2014 100%
2014-2015 100%
2015-2016 100%
2016-2017 93% Source: School of Health Professions Annual Report

40
School of Health Professions
Table 8.1-51 Percentage of 2-Year RN Graduates Employed
within 3 Months of Passing the NCLEX-RN Registered Nursing Program (A.S.N. 2-Year)
Benchmark:
Within three months of passing the NCLEX-RN, 75% of graduates will be employed as staff nurses in hospitals and similar agencies.
Year
Job Placement Rate
2003-2004 99%
2004-2005 100%
2005-2006 100%
2006-2007 95%
2007-2008 75%
2008-2009 95%
2009-2010 90%
2010-2011 92%
2011-2012 92%
2012-2013 100%
2013-2014 100%
2014-2015 100%
2015-2016 100%
2016-2017 100%
Source: School of Health Professions Annual Report

41
School of Health Professions
Table 8.1-52 Percentage of School of A.A.S. Respiratory Therapy Graduates Employed
within 12 Months of Program Completion Respiratory Therapy (A.A.S.)
Benchmark:
Within 12 months of graduation, 70% of students will be employed.
Year
Job Placement Rate
2006-2007 100%
2007-2008 100%
2008-2009 90%
2009-2010 100%
2010-2011 100%
2011-2012 92%
2012-2013 92%
2013-2014 92%
2014-2015 100%
2015-2016 100%
2016-2017 100% Source: School of Health Professions Annual Report
Table 8.1-53 Percentage of B.S. Respiratory Therapy Graduates Employed
within 12 Months of Program Completion Respiratory Therapy (B.S.)
Benchmark:
Within 12 months of graduation, 70% of students will be employed.
Year
Job Placement Rate
2015-2016 100%
2016-2017 100% Source: School of Health Professions Annual Report

42
School of Health Professions
Table 8.1-54 Percentage Social Work Graduates Employed and/or Enrolled in an MSW Program within
3 Months of Program Completion Social Work
Benchmark:
Ninety percent (90%) or more of graduates will be either employed as a professional social worker and/or enrolled in a Master of Social Work (MSW) program within three months after receiving their BSW degree.
Year
Job Placement Rate
2004-2005 80%
2005-2006 100%
2006-2007 87.50%
2007-2008 87.50%
2008-2009 95%
2009-2010 100%
2010-2011 90%
2012-2013 100%
2013-2014 100%
2014-2015 77.4%
2015-2016 100%
2016-2017 100%
Source: School of Health Professions Annual Report

43
School of Liberal Arts
Table 8.1-55 Percentage of B.A. Communication Graduates Employed or Attending Graduate or
Professional School within 12 Months of Program Completion Communication
Benchmark:
A minimum of 80% of graduates will be employed in a communication-related field or be accepted into graduate school within one year of graduation.
Year
Job Placement/Graduate School Acceptance Rate
2016-2017 66% Source: School of Liberal Arts Annual Report
Table 8.1-56 Percentage of B.S. Criminal Justice Graduates Employed or Attending Graduate or
Professional School within 12 Months of Program Completion Criminal Justice
Benchmark:
In their responses on the Criminal Justice Program Exit Survey and a follow-up survey four months after graduation, at least 70% of the students will report that they have found a position related to their degree or that they have gained acceptance into a graduate or professional program.
Year
Job Placement/Graduate School Acceptance Rate
2010-2011 60%
2011-2012 58%
2012-2013 60%
2013-2014 56%
2014-2015 70%
2015-2016 70%
2016-2017 74% Source: School of Liberal Arts Annual Report

44
School of Liberal Arts
Table 8.1-57
Percentage of B.A. English Graduates Employed or Attending Graduate or Professional School within 12 Months of Program Completion
English
Benchmark: In their responses on the English Program Exit Survey and a follow-up survey four months after graduation, at least 70% of the students will report that they have found a position related to their degree or that they have gained acceptance into a graduate or professional program.
Year
Job Placement/Graduate School Acceptance Rate
2010-2011 57%
2011-2012 57%
2012-2013 42%
2013-2014 38%
2014-2015 20%
2015-2016 59%
2016-2017 100%
Source: School of Liberal Arts Annual Report
Table 8.1-58 Percentage of B.A. History Graduates Employed or Attending Graduate or Professional
School within 12 Months of Program Completion History
Benchmark:
In their responses on the History Program Exit Survey and a follow-up survey four months after graduation, at least 70% of the students will report that they have found a position related to their degree or that they have gained acceptance into a graduate or professional program.
Year
Job Placement/Graduate School Acceptance Rate
2010-2011 50%
2011-2012 60%
2012-2013 75%
2013-2014 55%
2014-2015 72%
2015-2016 56%
2016-2017 79%
Source: School of Liberal Arts Annual Report

45
School of Liberal Arts
Table 8.1-59
Percentage of B.A. Interdisciplinary Studies Graduates Employed or Attending Graduate or Professional School within 12 Months of Program Completion
Benchmark:
In their responses on the Interdisciplinary Studies Exit Survey and a follow-up survey four months after graduation, at least 70% of the students will report that they have found a position related to their degree or that they have gained acceptance into a graduate or professional program.
Year
Job Placement/Graduate School Acceptance Rate
2014-2015 57%
2015-2016 75%
2016-2017 70%
Source: School of Liberal Arts Annual Report
Table 8.1-60 Percentage of B.S. Psychology Graduates Employed or Attending Graduate or
Professional School within 12 Months of Program Completion Psychology
Benchmark:
In their responses on the Psychology Program Exit Survey, at least 70% of the students will report that they have found a position related to their degree or that they have gained
acceptance into a graduate or professional program
Year
Job Placement/Graduate School Acceptance Rate
2015-2016 67%
2016-2017 76% Source: School of Liberal Arts Annual Report

46
School of Science, Technology and Mathematics
Table 8.1-61 Percentage of B.S. Biology Graduates Employed or Attending Graduate or Professional
School within 12 Months of Program Completion Biology
Benchmark: 80%
Year Job Placement Rate
2014-2015 44%
2015-2016 3.33%*
Source: School of Science, Technology, and Mathematics
*The responses to the graduate surveys conducted in late September and early October 2016 were minimal.
Table 8.1-62 Percentage of B.S. Chemistry Graduates Employed or Attending Graduate or
Professional School within 12 Months of Program Completion Chemistry
Benchmark: 80%
Year Job Placement Rate
2015-2016 20%
Source: School of Science, Technology, and Mathematics

47
Surveys 47TPurple Briefcase – First Destination Survey47T In an effort to help academic programs and schools with information about graduate outcomes, the College has been looking for an affordable and customizable survey to do that. Information about graduates has been generally difficult to collect and disseminate. In 2017, the Office of Academic Affairs provided funds to purchase and begin using the 47TPurple Briefcase – First Destination Survey 47T[32] about graduates’ outcomes. The first survey was administered in December 2017 by the 47TOffice of Career and Professional Development 47T. The response rate was rather low, but still, the results gave a glimpse of what Dalton State graduates are up to. For example, 26% of graduates have received an employment offer, 28% of graduates are planning to attend graduate school following graduation, and 68% are very satisfied with their next steps of conducting a job search to accept full-time employment or attend graduate/professional school [33]. The Office of Career and Professional Development is working hard to improve response rates in the years to come. Graduating Student Survey Prior to the recent adoption of the HERI College Senior Survey, Dalton State surveyed graduating students using an internally developed instrument. The results were compiled by the 47TOffice of Institutional Research and Planning 47T and made available on its 47TWebsite47T. As well as finding out about their experiences while a student at Dalton State and providing useful information to improve educational programs and services, the survey also gathered data on whether students felt they had achieved or accomplished their primary objective for attending Dalton State College. For example, in one such graduating students’ survey, 80% of graduates reported that their objective for attending Dalton State College was fully accomplished; 90% of graduates rated the quality of education they received at Dalton State as “Excellent” or “Good.” And 93% rated their level of satisfaction with the education they received at the College as “Satisfied” or “Very Satisfied” [34]. These questions and others have been added to the new externally administered HERI College Senior Survey, and was administered for the first time in spring 2016 [35]. The results of the new HERI Senior Survey and all previous graduating survey results are posted on the Institutional Research Webpage on 47Tsurveys47T. Results from the 2017 Dalton State College HERI College Senior Survey, for instance, showed that about 60% of graduating students were satisfied with their overall college experience, including the quality of education received, and would choose to enroll at the College if they could make their choice over [36]. There were other results of graduating students’ surveys from specific schools and academic programs. Graduating Student Surveys in Liberal Arts tend to report high levels of student satisfaction. For example, Criminal Justice Program Exit Surveys were distributed to graduating students in late fall 2016 and late spring 2017, and 25 out of 27 graduates returned them (93%). Of these, 100% reported that the program met (16%) or exceeded (84%) their expectations. On these same surveys, 100% of the graduates rated the quality of instruction by faculty as good (20%) or excellent (80%) [37]. Exit surveys in Interdisciplinary Studies for 2016-2017 show similar results with 100% of the students who returned the surveys reporting that their experience met or exceeded expectations and 100% rating the program's quality of instruction as "good" or "excellent" [38]. English program exit surveys distributed in 2015 and 2016 were also positive with 94% of English majors rating the quality of instruction as good or excellent [39]. The C. Lamar and Ann Wright School of Business surveys seniors in their graduating semester as part of their strategic management class. The latest results (Fall 2017) showed more than 90% of graduates expressed the overall quality of the education they received from the business school as either “Excellent” or “Good” [40].

48
As students graduate from the School of Education programs, the School has them complete an Educator Preparation Provider (EPP) created survey about their preparation. Their responses are gathered, analyzed, and shared with stakeholders. Results of the survey are posted on the School of Education’s Data Snapshots on the following Website link: 47Thttps://www.daltonstate.edu/academics/resources.cms47T. The School uses stakeholder feedback to make adjustments to the program as needed. The School of Education graduating seniors continue to respond positively to the various program questions, but for a few semesters, the positive agreement dropped in some areas. For example, in the 47TFall 2016 Graduate Completers’ Survey47T, 94% responded positively (strongly agree/agree) to the Content and Curriculum survey statements, but 84% responded positively (strongly agree/agree) to the Classroom, Program, and School-wide Assessment survey statements. Thus, adjustments were made to the program, and there has been an increase in positive responses to many of the questions (e.g., 93% responded positively to the Knowledge of Students, Teaching and Learning survey statements). Follow-Up Surveys of Graduates/Alumni The Purple Briefcase – First Destination Survey [32], [33] now serves as a follow-up survey of Dalton State graduates and alumni, as it asks questions about employment prospects/outcomes/experiences, further education, satisfaction, etc. This survey complements the campus-administered alumni survey [41] conducted by the alumni relations unit in the Office of Institutional Advancement and the Office of Institutional Research and Planning. In addition, follow-up surveys of graduates or completers for purposes of program accreditation and improvement are administered by the by the departments of Nursing [42], Social Work [31], and Allied Health [43] in the School of Health Professions, and the School of Education [30], and Professional Education Secondary (PES) [44]. For example, the Department of Nursing concluded in one such survey that based on the alumni surveys, “graduate satisfaction with their educational preparation received from the nursing program indicates that the curriculum is meeting the mission, goals, and objectives of the college and program” [45]. Indeed, the Department of Nursing’s RN Questionnaire [46] is a good example of a follow-up survey. The survey provided much useful data for the College, such as graduates’ satisfaction with their training at Dalton State, their current employment, their current salaries, and the month in which they passed their board exams. Graduates from the Phlebotomy program all answered “yes” to question of “should faculty feel they have accomplished their goals in training well-qualified Phlebotomists?” [47]. Graduates of the Medical Laboratory Technology program gave each question, on average, a 7 or higher (on a 10-point scale) when asked about the program objective, instructor knowledge, instructor willingness to help, assignments, and preparation [48]. All respondents to the 2018 graduate of the AAS Respiratory Therapy program rated the program as above average or excellent [49]. In the 47TSchool of Education47T, some of the first year induction surveys have shown that graduates feel prepared for their first year of teaching. They feel prepared for classroom management, differentiation of instruction, and writing lesson plans (note: Surveys are sent by the GaPSC, and the response rate is low. Surveys are sent only to graduates teaching in Georgia public schools in the areas for which they were prepared.) The Educator Preparation Provider (EPP) will develop a plan to try to get a higher response rate. In addition, the EPP has already begun working on a plan to follow some graduates from each program and interview them about their preparation. This process is taking place in the Spring of 2018 and will continue each year forward. The C. Lamar and Ann Wright School of Business has developed a survey (in-house) and will implement it in March 2018 to poll Fall 2017 graduates at the three-month mark [50].

49
All collected data are then used to evaluate program effectiveness and improvement, including surveys of the alumni of these programs [51] [52]. Programs in the Schools of Business and Health Professions and the Departments of Social Sciences and Communication also use student/alumni/business advisory boards and committees [53], [54], [55] to find out the knowledge and skills that need to be addressed in workforce preparation programs and to gather feedback on the performance of program graduates. Employer Satisfaction Surveys The Schools of Business [56], Education [57], and Health Professions (Nursing [58], Allied Health [59], [60], Social Work [61]) and the Department of Social Sciences (Criminal Justice) administer employer surveys to determine the knowledge and skills that need to be addressed in workforce preparation programs and to gather feedback on the performance of program graduates. Results of some of these surveys are available on the Institutional Research and Planning 47TWebsite47T. For example, surveys of employers of Medical Lab Technology graduates in the School of Health Professions have shown employer satisfaction with Dalton State graduates to be consistently ranked as “above average.” Written feedback commonly refers to the high level of preparation of graduates and how quickly they are able to train for their positions [60]. As well, employer feedback from the Respiratory Therapy program shows similar results [61]. Generally, employers rank graduates in the health profession programs as above average, with a few exceptions. During Summer Term 2015, the Department of Social Sciences within the School of Liberal Arts secured contact information for seven employers of recent Criminal Justice graduates. These graduates found employment as parole officers, legal secretaries, probation officers, and case managers at Highland Rivers Treatment Services and at Hayes State Prison, the Dalton Police Department, and the Department of Community Supervision. Five employers returned completed surveys for a 71% response rate. Of these, 100% agreed “that our criminal justice graduates are well qualified for their respective positions. All respondents (100%) reported that they were satisfied (20%) or very satisfied (80%) with the work and performance of our criminal justice graduates, and all respondents (100%) reported that Dalton State prepared the graduate for the position either more than adequately (60%) or extremely well (40%).” This same survey also offered employer feedback on the knowledge and skills of Criminal Justice graduates:
All respondents (100%) rated Dalton State's criminal justice graduates' understanding of the criminological sciences as good (40%) or excellent (60%). . . . All respondents (100%) rated Dalton State graduates' critical thinking skills as good (40%) or excellent (60%). . . . All respondents (100%) rated criminal justice graduates' understanding of the essential elements of academic and professional writing as average or better, with 80% rating them as good or excellent (40% good and 40% excellent). The one employer who rated the writing skills as average (Georgia State Board of Pardons and Paroles) suggested that the department should have future students "focus more on their writing skills as this is an essential tool in the criminal justice field.” . . . All employers (100%) rated graduates' understanding of professional research and scholarship as good (40%) or excellent (60%). . . . All employers (100%) rated graduates' understanding of professional and ethical values in criminal justices as excellent. [62]
The Department of Social Sciences administered Employer Surveys for the criminal justice program again in 2016-2017; however, only one survey was returned. This employer expressed great satisfaction with the program and rated the graduate's understanding as excellent for all program learning outcomes: effective written communication skills, effective oral communication skills, effective critical thinking skills, effective use of research and technology, sound general
50
knowledge of the criminal justice core curriculum, and understanding of professional and ethical values [63]. Furthermore, the 47TGeorgia Professional Standards Commission47T (GaPSC) surveys the administrators in Georgia that have employed Dalton State education graduates in the School of Education. According to the results of the most recent employer survey, 2017, provided to the dean, overall, the administrators score first year teachers averaging 3.04 points out of 4 possible points across the 31 elements surveyed. They score the graduates highest (3.45/4) in their professionalism (working collaboratively and understanding and upholding ethical standards). Collaboration is one of the four pillars of the School’s programs. The administrators scored the graduates lowest in the areas of differentiation for gifted students (2.52/3) and for English Language Learner (ELL) students (2.39/4). While differentiation is difficult for even veteran teachers as evidenced by the scores on the TKES (evaluation instrument for in-service teachers), the School of Education recognizes that these are two areas on which they need to focus their attention. In conclusion, it needs pointing out that employer surveys have notoriously low response rates, and some programs have struggled to maintain a regular administration of such surveys. However, attempts are being made to put in place a credible system that can regularly gather information about employers of Dalton State graduates as this set of minutes [64] and plan from the C. Lamar and Ann Wright School of Business School shows. The plan is to administer an alumni/graduating students survey in March 2018 and to ask for information about employers, who will then be surveyed after initial data is collected [65]. Still, anecdotal data from employers of business graduates and their confidence in sending job announcements to the school to disseminate via e-mail to current students show high satisfaction levels with business graduates. This is also evident of the number of companies with booths that show up at the school’s job fairs, their participation in mock-interviews with juniors, and their participation in practice networking events with students or in panel events on key topics of interest (e.g., Social Media on 1/31/18 with members from the Society for Human Resources Management (SHRM) professionals from local industry). Exit Interviews (Total Withdrawal/Non-Returning) Each student who requests to withdraw from all classes must have the withdrawal form signed by Academic Affairs, Financial Aid, and Enrollment Services staff members. If a student is not returning to Dalton State, the student must also meet with a staff member at the Dean of Students office and complete an exit interview before approval is granted. During the interview, students complete an exit survey [66], and staff members and students have an opportunity to discuss the student's challenges and potential options to withdrawal. This information is regularly compiled into a summary [67], which helps Dalton State to shore up any apparent weaknesses and address student needs. Transfer Reports A major mission of two-year and state colleges is to prepare students for transfer to a research, regional, or state university. As such, the College tracks the success of transfer students by means of 47Tdata supplied by the University System of Georgia47T. The annual transfer report provided by the System is designed to provide feedback to the USG on the mobility of its students and to sending institutions on the success of their students up to one year after transfer. The transfer reports are available on the Institutional Research and Planning 47TWebsite47T (see Undergraduate Student Transfer Reports). The USG has not regularly provided transfer GPA data for the College, but the latest USG transfer report (2016-2017) [68], which contained GPA information, showed that Dalton State’s 194 students perform very well after transferring to other institutions. In fact, the College, in past times, was a leader in this regard among the two-year and state colleges within the University System [69].

51
Related Institutional Links Related to Student Achievement Below are links to other resources that provide student achievement data about Dalton State students. 47TComplete College Georgia Dalton State’s Complete College Georgia plan is focused primarily on efforts to expand and/or enhance programs, services, and interventions that will provide additional support, flexibility, and options to help its students succeed. As noted in its 2016 report, the College has sought to promote high-impact learning practices inside and outside the classroom. In addition to the five goals to which DSC committed to the CCG at the outset (intrusive advising through predictive analytics, increased dual enrollment offerings, transforming remediation through co-curricular courses (specifically in math), offering more online and hybrid courses and programs, and providing alternative instructional delivery methods), the College has also improved its First Year Experience course, sought to increase student engagement in curricular and co-curricular programs, restructured to offer better student and enrollment services, and involved itself in national initiatives such as LEAP and High Impact Practices [70].
47TGeorgia Higher Learning and Earnings (GHLE) dashboard47T This dashboard, provided under the auspices of the 47TGovernor’s Office of Student Achievement47T, provides earnings information for college graduates one year and five years after graduation. Earnings information can be viewed by degree type, major, college, or any combination of those choices. In the latest report, 47TGeorgia Higher Learning and Earnings47T, published in January 2017, data showed that after one year of graduation, median earning for Dalton State bachelor’s degree students was $28,330. Five years after graduation, median earning rose to $37,209 [71]. Student Achievement Dashboards 47Thttp://Dashboards.daltonstate.edu:8877/Dashboards/html5/?guestuser=guest 47T This is the Website in the Office of Institutional Research and Planning at Dalton State that provides data on student achievement and other data such as enrollment and admissions, faculty and staff, finance, library resources, schools/departments/programs, and student financial information. It is officially the institution’s Fact Book. Also, per SACSCOC instructions, a Webpage of Dalton State Student Achievement data is compiled and reported 47There47T. The following are also essential in gathering and reporting student achievement data and other information for Dalton State and other institutions in the University System of Georgia. 47TUniversity System of Georgia Statistics and Reports 47T
47TCompletions (Degree Conferred) 47T
47TCredit Hours47T
47TEnrollment47T
47TEntering Freshmen SAT 47T
47TInformation Digest47T
47TRetention and Graduation Rates47T

52
Resources for Peer Comparisons 47TPeer Institutions Data47T 47TIPEDS (Data Feedback Reports)47T 47TCollege Results Online47T Conclusion As shown above, Dalton State College possesses many vehicles for evaluating student achievement, including course completion, external examinations, surveys, and other data, such as job placement rates, graduation and retention rates, and exit interviews. The data collected via these methods are used to direct the College’s strategic goals, to focus on any areas of weakness, and to meet student needs. Documentation Note: All hardcopy documentations are available upon request from the Office of Institutional Research and Planning, Dalton State College, 650 College Drive, Dalton, GA 30720 (706-272-4406/[email protected]) [1] Dalton State Mission Statement re Student Achievement [2] Quick Facts, Fall 2017 Enrollment [3] Annual Retention and Graduation Rates Improvement Plan, 2005 [4] DSC Retention and Graduation Report Presentation to USG Graduation Task Force, 2010 [5] USG Graduation and Retention Rate Targets (Revised), 2011 [6] USG Graduation Rates Definitions [7] Quick Facts Fall 2017, Retention and Graduation Rates [8] President’s Address, Campus Assembly & Faculty Meeting, Fall 2015 [9] Example of Grade Distribution Table [10] Deans' Meeting Minutes re Grade Distribution Reports [11] School of Liberal Arts Annual Report, 2016-2017 [12] School of Liberal Arts Annual Report, 2016-2017 - Course Completion Rates [13] Learning Support Program Assessment - 2010-2011 Annual Report Example [14] School of Liberal Arts Annual Report re Learning Support [15] Natural Sciences and Mathematics Annual Report re Learning Support [16] Learning Support Math Success Rates [17] Distance Education Profile Report Example [18] General Education Learning Outcomes [19] Graduating Students Survey Summary Report, General Education Competencies Results [20] DSC Additional Questions on General Education Competencies to HERI Senior Survey [21] School of Liberal Arts Annual Report, re General Education Competencies [22] HIST 2111 Assessment - General Education Class [23] General Education Program Assessment, 2017 [24] School of Business Annual Report re ETS Test Scores [25] School of Education Annual Report re GACE Test Pass Rates [26] School of Health Professions Annual Report re Various Licensure Pass Rates [27] School of Education Snapshot reports re Graduate Completers' Survey Results [28] AAS Respiratory Therapy student survey results [29] RN Graduate Follow-Up Survey Results [30] School of Education Alumni Satisfaction Results [31] School of Social Work - Alumni Surveys [32] Purple Briefcase Graduates Survey

53
[33] Purple Briefcase Graduates Survey Results Summary [34] Graduating Student Survey Summary Report [35] HERI College Senior Student Survey, 2016 Results Documentation Note: All hardcopy documentations are available upon request from the Office of Institutional Research and Planning, Dalton State College, 650 College Drive, Dalton, GA 30720 (706-272-4406/[email protected]) [36] HERI College Senior Student Survey, 2017 Results [37] Criminal Justice Program Assessment, 2016-2017 re Exit Survey Results [38] Interdisciplinary Studies Program Assessment, 2016-2017 re Exit Survey Results [39] English BA Program Assessment, 2015-2016 [40] Business Graduates Survey, Fall 2017 - Satisfaction with Overall Quality (Col. Z) [41] Alumni Survey Summary, Spring 2018 [42] RN Graduate Completers Survey Results, 2013 [43] AAS Respiratory Therapy student survey results, 2018 [44] School of Education Snapshot report re PES Completers Survey [45] Department of Nursing Alumni Survey Results [46] RN Graduate-Alumni Questionnaire [47] Phlebotomy Program Graduate survey summary results, 2015-16 [48] Medical Lab Technology Graduate survey, F16-S17 [49] AAS Respiratory Therapy student survey results, 2018 [50] School of Business Alumni Survey Instrument, 2018 [51] School of Education Program Outcomes [52] Dept. of Nursing Alumni Survey Evaluation [53] Business Advisory Council Meeting Minutes [54] Health Professions Advisory Board Minutes [55] Department of Nursing Advising Committee Meeting Minutes [56] School of Business Employer Survey Instrument - Management [57] School of Education Employer Survey Results [58] ASN and RN - BSN employer survey results, 2016 and 2017 [59] AAS Respiratory Therapy clinical and employer survey results, 2018 [60] MLT Employer Survey Summary, 2014-15 [61] School of Social Work - Employer Surveys [62] BS Criminal Justice Program Assessment, 2015-16 re Employer survey results [63] Criminal Justice Program Assessment, 2016-2017 re Employer Survey Results [64] School of Business Faculty Minutes re Alumni and Employer Survey Issues [65] Business Graduating Students & Alumni Survey plan [66] Dalton State Withdrawal - Exit Survey [67] Student Withdrawal-Exit Survey Summary [68] USG Transfer Report, 2016-2017 [69] Annual Report of Institutional Progress, 2003-2004 re Dalton State Transfer Report Results [70] Dalton State College CCG Narrative – 2016 [71] Higher Learning and Earnings Report, Jan. 2017

54