the field measurement of suspended sediment in the surf zone · the field measurement of...
TRANSCRIPT

Univers
ity of
Cap
e Tow
n
'\ <
THE FIELD MEASUREMENT OF
SUSPENDED· SEDIMENT --, .
IN THE SURF ZONE
N. N. HEIDSTRA
A .,Dissertation submitted in partial fulfilmen~ for
the degree of M. Sc(ENG) to the University of
"Cope Town, . 1978 •
.. '
' ,

Univers
ity of
Cap
e Tow
n
The copyright of this thesis vests in the author. No quotation from it or information derived from it is to be published without full acknowledgement of the source. The thesis is to be used for private study or non-commercial research purposes only.
Published by the University of Cape Town (UCT) in terms of the non-exclusive license granted to UCT by the author.

ACKNOWLEDGEMENTS
The author would like to thank the following persons and organisations for their assistance :-
AECI Limited for granting the author a post-graduate scholarship to undertake these studies.
Prof. F .A. Ki Iner and staff of the Department of Civil Engineering, University of Cape Town for their.support and advice.
The Electricity Supply Commission of South Africa for financially assisting field operations •.
Ms. C. Hoenson for the typing of this dissertation.
This dissertation is dedicated to the memory of a friend and col league ;
John Dudley Woodward

INDEX
Synopsis 1
Chapter
l Introduction 2
2 Review of Published Work 4
2. 1 Pump Type Samplers 5
2.2 Time-averaging Trap Type Samplers 11
2.3 Instantaneous Trap Type Samplers 16
2.4 Indirect Type of Samplers used in the Field 18
2.5 Suspended Sediment Samplers used in Tidal, Estuarine and Deep Sea Applications 20
2.6 Suspended Sediment Samplers used in Laboratory Applications 2.5
2.7 Conclusions 28
3 Theo re ti ca I Considerations 2~
3. 1 Bed Shear Stress Considerations·· 29
3.2 Boundary Layer 33
3.3 The Distribution of Suspended Sediment Concentrations 33
3.4 Wave Theories 35
4 Design and Construction of Sampling Equipment 37
4. 1 Design Criteria 37
4.2 Design of the Mark I Sampler 38
4.3 Design of the Mark II Sampler 41
4.4 Control Equipment for the Mark II Sampler 48
4.5 Evaluation of the forces due to Wave Action on the Mark II Sampler 51
4.6 Design of the Sea Anchor and Buoy 53
4.7 Design of the Main Rope and Winch System for the Mark II Sampler 55
4.8 Ancillary Equipment 56

Chapter
5
6
7
Appendix
Appendix
Appendix
Appendix
Sampling Operations
5.1
5.2
5.3
5.4
5.5
Helicopters used with Mark I Sampler
Sampling Proce.dures for the Mark I Sampler
DetermNiation of Sample Position
Mark I Sampler : Summary
Field Operations using the Mark II Sampler
5. 6 Laboratory Experiments
Field Results and Analyses
6. 1
6.2
'6.3
Beach Topography and wave climate
Results
Comments on Results
Conclusion and Recommendations
1 References
2 Nomenclature
3 Graphs of e1 and b1 values
4 Addi tiona I Course work completed for fulfilment of the
60
60
62
64
66
67
70
74
74
75
88
90
92
96
97
M.Sc(Eng) degree. 106

1.
SYNOPSIS
Suspended sediment concentrations were measured in the nearshore environment at the site of the proposed breakwater of the Koe berg Nuclear Power Station. Reference concentrations are evaluated from the field data.
·Two sampling systems to obtain these concentrations were designed and constructed. J
The Mark I sampler was used to collect the field data, whilst the Mark II sampler was extensively tested in the laboratory and the proposed operational system was tested in the fi~ld. Difficulties were experienced in the operation of the Mark II sampling system, and are described.
Recommendations for the improvement of the ,sampling systems are given, based on the experience gained using the sampling systems.
2.
CHAPTER ONE
Introduction
This dissertation deals with the investigation of suspended sediment concentrations resulting from wave action in the nearshore coastal region using available techniques, and the design and development of new methods for determining these concentrations.
Two suspended sediment samplers are described, one involving the use of a helicopter, the other using a system entirely based on the shore except for an anchor point offshore. Both these samplers are time-averaging point samplers. The concentrations determined by one of these samplers wi 11 be compared with various other field results and existing theories developed by other sources.
On the request from various organisations dealing with the planning and design of major coastal engineering works, a project was initiated to develop means of measuring the suspended sediment concentrations, as no existing measuring techniques could be applied in the nearshore coastal region. This dissertation is a continuation of this project. D1.,1ring 1972, a research unit was formed by the Department of Ci vi I Engineering, University of Cape Town, to investigate various coastal sedimentation problems encountered during diamond mining operations on the coast of southern South West Africa/Namibia. One of the problems encountered was related to the amount of sediment drawn into a sea water intake for one of the diamond recovery plants. A technique for measuring the suspended sediment concentrations in the surf and j~st beyond the sur.f was developed by this research team. This technique made use of an evacuated bottle and gave instantaneous point concentrations. In the later half of 1974: the same technique was used in similar applications at the site of the Koeberg Nuclear Power Station at Duynefontein, Western Cape Province. As these concentrations tended to be relatively small, 1·he mass of sediment in the sample was too sma II for accurate analysis, and a new system was developed. All the field work undertaken during this project was at the site of the Koeberg Nuclear Power Station.
Existing techniques for sampling suspended sediment concentrations are all based on obtaining these concentrations in open chanrie Is and rivers where access to the sampling point is easy and sampling can be conducted safely. The emphasis in this type of sampling is to determine the sediment concen.trations as accurately as possible and research has tended to concentrate on sampling at stream velocity to minimise disturbance to the actual flow. (1), However, similar sampling in the nearshore zone presents a completely different set of problems. Access to the sampling point is difficult due to the surf, and the natura I fluctuation of sediment concentrations is greater than the order of accuracy of the sampler. Thus a fairly crude type of sampling system can be used, the main problem being the placement of the sampler at the desired sample point.

3.
All previous suspended sediment scmpling investigations in the coastal environment have either made use of a pier or a boat as access to the desired sampling point. Neither of these methods is very satisfactory; as a pier restricts sampling to one profile on the beach, and its effect on the suspended sediment concentrations is unknown; and a boat cannot remai_n within the surf zone for the time duration of sampling without being endangered, particularly under high surf conditions. A new approach to the problem of measuring suspended sediment concentrations within the nearshore zone is thus needed.
The region of interest in this dissertation is the nearshore coastal environment. This area is defined, for the purposes of this dissertation, as the area including the surf and breaker zones and the area immediately seaward of the breaker zone. As the wave energy per unit depth reaches a maximum value just out; side the breaker zone, most of .the sediment transport processes take place in this region due to the relatively high shear stress exerted on the sea bed by the wave action and the high degree of turbulence within the surf zone. The actual width of this nearshore zone is dependent on the wave climate impinging on to the particular beach, and the physical characteristics of that beach. At Duynefontein, for example, the nearshore zone, as defined above, could vary from 100 metres to 2000 metres in width under wave heights of approximately 0, 5 metres and 1 Ometres respectively. The suspended sediment concentration measuring system must. thus be designed to operate effectively under the majority of wave conditions experienced.

4.
CHAPTER TWO
Review of Published Work
A brief review of existing techniques for measuring suspended sediment concentrations in the nearshore region is made, together with other techniques used in related environments, as well as techniques and results from sediment concentration laboratory experiments.
In order to distinguish between the different types of samplers, a brief distinction between the various general types is given. Sediment. samplers can either be of the instantaneous or time-integrating types. The instantaneous type of sampler obtains a concentration result at a particular point, at a given instant in time. The time-integrating type ofsampler obtains a concentration result averaged over a period of time at a particular point. The two general types can each be further classified, by their mode of operation, into direct and indirect types of samplers. The direct type of sampler traps a quantity of sediment water mixture and the concentration can thus be measured directly. The indirect type of sampler measures some property of sediment-water mixture, for example, light attenuation or sonic velocity, and through calibration of the instrument, converts this reading into a sediment concentration. The direct type of sampler is more commonly used in the field where there is no control on the specific parameters that have to be known for calibration of the indirect type, namely grain size, particle density and particle shape factor. The indirect type of sampler has been almost exclusively used in the laboratory only, where the above mentioned parameters can be controlled and the scale of measurement is generally smaller than the direct type, and is thus more desirable. Recently, however, the indirect type of samplers have been used in the field by Wenzel (2) and Basinski and Lewandowski (3) with limited success.
Investigation of suspended sediment concentrations using direct type samplers can be categorised into three main types, depending on their mode of operation. Pump samplers, as used by Watts (4), Fairchi Id (5), and subsequently the type used in this dissertation, physically draw water from a desired point, and pump that through a filter or into a container. Syphon samplers operate on asimilar principle of drawing water from the desired point into an evacuated bottle. The third type, defined here as trap type samplers, allows the water-sediment mixture to enter an enclosed space where the water velocity is reduced and the sediment settles out. This type of sampler was used in early investigation on suspended sediment movement in Japan by Fukushima and Kashiwamura (6) using bamboo traps, and also as a preliminary investigation at Duynefontein, Cape Province, by the Department of Oceanography at U.C. T. using Delft bottles (7). A disadvantage of this method is that the actual concer.trations cannot be determined, only the relative masses of sediment trapped at each level and it is not possible to determine, wi.th any confidence, the actual volume of water passing through these sand trap devices.
!.
5.
The indirect type of sampler has been developed more extensively than the direct type, possibly because of rigidly controlled conditions in the laboratory and the need for greater accuracy, and consequently more 'research has been developed in the instrumentation and calibration of the indirect type than in the direct type.
Five basic types of indirect samplers.can be broadly categorised on their mode of operation, namely electro-optical or light attenuation type as used by Kennedy and Locher (8) and Hom-ma et al (9); underwater photography as used by Bijker (10), which uses the principle of light attenuation and is basically an extension of the above mentioned type; electronic particle counters as used by Hattori (11 ); ultrasonic adsorption apparatus as used by Wenzel (2) and gamma-ray adsorption as used by Basinski and Lewandowski (3). Four of the five types above use the principle of attenuation of some physica I phenomern:)flwhen trove lling through the sediment-water medium, namely visible light, sound waves and gammarays. The other method is closely related to the direct type of sampler in that it actually counts the number of particles passing the instrument but requires calibration and measurement of particle or water velocity in parallel to determine concentrations.
The first significant contribution made in the investigation of the measurement of suspended sediment concentrations was by Watts (4) between 1949 and 1951. Concentrations were obtained by using a pump type sampler from a pier on the western seaboard of the U.S.A., and a large number of results were obtained. In Japan, investigations using bamboo trap type samplers were first conducted by Fukushima dnd Kashiwamura (6) in 1957 and 1958 off the coast. Cumulative results were obtained and various types of concentration profiles were identified. The next significant contribution was made by Fairchild (5) in 1970 and 1971 on the eastern seaboard of the U.S.A. Various other authors have conducted work on suspended sediment concentrations apart from the above mentioned, but their application has either been deep sea, tidal or estuarine, or. laboratory. From the literature avai !able to date, the only significant results produced from suspended sediment concentrations in the nearshore zone have been Watts and Fairchild. The work of these two researchers will be discussed in detail and the work by other researchers in applications in associated fielJs, will be mentioned and discussed.
2. 1 Pu me Type Same lers
Watts (4) conducted the field investigations into suspended sediment concentrations at Pacific Beach near San Diego, California between 1949 and 1951, using an existing pier which extended approximately 300 metres seaward of the shore line,' The wave spectrum during which the observations were made varied from wave heights of 0,3 metres up to 2 metres, and concentrations were measured both inside and outside the surf. · The tidal range at the site varied between 1 and 2 metres. The pump-type sampler was lowered from a bo~m mounted on the pier into the sea at various interva!s along the pier. The sampling points used were as far as possible from the structural members of the pier, and ~he sampler was positioned about 3 metres away from the pier by means of the boorn, in order to minimise erroneous readings resulting from the disturbed flow patterns caused by the pier.
'.

6.
The unit was completely submersible and the main components were a pump, water meter and sediment filter. The sediment-water mixture was drawn in through a 12mrn nozzle, positioned vertically downwards; pumped through a sediment filter in which the sediment was collected; through a water meter and the sediment-free water returned to the sea. The pump was powered by an electric motor, using an external power supply. A standard non~return valve was also included into the water circuit to prevent any reverse flows taking place before or after sampling. Sampling duration was approximately five minutes. The type of filter used was a filter paper, 10 ply and Z fold embossed, with a rating of rei·aining all solids greater than 25 microns.
When samples were taken within 0, 3 to 1, 3 metres of the sea bed, the intake nozzle was positioned by means of a round plate attached to the sampler and resting on the sea bed to prevent any lateral movement of the sampler during sampling. Watts does not give any indication of how the sampler was restrained against latera I movement for samples higher than 1, 3 metres above the sea bed, and the author assumes, therefore, that the sampler was hung from the boom to the correct depth. This could give rise to a pendulum action of the sampler caused by the orbita I motion of the water, and as the sampler was not stationary, the resulting readings could therefore be low as the sample was being continuously drawn off from the same region of water. The author be Ii eves, however, that this variation from the true reading wi II be small and other factors affecting the readings such as the effect of the fixed structure on the flow patterns, and the natural variation in wave height and wave length would result in variations in concentration readings far greater than that caused by a slight pendulum motion of the sampler.
Extensive laboratory calibrations were carried out by Watts (12) to determine the order of accuracy of the sampling procedure. As l·he unsteady motion of the water mass subject to wave motion cannot be accurately modelled in the laboratory and the resulting sediment concentrations in such a water mass are unknown, Watts decided to test the sampling procedure in a steady uniform flow where the sediment concentration is fairly uniform and initially measured concentrations using a reference nozzle sampling at stream velocity, directed into the direction of flow. The reference nozzle is then removed from the apparatus, and the test nozzle inserted and concentration determined using this nozzle. A circulatory system was set up to keep the sediment concentrations as uniform as possible. The velocity in the test section was varied to investigate the effect of the ratio of the velocity in the nozzle at the sample draw-off point, to the stream velocity. Watts used a high sediment concentration for the calibration, approximately 4% by volume (100 000 ppm by mass) which seems exceptionally high as the highest average concentrations determined in the field investigation was 3 500 ppm. Various sampling efficiencies were evaluated for differenf velocity ratios, nozzle sizes and orientations, and it was found that the highest sampling efficiency was obtained using a 12mm nozzle with as high a velocity ratio belween the nozzle velocity and the flume velocity, as possible. ·

7.
1,20 ~~---.--T-
'-0 . t 1, 15 ·IJ u... c: .2 ..... u <I> t:l,10 0 u
0.. E a
V) l, 05 . - --<!> O> e <I> >
<( .1 .. O'------'---""'--_..... __ _._ _ __. __ -'
- I 0 . 1 2 3 4 5 6
Figure 2. 1 Correction Factor for Entire Wave in Breaker Zone.
Maximum Orbital Velocity in Metres per Second
Maximum Orbital Velocity in Metres per Second
From reference (12)
Figure 2. 2 Correction Factor for Entire Wave Outside Breaker Zone.
The velocity ratios were evaluated both inside and outside the breaker zone in terms of the maximum orbital velocity and the nozzle velocity graphs of the sample correction factor versus maximum orbital velocity were plotted using the intake nozzle velocity as a parameter, and are given above in Fig 2. 1 and Fig. 2.2.

8.
Watts concluded the laboratory ca Ii bra ti on with the evaluation of overall correction factors that .could be applied to the field readings. These correction factors were based on 1·he findings of the laboratory work and were evaluated knowing the nozzle velocity and the maximum orbital velocity. · Watts tenta-tively concluded that samples could be obtained in the field to within approximately 15 percent of the true concentrations.
The laboratory calibration of Waas have indicated that the concentrations. of. the samples obtained can vary considerably from the true concentration. These results are however based on experiments carried out with very high concentrations which were not experienced in the field, and the author thus feels that the correction factors thus evaluated may be too high. If a lower concentration is used for calibration then there is less likelihood for the sediment to settle within the sampling system during sampling and consequently a higher sampling efficiency.
A total of 290 samples were taken at Pacific Beach, San Diego between January 1950 and May 1951, of which approximately one third were rejected on the grounds that the intake velocity was less than 4,6 m/s and it was concluded that the intake was blocked or restricted for these samples and hence considered unrepresentative. In total, 170 representative samples were taken landward of the breaker line and 22 representative samples taken seaward of the breaker zone .. Each sample period was of 5 minutes duration, thus giving an average concentration over a time of 25 to 30 wave front passes, and the a-.erage size of sample was approximately 200 litres. The order of magnitude of the average concentrations varied between 89 ppm for 0,3 to 0,6 metres wave height class, to 1374ppm for 1,3 to 2,0 metre wave height class, with a maximum of 3470 ppm occurring under conditions of 1,0 to 1,3 metre wave height class. The median diameter of the samples was approximately 0, 150 mm. The maximum concentration obtained in any one indivi dua I sample was 7 910 ppm under 1, 0 to 1, 3 metre wave height conditions, in 1,3 to 2,0 metre water depth, with~sample elevation of 0, 15 to 0,3 metres off the sea bed. The author believes that these high concentrations at very low nozzle elevations could result from possible entrainment of sediment from the sea bed. However; the water depth in which they are taken indicates that the sample position could have been at the breaker line, and high concentrations could exist directly under the plunge point of the breaker. This is also indicated by the wide variation in concentrations in this class, namely from 1 460 ppm to 7 910 ppm.
Watts concluded that there is evidence to suggest that the concentrations were fairly constant between 2/10 and 6/10 of the depth from the bottom. The correlation between grain size of each sample and the elevation of the sample was studied, but no definite trend in any relationship between these two parameters was found.

9.
The investigations undertaken by Watts gave an initial insight into the order of magnitude and distribution of suspended sediment concentrations both inside and seaward of the surf zone. The method of sampling adopted was simple and practical, and the laboratory calibrations of the instrument provided an estimate. of the order of accuracy of this type. of sampler, even although prototype conditions were not attained in the laboratory. The main problem associated with this investigation<.rtfthe effect of the pier on the suspended sediment concentrations is unknown, and the results have thus to be accepted as being representative of the conditions prevailing if the pier we:<t.absent. The whole sampling system is dependant on the use of a pier as the base for the system, and sampling is thus restricted to one particular profile of the beach. The investigations conducted by Watts were carried out under a maximum wave height of 2 metres, which the author believes to be in the lower range of the tota I wave spectrum, and cannot thus be representative of the complete wave spe.ctrum. Watts, therefore, provided a basic method for investigating the suspended sediment concentrations in the surf and is backed by an extensive laboratory calibration that shows the feasibility of using pump type samplers in this application.
Fairchi Id (5) conducted more than 800 suspended sediment tests between 1970 and 1972 from two fishing piers on the Atlantic sea board of the U.S.A. at City Pier, Ventnor, New Jersey and at Jennettes Pier, Nags Head, North Carolina. The samples were taken in waves of up to 1,3 metres in height, inside and outside the surf zone and in a maximum depth of 4 metres. The sampling unit used was a type of pump sampler, the pump and motor being mounted on a tractor which moved along the pier deck. A boom with the inlet pipe and nozzle was lowered onto the sea bed from the tractor on the pier deck, and the sample pumped from the desired sample point into a 150 litre drum. The sediment was allowed to settle, and the water was decanted from the drum to obtain a wet sediment sample suitable for handling. The sampling duration was approximately 3 minutes, and using a 12 mm nozzle, the average flow was 0,83 dm3/s and intake velocity is 7 4 metres/sec, compared to an average flow and intake velocity of 0,67 dm3/s and 5,3 metres/sec respectively, as used in the submersible pump sampler used by Watts ( 4). .
Suspended sediment concentrations were sampled at points both inside ·and outside the surf zone alongside the pier, at elevations above the sea bed of between 75 mm and middepth. The sediment size distributions were found to be fairly constant, with a median diameter of approximately 0, 150 mm at Ventnor and approximately 0,200 mm at Nags Head. Fairchild presented the results in the form of scatter plots of concentration versus nozzle elevation; height to depth ratio; and height squared. All the plots showed a relatively large scatter, but despite this, Fairchild was able to draw some important conclusions. On examination of the graphs of concentration versus nozzle elevation, Fairchi Id concluded that as the wave height increases, the distribution curve appears to become flatter, i.e. the rate of variation of concentration with elevation decreases, as shown in Fig. 2.3 and Fig. 2.4. This appears to be logical in that as the wave height increases, more energy is available in the form of turbulent shear stresses to lift sediment into suspension at higher elevations, but the bed load concentrations will remain fairly constant, and only increase in· thickness with increasing wave height.

10.
5,0;--~~~~--~~----~~~--~~~......,
Nags Head Data 5,0
Nags Head Data
H = 1,om H = o,5m
• • • • • +- • ...c • •
1, 0- e • •
0)
·~ 1, 0 •
• e
.. .. >-...0 • .. • +- •
0,5 ~ 0 • •
' •
a. 0. 0 5
I c 0 ·-
• • • 0 e
.... • 0
'-• • +-
c (!) 0 c • 0 u • • •
0, 1 I I
Sta. 325S o, lL-~~~L.-~~·-'-~~~-'-~~--''...__,~_, Sta. 326N
0 0,5 1, 0 0 0,5 1,0 EB - Metres
Figure 2. 3 Figure 2.4
Vertical Distribution of Sus.e~ded Sediment Concentrations
From reference (5)
Fairchi Id also identified various J·ypes of distribution·; related to the type of breaker present, and found that the median diameter of the sediment remained relatively constant with nozzle elevation, but the coarser 5% fraction decreased with elevation.
The most significant observation by Fairchi Id was the sharp increase occurring in suspended concentrations just seaward of the breaker zone, reaching a maximum concentration at a point where the wave height to water depth ratio was approximately 0,78. The reason for this may be explained in energy terms. On a flat sandy beach, the energy dissipation due to bed shear stress is very small, thus most of the energy in a deep waler progressive wave is still present in the wave when it begins. to break. Howeve~, just before breaking, this energy is concentrated in the minimum depth of water encountered from deep water conditions to breaker point, and thus it can be expected that the bed shear stresses are a maximum, causing the greatest amount of sediment to be entrained and held in suspension due to the increase of turbulence. After breaking, the wave has lost much of its energy, hence the sediment concentration would be expected to decrease as the energy per unit depth has decreased.

11.
Fairchi Id compared the results obtained in the field with those obtained in a wave tank, and concluded that the field results compare realistically with those obtained in the laboratory. In presenting the field data, however, no mention is made of the wave period. The author believes that the wave period is an :.z
important parameter in the determin~tion of the distribution of suspended sediment, as it is the wave period alone that determines the deep water wave length, and consequently the shallow water wave length, Without a knowledge of the wave period, no estimate of the maximum orbital velocities at the bed can be made, and this parameter defines, to a large extent, the distribution of suspended sediment and the bed concentrations under oscillatory wave action. The field data thus presented by Fairchi Id with no reference to wave period, cannot be analysed further and the results can only be used to predict certain character-istics of the sediment distribution. With regard to the process of decanting the water from the 150 litre drum to obtain the sample, the author feels that this process can result in considerable errors when decanting in the field and in particular with such a large container with a relatively small sediment sample. A sand particle of 0,040 mm diameter would take approximately 14 minutes to settle. If the decanting process is done too quickly, the smaller size fraction of the sample wi II be lost. The author obtained some sediment samples at Stilbaai in the Cape Province, South Africa, during December 1976 using an instantaneous vacuum sampler, and due to a shortage of bottles, decanting had to be dqne in the field. This process proved to be very time consuming and the strict control needed for decanting in the field indicates ·that the filtration method, as used by Watts (4), is preferable,
The pump type samplers as developed by Watts and Fairchi Id have produced a large number of field results both inside and outside the breaker zone and have helped to define the expected order of magnitude of suspended sediment concentrations. However, the results obtained by these two investigators are only of value for comparatively low wave heights, up to a maximum of 2,0 metres. In addition, the system which requires a pier for access, gives rise to unknown effects on the concentration distribution caused by local flow disturbances. A pier is generally immovable, therefore sampling takes place on a fixed profile of the beach, and thus the day to day longshore variation of phenomena within the surf zone, such as rip currents, may alter thei-r position with respect to the pier over a period of time, and the influence ori" the sediment transport characteristics near the pier will be significantly altered. Another problem encountered when using the pier as a platform for sediment tests, is the limited wave height conditions under which sampling can safely take place. This has resulted in relatively low wave height conditions under which Watts and Fairchi Id measu/ed suspended sediment concentrations.
2 .2 Time-averaging Trap Tl'ee Samplers
This type of sampler operates on the principle of allowing the water-sediment mixture to enter a container submerged in the water, in which the velocity of the dispersoid is reduced to the extent that the sediment wi ii settle and collect in the container.
12.
The water then flows out oft-he container via a ~mall hole in the rear. This type of sampler has been used with success in the measurement of suspended sediment in undirectional flows, where together with a current meter, the absolute mass of sediment at a particular level passing a particular point in a known period of time is measured, and knowing the water velocity, the suspended sediment concentration can easily be calculated. Attempts have been made by several investigators to use this type of sampler in the nearshore environment.
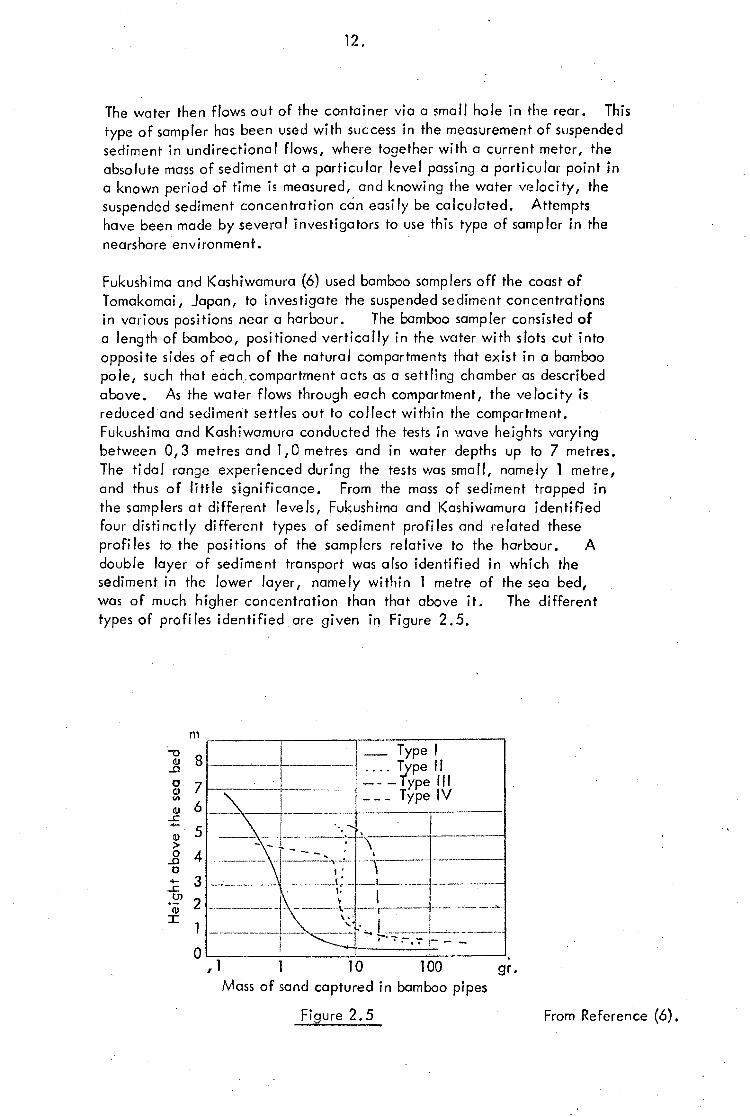
Fukushima and Kashiwamura (6) used bamboo samplers off the coast of Tomakomai, Japan, to investigate the suspended sediment concentrations in various positions near a harbour. The bamboo sampler consisted of a length of bamboo, positioned vertically in the water with slots cut into opposite sides of each of the natural compartments that exist in a bamboo pole, such that each.compartment acts as a settling chamber as described above. As the water flows through each compartment, the velocity is reduced and sediment settles out to collect within the compartment, Fukushima and Kashiwamura conducted the tests in wave heights varying between 0, 3 metres and 1, 0 metres and in water depths up to 7 metres. The tidal range experienced during the tests was small, namely l metre, and thus of little significance. From the mass of sediment trapped in the samplers at different levels, Fukushima and Kashiwamura identified four distinctly different types of sediment profiles and re lated these profiles to the positions of the samplers relative to the harbour. A double layer of sediment transport was also identified in which the sediment in the lower layer, namely within l metre of the sea bed, was of much higher concentration than that above it. The different types of profiles identified are given in Figure 2.5.
m ~~-~~~---.,..-------~-~---, -o ! _ Type I ~ 8 ---~--, --j _. _. ~pe 11 ~ 7 _____ · --1-·--·-- ·- I ~ ~ _- T~~: IU i :-=-_:_ l=~-:-_:::;-'\ ___ -1 ____ _ ~ 4 . ------- ·1-----=-=~·\;·j- ·--~----·--1-···-----~ 3 -------- -· ,...- -~-------t., .-- ·-·-· -----!--------------
; 2 ------- -1-' ------'~:----~-------+-· -- ------~ . 1 --------+---· ____ ': . "~---.:.---=--=--!=-~----·--·· 0 ! • •• - -
, 1 10 100 gr. Mass of sand captured in bamboo pipes
Fi sure 2. 5 From Reference (6).

13.
The type I distribution was found to occur on a natural sandy coast with little or no longshore obstructions. The type II distribution occurred at sample points alongside a breakwater, and the relatively larger masses of sediment· trapped at the higher elevations from the sea bed can be explained by an increase in turbul.ence due to the interaction of the incoming progressive waves and the breakwater, coupled with the possibility that fine sediment could be injected into these levels by a river which entered the sea at that position. This type of distribution could thus be caused by the influence of the river sediment dispersing into the sea, rather from the result of increased wave action. The type Ill distribution is similar to the type II, but the higher mass retained at lower elevations are not present, possibly due to the fact that the sample positions relating to this distribution were at the head of the breakwater, and the influence of the sediment brought down by the river is not significant. The type IV distribution occurred in areas sheltered by the breakwater.
The mechanism by which sediment collects in the bamboo samplers was investigated in the laboratory by Fukushima and Kashiwamura {13). A study on the effect of the inclination of the slots relative to the water velocity was made, in order to determine the efficiency of sampling for various particle sizes. From the results obtained in this reference, .it appears that the efficiency is rather low; the ratio of the mass of sediment captured in the tube to that flowing through the tube varied between 2% and 7% for different size particles~
Further tests using bamboo samplers were carried out by Hom-ma and and Horikawa (14) of the coast of Takai and Niigata in Japan during 1959 and 1960. Measurements were made in the field under wave conditions of l, 1 metres in height with a period of 6,2 seconds, and .. , .. in water .. dep.ths·beiweeri 4,8·metres and 7,8 metres. _Laboratory calibrations .using a siphon sampler of 1, 5 litre capacity were undertaken in order to determine the constants in the _theoretical expressions developed by Hom-ma and Horikawa, so that the concentration distributions could be estimated under higher wave conditions. Hom-ma and Horikawa concluded that under high wave conditions, up to 5,5 metres in height with a period of 12 seconds, the suspended sediment concentration would decrease rapidiy as elevation above the sea bed increased up to a height of approximately 2 metres, and would· then remain relatively constant, as shown in Fig. 2.6.
These results are based purely on mathematical expressions and field observations in relatively low wave conditions with no verification under high wave conditions, and must be viewed accordingly.· Hom-ma and Horikawa observed that the sand ripple dimensions have an important effect on the distribution of suspended sediment concentrati'ons determined in the laboratory experiments. The effects of the sand ripple profile on suspended sediment concentrations in the field, are, however, unknown.

14.
Figure 2.6
H (m) T (sec)
8 4 5 2 3 1 l 5,5 12 I -- -·--~-- --·-- 2 4,5 . 12
-·------ ... 3 4,5 10 4 3,5 10
------·-- 5 3,5 8
103 105
, . C (ppm) Analytical Vertical Distribution· of Suspended Sediment Concen-:
.' trations for Variable Wave Conditions.
From Reference ( 14)
Basinski and Lewandowski (3) used a time averaging trap type sampler made of perspex similar to the bamboo tube type of sampler as described above, to determine the relative concentrations of sediment at various levels above the sea bed at Lubiatowo in Poland off the coast of the Baltic Sea and off the coast of Libya during 1973. The sampler consisted of a perspe·x tube, 50 mm outer diameter and between 3 and 4 metres long with a cot'.lpartment size of 20 mm, positioned vertically in water depths of between 2 metres and 5 metres. The tul::es were kept in position for a period of 5 days, during the passage of a meteorological low pressure system which resulted in wave height of up to 1 metre. The tubes were positioned in a line offshore, approximately 100 metres apart, up to a maximum distance of 500 metres offshore. Basinski and Lewandowski evaluated the relative sediment transport both in the onshore - offshore direction and in the longshore direction at various distances along the profile relative to the underwater bars. However, no attempt was made to correlate the mass of sediment retained in the tubes at various levels with the prevailing wave conditions.
The bamboo type of samp fer described above measures the accumulated mass of sediment at various le\els above the sea bed. In order to determine the distribution of suspended sediment, the velocity profile at the $amp ling point must be known.

15.
None of the investigators using the bamboo samplers took the velocity profile into account when analysing the data, but assumed that the curve resulting from the accumulated mass at various levels is similar in .shape to the distribution of suspended sediment. The bamboo type sampler, however, determines a relative measurement of the total sediment transport in a particular direction at a particular elevation and position rather than the relative distribution of suspended sediment.
Investigations by Longuet-Higgi ns and others in reference (15) have shown that the velocity profiles are exceedingly complex in both the longshore direction, caused primarily by oblique wave attack, and in the onshoreoffshore direction, caused by mass transport velocities due to the unsymmetrica I wave profile. It is possible, under certain circumstances, for a reverse mass transport flow to occur at mid depth whi 1st the mass transport flow at the bed is in the opposite direction. Hence the determination of the distribution of suspended sediment concentrations from the measurement of the relative mass transport at various levels above the sea bed, as obtained by bamboo samplers, without knowing the velocity profile, can lead to large errors being made. The author, therefore, concluded that the bamboo type of sampler cannot be used with any accuracy to determine the relative distribution of suspended sediment concentrations existing in the field. The work carried out by investi-gators using this type of sampler has only been undertaken in very low wave height conditions and only seaward of the breaker zone. Although the bamboo samplers offer a simple and cheap method of obtaining results, the wave climate in which it can be used is very limited and thus is of little value when measurements are required off a beach experier:icing high wave conditions.
Another type of time-averaging trap type sampler which has been used in the coastal environment is the Delft bottle commonly used in the measurement of suspended sediment concentrations in rivers and channels. Experiments were conducted by· the Marine Effluent Resea:·ch Unit of the Department of Oceanography, University of Cape Town (7) and (16), at Duynefontein, north of Cape Town during 1972 to 1974. The instrument was attached to the leg of a tower situated approximately 1200 metres offshore in a water depth of 11 metres. Measurements were taken over a · period of approximately one to two months at a time, in water depths of 5 and 8 metres. Wave heights varied considerably during the sampling period, with heights of over 5 metres being recorded (7). Initially a Bendix current meter was installed with the Delft bottle to obtain current velocities and directions, but this had to be removed later because of corrosion problems and damage caused by wave action.
The data obtained from the Delft bottle experiments was thus.unable to predict the suspended sediment concentrations, but tha relative amount of sediment transported in various directions could be determined, together with the size of sediment present.
16.
It was noted that 80% to 90% of the mass fraction of the sample was within 0,088 mm to 0, 177 mm, but under more severe wave conditions, i.e. during winter storms, a significant proportion, between 10% and 15% of the mass fraction, was found to be between 0, 177 mm and 0,250 mm in size. It was also noted that the mass of sediment trapped in the longshore direction was significantly larger than that trapped in the onshore-offshore direction, the ratio between these two masses varying between l, 5 and 10. The mass fraction of si It trapped, i.e. less than 0, 060 mm in size, was very small in
all cases.
Although this type of sampler was only used as ·a preliminary study of sediment transport, it does provide an indication of the relative transport of suspended sediment at various depths, and with further instrumentation providing velocity measuremerit, the distribution of suspended sediment concentrations can be obtained. However, as the sampler and accompanying velocity measuring equipment are not robust enough for measurements in the surf zone or outside the surf zone under high wave conditions, thus severe limitations restrict the use of this type of sampler to low wave height conditions, when the suspended sediment concentrations are small and contribute little to the overa II sediment movement experienced on a beach.
2. 3 Instantaneous Trap Type Samelers
The type of sampler used in this application of measuring suspended sediment concentrations in the surf is a portable siphon sampler, commonly consisHng of an evacuated bottle of 1,5 litre capacity, connected to a quick release valve and intake nozzle. Hom-ma and Horikawa (14) mention the use of such a sampler in conjunction with bamboo samplers, but it proved to be
"unfeasible due mainly to the difficulty of operation under rough sea con-diHons". No results using this type 9f sampler were mentioned by Hom-ma and Horikawa.
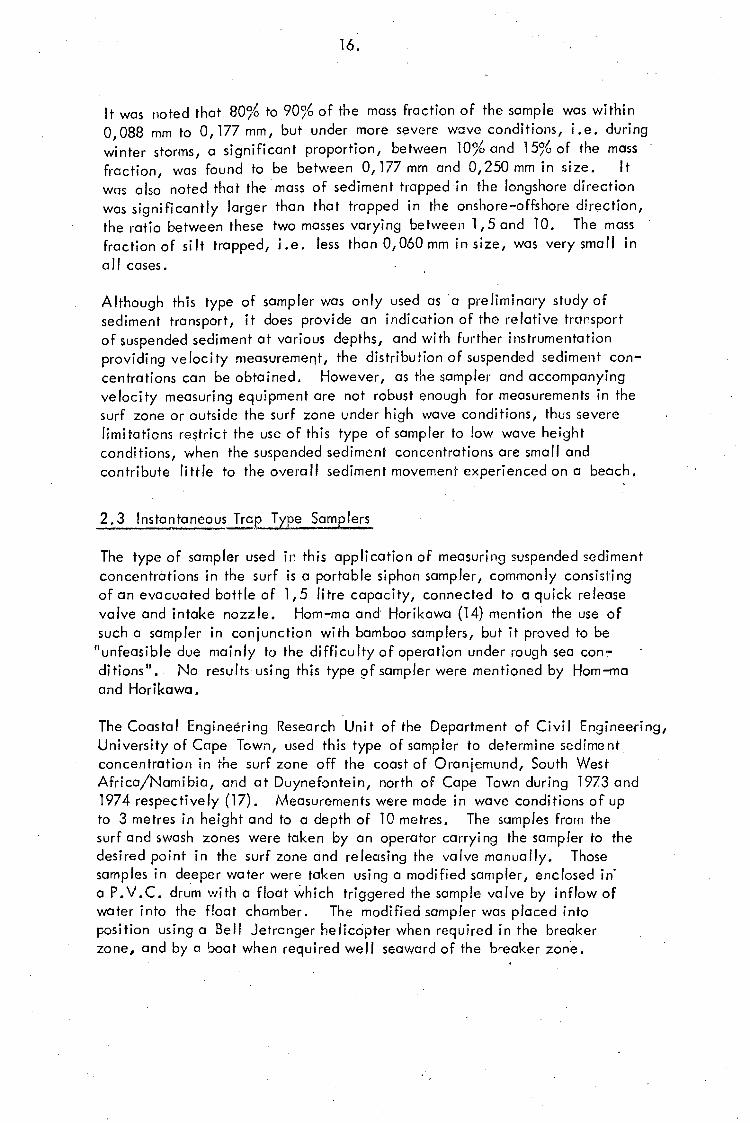
The Coastal Engineering Research Unit of the Department of Civil Engineering, University of Cape Town, used this type of sampler to def'ermine sediment concentration in the surf zone off the coast of Oranjernund, South West Africa/Namibia, and at Duynefontein, north of Cape Town during 1973 and 1974 respectively (17). Measurements were made in wave conditions of up to 3 metres in height and to a depth of 10 metres. The samples from the surf and swash zones were taken by an operator carrying the sampler to the desired point in the surf zone cind releasing the valve manually. Those samples in deeper water were taken using a modified sampler, enclosed in· a P.V.C. drum with a float which triggered the sample valve by inflow of water into the f!oat chamber. The modified sampler was placed into position using a Bell Jetrcnger helicopter when required in the breaker zone, and by a boat when required well se:av1ard of the breaker zone.

17.
The samples obtained were instantaneous measurement of the suspended sediment concentrations at a particular time in the wave cycle. In order to obtain the average concentration, several measurements had to be taken at various times in the wave cycle, at the some elevation above the sea bed, Some results obtained using this type of sampler are given in Fig. 2.7.
1.2
1, 1
1.0 ELEVATION
0,9 ABOVE SEABED 0,8 (m)
I
I -t -' ,Om I I -"
I '· .... t =( -!Sm
I -- - t =1 ,bm I
d=4,_5m d=2,0m d=4,5m
0,7
0,6 f -f= 0 . ' --- m d=2, Om
o.s 0,4
0.3
0,2
I '""-...
'\. . ~ -
~ t--.__
"' --- r-...: ' " II
' --. . 0,1 -o.o
2 3 4 s 6 s 1 2 3 4 sG a 1 2 3 4 s 6 e 1 2 a 10 100 1 000 CONCENTRATION ppm by m~ss
•,'I','',. 'I '1:' t >',I
Figure 2~7 : Concentration results using siphon sampler. From Reference (17)
The necessity to obtain several samples at one sample point to determine the average concentration is time consuming and costly if the operating costs are high, for example, use of a helicopter, In addition, the use of a boat seaward of the breaker zone sometimes proved to be hazardous if the beach profile was very flat. The main disaavantage of this type of sampler was the. small quantity of sediment trapped. This can result in large variations in the concentrations as calculated as a small amount of residual sediment in the sampler will alter the total sediment mass trapped significantly, and with it, the concentration, whereas if the sample contained a larger mass of sediment, this sma II amount of residua I sediment wi II have little or no effect on the concentration. In addition, the grading analysis of such a small sample is difficult to determine, However, this type of sampler is relatively inexpensive to manufacture and operat·e, and the results give a reasonable indication of the order of magnitude of suspended sediment concentrotions which can be expected under prototype conditions. It can also be used in high wave conditions, obtaining samples from the breaker zone and just seaward of it, using a helicopter to place and retrieve the unit, None of the previous instruments discussed w~~~;,, able to be used under these conditions.

18.
2. 4 I ndi red T yee of Sam.e.ler~ used i ri the~
Three types of indirect samplers wi II be considered, namely the ultrasonic m'ethod as described by Wenzel (2); the radiometric method as described by Basinski and Lewandowski (3); and by the electro-optical method as described by Brenninkmeyer (i8).
Wenzel (2) developed an instrument to measure current velocity and sediment concentrations using the change in sonic properties of the water with increasing sediment concentrations. Electro-magnetic current meters were used, whereby a voltage is generated by water passing_ through an electromagnetic field. The actual construction of these current meters is not desc;ibed by Wenzel. The sediment concentration can be measured by these acoustic phenomena; namely reflection, absorption and variation of sonic velocity. Wenzel postulated that the measurement of suspended sediment con'centration can be made using two of these phenomena: absorption and variation in sonic velocity. Formulae for the sonic velocity in sediment-free and sedimeni·-laden water are quoted by Wenzel. This resuits in a measuring system independent of water colour and turbidity, which 'handicap other indirect types of samplers in the field, but sti II needs extensive calibration.
The instrument consisted of a sound emitter and receiver placed v~rtically on a loop of approximately 600 mm in diameter. Water flowing through the loop resulted in a reduction in sonic velocity according to the. concentration. The unit is to be mounted in a.sturdy frame and placed on the sea bed during a ca Im period. An under-sea cable connects the instrument to the base on the shore providing power and data transmission link. This device, therefore, provides a continuous record of current velocities and sediment concentrations at a particular level above the sea bed, during a long period of time. It has been tested at Westerland on the Island of Sylt, North Germany, in the North Sea during 1972, but no results were mentioned by Wenzel, as the calibration was incomplete.
If the system as described by Wenzel is successful, it wi II provide a .major advancement in the problem of measuring suspended sediment concentrations in the surf zone under high wave conditions. The unit is robust, lacks moving parts, and can remain in position for long durations. However, several problems still have to be solved, the main one being calibration. During operation, other problems may arise, such as the effect of marine' growth on the instrument, giving rise to erroneous velocity measurement, and the possibility of the instrument being buried by seasonal changes in the beach profile. In addition, the instrument at present only meas~res the reduction of sonic velocity at one level, and if calibrated, the resulting sediment concentration, thus a number of these instruments with sensors at different levels would be required to determine the distribution of suspended sediment concentrations.
19.
Notwithstanding these difficulties, this system could provide a good method of measuring.sediment concentration in the future, if the calibration of the instrument is successful.
Basinski and Lewandowski {3) developed a system to measure suspended sediment concentration in the ,surf using the absorption of gamma radiation in sedimentladen water. Preliminary tests were conducted in the Baltic Sea off Lubiatowa in Poland during 1973 and 1974 but no concentration readings were published. Two aluminium tubes, 500 mm in diameter, one containing a radioactive source, the other containing the sensor, were placed 46 mm apart and fixed vertically to a platform resting on the sea bed. The probe and sensor moved simultaneously in each tube t~ the desired level, and a continuous reading of gamma ray absorption was obtained.
Laboratory calibration was carried out by inserting perspex sheets between the probe end sensor, and placing sand between these sheets. By adjusting the distance between the perspex sheets, different concentrations of sediment could be simulated. However, the variation of radiation as detected by the sensor can be caused by phenomena other than sediment concentration. The intensity of gamma radiation from the probe itself can vary, together with natural gamma radiation received from space. In addition the absorption of gamma radiation is also affected by the .variation in salinity and chemical composition of the sea water and sediment respectively. The author believes that these factors render calibration as determined in the laboratory, not to be as accurate as found by Basinski and Lewandowski. If a very low emittance is used in the probe, then the level of natural radiation may affect the readings considerably, whereas if a probe of high emittance is used, radiation hazards may result to the detriment of the local marine environment.
During field tests, Basinski and Lewandowski mentioned several difficulties experienced, namely the electrochemical corrosion of the aluminium tubes in sea water causing the probe and sensor to jam in the tubes, and wave action on the tower caused leakages in the tube joints.
The system as developed by Basinski and Lewandowski has several major disadvantages, namely: the inflexibility of the system which relies on a fixed platform of sufficient slTuctural rigidity to withsl·and wave attack, particularly if situated in the surf zone; the problems.associated with calibration of the · system as described above; the radioactive nature of the experiment may be hazardous to marine life and the consequences of failure of the probe casing could cause considerable damage; and the reliance on a high voltage system needed for the probe and sensor, requires an external power supply. Gibbs (26) concluded that the radiometric absorption method is not very sensitive in very low concentrations, and can only be used in the ra~ge of 5000 ppm to 100 000 ppm. The threshold limit of 5000 ppm occurs seldom in the coastal environment, and then only under conditions of high wave actiOn.

20.
As the Baltic Sea where Basinski and Lewandowski conducted the tests ,appears to experience a low wave climate~ this system may be successful under these conditions. However, it is not feasible for this type of system to be employed in a region of high wave action as it is not sufficiently robust.
Brenninkmeyer (18) developed on electro-optical system to measure sediment concentrations in the swash zone. The syst-em consisted of 64 photo-electric cells placed above each other in a tube, which was placed vertically in the upper region of the swash zone. A high intensity fluorescent lamp was placed next to the ph9to cells, and the light attenuation between the light source and sensor was measured. Tests were conducted at Point Mugu, California. under wave conditions of up to 0,9 metres in height and 13 to 16 second wave period. Measurements were carried out under extremely low wave conditions and in the upper region of the foreshore only, thus resu I ts cannot be comparable to those obtained under high wave conditions.
The main disadvantage of this system is that it is not robust enough to conduct measurement under reasonably high wave conditions, i.e. up to 2 to 3 metres in height, and can only measure :;ediment concentrations in the upper foreshore where the concentrations _are of little value in determining the overall movement of sediment. The electro-optical system is also susceptible to erroneous readings caused by turbidity, marine organisms and water colour.
2.5 Suspended Sediment Samplers used in Tidal, Estuarine and
Deep Sea Applications
Numerous samplers have been developed for .the measurement of suspended sediment in tidal and estuarine waters. A cross section of these types wi II be discussed briefly to illustrate the system used for sampling, and whether it can be developed for use in the nearshore environment.
Jensen and Sorensen (19) determined suspended sediment concentrations in a proposed dredged channel at the Port of Karachi in Pakistan during 1971. Sampling took place well outside the breaker zone, in 11 metres water depth, using a boat operated system. The sampler consisted of a frame in the form of a tripod with' four nozzles mounted horizontally on to the frame, being 0, 1 metre; 0,3 metre; 0,9 metre and 2,4 metres above the sea bed. The nozzles were connected by a flexible tube to the pumping system on the boat, anchored overhead, where two 1 Ii tre samples were obtained every 45 minutes from each nozzle, the sampling duration being approximately 30 seconds. In addition, a sample was taken at middepth. The wave conditions during sampling varied between 1,4 metre and 2,7 metre, with a zero crossing period of between 7 to 9 seconds. .,.,. . ., .. , .. _;
... '. ,·: .. :.. '. ·)

21.
The tidal range was significan1·, being 3,5 metres, with a maximum velocity of 0, 5 metres per second. Thus the sediment in suspension. was the result of the combination of the wave action and the tida I current. Concentrations determined from the sampling system are given in Fig 2. 8. The median diameter of the bottom sediments was found to be 0,080 rnm. It was found that the concentrations at the 0,3 metre level and above agreed with the calculated values, but that the value for the 0, l metre level varied considerably. This may possibly have been due to slight settlement of the tripod. Full scale laboratory tests were undertaken in an oscillatory water tunnel to determine the sediment concentrations at levels between the bed and 0, l metre elevation.
10
I I i I
. ___ .. __ J ... ··-- . !.. . --- ·----------' I I. I
__ _j__~_ ------~ I I
I I -+-I
. I Prototype Measurements
- - - Laboratory Measurements Average Depth 11, 3 m
·1------1--\ ·---+---~--------
5
2
p
0,5
i o2 -----.--·-==-~ J=_J.-~--------!--'--+---- -·___Jl'-----
1 ,, ' ' --.. --.. l 0 05
0,2
0, l
I ~ - _L ____ ·o.·02; 3 ·-··--- --- -----i·--- - I -' ' J__ I.. -
10 ·1 -- ,1 0,01 .£:L j I __ ,
y 100 1000 Concentration (ppm)
10 000
Figure 2. 8 · : Sediment Concentration Profiles
,....... E ...........
>-
E .2 .... .8
Q)
> ..8 0 ....
..r.
.!2> (I)
:c

22.
This system requires a boat as the support craft for sampling, and thus cannot sample near the breaker zone. In addition, the size of sample is rather small, namely 1 litre, which could affect the accuracy of the concentrations. It does, however, give the order of magnitude of sediment concentrations which can be expected under combined action of waves and currents.
Crickmore and Aked (20) describe four types of pump samplers used by the Hydraulics Research Station in the United Kingdom to determine velocity and sediment concentrations in estuarine and tidal water. Two of the units were point integrating samplers and the other two were depth integrating units as defined by the Draft. ISO Standards (21) and (22). The point integrating units consisted of a bed frame type and a mast type, with intake nozzles and current meters fixed at various levels above the sea bed, the closest being 150 mm to the bed. The current meters were of the impeller type, measuring velocity by "make and break" principle caused by the rotation of the impeller blades. The electrical impulses were picked up by magnetic sensors and transmitted to i·he instrumentation on the boat by multi-way cables. The pump was mounted on the boat, connected to the nozzles by way of a single flexible hose, where the various nozzles were opened or closed using solenoid valves. One of the depth integrating samplers was operated from a boat, the frame being lowered to the sea bed ~:>n which a nozzle was mounted on a drive to enable it to move vertically. The other sampler was used on a fixed structure, where a wheeled trolley was mounted on to one of the vertical' legs, thus enabling vertical movement of the nozzle. Fins were fixed to the frames to ensure correct orientation of the nozzle. The samples were filtered on board through terylene filters capable of retaining particles larger than 0,040 mm in diameter, and the throughput of water was measured by volumetric meter, The volume of sample was approximately 40 Iii-res and pumped at between 10 to 15 litres per minute, giving an intake velocity of 1,5 metres per second for a 13 mm nozzle.
These units were designed specifically for calm water applications and can not be used in the surf without modification. They are very similar to the pump samplers used by Fairchi Id (5) and Jensen and Sorensen (19).
Crickmore and Aked (20) also investigated the effect of the relative intake and flow velocities and the orientation of the nozzle on the efficiency of sampling. Tests were carried out in a flume with water depth of 0, 4 metres, and steady uniform flow of 0,62 metres per second, with a measured concentration of approximately 400 ppm at 0, 1 metre above the bed. Concentrations at various velocii-y ratios were measured and are given in Fig2.9.
,·

23.
It appears that for velocity ratios of 0,5 to 4,0 the concentrations determined show no large variations and thus the velocity ratio does not have a significant effect on the sample concentration. Tests were also carried out to determine the sampling efficiencies with different nozzle orientation with respect to the flow velocity. It was found that 13 mm and 15 mm nozzles showed a 6% concentration deficiency for a 90° orientation to the flow velocity, and an 18% deficiency for a 180° orientation.
600[ 0
500
00 A 4 •
400 ,,........
'o> .s 300 c
.Q 0 200 ..... ..... c (!) u § 100 u
• • . .. x x
Intake dia (mm) 6 13 )( 16 • 25
500
::::- 400 'ci> .s
r.: 300 0 ·-..... 0 ..... ..... ~ 200 u c 0
u 100
4
"
Bore of Intake hose mm dia mm
13 13 13 16 13 25 16 13
0 ·---'----'---" . 0,4 0,6 O,ff 1,0 . 2,0 3,0 ~;O 5,0
a·~-__.~ _ _.__. _ _,__ __ _._ _ __.. __ ~ 0,5 1,0 1,5 2,0 2,5 3,,0
Sampling ratio= intake velocity/ Sample velocity~
Figure 2. 9 : Effec;:t of Pumping Velocity J2.!2_ Sampling Efficiency
Mean Velocity in pumping line (m/s)
Figure 2. 10 : Effect of Sampling Flow rate on Sediment Concentration.
The duration of sampling has an effect on the coefficient of variation of the samples. Crickmore and Aked determined that the coefficient of variation for sampling periods of 12 and 240 seconds was 17 and 7 percent respectively. A minimum sampling time of 60 seconds was thus used to provide a coeffi.cient of variation of less than 10 percent. In addition, they carried out tests to determine the minimum pumping velocities in the system needed to prevent fall-out of sediment within the pipes. Experimental values given in ·. Fig 2.10, show that for velocities lower than 1,0 metres per second, sediment tends to accumulate in bends or horizontal lengths of the pipe. It is thus desirable to design the sampling system with pumping velocities above 1,0 metre'.'.- per second.

24.
Gohren and Laucht (23) developed a si It gauge to investigate the influence of wave action and drift currents on the suspended sediment load in tidal flats in the Elbe Estuary, West Germany. The instrument consisted of a conical settling tube, l metre in height, into which a 20 litre sample is pumped every hour. The sediment is allowed to settle into a measuring cylinder at the base of the tube, where the volume of sediment settled within one hour is recorded photographically, together with the time. The recorded volume therefore includes all sand sizes greater than 0,020 mm in diameter. A magnetic va Ive discharged the sediment back to the estuary, and a further sample is pumped into the settling tube by a submersible pump-motor unit. A continuous hourly record of sediment concentrations at a particular elevation above the bed can thus be made, and the whole system is self sufficient, relying on a wind generator for power sup~ly. The instruments were.mounted on a platform in the tidal flats, and can/operated up to 2 months when a change of fi Im is required.
Collins (24) developed sampling towers used on the tidal flats of the Wash during 1971 and 1972, to determine suspended sediment concentrations at mid depth at various times during one tide cycle. The towers were constructed of light steel and aluminium frames, mounted on a concrete base cast in situ during low tide. The sampling system consisted of 0,5 litre polypropylene and polythene bottles connected to the surface and sampling point with flexible tubes. The sampling tube was clamped or bent in such a way that when the water level rose to a particular level such that the intake nozzle was at middepth, a release mechanism allowed the water to flow into the bottles, the air escaping to the surface via the exhaust tube. A variety of release mechanisms was used, namely a goose neck in the intake tube which would act as a siphon when the water level reached the desired height; a mechanism clamping the intake tube with a cistern float, released at the desired water level; and various mechanical releases involving time switches or magnetic reed switches and solenoids. These release mechanisms appear to work reasonably well in tidal areas according to Collins, but the size of sample, 0, 5 litre, would make analysis of samples of small concentration difficult. This system of sampling would be unsuitable for sampling in the surf zone because of the light tower construction and the possibility of the release mechanisms failing due to vibrations caused by wave action.
Various authors have described sediment samplers used in deep water applications. Collins (25) used a transmissometer to determine suspended s~diment transport , routes and sources in the Outer Narragansett Bay adjoining Rhode Island, U.S.A. This instrument is based on the optical attenuation of light through a water- -sediment mixture and can be used to determine low concentrations. Collins (25) determined concentrations of the order of 5 ppm with median particle diameter of the order of 0, 015 mm to 0, 020 mm. Gibbs (26) describes various samplers used in deep sea applications. As the concentralfons are very low, pump type samplers are used with filters that must be capable of retaining particles of the size found by Collins, with a throughput of large volumes of water, up to 1000 Ii tres. " _ .. , _ .

25.
Optical absorption devices as used by Collins (25), are unable to read low concentrations very accurately, in the order of 1 ppm. ·A new device is being developed for the determination of very low concentrations, namely the optical scattering method. The amount of light reflected from the particles is measured and with calibration, the concentrations can be determined. This system wi II only be accurate under very low concentrations because of the shielding and shadow effect at higher concentrations. As these low concentrations are unlikely to occur and are of little significance in the nearshore region, this method cannot be used in this environment.
2.6 Suspended Sediment Samplers used in Laboratort Applications
Measurement of suspended sediment concentration in the laboratory has mainly been determined by electro-optical techniques. Hom-ma and Horikawa (14) initially measured concentrations using a siphon sampler to obtain results which were compared with field data to estimate the concentrations under higher wave attack in the field. However, the siphon sampler has several disadvantages, namely the disturbance of the flow patterns in small scale models exaggerates concentration readings, and if a large number of samples is required, the res
1ulting analysis of the samples is tedious. A new approach
was sought, and two instruments using the same principle were developed.
Hom-ma et al (9) and (27) developed a photo-transistor type of concentration meter, which measures the light attenuation across a glass sided flume, This instrument was developed further by Horikawa and Watanabe (28) who introduced an electrolytic turbulence transducer to measure the turbulent water velocities under wave action and investigated the effect of turbulence on suspended sediment concentrations. This instrument consisted of an ele.ctric probe immersed in the water, the turbulent velocities measured by the fluctuating voltage between the cathode and anode of the probe.
Bhattacharya, Glover and Kennedy (29) developed an electro-optical probe, the ISCP, containing diodes as light source and sensor each 1,6 mm in diameter. The emission spectrum of the light was in the visible and near infra-red regions. The source and sensor are coupled to amplifiers and filters and the output read on a voltmeter. Alternatively, the output can be read on an osci I loscope or plotted on a moving chart. The ISCP was calibrated for different sand size and a sand with median diameter of 0,21 mm was used in laboratory tests. This instrument was developed further by Bhattacharya and Kennedy (30) by coupling the output to an on-line computer for signal averaging and analysis of the mean and fluctuating components of sediment concentrations.
The ISCP probe of the Iowa Institute of Hydraulic Research has several advantages over that developed originally by Hom-ma and Horikawa (27). The small size of the probe when inserted into the flume produces little disturbance of flow patterns, and measures the concentration at a particular point.

26.
The photo-transistor method as developed by Horn-ma and Horikawa is subject to the reflection and scatter through the glass sides of the flume, and measures the apparent concentration across the width of !he flume. The opaqueness of the glass and the distortion of sediment concentrations caused by the wa II effect, could give rise to slightly erroneous readings. In addition this system measures the average concentration over a finite width equal to the size of of the source and sensor,. whereas the ICPS measures the concentration over a very small area. Nakato et al (31) investigated the effect of the passage of single sediment particles moving through the optical field of the probe, on the concentration reading, using ink dots on glass slides to simulate sediment particles.
Hattori (11) developed a probe. which counted the number of sediment particles passing through a slit by the variation of electrical resistance between two electrodes in the probe. The relative distribution of suspended sediment concentration could be determined, but a knowledge of the water and particle velocities must be known to determine absolute concentrations. For the experimental results, Hattori introduced the concept of "delay distance", described by sediment particle moving at the same velocity as !'he fluid, but some distance behind it, caused by the inertial resistance of the particle.
Bijker (10) investigated the possibility of using photography in determining sediment concentrations. Although this method provides instantaneous measurements of concentrations over a large area at a given instant of time, the fluctuations of the concentrations cannot be determined. It does, however, provide useful information~ as regards the entrainment process and mechanics of sediment suspension.
An important aspect recognised in all the laboratory investigations is the effect of sand ripple profiles on the sediment-suspension. Up to 5 peaks of fluctuating concentrations were measured at various positions above the sand ripple profile on the oscillatory wc;ive motion near the bed. Many investigators have attempted to correlate the resulting sediment suspension with sand ripple profile in the laboratory models. However, the extent of sand ripples in the field at the sample positions is generally unknown, and thus the application of laboraf'ory results in the field using the relationships between concentrations and ripples as determined in the laboratory, could be over-emphasising the role of the ripple profile in suspension of sediment in the field.
Some typical resuli·s ob1·ained from laboratory experiments are given below in Fig 2. 11 and 2. 12, where the concentration is plotted against the parameters (d - y)/y and y/d respectively, on a log-log plot.
. ' . ·~:: ·_,_:

d-y y
x_ h
x_ h
27.
10
1, 0
0 q
0, 1 ~~-_L_. 1 I I ___J_-~~_i_J____ _ ___._ _ _
10 100 1000 Concentration in ppm.
Fig ure U]_ From Reference (29)
1 ;oo " x=2,4m " x=2,7m x=3, lm
0, 10
\ 0,01 - -
1'03 , ___ __.__ __ ___,
103
1, 00 -x=3,4m o x=3 lm
0 ' x=4,0
0, 10 0
0
0,01 l.__~--J I .J_
103 103
Mean Concentration (ppm)
Fi gure 2. 12: Vertical Distributions of Mean Conce ntration, C, From Reference (8)

28.
2J Conclusions
No satisfactory method has as ye t been developed for the determination of the distribution of suspended sediment concentrations in the surf and nearshore zones. The direct type of pum p sampler appears to be the most feasible sampler for adaption to this application because of the simplicity of the data acquisition and analysis. Indire ct samplei·s have been tested in this application, but with little success, as the laboratory conditions under which the calibration is performed are not entirely re presen tative of those. existing in the field.
The use of instantaneous type trap samplers should be avoided because of the low concentratio ns and hence small size of sample obtained, and because of the difficulties of obtaining an average concentration reading from several instantaneous results. As concluded by Crickmore and Aked (20), the sampling duration should be at least 60 seconds for an acceptably low coeffici en t of variation of the res u lts. Further, samplers which rely on fixed structu res such as piers and lowers, or boats, for operation should be avoided, as sampling from either the pier or boat is impossible within the. breaker zone under moderate wave conditions.
The importance of sampling at stream velocity using pump samplers appears to have been overemphasise d by research in sampling in uni directiondl flows. Both Watts (12) and Crickmore a nd Aked (20) indicate that the orientation of the intake nozzle and the velocity ratio between the intake velocity and the oscillatory orbital velocity wil l result in concentrations being measured to within 15 percent of the true concentration.
' j , '
4.5
r
4.7 p 4. Filter

29.
CHAPTER THREE
Theoretical Considerations
In the practical application of be d, suspended and total sediment load transport formulae which have been derive d theoretica lly, the transport rate is given as the product of the sed iment concentration and velocity distributions integrated over the depth considered. Expressions for the velocity distribution have been derived by severa I au tho rs , for ex amp le, Swart (32). Expressions for the suspended sediment distribution in both the upper and be d reg ions of flow have been derived, but are expressed in terms of the sedimen t co ncentration at a particular reference leve l. In o rder to evaluate the tra nspo rt rate e quations, this reference concentration ml)s t be determined empirically from data collected in the laboratory and field.
The choice of the refe rence level is arbitra ry. Howe ver , it will be de fined in this dissertation as the theoretical interface between the be d and upper layers of flow. The thickness of th e be d layer is ra lher arbitrary in i1 se lf, as it is assumed to be the region in which the transporte d se diment transm its its weight directly to the unmovi ng bed, i. e . by slid ing or rolling motion. The upper region is defined as that where the tra nsported se diment transmits its weight entirely to the surrounding fluid. A trans ition laye r of finite thickness exists between these two l"ypes of sed imen l motion, but for si mp lification of the mathematical model, it is assumed that the transition occurs at a definite leve l, this level be ing defined as the refe rence le vel. The co ncentration of suspe nded sediment at this reference level is thus common to both re gions, and once determined, the sediment distributions in both regions can be evaluated.
In order to determine the position of this reference le vel, the form of the expressions for the distribution of suspe nded sediment concen trations must be theoretically determined. In the determination of J·hese theoretical expressions, a study of the bed shear stresses that ex ist unde r oscillatory wave motion and the type of boundary layer enco.:irrered, must be made. No new theoretica l expression wi II be developed below, but those deve loped by va rious investigators wi 11 be presented so that a procedure for the ca lcu lotion of the reference concentration, can be established.
3. 1 Bed Shear Stress Considerations
Expressions for the distribution of suspe nd~ d sedimen t c oncentrations under osci I latory wave motion have not as yet been derive d in terms of the parameters describing the oscillatory motion alo ne . Howeve r, express ions fo r th is distribution derived for unidirectional steady-state flow in two dimensions have been adapted for use in oscillatory wave motion by determ ining 1-he various constants empirically. Although these ex pressions have be en found to describe the distribution reasonably we ll, the basic differences between oscillatory motion and unidirectional flow must not be forgotten.

30.
The ma jor diffe rences be twee n the se two types of water motion with regard to sed ime nt tra nsport, a re the shea r s tresses e xe rted by the fluid on a fi xed
boundary and the res ulting boun dary layer. Unidi 1·ec t io na l steady state flow is ke pt i n e quilibrium by th e ex istence of be d shear stresses and may be considere d as a type of boundary laye r flow in i ts e ntire ty. The flow parame te rs can th us be de fi ned en tirely a s functions of the be d shea r stress and bo unda ry roug hness. O sei I lato ry mot io n , ho we ver, is defined as the motion resulti ng from a n exchange of pote nti a l and kinetic e nergy in the wate r mass, a nd the flow pa ra me ters are de fined in e ne rgy te rms ra ther than equilibrium force te rms. Be d shear stres~may exi st un de r oscillatory wave mo t ion in shallow water, but are ca used by the introduction of a constraint on th e mo tion, such as ze ro oscillatory wa ve velocity at a boundary. Th ese be d shear stresses are thus determin e d by the thickness and type of boundary layer ex isting at a par t icular point and ma y vary conside rably in re la t ion to th e depth in \¥hi ch the osc i Ila tory flows tak e p lace. The desc ription of the bed shear stresses a nd bo undary la ye r is thus de penda nt on the form of the wave motion ct nd cannot be use d to de fi ne the water motion as is possib le in unidirec t ional stea dy state flow.
The pri ncipal pa ra me te r used in describing a ny sedime n t motion in unidire ctional steady state flow has been th e be d shear stress, a s i-his para me ter is easy to e valuate by conside ring overn ll e quilibrium of a body of water. As expressions using this parame ter have bee n a dapted for use unde r osci ll a i·ory wave motion, an expre ssio n fo r the be d shea r stress unde r wa ve motio n is sought. It is, howe ve r, diffic u lt to eval uate a s equilibrium equations a s use d in uni di re ctiona I flows cannot be app lied with an y success i n e valuating this parame ter . The shea r stress can, howe ver , be e x pressed in te rms of the ene rgy diss i potion within the wave mo tion. This d iss1ipa t ion co uld be e valuated by measu ring the diffe rence in wave height be twe e n two sections. However, th e orde r of mag nitude of this e ne rgy diss ipa tion is gene rally ve ry small compa red to that of th e total wave he ight, and th e diffe renc e in wave he ig hr is us ually
negli g ible . Expressions for the bed shear stress are there for e soug ht in te rms of the ve locity di st ribution near the bed. The shear st ress in a Fluid is defin e d in classical hydraulics a s the sum of the viscous and turbule nt shears, which in turn are describe d in terms of th e velocity di str ibu tion:
't = 't + "G v t
. JJ. du + du 2
= ~12 dy dy
Wi th a knowledge of the veloc ity di stribution and Prand tl's "mixing le ngth", I, the shea r stress wo u ld th ere for e be a ble to be e valuated. Howe ver , the actual velocity distributio n at a mo bi le be d under wave adion is excee di ng ly complex a nd is th us unknown as yet. Seve ra I in vest iga tors have de veloped expressions for th e shear stress at the boundary unde r osci I la tory wa ve motion. Two of th e se a pproache s wi 11 be studied a nd used in the evalua tion 'of the re feren ce conce ntration.
(3. 1)

31.
Yalin (33) defined the shear stress at the bed, "to, resulting from oscillatory wave motion as :
where
't 0 = d ~ u 2
S = thickness of boundary layer S = slope of the free surface
o<. and f3 are coeffi cients.
The above expression was simpl:fied by putting
U 6 = (US ) max a nd S = 0
•.•.•••...•.•••. (3. 2)
For a rough turbulent boundary la yer, Yalin determined a value for 0
resulti ng in the expression taking the form :
':'( 0 =
{2 , 5 In 30, 1 s ]2 Ks
............. (3. 3)
For laminar boundary laye r cond i tions, the values of <X and f3> are given as
o{, = L
(cons tant) 1 -u s & v
f3 =
Th us with a knowledge of the thi c kness of the boundary layer, b, and the sand roughness, Ks, the ave rage bed shear stress can be evaluated.
Yalin determined an expression fo r the rough turbulent boundary layer thickness ~ , in terms of the amplitude of the orbital motion at a dis tance 6 above the
bed, and the roughness :
~ = constant (as) 0,75 Ks0,25 .•.........•... (3. 4)
An expression was also develope d for the laminar boundary layer thickness :
~ = (consta nt) 1 )TT ..•..•.•.•..•.• (3 0 5)
where T is the wave period. The constant was evo luated by Si Ivester (15) as 2 /rr Laminary bounda ry layer conditions generally occur under long period waves such as tidal cycles , tsunamis and storm surges, and only occur in deeper water of the nearshore environment.
An a lterna ti ve approach is .proposed by Bi jker ( 10). The bed shear stress under the combined wave and current a ction is .evaluated in terms of the bed shear stress of the current alone :

where
32.
't WC
I ( r; U max / J = I 1 + v · tc L 2 .
(U max) v
= =
maximum orbita l velocity at the bed
current ve locity
(3. 6)
~ = coefficien t given in terms of the Chezy roughness coefficient,(, = 0,0575 c ............. (3.7)
T c = bed shear stress due to th e c urrent a lone = ~ g v
2/c2 ............. (3.8)
Swar t (32) evaluates th e Chezy roughness coe fficient in i·erms of the depth of water and the hydra ulic be d roughness, r :
where
C = 18 log ( 12
d) r
r
6. r A r
=
= =
25 Li r (_A!_) >. r
ripple he ight ripp le length
...•....•.•.. (3. 9)
.•....•...... (3 . 10)
The eva lua t io n of Li rand /ir is complex and is given in reference (32) by Swa rt.
Alternatively, the Chezy roughness coefficient is given in terms of the Manning Coefficient, n , in classical hydraulics as :
c = ............. (3. 11)
assuming the hydraulic radius is equal to the depth for two-dimensional flow.
Bijker (10), however, simplified the expression for the hydraulic bed roughness,..,.L assum~this to be 1,6 times the he ight of the ripp les . The r ipp le dimensions are re lati ve ly easy to meas ure in the laboratory, toge ther v·ith the current veloc ity, bu t are under most circumstan ces diffi cult to measure in the field. If no cu rrent velo citi es have been measured , an estimate of the current at the bed can be ma de using the mass transport formula as given in refere nces (15) , (34) and (35) as :
5 0 TT 2 H2 = ' 2
4TL sin h ( 2 ~ d,) .............. (3. 12)
The accuracy of eva luat ing the shear stresses due to wave and , . · · ,: · .,.._,, currents using this method proposed by Bijker,. is thus highly depende nt on the accuracy of me asurement o f current ve locities at the bed, wh ich is difficult in prototype conditi o ns .

33.
Using formula (3.6) to eval~ate the shear stresses, it can be seen that an under-est imation of the current velocity wi II produce large values of shear
stress, which does not conform to that experienced in practice . In the limiting case, if the current velo city is zero, the expression becomes
mea nin g less. Hence this express ion can only be true between certain limits, but th ese are not evaluate d by Bij ke r (10) or Swart (32). When calcula t ing the shear stress using !"his formula, this lower li mit must be
kept in mind.
3. 2 ·. Bou ndary · Lay~r
The type of bou ndary layer has bee n disting uished by using a critical Reynolds num ber . Einstein (36) conducted experiments using an oscillatory tray in still waler to determine the form and values of this critical Reynolds number. For th ree dimensional roughness, the transition betwe en laminar and turbulent boun da ry layer conditions was found to be g iven by:
Re = = 104 a
for r < 1630 s
.......... (3. 13)
Si Ivester (15) quotes another form of Reynolds numbe r to determine th e transition between turbulent a nd laminar co nditions. This value is given as :
Re = ( u mcix b v = 1000 ...•...... (3 . 14)
It thus appears that two conflicti ng definitions of the critical Reynolds number exist. The form of the express ion as developed by Einstein, in volves parameters which are easi ly calculate d from wave theory, whereas those quoted by Silvester, i nclude the thickne ss of the bou ndary layer. This value canno t be calculated with any degree o f confide nce , and as th e values obtai ned by Einste in are backed by ex te ns ive laboratory work, this form of the ex pression wi II be used to determine the type of boundary la yer present.
3. 3 The Distribution of Suspended Sediment Concentrations
Yalin (37) has iden tified the two basic approaches to the derivation of expressions for th e d istribut ion of suspended sediment concentrations, namely the d iffusion and gravitational theories.
In the diffusion theory, the volumes of two fluid lumps, one moving upward and the other moving downward through a particular le vel, each a dis tance , 1 ,
apart, a re equated. The distan ce, I, is equal to the mixing length as defined by Pra ndtl. The volumes ore the n expressed in terms of we ights of solids contai ne d within the f luid lumps, and subsequently expresse.d in terms of concentrations. The diffe rential equation for the distribution of suspended sediment is thus determined :

34.
de + 0 a * c = dy
•••..•.•..... . (3. 15)
where 2w
a * = 1;'7; (3.16)
where/)/ is the vertical ve loci ty of the turbulent eddy diameter, This expression can be integrate d if the shear stress and ve locity distributions are known. If the shear . stress distr ibution is assumed lin ear and the velocity distribution assumed logar i1h mi c, and the e ddy diffusion to vary quadratically with elevat ion above th_e bed , then:
............. (3. 17)
where e1 = ............. (3.18)
If the eddy diffusion is assumed to vary li nearl y with e leva tion above the bed the n the differential equation resolves to :
(3. 19)
where bl = w Ya ......... . ... (3.20)
c. Yo
La boratory results by Ke nned y a nd Loche r (8) ore given in Chapter 2 an d a re seen to conform to both solutions. Kenn e dy and Locher cone lude d that virtually any estimate of the eddy diffusion couid be used and a wo rkable theory would be obtaine ::I. Neither o f these theories cou ld there fore be rejected by the lack of conformi ty to expe ri menta l resull-s . A di scontinuity was noted when fl = 0, 05, cind this \Cl lue cou Id be an es timate of the upper boundary of 1·he bed layer . Yalin (37) also observed this discontinuity at the same relative depth in unidirectional steady state flows.
Swart (32) compared these expressions with fi e ld and laborato ry results and concluded that equation (3. 19) fitted the expe rimenta l data best. A value for bl was determined empirically:
=
Flemi ng and Hunt (38) and (39) derived an express ion for the suspended sediment distribution abo ve the bed layer as :
(3. 21)
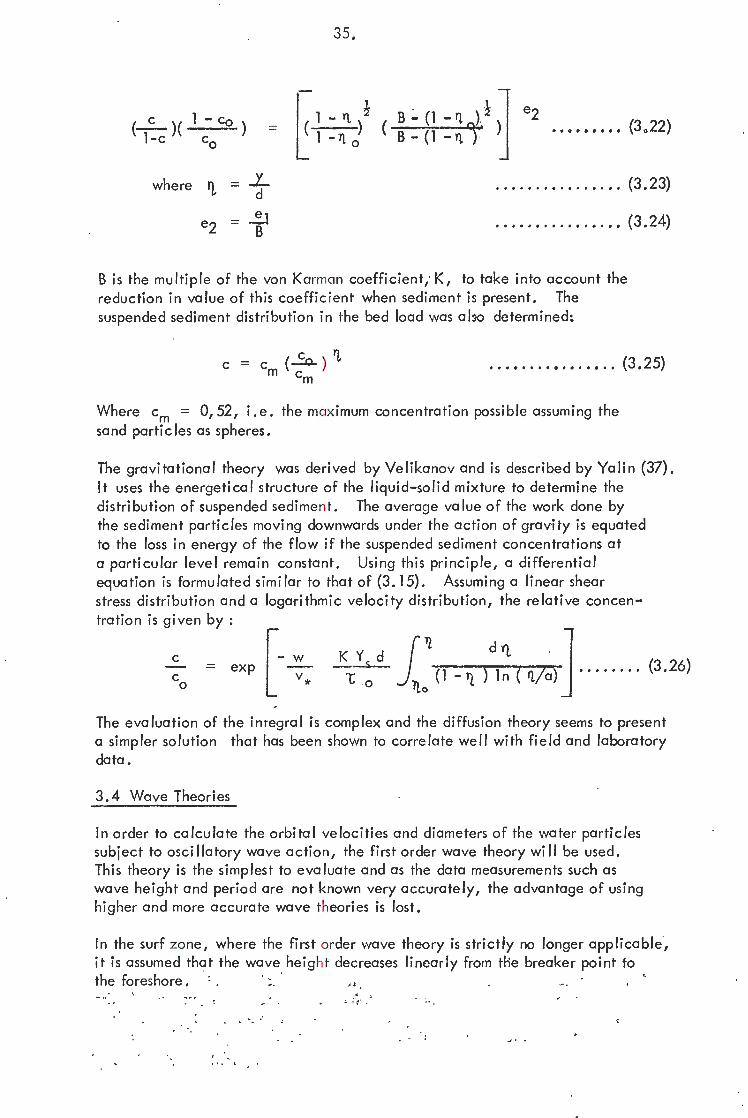
35.
I
~ I } J e2 (-c- )( 1 - Co l - 11 ~- B - ( 1 : rt, 0)~ )
• • o ...... (3o22) = - -- ) ( 1-c l - 71 0 B-(1-l'l) co
where rt = ..L .......... ...... d
e2 = __!] t t t t t • I t I t • t t • t •
B
Bis the multiple of the von Karman coefficient, I<, to take into account the reduction in value of this coeffici ent when sedime nt is present. The suspended sediment di s1Tibution in ihe bed load was abo dele rmined;
(3.23)
(3.24)
...•....•.•..•.. (3.25)
Where cm = 0,52, i.e. the maximum concentration possible assuming the sand particles as spheres.
The gravitational theory was derived by Velikanov and is desc ribed by Yalin (37). It uses th e energetical structure of the liquid-so lid mixture to determine the distribution of suspende d sediment. The average value of the work done by the sediment pa rticl es moving downwards under th e action of gravity is equated to the loss in energy of the flow if the suspende d se diment concen tratio ns at a particular level remain constant. Using thi s pr inciple, a di ffe rential equation is formulated similar to that of (3.15). Assuming a linear shear stress distribution and a logarithmic ve locity distribution, the re lative concen-tration is given by:
= exp [
- .:!!.._ v*
KYd112 dfl ·l ""i: : 7lo (1 -11 ) ln (rt/a) J ........ (3.26)
The evaluation of the in tegral is complex and the diffusion theory seems to present a simpler solution that has been shown to corre late well with fi e ld and labora tory data.
3. 4 Wave Theories
In order to calculate the orbital velocities and diameters of the water particles subject to oscillatory wave action, the first order wave theory wi 11 be used. This theory is the simpl es t to evaluate and as the data measurements such as wave height and period a re not known very accurately, the ad vantage of using higher and more accu ra te wave theories is lost.
In the surf zone, where the firs t o rde r wave theo ry is strictiy no longe r applicable, it is assume d that the wave heig ht dec reases li nearly from the breaker poi nt to the foreshore. . _, .

36.
First order wave theo ry will be used to calcula te ve locities and orbit diame ters, but in order to take into account the unsymme trical profile of the waves, the values will be multipli e d by a correction factor of 2ac/H, where ac is the amplitude under the crest at the breaker point as de termined by cnoidal wave theory. A graph is given tabulating ac/H, in Fig 3. 1, and is obtaine d from re ference (15). Value of the functions used in first order wave theory are obtained using tables given in reference (40).
d/l
0 .8 5
0 .8 0
0 .5 5
0003
Figure 3. 1
0.7~
0 .70
~ ~ - H
,_,_....__.__.__, 0.6&
-+-.i.++-H·-+--i 0.1
-'--+-'---' O.OtS
O.OQ<\
0.003
I 0.001 03 o ~ o ~ 0 .1 1.0
Graph of aJH versus r~· : 0

37.
CHAPTER FOUR
Des ign and Construct ion of Samp lin~ Eg uipme nt
4. 1 Des ign C riteria
Two main des ign cr iteria must be fu lfilled whe n consider ing the design of the samp ling system. The first is th a t the type of instrumentat ion to be used must o bta in a representat ive sample at a given po int. The second is that the operation of placing the ins trum e nt at the des ire d posit ion must not risk the safety of personnel and must be a s e conomical as possibl e .
Purnp type sample rs we re chose n to be used in this appli cation so that a direc t read ing o f sediment conce ntrat ion was obta ined. In itial invest iga tions by the CERU, Departmen t of Ci vi I Eng ineer ing , Unive rsity of Cape Town (17) showed the short fa ll of obtai n ing sma ll sampl e vo lumes. A large r sample volume, of the order of 100 li tre s, was chose n. If th e concentrati on sampled was 100 ppm , the n th e resulti ng sed ime nt mass would be 10 grammes, which is suffic ien tly large enough for s ieve and sett li ng-tube grad ing analyses. In o rder to re duce the physica l size of the sampl e r, filt rati on is necessa ry to separate the sedimen t from the water , th e wate r be ing returned to the sea via a vo lumetr ic me ter . The samp ling pe riod must be longer than 60 seconds, as shown by C rick more and 16..k e d (20), to obtain a sampl e wi th an acceptable coeffici en t of variation. The system use d obtaine d a sample over a period of 15 to 30 wa ve passes, i.e. of 3 to 5 minutes duration, wh ich is deemed suffici en tly long enoug h to o bta in the average conce ntration.
As the units used were relative ly small compared with th e overall de pth of water , the distu rbance of flo w patterns is a ssume d nor to affect the read ings. The au thor's observat io ns fro m he licopters of horizontal edd ies occurri ng in the surf zone, indicate that thi s turbulence is far greate r than tha t caused by the inf luence of J-he sampler,
The indirect type of samp ler was rejected as the sedi men t characteristics and water qua lity are unknown para me te rs. These parameters must be known fo r successfu l calibration of th e ind irect samp lers. The author o bserved red tide , a type of plankton, o n several occasions in the sampling area whi 1st di vi ng at the sea towe r. This red tide would a ffect the read ings of an indire ct type of sampler considerably a nd it cannot be assumed tha t marine o rganisms su ch as red tide are not prese nt at lowe r leve ls if they are not visible at the surface . In addition the ind ire ct type of sampler is unab le to determ ine . the type and grad ing of the sed ime nt presen t.
The samp li ng unit must be a ble to operate and be placed under high wave conditions in the surf zone. A bo the system must be fl exi ble, in that sampling can ta ke place along various profile s of the beach. These criteria rule out the use of a fixed pie r or boat.
·.
;-

38.
Two syste ms are proposed, one mak ing use of a he Ii copter to place and retrieve the sampler, the other using a more com p licate d sampler, which is floated into position, sunk and refloate~ afl-er sampling . The sample rs used in both these systems must therefore be se lf-co ntained and sufficiently robust to withstand large dynamic forc es caused by the oscillatory water motion.
A portable power source is thus needed to be contained within the samp ler for pumping water through th e fi lter. A choice betwee n pneumatic and electrical powe r sources is availa ble. Pneumatic powe r was chosen be cause of the susceptibility of e le ctrical power being shorted out in damp co ndit,ions existing inside the sampler during sampling. In addition, the electrical powe r source is normally a lea d-acid accumulator, which could be damaged in the rough conditions under . which it must operate and is susce pHble to spillage if the sampler is inve rted. Alte rnative non-spi II recha rgeab le accumulators with the same sto ra ge capacity as the lead- acid accumulator are e xpensive and difficult to obtain, as the author di scovered when investigat ing th e pu rc hase of o n electrical powe r source for the control syste m of the Mark II sample r. The pneumatic powe r 5ource used was a 7 litre compressed air bottle with a working pressure of 20 MPa , commonly us e d for underwate r breathing apparatus.
4.2 Design of the Mark I Sam p ler
This unit was designed as a protolype to be used in conjunction with a helicopter . The unit is attached to the aircraft by means of a ca ble, and lowered onto the sea bed. It must therefore be self-triggering and stable during sannpling. Fig 4. 1 shows an elevatio n of the instrument. The unit is desig ned for a rapi d replenishment of filte rs and air cylinders to reduce the sampling cycle pe riod to a minimum .
The water circuit consisted of brass intake pipes of 15 mm diameter which cou Id be interchanged so that the sample cou Id be drawn off at different ele va tions above the sea bed. The intake no zzles are ;;ositioned at 0,3 metres , 0,6 metres, 1,0 me tres and 1,5 metres above the se a be d, projecting 0,5 metres from the body of the samp le r. The sample ·is pumpe d by a fibreglass pump, Mar ino type FP - 2, through a Kent water meter ab le to read to the nearest litre. The sample then passes through a non-return valve and into th e filter, a Thomas Tu be type with a terylene filter cloth held in position by means of a jet tube and rubber bu ngs. This filter is commonl y use d in the fi ltratio n of water for drinking purposes and the minimum size of solids retaine d on the filter was found to be approximately 0,030 to0,040mm in diame le r. It is easily inter-changeable wilhout any loss of sediment . The water is then discha rged back to the sea via the outlet of the filter.
The average f low through the instrument was meas ure d to.be 0,56 dm 3/s with an intake velocity of 2, 4 metres per second.

: ! L ! -
i I ~ : ~
i .
~
:;
i
>
~
~I "'' z ' .. O:I ;1
&'.
~
·r .. , ..
·r: ;;-u;.
j
ei
I
i a -I
i ~ I
I .
ti
~ ! i l 1r J
I
t "' ~
i ;. •• i : '1 i i ~
•
l ~ i:J i
~
I i i ..
" I ~ i
" 0
t I ;
f
0 ~
h .. .. i .. .. s & ;t
" g .. > ~ .. !:! .,.
i I
! ~ ~ I ~

40.
The largest piping used in the instrument is 25 mm in diameter, g1v1ng an internal pumping velociJ-y of 1, 1 metres per seco nd, This veloc ity is greater than the minimum velocity required to prevent settlement of sediment in the instruments, as de termined by Crickmore and Aked (20).
The pump is coupled on a common shaft to an air motor, a Desoutter type SRM 3000 , of maximum output 350 watts. The motor is powered by compressed air from the 7 litre, 20 MPa air cylinder. The air passes through an air regulator to re duce the press ure to 700 kPa, then through a Parker Hannifin oil d rip to introduce a small amount of oil in~o the air to provide lubricatio n of the fins in the air motor, and to prevent corrosion. The air is ex pelled into the sea via a non-return valve on the opposite side of the sampler to the water intake.
The sampling eye le is triggered by a float rising in the lower compartment with the inflow of water through holes in the compartment. This float activates a quick release Saunde rs type A valve in the airline and operates · the motor.
The components ore housed in a modified PVC pipe of 300 mm diameter with two ports covere d with perspex as face plates. 0 ne port is opposite the water meter, so tha t this instrument can be read without opening the sample r, the other port gi ves access to rese t the air valve and air regulator. The float c hamber in the bottom compartme nt is drained by a drain cock. The overall height of the instrument is approximately 1, 4 metres.
A weighted base of 40 mm thick steel is attached by long, threaded bolts to the unit. Lifting hooks ore provided at the top of these bolts. Horizonta I stabilizing legs are screw~d into the base to prevent over-turning during sampling. ·
The dry weight of the assembled sampler on 1·he beach ready for Ii ft-off is 185 kg. The submerged wei ght is 77 kg, with a maximum lift-out weight of 250 kg if filled complete!y with water. The lifting system must therefore be designed for this maxi mum weight. The maxi mum operating depth is estimated to be 20 metres of water. P!ate 4. 1 shows the unit fully assembled on the beach ready for lift-off.
A simple ti It indication was developed to determine whether the sampler had been overturned du:-i ng sampli ng. This consisted of two perspex tubes, the smaller one placed inside the larger. The larger was closed with a rubber stopper to prevent any water entering the tube, and the smaller was partially filled with a red liquid. If tilting occurred, the liquid in the inner tube would f low out and collect in the oui er tube. This could easily be ide ntified when changing the fil te rs ·on the beach. The tube could be d:·ained and refilled for immediate re-use. The tilt indicator is shown in Plate 4.2.

p 4. l:
Plete 4.4 Plate4.3

41.
Landon (41) conducte d perfo rma nce tests on various components of the sampling unit unde r supervision of the au thor. The head-discharge curves obtcli ned for the marine pump are given in Fig 4.2 together with the manufacturer's head-discharge curves. The speed of the motor and pump was found to be approximately 2000 rpm under working conditions. A pumping efficiency of approx imately 53% was determine d, which is fairly low, but as the pump was one for the few fibreglass models available, it was used with a slight sacrifice in efficiency. A shape factor of 0,23 was determined for the pump. The manufacturer's torque and power curves for the Desoutter air motor are given in Fig 4.3.
Tests to determi ne the head loss in the filter and water meter were also co nducted by Landon. The hea d loss in each of these components are expressed in terms of the value of K, and are given be low
h = KQ2 For the filter, K = 0, 47 x 103 s2 m -5
and For the water met·er K = 3, 14 x 103 s2 m -5
The graphs for head loss versus flow through the filter and meter ore given in Fig 4. 4 and 4. 5. The water meter was found to be over read by 2<jo.
The Mark I sampler describe d a bo ve was basically an experimental proto-type. The components within the sampler were matched together on manufacturer's specification rather than designed. Design weaknesses became apparent during the fi e ld operations, and the sampler was modified slightly to overcome these weaknesses. The sealing of the top cover of the PVC body proved to be difficult because of the distortion of the cover by the clamps. As the components were not affected by slight leakage, no atte mpt was made to seal this cover completely. The components did suffer from corrosion problems, however, and the bearings in both the pump and motor had to be renewed. The air regulator suffered from corrosion and also had to be renewed after failure during a sampling operation. In addition, the sampler was overturned in high wave conditions and an extra weight was fitted onto the base as well as addi tional stabilizing legs. This subsequently oppeared to work satisfactorily except under extreme ly high wave conditions in the breaker zone. When the instrument was overturned, the complete system was completely clogged with sand as the pump continued to run, requiring a complete overhaul to unblock the pipes. Modifications to prevent the pump from running when overturned, were adopted into the design of the Mark 11 sampler.
4. 3 _!2.: sign of the Mark 11 Sampler
The sampler was desig ned to fl oat out from the ,beach on 'an endless rope system, sink at the desired position, reffoat after sampling and be pulled back to the beach by the rope.

-E --0 0 CV
:r: 0 ...... 0 .._
-0 .4) a..
10
5
0
500
400
42.
-~rprn - -I .
1, 0 Flow (dm3/s)
Figure 4.2 : Head Discharge curves for Morino Pump
0 300 --- - ---~--CV > CV
-0
3: 200
Figure 4. 3
2400 2200 Speed (rpm)
18 0
Power Curves for Desoutter air motor
-- ·quoted
-- - experimental
2,0

43.
0,5
0,4 -. E ........ .,,
0,3 .,, ..9 ""C 0 ell 0,2 :::I:
0, 1
0,2 0,3 0,4 0,6 0,8 1,0 Flow (dm3/s)
Figure 4. 4 Head Loss versus Flow through Fi I ter
0,8
·1
0,7
0,6 I l -. E ........ .,, 0,5 .,,
..9 ""C
0,4 0 4'
__] ____ - . . :::I:
0,3
0,2
- -- -1----L-1--· -,
I : I I : I I ' :
0, l I I
; 0 I I
0, l 0,2 0,3 0,4 0,6 0,8 1,0 Flow (dm3/s)
Fig ure 4.5 : Head Loss versus Flow through water meter

44.
The design requi1·emen ts called for a robust, woter-tight unit, capable of sinking and refloating using an internal coritrol system, and fitted with some form of traction unit to enable the sam pler to be pulled up or down the foreshore into the water.
A steel casing was chosen in place of the PVC type as used in sampler Mark I. Steel has the advantage that joints and pipes passing through the casing can be welded to obtain water-tightness, and a circular steel cylinder is robust be cause of its shape. Flanges and "O" rir.gs are used to seal joints not we lded. The corrosion of steel in the sea water was not viewed as a serious problem, as the casing could be inspected and and repaired afte r each field trip. One of the difficulties experienced with the Mark I sampler was the inaccessibility of the com ponents when assembled in the PVC pipe. Access was only available from the top, and fitting and overhauling compone nts was difficu It. Consequently the concept used in the Mark II sam ple r was that of the cop cover fitting over all the components which are rr.ounted on platforms supported by three threaded rods welded to the lowe r pi ate of the instrument chamber. Fig 4.6 and plates · 4. 3 and 4. 4 show an elevation o f the Mark II sampler. Al I pipes entering and leaving the instrumen~ chamber did so below the top cover so that this cover could be lifte d off in order to gain easy access to components.
A ballast tank was fitted on to the bottom of the instrument chamber. The inlet and outle t valves were situated in the i ns trume ~t· chamber and were connec ted to the ballast chambe r vi a the common s tee I plate. During sampling, the sampler may be toppled on its side. Using a conventional ballast tank, similar to the saddle tanks of submarines which are open at th e bo ttom and have control valves at the top, the air blown into the tank to ex pe II the wate r wou Id escape through the bottom, and th us the sampler wou Id not re float. Various configur9tions of va Ives were tri e d ro eliminate this proble m, but all we re unsuccessful. A rubber diaphragm, made of 3mm thick red rubber was eve ntually used. When inflated in any orientation, the diaphragm would expa nd and expel! the water from the tank, and assume the sha pe of the tank when fully inflated. A separate 7 litre 20 rnPo compressed air cylinder was used for inflating the diaphragm. The pressu re was reduced to 150 kPa using an Afrox M70-0 G regulator. /:>, safety va Ive was fitted to the tank to prevent over-infla t io n . Similarly, as the instrument compartmen ·r con ta ined high pressure compresse d ai~ cylinders, a safe ty valve was fitted to preven t rupture if the internal pressure rose too hi gh , caused by a leak in the air hose. Plate 4.5 shows the di a phragm in the ballast tank befo re assembly o f ihe sampler.
As the control system was ele ctrically controlled an d thus subject to shorting by moisture and failure, ex te rnal control valves were fitted to 1-he side of th e sampler, so that in the case o f comple te electrical failurP. during sampling, the sampler cou Id be ref!oated by manua I operation of the vi:l Ives by a diver.

' ' 1 • • l . i ... . _.,
.... .. ... \ •• ,, ... •.1. ·, .. ... u: - ~ - • • "'"' 1 .... l• )
c l'Qllol'I TS. "'o v r.T 1t. c; •UCa r• s , t L f C " .. IC#I L
• 1•r t At.0 " ' "' NOtfS l t ,\••90•f l
E lPOSED fl£VATION
SU SPUIDED Sf~NT SAM Pl.EA M• J
Fi JUN 4.6 E
45.
----- Sf[[l PLAfl '99® IT
, ,.• l"• •.U • 1Jl., S"lll c. .. a ... •t !t
. S TI H .. , ,. :; io[ A.. '" · Jlf
... '
/!t oOIJTf . .. D 1•Ml T[h ( ,....,)
10111 .. 1tlo o~ .. [ f f.lo t "'"''
.. T o l"[ l (; otT ( .,,., J
T . . .. IC •ht"Ssc ..... 1
UNIVERSITY OF CAPE TOWN Of llUl'IMENT OF C !Vil ENGllEEAING
:i f fvl . .-k II SutPeMled
ST[ U TU I[ 5HJ1ll. O~.r!T .....i.l
SOlE,,.OIC. \'A LV((SAlllJ'\.U•(.J 1..UC ll'U• T1SA'.:1
·ment
}.( &\ 51 •
E E
18
E E ~ ..

te 4.9 "· 10 d Air
p te4.11

46.
These valves were fitted with an easily removab le co ver to prevent damage. Plate 4.6 shows the arrangement of these valves and the safety valves.
A tracked unit consisting of stee l tubes covered with a continuous rubber belt was originally used as the t raction unit. Howe ve r, after fi e ld tests .on !·his crawler, it was found to bury itself into the sand by the sand piling up in front of the unit. An alternative traction unit was designed using inflatable tyres and was tested with reasonable success an the beach.
The components used for the basic pump sampler unit are identical to those used in the Mark I sampler . As no basic mo~lification was needed on the design of the sampling system after field le sts, it was decided to use the same components so that the y could be in te rc ha ngeable be tween units, and components such as a ir c y linde rs and filte rs we re common to both units. Slight modifications in i·he design were however unde rtaken.
In order to keep the head loss to a minimum, but still main tain the required minimum pumping veloc i ty in the pipes, 25 mm copper pipes were used throughout the system. Copper was used, as corrosion was found to occur in the galvanised steel pipes of the Mark I sampler. The pump motor unit and meter unit we re mounted a s low as poss ible to prime the pump, and the filter was placed inside the instrument chamber instead of outside as in the Mark I sampler, to pre ve nt damage. Plates 4.7 and 4.8 show the positioning of these components in the instrument compartment.
The centres of gravity and buoyancy we re calculated in order to establish the stability of the sampler before ma nufacture. To c1chieve the condition where toppling was minimised, the centre of gravity was kept as low as possible, such that it was below the centre of buoyancy, thus always resulting in a positive righting moment. The calcula ted and measured weights and centres of g ravity and buoyancy for both the tracke d and wheeled units are given in Table 4. 1
Table 4. 1
Wei ghts and Centres of Gravity for sa mpler Mark II
Dry Wt. Submerge d I Floating c.g.(mm ( K ~) Wt. ( t<g) Reserve F.loaHng S ..
c. b. (mm) J unk Floating Sunk
Wt. ( 1C 9)"
Trolley Unit:
I Calculated 364 71 40 345 . 3 1 1 460 535 Measured 387 72 22 -Wheeled Unit: Calculated 372 40 56 491 460 700 Measured 390 72 .22
I 410 -
The e.g. and c.b. are measured from the bottom of the sampler.

8
7
6
5
--E 4 ....__..
E I
3
2;'
47.
Landon ( 41) ca lcu lo-red the overa 11 friction head !osses in the pipes and compo nents in the Mark II sampler, unde r su pervision of the author. The head loss is expressed in va Jue of K in the fo rmula
h = K02
and is given in Table 4.2
Table 4.2
Friction Head Losses calculated in f\ . .\. a rk II Sameler
_Comeonent K ( s2 m -5) -
Pipes 0,62 x 10⁶
Inlet 1, 59 x 106
Outlet 0,20 x 10⁶
Bends l, l 0 x 106
Water Meter 3, 14 x 103
Filter 0,52 x 10³
TOTAL 3,51 x 10⁶
These values are plotted in Fig 4.7 and sur,erimposing the head discharge curves on this graph, an ex pected flow of 0, 9 dm3/s is obl'ained fo r a pump speed of 2000 rpm, which was measured in the laboratory. Flume tests revealed a sampling flow of 0,85 dm3/s.
- - --- z = 0, 5m
--1.... l, 0
Flow (l/s) 2,0
·~

48
External water pressu re acts on the sampler when it is at the sampling poi nt. An estimate of the critical external buckling press ure must th e refore be obtaine d for the siTuctural des ign of the sample r. Formulae by Timoshenko and Gere (42) a nd Baker e t a l (43) are used to estimate this buckling force. The values obtaine d using Timoshenko and Gere was 802 kPa, and using Baker et al, was 600 kPa. The stiffening of the f langes was not taken into account. If a factor of safe i· y of 4 is used, th e n the maximum ope rating de pth of the sampler is 15 metres, which is satisfactory as this is the outer limit of the nearshore zone.
4. 4 Co ntrol Equipme nt for Mark II Sampler
The sampler is requi red to sink a i· ~he desired position, sample, and refloat by remote control. It was thus necessary to deve lop a control system to carry out the various operations. These basic ope rations are given in a block diagram in Fig. 4.8
Input: Signal to Sink.
··--- l
[ ~pe~ sc-:; _ Close Sink ~j
NO Is Sampler Uprigh~ ___ Y_E_S ____ _ ~ r 0 pe~-Sa_m_,_p_I e-. _V_a_l_v_e.....,
[~~~m~ le Valve f-------·-__ _.I
_[ l__v;;-;::-1 L------5:4
1 Open Refloa t ~
Fig 4 . 8 Diag ram Showing Opera tions of Same_lin~
Solenoid valves are used as the bas ic control for sinking, sampling a nd refloat ing. These valves are opened and closed by relays in the control box. The initial signal to sink is given by a radio transmiHer on the shore. This signal is rece ived by a receiver in the control box and opens a solenoid va Ive to float the ba llast tank.

49.
This valve is a 19 mm ASCO normally closed valve. The sinki ng cycle is determined by a timer that is star ted the same time the valve opens . Sufficient time is allowed for the sinking cycle , and was determined in th e la bo ratory to be 3 minutes. Afte r this cycle is comple te, the sinking vaive c loses, and a limit swi tc h determines whether the sampler is upri ght or not. If upright, the solenoid valve in the samplin sJ ai r li ne is opened, and sampling comme nces. In addition, a timer is stor ted, which is calibrote d to a sampli ng time of 4 minutes. If at any stage during sam pling, the sampler is tilte d so that the limit switch closes, then the sampling valve is closed and the ref loa ting valve is opened. The refloating valve is also linked to a timer, and is closed afte r a period of 5 mi nutes. The limit switch is positione d vertically with a brass weight attached to th e pendulum a t the base of the switch. Inclination of the switch in any direc t ion will ca use the brass weight to move the pendulum and thus close the swit'ch.
The sampling solenoid valve is a Lucifer 6 mm impulse control vcdve. The rodio rece ive r is super rege nt, and thus able to pick up any signal on the 27 MHz band. However, a de la y timer is opera ted in the control box, to cut the receiver out unti I a certain ti me has r:dapsed and the sampler should be in position. After sampling, a relay switches the receiver off so that the sample r can not be acci dentally sunk again.
All the relays and controls are situa ted in the control box. Fig 4. 9 gives !he circuit diagram for the contro l system. The abbreviations used are as follows : .
B sv -RL T RX -L. s. -
BaHery Solenoid Valve Relay Timer Radio Re ceher Limit Switch
Three baHeries are used, namely a 3 volt battery for the radio receiver, a 12 volt batte ry to power the solenoid valves and a 24 volt ba ttery for the control syste m. It was decided to operate the solenoid valves and the control system on differe nt batteries as sudde n steps in voltage are caused by opening a nd closing of the valves. Initially, thyristers were used in place of relays in the control circuit to control the time cycles, but it was found that the thyristers were susceptible to sudde n current and voltage changes caused by the sole noid valves . Light emitting diodes are placed in para lle l with certain tirne cycles so that a r:heck ca n be made whe ther these ti me cycles are operating.
A simple clockwork switch, MT2, is used as a back-up in case th e control sequence fai Is. If sompling has not taken place within a certain time, it will automatically open the refloa t valve. This switch was· normally set to 60 minutes. Double wiring from the battery packs and solenoid valves to the control box also assis te d in pre venting control breakdown.

• Sl
fl_[ f2~ Bl f B2 ~
S\/l Sink
Rll
LED 1
R 1 2k
Tl ol
~
RL2
f 3 rll~
_l_'-RL3
i -1:3 A~
S2 L.S.
•
RL3
6 RL J
S~mple
0
RL l
Figure 4. 9 : Co ntrol C ircui t Diagram
0 RL8
I
~
55~: 6\
:o/ t 1Rr (
I
Re floa t
MT2
c..n 0

51.
To assi st easy remova I of th e con trol box fro m thP. sampler, a mu I ti-way plug was ins ta I led. This connects the control box 1·0 a jundion box in which the fus es for all three battery systems are located.
Plate s 4. 9 and 4. 10 and 4. 11 show the control box, junction box and solenoid valve s in the top of the instrum e nt chamber.
4. 5 Evaluation oflhe Forces due to Wave Action on Mark II Sampler
The Mark II sampl e r is designed to be pulled into position using a sea-anchor and e ndless rope powered by a winch on the beach. Fig 4. 10 shows the proposed layout of the system . In order to de sign the buoy, anchor, rope and winch, an es ti ma te of the to tal forces which can be expected on the samp le r must be ca lculated.
Design wave he ight conditions we re assumed to be a deep water height of 4 metres and a wave pe riod of 12 seconds. This is assumed to be the ma x imum wave height under which this sampler is to be used. For sam pling in hi gher wave he ig hts, it was proposed that the Mark I sampler is to be used. In order to evaluate the total forces on the sampler, the following assumptions are made :-
(a) The maxim um forces o n the sample r wi II occur in the breaker zone and just outside the breake r zone.
(b) The forces on the sample r will be e valuate d assuming the sampler to be stationa ry. This wo uld occur if the sampler
was be ing pulled out such that when the crest passed the unit, it was held stationary by the rope, and move d seaward with the orbital motion occurring in the trough of the wave.
(c) 1st order wave theory is u~ed. In the surf zone, however, the velocity of the breakers is greater than that of the orbital motion theore tically calculated. This can be . clearly indicate d a t the breake r point where the water in the cres t of the breaker is acce !era ted to the wove ce lerif-y, and hence the break ing process occurs. In order to e valuate some relative velocity between the breakers and the sampler, this velocity is a ss ume d to be equa l i·o three quarte rs of the wave celerity at breaking point. The accele ration is estima ted as the ave rage rate of change of velocity from zero to maximum in a period of one second.
(d) The total drag force o n the sampler is the sum of the velocity drag, Dv, and the acceleration drag, Da, as given by:
Dv = (~ ?) ) Ccl'x (frontal area)
Da = Cm M v

BUOY WITH
Approx . 8 metres
Approx . 800 metr~s
~ z 0
TENSIONED ROPE ;: u w '! 0
TRAILING ROPE
Figure · 4. 10
52.
.... z IU a: a:: :;)
u ..... <( a: 0 ... .... _,
ELEVATION
TRUCK WITH \'/ INCH
SEDIMENT SAMPLER MK. 2
PLAN
a: --}:> w ,,.: IU <( z IU 0
~N
..
BEACH
SH OR El INE <'{
Pr.oposed Operqtional System of Mark II Sampler

53.
The va lues for the coe fficients Cd and Cm are assumed to be :
Cd = l, 2 and Cm = 2, 0
(e ) A beach s lope of 1: 100 is assum e d.
The re le vant prope rti e s of the flow at the pos itions considere d in the design
are summar ised be low :
De ep water wa ve leng th , La = 225 m
Breaker height Hb - 4,9m Breake r de pth db = 7,2 m
Wove celerity at breaker po int Cb = 7, 8m/s Wave leng th at breaker po int Lb
Ou tside Surf
Orbital ve locity Umax 3 ,4m/s Orbi ta l accehroi"ion Umax l,8 m/s2 Dv 4,0kN Do l, l kN
= 103m
In Bre aker Zone
0,75 x 7,8 = 5,8 m/s 5,8m/s2 11, 6 kN 3, 6k N
The veloci ty and acce leration drog forces a re added vectorially and a re plotted in Fi g 4 . 11. The drag forces in the break e r zone occur simultaneously and may thus be added. These force s, however, are of very short duration , as the y a re assu med on ly to occur unde r the p lu nge point of the breaker.
The design forces acting on the sa mpler are thus :
Outside breake r zone : Under plunge point
Dt = 4kN Dt = 15kN
4.6 De si g n of the Sea Anchor and Buoy
The des ign and construction o f the sea anchor and buoy was carri ed out by Ande rson (44) unde r the supe rv isio n of the author .
The Mark II samp le r is designe d to operate in cond i tions of 2 to 3 me tre wave he ig ht, w ith a max imum of 4 me tres . Unde r these normal condi tions , the outer limit of the nearshore regi o n in wh ich the suspension of se dim e nt is of inte rest, is approx imate ly 800 me tres offsho re. It was thus de cided to posi tio n the buo y a nd sea a ncho r at this distance from the beach o The water depth a t this position was esti ma te d to be 9 metres.
The buoy was designe d to withsta nd a force exerte d o n it by the sampler of 5kN, together with drag forces to the wind and wave action on the buoy i tse lf. Ande rson (44) eva luated the se forces under design ~onclitions as:
Drag force due to wind = 0,3kN Drag force due to wave action = 9, 5 kN

-z ~ -
C> u ... 0
LI-
5~~~~~~~~~-~~~~-~-~·
4
J ·t----- -
·~t -
----.r--- -t ---------- -- ,,,..--- .--0r I -- _1 ·--
swLT;ing C q~t -.._
------1 ---
..-- Trough ---1 --- --------1------- -- ---- ·- --- I ..._-.. - --2 ----- --1----- ·-- ·- - ·--L .. _
·.
-41 ' . ·. ~ ----L--------- _I I I - • -
-5 I ---.. --- . ·1 · . "~-1 • • - -' . . ....
-3 ~ --
Figure 4. 11 : Design Drag Forces on Mark II Sampler I
• •
~
Velocity drag
Acceleration drag
Total force
- -: .
WL ising
~ .

55.
The buo y and anchor are thus designed for a resistant force of 15 kN.
The buoy was constructed using a 120 litre drum filled with a polyurethane foam to preve nt sinking if damage d. A frame was clamped to the drum and connected to J-he sea anchor by wa y of a 32 mm po lyprope lene rope with breaking strength of approximately 90kN. Two rollers were fixed to the frame to form the pullies for J-he ro pe. The layout of the buoy and anchor is given in Plate 4. 12 as it was be ing assemb led on the beach prior to placement. A view of the roller used is g iven in Plate 4.13. The roller was the type generally used on boat trailers, and was tested in a compression machine to determ ine the max imum rope load it could carry. It was found that it could safely carry lOkN without deformation, and thus was deemed satisfactory as the maximum rope force was evaluated to be 5kN.
Two design philosophies were cons idered. If the buoy was to remain on the surface of the sea under the pu ll of 15kN, then a nett buoyancy of approx ima tely 280 kg is needed , fo r a 20 metre length of anchor rope. This would requi re a buoy of total volume of approximately 600 litres and drag fo rces wou ld be considerably increased. However, if the buoy \'v't'ft.allowed to submerge under the 15kN pull, the proposed 120 Ii tre buoy cou Id be used, and the design force on the anchor is reduced considerably. The weight of the buoy as constructed was 55 kg, with a nett buoya ncy of 65 kg.
The anchor system was des igne d to withstand a force of 15kN. Myers et cl (45), give ho lding powers for various types of anchor • The types of anchor that has proved to be most reliable, and has a holding power
.of approximately fou r times its own weight, is the kedge anchor. Anchor chain and clump anchors have a holding power of approx imately their own weight. A 220 kg scrap kedge anchor was acquired from a salvage yard, and togethe r with chain weighing 150 kg and a clump anchor made of scrap stee l re inforcing bars of 230 kg, give a holding power of 14,SkN. This ma tches the required holding with sufficient accuracy.
_4.7 Des ig n of the Main Rope and Winch System for the Mark II Sampler
A rope with a work ing load of 5k N and total leng th of 1600 metres was required. After investiga ting the differen t types of rope avai fable, a nylon rope, 6 mm in diameter, and 16 strand braided twine construction with a central core was decided to be adequate. The quoted breaking sf'rength of this rope was 9 kN. The rope had to be jo ined, however, and splicing proved to be difficul t with a braided rope, therefore knots were used. The author carried out laboratory tests on the rope, and . found that the breaking strength in the knot was reduced to .5 kN. Other types of rope were considered , but the 6 mm nylon was chosen on the grounds that nylon is the strongest synthetic fibre available, and also the most economical. .,

56.
The quoted breaking stren~th of othe r types of rope are give n below :
Te~ylene : Polypropelene Nylon: Nylon:
diameter 8 rnm · 6 kf'.I diameter 6 mrn 5, 5 kN diameter 4mm 4,5kN diameter5mrn - 6,6kN
This nylon rope chosen also had an approximate strain at breaking of 25 percent, and this helps to reduce the magnitude of the impact forces in the rope which may occur under high wave conditions.
A winch was construcl'ed using al, l kW electric motor.driving a capstan through a reduction box and a va riable speed drive. It was mounted on to the back of the four wheel drive vehicle use d l o transport the sampler and equipment to l'he beach, and powered by a portable 220 volt single phase AC generator. The capsta n speed vari e d between 180 r.p.m. and 45 r.p.m. The maximum calcula te d te nsions in the rope for these speeds are 1, 1 kf'.I and 4,4kN with linear rope speeds of 41 metres per minute and 10 metres per minute respedively.
This winch was constructed as a pre liminary o pe rational unit us ing existing components in the labora tory. The 1, l kW single phase motor is the larges t sing le phase motor commercially available, a nd the, power supply was limited to the portable generator. Pre liminary investigations into the possible use of a hydraul ic motor system were carri ed out, but shelved as capital was limited. Deta ils of the winch as constructed are given in Fig 4. 12 and the mounting arrangemen t on the ve hicle is shown in Plate 4.14. A protective woode n box was constructed to cover the winch during operation for protection from the belt drives.
_4. 8 Ancillary Equipment
A four wheel drive vehicle was used to transport the equipme nt to the beach. A gantry and crawl beam was constructed on the vehicle to enable off- and on- loading of the 390 kg sample r . This gantry is shown in Plate 4.15, offloading the Mark II sam pler.
A portable Bauer compressor was use d to charge the compresse d air cylinders to 20MPa. , It was powered by a 2,2 kW petrol motor, and normally took 25 minutes to charge one 7 litre bottle • .
A settling tube was constructed to analyse the grading of the s.ediment samples obtained. It consiste d of a 2 metre length of perspex tube, 150 mm in diamete r: with a pe rspex pla te near the bottom hu ng from three nylon strands from a cross-piece res.ting on a Me ttl e r balance.

57.
The sample was re leased from a perspex tube by way of a trapdoor, and the mass accumulation read on the Mettler balance. After no further mass was accumulated on the plate, the tube was drained and the plate removed from the tube to recover the sediment.

4.1 3 y p ... 1-4
,

-- ~
, •• ...
. r
. ...
'
•
..
'"
!.
, · -
-u u
•
v c

~t. HELENA
BAY
BAY
ATLANTIC
. I DA SSE N \)
ISLAND
OCEAN
0 10 20 30 40 50 ~~sm:.f::_· . -~~~
KILOM E TRES
Figure5.l
59,
/ ·~.L--~--___ REPUBLIC OF SOUTH AFRICA /
/ / CAPE;OVIN~
// / / /, / / / / /
// / / / // / .
DUYNEFONTEIN / / / / /
TABLE / . / // / ' BAY / t
FALSE BAY /
CA PE POINT

60.
CHAPTER FIVE
Sampling Operations
Sampling operations were carried out in the field using the Mark I sampler, and attempts were made to put th e proposed system for sampling using the Mark II sampler into practise, but were hampered by difficulties encountered. All field sampling was conducted at the site of the proposed Koeberg Power Station on the farm Duynefontein , north of Cape Town.
Suspended sediment sampling was also carried out to a minor extent in the laboratory by Crosswell (46) unde r the supervision of the author. A simple electro-optical indirect type of sampler was constructed and relative sediment concentrations dete rmine d under wave action with a mobile bed in a glass sided flume. Calibration of the instrument was attempted, but was not successfu I. .
5. 1 Helicopters used with the Mark I Same ler
The operation of the Mark I samp ling system required the use of a helicopter to place and retrieve the sampler in the surf zone. Use was made of commercial helicopters hired from a local company. Four types of helicopter were used on various occasions.
In the initial field testing of the Mark l sampler, during December 1974, at which the author was not present, use was made of a Bell Jetranger 206. This aircraft is powered by a sing le 250 kW gas turbine engine and has a maximum lifting capacity of 500 kg on the external cargo hook. As the aircraft has no winch, a long length of rope had to be attached between the sampler and the helicopter. The typical lifting arrangement is given in Fig 5.2. When the Jetranger attempted to transport the sampler to the desired position, it was ~ound that the pendulum aci-ion of the sampler resulting from take off, could not be counteracted by the aircraft. The Jetranger was therefore not powerful enough to be used in sampiing operations.
The next size of helicopter locally availabl~ was a Sikorsky s :62A. This aircraft is powered by a single 925 kW gas turbine engine and has a maxiroum lift capacity of 1300 kg on the ex ternal cargo hook. In addition, it is equipped with a rescue hoist of 270 kg capacity. This helicopter was proved to be the most compatible for sampling as it is comparatively light and easy to manoeuvre when compared with the larger he Ii copters used. . The flying time, however, was limite d to approximately one and a half hours at site, including twenty minutes flying time to and from base. Unfortunately, this aircraft was out of commissio n towards the end of 1975,. and use had to be made of larger and more expensive aircraft.

5. 1 y S A p te 5~2 y S T
5.3 y S 1 N

MARKER BUOY
10 metres NYLON ROPE
SCRAP STEEL ANCH('l8-4;>
35 metres
61.
----------~S~J~h
---~C~O~R. b__f_L_OA15
SAMPLER MK.1
~,,,,11,,
/ ,,/ '-' I
Figure 5.2 Lifting Arrangement for Mark _I Sam~

62.
When the Sikorsky S62A was not a vailable, a Sikorsk y S58T was used. It is powered by two 960kW gas turbine eng ines and has a ma x imum lift capac ity of 1800 kg on the ex terna I cargo hook. Occas ions arose whe n this he licopter was on contrac t e lsewhere and the largest he licopte r, a Sikorsk y S6 l N was used. This aircraft is powere d by two 1100 kW gas tu rbine engines and the maximum lift ca pac ity on the externa l cargo sling is 3000 kg . It is also equippe d wi th a rescue ho ist. The flying endurance at site of the two la rger helicopters is limite d to two hours.
5.2 Sa mplins Procedures for the Mark I Sam pler
A des cription of the typical proce dures used when obtaining samples with the Mark I sampler is given.
The sampler a nd ancillary eq ui pmen t were transported to site by tru ck and pre pa red at beacon Pl3 on the beach, near th e proposed break water at Duyne fontein. The helicopter would fly out from base a nd immediately beg in sampling. The sampler was hooked up to the cargo hook or winch, depending on the type of aircra ft used, a nd p laced in pos ition at the desire d sampling po int. The place ment of th e first samp le was done by judgeme nt of the author and pi lo t as to whe re the samp le was to be taken i.e. in the surf o r ou tside the breaker zone. A long length of rope was us e d to allow ma noe uverabi lity of the hover ing helicop te r during samp ling. Cork floats were aJ-tached at ha If metre interva Is to the rope to prevent th e lowe r cab le fro m snaggin g the instrumen t. A buoy was placed on the cable, 8, 5 metres obove the samp ler to in dicate the pos ition of the samp ler to the pi lot when hovering. The author a !so found these cork f loots use ful to determine the depth of water at the sampling point. Fig 5.3
· shows the sampl e r on th e sea be d.
After the fi rs t sample was comple ted, a nd as the sampler was be ing lifted out of the wate r, a marker buoy was release.d from the a ircra ft to ind icate the sampling point. This buoy was made up of a plasti c bui-t le filled with polyurethane foam and pain ted fluorescen t red, atta ched to an anchor of scrap metal'. Once the sampling spot was marked , the sam.pler could be positioned to within 15 me tres of the original sam ple point for samp les at diffe rent e le vations above the sea bed. Plate 5.4 shows the sample r being lifte d out of the breaker zone by the he licopte r after samp ling.
It was usual to commence samp li ng with the h ighest ele valion nozzle fitted as there is less li ke lihood of the intake be ing clogge d by slight tipping of the samp le r, a nd resu lt ing in hav ing to abort the sam pling ope ration.
After a sample was completed, the samp ler was returne d to the beach for chang ing of fil ters and air cylinders. Plates 5.5, 5.6 and 5.7 show these operations.

5.5 , tie 5.6
,. )
, 5.7
/ 5.

63.
TO HELICOPTER WATER S URFACE
BUOY
S . W. l.
8 15metres STEEL C_A_B_LE_(_6_ m_m_i _l _______ ~
~RK FLOATS
INTAKE PIPE
Figure 5 . 3 Dia9 ram showing Mark I Samele r on Sea Bed
DEPTH SHOW N 5 mclres
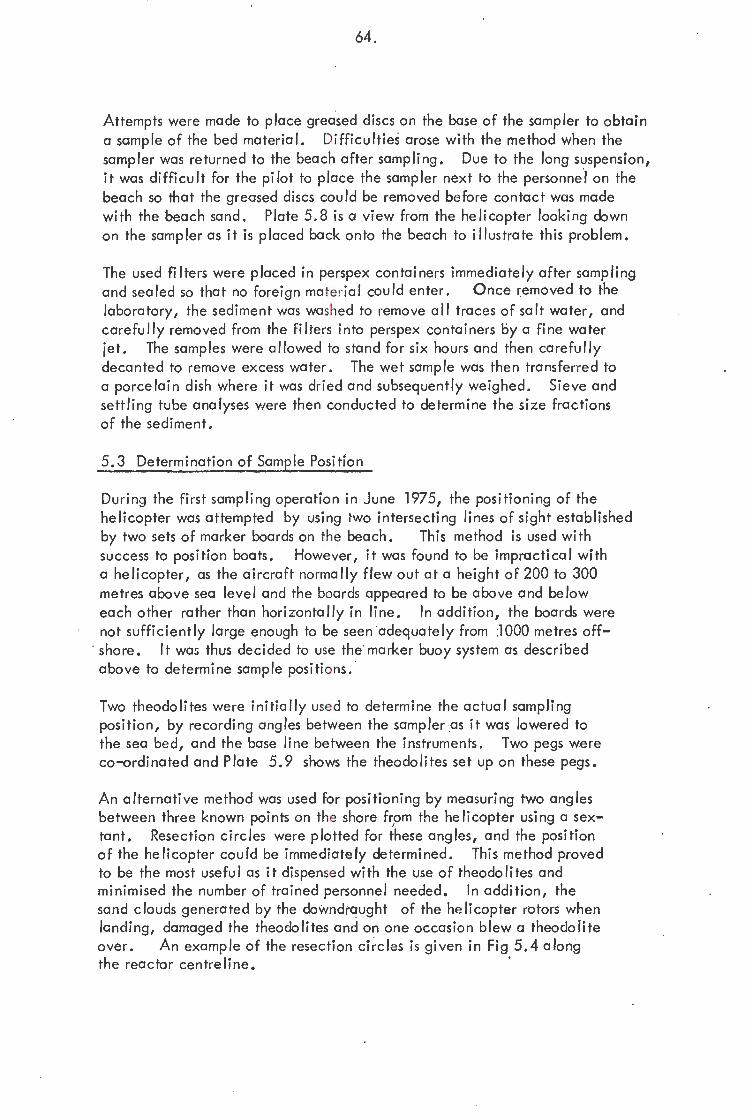
64.
Attempts were made to place greased d iscs o n the base of the samp ler to obta in a sample of the bed mater ial. Difficulties arose wi l·h the method when the sampler was returned to the beach after sam pling. Due to the lo ng suspens ion, it was difficult for the pilot to pla ce the sam ple r next to the personne.I on the beach so that the greased discs cou ld be removed before contac t was made with the bea ch sand. Plate 5.8 is a view from the he licopter looking down on the sample r as it is placed ba ck onto the beach to i lluslra te this problem.
The used filters were placed in perspex conta iners immed iately after sampling and sealed so that no foreign mate rial could enter. Once removed to the la boratory, the sediment was washed to remo ve all t races of salt water, and care fully removed from the filters into pers pex con ta iners by a fine water jet . The samples were allowed to stand for six hours an d then carefull y decanted to remove excess wa ter . The wet sample was then tra nsfe rre d to a porcelain dish where it was dr ied and subsequently we ighed. Sieve and sett ling tube analyses we re then conducte d to determ ine the size fra ctions of the sedime nt.
5.3 Determ ination of Sam~ Position
During the first sampli ng operci tio n in June 1975, the positioning of the helicopter was attempted by usi ng i·wo in terse cting li nes of sight estab lished by two sets of marker boards on the beach . This method is used with success to pos ition boats. Howe ver, it was fou nd to be impra ct ica l with a helicopte r, as the aircraH no rmally flew out at a he ight of 200 to 300 metres above sea level and the boards appeared to be above and below ea ch other rather than hori zontally in li ne . In addition, the boards were not suffici en l"ly large enough to be see n adequately from ;1000 metres off-
. shore. It was thus de cided to use the marker buoy system as descr ibed above to de termine sample positions.
Two theodolites were initially use d to determine the actua l sampling position, by recording angles between the sample r as it was lo we re d to the sea bed, a nd the base line between the instruments . Two pegs were co - ordinated and Plate . 5. 9 shows the theodo lites set up on these pegs.
An alternative method was used fo r posi tioning by measuring two angles between three known poi nts on the shore fr,om the he licopter usi ng a sextant. Resection circles were plotted fo r these a ngles, a nd the pos ition of the helicopter could be immediate ly determined. This method proved to be the most useful as it dispensed with the use o f theodolites and minimised the number of tra ined pe rson ne l neede d . In add ition, the sand clouds gene rate d by the do ·-ivndraughi· of the hel icopte r rotors whe n la nding, damaged the theodo lites and on one occasio n blew a theodol ite over. An example of the resection ci ~c l es is given in Fig 5. 4 along the reactor centreline.

I
\
I
\
'\ ,•
'• ..
, ,
L _! - ' .
"" ·· ....
... ...
I
I
I
-•

66.
The three fixed points subtending these angles we re the shelter, hous ing the experimental switchgear, Peg CERU/3; Peg CERU/l, where the vehicle was parked; and the Radar Tower . All these three points were eas ily identifiable from the helicopter. A co-ordinate list of the sea and radar towers and survey points is given in Table 5. l.
Table 5. l Co-ordinate List
Sea Tower Radar Tower p 13 CERU/l CERU/2 CERU/3 SSBI
5. 4 Mark I Sampler Summary
54 041 52 287 ,6 52 753,7 52 796 52 522 52 995 53 240
X (m)
3 727 814 3 728 979,7 3 727 7 47' 9 3 727 634 3 728 295 3 726 762 3 728 624
Various minor modifications had to be made to i·he Mark I samp ler after fau lts developed during ope ration, and are mentioned under section 4.2 . Despite the need for minor chcnges and problems expe rie nced, the sampler performance was reasonable considering that it was built basically as a prototype . Table 5.2 gives a summary of the number of samples taken, and number of
· hours f I own.
On average, one sample was take n per half hour of flying time. It should be remem bered that each sample ope ration invo lves 20 minutes flying time to and from base. If this time is subtracted from the overall time, the ave rage time for each sample is 24 minutes. Out of a total of 11 o perations , five had to be aborted. This me thcd of obta ining sampl es from the su rf zone under moderate wave condil"ions is thus expensive as the hire charges for helicopters used are very high. A cheaper a lte rnative was sought, using basically the same pump sampler unit but avoidi ng the use of a helicopter. In addition, some element of dan ge r is presenr whe n flying the helicopter at such low altitudes, and a system was sought which was entirely shore based to minimise the occasions when pe rsonnel were actively working in or above the surf.
The sampler, however, was able to sample under exceptionally high wave conditions just outside the breaker zone'. On the operation of 8th June 197 6, the average wave height was 6 me tres and the breaker zone approximate ly 1400 metres offshore.

ft te 5. 9 Survey,. ints t ft 13
p .. 5 11 T ow.r under Hi C nditions
te 5. 10
P te 5. 12 S Tower

67 .
Plates 5 . 10 and 5 . 11 show the ex te nt of the waves breaking seawa rd and over the sea tower on that day. Th ese photographs were taken with a very long foca l length lens and are coilSeq ue nt ly fore-sho rte ned . Plate 5 . 12 shows the to wer in ca lm wea ther as a compa1· ison.
Tab le 5 . 2 Summary of Operatio ns of the Mark I Sa mp ler .
'
I No. of Sam ples j Helicopter ' ~g Time Remarks Date !
2- 12- 7 4 Je tranger 1 hr 0 I
Aircraft not powerfu I enoug h
1-- ·-2 -1 2 -74 S 62A 50 min 0 Cable snagged
--- ·- ----- · --- - -6- 12 - 7 4 S62 A -1 hr 25 min 4 - -- .. ·-
1.2-6-7 5 S62A 3hrl5min 8 He Ii copter returne d to base to refue l ··- - -
3- 10- 75 S 58 T l hr10m in I 0 Re gu lator fa iled ---- - -- -
15- 10-75 I S 58 T 1 hr 20 min 4 -
6- 11-75 S 58 T 30 min 0 I Aborte d - pipes blocked
1- 12-75 S62A l hr 45 min 4 ..--- -----·-·-
8-12-75 S 62 A 1 hr 10 min 3 -->- ·---
12- 3-76 S 6 1 N 2 hrs 6 Interrupted - he licopte r
~ low on fu e l --- --r--- ·-·- --
8- 6-76 S61 N . 1 hr 35 min 2
I
Aborted - pipes blocked . -
TOTAL I 16 Hou'rs 31 -
5.5 Fie ld O peratio ns us ing the Mark II Samp l~
The bas ic system of operation proposed used an endless rope as the mode of transport i ng the Mark II sa mpler to the desired sampling point. This fulfill e d the requirement of a more eco nomical method of obta in ing samples and increas ing the personal safety o f the operato rs as the po int of contro l, name ly the winch, was si tuate d on the beach . A c e rtain deg ree of dange r was invo lved , ho we ve r, in the estab lishment o f the rope system from the sho re to the buo y o ffshore.
The i nitia l pro posa l was to es tab li sh rhe endless rope from shore to buoy and back to shore using a li ght nylon rope . This would then be used to pul l the heavy rope into pos it ion . The sea anchor and buoy were placed using a Sikorsky S 58 T he lico pter du ring sampling o perations involving the Mark I sample r in November 1975. ' · . -. -, · ., ·

68.
In order to position this buoy accurate ly 800 me tres offsho re , a marke r buoy was previo usly place d usi ng a boo t posit ione d by theodo lite from pegs CE RU/ l and CERU/ 2. The buoy broke loose afler a sto rm in Ma rch 1976, and was· cleaned of ma rine growth a nd re posit io ned in April 1976. Plate 5.13 shows the conditi on of the buoy after 4 months at sea. The ancho r was located by the use of two th eodolites set up a t C ERU/l and CERU/ 2, sel- o n fi xe d angles. A boat was positione d by these theodo lites and a diver was used to locate the anchor, and reshackle the buo y to it. Use was made of rese c tio n ci rcle s shown in Fig 5.5, to obiain opprox ima te positions of the boat.
The buoy su bsequently broke loose a gain in July 1976 and was re place d by the same me lhod in Octobe r 1976 . Th e anchor rope wa s shortened to a pprox ima te ly 12 me tres to try to preve nt abrasio n at th e rope -cha in junction. Thi s was fou nd to be the weak point which eve ntually parte ci duri ng hea vy seas when th e buoy was in the breaker zone.
Severa I a ttempts to estab lish the ro pe li nk be twee n the buoy a nd the shore were made. In ve ry low wa ve co ndit ions, a li ght line was e stab li shed using swimmers and surfboa rds a nd a Zo dia c inflata b le di ng hy was used to pull the hea vy ro pe ·to the buoy. This opera ti o n could o n ly be ca rri e d out in very lo w surf conditions. For high e r surf condi t io ns, the use of line th ro wi ng equ ipment commercially ava ila ble was conside re d, but after the au thor witnessed the use of such equipme nt at Ora n jemund, th e ra nge of thi s equ ipmen t be ing only 200 me tres and insuffici e nt for use a t Duyne fonte in, the idea wa s re je c ted. The co ndi t io ns unde r which the Zod iac di nghy wo ul d be us e d were in wave heights o f up to 1,5 me tres , unde r wh ich circumstan ces it would not be able to a pproach closer than 400 me ters to the shore with safety.
The endless rope was insta ll e d in July 1976, and a tl'empts we re made to pull the sample r out into the surf. Difficulti e s we re e ncoun te re d due to the large tens ions de ve lope d in f·he rope c~ use d by the drag of the rope in the surf, and the catenary a ction of the rope caused by longs ho re curTe nt. The winch system used was fo und to be unde rpowere d. The rope wa s left in ove rnight, the ends a nc ho red to co nc re te blocks burie d on the beach ap prox imate ly 300 metres apart. . The fo llo wing morn ing the rope was found to be ex te nsi ve ly tangled at the buoy end, and wa s cut loose to retri eve it. Pla te 5 . 14 shows the Mark II sampler and equipment on the bea ch in a t tempts to es ~·a b l is h the rope system.
Ope rations using th e Mark II samp le r were attempte d aga in duri ng O ctober and Novembe r 1976, but the same prob lems we re expe ri en ced as in J u ly 1976. The autho r the refore concluded that for this system to work satisfactori ly1 a more powe rful opera t io na l sys tem was needed . If a powe rful boa t was avai !able , the system cou ld be modi fie d to elimi na te the return end of the rope and de c rease the pro bability of tangling at the buo y. This howeve r involves personnel on the sea, a nd could not o pera te un de r wa ve conditi ons of more than 2, 5 metre wave height.

---- ' I:
f:
t
, .. .. ...
I
, ~ , ,
' ....
...
I ' I ' ' ' I I I
I (
\
; 1 '-
' ' '
• . ____..;.
I
' ' •
I ~ ·- ·- ;
•I ~ ;p 1dl.H ' I! -.. Ii I ; •
">\ ., .. .
-a
I ...

5. 1

70.
The Mark 11 sampler 'N OS tested ex te nsively in the laboratory a nd the sampling cycle of si nking, sa mpling and ref loo ting worked tho roug hly. The sam ple r was also tested in the swash zone of the beach a nd the wh ee le d motive system was found to work with a reasona b le deg ree of success. No sam ples were obtaine d using this sam pler be cause of the probl e ms encountere d with the operatio na I syste m as describe d above.
5.6 La boratorr EXpe rjments
Crosswe ll (46) unde rtook prelimina ry laborato ry investigations into the suspe nsion of se dime nt under the supervision of the author in October 1975. A wa ve fl ume 20 me tres long and 0,6 metres wide was used, ca pa ble of producing wa ves of up to 0, 32 metres in he ight and o f wa ve pe riod of between 1,0 and 4 ,5 seconds. A mobile bed was used with ari a ve rage slope of 1: 15. Two types of sa mpler' were use d, a siphon sa mpler consisting of a 1,5 litre eva c ua ted bottle a nd an ele ctro - optical indire ct type of sa mpler. The output from this sample r was initial!yread on a vol tmeter, but subsequently p lo tte d on a pe n recorde r. Calibra ti o n of the e lectro-opti ca l system was a tte mpted by a llowing a known mass of sa nd to settl e in a conta iner and compare d with vol tag e drop readings reco rde d by the ele ctro-optical sa mpler measu ring across thi s suspension. Difficul tie s we re e ncounrere d in esta blishing a consta nt flo w of sand throug h the si e ves to provi de a constant suspe nsion, a nd the calibrat ion res ults we re not conclusive. The results usi ng 1·he siphon sampler we re fo und to be subje ct to large variations be cause of the sma II ma ss of sediment o btained.
The rela tive concentrations of suspended sedime nt at a pa rticular point were able to be determined, and insta nta neous rea dings were plotte d by the pen recorde r. An example of the output is given in Fig 5,6. It is seen that several bursts of sedime nt occur with high pea ks during a wave cycle and are cause d by the vo rtices ge nerate d by tbe sand rippl es on the be d passi ng the optical beam. If 1·he drop in vo ltage is assume d to vary li nea rly with the conce ntra l-ion, th e n these peaks a re of the orde r of 3 to 4 ti mes the magn i tude of the ave rage concentration.
In con c lusion, the follo wing poin ts we re obse rved in the experime nts :
(a) The amount of sedi me nt in suspension for a gi ve n wave he ight and period appea rs to be greatest just outside i-he breake r zone. This phenomenon was a !so observed by Ke nnedy and Locher . (8)
(b) Suspe nsion of sedime nt did not occur in any si gn ificant amounts unti 1. sand ripple fo rmations occurre d on th e bed. These ripples vari e d between 50 a nd '180 mm in le ngth and 5 to 30 mm in he ight. Unde r low wave co ndit ions, the ripp les appe::ired to be we ll formed, but as the inte ns ity of wave attack increase d, the ripples tended to be come flatte r and less pronounced.
(c) The principle mec ha ni sm of the suspe nsion of se diment is the vortex formation cause d by turbu le nt flow o ve r the ripple be d.

71.
Se veral peaks in the instantaneous ·measu rement of suspended se dime nt were ide ntifi e d, cause d by tu rbulent vortices lade n with sediment forming on the landward side of l"he ripple and being carried ove r the crest of the ripple in a seaward direction by the oscillatory motion of the flow. The number a nd intensity of these peaks was found to vary with the wave pe riod, wave height and position relative to the ripple.
(d) Calibratio :i of the indirect type of sa mplers is difficult and can result in e rroneous rea dings particularly if organic turbidity is
present.
(e) Readings take n by ele c tro-optical instruments in the surf zone are unre li ab le because of the prese nce of entrained air bubbles.
The author concludes that the sa nd ripple formations occurring in laboratory experiments were found to hc ve a significant effect on the suspension of sediment. Observations made by the author whi 1st diving in the sea at the area unde r investigation, indicate d tha t the scal e of the sand ripples was more de pe ndant on the current occ urring at the sea bed rather than that resulting from wave motion. Sand ripples of approx imately 100 mm in length and 10 mm in hei ght· we re observe d a t a poi nt 800 me tres offshore under 2 metre wa ve height conditions. The orientation of these ripples was normal to the dire ction of the current 1 rathe r than pa ro ll e l to the wave crests. The ripple formation wa s, howeve r, reasonably symme trical.
A comparison between the ripple dimensions occurring in the laboratory experiments and in the prototype , compa red to their related depths, indicated that the ripple formation in the prototype does not assume such a sig nificant role in the suspension of sedimen t as assumed under laboratory conditions.
, ·

2
Volt drop
0
2
Volt drop
1
2
Volt drop
0
0
10
10
r
!
10
72.
H=0,29m T = 4,5s d=0,18m At grid 81 well seaward of breaker point
20 30 40 50
20
20
Time (seconds)
H = 0,34m T = 3,5s d = 0, 18m At grid 81 well seaward of breaker poi nt
30 Time (seconds)
40
H = 0, 34 m T = 3, 5 s d = 0, 18 m
50
at grid 55 just seaward of breaker point
30 40 50 Time (seconds)
Figure · 5.6 Output from Electro-optical Sediment Sampler

• 3 127 000.
! N
• 3 7?~ 000 •
• ' 729 'XV' •
..l WAV( RIDER A V-ooso
§ "' "'
·--
I~
KIEL~
SSB l - position of buoy and anchor for Mk II sampler.
SE A TO WER -- 1~, \wt MELSFELDr.R]. · ' \ A><EWOMCTER I L: EMP'!RATURE ~
J
l v.A\I( RIDER C ~ DQ SO
'
. § : • "' ~
0
~16
IO
+ SSB 1
\ , .;:
\
Fig 6. 1 Genera I P Ian of Duynefontein Coast.
\ . +'4 ~ / ·'
~ia.GE. '!.
_-c.'-
_-c. ·'- ·s'"'GE.
\ p.E.._c.~Op.S
+pg 0
OU
\
p.E."'c.~01<
l'f-"'c.~p.
)
'I w
74.
CHAPTER SIX
Fi e Id Resu Its and Ana lxs is
6 . l Beach Toeogra phy an~_'ijave Climate
The approximate depth contours of the beach and pos itions of the data recording equipment are shown in Fig 6.1. The approximate bea ch slope was l: 100 and found to be fa ir ly constant throughout the season, as shown by Bosman (48). The position o f the breaker zone a s observed by the au thor is g ive n in Table 6.1 and it is no ted that the surf zone is unusually wide.
Table 6. l : O bserved Width of Surf Zone.
H J\verage (m)
0,5 1 2 3 4 5 6
Surf Zone Width (m)
50 to ·100 200 300 to 400 up to 600 800 to 1000 1000 to 1200 1200 to 1400
La rger sets of waves occurre d and wou ld break well seaward of i-he normal breaker position for the specifi ed average wave climate.
The tidal range at the area unde r inves tiga tion was assumed to be the same as that for Table Bay. Tide tables (47) give the following values for Table Bay:
HAT - = 2,02m LAT .. = -0, 01 m MHWS = l ,69m MLWS = 0,27m MHWN = 1,26 m M LWN = 0, 71 m
The above leve ls are given re lati ve to the local datum.
Bosman (48) showed !hat the offsho re contours were we II spa ced and regu !a r, with no reef o r sudden loca l c ha nges in depth . The average deep sea swe ll direction was found to be WSW (247°). The beach orien tation was 335° so that the incoming waves are approximate ly parall e l to th e beach when enteri ng the nearshore reg ion.
Wave he ights and periods during sampling were measured by a Weme lsfelder wave recorde r situated on the sea towe r, and by a Wa ve Rider buoy situated 1500 metres offshore.
., ..

75.
Wa ve di rection was meas ured by rada r from a towe r on the beach. Wave data used in the ana lysis of the suspended sedimen t results was obta ine d from reference (7).
The following assumptions are made in the analysis of the resu Its :-
(a) The density of the sea water and sand is assumed to be 1025 kg/m3 and 2650 kg/m3 respe cti ve ly. In the del'erm inatio n of the sediment size fraction by sett li ng tube a nalys is, it is assumed tha t the sed imen t behaves as spher ical san d particles. Thus the larger sized shell particles are assumed to be small e r sized sand partic les with the same hydra ulic propert ies. .
(b) The wave heights given we re recorde d a t the sea tower in 11 metres water depth. As the wave he ights are not known to any great degree of accuracy, the wave he igh t at the samp le poin t wel l seaward of the breaker zone is assume d to be equa I to that at the sea tower. For sam ple points in the surf, the breaking wave height is found and us e d in the calculations. The wave heights recorded are g iven as H1j1Q, and as the significant wave height is to be used in the calculation of o rb ital velociti es, the fol lowing co nversion is used , as g iven in referen ce (40) :
= 0,79 H1j10·
(c) The wave fron ts are assume d parallel with the shore line , and no refraction wi ll be conside red . This was found to be true in most cases by Bosman (48).
(d) The k1"t."'~c.. v i scos ity of the water is given by the equa tion quoted in Swart (32) :
y = 1 J92 x 10-6 exp ( -0, 042 to' 87 ) m2 /s.
where t is in dqrees Ce l!li us. is a ss umed to be 0,38.
The value for von Karma n coe fficient
(e) The settling ana lysis of the sediment was determine d using the Stokes ', Transit iona l and Al len 's Laws as given by Lazarus (49) and is plotted in Fig 6.2 for water at 20° C. The fa ll velocity of the particles used in the cal culatio ns is assume d to be eq ua l to that for a sand particle of size D50, determ ined from the grad ing analyses.
6.2 Results
The sediment concentrations and g rading analyses for the sampies obtained by the Mark I sam p ler are given in Fig 6 .3 . to Fig 6. ·11. The max imum sizes of pa rticles were determined in the grad ing analysis by observi.ng the time of firs t arri va l on the sca le, and a re given in Table 6. l.

200
I 80·-~---~---.-~-----~--~----~--+-~,__,,~1__._~ 1 I
60 1 i I 50 1-----·----~-----4-----+----+--,.__._____.__j_J_
I ; I 1. I,
401---C--~----' --+-----+-~-----1----JiF---+----+--'--+----r--i
I I I I
1_J1·_:___j l : I ! I ' I I ' I
I ' I ; 1 I I ,
: l •
I : -l
' !
30 1--------+---~-'__,'---;-------+
20
- 15 - - --· ----, ~ ! I E E
I - I
~ )... 10 .... u ---
_Q 8
~ · C) c ·- 6 - --.... .... Q)
5 Vl -- ··- - .
I i ' I I I
----1--'--!-----~i:-=-· ~=~---+-H~! ; ' I : :- I _____ _
4
3 I : I _· -1 -1---1--- . ! i ~
2 ---~~-~~--~~-· ~~~~~: ~~~1~·~ ,- -r ·--· - -
! I
1 30 40 50 60 80 100 150 200 300 400
Diameter { m x 1 o-6)
Figure 6 .2 Settling Velocity of Sand in Water at 200C
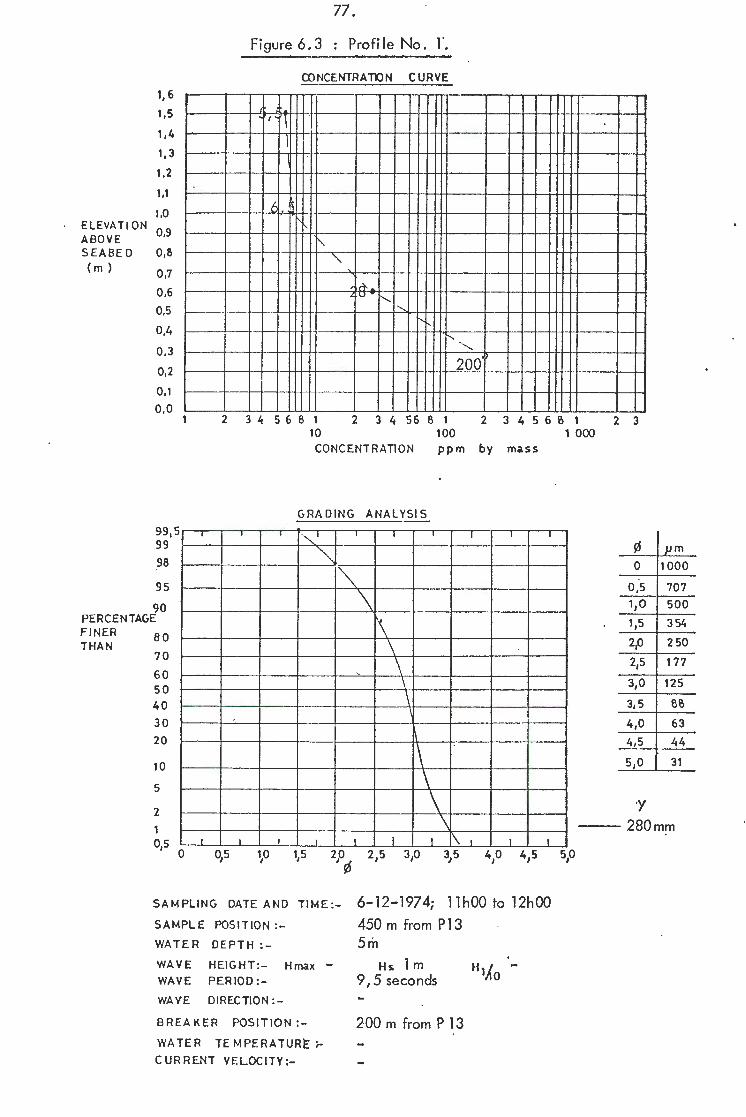
77.
Fi gure 6. 3 : Pro fil e No. T. ·
CONCENTRATIO N CURVE
1, 6
1,5 r- -
l I •
r \ 1.4 I
-1, 3
1.2
1.1
1,0 ELEVATION
0.9 ABOVE
f
' ' ~
SEABED 0,8 (m) 0,7 " '
0,6 , n. -" u - -......_
0.5 '-
0,4 I ' r-
' 0.3
0,2 ""' -200'°
0 ,1 -
o.o 2 345681 2 3 4 56 8 1 2 345681 2 3
S9, 5 99
98
95
90 PER CENTAGE
FINER BO THAN
70
60 50 40 30
20
10
5
2
~-r t-·--
I I o,s 0
10 100 CO NCEN TRATlON ppm by mass
GRA DING AN AL YSIS
I
I'" ' I I I I I I
"'-. ...., -
""' \ \ \
' \ \ \ I
\ \ \ \
I I I I I \ , 1 I
110 1,s
S AM PLING DATE AND TIME :- 6-12 - 1974; llh00 to 12h00
SAMPLE POSIT ION:- 450 m from Pl3 WATER DE PTH:- 5m WA V E HEIGHT:- H max -
WAV E PERIOD:-
WAVE DI RECTION:-
BREAKER POSITION:-
WA TER T EMPERATURE :
CUR RE.NT VELOCITY:-
Hs 1 m 9, 5 seconds
200 rn from P 13
H I -1110
1 000
¢ µm
0 1000
0,5 707 1,0 500
115 3 54
2p 2 50
2,5 177
3,0 125
3,5 8'0
4,0 63
4,5 44
s,o 31
'Y - - - 280mm

ELEVATION ABO VE SEABE D ( m )
1, 6
1,5
1,4
1, 3
1.2
1,1
1,0
0.9
0,8
0,7
0 ,6
0.5
0,4
0.3
0,2
0,1
o.o
99, 5 99
98
95
90
,., ~
I
78 .
Figu re 6. 4 : · Profile No. 2.
CO NCENTRATIO N C URVE
I\ \
1,
\
2' d -''r- I
,_
'-....
'I' ....
" · ~~ ' I
\ )Q ~ ·-
2 3 456 81 2 3 4 56 a 1 -2 31+Sbe1 2 3 10 100 1 000 CONCE NTRATION ppm by ma.s s
GRAD ING ANA L YSIS
I I I I I I I I
¢ µ m
' 0 100 0
""' .
~ __ , ~~
. 0,5 70 7 1,0 500
PERCEN TAGE
"" ....... i,s 3 54
FINER BO THAN
70
60 50 40 30 20
10
5
2
I I
" I'\. "\.
I 1 t
. r- •
~
' \..
' ' \
I"
I
\ . '\
\~ 'I\\ \\ ~ . " I I I I
2.0 2 50
2,s 1 'J'7
3,0 12 5
3,5 Sn 4,0 63
4,5 44
5, 0 31
y
-- 280mm
· • • • • 630 mm o,s 0 410 415 5,0 _ __ 970 mm
SAMPLI NG DATE AN D T I M E : - 12-6-1975; 13h00 to 13h40
S AMPLE POSI T ION: - 1300 m from Pl 3 WATE R DEP TH : - 12 m
WAY E HEI GHT : - H max 2,8m Hs
WAV E PERIOD: - 12 se co nds H 1~0 · 2,0 m
WA YE DIRECTION: -
BREAKE R POSITIO N : - 400 m from P13 WATER T EM PE RA T UR E ;... 15°C CU R REN T VELOCITY :-

ELEVA TI ON ABOVE SEABED (m)
1, 6
1,5
1.4
1, 3
1.2
1,1
1.0
0,9
0,8
0,7
0,6
0,5
O,L,
0.3
0,2
0,1
o.o
S9, 5 99
98
95
90
79.
Fiqure 6 .5 : Pro fi le N o . 3 __..:.:
CO NCENTRATION C URYE
r ~-~~IT .J
' i ! I ~
- -1' .- ,
-- - ·- "'-- - i L--__ ..._
' -- ,_ - 1-1 >-- - -- .
+ " 4-
~ ~-- --.- t3: I 11
'- ~ L I
I
') () , -
t--1- 1--
l --- - 1--- -
- .. - '-- 1400
T t - . ---TI I
2 34 5 6 8 1 2 3 4 5 6 8 1 2 3456{'i1 2 3 10 100 1 000 CON CENTR ATIO N p p m b y mass
GRA DING A NA LY SIS
- r I I I I .- I I
'~ . \ \ \' \
---1--. \ \ .
- \
¢ m 0 1000
0 ,5 707
1,0 500 PER CENTAGE "-\ .... H I . 1,5 3 54 FI NER BO THAN
70
60 50 40
30
20
10
5
2
0,5
\ - \
=F~
I
~-=t==r--· ~-- , 1 ~=--1- I
0 1,0
. - --!'-... . [\ " ' .
-I\ \ I"\. .
~ 1--- - - >-
0- ' . \ \ .
~f "' '\ --i: , \
I' • \\
\ I I I
-
. \' \ • I 1
2,0 2 50
2,5 177
-----' ~ 3, 0 1~_25
I
3, 5 81')
4,0 63
4,5 41-t
s,o 31
y
280 mm 6.30mm
s,o - - -- 970mm
SA M PLI NG DATE A N D TIME:- 12 :..6- 197 , 15h30 to 16h20 - - -- 1500mm
SAMPLE POS IT ION :
WATER DE P TH:-
700m from P 13 Sm
WAYE HEIGHT:- H max 2, 8 m Hs
WAVE PE R IOD:-
WAVE DIR ECTION : -
BREA K E R POSITION:-
WATE R TE MPE RATU Rt: :-
CUR REN T VE LOCITY:-
12 seco nds
400 m from P13 i,s 0 c
H I 1/l 0
· 2,0(11

ELEVAT ION ABO VE SEA BE D ( m )
1, 6
1,5
1.4
1, 3
1.2
1,1
1.0
0,9
0,B
0,7
0,6
0.5
0,4
0.3
0,2
0,1
o.o
~9, 5 99
98
95
90
80.
Figure 6 . 6 : Profi le No. 4.
CO NCENTRATON CURVE
i A -\
c --- -
\
I H .
-....... ., 84
\ - -
\ -
, ___ \ I
)08
-2 3 4 5 6 8 1 2 3 4 56 8 1 2 3 4 5 6 8 1 2 3
10 100 1 000 CONCEN TRATION ppm by mass
GR A DING A NA LYSIS
I I I I I I I I I I . \·
' I' \'. \ ' " "-.. \ . \
¢ µm
0 1000
0,5 707 1,0 500
PERCEN TAGE '\ !' 115 354 FINER BO THAN
70 -
60 50 40 30 20
10
5
2
I I I I
\ :\ 1\ ·~\ \
\ . '\.. \ . [\ '
\ · \ I\.
1\' . '\ . \: . " \
'\ . ' I'\. . ' ~
I I I
" '\
. "-.. _\
K . ' . I 1 I
2,0 2 50
2,s 177
3,0 125
3,5 88
4,0 63
4,5 44
5,0 31
y
_ _ 280mm
• · • · 870 mrri o,s 0 o,s 1,0 L,10 415 s,o __ _ 970mm
SA M PLI NG DATE AN D TIME : - 15- 10-74 15h45 to 16h30 SA MPLE POS ITION:
WATER DEPTH:-
550 m from P 13 in surf zone
4m WAVE HEIGHT:- Hmax 3,7m Hs
WAVE PERIO D:- l 0 seconds WA VE DI REC TION :- 2530
BREAKER POSITION:-
WAT ER TEM PER ATURE:.--
CUR RENT VE LOCITY :-
600 m from Pl3 13, 5o c
HI -2,7m 1110
-- - 1500mm

ELEVATION ABOVE SEA BE D (m)
1, 6
1,5
1,4
1, 3
1.2
1,1
1.0
0,9
o,e 0,7
0,6
0,5
0,4
0.3
0,2
0,1 0,0
S9, 5 99
98
95
90
I
81.
Figure 6 .7 : Profile No. 5
CO NCENTRATION CUR VE
i 2- - \ I -
\ .....__ '-I\
7 el\ 1
1 ()?
..........
' !'-...
!'-... -;ec
2 3 4 5 6 8 1 2 3 4 56 8 1 2 3 4 5 6 8 1 2 3 10 100 1 000 CONCENTRATION ppm by mass
GRAD ING ANALYSIS
. I I I I I I I I
i" \ \ \ \ " . \ \ ' '
¢ µm
0 1000
0,5 707 1,0 500
PERC ENTAGE .. \ \ '\ 115 3 54
FINER BO ' ' \ \ \ 2p 2 50 THAN 70
60 50 40 30 20
10
5
. . \
\
' \ \
I\
I\ \ \
· \ \
-\ \ \ ·
l \_ \ .
\
2,5 177
3,0 125
3,5 88 I\
\ 4, 0 63
4,5 44 \
1, s,o 31 \
2 - \
I\ "'
y
340mm 690m·m
'•,o 415 510 ·- _ - 1030 mm
\ ~ I I I I I I I , ' o,s
0
SAMPLI NG DATE AND TIME:- 1-12-1975 15h25 to 16h3Q
SAMPLE POS IT ION:- 600m from P13 WATER DEP TH :- 6,5 rn
WAVE HEIGHT:- Hmax
WAVE PERIOD : -
WAVE D!RECTION:-
BREAKER POSIT IO N:-
WATER IEMPERATURt: :.
CURRENT VELOCITY: -
Hs 2m 9, 0 seconcls 233.0
400m from P 13
13°C
I
___ l560mm

ELEVATION ABOVE SEASE D ( m )
1, 6
1,5
1,4
1, 3
1.2
1.1
1.0
0,9
0,8
0,7
0,6
0,5
0,4
0.3
0,2
0,1
0.0
S9,5 99
98
95
90
I
82 .
Figure 6 . 8 : Profil e No. 6 CONCENTRAIDN CU RVE
- - 1- ---'--
. 105 \ -
\
I\ -'l. 1 o. l
I 2b>O 1•
-
- 2 3 4 5 6 8 1 2 3 4 5 6 8 1 2 3 4 5 6 8 1 2 3 10 100 1 000
CONCENTRATION ppm by mass
GRA D ING ANALYSIS
l I I I I I I I
¢ µm \ \ ' \ \'
\ \
0 1000
0,5 707 1) 0 500
PER CENTAGE \. ~ 115 354 FINER BO
\ 2.0 250 THAN 70
60 50 40 30 20
10
5
2
o,s I
0
\
I I I
\
' \ \
\• \
\· \, \
\\ \
I I
·\ ~\
'\ , \ I
2,5 177
3,0 125
3,5 8~
4, 0 63
4,5 44
s,o 31
I I
y
340mm ••• • 690 mm
410 415 sp_ - - 1030mm
-- - 1560mm
SAMPLIN G DATE AND TIME : - 8- 12- 1975 14h25 to 16h0Q
SAMPLE POSIT ION :
WATER DEPTH:-
350 m from P 13 in surf zone 3m '.
WAVE HEIGH T:- Hmax 3m Hs 2m H 1~0 WAVE PERIOD:- 10 seconds WAYE DIRECTION: - 250°
BREAK ER POSIT ION :
WATER TEMPERATURE:.
CUR RENT VELOCITY: -
400 to 500 m from P 13 130(
0, l to 0, 15 m/s to S. E.

ELEVATION ABOVE SEABED (m)
1, 0
1,5
1 '4 1, 3
1.2
1,1
J,0
0,9
0,B
0,7
0,6
0,5
0,4
0,3
0,2
0,1 0,0
S9, 5 99
98
95
90
I
83. Fi gure 6 . 9 : Profile No, I_
CONCENTRATION CURVE
I ! gc: I "' . .:.>
l -I I ----
--- -
I
L ,____
I I 1
o 147
"' -
"' ' _,_
A IC 0
2 3Li5681 10
2 3 4 56 B 1 100
2 3456~1 2 3 1 oco
CONC ENTR ATION ppm by mass
GRA D ING ANA LYSIS
I I I I I I I I I
\ ~
' \ '\ \ - 0 ,5
1,0
707 500
PERCENTAGE \ 1,s 354 FINER BO
2p 2 50 THAN 70
60 50 40 30 20
10
5
2
'
\
\·\ \ . ~'\ \ . \ \
\
-
' \
\ , o I
\ \
\ • ' I
\
--
\
2,5 1 77
3,0 125
3,5 81'>
4, 0 63
4,5 44
5,0 31
y 340mm
' I ' I 0,5 0 i,5
• I ' t I I ..L I 690mm 2p¢ 2,5 3p 3)5 . i.}o 4}5 5p_ _ _ l S60mm
SA MPLING DATE AN D TIME:- 12- 3- 1976 l 1h20 to 12h15
SAMPLE POSITION: - 430 m from P 13 in surf zone
WATER DEPTH : - 5m
WAVE HEIGHT : - Hmax 3,5m Hs
WAV E PERIO D:- 11 seconds WAYE DIR ECTION:-
BREAKE R POSITION:
WATER TEMPERATURl:: :
CUR RENT VELOCITY:-
500m from P13
14°c

84.
Fi gure 6. I 0 : Profi le No. 8 CQ , 1CENTRAIDN CURVE
1, 6
1,5
1.4
I ,~,..
·- -I
1, 3 -
1.2
1,1
1,0 ELEVATION
0.9 ABOVE
• l 0 \
SEABED 0,B \
( m ) 0,7 '
0,G 0,5 I\ ·>---- ..... r--
0,4
0.3 " fl 990
0,2
0,1 0.0
2 345681 2 3 4 56 B 1 2 345GS1 23 10 100 CONCENTRATlON ppm by mass
99, 5 99
98
95
90 PERC EN TAGE
F!NER BO THAN
70
GO 50 40 30 20
10
5
2
0)5 0
I I I
I ' ' 1,0
GRA DING ANA LYSIS
I I I I I I
\ · \
\ \
\ \ \
\ \
\ \ \ , \I\ I\'
\\ \ 1\
I 1 I I I ...-1 1,s 20 2)5 3p 3)5 )¢
SAMPLING DATE AND TIME :- 12-3-1976 12hl5 to 12h40 SAMPLE POSITION:- 530m from Pl3 WATER DEPTH:- 6,5m WAVE HEIGHT:- Hrna;; 3,5m Hs
WAVE PERIOD:- 11 seconds WA YE DIR ECTION : -
BREA KER POSITION:-
WAT E R T EM PER AT URE :
CUR RENT VELOCITY :-
500 m from Pl 3
14°C
1 000
I
I
¢ ~-0 1000
0,5 707 1,0 500
115 354 - -- ~-
2.0 215
3,0
3,5
4,0
4,5
5)0
2 50
177
125
s~
63
41,
31
y
340mm lQjOmm

85.
Fi gure 6. 11 : Profile No. 9 O) NCENTRAIDN CU RVE
1, 6
1,5
, ''· ' 90
I I
1, 3 \ \
1.2
1.1 \ 1.0
187 o
ELEVA TION 0,9 ABOVE
-
S EABE 0 0,8 ( m ) 0,7
0,6
0.5
0,4
0.3 I
0,2
0,1 -
0.0 2 3 4 5 ti 8 1 2 3 4 56 B 1 2 3 4 5 6 B 1 2 3
10 100 1 000
99,S 99
98
95
90
I I I
""'-'-.... _,
CONCENTRATION ppm by mass
GR A DING AN A LY SIS
I I I I I I
\
\
PERC EN TAGE ""' \ FINER BO
' THAN 70
60 50 40 30 20
10
5
2
0,5 0
I I I I
~ ' '
' " ' '\
"
I I 20 2,5 1¢
3,0
'\
' ' ' " "'\
K I I
\ 1
SAMPLING DATE AND TIME:- 8-6-1976 . 13hl5 to 13h40
SAMPLE POSI TION :
WATER DEPTH:-
1550 m from Pl 3 15m
WAVE HEIG HT:- Hmax 8m Hs 6m WAVE PERIOD:- 12 seconds WAVE DIRECTION:- 254.o
, ·
H I -1110
BREA KER POSITION:-
WATER TEMPE RA TURI: :
CUR RENT VELOCITY:-
up to 1400m from Pl3
13,5°C
I
I
5p
_j_ ~ 0 1000
0,5 707 1,0 500
115 354
2.0 2 50
215 177
3,0 125
3,5 BB
4,0 63
4, 5 44
s,o 31
y 1030 mm
1560mm

86.
Calculated values of var ious parame te rs needed for the computation of the parameters e
1 and b
1 in equations (3. 18) and_ (3 . 20) res pective!~, are
given in Tab le 6.2. The e 1 an d b l va lues wi ll be calculated usrng the shear stress fo rmu lae given by Ya lin in equation (3.3) and Bijker and Swart in eq uatio n (3 .6).
Tabl e 6~ l
Profile No. Elevct ion z (m m) D max ( ;1 m)
2 280 - -- ____ _______ 42 0~--·
. ··-··-··) ____________________ - __ 630 .. . -·- _____ 380 3 ____________ 280_. :_ ······--· ____________ z 40 _ ____ _ _ 4 ____________ ---·· --- __ 2 ~Q___________ . ________ 440 4 _____________________ §2:5 ________ __ 3$0 _ _ _
__ 4 _________ _____________ 27'9 -·--·-··-·--- ---- ~;?_Q ____ _ 5 .. -··· .. ·-- -· -~-49 _____________ --- -----4_50 ----·-·--5 690 --- - .... - - -- ·-·- _____ 500 ________ _ 5 - --·· - J Q3Q _ --- ---· ---- - --- _ ;320 ____ _ _ 6 340 ______ _ --- - ------ 550 ________ _ 6 .. _____ Q.?_O ____ ___ _______ _ _____ 40Q ____ ___ _ 6 . 1Q_30_ . .. . ·---- _ _______ 400 __ _ 7 34Q ------- --·-·--·----- ~29. _____ _ 7 --· -------- _ji9Q____ _2QQ __ _ 7 1560 400 --·- ----·-······ ------ !------- --------- - ------ ----- -- - ---------- ------- ---- -8 340 390
--~------·==·===:= _ _i_o30--------:=--=--~-~)-~o=~~== 9 1030 400 -----·- ---- -- -------- - ------- + ---- --------------9 1560 770
The values of b 1 and e 1 a re e stimate d from the field data by plotting the volumetr ic concentration agains t the e leva t ion abo ve the sea bed, y, for evaluating b1 ; and a gainst the parame ter .i.:x. for evaluat ing el. The slope of the straight li ne through the da ta plo tte d on a log-log scale , gives these values.
Graphs of the plots for ea ch profi le are given in Appendix 3, Figures A. l to A. 9, and a compariso n between the ca lculate d a nd experimental values of e 1 and bl is given in Tab le 6. 3 .
If the expressions (3 . 17) and (3 . 19) a re assume d to hold true above the reference leve l, the concentration at thi s leve l is determ ined using the value of r, given in Ta b le 6. 2, as the e levatio n of th e reference I eve Is abov~ the sea bed. The logarithmic mean of the referen ce calculation is then determined for each profile using the concen trations determ ined by (3.17) and (3.19), a nd is the n plotted . against the value of parameter H d for each profile in Figure 6. 12.
TT

87.
Table 6 .2 : Calculated Va lues of Parameters e1 and bl
Profile Number
L(m) 1_P_a_ra_m_e_te_r_-t _ _ l -+-I __ 2 __ tl ___ 3_
1! __ 4 --~ 5 L 6_......-_7_...,...__?_~---· -l
65 11 122 101 I 61 68 I 53 76 85 I 135 t
D50 (,tlm)
y (mm2/s)
U max (m/s)
a (m)
Re
(m/s)
135 130 175 I 185 160 I 210 150 170 155 I l, 18 l, 15 1, 15 1 1, 20 1,20 l 1, 17 l, 15 1, 15 1, 15 !
0 I 65 0 I 64 0 I 81 3, 4 l, 09_ I 2 I 54 3 I 8 1, 7 2 I 78
0 I 99 1 I 2 l , 55 5 I 36 l , 56 1
1
4 I 01 2 I 42 3 I 0 5 I 3
7 4L 71 L l 23T I 519T l 45T 279T 180T 253T 37 4T I 0,014 0,014 0,019 I 0,02 1 0,018 0,025 0,017 0,019 0,017 t
·---- ·------- --··-- ------· ·------t------t---- r--------- - -----1 1
Yalin Theory ·- j i,
~ (rnm) 12 13 55 21 29 35 53 ! v*w(m/s) 0,015 0,014
22
0,039
1,28
l, 23
0, 149 0,054 0, 116 0, 175 0,078
0,26 0,64
0,28 0,65
I I· o, 120 I
el 2,46 2,63 0 I 37 0 r 89 0 I 57 0, 37 I. 2, 1 2, 18 o,39 o,88 I o,59 0,39
·--- --- 1----+----+------1----r------ --- --- ··--- --------
Bi jker Theor) ·-
/':, r(mm) 11 13
fl r(mm) 95 113
r (mm) 25 37
c 61 64
23
189
70
56
8
107
15
63
13
108
35
63
Us (m/s) 10,078 C,050 0,098 0,433 0,196 I
. v 7: we (m/]) 0,082 0,081 O, l 03 0,433 0, 139
e1 o,45 o, 45 o, 49 o, 13 o,34
b 1 o_, 4_7_J_.._o_,_47_--!..._ o ,_4~ o, 15 o, 36
8 9 10 8
103 99 133 108
16 21 22 15
60 62 64 73
0 I 52 1 , 04 0,479 0,354
0,319 0,485 0,297 0,354
l I· I I I
1-
1 I I
0 / 21 0 / 09 I 0 / 1 7 0 / 13 I o_,_23__1._o_,_10~/ __ o_,_19___,__o_,_15_.1
The abbreviations L and T afte r the Reyno lds number indicate laminar an d turbule nt boundary layers res pee ti ve ly.

88.
. . ' . .
1._·a_b_le_6_ . 3 __ c_a_l_cu l ated~nd EXper ime ntal Va l u e.:_::_~1 and b 1 - ~---- --·--- -----
el Values b1 Value s
Profile No. Yalin · Bi jker Exper imenta I Ya I in Bijke r Experime nta I
1 2,46 . 0,45 2,0 2, i 0, 47 2,3
2 2,63
I 0,45 2,6
3 i, 28 0,49 3,0
I 4 0,37 0, 13 i , 1
2, 18 0,47 2,8
i ,23 0, 49 3,2
0,39 0, 15 i, 0
5 0, 89 0,34
I 2,0
6 0,57 0,21 l , 1
I 7 0,26 0,09 0,9
0,88 0,36 2,3
0,59 0, 23 1, 3
0,28 0, 10 1, 0
8 I 0,64 0, 17 0,8 0,65 0, i 9 . 0,8
9 I 0,37 I 0, i3 l, 6 0,39 0, ]~-- 2,0
6. 3 Comments on Resu Its
A si gnificant di fference is observe d in the calculated and expe rimenta l va lues of e1 and b 1• As the value of bi is determine d from e 1, it can be co nside red to be dependant on e1. The va lue of ei is calculated from the fa ll ve locity on the pa rticle, vo n Karma n's coeffi ci e nt and the shear velocity. The fa ll velocity a nd von Ka rman's coefficient are practically constant for a ll the profiles,
· as the range of the representat ive sediment size , D50, is sma ll and varies betwee n 0, 130 mm and 0,210 mm as seen in Table 6.2. The smaller ca lculated values of e i thus indicate tha ·~ the bed shear stress is overes timate d, and if used to predict the distr ibut io n of suspended sed im e nt concen trations wi 11 res ult in lower re ference conce ntrations occurring at higher elevations above the be d.
The calculated resu lts in best agreement with the exper imenta l va lues were those o bta ined us ing the expression for shear strees in a laminar boundary la yer, . as quoted from Ya !in (33). Th e values were use d for Pro files 1 and 2.
The plot of HJ ve rsus Cr shows that the p lo tted points li e in a broa d band rather than T desc ribed by a single line. As the va lues of bl and e] a re dete rmined by drawing strai ght lines through experimen tal points, the order of accurac y is not ve ry high for the number of res ults ob ta ine d. In o rder to evalua te the values of bi and e l more accu rate ly, mo re samp les must be taken on a par ti cu lar verti ca I profile. The value use d fo r the e levation of the reference level above the sea bed was dete rm ined by theory only. The estimation of the width of the bed load the refore dete rm ines the reference con centra tions, and could result in a la rge scatte r of reference concentrations as de term ine d by the e 1 va lues for Profile 9. ' ·
. :,:

89.
A value of 2 x 10⁶ ppm by volume is obtained, which is impossible as the maximum concentration of close packed sand particles is approximately 0,52 x lo6 ppm, as given by Fleming and Hunt (38). A more reliable estimate of evaluating the thickness of the bed layer or elevation of the reference concentration is thus needed.
I 0 I 6 1-------'---------------------..,--;--.,,'-;-l ----------
1 I
1--------- ---.,.-- - - - ----- ---'---i----,---;---:------------ ---
0,5 1- -------'---- I I I
Hd
l7 i
- .. --i-+- ---- -----1 '
0,4 1-----------------------~--~ ----
(m/s)2
0 / 3 !-----'----
' I
I I I -- ------ -------+--,--,le--:------ - ---- - -
' I I
I t------,- ---.------.,-----------'---1'----"----- ----- - - -- -
0,2 1-------<-~----------------+-----l--+---'---------
0, l
0
x
l0-4
Hd
I ' I
)<
I )I( !
I
I I I I
I
1 1
--------
I 10-
Reference Concentration (ppm by volume)
Figure 6. 12 -=rz- versus Reference Concentration
J
-'
1

90
CHAPTER SEVEN
Conc lusion and Recommenda tions
Sampling of suspended sedi me nt concentrations was successfully carried out in the nearshore region unde r hig h wave conditio ns where sampling had not
previously been achieved.
The Mark I prototype sampler nee ded minor modifications and these were incorpora te d into the design of the Mark II samp ler . 1he main problem in the operation of this sys tem was the uneconomi cal use of a helicopter. The he licopters used had a lift ing capacity of greater tha n 1600 kg , whereas the sampl e r only weigh ed a max imum of 250 kg . The length of the li ft ing tackle used proved to be the dec iding factor for the power needed to ma nceuvre with the sampler e ffectively. The smaller he licopter was not equ ipped with a winch and thus a long lifting tackl e was needed.
The following re commendations a re made for the future use of a pump type sampler using a helicopter to place and ret rieve the unit :-
(a) The sampling unit must be kept as small and as li ght as possible, without sac rificing the submerged weight needed for stability of the sam p le r on th e be d.
(b) In order to use the sma lles t size helicopter available, a winch system must be used , able to be attached to the bottom of the he licopter. This wo uld re duce the pe ndu lum action of the unit a nd helicopter, and cut costs conside rab ly.
(c) To further achi eve a more economical use of the helicopter, a sampler sho :Jld inco rporate apparatus to sample at two e levations simultaneous ly. This may necessita te the power source needed for the pumps to be kept on the helicopter and fed by cable or a ir hose to the sam pling unit. This may result in problems in handling the unit, particularly if this power link becomes tangled with the lift ing rope.
Field operations using the Mark II sampler were noi· success ful due to the action of the litto ral currents and breakers on the rope causing significant forces to be generated in the rope which the winch system could not handle. The author believes that with more powerfu l equipment, the Mark II sampler would be able to be reasonably success ful under moderately low wave conditions.
The author concludes that for the field measurement of suspended sediment concentrations, the pump type sample r is the only type that can, at present, be used, unless major advancements are made in the development and calibration of the indire c t types, such a s sonic absorption.

91.
The system using a helicopJ·e r to p lace and retri e ve the instrument needs only a relatively simple sampling unit, a lthough the cost per samp le is high. Other systems proposed can reduce the cosl pe r sample, but cannot ope rate under as high a wave climate as that using the helicop l·e r.
Field results show a large r sca tl-er than that obtained in the laboratory, which is understandable as the conditions in the field are far more variable than those in care fully contro lled laboratory experiments. In orde r to evaluate the parameters needed for the eva luation of the reference co nce ntration, a larger number of rea dings is neede d for field meas urements than for laboratory measuremen ts.
The reference conce ntrations for pro files de term ined by fi e ld results a re used to calibrate sedime nt transport ·mode ls which evaluate the movement of sediment in areas influe nce d by coastal st ructures, The theory on which these models are base d is basically derived from those expressions determined for unidire ctional steady state flow. In o rder to e valuate the accuracy of the sediment transport
models and the values of the reference concentration used, extensive measurement of the sediment tra nspor t in the a reas under consideration should be conducted after the structure is completed. This would lea d to a better understanding of the complex phenome na controlli ng sediment transport in the coastal environment.

92.
APPENDIX 1
REFERE NCES
(1) BENNETT , J .P . "At- Stream-Ve loc ity Pu mp ing Sedime nt Sampling System ". Inst. of Ci vil Er.g., Jnl. of Hydr. Div. Ju ne 1973
(2) WENZEL, D. "Measuring Sand Discharge near the Sea Bottom 11•
Proc . of the 14th Int. Conf. on Coastal Engineering, Copenhagen, 1974,
(3) BASINSKI, T. a nd LEWANDOWSKI, A. "Field Measurement of Suspended Sediment ". Proc. of the 14th Int. Conf. on Coastal Eng ineering, Copenhagen 1974.
(4) WATTS, G. M. "Fie ld Investiga tion of Suspe nded Se diment in the Surf Zone''. Proc . of the 4th Int. Conf. on Coastal Engineer ing, Chicago, 1953.
(5) FAIRCHILD, J.C . "Longshore Transporl" of Suspended Sediment." Proc. of the 13th Int. Conf. on Coas ta l Engineer ing , Vancouver 1972.
(6) FUKUSH!MA, H. and KASHIWAM URA, M. "Fi e ld Investigation of Suspe nded Sed iment by the use of Bamboo Samplers". Coastal Enginee ring in Japa n, Volume 2, 1959.
(7) Department of O ceanography, Univers ity of Ca pe Town "Progress Reports on the Oceanographic Investigations for the Proposed ESCOM Nucl ear Power Station, Duynefon te in. 11 Ccrpe Town, 1969 to 1976.
(8) KENNEDY, J.F. and LOCHER, F.A. "Sed i r~e nt Suspens ion by Water Waves 11
• in Waves on Beaches and Resu/Hng Sediment Transport. Edited by R.E. Mayer. Academ ic Press, 1972.
(9) HOM-MA, M., HO RIKAWA, K., KAJIMA, R. "A Study on Suspended Sed iment due to Wave Action". Coastal Engineering in Japan, Volume 8, 1965.
(10) BIJ KER, E. "Longshore Transpo rt Computations". Proc. of the ASCE. Jnl. of Waterways, Harbours an d Coasta l Eng ineering Division, WW4, November 1971.
(11) HATTORI, M. "The Mechanics of Suspended Sedi ment due to Standing Waves". Coasta l Engineer ing in Japan, Volume 12, 1969,
(12) WATTS, G.M. "De velopment a nd Field Tests of a Sampler for Suspended Sed iment in Wave Ac tion". Technical Memorandum No 34 Beach Erosio n Board , March 1953.

93 .
(13) FUKUSHIMA, H. and KASHIWAMURA, M. "Some Experiments on Ba mboo Samplers. 11 Coastal Engineering in Japa n, Volume 4, 1961.
(14) HOM-MA, M. and HORIKAWA, K. "Suspended Se diment due to Wave Action". Proc. of the 8th Int. Conf. on Coastal Engineering, Mexico City, November 1962.
(15) SILVESTER, R. "Coastal Engineering, 111 Published by Elsevier 1974.
(16) MALLORY, Prof. J.K . , "Analysis of the Acquisition of Physical Oceanographic Data in the Nearshore Waters on the Open S. W. Cape Coast". Paper prese nte d at the lst l~terdisciplinary Conf. on Marine a nd Freshwater Research in Southern Africa, Port Elizabeth, July 1976 .
(17) KILNER, F.A. "Mea surement of Suspended Sediment in the Surf Zone." Proc. of the 15th Int. Conf. on Coastal Engineering, Honolulu, 1976.
(18) BRENNINKMEYER, B.M. "Mode and Period of Sand Transport in the Surf Zone. 11 Proc. o f the 14th Int. Conf. on Coastal Engineering, Copenhagen, 1974.
(19) JENSEN, J.K. and SORENSEN, T. "Measurement of Sediment Suspension in Combinations of Waves and Curren ts." Proc. of the 13th Int. Conf. on Coastal Engineering, Vancouver, 1972.
(20) 1 CRICKMORE,M.J. a nd AKED, R.F. "PumpSamplersforMeasuring Sand Transport in Tida l Waters. 11 Proc. of the Conf. on Instrumentation in Oceanography, Ba ngor, September 1975. ·
(21) DRAFT INTERNATIONAL STANDARD ISO/DIS 3716 "Liquid Flow Measurement in Open Channels - Functional Requirements' and Characteristics of Suspended Load Samplers. 1975 .
(22) DRAFT INTERNATIONAL STANDARD ISO/DIS 4363. "Liquid Flow in Open Channels - Methods for Measurement of Suspended Sediment."
(23) GoHREf'..I, H. and LAUCHT, H. "Instrument for Long-Term Measurement of Suspended Matter (Si It Gauge)". Proc. of the 13th Int. Conf. on Coastal Engineering, Vancouver, 1972.
(24) COLLINS, M.B. "Suspended Sediment Sampling Towers as used on the Intertidal Flats of The Wash, Eastern England. 11 Estuarine and Coastal Marine Science, Volume 4, 1976.
" (25) COLLINS, B.P. "Suspended Material Transport: Narragansett Bay
Area, Rhode Island. 11 Estuarine and Coastal Marine Science, Vol 4, 1976.

94.
(26) GIBBS, R.J. "Principles of Studying Suspended Ma te ria ls in Wa te r." from Suspended So li ds in Water . Edited by R. J. Gi bbs, Marine Science, Volume 4, 1974. Plenum Press, New York.
(27) HOM-MA, M. and HORIKAWA, K. "A Labora tory Study on Suspended Sediment due to Wave Actio n ." Proc. of the l 0th Cong. of the Int. Associatio n of Hydraulic Research, London, 1963.
(28) HORIKAWA, K. and WATANABE, A. "Turbulence and Sedime nt Concentrations due to Waves. 11 Coastal Engineering in Japan, Volume 13, 1970
(29) BHATTACHARYA, ~. K ., GLOVER, J.R. an d KENNEDY, J.F. "An Electro -op tical Probe for Measurement of Suspended Sedime nt Concentration. 11 Proc. of the 13th Congress of the Int. Associa tion fo r Hydraulic Research, Kyoto, Japan, 1969.
(30) BHATTACHARYA, P. K. and KENNEDY, J. F o "Sediment Suspension in Shoaling Waves. 11 Proc. of the 14th Cong. of the Int. Association of Hydraulic Research, Paris, 1971.
(31) NAKATO, T., GLOVER, J.R., LOCHER, F.A. and KENNEDY, J . F. "Characteristics of the Io wa Concentration Measuring System. 11 Proc. of the 15th In. Conf. on Coastal Engineering , Honolulu, 1976.
(32) SWART, D. H. "Sediment Transportation in the Coasta I Envi ronment." Lecture Notes presented at the ECOR course, Port Eli zabe th, June 1976.
(33) YAUN, M.S. "Theory of Hydraulic Models." Macmillan 1971.
(34) WIEGEL, R.L. "Oceanographic Engineering." Prentice-Hall, 1964.
(35) MUIR WOOD, A.M. "Coastal Hydraulics." Macm i llan, 1969.
(36) EINSTEIN, I-I.A. "A Basic Descrip tion of Sedi ment Tra nsport on Beaches". fro m "Waves on Beaches a nd Resulting Sediment Transport. 11
Edited by R.E. Meyer, Academic Press, New York a nd London, 1972.
(37) YAUN, M.S. "Mechanics of Sediment Transport." Pergamon Press, 1972.
(38) FLEMING, C.A. and HUNT, J.N. 11Applicat·ion of a Sediment Transport Model. 11 Proc. of the 15th int. Conf. on Coastal Engi nee ring, Honolulu, 1976.
(39) FLEMING, C.A. and HUNT, J.N. 11A Mathema tical Sediment Transport Model for Unidirectional Flow." Proc. of the Inst. of Ci vi I Enginee rs, Part 2, June 1976.
95.
(40) U.S.AR MY COASTAL ENGINEERING RE SEARC H CENTRE. "Shore Protection Manual, Volumes l to3." U.S. Governme nt Printing Office 1975
(41) LANDO N, G. · Undergraduate Thes is No. 28. "Suspended Sediment."
(42)
Departme nt of Civil Enginee ring, Univers ity of Cape Town 1976
TIMOS HE NKO and G ERE McGraw-Hill, 1961
"Theory of Elastic Stability."
(43) BAKER, KOVALEVSKY and RISH. "Structura l Analysis of She lls." Mc Graw- Hi II, 1972.
(44) ANDE RSON, D. L. Un de rgraduate Thesis No. 35 "Suspe nded Sedimen t in the Field." Department of Civil Engineering, University of Cape Town, 1975.
(45) MYERS, HOLM and McA LLISTER. "Handbook on Ocean and Underwater Engineering ." McGraw-Hi 11.
(46) CROSSWELL, S.F. Undergradua te Th esis No. 36 "The Measurement of Suspended Sedi men t due to Wave Action in the Laboratory." Department of Ci vil Eng ineer ing, University of Cape Town , 1975.
(47) SOUTH AFRICAN TIDE TABLES, 1976. Published by the Hydrographer, South African Navy, . You ngsf ie Id, Cape.
(48) BOSMAN, D.E. -"A Case Study of a Coastal Project: Cooling Water In take of Koe berg Nuclear Powe r Station. 11 Lecture given at the ECOR course, Port Elizabe th, July 1976.
(49) LAZARUS, J . H. 11 Hydra ulic Transport of Solids in Pipelines." Course CE 511, Departmen t of Ci vi I Engineering, University of Cape To wn , 1975.

96.
APPENDIX 2
List of Sl'mbols
Co-ordinate System
x offshore - onshore
y verti ca I from bed
z longshore
d water depth
D particle diameter
a amplitude of orbita l motion (horizontal}
A hori zontal diameter of orbital motion
w angular velocity
v l(i11&11J1C,, viscosity
/J.. absolute viscosity
Ks sand roughness
c volumetric concentration
w fa II velocity
Prandtl mixing length
1 ~ - dimensionlus _, ht above sea bed
k Von Karm~'s coeffi cient
v* shear velocity
~ density
t shear stress
Y specific weight
g acceleration due to gravity
r elevation of reference level
lJ. r ripple height
>.. r ripple length
S boundary layer th ickness
U · 1rbital velocity
C Chezy coefficient
n Manning coefficient

1000, 8 6
5 4 3
2
100, 8
c 6 5
ppm by 4
Volume 3
2
10 1 8 6 5
4 3
2
1
1000, e. 6 5 4 3
2
100 1 8
c 6
ppm by 5 4
Volume 3
2
10 1 8 6 5 4 3
2
1
97.
Fi gure Al : Profil e No.
.___ ,__
\
...
, 2
0, l
·'
1--. ~- - --- 1-- 1- -
-
,\
I\ \
~
l \,
\ 345681
l , 0
x -, I
I I - v
ii
[/
h~
I
I
I/ I
I/ IX
II
- 1-
- - -
L-
-
. -
2 3 4 56 8 1
10 y (m)
I
,-l-
=!- -
2 345681
1 2 345681 2 345681 2 345681 l 10 100
d-z y
b = 2, 3 Cr = 12000 ppm el = 2, 0

c ppm by Volume
c ppm by Volume
98.
Fi gure A2 Profile No. 2
100 1
8 6
' -1: -, -· , __ -! - - - - ,_ ,__ -
r 5 4 3
-\ '-e--\
I
2
\ x
t-
10 1 >---8 _ ,_ 6 J
5 4
3
2
1
~ \ -
8 6 5
4 3
2
1 1 2 345681
l, 0 0, l
100, 8 6 5 4 3
2
10 1 8 6 5 4 3
2
1 8 6 5 4 3
2
1 1
l
I v
-- ' !X v
2 34 5681 10
" I
I
I
\
~ - ~- --
2 3 4 56 8 1
10 y (m)
I
I
I I IV
x I v
I
-
2 3 4 s6 a ,
d-y 100
y
2 345681
-
2 34 566 1
b1 = 2, 8
Cr = 15000 ppm
e] = 2,6

99.
Fi gure A 3 Profile No. 3. - - -·----1000 , .
8 6 5 4 3
.--~-E= 1-RJ --. . - - ,___·--I---- --- ··- -
c ppm by
Volume
2
l 00 , 8
3
2
10 1 8 6 5
4 3
2
,
- ---· ------ -·
>---·- --
---- >---
-
-
-·- - - - >---- ·
- ··
-- ,_
I
·- +--
1 ·
_ii ~-
I
\ ---\ --
I
-~ --~
\. I
' \
--, ' - 1 -
\ ~ \
\
\
--· -
,__
I
1 2 34568 1 2 3 4 56 6 1 2 3 4 5 6 8 1 0, 1 1, 0 y (m) 10 bl = 3, 2
l 000 1
B 6 5 4 3
2
100, 8 6
c 5
ppm by 4
Volume 3
2
10 , B 6 5 4 3
2 ,_ __
1 1 1
~--1-I
I -I >---- -
I I I
I I
ti ~ ·,
:!
I I v
--L l I
x I
-· -
I 2 34 56 8 1
10
-
·- -
I
I ~ 2 3 4 56 B 1 2 3456~1
d - y 100
y
Cr = 30000ppm
el = 3,0

1000 1
8 6 5 4 J
2
100, 8
c 6
ppm by 5 4
Volume .3
2
10 1
8 6 5
4 3
2
1
1000, e 6 5 4 3
2
100 1
c 8
ppm by 6 5
Volume 4
3
2
10, 8 6 5 4 3
2
100.
Fi gure A4 : Profile No. 4
I\..
""-~
'
'
I\.. '
""' x ~ ""-1 2 345681 2 3 4 56 6 1 0, l 1, 0
y (m) 10
/
/
v /
v - ·
// 1,,7<.
- - --' v v -
/
/ /
v 2 34 5681 2 3456Sl
10 _:l_:r
100
y
2 345681
2 345631
b1 = 1,0
Cr = 2600ppm
el = 1, 1

1000 1 I
B 0 5 4 3 x
2
100 1
8 c 0
ppm by 5
Volume 4
3
2
10 1
8 6 5
4 3
2
1000 1
B 6 5 4 3
2
100, 8
c 6 ppm by 5
Volume 4
3
2
10 , 8 6 5 4 3
2
1 1 2 l
101.
Fi gure A5 : Profile No. 5
\ I
\
\ I -
\ \
\
' p
\
\
3456S1 1, 0
A
~I I
I
I f
I x
/ I
"'· ...L
3 4 5 6 8 , 10
I
,_
2 3 4 56 8 ,
y (m) 10
I v
I X
2 3 4 56 8 1
_d....:.L y
100
-
2 345681
2 345661
b1 = 2,3
Cr = 40 000 ppm e1 = 2,0

102.
Figure A6 Profile No. 6
l 000 1
8 6 5 4 3
2
l 00 1 8
c 6
ppm by 5 4
Volume .3
2
\.
\.
'" ~
\
[\ 10 1 ~ '·,
8 ' 6 5
- r.
4 3
2
''\,
'\ ~
1 1
0, l 2 3 4 5 6 8 1 2 3 4 56 8 1 2 345681
b1 = l, 3 l, 0 lO y {m) Cr= 6900ppm
e1 = l , l
10001 8 6 5 4 3
2
100 1
c 8
ppm by 6 5
/
/ v
Volume 4
3
2
/
/ v
v
10 1 ~ v~
, e
/ /
-- -6 /
5 4
/ .,V
3
2
7
/ v
1 1 2 34 5681 2 345681 2 345681 l 10 100

10001 8 6
5 4 3
2
100, 8
c 6 ppm by 5
Volume 4
.3 ' "" "' 2
10 1
' ""' ~
8 6 5
4 3
2
1 1 2 3 4 0 I l
l 000 1
fl>
6 5 4 3
2
100 1 8
c 6 ppm by 5
Volume 4
3
2
10 1 8 6 5 4 / 3 ~/ /
/ 2 /
v
103.
Figure A 7 : Profile No. 7
-
' ' ' ,,
I'-. !',
~
v
"" "- .
"' "" ' 5 6 s 1 2 3 4 56 8 1 1, 0
y (m) 10
v
/
/
/ ;/
-
/
/ .K
1 1 1
2 34 5681 2 3 4 56 e 1 10
.i:.l 100
y
2 345681
b1 = l, 0
c = r 7500ppm
e1 = 0,9
2 3456~1

1000 1
8 6
5
'• 3
2
100 1 8
c 6 5
ppm by 4
Volume .3
2
101 8 6 5
4 3
2
1
l 000, e 6 5 4 3
2
l 00 1 8
c 6
ppm by 5
Volume 4 3
2
10 1 8 6 5 4 3
2
I
104.
Figure A 8 : Profil e No. 8
-
-
-
--.._
' -
""'
1 2 0, 1
I /
---:;::r /
1 l
2
/
' '"' " ' r-
~
-
3 4 5 6 s , l, 0
-
v L/ <
/
/
I
-
3 4 5 6 8 1 10
,_
' '
' ' ,
" ' "'
' '
2 3 4 56 8 1
10
/
:/
/ )r
- >--·
' ... -·
2 31.5681
d·-: y 100
y
2 345681 b - 0,8 l -
C= r 7500ppm
e = 1 0,8
I I-
2 3456&1

l 05.
Figure A 9 : · Profile No. 9
1000 , - -
8 - -6 - ·-~ - -5 -·--- - -- -'-
4 3
2
100, 8 \
6 \
c 5
ppm by '· Volume .3
I\ \
I\ 2 \
~·
101 \
8 /
6 5
,, \ \ 4
3 ~
c ppm by Volume
2
1 l 1 2 345681 0, l 1,0
1000 1
e 6 5 L,
3
2
100, 8 6 5 4
3
2
10, 8
"' I
6 5 L 4 3
2
, 1
1
I
I -
I
I
I
I 2 34 5681
10
/
- ·
-
\
I\ 2 3 ,, 56 8 ,
y (m) lO
I
I I
I I
I I
2 3 4 56 8 1 100
--·
2 345681
2 345681
b1 = 2, 0
Cr= 370000ppm
e1 = 1,6

106.
APPENDIX 4
Additional Course Work Completed
Additional Course Work completed by the author for fulfilment of the remaining requirements for the degree of M.Sc. (Eng) is given below:-
Year Course Credit Ratin~
1975 CE 516 Prestressed Concrete 5
1975 CE 522 Aquatic Chemistry 10
1975 CE 525 Coastal Engineering 5
2 0 DEC 1978