the factors in completion, non-completion, and non
TRANSCRIPT

THE FACTORS IN COMPLETION, NON-COMPLETION, AND NON-
PARTICIPATION IN FARMER FIELD SCHOOLS IN TRINIDAD AND
TOBAGO
A Dissertation
by
SAMUEL NEAL GOFF
Submitted to the Office of Graduate Studies of Texas A&M University
in partial fulfillment of the requirements for the degree of
DOCTOR OF PHILOSOPHY
May 2008
Major Subject: Agricultural Education
THE FACTORS IN COMPLETION, NON-COMPLETION, AND NON-
PARTICIPATION IN FARMER FIELD SCHOOLS IN TRINIDAD AND
TOBAGO
A Dissertation
by
SAMUEL NEAL GOFF
Submitted to the Office of Graduate Studies of Texas A&M University
in partial fulfillment of the requirements for the degree of
DOCTOR OF PHILOSOPHY
Approved by:
Chair of Committee, James R. Lindner Committee Members, James E. Christiansen Charles T. Hallmark Timothy H. Murphy Head of Department, David W. Reed
May 2008
Major Subject: Agricultural Education

iii
ABSTRACT
The Factors in Completion, Non-Completion, and Non-Participation in Farmer Field
Schools in Trinidad and Tobago. (May 2008)
Samuel Neal Goff, B.A., Baylor University;
M.S., Texas A&M University
Chair of Advisory Committee: Dr. James R. Lindner
The purpose of the study was to identify and analyze factors affecting completion,
non-completion, and non-participation in five Farmer Field Schools (FFS) administered
by the Ministry of Agriculture, Lands, and Marine Resources (MALMR) of Trinidad and
Tobago.
The research objectives used to accomplish the purpose of this study focused on
the relationship between participation status and 1) personal characteristics, 2)
individuals’ motivations for participation, 3) perceptions about selected farming
practices, 4) individuals’ priority rankings of their sources of information regarding
farming practices, 5) the deterrents to participation, and 6) perceptions of the usefulness
of competitions as a means for increasing the popularity of FFS.
This study employed an ex post facto, causal comparative research design. Three
instruments were developed. The sample population (N=109) consisted of farmers
classified as FFS completers (n=56), non-completers (n=15), and non-participants
(n=38). Data were gathered from late May to late September 2007.
Individuals with a greater number of participating friends are more likely to
complete the program FFS completers 1) were more driven by social reasons to

iv
participate in FFS than were non-completers, 2) possessed a greater concern for the
environment than did non-completers, 3) had higher expectations than did non-
completers that participation in a FFS would improve their occupational performance and
status, 4) more likely than non-completers to be willing to take on the financial risks
involved in the adoption of IPM on their farms, 5) believed more strongly than did non-
completers that IPM is compatible with agricultural practices and the market in Trinidad
and Tobago. Completers most highly value the information received from MALMR
whereas the non-completers and non-participants most highly value information received
from the agro-shops. Completers vs. non-completers and non-participants held widely
divergent views on the deterrents to participation in FFS.
The contribution of this study to the field of agricultural and extension education
is that policymakers and practitioners may use the information herein to employ
strategies that impair or eliminate the factors leading to attrition and non-participation,
thus making programs more accessible, prevent attrition, and may decrease farmers’
expenditures on pesticides, and increase income.

v
DEDICATION
This dissertation is dedicated to my family. I would first like to thank my wife,
Kylah Clark-Goff, for her support, encouragement, and willingness to take on a blitzkrieg
approach to higher education and raising a family. Four years, three degrees, two
children! I am amazed at how well you have been able to multi-task your academic and
familial responsibilities over the last four years while also leaving room for me to pursue
my studies. You are, without a doubt, far more of a friend and wife than I could have
ever hoped for. The words “thank you” somehow seem inadequate. I look forward to
seeing how you and I will put our academic backgrounds into practice.
Mo and Madeleine: you bring immense joy to my life. Breaks from my work in
the evenings to play with you kept me sane. You, like your mother, have made sacrifices.
Your smiles, kind words, and desire to play stimulated me to complete my work so I
could be home with you.
Thank you, Mom, Dad, and Gary, for believing in me all along the way. You
have shown me what is truly important in life. Keith, Vicki, Cullen, and Kara, I could
not have married into a better extended family!
A million thanks to all of you. To you, I dedicate this work.

vi
ACKNOWLEDGEMENTS
To my advisor, Dr. Lindner, I would like to express my sincere gratitude for your
support and guidance throughout my graduate studies at Texas A&M University. Your
suggestions have always challenged me to give my best effort every day. Your
contributions to my academic development have made the last four years productive and
enjoyable.
I would also like to thank Dr. Christiansen, Dr. Hallmark, and Dr. Murphy for
serving on my committee. Your valuable feedback and support encouraged me to persist
to the end. I greatly value the depth and breadth of your insights and experience.
This research would not have been possible without the support of Dr. David
Dolly of the University of the West Indies. I thank Dr. Dolly for his availability to
establish my dissertation study and host Dr. Lindner and me on several occasions. Your
commitment to provide agricultural and extension education to the small-scale farmers in
Trinidad and Tobago is an inspiration.
I would also like to thank Ms. Phillippa Ford, the Permanent Secretary of
Agriculture at MALMR, and Ms. Pauline Dowlath of MALMR for granting permission
to conduct the study.
Finally, I express my appreciation to the farmers who kindly participated in this
research and provided the information for this dissertation.

vii
TABLE OF CONTENTS
Page ABSTRACT....................................................................................................................... iii DEDICATION.....................................................................................................................v ACKNOWLEDGEMENTS............................................................................................... vi TABLE OF CONTENTS.................................................................................................. vii LIST OF TABLES...............................................................................................................x LIST OF FIGURES ......................................................................................................... xiii CHAPTER I INTRODUCTION.............................................................................................1 Statement of the Problem.............................................................................6 Purpose and Objectives of the Study ...........................................................8 Theoretical Framework..............................................................................11 Significance of the Study ...........................................................................12 Methodology..............................................................................................13 Definition of Terms....................................................................................16 Abbreviations.............................................................................................18 Assumptions...............................................................................................18 Delimitations..............................................................................................19 Limitations .................................................................................................19 II LITERATURE REVIEW...............................................................................21
Agricultural and Extension Education .......................................................21 Extension Modalities .................................................................................25 Farmer Field Schools as a Modality for Agricultural Extension ...............28
Theories of Adult Learning Applicable to FFS .........................................36 Research on Motivation and Participation in Adult Education .................39 Studies on Participation in FFS..................................................................43
The Context of Trinidad and Tobago.........................................................46

viii
CHAPTER Page III METHODOLOGY .......................................................................................56 Research Design.........................................................................................58 Population and Sample ..............................................................................59 Instrument Development............................................................................61
Data Collection ..........................................................................................66 Data Analysis .............................................................................................68 Summary of the Chapter ............................................................................73
IV RESULTS AND FINDINGS........................................................................74 Demographics of the Five Farmer Field Schools ......................................74 Objective 1: Personal Characteristics ........................................................78 Objective 2: Motivations for Participation ................................................85 Objective 3: Farming Practices..................................................................91 Objective 4: Priority Rankings of Sources of Information ......................108 Objective 5: The Deterrents to Participation ...........................................113 Objective 6: Competitions .......................................................................128 V SUMMARY, CONCLUSIONS, AND RECOMMENDATIONS..............132
Statement of the Problem.........................................................................132 Purpose and Objectives of the Study .......................................................133 Summary of the Methodology .................................................................136 Key Findings, Conclusions, Implications, and Recommendations for Future Practice...............................................141 Objective 1: Personal Characteristics ......................................................141 Objective 2: Motivations for Participation ..............................................143 Objective 3: Farming Practices................................................................148 Objective 4: Priority Ranking of Sources of Information........................153 Objective 5: Deterrents to Participation...................................................156 Objective 6: Competitions .......................................................................161 Recommendations for Future Research ...................................................163 REFERENCES ................................................................................................................167 APPENDIX 1 CONSENT FORM.................................................................................180 APPENDIX 2 Participants at the Beginning of the Educational Cycle.........................181 APPENDIX 3 Completers and Non-Completers...........................................................183 APPENDIX 4 Non-Participants.....................................................................................186

ix
Page VITA ..............................................................................................................................189

x
LIST OF TABLES
Page TABLE
1 Tests of Instrument Reliability (N=109) ..........................................................70
2 Personal Characteristics of Respondents in Transfer Village FFS (n=30) ......75
3 Personal Characteristics of Respondents in La Trinidad FFS (n=22)..............75
4 Personal Characteristics of Respondents in Grand Fond FFS (n=16) .............76
5 Personal Characteristics of Respondents in Cemetery Trace FFS (n=14).......77
6 Personal Characteristics of Respondents in Platanite FFS (n=27) ..................77
7 Distribution of Personal Characteristics by Participation Status (N=109) ......80
8 Analysis of Variance: Participation Status and Personal Characteristics (N=109) ............................................................................................................83
9 Post Hoc: Number of Friends Who Have Participated in FFS by
Participation Status ..........................................................................................84
10 Post Hoc: Age by Participation Status .............................................................84
11 Chi-Square Tests: Personal Characteristics by Participation Status ................85
12 Completers’ (n=56) and Non-Completers’ (n=15) Motivations for Participation in FFS .........................................................................................87
13 T-tests: Completers’ (n=56) and Non-Completers’ (n=15) Motivations
for Participation in FFS....................................................................................90
14 Completers’ (n=56) and Non-Completers’ (n=15) Perceptions of Selected Agricultural Practices at the Beginning of the FFS .....................92
15 T-tests: Completers’ (n=56) and Non-Completers’ (n=15) Perceptions
of Selected Agricultural Practices at the Beginning of the FFS ......................94
16 Completers’ (n=56) and Non-Completers’ (n=15) Perceptions at the End of the FFS of Selected Agricultural Practices ..........................................96

xi
TABLE Page
17 T-tests: Completers’ (n=56) and Non-Completers’ (n=15) Perceptions of Selected Agricultural Practices at the End of the FFS.....................................99
18 Comparison of Completers’ (n=56) Perceptions of Selected Agricultural
Practices at the Beginning and End (Pre/Post) of the FFS.............................101
19 Comparison of Non-Completers’ (n=15) Perceptions of Selected Agricultural Practices at the Beginning and End of the FFS .........................102
20 Non-Participants’ (n=38) Perceptions on Selected Agricultural Practices ....104
21 Analysis of Variance: Perceptions of Selected Farming Practices and
Participation Status (N=109)..........................................................................107
22 Post Hoc: Perceptions on the Use of Pesticides in Farming by Participation Status (N=109)..........................................................................107
23 Post Hoc: Perceptions on Financial Factors by Participation
Status (N=109) ...............................................................................................108
24 Post Hoc: Perceptions on the Compatibility of IPM with the Social Setting by Participation Status (N=109) ........................................................108
25 Completers’ (n=56) Priority Ranking of Their Sources of Information
at the Beginning of the FFS ...........................................................................109
26 Completers’ (n=56) Priority Ranking of Their Sources of Information at the End of the FFS .....................................................................................110
27 Non-Completers’ (n=15) Priority Ranking of Their Sources of
Information at the Beginning of the FFS .......................................................111
28 Non-Completers’ (n=15) Priority Ranking of Their Sources at the End of the FFS.......................................................................................................112
29 Non-Participants’ (n=38) Priority Ranking of Their Sources of
Information ....................................................................................................113
30 FFS Completers (n=56): Factors Impacting Participation.............................115
31 FFS Non-Completers (n=15): Factors Impacting Participation.....................118
32 FFS Non-Participants (n=38): Factors Impacting Participation ....................121
xii
TABLE Page
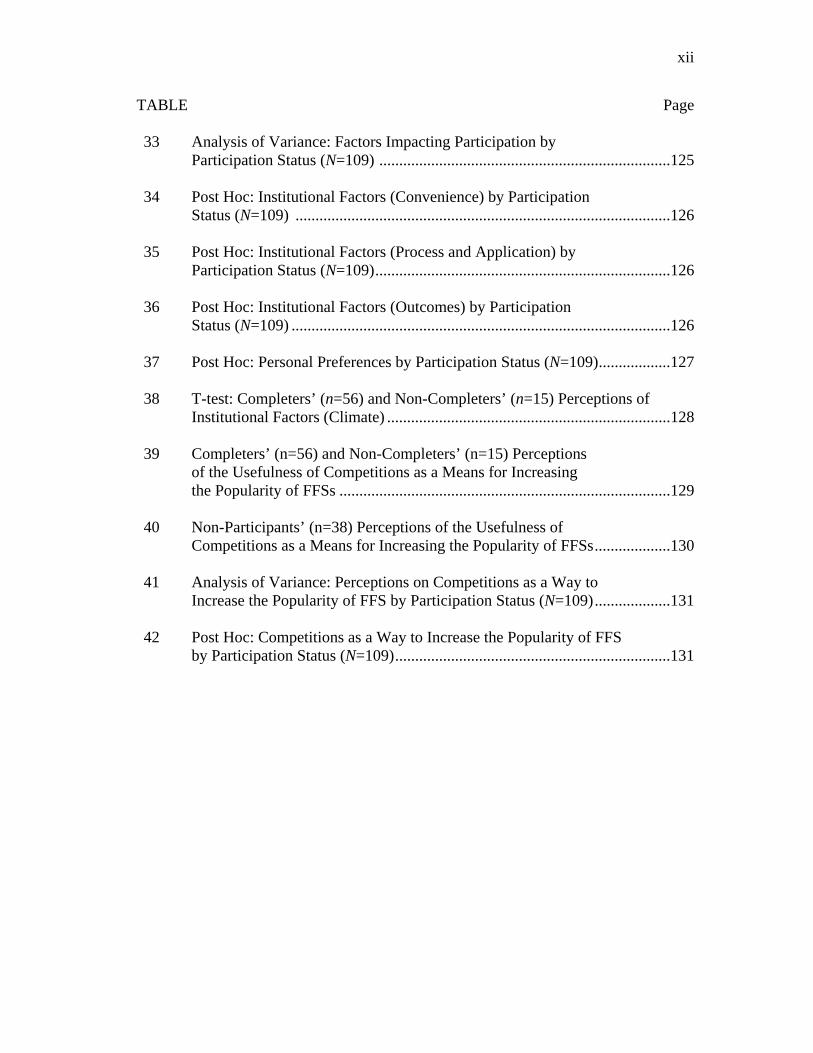
33 Analysis of Variance: Factors Impacting Participation by Participation Status (N=109) .........................................................................125
34 Post Hoc: Institutional Factors (Convenience) by Participation
Status (N=109) ..............................................................................................126
35 Post Hoc: Institutional Factors (Process and Application) by Participation Status (N=109)..........................................................................126
36 Post Hoc: Institutional Factors (Outcomes) by Participation
Status (N=109) ...............................................................................................126
37 Post Hoc: Personal Preferences by Participation Status (N=109)..................127
38 T-test: Completers’ (n=56) and Non-Completers’ (n=15) Perceptions of Institutional Factors (Climate) .......................................................................128
39 Completers’ (n=56) and Non-Completers’ (n=15) Perceptions
of the Usefulness of Competitions as a Means for Increasing the Popularity of FFSs ...................................................................................129
40 Non-Participants’ (n=38) Perceptions of the Usefulness of
Competitions as a Means for Increasing the Popularity of FFSs...................130
41 Analysis of Variance: Perceptions on Competitions as a Way to Increase the Popularity of FFS by Participation Status (N=109)...................131
42 Post Hoc: Competitions as a Way to Increase the Popularity of FFS
by Participation Status (N=109).....................................................................131

xiii
LIST OF FIGURES FIGURE Page 1 Map of Trinidad and Tobago ...........................................................................46 2 Conceptual Framework: The Factors in Completion, Non-Completion,
and Non-Participation in Five Farmer Field Schools in Trinidad and Tobago, 2007 ...................................................................................................55

1
CHAPTER I
INTRODUCTION
Trinidad and Tobago’s economy is heavily dependent on oil and gas industries
(Central Statistical Office, 2008). The energy sector contributes 40% of GDP and 80%
of exports, yet only employs 5% of the population. In contrast, the contribution of
agriculture to Trinidad and Tobago’s GDP is 0.6% (Central Intelligence Agency, 2008),
a decline from 5% of GDP in 1985 (Seepsersad, 2003). The agriculture sector, however,
employs 9.5% of the population (Central Intelligence Agency, 2008). Trinidad and
Tobago is a net food importer; in 1999, the value of food imports exceeded the value of
food exports by 181%. As a result, national and household food security is a source of
concern. Gradually reversing the trend from three decades ago, the majority of
agricultural production is for local sale and consumption rather than for export. The
country’s farmers produce “most of its requirements for vegetables” (Seepseerad, 2003,
p.6).
Despite producing the majority of the vegetables needed for domestic
consumption, it has been noted (Dolly, 2005) that farmers’ indiscriminate use of
pesticides caused great harm to human health, the environment, and unduly raised the
costs of inputs. Ramroop, et al. (2000) observed that
It is not uncommon for farmers to use combinations of pesticides, often referred
to as “cocktails.” The “cocktails” can at times contain up to 4 or 5 pesticides and
__________________ This dissertation follows the style of the Journal of International Agricultural and Extension Education.

2
this is applied between one and seven times weekly. The recommended dosages
are usually not adhered to, safety intervals before harvest not observed, and there
is poor storage of pesticides. (p. 65)
The misuse of pesticides in Trinidad and Tobago was chronicled as far back as
the mid-1980s. Phillips-Flanagan’s (1986) study on the indicators of pesticide illiteracy
among Trinidad’s small-scale farmers showed that though the farmers had been using
pesticides for several years, some as many as fifteen years, their knowledge of the
hazards or toxicity was low to non-existent. She reported that pesticide illiteracy was
found in three areas: “the knowledge of hazards or toxicity of the pesticides being used,
the knowledge of safe mixing and application practices, and the knowledge of the
necessary protective clothing” (p. 1).
From 1997 to 2000, the Hibiscus Mealy Bug (HMB), a highly invasive pest
species from Asia, threatened food security in the region by destroying many food crops
(Caribbean Agricultural Research and Development Institute, 1997; Dolly, 2005). The
crop protection services of the various ministries of agriculture in the Caribbean
attempted unsuccessfully to control the HMB with routine pesticide applications.
Ultimately, the introduction of biological parasites contained the spread of HMB and
restored food crop cultivation. This experience highlighted the value of pest
management systems that did not rely solely on chemical pesticides.
It is in this context that the Farm Management and Extension Service of the
Ministry of Agriculture, Lands, and Marine Resources (MALMR) of the Government of

3
Trinidad and Tobago established the Farmer Field Schools (FFS) to introduce integrated
pest management (IPM) technologies. The objective of the IPM approach is to use
comprehensive information on the life cycles of pests and their interaction with the
environment in combination with pest control methods that are economical and cause
minimal harm to people and the environment (van den Berg, 2004). Thus, through the
FFS educational program, MALMR seeks to improve farmers’ capacities for critical
analyses, decision-making, and stimulating innovation for increased agricultural
productivity while also safeguarding human health and the environment. FFS, a popular
contemporary model for agricultural extension, is a hands-on, experiential, participatory
approach to teaching farmers about the ecology of their fields (Gallagher, 2003). Central
to the approach is the emphasis on teaching farmers not only the “how” but also the
“why” of agro-ecological systems.
In 2000, the Commonwealth Agricultural Bureau International (CABI)
introduced the Farmer Field School (FFS) initiative to the Caribbean (Dolly, 2005). In
2003, the Trinidad and Tobago Ministry of Agriculture Lands and Marine Resources
(MALMR) and CABI introduced FFS in two locations, in the Caura Valley and South
Aranguez. As of January 2008, MALMR has carried out FFS in over thirty locations in
Trinidad and Tobago (David Dolly, personal communication, January 2008). MALMR
is using FFS as the vehicle for teaching farmers the principles and practices of integrated
pest management (IPM) for vegetable production targeted for the local market.
The FFS approach to agricultural education and extension was developed by the
Food and Agriculture Organization of the United Nations (FAO) in 1989 (van de Fliert,

4
1993). The approach was designed as a hands-on way of diffusing knowledge-intensive
integrated pest management principles and practices for East Asian rice-based systems.
According to Tripp, Wijeratne, and Piyadasa (2005), the “defining characteristics of FFS
include discovery learning, farmer experimentation, and group action” (p. 1707).
Pontius, Dilts, and Bartlett (2000) posit that four principles are the basis for any FFS
focused on teaching IPM: (1) grow a healthy crop, (2) conserve natural enemies, (3)
conduct regular field observations, and (4) farmers become IPM experts.
The purpose of FFS was to enable farmers to engage in decision-making
processes on the ecology of their own fields by improving their analytical and decision-
making skills. Agro-ecosystems analysis (AESA) is the discovery-learning
methodology taught in FFS (Feder, Murgai, & Quizon, 2004a). The intent of the AESA
approach is to discontinue dependency on pesticides as the primary pest-control
measure. To achieve this, farmers needed to understand the ecological principles and
processes governing pest population dynamics.
FFS groups are generally composed of 15-25 farmers who meet once a week in a
designated field throughout the crop cycle. Farmer experimentation plays a critical role
in FFS. Using AESA to understand pest population dynamics, farmers observe the
processes and relationships between the harmful insects and their natural enemies in two
plots, one using conventional practices and the other IPM practices. Farmers then draw
their observations on flip-chart paper and discuss them. The FFS facilitator, usually an
extension agent or NGO staff member, takes particular care to not provide answers
through lectures, but to stimulate the farmers to ask questions and find their own

5
answers. FFS facilitators build group dynamics through activities designed to foster
group action (Tripp, Wijeratne, & Piyadasa, 2005). FFS provide opportunities for
farmers to learn-by-doing, based on the principles of non-formal and vocational
education. Extension agents and farmer-trainers facilitate the learning process,
stimulating farmers to discern key agro-ecological concepts and develop skills through
experiential learning in the field (Braun, Thiele, & Fernandez, 2000).
Extension practitioners and academics have noted the effectiveness of FFS for
the transmission of agricultural knowledge. In a study of rice-farmers in the Philippines,
Rola, Jamias, and Quizon (2002) found that FFS graduates possessed greater knowledge
of integrated pest management than their non-FFS peers and that graduates retained their
field school knowledge. In recent years, extension agencies have expanded FFS to
include in its curriculum other topics relevant to resource-poor farmers. In a study on
the effectiveness of FFS for soil and crop management technologies in Kenya, Bunyatta,
Mureithi, Onyango, and Ngesa (2006) found that FFS graduates acquired high to very
high levels of knowledge of the technologies presented in comparison to non-FFS
farmers. David (2007) noted that FFS graduates in Cameroon acquired “superior
knowledge on cocoa-integrated crop and pest management generally compared to non-
FFS farmers” (p. 35). The results of a study on FFS pilot projects in three South
American countries showed that FFS-trained farmers, compared to other farmers,
acquired increased knowledge on diseases affecting potatoes (Thiele, Nelson, Ortiz, &

6
Sherwood, 2001). FFS, a non-formal adult education program, holds great potential as a
vehicle for the dissemination of agricultural knowledge and practice.
Every year millions of adults enroll in adult education programs (United Nations
Educational, Scientific, and Cultural Organization, 2000). These programs may range
from vocational training, including agricultural extension programs, to basic education
classes, to sports and recreational classes. Adults’ motivations for participating in adult
education are as diverse as the lives they lead (Silva, Cahalan, & Lacireno-Paquet,
1998). Moreover, there are many adults, who despite the educational programs provided
in their communities, either do not complete the educational programs or chose to not
participate at all. It is widely believed by adult education theorists and practitioners that
program non-completers and non-participants would benefit from completing the
educational programming (Darkenwald & Gavin, 1987; Garrison, 1988; McGivney,
1993). As a result, a great deal of research (Burgess, 1971; Carp, Peterson, & Roelfs,
1974; Cross, 1992, Dirkx & Jha, 1994; Garrison, 1985) has been conducted in recent
decades to identify factors that advance or constrain participation in adult education
programs.
Statement of the Problem
David Dolly, of the Department of Agricultural Economics and Extension at the
University of the West Indies in Trinidad and Tobago, and Pauline Dowlath of
MALMR, identified the issue of participant attrition and non-participation as a challenge
faced by agricultural extension in Trinidad and Tobago (personal communication,

7
January 2006). The limited understanding of the factors of participation in FFS hinders
the progress of FFS as a means for agricultural education and extension in Trinidad and
Tobago. In addition, Davis (2006) declared of FFS on a global scale, “The issue of
participation in farmer field schools has barely been touched in the literature” (p. 94).
The absence of literature on the issues surrounding participation in FFS in Trinidad and
Tobago and elsewhere hinders the knowledge base required for effective scaling-up of
this approach.
Considering that FFS is a financially expensive vehicle for conducting
agricultural extension and educational outreach (Feder, Murgai, & Quizon, 2004a; Rola,
Jamias, & Quizon, 2002), program attrition and the reticence of others to participate
constitutes a challenge for the dissemination of FFS in Trinidad and Tobago.
Understanding why adult education participants withdraw from adult education
programs (Perin & Greenberg, 1994; Darkenwald & Gavin, 1987; Garrison, 1985) and
why non-participants do not participate (Darkenwald & Valentine, 1985; Beder, 1990) is
a major concern of researchers, policymakers, and practitioners of adult education,
including agricultural extension (Norland, 1992).
Based on a review of the literature of the fields of adult education and
agricultural extension, particularly the FFS, and the challenges faced by MALMR to
establish effective and sustainable FFS programs in Trinidad and Tobago, there are six
factors that are unknown: 1) the relationship between participation status and personal
characteristics, 2) the relationship between participation status and individuals’
motivations for participation, 3) the relationship between participation status and

8
perceptions about selected farming practices, 4) the relationship between participation
status and individuals’ priority rankings of their sources of information regarding
farming practices, 5) the relationship between participation status and the deterrents to
participation, and 6) the relationship between participation status and their perception of
the usefulness of competitions as a means for increasing the popularity of FFS.
Purpose and Objectives of the Study
The purpose of the study was to identify and analyze factors affecting
completion, non-completion, and non-participation in FFS in Trinidad and Tobago.
Following are the research objectives identified to accomplish the purpose of the study.
1. Determine the personal characteristics of FFS completers, non-completers, and
non-participants.
a. Describe selected personal characteristics of FFS completers, non-
completers, and non-participants.
b. Describe the relationship between participation status and personal
characteristics.
2. Identify the motivations for participation in a FFS.
a. Describe FFS completers’ and non-completers’ motivations for
participation in a FFS at the beginning of the program.
b. Determine if a significant relationship exists between motivations for
participation and completion or non-completion of FFSs.
9
3. Determine the perceptions of selected farming practices (i.e., integrated pest
management, financial factors, and the compatibility of integrated pest
management in the social setting).
a. Describe FFS completers’ and non-completers’ perceptions of selected
farming practices at the beginning of the FFS.
b. Determine if there is a statistically significant difference in completers’
and non-completers’ perceptions of selected farming practices at the
beginning of a FFS.
c. Describe FFS completers’ and non-completers’ perceptions of selected
farming practices at the end of a FFS.
d. Determine if there is a statistically significant difference in completers’
and non-completers’ perceptions of selected farming practices at the end
of the FFS.
e. Determine if there was a statistically significant change in completers’
perceptions at the beginning and end of a FFS on selected farming
practices.
f. Determine if there was a statistically significant change in non-
completers’ perceptions at the beginning and end of FFS on selected
farming practices.
g. Describe FFS program non-participants by selected farming practices.
h. Determine if a significant relationship exists between participation status
and perceptions about selected farming practices.

10
4. Establish the priority rankings of their sources of information for farming.
a. Describe completers’ priority ranking of their sources of information for
farming at the beginning and end of FFS.
b. Describe FFS non-completers’ priority ranking of their sources of
information for farming at the beginning and end of a FFS.
c. Describe FFS non-participants’ priority rankings of their sources of
information for farming.
5. Identify the deterrents to participation in the FFS.
a. Describe FFS program completers, non-completers, and non-participants
by the deterrents to participation (life situation factors, institutional
factors, and dispositional factors).
b. Determine if a significant relationship exists between the deterrents to
participation and participation status.
6. Determine the usefulness of competitions as a means for increasing the
popularity of FFSs.
a. Describe FFS program completers, non-completers, and non-participants
as to their perceptions of the usefulness of competitions as a means for
increasing the popularity of the FFSs.
b. Determine if a significant relationship exists between respondents’
perceptions of the usefulness of competitions as a means for increasing
the popularity of FFS and participation status.

11
Theoretical Framework
This research task was bounded by two fields of study: adult education (Cross,
1992; Johnstone & Rivera, 1965; Knowles, Holton, & Swanson, 2005) and agricultural
extension and education (Anderson & Feder, 2004). There is considerable overlap in
these fields: FFS methodologies are founded on the principles of adult education as well
as being an innovation for agricultural education and extension.
The Androgogical Model, as presented by Knowles (2005), undergirds the
theoretical base of this study. Knowles distinguished the principles of adult learning
from the principles of child learning based on six criteria: 1) the need to know, 2) the
learners’ self-concept, 3) the role of the learners’ experiences, 4) readiness to learn, 5)
orientation to learning, and 6) motivation.
A considerable portion of adult education research has attempted to address the
issue of participation (Pryor, 1990). Understanding the role of participation in adult
education is important for several reasons. First, education for adults and children fulfill
differing functions. Adults, as opposed to children, perform multiple roles, such as
spouse, parent, and worker. These competing responsibilities constrict the amount of
time and energy adults may allot to any single activity. For this reason, adults’
orientation to learning tends to be more problem centered. Adults are willing to invest
their time and energy on the most pressing educational issues (Knowles, Holton, &
Swanson, 2005).
It is critical to agree on a definition of extension, for it will guide the
establishment of its purpose, goals and strategies. Purcell and Anderson (1997) have
12
defined extension as “the process of helping farmers to become aware of and adopt
improved technology from any source to enhance their production efficiency, income,
and welfare” (p. 55). Van den Ban and Hawkins (1996) offered this definition of
extension: “The conscious use of communication of information to guide people to form
sound opinions and make good decisions” (p. 9). Nagel’s (1997) observation that the
overarching goals of extension are two-fold, technology transfer and human resource
development, encompasses a historical perspective. Traditional agricultural extension
has focused on the transfer of research knowledge to farmers (i.e., technology transfer)
in a top-down fashion. Increasingly, agricultural extension theory and practice entails
human resource development, meaning, “enabling [farmers] to clarify their own goals
and possibilities, educating them on how to make better decisions, and stimulating
desirable agricultural development” (Anderson & Feder, 2004, p. 41). There has been a
shift, particularly in developing countries, for extension services to not only focus on the
diffusion of innovations (Rogers, 2003) from experiment stations to the farmers but to
also implement participatory approaches that enable farmers to conduct research on their
own farms.
Significance of the Study
Agricultural extension is a vehicle for facilitating farmers to solve their own
problems. As such, a study on their perceptions of their agronomic, financial, and
personal conditions and the educational programs offered by the extension services

13
provide insights from the end-users’ perspective. Thus, the farmers’ feedback may help
improve the extension delivery system to the farmers.
The voluntary nature of participation in FFS necessitates that agricultural
extension policymakers and practitioners give careful attention to the current patterns of
participation in FFS in Trinidad and Tobago. They may employ strategies that impair or
eliminate the factors leading to attrition and non-participation, thus making programs
more accessible, prevent attrition, and may decrease farmers’ expenditures on pesticides,
increase income, and benefit the environment. Understanding the perceptions of
participating and non-participating farmers in Trinidad and Tobago regarding the Farmer
Field Schools and integrated pest management is critical, particularly considering that
the approach is being scaled-up in several other Caribbean islands and elsewhere.
Methodology
This study employed an ex post facto, causal comparative research design.
According to Gall, Gall, and Borg (2007), an ex post facto research design relies on
“observation of relationships between naturally occurring variations in the presumed
independent and dependent variables” (p. 306). The research design used in this study
allowed for researching natural, pre-existing variations in the independent and dependent
variables as a result of the respondents’ exposure to (or knowledge of) a Farmer Field
School.
The population of the study is FFS-participating and non-participating
agricultural producers in Trinidad and Tobago. The sample of the study encompassed

14
109 farmers associated with five Farmer Field Schools funded and facilitated by the
Ministry of Agriculture, Lands, and Marine Resources of Trinidad and Tobago
(MALMR). For the purposes of this study, the farmers were classified as FFS program
completers (n=56), FFS program non-completers (n=15), or FFS program non-
participants (n=38). The five FFS were located at Transfer Village, La Trinidad, Grand
Fond, Cemetery Trace, and Platanite. These five FFS were selected by MALMR
personnel for this study due to the time frame established by the researcher, the
schedules of operation of the five FFSs, and the availability of extension personnel who
served as data collectors.
Three instruments (Participants at the Beginning of the Educational Cycle,
Completers and Non-Completers, and Non-Participants) were developed to gather
information from the program completers, non-completers, and non-participants (see
Appendices 2, 3, and 4). The questionnaires included quantitative, closed-ended
category scale questions on a four-point Likert-scale measuring the farmers’ agreement
levels (1=Strongly Disagree, 2=Disagree, 3=Agree, 4=Strongly Agree) with statements.
The questionnaires also solicited information about the respondents’ personal
characteristics, including but not limited to gender, marital status, whether they had
participated in any prior agricultural extension activities, and educational background.
The questionnaire Participants at the Beginning of the Educational Cycle sought
information from participants about their motivations for participation in FFS, their
perceptions of integrated pest management, and personal information. All of the
participants at the beginning of the educational cycle completed this questionnaire, thus

15
allowing the researcher later to compare the responses of the farmers who completed and
did not complete the program.
The two other questionnaires, Completers and Non-Completers and Non-
Participants, consisted of three sections: 1) 38 Likert-scale statements on the life
situation factors, institutional factors, and dispositional factors that influenced their
decisions to complete or not complete the Farmer Field School. 2) 20 Likert-scale
statements on the use of pesticides in farming, financial factors in adopting integrated
pest management on their farms, the compatibility of integrated pest management with
the social setting in Trinidad and Tobago. A paired-samples t-test between respondents
at the beginning and end of FFS was conducted. In addition, program completers, non-
completers, and non-participants were asked about the viability of competitions as a
means for increasing the popularity of FFS.
Because non-participants were not active in the FFS program, there were no
constraints on the extension agents as to a time or place for locating non-participants
whom to administer the instrument, Non-Participants. The extension agents could
administer the questionnaire Non-Participants at any time after the non-participants
were presented with the opportunity to participate in the program and made a decision to
not join the FFS group.
The instruments were checked for face validity by a panel of 15 MALMR
extension agents with vast experience conducting FFS in Trinidad and Tobago. The
panel gave suggestions to improve the clarity and cultural sensitivity of the questions.
Reverse coding of some statements was used to reduce biasing effect (Tuckman, 1999).

16
Five members of the panel were selected to administer the survey in the five Farmer
Field Schools. Training was conducted to ensure that the interviewers would follow a
standard protocol, thus ensuring the content validity of the instruments. In addition, a
measure for reducing social desirability bias and ensuring respondent anonymity was for
the data collectors (i.e., the extension agents) to collect data in a FFS outside of their
geographic region of service. At the conclusion of the data collection, the five extension
agents who collected the data were compensated for their services rendered. Data were
collected from May to September 2007.
Quantitative data analysis was conducted using the Statistical Package for Social
Sciences (SPSS Version 15) to determine reliability of the instruments, frequencies,
percentages, means, standard deviations, chi-square test for independence, independent
samples t-tests, paired samples t-tests, one-way analysis of variance (ANOVA), and
post-hoc tests of differences. Statistical significance was established at the 0.05 level.
Definition of Terms
Adult- anyone recognized by their own society as having reached maturity (Knowles,
2005)
Adult education- planned learning in which adults determine the program content in
order to meet their needs (Knowles, 2005)
Andragogy- the art and science of teaching adults (Knowles, 2005)
17
Completer- At the end of the FFS educational cycle, the individual was an active
member of the FFS group. This individual was recognized as a FFS graduate at the
graduate recognition ceremony.
Experiential (and/or) problem-based learning- Learning in which the learner sorts things
out for him/herself (Tight, 2002)
Non-completer- At the end of the FFS educational cycle, the individual was not an active
member of the FFS group. This individual was not recognized as a FFS graduate at the
graduate recognition ceremony.
Education- planned learning (Tight, 2002)
Non-formal education- any organized educational activity carried on outside the formal
education system. Non-formal education provides learning opportunities to adults and
children on topics of interest to the beneficiaries. Non-formal education includes
agricultural extension and farmer-training programs. (Tight, 2002)
Non-participant- An individual who may be classified as any of the following:
1) Officer met with the intended participant and after describing the Field School to the
person, the person declined an invitation to participate, 2) Participant visited the
introductory Farmer Field School activity and decided not to continue to participate in
the school, and 3) A member of the community or someone else described the school to
the intended participant and the person decided not to participate.
Pedagogy- the art and science of teaching children (Knowles, 2005)

18
Abbreviations
AESA: Agro-Ecosystem Analysis
CABI- Commonwealth Agricultural Bureau International
FAO- Food and Agriculture Organization of the United Nations
FFS- Farmer Field School
IPM- Integrated Pest Management
MALMR- Trinidad and Tobago Ministry of Agricultural Lands and Marine Resources
Assumptions
1. Respondents’ motives for participation (or non-participation) in FFS correspond
to general adult education theory.
2. The study assumes that most people are motivated to participate in education and
that the removal of external barriers will permit them to do so.
3. Non-formal adult education programs, such as FFS, can improve the capacities of
participants to solve problems relevant to their lives, thus improving their
livelihoods and wellbeing.
4. Program completers were motivated to improve their knowledge and skills
whereas program non-completers and non-participants were less motivated.
5. Respondents represented a broad spectrum of adult learners.

19
Delimitations
1. This study was delimited to 109 small-scale farmers in the areas served by five
different farmer field schools on the island of Trinidad in the twin-island nation
of Trinidad and Tobago.
2. The 109 farmers were surveyed between May and October 2007.
3. The study was delimited further to those farmers who could be positively
matched at the beginning and end of the educational cycle (and those classified
as non-participants) in the FFSs.
Limitations
These were factors which the researcher may have controlled, but due to time,
money, or other constraints, chose to not control them.
1. The researcher could not control for the small number (n=15) of program non-
completers. This was an effect of an ex post facto research design which relies
on observation of relationships between naturally occurring variations in the
presumed independent and dependent variables.
2. There were thirteen respondents who were not included in the total sample
population (n=109) because they filled out either the Beginning of Educational
Cycle questionnaire or the Completers and Non-Completers questionnaire, but
not both. There were components on these questionnaires that served as pre/post
tests. These farmers could not be matched in the pre/post test.
20
3. The study was limited to only five FFSs, though MALMR has conducted over
thirty FFS (as of January 2008). Caution should be exercised when generalizing
to a broader FFS population and farmers in general in Trinidad and Tobago.
4. The researcher did not personally administer the three instruments. Bias may
have been introduced into the data due to respondents’ perceptions of social
acceptability of their responses and the perceptions of response anonymity.
5. Purposive sampling: similarities and differences found in comparisons of
completers, non-completers, and non-participants may arise simply because of
the selection process. Random sampling was not an option.
6. The study fails to distinguish the category of individuals who started FFS, did not
attend several contiguous weekly meetings, yet at the end of the educational
cycle were active participants and were recognized as program completers.
Within the study these individuals are classified as completers, yet a more
nuanced approach may classify them as “start-stop-starters.”
7. The study does not statistically control for the influence of the extension agent in
the participation-status phenomenon.
8. The study evaluated FFS completers, non-completers, and non-participants
during one FFS educational cycle, which parallels a cropping cycle. This time
period may be insufficient for the questionnaire respondents to gain a well-
balanced perspective on FFS. While this study takes a snap-shot approach, it is
recommended that a follow up study capture the respondents’ perceptions at a
later date.

21
CHAPTER II
LITERATURE REVIEW
The purpose of this review of literature is to establish a conceptual basis for a
study on the nature of participation in Farmer Field Schools (FFS) in Trinidad and
Tobago. Two fields of study support this research task: first, agricultural extension,
specifically the history of extension that paved the way for the Farmer Field School
approach. A broad history of extension covering the leading paradigms and extension
models is provided. The second field addressed is adult education, particularly the issue
of participation in adult education. There is a great deal of overlap in these two fields;
agricultural extension employs many of the theories of adult education. Finally, a
description of Trinidad and Tobago’s geography, history, culture, economy, and the
events that paved the way for the introduction of the Farmer Field Schools set the stage
for the study.
Agricultural and Extension Education
Agricultural extension, broadly defined, focuses on the delivery of information to
farmers to improve agricultural productivity and increase farmers’ incomes. Information
transmitted may range from estimates of future commodity prices to the timing and
intensity of pesticide use. Extension may deliver knowledge embodied in products, such
as improved crop cultivars or machinery, or it may be more abstract information on
agricultural practice. Extension services liaise between researcher and farmer by
focusing on the delivery of information to farmers (Anderson & Feder, 2004).

22
According to van der Ban and Hawkins (1996), the goals of agricultural extension
include the transfer of information from international and local research to farmers, thus
providing them with the knowledge and skills to make better decisions, clarify their
goals, and stimulate agricultural development leading to improvements in livelihoods
and wellbeing. In similar fashion, Nagel (1997) stated that the overarching goals of
agricultural extension are technology transfer and human resource development.
Agricultural development plays an integral role in national economic and social
development (World Bank, 2007). Over the course of the last five decades, agricultural
extension in developing countries has been one of the largest development efforts
undertaken by governments and international agencies. Worldwide, hundreds of
thousands of extension agents have been trained and millions of farmers have had
contact with extension services (Anderson & Feder, 2004; World Bank, 2000).
Conducting agricultural extension is not without its challenges (Feder, Willett, &
Zijp, 2000). In developing countries where the vast majority of farmers cultivate fairly
small plots, extension services face a daunting task of reaching a geographically
dispersed target audience. Complicating matters, resource-poor farmers typically
possess low levels of literacy and are limited in their contacts with mass media
communications mediums that extension services may use to disseminate their
messages. Inadequate road infrastructure adds to the challenge and cost of reaching
these farmers. Moreover, the diversity of information needs of farmers due to
“variations in soil, elevation, microclimate, and farmers’ means, capabilities, and access
to resources” (Anderson, Feder, & Ganguly, 2006, p. 5) require location-specific

23
messages. The number of farmers needing extension services is large and the effort and
expense to service all of them is quite high (Anderson & Feder, 2004).
After independence, the vast majority of the former colonies organized the
agricultural extension service within the ministry of agriculture. Ministry-based general
extension has historically applied top-down, transfer of technology (TOT) methods for
disseminating new technologies. The TOT approach focuses on spreading technologies
generated on research stations to the end-users, the farmers (Nagel, 1997). According to
Chambers, Pacey, and Thrupp (1989), the farmer’s lack of involvement in the
technology-generation process led to the perception, particularly among resource-poor
farmers, that they were powerless to experiment in their own fields. On the other hand,
better-endowed farmers whose farming conditions are similar to those found on the
research stations, possessed more favorable circumstances and thus, had greater
opportunity to apply cutting-edge technologies. Moreover, large-scale farmers are not
typical of the broader farming population, thus small-scale farmers are unlikely to follow
the advice given large-scale farmers due to the limited applicability of the messages to
their own socioeconomic and agronomic conditions. For these reasons, extension
services typically concentrated their attentions on “larger-scale, better-endowed, and
more innovative farmers who can provide some in-kind payment and are likely to exhibit
better performance” (Anderson & Feder, 2004, p. 45).
Where efforts have been made to reach small-scale farmers with messages
consistent with their conditions, the general strategy has been to mobilize a large number
of extension agents to reach their disparate audiences. This strategy necessitated a large

24
administrative organization from the national down to local levels. This, in turn, brought
about “a centralized, hierarchical, top-down management system” generally not
“receptive to participatory approaches to information delivery and priority setting”
(Anderson & Feder, 1994, p. 45). The extension service personnel commonly made
decisions about message content far from the field level without the consultation of the
message recipients, often leading to suboptimal decisions.
Transfer of Technology (TOT) and Diffusion of Innovations Theory
Transfer of Technology (TOT) approaches are largely based on the Diffusion of
Innovation theory developed and popularized by Rogers (2003). Rogers defined
diffusion as “the process by which an innovation is communicated through certain
channels over time among the members of a social system” (p. 5). The rate of diffusion
is largely dependent upon the adopter categories of the users (i.e., innovator, early
adopter, early majority, late majority, and laggards) and the characteristics of the
technology (i.e., relative advantage, compatibility with the social setting, trialability,
observability, and complexity).
In the context of international agricultural development, the diffusion of
innovation model (Rogers, 2003) presents an unduly linear approach to the development
and dissemination of technology. Rogers acknowledged the criticisms of the theory: a
pro-innovation bias, blaming farmers for failing to adopt technologies (despite their
unsuitability to their agronomic and economic conditions), a lack of recognition of the
centrality of farmers’ innovations to their conditions, and an overly simplistic focus on
the change agency and change agent rather than the end users of the technologies.

25
Scholars and development practitioners (Bunch, 1982; Chambers, 1983; Davis,
2004; Rhoades & Booth, 1982; Rogers, 2003) have noted that that the theory of
innovations and the Transfer of Technology (TOT) model are better adapted to
developed, rather than developing nations. This is due to the complexity of the socio-
economic environment, particularly in relation to the disparities between the well- and
poorly-endowed farmers. One of the earliest scholars to suggest a different approach
was E.F. Schumacher (1973). He noted that developing countries would benefit more
from “intermediate technologies,” meaning technologies that are more effective and
expensive than traditional methods, yet are less expensive than the technologies
produced in the industrialized nations. By the early 1980s, leading development
scholars and practitioners (Bunch, 1982; Chambers, 1983) stimulated the trend by
proposing a shift in priorities and strategy: a more participatory approach to
development. Gradually, this movement toward more farmer-centered approaches
would shift development practice. In accordance with the participatory approaches,
contemporary theory (and practice) places farmers as the primary actors in every stage,
from needs assessment, to technology generation, testing, dissemination, and evaluation.
Extension Modalities
The shift over time from the Transfer of Technology-led extension paradigm to a
more participatory, farmer-centered extension paradigm is reflected in the dominant
models of extension over the last several decades: the Training and Visit (T&V) Model,
the Decentralized Extension Model, and Privatized Extension. Each of these modalities

26
attempts to overcome the challenges to the effectiveness of extension. These extension
models subsequently paved the way for more participatory approaches, including the
Farmer Field School methodology.
The Training and Visit (T&V) Extension Model
In the late 1960s and early 1970s, the diffusion of the Green Revolution
technology cluster was the primary focus of agricultural extension systems in many
developing countries (Benor, Harrison, & Baxter, 1984; Picciotto & Anderson, 1997).
The technology cluster developed by the international research centers, including high-
yielding varieties of staple crops, irrigation systems, mechanization, fertilizers, and
pesticides, needed to be released and made known to as broad an audience as possible.
The need for new systems for disseminating the technology gave rise to the Training and
Visit (T&V) model of extension in the early 1970s. It was championed by the World
Bank in more than 50 countries, primarily in Asia and Africa, but not in Latin America.
As noted in Anderson, Feder, & Ganguly (2006), the T&V model was a highly
hierarchical system with several layers of management which supervised a large cohort
of subject-matter specialists. These subject-matter specialists conducted bi-weekly
meetings with a set of contact farmers (later revised to include contact groups) to teach
messages pre-determined by the ministry of agriculture, irrespective of the actual needs
of the farmers. The expected role of the contact farmers (or groups) was to pass on the
messages to other local farmers, thus maximizing coverage over a geographic area.
The design of having highly structured, bi-weekly meetings with an established
group was intended to increase the accountability of the extension agents to the clientele.

27
But due to the top-down, hierarchical flow of information, the concerns of farmers were
largely overlooked, leading to the transmission of irrelevant messages to resource-poor
farmers. Also, in many cases, the contact farmers chosen to interact with other farmers
were not opinion leaders within their own social system. Many have observed, however,
that what eventually led to the demise of the Training and Visit extension system was
that it was financially unsustainable. In the absence of donor funds, governments could
not afford to maintain the expense of the administrative burden for carrying out
extension under the T&V model.
The Decentralized Extension Model
Decentralized extension maintained the government-funded and delivered
qualities of traditional centralized extension (Anderson & Feder, 2004; Parker, 1995;
Rivera, 1996). Within this framework, the locus of responsibility for delivery rested
upon local district or county governments. Seeking to address a shortcoming of the
Training and Visit extension system, an objective of decentralization was to “improve
accountability by moving services closer to the people who use them” (Anderson &
Feder, 2004, p. 50). While this was a positive step, decentralization tended to shift the
financial burden onto local governments, which too, proved to be unsustainable. To
address this challenge, some reformist governments devolved the extension function
from the local government level to farmers’ associations. This maneuver improved
accountability by placing the employer even closer to the clientele and financial
sustainability because farmers’ associations could recover their costs through
membership fees. The primary deficiencies of the decentralized extension model

28
included “difficulties maintaining agent quality due to loss of economies of scale in
training and more difficult linkages with research” (Anderson & Feder, 2004, p. 51).
Fee-for-Service and Privatized Extension Model
Fee-for-service extension programs tend to require some public funding, such as
government-funded vouchers or other forms of public support, but do reduce the
financial burden of publicly funded extension services. “Small groups of farmers
typically contract for extension services to address their specific information needs.
Because this solves the accountability problem, the quality of service is likely to be
high” (Anderson & Feder, 2004, p. 51). The primary drawback to fee for service
extension is that “less commercial farmers-poorer farmers, women farmers, farmers with
smaller or less favorable plots-for whom the value of information is lower, may purchase
fewer extension services, because the price of the service will tend to be market-
determined” (Anderson & Feder, 2004, p. 51). In order to avoid the undesirable social
and economic implications of this policy, small-scale and resource-poor farmers may be
serviced by public extension or by government-subsidized contracted extension services.
In developing countries, a fully privatized extension service is not a viable option due to
the large numbers of farmers unable to pay for extension services.
Farmer Field Schools as a Modality for Agricultural Extension
Early History of FFS
During the 1970s and 1980s, severe losses in rice production in Asia caused by
the brown plant hopper (Nilaparvata lugens) moved the Food and Agriculture

29
Organization of the United Nations (FAO) to seek solutions. This was critical
considering that the livelihoods of 200 million rice farmers were at stake. Research in
the Philippines and Indonesia showed that capricious pesticide use on rice crops created
resistance by N. Lugens and killed its natural enemies, thus encouraging subsequent
outbreaks (Pontius, Dilts, and Barlett, 2002). The FAO Intercountry IPM Programme,
the innovators of Farmer Field Schools, pointed out that the recurring brown plant
hopper outbreaks were signs of pesticide dependency, a negative consequence of modern
agriculture. FAO recognized the shortcomings in the dominant pest management
strategy: the formal agricultural research institutions communicated with the farmers in a
hierarchical, top-down fashion, many of the technical recommendations were irrelevant
to the realities faced by the farmers, and farmers typically chose pesticides over pest
resistant crop varieties because they perceive them as less risky (Braun, Thiele, &
Fernandez, 2000).
According to Gallagher (1999), the first FFSs were established in central Java,
Indonesia in 1989. Fifty plant protection officers of the FAO-assisted Indonesian
National IPM Programme tested field-training methods in order to develop a training-of-
trainers course. The following year, two hundred FFSs were established with 5,000
farmers participating. In 1991, 50,000 farmers joined FFSs. Since 1992, the program
currently trains about 100,000 Indonesian farmers every year.
Essential Elements of a FFS for IPM
Farmer Field Schools are not limited to teaching IPM technologies. The
methodology has been used to teach a wide variety of topics including, but not limited

30
to, organic agriculture, soil and crop management, animal husbandry, and even the
development of small, income-earning enterprises (Gallagher, 2003). The focus of this
research task is on FFS programs focused on IPM.
FFS was designed as a program that offered participatory, hands-on learning
experiences for farmers in order to sharpen their skills of observation, decision-making,
and critical thinking. FFS aimed to improve farmers’ analytical and decision-making
skills through developing an agro-ecological approach to farming with the intent of
discontinuing dependency on pesticides as the primary pest-control measure (Braun,
Thiele, & Fernandez, 2000). To achieve this, farmers needed to understand the
ecological principles and processes governing pest population dynamics. The
development of expert farmers who observe crops regularly, grow healthy crops, and
conserve natural enemies is the objective of FFS (Gallagher, 1999). The benefit to FFS
farmers is an increased capacity for informed decision-making for appropriate
interventions for water, soil, and plant management based on ecological and economic
assessments.
FFS facilitators educate farmers on agro-ecological systems analysis (AESA),
including topics such as “plant health, water management, weather, weed density,
disease surveillance, plus observation and collection of insect pests and beneficials”
(Indonesian National IPM Program Secretariat, 1991). Gallagher (2003) pointed out that
an IPM FFS consists of three activities: first, agro-ecosystem observation, analysis
(AESA), and the presentation of the results, second, a special topic, and third, a group-
dynamics activity.

31
AESA is the core activity of an FFS; all other activities (such as the special topic
and group dynamics activities) revolve around and support AESA. The typical FFS
educational cycle consists of 20-25 farmers, though they tend to divide into smaller
groups (of about five) for the weekly AESA field observations. Each FFS meeting
begins with the small groups (of about five) collecting field data, such as the varieties of
pests and plant samples, on IPM and non-IPM plots. A facilitator is present to assist the
farmers in their observations (Gallagher, 2003).
After the field observation, the farmers return to their meeting place to draw their
small groups’ observations on large sheets of paper. The drawings include the stages
and conditions of the plants, the pests and their natural enemies, and other important
features of the environment. As the farmers draw, they analyze the field data and
determine a management plan. The management plan is then added to the drawing.
A member of each small group presents the field data, the drawing, the analysis,
and the management plan to the entire group of FFS farmers. The other farmers are
encouraged to ask questions and add comments based on their own experience. This
cycle is repeated until all of the groups have presented their findings. The drawings are
retained and added to those from previous weeks to serve a reference for future FFS
weekly meetings throughout the cropping cycle.
The FFS facilitator plays a critically important role in the AESA process
(Gallagher, 2003). The effective facilitator enables the farmers to notice changes in the
fields that may easily be overlooked. Moreover, the facilitator employs learner-centered
teaching strategies: the more the farmers talk about what they see and know, the more

32
they will learn. The effective facilitator stimulates critical and creative thinking by
posing alternative ‘if-then’ questions. The effective facilitator encourages all farmers to
participate in the discussion, and ensures that the farmers’ AESA management plan is
appropriate and reasonable.
Thus, FFS provide opportunities for farmers to learn-by-doing, based on the
principles of non-formal education. Extension agents and farmer-trainers facilitate the
learning process, stimulating farmers to discern key agro-ecological concepts and
develop IPM skills through experiential learning in the field (Braun, Thiele, &
Fernandez, 2000). The FFS approach uses participatory, non-formal, adult education
training methods to develop FFS participants into “confident [integrated pest
management] experts, self-teaching experimenters, and effective trainers of farmers and
extension workers” (Wiebers, 1993, p. 32). Through group interactions, discovery-based
learning and hands-on experimentation, participating farmers develop their decision-
making abilities and their leadership, communication, and management skills (van de
Fliert, 1993).
At the conclusion of the educational cycle, FFS participants are awarded
graduation certificates and are presented in a ceremony as FFS “graduates” (Gallagher,
2003). It is the intent of FFS planners and facilitators that the benefits of participation
do not end with the FFS farmers, but rather that the impacts are “scaled up” to the
national level (Davis, 2006). A key to scaling up is informal farmer-to-farmer
dissemination of the knowledge and technologies learned in FFS. There is evidence
(Feder, et al., 2004b; Tripp, et al., 2005) that informal farmer-to-farmer dissemination is

33
not occurring, thus halting the spread of the benefits of FFS to the national level.
Nevertheless, the success of FFS as a tool for agricultural extension in Asia has placed
the methodology at the forefront of extension practice in Africa and Latin America with
a variety of crops and topics.
FFS in Asia and Other Regions
Studies have shown that the first 50,000 FFS graduates in Indonesia “reduced
insecticide applications from an average of 2.8 sprays per season to less than one, with
most [rice] farmers not spraying at all. When [rice] farmers did apply insecticide, they
could identify a specific target pest” (Matteson, 2000, p. 558). By 1999, over two
million small-scale rice farmers in twelve Asian countries had learned through FFS how
become informed decision-makers regarding crop management and protection
(Matteson, 2000; Pontius, Dilts, & Bartlett, 2002).
Not all of the analyses of FFS have yielded positive reviews. Feder, Murgai, and
Quizon (2004b) conducted one of the first studies to analyze a large-scale and long-term
FFS program. Their evaluation focused on “whether program participation [in Indonesia
from 1991-1999] has improved yields and reduced pesticide use among graduates and
their neighbors who may have gained knowledge from graduates through informal
communications” (p. 45). The respondents in the study were 1) 112 FFS-participant
households, 2) 156 non-participant households in villages where field schools were
implemented, and 3) 52 households in villages where field schools were not
implemented. The latter group was the control group. Thus, the researchers were able
to compare the FFS effects upon farm-level yields and pesticide use among three sample

34
populations. The data led the researchers to conclude that FFS in Indonesia had not
“induced significant improvements in yields or reduction in pesticide use by graduates
relative to other farmers. Not surprisingly then, secondary diffusion effects on those
exposed to graduates are also not significant” (p. 47). The authors questioned the
effectiveness of FFS for strengthening farmers’ capacities for improving yields, reducing
pesticide use, and disseminating crop production methods. Moreover, the authors
suggested that the effectiveness of other FFS programs should be evaluated in light of
their study.
FFSs have been replicated with other crops and topics in Africa. According to
Braun, Jiggins, Roling, van den Berg, and Snijders (2006), there are FFS programs in
over 27 African countries. The topics covered in these FFSs range from integrated
production and pest management (IPPM) of annual and perennial crops, soil
management, livestock production, and HIV/AIDS. For example, Bunyatta et al. (2006)
examined the effectiveness of Farmer Field Schools for stimulating the acquisition,
adoption, and spread of soil and crop management (S&CM) technologies in Kenya. The
objectives framed the investigation in terms of comparing FFS participants’ and FFS
non-participants’ knowledge acquisition of S&CM technologies, the adoption of these
technologies on their farms, and the degree to which FFS participants shared their new-
found knowledge with FFS non-participants. Sixty FFS graduates and sixty non-FFS
farmers were selected for this study. The results of the study showed that there was a
significant difference on the knowledge acquired of S&CM technologies by FFS and
non-FFS farmers, a significant difference on the adoption of S&CM technologies by FFS

35
and non-FFS farmers, and a significant difference in the dissemination levels of S&CM
technologies by FFS and non-FFS farmers. Bunyatta et al. (2006) concluded “that the
FFS methodology is a very effective tool for cultivating farmers’ learning…they
encourage farmers to develop their critical thinking and make sound farm management
decisions, resulting in the adoption of improved technologies such as the S&CM
technologies promoted in Kenya” (p. 60).
FFS have also been established in the Andean nations of Ecuador, Peru, and
Bolivia (Braun, Thiele, & Fernandez, 2000). According to Ortiz, Garrett, Heath, Orrego,
and Nelson (2004), the management of potato late blight is the most important problem
facing Andean potato growers. To that end, the International Potato Center (CIP)
adapted the FFS model to the address the needs of potato farmers in Cajamarca, Peru.
Ortiz et al. (2004) examined the benefits of participation in FFS with regards to
knowledge about the control of potato late blight and productivity gains. First, a
baseline survey was conducted to compare the knowledge levels of late blight of FFS
and non-FFS farmers. They reported that FFS farmers’ possessed higher levels of
knowledge prior to the FFS program than did non-FFS farmers. After the program, the
knowledge differential was even greater. Moreover, FFS farmers’ productivity was
statistically significantly higher than that of non-FFS farmers. They concluded that the
FFS participants benefited from increased knowledge of potato late blight and increased
their productivity.

36
Theories of Adult Learning Applicable to FFS
FFS methodology not only teaches farmers new technologies, but more
importantly, stimulates farmers’ capacities to think critically about the ecology of their
fields and work out their own solutions (Bunyatta, et al., 2006). Central to the approach
is the emphasis on teaching farmers not only the “how” but also the “why” of agro-
ecological systems (Gallagher, 2003) through hands-on, experiential learning
experiences. Pontius, Dilts, and Bartlett (2000) pointed out that the educational
procedures used in FFSs are based on several of the leading theories that guide the
practice of adult non-formal education.
FFS methodologies are influenced by the theories of andragogy (Knowles, 2005),
the learning cycle (Kolb, 1984), and learner-centered approaches to teaching (Rogers,
1969). Critical theory, as framed by Freire (1970), has also strongly influenced FFS
practice.
The Andragogical Model
The Andragogical Model (Knowles, 2005) is concerned with the principles of
adult learning, as opposed to pedagogy, the principles of child learning. Knowles et al.
distinguished the Andragogical Model from the Pedagogical Model based on six criteria:
1) the need to know, 2) the learners’ self-concept, 3) the role of the learners’
experiences, 4) readiness to learn, 5) orientation to learning, and 6) motivation.
The principle of pedagogy states that learners must learn what the teacher wants
them to learn in order to advance to the next school grade. The learner does not need to
know how that which is learned will be applied to future situations. On the other hand,

37
the principle of andragogy indicates that learners desire to know why they need to learn
something before attempting to learn it. Among the first tasks of the facilitator of adult
education is to increase awareness of the usefulness of that which is to be learned.
The Pedagogical Model assumes that the learner is dependent on the teacher for
instructions and subject-matter content. The Andragogical Model assumes that adults
are self-directed in their educational pursuits. As a result, in adult education programs,
learners exert a great degree of control in establishing the content and delivery methods.
The basis of pedagogy is that the learners’ limited experience due to their young
age diminishes their contributions to the learning experience. The experience that is
valued is that of the teacher, who is older and wiser. In contrast, andragogy values the
breadth and depth of experience of the adult learner. As a result, within adult education
there is a greater emphasis on individualization of content and learning strategies, such
as peer-helping activities.
According to the Pedagogical Model, learners are not ready to learn
independently from the teacher. The Andragogical Model stipulates that adults are
naturally ready to learn about topics of importance to them. Adults’ readiness to learn
stems from a desire to better address real-life situations. Adult education does not focus
on theories, but rather on enabling adults to solve real-world problems through new
skills, behaviors, and attitudes.
Within pedagogy, learning is promoted as the mastery of specific subject matters.
To the contrary, within andragogy, learning exercises are focused on life-centered, task-

38
centered, or problem-centered activities. Adults desire to learn that which will help them
better confront the challenges they encounter in real-life situations.
According to the Pedagogical Model, learners are motivated by extrinsic
motivators, such as parental approval or grades. Extrinsic motivators, such as a
promotion or an increase in salary, may also motivate adult learners. However, it is
certain that adults demonstrate a greater degree of intrinsic motivation to learn than do
children or youth.
The Learning Cycle
Kolb (1984) proposed that the learner undergoes a “learning cycle” in four
stages: a concrete experience, observation and reflection, generalization and abstract
conceptualization, and active experimentation. Pontius, Dilts, and Bartlett (2002)
pointed out that the agro-ecosystems analysis (AESA) embodies the learning cycle as
proposed by Kolb (1984). AESA is a concrete experience based upon the observation of
events and processes in the IPM and non-IPM fields within specific time periods. The
farmers reflect on their observations through the process of drawing and discussion.
Later, the farmers make generalizations and abstract conceptualizations leading to their
suggested management plan. During the subsequent week, the farmers engage in active
experimentation by implementing the management plan. Then, the learning cycle begins
anew.
Learner-Centered Teaching Approaches
Rogers (1969) proposed that adults learn best when they are put in control of
their own learning. Critical to the learner-centered teaching approach is that the teacher

39
take on the role of facilitator, rather than an instructor who knows-it-all (Pontius, Dilts,
& Bartlett, 2002). In addition, adult learners require learning to be relevant to their
needs, activities that encourage independence, creativity, self-direction, self-reliance,
self-criticism, and self-evaluation. The effective FFS facilitator practices learner-
centered teaching approaches.
Critical Theory
According to van de Fliert, et al. (2002), non-formal education is based on
Freire’s (1972) concept that the purpose of education is to raise individuals’
consciousness such that they are empowered to solve their own problems. Freire (1972)
placed great emphasis on education as a means for empowerment and social action. The
FFS methodology seeks to empower farmers “by fostering participation, self-confidence,
dialogue, joint decision-making, and self-determination. Translating these underlying
principles to IPM learning, farmer field schools (FFS) are designed to capacitate farmers
by enhancing their agro-ecological, science-based knowledge and develop skills needed
for informed decision-making and problem-solving” (van de Fliert, et al, 2002, p. 2).
Research on Motivation and Participation in Adult Education
“One of the most widespread, enduring, and passionate commitments of
continuing education practitioners is to reduce barriers and to encourage participation
and persistence in our educational programs for adults” (Knox, 1987, p.7). A
considerable portion of adult education research has attempted to address the issue of
participation (Pryor, 1990). There are a number of reasons why adult education theorists

40
and practitioners have dedicated so much effort in understanding the issue of motivation
for participation. First, as Knowles (2005) pointed out, education plays differing roles
for children and adults. Due to the competing responsibilities of adult life, adults are
more likely to be “problem oriented” in their educational pursuits than are children.
Adults invest their money, time, and energy in learning activities that enable them to
overcome the challenges they face. Second, it is of great value to adult education
program planners to understand, and even anticipate, the learning needs of adult learners.
Possession of this knowledge allows program planners to create better programs that will
attract participants to their programs, and encourage participant persistence (i.e.,
completion). Third, success at attracting participants ensures the survival and
continuation of adult-education programming (Kowalik, 1989).
Houle’s (1961) theoretical typology is a seminal work in the area of participation
motivation. His typology provided a framework in which adult learners could be
classified based on their reasons or motives for participation in educational
programming. He identified three motivational types. Learners in the first category are
goal-oriented. They participate in educational programming to accomplish clear-cut
objectives. The second group, activity-oriented learners, participates in educational
programming because they find meaning in the activity of learning but do not
necessarily seek a meaning that is connected with the content or the intended purposes of
the activity. The third group, the learning-oriented learners, seeks knowledge for its own
sake.
41
Houle (1961) recognized that there may be some overlap in these classifications,
yet the typology provides heuristic value. This is evidenced by the numerous subsequent
studies that utilized the typology as a conceptual framework. Most of these studies begin
with psychometrically constructed instruments and then subject the responses to factor
analysis techniques. Morstain and Smart’s (1974) factor analysis of Boshier’s (1971)
Educational Participation Scale (EPS) yielded six factors for motivation in adult
education programming: social relationships, external expectations, social welfare,
professional advancement, escape/stimulation, and cognitive interest (Cross, 1992).
Houle (1961) did not address the barriers to participation faced by adults. Based
on Houle’s typology, Boshier (1973) attempted to describe the role of motivation in
dropout and persistence among adult learners. Boshier’s Congruence Model presented
motivational orientations for participation and persistence as a continuum (Kowalik,
1989). Incorporating concepts of other theories, Cross’s (1992) Chain of Response
(COR) Model explained that motivation to participate in educational activities “assumes
that participation in a learning activity… is not a single act but the result of a chain of
responses, each based on an evaluation of the position of the individual in his or her
environment” (Cross, 1992, p.125).
Cross (1992) also provided a framework for conceptualizing the barriers to
participation. She used national survey data (Carp, Peterson, & Roelfs, 1974; Johnstone
& Rivera, 1965) to construct a framework consisting of three categories of barriers:
situational, institutional, and dispositional barriers. Situational barriers arise from one’s
situation in life at a given time. Examples include, but are not limited to, a lack of time

42
due to responsibilities at home or work, or a lack of money. Institutional barriers are the
practices and procedures related to the institution which exclude or discourage adults
from participating in educational activities. Inconvenient schedules or locations and
inappropriate course content are examples of institutional barriers. Dispositional barriers
are those deterrents related to attitudes and self-perceptions of the individual.
Johnstone and Rivera (1965) addressed the issue of deterrents to participation in
a study in which non-participants in adult education programming were asked to select
from a predetermined list of ten statements reasons why they did not attend adult
education programs. The ten statements were divided into two categories of barriers,
namely, environmental/situational, which are factors beyond the individual’s control,
and second, internal/dispositional, which are factors related to the individual’s attitudes
and self-perception. They found that situational barriers are mentioned more often than
internal/dispositional barriers. In addition, they also explored the relationship between
demographic characteristics and the deterrents to participation. They found that sex,
age, and socioeconomic status were related to individual’s perceptions of barriers to
participation (Kowalik, 1989).
In a study on the perceptions of non-participants regarding the deterrents to
participation, Wilcox, Saltford, and Veres (1979) asked respondents to identify barriers
to their own participation and that of other non-participants. The results of the study
were that only two percent of the non-participants indicated that a lack of interest (i.e., a
dispositional factor) was the primary reason why they did not attend educational

43
programming. Respondents, however, believed that a lack of interest was the leading
reason why others did not attend educational programming.
Studies on Participation in FFS
The issue of participant attrition and non-participation is a challenge faced by
agricultural extension in Trinidad and Tobago (D. Dolly & P. Dowlath, personal
communication, January 2006). The absence of literature on the issues surrounding
participation in FFS in Trinidad and Tobago and elsewhere hinders the knowledge base
required for effective scaling-up of this approach. Davis (2006) declared of FFS on a
global scale,
The issue of participation in farmer field schools has barely been touched in the
literature. FFS usually target women and encourage them to join, but is this
indeed happening? Are some farmers unable to join the groups, and if so, why?
Can farmer field schools, as they are currently configured, reach everyone?
(Davis, 2006, p. 94)
Few studies have addressed, to any extent, the issues related to participation in
FFS. For example, in a comparison of FFS and non-FFS households in the Philippines,
Rola, Jamias, and Quizon (2002) found that the average FFS and non-FFS participating
farmers were significantly different on three measures of their personal characteristics.
First, there were significantly more women FFS participants. Rola et al.’s conclusion
was that though women were not the primary decision makers in agriculture in the
Philippines, they participated in FFS in disproportionately high numbers because they,
44
rather than the men, had time to participate. Second, FFS-participating farmers tended
to be tenants rather than owners of land; non-FFS farmers tended to be land-owners.
Third, FFS-participating farmers tended to have other sources of income than did non-
participating farmers, thus they were less dependent on agriculture as a source of
income.
Tripp, Wijeratne, and Piyadasa (2005) highlighted participation issues in a study
about Farmer Field Schools in Sri Lanka. They noted that the only significant difference
between the participants with their neighbors “was in terms of additional income
sources; those farmers who also worked as farm laborers or as casual laborers were
much less likely to participate in the FFS…” (p. 708).
Moreover, this has implications for gender. There is evidence in Sri Lanka and
the Philippines that farmers with off-farm employment may send their wives to join the
FFS. In principle, this may be a step in the right direction. It is men, however, who are
the on-farm decision-makers, not women. The implication is that those who are in
greatest need for the IPM training, the men, are not participating in FFS programming.
Pontius, Dilts, and Bartlett (2000) pointed out that historically FFSs have focused on the
empowerment of underrepresented and marginalized populations, including women.
There is evidence (Godtland, Sadoulet, de Janvry, Murgai, & Ortiz, 2003) from
Peru that FFS participation is “highly correlated with labor availability, and many
farmers said that lack of time and labor was the main reason for not participating”
(p.1709). In addition, a FFS program in Zanzibar excluded poorer farmers because they
lacked the physical and financial buffer for experimentation (Bruin & Meerman, 2001).

45
Tripp, Wijeratne, and Piyadasa (2005) indicated that in a study on the FFS
program in Indonesia, “FFS participants own more land, are better educated, and are
more active in community groups” (p. 1708). According to Roling and van de Fliert
(1994), in the early years of FFS in Indonesia, the program tended to reach better
educated and wealthier farmers. This, however, may have been due to an act of
cronyism by the hamlet leader. There is also evidence that participation in an FFS in
Peru was determined by favoritism toward wealthier participants and family members of
the communal leadership (Godtland, et al., 2003).
Farmers’ Sources of Information
An exploration of FFS- and non-FFS farmers’ sources of information on farming
provides insight for FFS planners and practitioners with regards to the effective targeting
of FFS-related messages. In their study on the impact of FFS on knowledge and
productivity among potato farmers in the Peruvian Andes, Godtland, et.al., (2003)
concluded that the majority of farmers get information on potato cultivation practices
from family members. Foster and Rosenzweig (1995) concluded from several surveys in
India that information from near peers, such as neighbors and family, was as important as
information from government extension services. Ortiz and Valdez (1993) found that in
Cajamarca, Peru neighboring farmers played a central role for influencing other farmers’
technological adoption habits. Feder and Slade (1986) noted that farmers in central India
were each others’ main source of advice for general agricultural practices but were more
likely to seek the advice of agricultural extension agents for technically complex issues.
What the researcher wanted to find out in the study reported herein were the most sought

46
sources of information. Farmers’ most frequently cited sources of information are
indications of their role in diffusing technologies presented in the FFS.
The Context of Trinidad and Tobago
Geography and People
The twin-island state of Trinidad and Tobago is the southeastern-most nation in
the Caribbean. It is located to the northeast of Venezuela on the South American
mainland. Trinidad is the larger of the two islands (Figure 1). Port of Spain is the capital.
Other leading cities are San Fernando, Chaguanas, Arima, and Scarborough (in Tobago).
Figure 1. Map of Trinidad and Tobago(Britannica Student Encyclopedia, 2008).

47
The islands have a combined population of about 1.3 million (U.S. Department
of State, 2008). The descendants of East Indians (40%) and Africans (37.5%) comprise
the majority of the population, while there are considerably fewer mixed (20.5%),
European (0.6%), Chinese (0.3%), and other (1.1%). English is the national language,
though small percentages also speak Hindi and French patois. Trinidad and Tobago
possesses a high literacy rate (98.6%).
The combined surface area for Trinidad and Tobago is approximately 5130 sq.
km. (1980 sq. m.). Trinidad, the larger of the two islands, has an area of approximately
4814 sq. km. (1858 sq. m.). The Caribbean Land and Water Resources Network (2005)
of the MALMR estimated that the various land use types are arable agricultural land
(14%), agricultural land under permanent crops (9%), permanent pasture (2%), forest
and woodlands (46%), and all other land (29%).
The climate in Trinidad and Tobago is tropical. According to Ramroop, et al.
(2000), the average daytime temperature is between 81-90 degrees Fahrenheit (27-32
degrees Celcius) and it is cool at night. The average rainfall ranges from 59-141 inches
(1500-3600 mm). The dry season runs from January to May while the wet season
typically runs from June to December. During the dry season there is an increase in
insect pests. In the wet season, there is an increase in diseases.
History and Culture
In 1498, Christopher Columbus landed on and named Trinidad (U.S. Department
of State, 2008). The Spaniards settled the island and wiped out most of the Arawak and
Carib Indians, the original inhabitants. The surviving Arawak and Carib were

48
assimilated with the French, free black, and other non-Spanish settlers living under the
Spanish crown. The British captured Trinidad in 1797. Control of Tobago proved
tenuous for the colonial powers: it changed hands twenty-two times, more than any other
West Indies island. Britain gained final control of Tobago in 1803. In 1888, the two
islands were incorporated into a single colony. In 1962, Trinidad and Tobago achieved
full independence and joined the British Commonwealth. In 1976, Trinidad and Tobago
became a republic.
Two major folk traditions take precedence in the culture of Trinidad and Tobago:
Creole and East Indian (U.S. Department of State, 2008). The Creole culture is a
mixture of elements from the African, Spanish, French, and English cultures. Trinidad
and Tobago’s East Indian culture began in 1845 with the arrival of indentured servants
brought to fill a labor shortage created by the emancipation of the African slaves.
Today, most of the agricultural sector is comprised of peoples of East Indian descent,
though many are successful businesspeople and professionals. The East Indians have
maintained many of their traditions, including Hindu and Muslim religious festivals and
practices.
Economy, Including Agriculture
Tobago’s economy is based on tourism. Until the mid-1900s, Trinidad’s
economy was largely based on the sugar industry and, to a lesser extent, cocoa, coffee,
and coconuts. Today, Trinidad is the Caribbean’s largest producer of oil and natural gas
(U.S. Department of State, 2008). In 2007, economic growth from the petroleum,
natural gas, chemicals, and tourism increased the national GDP to $20.9 billion USD.

49
The largest contribution to GDP was the petroleum industry (44.3%), while only 0.4%
was derived from the agriculture sector. Due to external market forces, the sugar
industry in Trinidad is in decline.
The country’s primary crops are cocoa, sugarcane, rice, citrus, and coffee. The
key exports are sugar, cocoa, coffee, citrus, and flowers. Small-scale producers maintain
the country’s self-sufficiency in vegetable and fruit production (Caribbean Land and
Water Resources Network, 2005). The vast majority of the fruits and vegetables are
produced for the local market. According to Ramroop, et al. (2000), a mixed vegetable-
based farming system is most common. The principle vegetable crops are tomato, sweet
pepper, hot pepper, cabbage, watermelon, and melongene (i.e., eggplant). Other crops of
less importance include bodi (a vegetable-type cowpea), ochro (okra), sorrel (a relative
of rhubarb), lettuce, patchoi, celery, caraille (bitter melon), cucumber, pumpkin, and
papaya. The leading vegetable export crops are papayas, hot peppers, and pumpkins.
Farming employs 9.5% of the country’s labor force (Caribbean Land and Water
Resources Network, 2005), which constitutes roughly 123,500 farmers. The average
landholding is less than 5 ha (12 ac.). Each extension officer is responsible for up to 900
farmers, thus necessitating group methods, such as FFSs, to disseminate information
(Ramroop, et. al., 2000).
Pesticide Use in Trinidad and Tobago
Agrochemicals are widely used in vegetable and fruit gardens. Given the tropical
climate, pest control is critical for maintaining or improving crop yield. “Farmers tend
to equate pest management with pesticide use in the mistaken belief that a direct

50
relationship exists between an efficient product yield and the amount of pesticide
applied” (Pinto Pereira, Boysielal, & Siung-Chang, 2007, p. 84). Unsustainable
pesticide use was documented as early as the 1980s. Phillips-Flanagan’s (1985) study
on pesticide illiteracy in Trinidad and Tobago showed that farmers possessed little
knowledge of the hazards or toxicity of the pesticides they used and little knowledge of
protective measures, such as safe mixing, application practices, and protective clothing.
Dolly (2005) noted that farmers’ indiscriminate use of pesticides was causing
great harm to human health, the environment, and unduly raised the costs of inputs.
According to Ramroop, et al. (2000), farmers frequently used pesticide “cocktails,”
sometimes containing four to five pesticides, and disregarded safety measures, such as
protective clothing and safety intervals before harvests. Momsen (2006) pointed out that
most farmers used “prophylactic spraying, that is spraying on a regular weekly or even
more frequent basis to prevent the emergence of pests” (p.168). Though this practice is
more expensive than the recommended application practices, farmers perceived that the
saved time from checking on the levels of pests was worth the expense.
Yen, Bekele, and Kalloo (1999) reported that farmers commonly exceeded
manufacturers’ recommended application rates and disregarded the recommended pre-
harvest intervals after pesticide application. As a result, pesticide residues on produce in
the markets posed a risk to consumers. They also reported that a market-basket survey
of produce over an eight month period showed that “10% of the produce exceeded the
internationally acceptable maximum residue limits (MRLs) for the respective pesticides”
(p. 991).

51
Pinto Pereira, Boysielal, and Siung-Chang (2007) reported that in Trinidad, only
2.9% (21) of 720 registered products from the four chemical classes were commonly
used. “Paraquat, methomyl, and alpha-cypermethrin (respective trade names are
Gramoxone, Lannate, and Fastac) from World Health Organization (WHO) Hazard
Classes I and II, and glyphosate isopropylamine (Swiper, Class U) are the most
frequently purchased pesticides” (p. 83). Moreover, access to pesticides is uncontrolled:
even children may buy them. Legislative controls have proven to be ineffective due to
lack of human and technical resources.
Hibiscus Mealy Bug Infestation, 1997-2000
Just as Asian rice farmers suffered food production losses from the brown plant
hopper, the Caribbean experienced infestations from 1997 to 2000 of an invasive pest,
the Hibiscus Mealy Bug (HMB) (Dolly, 2005). The HMB threatened food security in
several Caribbean islands by destroying the food crops upon which many farmers and
consumers relied. The crop protection services in the region applied pesticides but were
unable to contain the spread of HMB. The subsequent introduction of biological
parasites, however, controlled the spread of HMB. Food production in the region
rebounded. This course of events demonstrated the effectiveness of pest management
systems which do not rely solely on pesticides. Trinidad and Tobago’s success in
controlling the HMB with biological controls laid the groundwork for the introduction of
FFS. FFS-IPM programs were needed due to pesticide illiteracy and the potential threats
to human health and the environment. In addition, consumers in Trinidad and Tobago

52
were increasingly aware of health concerns and, as a result, were increasingly
demanding pesticide-free foods (Ramroop, et.al., 2000).
FFS in Trinidad and Tobago
In 2000, the Commonwealth Agricultural Bureau International (CABI)
introduced the Farmer Field School (FFS) initiative to the Caribbean (Dolly, 2005). In
2003, the Trinidad and Tobago Ministry of Agriculture Lands and Marine Resources
(MALMR) and CABI introduced FFS in two locations, in the Caura Valley and South
Aranguez. As of January 2008, MALMR has carried out FFSs in over thirty locations in
Trinidad and Tobago (David Dolly, personal communication, January 2008).
There are very few studies on FFS in Trinidad and Tobago. Ramroop, et.al.
(2000) noted that in Trinidad and Tobago, “Gender roles on the farm are clearly defined
with the male being responsible for decision-making, while females are merely
assistants” (p. 63). In similar fashion, Dolly (2005) pointed out that in the first two FFSs
conducted in Trinidad and Tobago, that though women outnumbered men as
participants, gender barriers inhibited information-sharing. Though males dominated the
FFS activities, females gained sufficient confidence to share their opinions, whereas
before their exposure to the participatory learning methods in FFS they would have
remained silent. Pontius, Dilts, and Bartlett (2000) pointed out that historically FFSs
have focused on the empowerment of underrepresented and marginalized populations,
including women.
Dolly (2005) reported that the FFS participants had a mean age of 45 years while
the non-participants had a mean age of 55 years. Participants and non-participants had

53
farmed 20 years and 27 years, respectively. Participants reported a monthly farm
income of $TT 3,409 (in January 2005, $550 USD) and the non-participants reported
$TT 3,197 (at that time, $516 USD). Mean monthly expenditures on pesticides for FFS
participants was $TT 2,516 ($406 USD) and for non-participants it was $TT 1,883 ($298
USD).
Dolly (2005) reported non-participants’ purported reasons for not attending a
FFS. First, non-participants cited an unwillingness to give up their time, particularly
considering the time commitment of weekly meeting times of four hours each during the
months of cultivation. Second, they believed that they did not need the training. Third,
they claimed that they were unaware of the educational programming being offered.
Dolly (2005) noted that in two Farmer Field Schools in Trinidad and Tobago, less than
40% of the program participants indicated that they had sought advice from the
government agricultural officer, the agribusiness shop, neighbors, or relatives. This is an
unusual and unlikely statistic. Moreover, the priority ranking of the sources of
information for the 60% who have sought advice from those sources is unknown.
Dolly (personal communication, January 2006) pointed out that those who
participated in the earliest FFSs in Trinidad and Tobago were individuals who had
frequent contacts with the extension officers. They were participants who regularly
worked and cooperated with the officers. He expressed his candid view that if the FFSs
were to be a viable option as an extension methodology for improved pest control
management in Trinidad and Tobago, farmers with little to no contact with the ministry
must be targeted.

54
Finally, one of the topics that was approached during the feasibility study in
October 2006 was the concept of using competitions, whether within the FFSs or
between the various FFSs, as a means for increasing the popularity of FFS for those
already involved, and to attract non-participants to join the program. It was recognized
at that time the likelihood that there would be little, if any, literature on the use of
competitions within FFS. In addition, it is possible that competitions have never been
used within a FFS to spur learning and the program’s popularity among farmers. For the
above reasons, the researcher determined to explore the concept of whether competitions
may be a vehicle for increasing the popularity of FFS in Trinidad and Tobago.
Figure 2 provides a conceptual framework for this study on the factors in
completion, non-completion, and non-participation in five Farmer Field Schools in
Trinidad and Tobago from May to September 2007.

55
Figure 2. Conceptual Framework: The Factors in Completion, Non-Completion, and Non-Participation in Five Farmer Field Schools in Trinidad and Tobago, 2007

56
CHAPTER III
METHODOLOGY
This chapter presents the research design, population and sample, instrument
development, data collection, and data analysis procedures of the study. The purpose of
the study was to identify and analyze factors affecting completion, non-completion, and
non-participation in the Farmer Field Schools funded and managed by the Ministry of
Agriculture, Lands, and Marine Resources (MALMR) in Trinidad and Tobago.
Following are the research objectives identified to accomplish the purpose of the study.
1. Determine the personal characteristics of FFS completers, non-completers, and
non-participants.
c. Describe selected personal characteristics of FFS completers, non-
completers, and non-participants.
d. Describe the relationship between participation status and personal
characteristics.
2. Identify the motivations for participation in a FFS.
a. Describe FFS completers’ and non-completers’ motivations for
participation in a FFS at the beginning of the program.
b. Determine if a significant relationship exists between motivations for
participation and completion or non-completion of FFSs.
3. Determine the perceptions of selected farming practices (i.e., integrated pest
management, financial factors, and the compatibility of integrated pest
management in the social setting).

57
a. Describe FFS completers’ and non-completers’ perceptions of selected
farming practices at the beginning of the FFS.
b. Determine if there is a statistically significant difference in completers’
and non-completers’ perceptions of selected farming practices at the
beginning of a FFS.
c. Describe FFS completers’ and non-completers’ perceptions of selected
farming practices at the end of a FFS.
d. Determine if there is a statistically significant difference in completers’
and non-completers’ perceptions of selected farming practices at the end
of the FFS.
e. Determine if there was a statistically significant change in completers’
perceptions at the beginning and end of a FFS on selected farming
practices.
f. Determine if there was a statistically significant change in non-
completers’ perceptions at the beginning and end of FFS on selected
farming practices.
g. Describe FFS program non-participants by selected farming practices.
h. Determine if a significant relationship exists between participation status
and perceptions about selected farming practices.
4. Establish the priority rankings of their sources of information for farming.
a. Describe completers’ priority ranking of their sources of information for
farming at the beginning and end of FFS.

58
b. Describe FFS non-completers’ priority ranking of their sources of
information for farming at the beginning and end of a FFS.
c. Describe FFS non-participants’ priority rankings of their sources of
information for farming.
5. Identify the deterrents to participation in the FFS.
a. Describe FFS program completers, non-completers, and non-participants
by the deterrents to participation (life situation factors, institutional
factors, and dispositional factors).
b. Determine if a significant relationship exists between the deterrents to
participation and participation status.
6. Determine the usefulness of competitions as a means for increasing the
popularity of FFSs.
a. Describe FFS program completers, non-completers, and non-participants
as to their perceptions of the usefulness of competitions as a means for
increasing the popularity of the FFSs.
b. Determine if a significant relationship exists between respondents’
perceptions of the usefulness of competitions as a means for increasing
the popularity of FFS and participation status.
Research Design
To meet these objectives, an ex-post facto causal-comparative research design
was utilized to investigate the attitudes and perceptions of Farmer Field School (FFS)
program completers, non-completers, and non-participants regarding their motivations

59
for participation, perceptions on the use of pesticides in farming, the financial factors
involved in the adoption of integrated pest management, and the compatibility of
integrated pest management within the setting of Trinidad and Tobago, and the use of
competitions as a means to increase the popularity of FFS. The relationship between the
life situation factors, institutional factors, and personal preference factors and
completion, non-completion, or non-participation in FFSs was also investigated.
Ex-post facto research relies on “observations of relationships between naturally
occurring variations in the presumed independent and dependent variables” (Gall, Gall,
& Borg, 2007, p. 306). The research design allowed for studying natural, pre-existing
variations in the independent and dependent variables as a result of the survey
respondents’ exposure to (or knowledge of) a Farmer Field School.
Population and Sample
The research objectives addressed issues pertaining to participating and non-
participating farmers in the Farmer Field Schools (FFSs). The population was FFS-
participating and non-participating farmers in Trinidad and Tobago. The sample was
limited to farmers who participated (i.e., completers and non-completers) in five specific
FFSs and farmers who possessed knowledge of the program but chose to not participate.
FFS completers began and were active participants until the end of the
educational program. These individuals were recognized at the end of the program as
FFS graduates at the graduate-recognition ceremony. FFS program non-completers were
those farmers who initiated participation in the FFS program but at the end of the

60
program were not active members of the FFS group. These individuals were not
recognized as FFS graduates at the graduate-recognition ceremony. Non-participants
were classified as such because they fit at least one of the following descriptions: 1) The
agricultural officer (i.e., extension agent) met with the intended participant and after
describing the Field School to the person, the person declined an invitation to participate.
2) The individual visited the introductory Farmer Field School activity and decided not
to continue to participate in the school. 3) A member of the community or someone else
described the school to the intended participant and the person decided not to participate.
There were one-hundred nine respondents: fifty-six completers (51.3%), fifteen
non-completers (13.7%), and thirty-eight non-participants (34.8%) across five Farmer
Field Schools. The five FFSs were at Transfer Village, La Trinidad, Grand Fond,
Cemetery Trace, and Platanite.
• Transfer Village FFS is located in the Debe District, County Victoria, in southern
Trinidad.
• La Trinidad FFS is located in the Talparo District, County Saint George East, in
north-central Trinidad.
• Grand Fond FFS is located in the Santa Cruz District, County Saint George West,
in northwest Trinidad.
• Cemetery Trace FFS is located in the Freeport District, County Caroni, in central
Trinidad.
• Platanite FFS is located in the Rochard District, County Saint Patrick East, in
south Trinidad.

61
These five FFS were selected by MALMR personnel and the researcher due to
the time frame established by the researcher, the overlapping schedules of operation of
the FFS, and the availability of extension personnel who served as data collectors. The
respondents were identified through a process according to whether they were a
completer, non-completer, or non-participant. At the beginning of the educational cycle,
the data collectors attended a FFS outside the geographic region in which they work. At
that stage in the educational cycle, program participants could not yet be categorized as
completers or non-completers. The data collectors gathered information from all of the
program participants (completers and non-completers: n=71) for the questionnaire
Participants at the Beginning of the Educational Cycle. At the end of the educational
cycle, the non-completers were identified by the agricultural officers who serve as FFS
facilitators on a weekly basis and by the program completers. The non-participants were
identified by the FFS facilitators, program completers, and program non-completers.
Instrument Development
Farmer Field School completers’, non-completers’, and non-participants’
attitudes and perceptions were collected using three questionnaires (Participants at the
Beginning of the Educational Cycle, Completers and Non-Completers, and Non-
Participants) containing Likert-scaled questions and open-ended responses. Reverse
coding of some statements was used to reduce the biasing effect (Tuckman, 1999). The
Likert-type scales measured the farmers’ agreement levels (1=Strongly Disagree,
2=Disagree, 3=Agree, and 4=Strongly Agree) with statements. The open-ended

62
questions were limited to seven questions requesting personal information: the number
of friends who had previously participated in an FFS, the number of family members
who had previously participated in an FFS, age, the size of their farm, the number of
years they had lived in the community, the number of years they had farmed, and the
percentage of annual income derived from agriculture. The administration of each of the
three questionnaires took approximately fifteen to twenty minutes to complete.
Validity
Validity is an important construct in research used to measure the value of an
instrument. Validity determines how well and instrument measures what it is meant to
measure (Gall, Gall, & Borg, 2007).
The instruments were checked for face validity by a panel of 15 MALMR
extension agents with vast experience conducting FFSs in Trinidad and Tobago. The
panel gave suggestions to improve the clarity and cultural sensitivity of the questions.
Five members of the panel were selected to carry out the survey in the five FFS.
Training was conducted to ensure that the interviewers would follow a standard protocol,
thus ensuring the content validity of the instruments. In addition, a measure for reducing
social desirability bias was established. The data collectors (i.e., the extension agents)
traveled to FFSs outside of their geographic region. They did not know any of the
respondents, thus reducing the possibility of social desirability bias.
Questionnaire: Participants at the Beginning of the Educational Cycle
The questionnaire, Participants at the beginning of the educational cycle, was
only completed by program participants (i.e., completers and non-completers). It
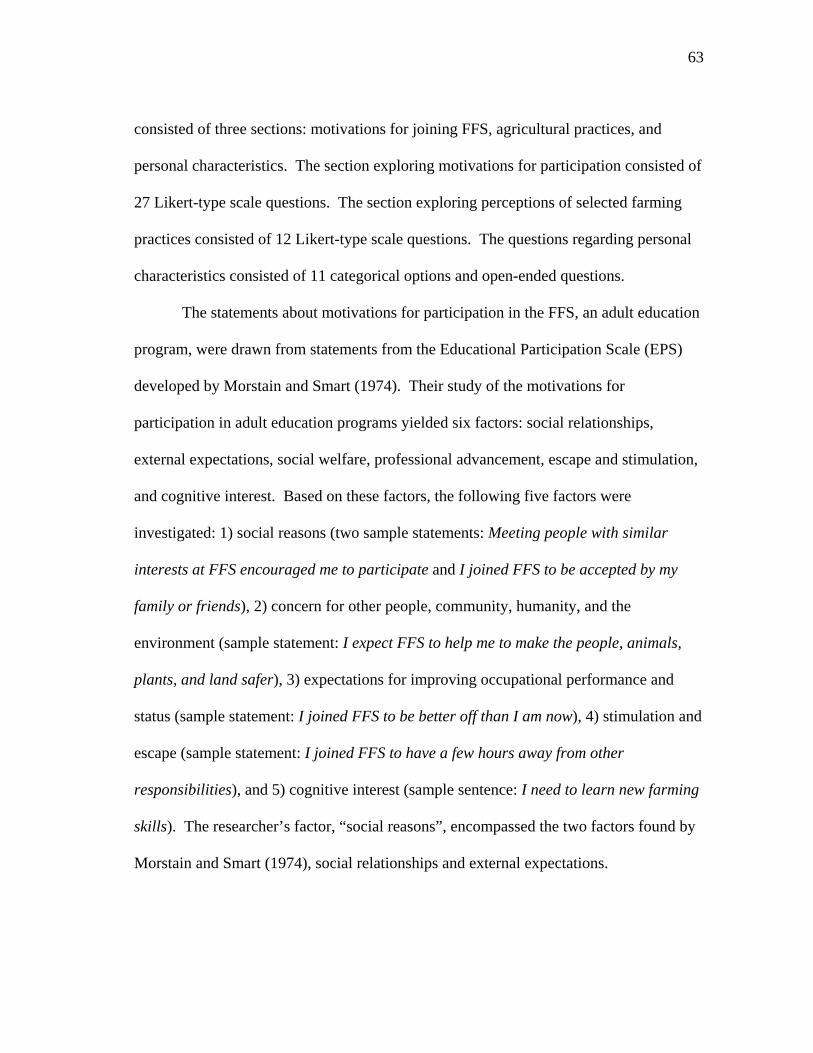
63
consisted of three sections: motivations for joining FFS, agricultural practices, and
personal characteristics. The section exploring motivations for participation consisted of
27 Likert-type scale questions. The section exploring perceptions of selected farming
practices consisted of 12 Likert-type scale questions. The questions regarding personal
characteristics consisted of 11 categorical options and open-ended questions.
The statements about motivations for participation in the FFS, an adult education
program, were drawn from statements from the Educational Participation Scale (EPS)
developed by Morstain and Smart (1974). Their study of the motivations for
participation in adult education programs yielded six factors: social relationships,
external expectations, social welfare, professional advancement, escape and stimulation,
and cognitive interest. Based on these factors, the following five factors were
investigated: 1) social reasons (two sample statements: Meeting people with similar
interests at FFS encouraged me to participate and I joined FFS to be accepted by my
family or friends), 2) concern for other people, community, humanity, and the
environment (sample statement: I expect FFS to help me to make the people, animals,
plants, and land safer), 3) expectations for improving occupational performance and
status (sample statement: I joined FFS to be better off than I am now), 4) stimulation and
escape (sample statement: I joined FFS to have a few hours away from other
responsibilities), and 5) cognitive interest (sample sentence: I need to learn new farming
skills). The researcher’s factor, “social reasons”, encompassed the two factors found by
Morstain and Smart (1974), social relationships and external expectations.

64
The second set of questions on Participants at the Beginning of the Educational
Cycle consisted of twelve Likert-scale statements. It investigated the completers’ and
non-completers’ perceptions about the use of pesticides in farming (sample statement:
Pollution from agricultural chemicals is a serious problem on my farm), financial factors
involved in the adoption of integrated pest management (sample statement: I am willing
to make less money this year and more money in the future to try new farming methods
that protect people, animals, plants, and land), and the compatibility of integrated pest
management with the social setting of Trinidad and Tobago (sample statement:
Consumers will pay higher prices for pesticide-free produce). The section consisting of
statements on the use of pesticides in farming were drawn from statements developed by
McCann, Sullivan, Erickson, and DeYoung (1997) in a study comparing the perceptions
of organic and conventional farmers in Washtenaw County, Michigan regarding farming
practices, environmental awareness, and their orientation toward economic factors in
adopting organic farming.
The third set of questions on Participants at the Beginning of the Educational
Cycle requested personal information, including the number of family members who
have participated in an FFS, the number of friends who have participated in an FFS,
gender, age, marital status, educational background, size of their farm, number of years
lived in the community, number of years farmed, the percentage of annual income
derived from agriculture, and whether they have participated in any agricultural
extension programs prior to the FFS. Included in this section was the question: Where

65
do you most often get information on farming? The question asked the respondent to
rank their top three sources of information on farming.
Questionnaires: Completers & Non-Completers and Non-Participants
The second and third questionnaires, Completers and Non-Completers and Non-
Participants, consisted of three sections. First, there were 38 Likert-scale questions on
the factors that influenced individuals to complete, not complete, or not participate in
FFS. Utilizing the framework established by Cross (1992), the questions explored the
life situation barriers, institutional barriers, and dispositional barriers to participation.
Sample statements of the life situation barriers are: Responsibilities at work/farming kept
me from participating in the FFS and I joined FFS because the agricultural officer
suggested it to me. The statements regarding the institutional factors were classified into
the following four constructs: 1) Convenience (sample statement: FFS was offered in an
acceptable location), 2) Process and Application (sample statement: The practices
promoted in FFS are relevant to my farming situation), 3) Climate (sample statement: I
could freely voice my opinions during FFS meetings), and 4) Outcomes (sample
statement: I am happy with the quality of the FFS program). For increased clarity for
the respondents, the researcher renamed Cross’ (1992) third barrier to participation,
dispositional barriers, to Personal Preferences. Sample statements of the respondents’
personal preferences (i.e., dispositional barriers to participation) include: I like learning
by myself more than with a group of people and I know enough about farming and do not
need the FFS.

66
The second sections on the questionnaires Completers and Non-Completers and
Non-Participants consisted of 37 Likert-type scale questions about selected agricultural
practices, including a new section on the use of competitions as a means for increasing
the popularity of FFS. The added section on competitions included statements such as, I
like participating in competitions and A FFS-sponsored vegetable-growing competition
for FFS participants will increase the popularity of FFS in my community.
The third section consisted of the same questions requesting respondents’
personal information found on the questionnaire administered at the beginning of the
educational cycle, including the request to rank their sources of information on farming.
Data Collection
A feasibility study was conducted in October 2006. The researcher met with
farmers of two FFSs, several extension agents from MALMR, and Dr. David Dolly from
the University of the West Indies. It was concluded that a study on the factors
influencing participation in FFS in Trinidad and Tobago was a timely endeavor. The
researcher contacted the Ministry of Agriculture, Lands, and Marine Resources
(MALMR) in writing to request permission to conduct the study. Ms. Phillippa Ford,
the Permanent Secretary of Agriculture at MALMR, Ms. Pauline Dowlath of MALMR,
and Dr. David Dolly from the University of the West Indies in Trinidad and Tobago
offered their support to the study.
The five data collectors received training to ensure that they would follow a
standard protocol, thus ensuring the content validity of the instruments. Moreover, in an

67
effort to reduce social desirability bias, the agricultural officers serving as data
collectors, traveled to FFSs outside of the geographic region in which they work. They
did not know any of the respondents prior to the data collection phase of the study. The
non-completers and non-participants were identified by the agricultural officer who
served as a FFS facilitator on a weekly basis and by the program completers.
Data were gathered from late May to late September 2007. In May, the FFS
participants completed the questionnaire Participants at the Beginning of the
Educational Cycle. Upon completion of the five FFSs in August 2007, the participants
completed the questionnaire Completers and Non-Completers. The five extension
agents who served as data collectors indicated on the questionnaire whether the
respondent was a completer or non-completer, according to the prescribed definitions of
those classifications. Because non-participants were not active in the FFS program, and
merely possessed an awareness of the program and decided to not join the FFS, the
extension agents could administer the questionnaire Non-Participants at any time after
the initial FFS meeting.
The 109 respondents were not compensated for their contributions to the study.
The data collectors, however, were financially compensated for their services rendered.
The five extension agents were selected by MALMR personnel to serve as data
collectors due to their familiarity with the purposes and methods used in FFS, their
professionalism, and integrity.
At the onset of administering the survey, the data collectors ensured respondents’
confidentiality. Each respondent had the right to refuse participation in the study. Upon

68
agreeing to participate in the study, the respondents’ signed the consent form. The
questionnaires were coded to ensure confidentiality and to facilitate the exploration of
the relationships between the perceptions of FFS program completers, non-completers,
and non-participants. Data were collected in conformity with the research guidelines set
by the Texas A&M University Institutional Review Board (IRB).
Data Analysis
Quantitative data analysis was conducted via the Statistical Package for Social
Sciences (SPSS Version 15) to determine reliability, frequencies, percentages, means,
standard deviations, chi-square test for independence, independent samples t-tests, and
paired samples t-tests, one-way analysis of variance (ANOVA), and post-hoc tests of
differences. Statistical significance was established at the .05 level of probability.
Thirteen of the items included in the instrument were negative statements. The
negative statements were subsequently recoded so that the summated scale would consist
of unidirectional responses.
Reliability
Reliability is an important construct in research used to measure the value of an
instrument. Reliability establishes how well the instrument produces the same results on
recurring occasions (Gall, Gall, & Borg, 2007).
The constructs of the three instruments were reliable (Table 1). Cronbach Alpha
and the inter-item correlation were used to show the internal consistency of the
constructs investigated. Cronbach alpha is the most commonly used statistic for

69
reliability. It provides an average correlation among all of the items in the scale (Pallant,
2005). Nunnally (1978) recommended a minimum Cronbach alpha level of 0.7.
Cronbach alpha values, however, are dependent on the number of items in the scale.
When there are fewer than ten items in the scale, Cronbach alpha values tend to be
small, thus it may be better to calculate and report the mean inter-item correlation for the
scales. The optimal mean inter-item correlation values range from 0.2 to 0.4 (Briggs &
Cheek, 1986).
By the standard of a minimum Cronbach alpha of 0.7, only eight of the eighteen
constructs suggested sufficient reliability. Tuckman (1999) opined, however, that the
minimum reliability for attitude tests (i.e., perceptions) is .50. Ary, Jacobs, and
Razavieh (1996) also supported the minimum threshold of 0.50:
The degree of reliability needed in a measure depends to a great extent on the use
that is to be made of the results. If the measurement results are to be used for
making a decision about a group or even for research purposes, a lower reliability
coefficient (in the range or 0.50 to 0.60) might be acceptable. (p. 287)
By a minimum standard of Cronbach alpha of 0.50 (Tuckman, 1999; Ary, Jacobs
& Razavieh, 1996), fourteen of the eighteen constructs were considered sufficiently
reliable.

70
Table 1 Tests of Instrument Reliability (N=109) Cronbach’s
Alpha Inter-item correlation
Constructs Participants at the Beginning of the Educational Cycle Cognitive interest .86 .56 Expectation for improving occupational performance & status
.82 .50
Concern for people, community, and environment .75 .32 Use of pesticides (pre-test) .68 .30 Social reasons .61 .18 FFS as Stimulation and Escape .57 .23 Compatibility of IPM (pre) .48 .23 Financial factors (pre-test) .32 .10 Completers and Non-Completers & Non-Participants Inst: Outcomes .84 .48 Compatibility of IPM (post-test) .81 .38 Inst.: Convenience .78 .37 Competitions .74 .45 Use of pesticides (post-test) .73 .32 Inst.: Climate .65 .35 Personal preferences .55 .12 Financial factors (post-test) .35 .14 Inst.: Process & application .30 .04 Life situation factors .30 .07
Descriptive statistics were employed to describe the sample. The mean was used
as the measure of central tendency and the standard deviation was the measure of
dispersion. According to Gall, Gall, and Borg (2007), when presented together, the mean
and standard deviation provide a good description of how respondents scored on a
particular measure.
The Likert-scales measured the farmers’ agreement levels (1=Strongly Disagree,
2=Disagree, 3=Agree, and 4=Strongly Agree) with statements. For the data analysis

71
purposes, however, the scale was measured as 1-1.5=Strongly Disagree; 1.51-
2.50=Disagree; 2.51-3.50=Agree; and 3.51-4.0=Strongly Agree.
Other basic statistical measures included frequency counts and percentages. This
approach was used in the analysis of the distribution of personal characteristics by
participation status and in the respondents’ ranking of their most important sources of
information about farming.
Chi-square test for independence was used to determine whether two categorical
variables were related. It compares the frequency of cases found in the categories of one
variable across the different categories of another variable (Pallant, 2005). The chi-
square test for independence was used to explore the frequency of the categorical
personal characteristics (gender, marital status, educational background, and whether
they had or had not participated in MALMR extension programming prior to FFS)
across the three participation statuses (i.e., completion, non-completion, or non-
participation).
Independent samples t-tests are used to compare the mean scores of two different
groups of people or conditions. An independent samples t-test indicates whether there is
a statistically significant difference in the mean scores for the two groups. If the
probability score is less than 0.05, there is a significant relationship between the means.
If the probability score is greater than 0.05, the difference between the means is probably
due to chance, and there is not a significant relationship between the means. An
assumption of the independent samples t-test is that the sample scores are independent of
each other.

72
Paired samples t-tests, on the other hand, are used when there is one group of
people and they are tested twice. Pre-test/post test experimental designs use paired
samples t-tests. Two paired samples t-tests was used in this study: 1) to test whether
there was a significant difference in the scores on the measures of the completers’
perceptions on the use of pesticides in farming, financial factors, and compatibility of
integrated pest management with the social setting at the beginning and end of FFS. 2)
To test whether there was a significant difference in the scores on the measures of the
non-completers’ perceptions on the use of pesticides in farming, financial factors, and
compatibility of integrated pest management with the social setting at the beginning and
end of FFS.
A one-way analysis of variance (ANOVA) is used when there is one independent
variable with three or more levels and one dependent continuous variable. In this case,
the independent variable is participation status (completers, non-completers, or non-
participants) and the dependent variables are the scores on the measures of the constructs.
An ANOVA indicates whether there are significant differences in the means scores on
the dependent variable across the three groups. Post-hoc tests can then be used to find
out where these differences lie (Pallant, 2005).
The general guidelines for analyzing effect size developed by Cohen (1988) were
used to determine the practical significance of the relationships between participation
status and the personal characteristics. The effect size (eta squared) for ANOVA was
determined according to Cohen’s (1988) guidelines: .01-.059 (small effect), .06-.139
(moderate effect), and .14 or more (large effect). The eta squared value indicates the

73
percentage of the variance in the dependent variable that is explained by the independent
variable.
Summary of the Chapter
This chapter addressed the purpose of the study, the research objectives, the
research design, population and sample, instrument development, data collection, and
data analysis procedures of the study. The validity and reliability of the instruments
Participants at the Beginning of the Educational Cycle, Completers and Non-Completers,
and Non-Participants were discussed. Data were collected in conformity with the
research guidelines set by Institutional Review Board (IRB) of Texas A&M University.
The questionnaires and the consent form used in the study are included in the appendices.

74
CHAPTER IV
RESULTS AND FINDINGS
The purpose of the study was to identify and analyze the factors affecting
completion, non-completion, and non-participation in the Farmer Field School program
in Trinidad and Tobago. Chapter III described the method for the study, which included
details on the sample, instrumentation, and data analysis. Chapter IV presents an
analysis of the data gathered from the three questionnaires: Participants at the beginning
of the educational cycle, Completers and Non-Completers, and Non-Participants.
Demographics of the Five Farmer Field Schools
All of the respondents from Transfer Village were men (Table 2). There were
eleven completers, nine non-completers, and nine non-participants. Completers had
larger farms and earned a greater proportion of their income from farming than did non-
completers and non-participants.
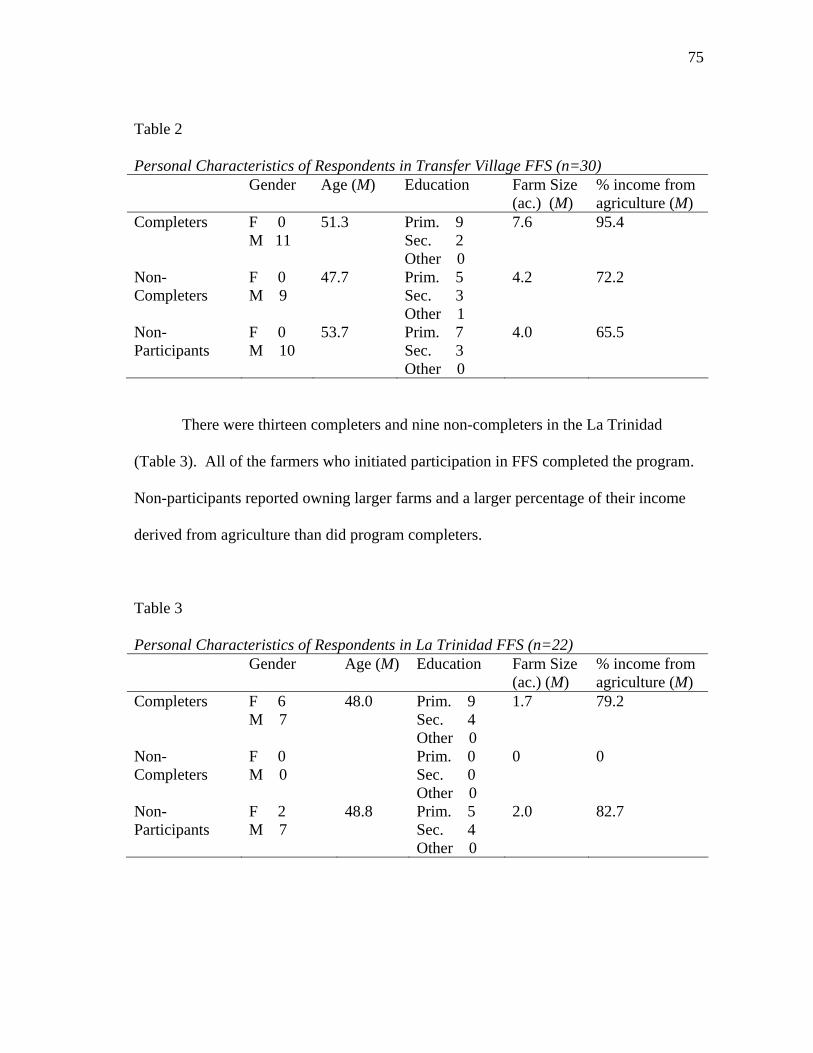
75
Table 2
Personal Characteristics of Respondents in Transfer Village FFS (n=30) Gender Age (M) Education Farm Size
(ac.) (M) % income from agriculture (M)
Completers F 0 M 11
51.3 Prim. 9 Sec. 2 Other 0
7.6 95.4
Non-Completers
F 0 M 9
47.7 Prim. 5 Sec. 3 Other 1
4.2 72.2
Non-Participants
F 0 M 10
53.7 Prim. 7 Sec. 3 Other 0
4.0 65.5
There were thirteen completers and nine non-completers in the La Trinidad
(Table 3). All of the farmers who initiated participation in FFS completed the program.
Non-participants reported owning larger farms and a larger percentage of their income
derived from agriculture than did program completers.
Table 3
Personal Characteristics of Respondents in La Trinidad FFS (n=22) Gender Age (M) Education Farm Size
(ac.) (M) % income from agriculture (M)
Completers F 6 M 7
48.0 Prim. 9 Sec. 4 Other 0
1.7 79.2
Non-Completers
F 0 M 0
Prim. 0 Sec. 0 Other 0
0 0
Non-Participants
F 2 M 7
48.8 Prim. 5 Sec. 4 Other 0
2.0 82.7

76
In Grand Fond, there were nine completers and seven non-participants. All of
the farmers who initiated participation in FFS completed the program (Table 4).
Completers farm more land than non-participants yet the percentage of their income
derived from agriculture is less than that reported by non-participants.
Table 4
Personal Characteristics of Respondents in Grand Fond FFS (n=16) Gender Age (M) Education Farm Size
(ac.) (M) % income from agriculture (M)
Completers F 2 M 7
45.6 Prim. 6 Sec. 3 Other 0
6.3 51.1
Non-Completers
F 0 M 0
Prim. 0 Sec. 0 Other 0
0 0
Non-Participants
F 1 M 6
48.6 Prim. 3 Sec. 3 Other 1
4.4 80.7
In Cemetery Trace, there were eight completers and six non-participants. All of
the farmers who began FFS completed the program (Table 5). Completers reported
farming larger farms and a larger percentage of their income derived from agriculture
than did non-participants.

77
Table 5
Personal Characteristics of Respondents in Cemetery Trace FFS (n=14) Gender Age (M) Education Farm Size
(ac.) (M) % income from agriculture (M)
Completers F 0 M 8
50.5 Prim. 8 Sec. 0 Other 0
4.6 90.6
Non-Completers
F 0 M 0
Prim. 0 Sec. 0 Other 0
0 0
Non-Participants
F 0 M 6
46.7 Prim. 3 Sec. 3 Other 0
3.4 36.6
In Platanite, there were fifteen completers, six non-completers, and six non-
participants (Table 6). Completers possessed more land, on average, than the non-
completers and non-participants. Agriculture contributed the most to the annual income
of non-participants.
Table 6
Personal Characteristics of Respondents in Platanite FFS (n=27) Gender Age (M) Education Farm Size
(ac.) (M) % income from agriculture (M)
Completers F 7 M 8
35.5 Prim. 6 Sec. 8 Other 0
4.0 71.3
Non-Completers
F 5 M 1
29.8 Prim. 2 Sec. 4 Other 0
3.0 66.7
Non-Participants
F 0 M 6
48.3 Prim. 3 Sec. 4 Other 0
3.8 75.0

78
Objective 1: Personal Characteristics
1a. Describe the Personal Characteristics Which Describe FFS Completers, Non-
Completers, and Non-Participants
The personal characteristics investigated included the number of family who
have participated in FFS, the number of friends who have participated in FFS, gender,
age, current marital status, last class level completed (education), size of farm, years
lived in the community, years farmed, percentage of annual income derived from
agriculture, and whether they have participated in agricultural extension programs before
participating in a FFS (Table 7).
Following are some highlights of the characteristics of completers, non-
completers, and non-participants in the five FFSs.
• The majority of FFS completers (57.1%), non-completers (66.7%), and non-
participants (71.1%) had no family members who had participated in previous
FFS.
• Completers (39.5%) had five or more friends who had participated in FFS while
non-completers (77.3%) and non-participants (44.7%) typically had fewer (0-1
friends) who had participated in an FFS.
• The vast majority of respondents were men: completers (73.2%), non-completers
(66.7%), and non-participants (92.1%).
• Program completers (41.1%) and non-completers (46.7%) were younger than 44
years old while program non-participants (42.1%) were older than 53 years of
age.
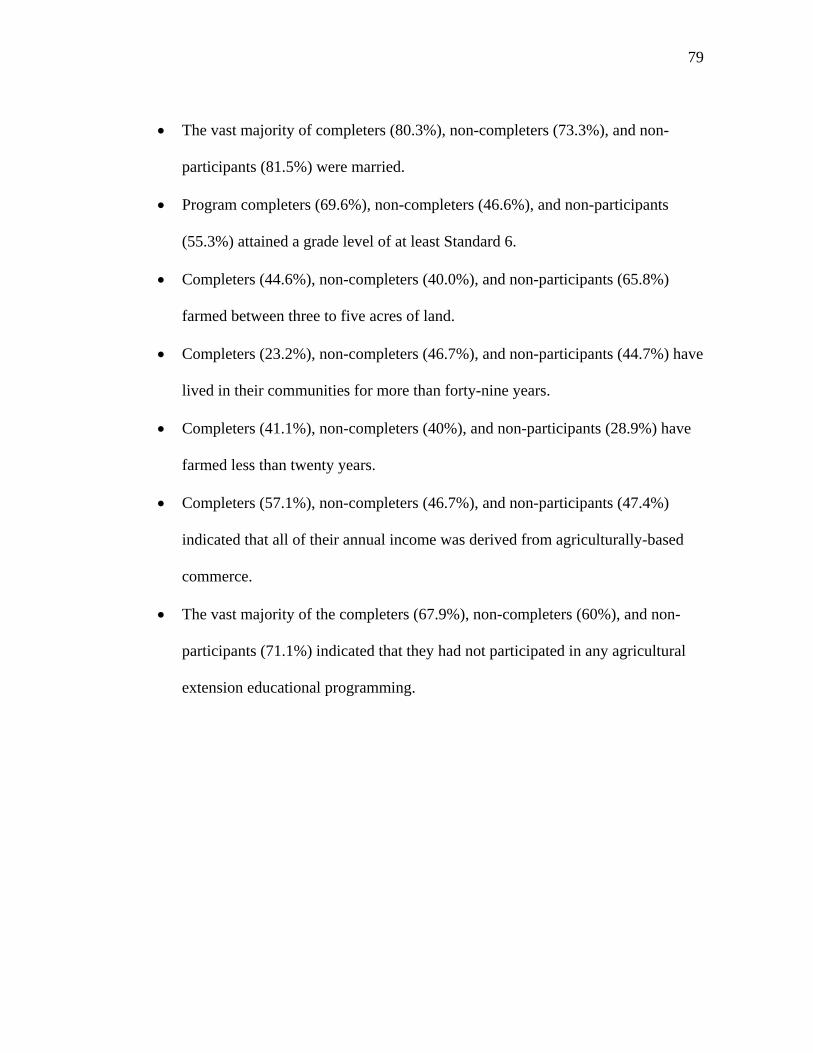
79
• The vast majority of completers (80.3%), non-completers (73.3%), and non-
participants (81.5%) were married.
• Program completers (69.6%), non-completers (46.6%), and non-participants
(55.3%) attained a grade level of at least Standard 6.
• Completers (44.6%), non-completers (40.0%), and non-participants (65.8%)
farmed between three to five acres of land.
• Completers (23.2%), non-completers (46.7%), and non-participants (44.7%) have
lived in their communities for more than forty-nine years.
• Completers (41.1%), non-completers (40%), and non-participants (28.9%) have
farmed less than twenty years.
• Completers (57.1%), non-completers (46.7%), and non-participants (47.4%)
indicated that all of their annual income was derived from agriculturally-based
commerce.
• The vast majority of the completers (67.9%), non-completers (60%), and non-
participants (71.1%) indicated that they had not participated in any agricultural
extension educational programming.

80
Table 7 Distribution of Personal Characteristics by Participation Status (N=109) Completers Non-
Completers Non-
ParticipantsStatement f % f % f %Total 56 51.3 15 13.7 38 34.8 Number of family who have participated 0 32 57.1 10 66.7 27 71.11 10 17.9 3 20.0 6 15.82+ 14 25 2 13.3 5 13.2 Number of friends who have participated 0-1 16 28.6 11 73.3 17 44.72-4 18 32.1 4 26.7 12 31.65+ 22 39.3 0 0 9 23.7 Gender Female 15 26.8 5 33.3 3 7.9Male 41 73.2 10 66.7 35 92.1 Age 0-44 23 41.1 7 46.7 10 26.345-52 18 32.1 5 33.3 12 31.653+ 15 26.8 3 20.0 16 42.1 Current Marital Status Single 10 17.9 4 26.7 4 10.5Married 45 80.3 11 73.3 31 81.5Separated/Divorced 1 1.8 0 0 3 7.9Widowed 0 0 0 0 0 0 Education Standard 1-3 5 8.9 3 20.0 3 7.9Standard 4-5 18 32.1 2 13.3 10 26.3Standard 6 16 28.6 2 13.3 8 21.1Form 1-3 4 7.1 2 13.3 5 13.2Form 4-5 12 21.4 4 26.7 9 23.7Form 6 1 1.8 1 6.7 2 5.3Other 0 0 1 6.7 1 2.6

81
Table 7 (continued) Completers Non-
Completers Non-
ParticipantsStatements f % f % f %Size of farm 0-2 23 41.1 6 40.0 10 26.33-5 25 44.6 6 40.0 25 65.86+ 8 14.3 3 20.0 3 7.9 Years lived in the community 0-26 18 32.1 6 40.0 10 26.327-48 25 44.6 2 13.3 11 28.949+ 13 23.2 7 46.7 17 44.7 Years farmed 0-20 23 41.1 6 40.0 11 28.921-35 17 30.4 3 20.0 12 31.636+ 16 28.6 6 40.0 15 39.5 Percentage of annual income derived from agriculture
0-50 16 28.6 7 46.7 16 42.151-99 8 14.3 1 6.7 4 10.5100 32 57.1 7 46.7 18 47.4 Participated in agricultural extension programs before FFS
Yes 18 32.1 6 40.0 11 28.9No 38 67.9 9 60.0 27 71.1
1b. Determine if a Significant Relationship Exists Between the Personal Characteristics
and Participation Status
A one-way between-groups analysis of variance was conducted to explore the
impact of the personal characteristics on participation status. In the one-way between-
groups analysis of variance (Table 8), a statistically significant relationship was found
between participation status and the number of friends who had participated in FFS [F
(2, 106) = 5.7, p<.05]. The effect size (Cohen, 1988) was moderate (eta squared=.10).

82
Ten percent of the variance in the number of friends is explained by participation status.
The Tukey post-hoc analysis (Table 9) indicated that the mean score for non-completers
(M=3.50, SD= 4.6) was significantly different from the completers (M=5.2, SD= 5.2).
The non-participants (M=3.5, SD=4.6) did not differ significantly from either the
completers or non-completers. The finding was that completers had more friends who
had participated in FFS than did non-completers and non-participants.
A statistically significant relationship was found between participation status and
age [F (2,106) = 3.7, p<.05]. The effect size (Cohen, 1988) was moderate (eta
squared=.07). Seven percent of the variance in age was explained by participation
status. The post-hoc comparison of means (Table 10) indicated that the mean score for
non-completers (M=40.5, SD=14.2) was significantly different from non-participants
(M=49.6, SD=10.2). The completers (M=45.3, SD=11.6) did not differ significantly
from either non-completers or non-participants. The finding was that, on average, the
non-completers were the youngest, the completers were in the middle, and non-
participants were the oldest of the three classifications.

83
Table 8
Analysis of Variance: Participation Status and Personal Characteristics (N=109) Personal characteristics N M SD F p dNumber of family who have participated in FFS
Completers 56 1.1 2.0 2.1 1.22 .04Non-Completers 15 .5 .9 Non-Participants 38 .5 .1
Number of friends who have participated in FFS
Completers 56 5.2 5.2 5.7 .00* .10 Non-Completers 15 .8 .9 Non-Participants 38 3.5 4.6
Age
Completers 56 45.3 11.6 3.7 .03* .07Non-Completers 15 40.5 14.2 Non-Participants 38 49.6 10.2
Size of Farm
Completers 56 4.6 5.8 .7 .5 .01Non-Completers 15 3.7 2.4 Non-Participants 38 3.6 1.9
Years lived in community
Completers 56 35.9 17.2 1.3 2.7 .02 Non-Completers 15 37.8 17.4 Non-Participants 38 41.7 16.6
Years Farmed
Completers 56 26.8 15.2 1.8 .17 .03Non-Completers 15 26.3 18.6 Non-Participants 38 32.5 13.4
Percentage of annual income derived from agriculture
Completers 56 77.4 30.3 .86 .43 .02Non-Completers 15 70.0 31.6 Non-Participants 38 69.3 32.8
Notes: 1=Strongly Disagree; 2=Disagree; 3=Agree; 4=Strongly Agree *p<0.05 Cohen’ d (1988): 0.01-.059 (small effect), 0.06-.139 (moderate effect), 0.14 or more (large effect)

84
Table 9 Post Hoc: Number of Friends Who Have Participated in FFS by Participation Status Participation Status Means for Groups (Subset for alpha=.05) Non-Completers .80Non-Participants 3.50 3.50Completers 5.20 Table 10 Post Hoc: Age by Participation Status Participation Status Means for Groups (Subset for alpha=.05) Non-Completers 40.53 Completers 45.27 45.27 Non-Participants 49.63
A Chi-square test for independence (Table 11) was conducted to explore the
impact of the (categorical) personal characteristics on participation status. Only gender
was statistically significant [X2(1, df = 109), 6.41, p<.05]. The effect size (Cohen, 1988)
was large (eta squared=.24). The finding was that men vastly outnumbered women in
the five FFSs.

85
Table 11 Chi-Square Tests: Personal Characteristics by Participation Status df X2 P d (phi)
Personal characteristics Gender 1 6.41 .04* .24Current Marital Status 3 5.21 .52 .22Education 6 9.99 .62 .30Participated in agricultural extension programs before FFS
1 .603 .74 .07
*p<.05 Effect size (phi) (Cohen, 1988): .19 or less (very small), .2-.49(small), .5-.79 (moderate), .8 or more (large)
Objective 2: Motivations for Participation
2a. Describe FFS Completers and Non-Completers’ Motivations for Participation in
FFS at the Beginning of the Program
Five constructs provided the framework for understanding the motivations of
FFS completers and non-completers: 1) social reasons for participation in FFS, 2)
concern for other people, community, humanity, and the environment, 3) expectations
for improving the occupational performance and status, 4) FFS as a means for
stimulation and escape, and 5) cognitive interest (Table 12).
Completers (M=2.86, SD=.53) tended to agree and non-completers (M=2.49,
SD=.23) tended to disagree that they participated in FFS for social reasons. Both FFS
completers (M=2.35, SD=.66) and non-completers (M=2.49, SD=.35) tended to disagree
that they participated in FFS as a means of escape from the routine of life. Completers
(M=3.46, SD=.42) and non-completers (M=3.19, SD=.49) tended to agree that their
concern for other people, community, humanity, and the environment played a role in

86
their decision to join FFS. Completers (M=3.50, SD=.50) and non-completers (M=3.04,
SD=.48) also tended to agree that they joined FFS expecting to gain skills which would
enable them to improve their occupational performance and status. Finally, completers
(M=3.44, SD=.50) and non-completers (M=3.06, SD=.59) tended to agree that their
cognitive interest was a motivating factor in their participation in FFS.
2b. Determine if a Significant Relationship Exists Between Motivations for Participation
and Completion or Non-Completion of FFS
An independent-samples t-test was conducted to compare the self-reported scores
on the motivations for participation in FFS of program completers and non-completers
(Table 13). Four of the five constructs were statistically significantly different for
completers and non-completers. There was not a statistically significant difference
between completers and non-completers on their perceptions of FFS as a means for
stimulation and escape.
A statistically significant relationship was found between completers (M=2.86,
SD.53) and non-completers [M=2.49, SD=.23; t(69)=2.65, p<.05] regarding their social
reasons for participating in FFS. The effect size (Cohen, 1988) was small (eta
squared=.04). This means that only four percent of the variance in completers’ and non-
completers’ perceptions of the social reasons for participating in FFS was explained by
their participation status.
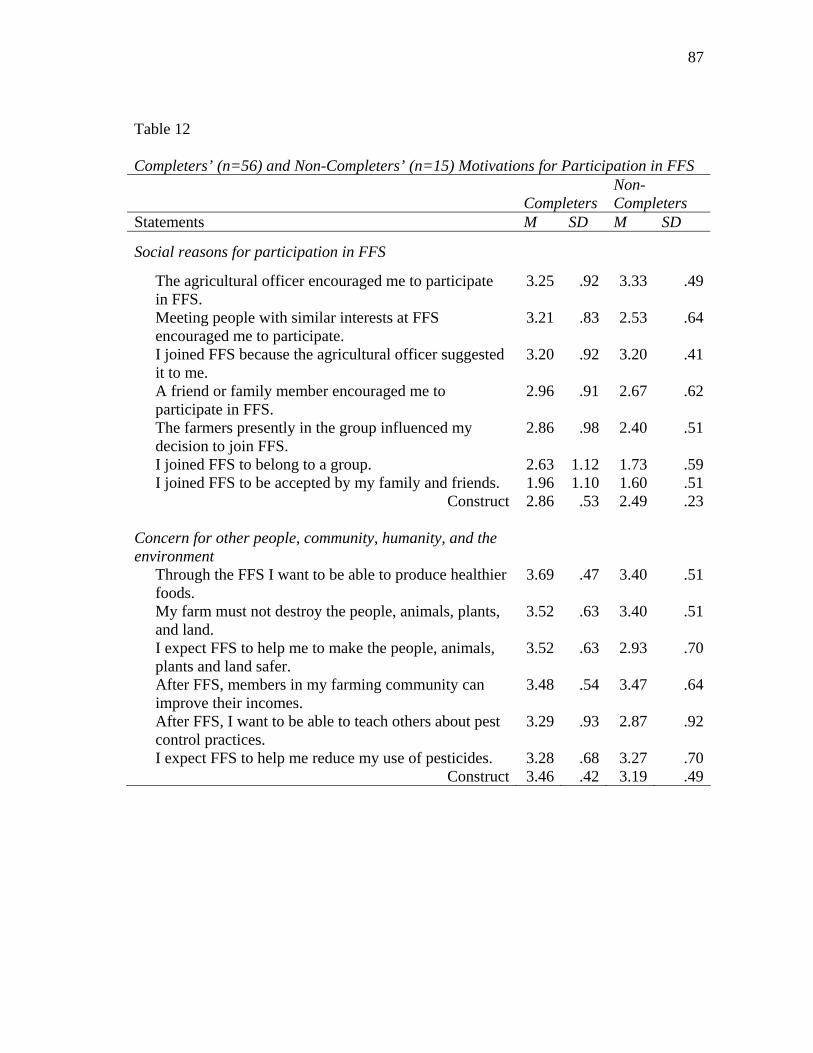
87
Table 12 Completers’ (n=56) and Non-Completers’ (n=15) Motivations for Participation in FFS
Completers Non-Completers
Statements M SD M SD
Social reasons for participation in FFS The agricultural officer encouraged me to participate in FFS.
3.25 .92 3.33 .49
Meeting people with similar interests at FFS encouraged me to participate.
3.21 .83 2.53 .64
I joined FFS because the agricultural officer suggested it to me.
3.20 .92 3.20 .41
A friend or family member encouraged me to participate in FFS.
2.96 .91 2.67 .62
The farmers presently in the group influenced my decision to join FFS.
2.86 .98 2.40 .51
I joined FFS to belong to a group. 2.63 1.12 1.73 .59I joined FFS to be accepted by my family and friends. 1.96 1.10 1.60 .51
Construct 2.86 .53 2.49 .23
Concern for other people, community, humanity, and the environment
Through the FFS I want to be able to produce healthier foods.
3.69 .47 3.40 .51
My farm must not destroy the people, animals, plants, and land.
3.52 .63 3.40 .51
I expect FFS to help me to make the people, animals, plants and land safer.
3.52 .63 2.93 .70
After FFS, members in my farming community can improve their incomes.
3.48 .54 3.47 .64
After FFS, I want to be able to teach others about pest control practices.
3.29 .93 2.87 .92
I expect FFS to help me reduce my use of pesticides. 3.28 .68 3.27 .70Construct 3.46 .42 3.19 .49

88
Table 12 (continued)
Completers Non-Completers
Statements M SD M SD Expectations for improving the occupational performance and status
After the FFS, my customers will like the healthier crops I produce.
3.68 .47 3.33 .49
I see FFS as a chance to improve my farming practices.
3.61 .53 3.20 .41
I saw FFS as a chance to learn how to improve my income.
3.57 .60 3.33 .72
I joined FFS to be better off than I am now. 3.36 .80 2.80 .86I am aware of the benefits of FFS. 3.27 .84 2.53 .74
Construct 3.50 .50 3.04 .48
FFS as a means for stimulation and escape FFS is a different experience to the other activities now in my life.
3.16 .76 3.00 .38
FFS gives me a relaxation break (from the routine of home or work).
2.20 1.07 2.33 .49
I joined FFS to have a few hours away from other responsibilities.
1.68 .83 2.13 .64
Construct 2.35 .66 2.49 .35
Cognitive interest I enjoy learning new things. 3.68 .47 3.33 .62I need to learn new farming skills. 3.57 .57 3.27 .70I joined the FFS to find out more about the benefits of the field school.
3.54 .57 3.27 .60
I joined FFS to improve the decisions I make on the farm.
3.52 .63 3.33 .49
I like learning just to know more. 3.41 .60 2.93 .80FFS will teach me new skills to help me cope with life. 2.93 1.13 2.27 .88
Construct 3.44 .50 3.06 .59Note. 1=Strongly Disagree; 2=Disagree; 3=Agree; 4=Strongly Agree
A statistically significant relationship was found for completers (M=3.46,
SD=.42) and non-completers [M=3.19, SD=.49; t(69)=2.15, p<.05] on the construct
Concern for other people, community, humanity, and the environment. The finding was

89
that completers agreed more than did the non-completers with the statements regarding
their concern for other people and the environment. The effect size (Cohen, 1988) was
moderate (eta squared=.06). Only six percent of the variance in completers’ and non-
completers’ perceptions of their concern for people, community, humanity, and the
environment was explained by participation status.
A statistically significant relationship was found between completers (M=3.50,
SD=.50) and non-completers [M=3.04, SD=.48; t(69)=3.17, p<.05] on the construct
Expectations for improving occupational performance and status. The finding was that
completers agreed more than did the non-completers with the statements regarding their
expectations for improving their occupational performance and status. The effect size
(Cohen, 1988) was moderate (eta squared=.13). Thirteen percent of the variance in
completers’ and non-completers’ expectations of FFS to improve their occupational
performance and status was explained by participation status.
There was a significant difference in scores for completers (M=3.44, SD=.50)
and non-completers [M=3.06, SD=.59; t(69)=2.46, p<.05] regarding cognitive interest as
a motivation for participation in FFS. The finding was that completers agreed more than
did non-completers with the statements regarding cognitive interest as a motivator for
participation in FFS. The effect size (Cohen, 1988) was moderate (eta squared=.08).
Eight percent of the variance in completers’ and non-completers’ cognitive interest as a
motivation for participation in FFS was explained by participation status.
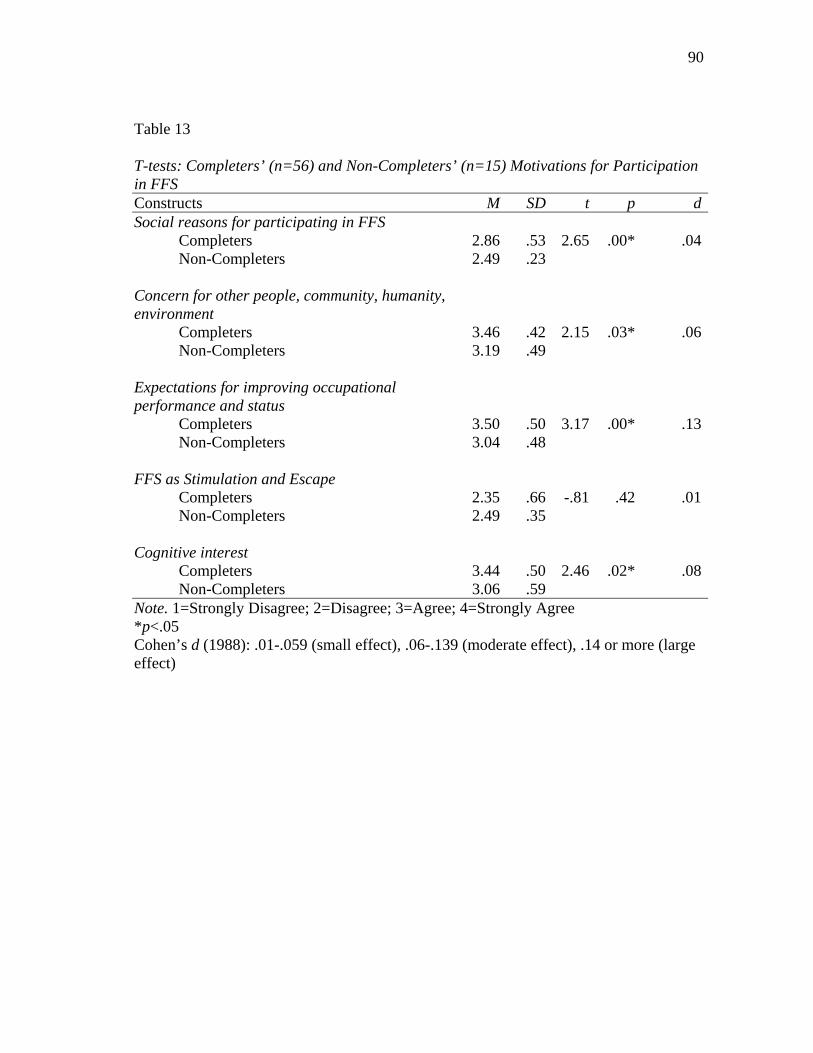
90
Table 13 T-tests: Completers’ (n=56) and Non-Completers’ (n=15) Motivations for Participation in FFS Constructs M SD t p dSocial reasons for participating in FFS
Completers 2.86 .53 2.65 .00* .04Non-Completers 2.49 .23
Concern for other people, community, humanity, environment
Completers 3.46 .42 2.15 .03* .06Non-Completers 3.19 .49
Expectations for improving occupational performance and status
Completers 3.50 .50 3.17 .00* .13Non-Completers 3.04 .48
FFS as Stimulation and Escape
Completers 2.35 .66 -.81 .42 .01Non-Completers 2.49 .35
Cognitive interest
Completers 3.44 .50 2.46 .02* .08Non-Completers 3.06 .59
Note. 1=Strongly Disagree; 2=Disagree; 3=Agree; 4=Strongly Agree *p<.05 Cohen’s d (1988): .01-.059 (small effect), .06-.139 (moderate effect), .14 or more (large effect)

91
Objective 3: Farming Practices
3a. Describe FFS Completers’ and Non-Completers’ Perceptions of Selected Farming
Practices at the Beginning of a FFS
At the beginning of a FFS, all participants responded to questions regarding their
perceptions of selected farming practices related to the concepts presented in the FFS.
Once the FFS educational cycle was complete and program participants could be
classified as completers or non-completers, then the researcher returned to the
participants’ responses collected at the beginning of FFS in order to compare them for
differences.
Completers (M=3.17, SD=.48) and non-completers (M=2.88, SD=.32) tended to
agree with the statements regarding the use of pesticides in farming (Table 14).
Completers (M=3.07, SD=.46) and non-completers (M=2.95, SD=.42) tended to agree
with the statements on the financial factors involved in adopting farming methods such
as those presented in FFS. Completers (M=3.21, SD=.47) and non-completers (M=3.00,
SD=.35) believed that integrated pest management was compatible with the social
setting in Trinidad and Tobago.

92
Table 14 Completers’ (n=56) and Non-Completers’ (n=15) Perceptions of Selected Agricultural Practices at the Beginning of the FFS
Completers Non-
Completers Statements M SD M SD Perceptions on the use of pesticides in farming
Pesticides are a serious threat to human health. 3.61 .56 3.87 .35Loss of crops due to insects and disease is a serious problem.
3.50 .54 3.00 .76
Pesticides are a serious problem for people, animals, plants and land.
3.46 .60 3.27 .59
I believe that farmers’ decisions affect people, animals, plants and land.
3.39 .73 3.13 .52
My use of pesticides affect people, animals, plants and land.
2.57 1.09 2.13 .83
Pollution from agricultural chemicals is a serious problem on my farm.
2.50 .87 1.87 .35
Construct 3.17 .48 2.87 .32
Financial factors Making money from farming is my most important concern.
3.52 .81 3.87 .35
I worry about how to keep my farm productive over the long term.
2.89 .89 2.07 .46
I am willing to make less money this year and more money in the future to try new farming methods that protect people, animals, plants and land.
2.82 .97 2.93 .96
Construct 3.07 .46 2.95 .42
Compatibility of integrated pest management with the social setting
Consumers want pesticide-free produce. 3.59 .56 3.27 .46Farmers will accept farming with less poisonous pesticides.
3.54 .57 3.07 .26
Consumers will pay higher prices for pesticide-free produce.
2.50 1.02 2.67 .90
Construct 3.20 .47 3.00 .35Note. 1=Strongly Disagree; 2=Disagree; 3=Agree; 4=Strongly Agree

93
3b. Determine if There Is a Statistically Significant Difference in Completers’ and Non-
Completers’ Perceptions of Selected Farming Practices at the Beginning of FFS
An independent-samples t-test was conducted to compare the scores of FFS
completers’ and non-completers’ perceptions of the use of pesticides in farming,
financial factors in adopting new farming practices, and the compatibility of integrated
pest management with the social setting (Table 15). The participants reported these
scores at the beginning of the FFS educational cycle.
A statistically significant relationship was found between completers (M=3.17,
SD=.48) and non-completers [M=2.88, SD=.32; t(69)=2.26, p<.05] on the measure of
their perceptions of the use of pesticides in farming. The finding was that at the
beginning of a FFS, completers agreed more strongly than did non-completers with the
statements concerning the use of pesticides in farming. The effect size (Cohen, 1988)
was moderate (eta squared=.07). This means that seven percent of the variance in
completers’ and non-completers’ perceptions regarding the use of pesticides in farming
was explained by their participation status.
There was not a statistically significant relationship for completers (M=3.07,
SD=.46) and non-completers (M=2.95, SD=.42; t(69)=.924, p>.05] on the construct of
Financial factors. In addition, there was not a statistically significant relationship for
completers (M=3.21, SD=.47) and non-completers [M=3.00, SD=.35; t(69)=1.59, p>.05]
on the construct Compatibility of integrated pest management with the social setting.
The finding was that at the beginning of FFS, completers and non-completers did not

94
differ in their perceptions of the financial factors involved in the adoption of IPM or in
their perceptions regarding the compatibility of IPM within the social setting.
Table 15
T-tests: Completers’ (n=56) and Non-Completers’ (n=15) Perceptions of Selected Agricultural Practices at the Beginning of the FFS Constructs M SD t p dThe use of pesticides in farming
Completers 3.17 .48 2.26 .03* .07Non-Completers 2.88 .32
Financial factors
Completers 3.07 .46 .924 .36 .01Non-Completers 2.95 .42
Compatibility of integrated pest management with social setting
Completers 3.21 .47 1.59 .12 Non-Completers 3.00 .35
Note. 1=Strongly Disagree; 2=Disagree; 3=Agree; 4=Strongly Agree *p<.05 Cohen’s d (1988): .01-.059 (small effect), .06-.139 (moderate effect), .14 or more (large effect)
3c. Describe FFS Completers’ and Non-Completers’ Perceptions of Selected Farming
Practices at the End of FFS
At the end of FFS, program completers and non-completers answered questions
regarding their perceptions of selected farming practices in relation to the principles of
IPM as presented in the FFS. Completers (M= 2.83, SD=.58) and non-completers
(M=2.87, SD=.18) tended to agree with the statements regarding the use of pesticides
(Table 16). Completers (M=3.06, SD=.51) and non-completers (M=2.55, SD=.41)
tended to agree with the statements regarding the financial factors involved in the
95
adoption of IPM. Completers (M=3.19, SD=.47) and non-completers (M=2.81, SD=.17)
also tended to agree that IPM was compatible with the social setting in Trinidad and
Tobago.
3d. Determine if There Is a Statistically Significant Difference in Completers’ and Non-
Completers’ Perceptions of Selected Farming Practices at the End of FFS
An independent-samples t-test was conducted to compare the perceptions of FFS
program completers and non-completers at the end of the educational cycle regarding the
use of pesticides in farming, financial factors in the adoption of IPM, and the
compatibility of IPM with the social setting (Table 17).
At the end of FFS, there was not a statistically significant relationship between
completers’ (M=2.83, SD=.58) and non-completers’ [M=2.87, SD=.18; t(69)=-.29,
p>.05] perceptions on the use of pesticide in farming. The finding was that at the end of
FFS, completers and non-completers tended to agree in their views with regard to the use
of pesticides in farming. It is worth noting that at the beginning of FFS there was a
statistically significant relationship between completers and non-completers on the
construct. The relationship was explored further through a paired sample t-test. The
implication is that at the end of FFS, completers and non-completers held similar views
on the use of pesticides in farming.

96
Table 16 Completers’ (n=56) and Non-Completers’ (n=15) Perceptions at the End of the FFS of Selected Agricultural Practices
Completer Non-
Completer M SD M SD
Statement The use of pesticides in farming
Pesticides are a serious threat to human health. 3.45 .93 3.87 .35Loss of crops due to insects and disease is a serious problem.
3.27 .86 3.00 .76
Pesticides are a serious problem for people, animals, plants and land.
3.21 .93 3.60 .51
I believe that farmers’ decisions affect people, animals, plants and land.
2.91 1.0 3.00 .00
My use of pesticides affects people, animals, plants and land.
2.13 .97 2.13 .83
Pollution from agricultural chemicals is a serious problem on my farm.
2.04 .85 1.67 .49
Construct 2.83 .58 2.87 .18
Financial factors Making money from farming is my most important concern.
3.46 .74 3.53 .52
I am willing to make less money this year and more money in the future to try new farming methods that protect people, animals, plants and land.
2.93 .93 2.07 .80
I worry about how to keep my farm productive over the long term.
2.80 .84 2.07 .26
Construct 3.06 .51 2.55 .41

97
Table 16 (continued)
Completer Non-
Completer Statement M SD M SD Compatibility of integrated pest management with the social setting
Consumers want pesticide-free produce. 3.55 .54 3.20 .41Farmers will accept farming with less poisonous pesticides.
3.38 .56 3.07 .26
Integrated pest management fits in well with our way of agriculture.
3.21 .68 2.47 .51
Consumers are more likely to buy FFS participants’ produce if participants could display MALMR-issued certificates certifying the produce as “IPM practices produce”.
3.14 .75 2.60 .62
IPM practices are better than the way I farmed before FFS.
3.13 .61 2.80 .41
MALMR-issued certificates guaranteeing FFS participants’ produce as “IPM practices produce” will increase sales.
3.05 .64 3.07 .46
Consumers will pay higher prices for pesticide-free produce.
2.91 .88 2.53 .52
Construct 3.19 .47 2.81 .17Note. 1=Strongly Disagree; 2=Disagree; 3=Agree; 4=Strongly Agree
A statistically significant relationship was found between completers (M=3.06,
SD=.51) and non-completers [M=2.55, SD=.41; t(69)=3.56, p<.05] regarding their
perceptions of the financial factors in the adoption of IPM. The finding was that at the
end of FFS, completers agreed more strongly than did non-completers with the

98
statements concerning the financial factors in the adoption of IPM. The implication was
that at the end of FFS, completers were more willing than non-completers to take on the
financial risk of adopting IPM on their farms. The effect size (Cohen, 1988) was large
(eta squared=.16). Sixteen percent of the variance in completers’ and non-completers’
perceptions of the financial factors in the adoption of IPM was explained by their
participation status.
A statistically significant relationship was found between completers (M=3.19,
SD=.43) and non-completers (M=2.81, SD=.17; t(69)=3.34, p<.05] with regard to the
compatibility of IPM with the social setting of Trinidad and Tobago. The finding was
that at the end of FFS, completers agreed more strongly than did non-completers with
the statements concerning the compatibility of IPM with the social setting of Trinidad
and Tobago. The implication is that at the end of FFS, completers believed more
strongly than did non-completers that IPM was compatible with farming practices in
Trinidad and Tobago. The effect size (Cohen, 1988) was large (eta squared=.14).
Fourteen percent of the variance in completers’ and non-completers’ perceptions of the
compatibility of IPM with the social setting was explained by their participation status.

99
Table 17 T-tests: Completers’ (n=56) and Non-Completers’ (n=15) Perceptions of Selected Agricultural Practices at the End of the FFS Constructs M SD t p dThe use of pesticides in farming
Completers 2.83 .58 -.29 .77 .00Non-Completers 2.87 .18
Financial factors
Completers 3.06 .51 3.56 .00* .16Non-Completers 2.55 .41
Compatibility of integrated pest management with social setting
Completers 3.19 .43 3.34 .00* .14Non-Completers 2.81 .17
Note. 1=Strongly Disagree; 2=Disagree; 3=Agree; 4=Strongly Agree *p<.05 Cohen’ d (1988): .01-.059 (small effect), .06-.139 (moderate effect), .14 or more (large effect) 3e. Determine if There Was a Statistically Significant Change in Completers’
Perceptions of Selected Farming Practices at the Beginning and End of FFS
A paired samples t-test was conducted to evaluate the impact of FFS on
completers’ measures of the use of pesticides in farming, financial factors involved in
the adoption of IPM, and the compatibility of IPM with the setting in Trinidad and
Tobago (Table 18). Of the three constructs, only one yielded a significant difference. A
statistically significant relationship was found between the completers’ scores at the
100
beginning (M=3.17, SD=.47) and end [M=2.83, SD=.58; t(55)=3.5, p<.05] of FFS with
regard to their perceptions of the use of pesticides in farming. The finding was that on a
pre/post comparison, program completers indicated less agreement with the statement
regarding the impacts of pesticides on people and the environment. The effect size
(Cohen, 1988) was large (eta squared=.18). Eighteen percent of the variance in the
change of perception on the use of pesticides in farming can be explained by completion
status.
A statistically significant relationship was not found for completers at the
beginning (M=3.07, SD=.46) and end [M=3.06, SD=.51; t(55)=.16, p>.05] of FFS
regarding their perceptions of the financial factors involved in adopting IPM. In
addition, a statistically significant relationship was not found for completers at the
beginning (M=3.20, SD=.46) and end [M=3.19, SD=.42; t(55)=.18, p>.05] of FFS
regarding their perceptions of the compatibility of IPM with the setting in Trinidad and
Tobago. The finding was that on a pre/post test, completers showed no change in their
perceptions of the financial factors and the compatibility of IPM with the setting.

101
Table 18 Comparison of Completers’ (n=56) Perceptions of Selected Agricultural Practices at the Beginning and End (Pre/Post) of the FFS Constructs M SD t p dThe use of pesticides in farming
Beginning 3.17 .47 3.5 .00* .18 End 2.83 .58 Financial factors
Beginning 3.07 .46 .16 .87 .00End 3.06 .51
Compatibility of integrated pest management with social setting
Beginning 3.20 .46 .18 .86 .00End 3.19 .42
Note. 1=Strongly Disagree; 2=Disagree; 3=Agree; 4=Strongly Agree *p<.05 Cohen’s d (1988): .01-.059 (small effect), .06-.139 (moderate effect), .14 or more (large effect) 3f. Determine if There Was a Statistically Significant Change in Non-Completers’
Perceptions of Selected Farming Practices at the Beginning and End of FFS
A paired-samples t-test was conducted to evaluate the impact of the FFS program
on FFS non-completers’ perceptions of selected farming practices at the beginning and
end of the educational program (Table 19). A statistically significant relationship was
not found between non-completion status and any of the three constructs tested.
A statistically significant difference was not found for non-completers at the
beginning (M=2.87, SD=.32) and end [M=2.87, SD=.18; t(55)=2.0, p>.05] of FFS
regarding their perceptions of the use of pesticides in farming. A statistically significant
relationship was not found for non-completers at the beginning (M=2.95, SD=.41) and

102
end [M=2.55, SD=.41; t(55)=2.0, p>.05] of FFS regarding their perceptions of the
financial factors involved in adopting IPM. A statistically significant relationship was
not found for non-completers at the beginning (M=3.00, SD=.35) and end [M=2.81,
SD=.16; t(55)=1.6, p>.05] of FFS with regard to the compatibility of IPM with the social
setting. The finding was that on a pre/post test, non-completers’ perceptions did not
Table 19 Comparison of Non-Completers’ (n=15) Perceptions of Selected Agricultural Practices at the Beginning and End of the FFS Constructs M SD t p dThe use of pesticides in farming
Beginning 2.87 .32 .00 1.0 .00End 2.87 .18
Financial factors
Beginning 2.95 .41 2.0 .06 .07End 2.55 .41
Compatibility of integrated pest management with social setting
Beginning 3.00 .35 1.6 .14 .04End 2.81 .16
Note. 1=Strongly Disagree; 2=Disagree; 3=Agree; 4=Strongly Agree Cohen’s d (1988): .01-.059 (small effect), .06-.139 (moderate effect), .14 or more (large effect)

103
change regarding (1) the harm that pesticides can cause to people and the environment,
(2) their willingness to take on financial risk to try integrated pest management
technologies on their farms, and (3) whether IPM was compatible with the social
environment in Trinidad and Tobago.
3g. Describe FFS Program Non-Participants by Selected Farming Practices
Non-participants were classified as such because they fit in one of the following
three categories: 1) Officer met with the intended participant and after describing the
Field School to the person, the person declined an invitation to participate, 2) Participant
visited the introductory Farmer Field School activity and decided not to continue to
participate in the school, and 3) A member of the community or someone else described
the school to the intended participant and the person decided not to participate.
Non-participants tended to agree with the statements about the use of pesticides in
farming (M=3.18, SD=.54), the financial factors involved in adopting integrated pest
management (M=2.86, SD=.73), and the compatibility of integrated pest management
with the social setting (M=2.75, SD=.61) (Table 20).
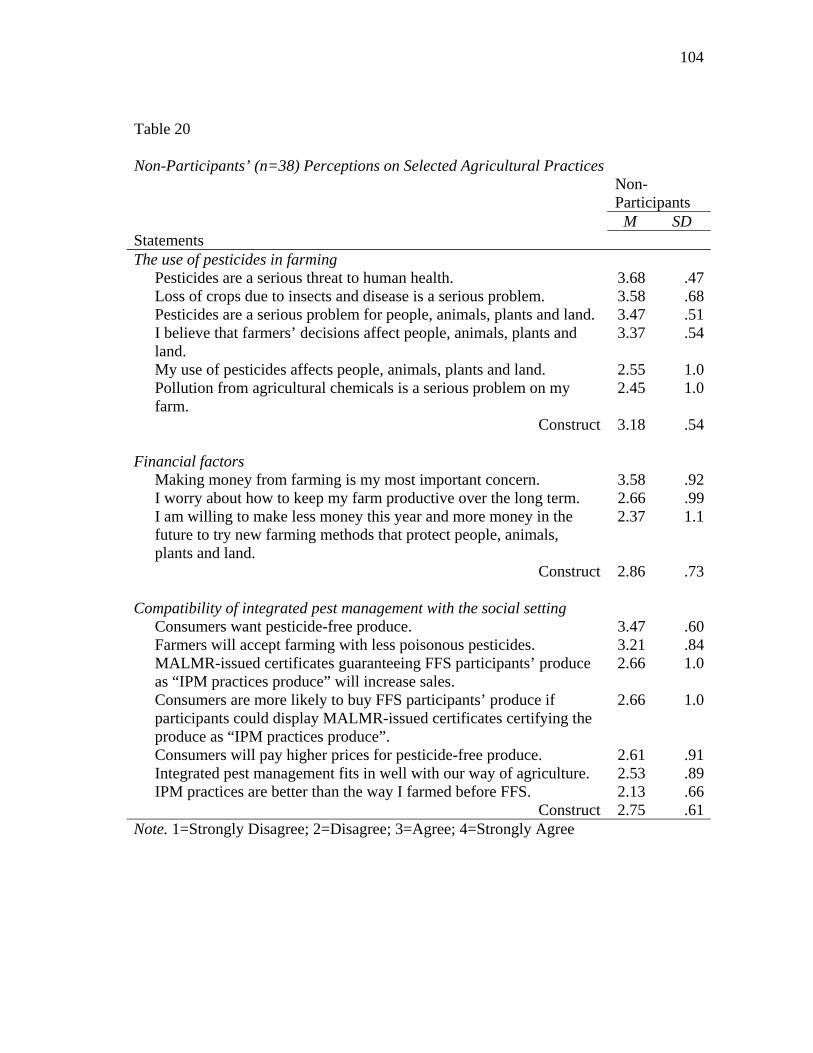
104
Table 20
Non-Participants’ (n=38) Perceptions on Selected Agricultural Practices
Non-Participants
M SD Statements The use of pesticides in farming
Pesticides are a serious threat to human health. 3.68 .47Loss of crops due to insects and disease is a serious problem. 3.58 .68Pesticides are a serious problem for people, animals, plants and land. 3.47 .51I believe that farmers’ decisions affect people, animals, plants and land.
3.37 .54
My use of pesticides affects people, animals, plants and land. 2.55 1.0Pollution from agricultural chemicals is a serious problem on my farm.
2.45 1.0
Construct 3.18 .54
Financial factors Making money from farming is my most important concern. 3.58 .92I worry about how to keep my farm productive over the long term. 2.66 .99I am willing to make less money this year and more money in the future to try new farming methods that protect people, animals, plants and land.
2.37 1.1
Construct 2.86 .73
Compatibility of integrated pest management with the social setting Consumers want pesticide-free produce. 3.47 .60Farmers will accept farming with less poisonous pesticides. 3.21 .84MALMR-issued certificates guaranteeing FFS participants’ produce as “IPM practices produce” will increase sales.
2.66 1.0
Consumers are more likely to buy FFS participants’ produce if participants could display MALMR-issued certificates certifying the produce as “IPM practices produce”.
2.66 1.0
Consumers will pay higher prices for pesticide-free produce. 2.61 .91Integrated pest management fits in well with our way of agriculture. 2.53 .89IPM practices are better than the way I farmed before FFS. 2.13 .66
Construct 2.75 .61Note. 1=Strongly Disagree; 2=Disagree; 3=Agree; 4=Strongly Agree

105
3h. Determine if a Significant Relationship Exists Between Participation Status and
Perceptions About Selected Farming Practices
A one-way between-groups analysis of variance was conducted to explore the
impact of the perceptions on the use of pesticides in farming, financial factors, and the
compatibility of integrated pest management with the social setting on participation
status (Table 21). A statistically significant relationship was found between
participation status and the use of pesticides in farming [F(2,106)=5.14, p<.05]. The
effect size (Cohen, 1988) was moderate (eta squared=.09). Nine percent of the variance
in their perceptions of the use of pesticides in farming was explained by completion
status. The post hoc comparison of the means (Table 22) indicates that the mean score
for completers (M=2.83, SD=.58) and non-completers (M=2.87, SD=.18) was
significantly different from non-participants (M=3.18, SD=.54). The finding was that at
the end of FFS, non-participants agreed more strongly than did completers and non-
completers with the statements regarding the use of pesticides in farming. A second
finding was that at the end of the FFS the completers and non-completers held similar
views concerning the use of pesticides in farming.
A statistically significant relationship was found between participation status and
the financial factors related to the adoption of integrated pest management
[F(2,106)=4.74, p<.05]. The effect size (Cohen, 1988) was moderate (eta squared=.08).
Eight percent of the variance in their perceptions of the financial factors was explained
by participation status. The post hoc comparisons of the means (Table 23) indicated that
the mean score for non-completers (M=2.55, SD=.41) was significantly different from

106
completers (M=3.06, SD=.51). Non-participants (M=2.86, SD=.73) did not differ
significantly from the non-completers or completers. The first finding was that
completers agreed more strongly than did non-completers and non-participants with the
statements regarding the financial factors related to the adoption of IPM. A second
finding was that non-completers agreed the least with the statements. The implication is
that non-completers are the group that is least willing to take on the financial risk of
adopting IPM on their farms and completers are the most willing. Though non-
participants did not engage in the activities of the FFS, they are moderately receptive to
the idea of taking on financial risk for the sake of adopting IPM.
A statistically significant relationship was found between participation status and
the compatibility of IPM with the social setting [F(2,106)= 10.9, p<.05]. The effect size
(Cohen, 1988) was large (eta squared=.17). Seventeen percent of the variance in their
perceptions regarding the compatibility of IPM with the setting was explained by
participation status. The post hoc analysis (Table 24) indicated that the mean score for
completers (M=3.19, SD=.43) was significantly different from non-participants (M=2.75,
SD=.61) and non-completers (M=2.81, SD=.17). Non-participants and non-completers
were not significantly different. A finding was that completers agreed more strongly
than did non-completers and non-participants with the statements regarding the
compatibility of IPM with the social setting. The implication is that completers believe
much more strongly than do non-completers and non-participants that IPM is compatible
with the social setting in Trinidad and Tobago.

107
Table 21
Analysis of Variance: Perceptions of Selected Farming Practices and Participation Status (N=109) Constructs N M SD F p d The use of pesticides in farming
Completers 56 2.83 .58 5.14 .00* .09Non-Completers 15 2.87 .18 Non-Participants 38 3.18 .54
Financial factors
Completers 56 3.06 .51 4.74 .01* .08Non-Completers 15 2.55 .41 Non-Participants 38 2.86 .73
Compatibility of integrated pest management with the social setting
Completers 56 3.19 .43 10.9 .00* .17Non-Completers 15 2.81 .17 Non-Participants 38 2.75 .61
Notes: 1=Strongly Disagree; 2=Disagree; 3=Agree; 4=Strongly Agree *p<0.05 Cohen’s d (1988): 0.01-.059 (small effect), 0.06-.139 (moderate effect), 0.14 or more (large effect) Table 22
Post Hoc: Perceptions on the Use of Pesticides in Farming by Participation Status (N=109) Participation Status Means for Groups (Subset for alpha=.05) Completers 2.83 Non-Completers 2.87 Non-Participants 3.18 Note: 1=Strongly Disagree; 2=Disagree; 3=Agree; 4=Strongly Agree

108
Table 23
Post Hoc: Perceptions on Financial Factors by Participation Status (N=109) Participation Status Means for Groups (Subset for alpha=.05) Non-Completers 2.55 Non-Participants 2.86 2.86 Completers 3.06 Note: 1=Strongly Disagree; 2=Disagree; 3=Agree; 4=Strongly Agree Table 24
Post Hoc: Perceptions on the Compatibility of IPM With the Social Setting by Participation Status (N=109) Participation Status Means for Groups (Subset for alpha=.05) Non-Participants 2.75 Non-Completers 2.81 Completers 3.19 Note: 1=Strongly Disagree; 2=Disagree; 3=Agree; 4=Strongly Agree
Objective 4: Priority Rankings of Sources of Information
4a. Describe FFS Completers’ Priority Ranking of Their Sources of Information for
Farming at the Beginning and End of a FFS
At the beginning of a FFS, those who later completed the FFS program, ranked
MALMR as their most important source of information for farming, agro-shops as their
second most important source of information, and other farmers as the third most
important source of information (Table 25). At the end of FFS, program completers
ranked MALMR as their most important source for information about farming, the agro-
shops as the second most important, and other farmers as the third most important (Table
26). The finding is that in a pre/post test, completers’ priority rankings of their sources

109
of information about farming did not change. Completers most highly valued the
information received from MALMR, then the agro-shops, and finally, the other farmers.
Table 25 Completers’ (n=56) Priority Ranking of Their Sources of Information at the Beginning of FFS CompletersStatements f %Get information from these sources most often
MALMR 23 41.1Agro-shop 19 33.9Other farmers 5 8.9Friends 3 5.4Family 2 3.6Self (own experience) 2 3.6Media 1 1.8Market 1 1.8
Get information from these sources second most often
Agro-shop 18 32.1Other farmers 15 26.8MALMR 4 12.5Friends 7 12.5Media 2 3.6Market 2 3.6Self (own experience) 2 3.6Family 1 1.8None listed 2 3.6
Get information from these sources third most often
None listed 21 37.5Other farmers 15 26.8MALMR 8 14.3Friends 4 7.1Agro-shop 5 8.9Media 1 1.8Family 1 1.8Self (own experience) 1 1.8
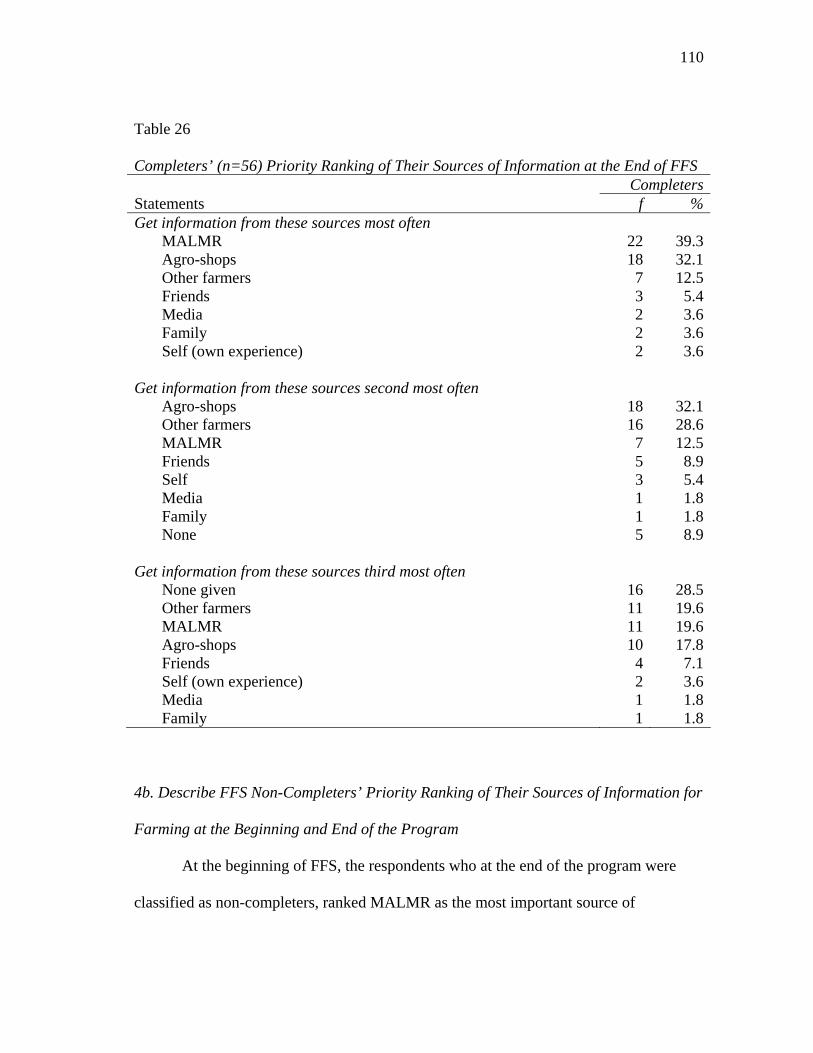
110
Table 26 Completers’ (n=56) Priority Ranking of Their Sources of Information at the End of FFS CompletersStatements f %Get information from these sources most often
MALMR 22 39.3Agro-shops 18 32.1Other farmers 7 12.5Friends 3 5.4Media 2 3.6Family 2 3.6Self (own experience) 2 3.6
Get information from these sources second most often
Agro-shops 18 32.1Other farmers 16 28.6MALMR 7 12.5Friends 5 8.9Self 3 5.4Media 1 1.8Family 1 1.8None 5 8.9
Get information from these sources third most often None given 16 28.5Other farmers 11 19.6MALMR 11 19.6Agro-shops 10 17.8Friends 4 7.1Self (own experience) 2 3.6Media 1 1.8Family 1 1.8
4b. Describe FFS Non-Completers’ Priority Ranking of Their Sources of Information for
Farming at the Beginning and End of the Program
At the beginning of FFS, the respondents who at the end of the program were
classified as non-completers, ranked MALMR as the most important source of

111
information about farming practices and agro-shops as the second most important source
(Table 27). At the end of FFS, however, non-completers ranked the agro-shops as the
most important source of information. There was a tie for the second most important
sources of information: the agro-shops and MALMR (Table 28). The finding was that in
a pre/post test, non-completers’ priority rankings of their sources of information
changed.
Table 27 Non-Completers’ (n=15) Priority Ranking of Their Sources of Information at the Beginning of the FFS Non-CompletersStatements f %Get information from these sources most often
MALMR 5 33.3Agro-shops 4 26.6Family 2 13.3Friends 1 6.7Other farmers 1 6.7Self (own experience) 1 6.7Media 1 6.7
Get information from these sources second most often
Agro-shops 6 40.0MALMR 3 20.0Other farmers 2 13.3Friends 2 13.3Family 1 6.7None listed 1 6.7
Get information from these sources third most often None listed 8 53.4MALMR 4 26.7 Agro-shops 2 13.3Friends 1 6.7

112
Table 28 Non-Completers’ (n=15) Priority Ranking of Their Sources of Information at the End of the FFS CompletersStatements f %Get information from these sources most often
Agro-shops 6 40.0MALMR 3 20.0Other farmers 2 13.3Family 2 13.3Friends 1 6.7Self (own experience) 1 6.7
Get information from these sources second most often Agro-shops 5 33.3MALMR 5 33.3Friends 3 20.0Family 1 6.7None 1 6.7
Get information from these sources third most often None given 8 53.3Agro-shops 3 20.0MALMR 3 20.0Friends 1 6.7
4c. Describe FFS Non-Participants’ Priority Ranking of Their Sources of Information
for Farming
Non-participants ranked the agro-shops as their two most important sources of
information regarding farming practices. One (2.6%) non-participant ranked MALMR
as their most important source of information on farming, five (13.2%) ranking
MALMR as their second most important source of information, and eight (21.1%)
ranking MALMR as the third highest source of information for them (Table 29). Non-
participants rank agro-shops as their most important source of information for farming.

113
Table 29
Non-Participants’ (n=38) Priority Ranking of Their Sources of Information CompletersStatements f %First Most Important
Agro-shops 19 50.0Other farmers 8 21.1Self 6 15.8Media 3 7.9MALMR 1 2.6Friends 1 2.6
Second Most Important
Agro-shops 13 33.3Other farmers 9 23.7MALMR 5 13.2Media 2 5.3Family 2 5.3Friends 2 5.2Self (own experience) 1 2.6None 4 10.5
Third Most Important None 14 36.8MALMR 8 21.1Other farmers 6 15.8Friends 5 13.2Family 2 5.3Agro-shops 2 5.3Media 1 2.6
Objective 5: The Deterrents to Participation
5a. Describe FFS Program Completers, Non-Completers, and Non-Participants by the
Deterrents to Participation
Completers (M=2.49, SD=.39) tended to disagree with the statements regarding
the life situation factors which may have played a role in their participation in FFS

114
(Table 30). Completers (M=3.36, SD=.39) most strongly agreed with the statement,
“The agricultural officer encouraged me to participate in FFS.” They (M=1.71, SD.39)
most strongly disagreed with the statement, “A health problem kept me from
participating in FFS.”
Completers (M=3.41, SD=.44) agreed with all of the statements regarding the
convenience factors of participating in a FFS. Completers agreed (M=3.19, SD=.44)
with all of the statements about the process and application of participation in a FFS.
Completers agreed (M=3.38, SD=.43) with all of the statements regarding the climate for
learning in the FFS. Completers agreed (M=3.31, SD=.46) with all of the statements on
the construct Institutional factors: Outcomes.
Program completers tended to agree (M=3.16, SD=.37) with the statements
concerning their Personal Preferences. Completers agreed with all of the statements,
with the exception of, “I like learning by myself more than with a group of people”
(M=2.18, SD=.88). The last four questions of the construct Personal Preferences were
reversed coded so that all of the statements would be positively worded.

115
Table 30 FFS Completers (n=56): Factors Impacting Participation Completers M SDStatements Life situation factors
The agricultural officer encouraged me to participate in FFS. 3.36 .75I saw FFS as a chance to learn how to improve my income. 3.29 .59A friend or family member encouraged me to participate in FFS. 2.89 .91Responsibilities at work/farming kept me from participating in the FFS.
1.89 .65
Responsibilities at home kept me from participating in FFS. 1.80 .84A health problem kept me from participating in FFS. 1.71 .73
Construct 2.49 .39 Institutional factors: Convenience
FFS was offered in a safe place. 3.48 .50I am happy with the frequency of the FFS meetings. 3.46 .57FFS was offered at a convenient location. 3.43 .68FFS was scheduled at a convenient time. 3.43 .57FFS was offered in an acceptable location. 3.39 .49I am satisfied with the length of the FFS meetings. 3.30 .66
Construct 3.41 .44 Institutional factors: Process and Application
Topics covered in FFS were important to my farming situation. 3.46 .54The practices promoted in FFS are relevant to my farming situation.
3.29 .68
The real problems on my farm were addressed. 3.07 .91I have suggested to farmers in my community that they participate in FFS.
2.96 .91
Construct 3.19 .44 Institutional factors: Climate
I could freely voice my opinions during FFS meetings. 3.61 .49My FFS group usually accomplished our daily agenda. 3.36 .65The FFS facilitator asked the students what they wanted to learn. 3.30 .60FFS program activities were well planned. 3.29 .76
Construct 3.38 .43
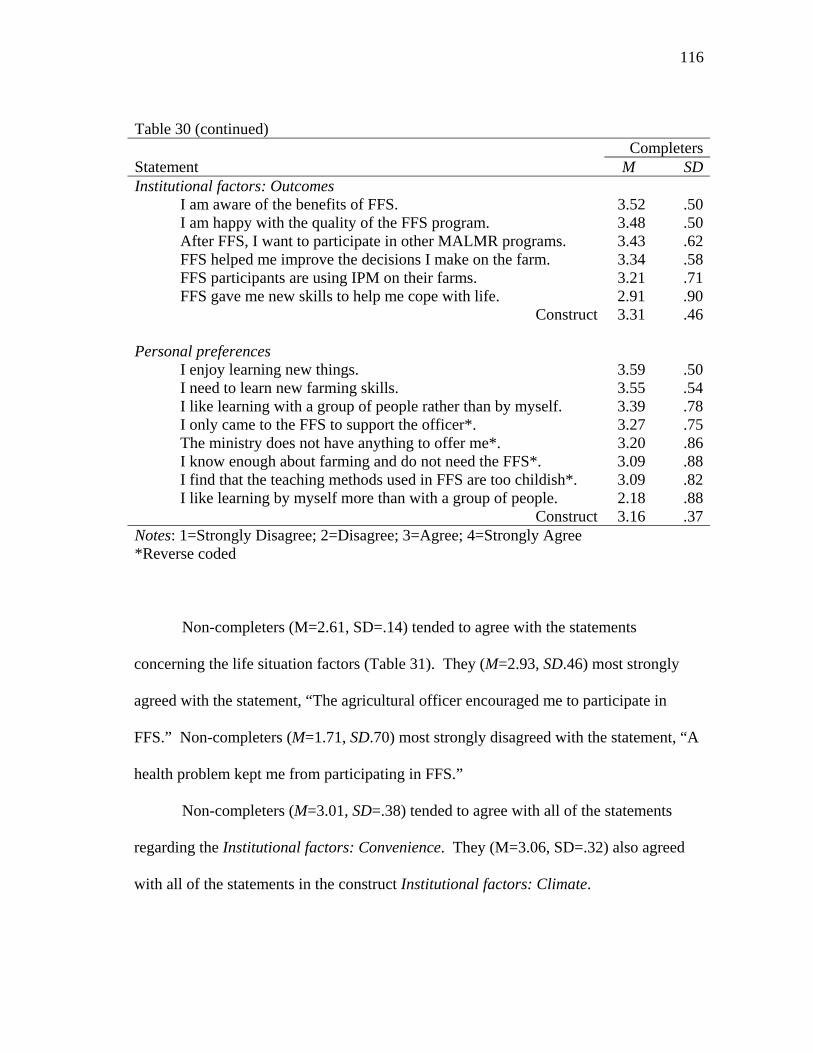
116
Table 30 (continued) CompletersStatement M SDInstitutional factors: Outcomes
I am aware of the benefits of FFS. 3.52 .50I am happy with the quality of the FFS program. 3.48 .50After FFS, I want to participate in other MALMR programs. 3.43 .62FFS helped me improve the decisions I make on the farm. 3.34 .58FFS participants are using IPM on their farms. 3.21 .71FFS gave me new skills to help me cope with life. 2.91 .90
Construct 3.31 .46 Personal preferences
I enjoy learning new things. 3.59 .50I need to learn new farming skills. 3.55 .54I like learning with a group of people rather than by myself. 3.39 .78I only came to the FFS to support the officer*. 3.27 .75The ministry does not have anything to offer me*. 3.20 .86I know enough about farming and do not need the FFS*. 3.09 .88I find that the teaching methods used in FFS are too childish*. 3.09 .82I like learning by myself more than with a group of people. 2.18 .88
Construct 3.16 .37Notes: 1=Strongly Disagree; 2=Disagree; 3=Agree; 4=Strongly Agree *Reverse coded Non-completers (M=2.61, SD=.14) tended to agree with the statements
concerning the life situation factors (Table 31). They (M=2.93, SD.46) most strongly
agreed with the statement, “The agricultural officer encouraged me to participate in
FFS.” Non-completers (M=1.71, SD.70) most strongly disagreed with the statement, “A
health problem kept me from participating in FFS.”
Non-completers (M=3.01, SD=.38) tended to agree with all of the statements
regarding the Institutional factors: Convenience. They (M=3.06, SD=.32) also agreed
with all of the statements in the construct Institutional factors: Climate.

117
Non-completers (M=2.70, SD=.42) tended to agree with the statements in the
construct Institutional factors: Process and Application. They agreed most strongly
with the statement, “The practices promoted in FFS are relevant to my farming
situation” (M=2.93, SD=.70). Non-completers (M=2.40, SD=.63) most strongly
disagreed with the statement, “I have suggested to farmers in my community that they
participate in FFS.”
Non-completers (M=2.81, SD=.37) tended to agree with the statements on the
construct Institutional factors: Outcomes. They (M=3.20, SD=.86) most strongly agreed
with the statement, “I am happy with the quality of the FFS program,” and most strongly
disagreed (M=2.00, SD=.54) with the statement, “FFS gave me new skills to help me
cope with life.”
Non-completers tended to agree (M=2.94, SD=.23) with the statements
concerning their Personal Preferences. Completers (M=2.27, SD=.59) agreed with all of
the statements, with the exception of, “I like learning by myself more than with a group
of people.” The last four questions of the construct Personal Preferences were reversed
coded so that all of the statements would be positively worded.

118
Table 31 FFS Non-Completers (n=15): Factors Impacting Participation
Non-Completers
M SD Statements Life situation factors
I saw FFS as a chance to learn how to improve my income. 3.20 .68The agricultural officer encouraged me to participate in FFS. 2.93 .46A friend or family member encouraged me to participate in FFS. 2.73 .70Responsibilities at work/farming kept me from participating in the FFS.
2.67 .49
Responsibilities at home kept me from participating in FFS. 2.40 .51A health problem kept me from participating in FFS. 1.73 .70
Construct 2.61 .14 Institutional factors: Convenience
I am happy with the frequency of the FFS meetings. 3.27 .46FFS was offered in a safe place. 3.20 .41FFS was offered at a convenient location. 3.07 .46FFS was offered in an acceptable location. 3.00 1.00I am satisfied with the length of the FFS meetings. 2.80 .78FFS was scheduled at a convenient time. 2.73 .70
Construct 3.01 .38 Institutional factors: Process and Application
The practices promoted in FFS are relevant to my farming situation.
2.93 .70
Topics covered in FFS were important to my farming situation. 2.87 .51My real problems on my farm were addressed. 2.60 .63I have suggested to farmers in my community that they participate in FFS.
2.40 .63
Construct 2.70 .42 Institutional factors: Climate
I could freely voice my opinions during FFS meetings. 3.20 .41My FFS group usually accomplished our daily agenda. 3.13 .35The FFS facilitator asked the students what they wanted to learn. 3.13 .35FFS program activities were well planned. 2.80 .56
Construct 3.06 .32

119
Table 31 (continued)
Non-Completers
Statement M SD Institutional factors: Outcomes
I am happy with the quality of the FFS program. 3.20 .86FFS helped me improve the decisions I make on the farm. 3.00 .38After FFS, I want to participate in other MALMR programs. 3.00 .54I am aware of the benefits of FFS. 2.87 .64FFS participants are using IPM on their farms. 2.80 .41FFS gave me new skills to help me cope with life. 2.00 .54
Construct 2.81 .37 Personal Preferences
I enjoy learning new things. 3.20 .41I need to learn new farming skills. 3.20 .56I like learning with a group of people rather than by myself. 3.07 .80I only came to the FFS to support the officer*. 3.07 .60I find that the teaching methods used in FFS are too childish*. 3.00 .00The ministry does not have anything to offer me*. 2.93 .46I know enough about farming and do not need the FFS*. 2.80 .41I like learning by myself more than with a group of people. 2.27 .59
Construct 2.94 .23Notes: 1=Strongly Disagree; 2=Disagree; 3=Agree; 4=Strongly Agree *Reverse coded Non-participants tended to disagree (M=2.50, SD=.34) with the statements about
the life situation factors impacting participation (Table 32). They (M=3.29, SD=.90)
most strongly agreed with the statement, “Responsibilities at work/farming kept me from
participating in FFS.” Non-participants (M=1.50, SD=.69) most strongly disagreed with
the statement, “A health problem kept me from participating in FFS.” In addition, non-
participants (M=2.47, SD=.95) disagreed with the statement, “I saw FFS as a chance to
learn how to improve my income.”

120
Non-participants (M=2.74, SD=.54) tended to agree with the statements
concerning the issues of convenience influencing participation. The statement, “FFS
was offered in an acceptable location” received the highest mean score (M=3.26,
SD=.86) while the statement, “FFS was scheduled at a convenient time” received the
lowest mean score (M=1.92, SD=.92).
Non-participants (M=2.69, SD=.59) indicated an overall agreement with the
statements on the construct Institutional factors: Process and Application. They
(M=3.58, SD=.64) agreed most strongly with the statement, “I have suggested to farmers
in my community that they participate in FFS.” They (M=2.26, SD=.59) most strongly
disagreed with the statement, “My real problems on my farm were addressed.” In
addition, non-participants (M=2.37, SD=.97) disagreed with the statement, “Topics
covered in FFS were important to my farming situation.”
Non-participants (M=2.88, SD=.60) tended to agree with the statements on the
construct Institutional factors: Outcomes. The statement, “I am aware of the benefits of
FFS,” was the only statement on the construct with which the non-participants disagreed
(M=2.37, SD=.71).
Non-participants (M=2.96, SD=.49) tended to agree with the statements
concerning their Personal Preferences. Non-participants agreed with all of the
statements. Worth noting is that non-participants (M=2.76, SD=1.03), but not
completers or non-completers, agreed with the statement, “I like learning by myself
more than with a group of people.”

121
Table 32 FFS Non-Participants (n=38): Factors Impacting Participation
Non-Participants
M SDStatement Life situation factors
Responsibilities at work/farming kept me from participating in the FFS.
3.29 .90
The agricultural officer encouraged me to participate in FFS. 2.74 .86A friend or family member encouraged me to participate in FFS. 2.55 .83Responsibilities at home kept me from participating in FFS. 2.47 .98I saw FFS as a chance to learn how to improve my income. 2.47 .95A health problem kept me from participating in FFS. 1.50 .69
Construct 2.50 .34 Institutional factors: Convenience
FFS was offered in a safe place. 3.34 .89FFS was offered in an acceptable location. 3.26 .86FFS was offered at a convenient location. 2.74 1.03I am happy with the frequency of the FFS meetings. 2.66 .91I am satisfied with the length of the FFS meetings. 2.55 .95FFS was scheduled at a convenient time. 1.92 .94
Construct 2.74 .54 Institutional factors: Process and Application
I have suggested to farmers in my community that they participate in FFS.
3.58 .64
The practices promoted in FFS are relevant to my farming situation.
2.58 .79
Topics covered in FFS were important to my farming situation. 2.37 .97My real problems on my farm were addressed. 2.26 1.13
Construct 2.69 .59 Institutional factors: Outcomes
I expect that the FFS program will be of high quality. 3.32 .90I want to participate in other MALMR programs. 3.16 .75I want to participate in FFS sometime in the future. 3.13 .81I expect that FFS participants are using IPM on their farms. 2.71 .80I am interested in joining FFS. 2.63 .94I am aware of the benefits of FFS. 2.37 .71
Construct 2.88 .60
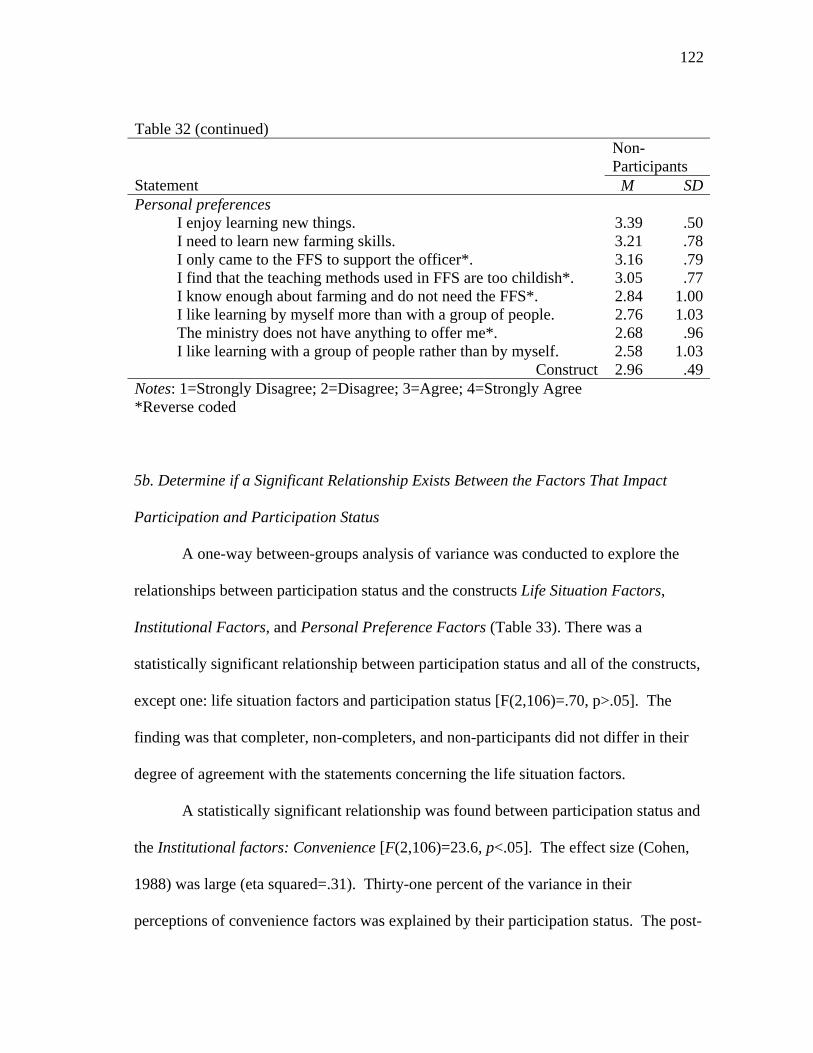
122
Table 32 (continued)
Non-Participants
Statement M SDPersonal preferences
I enjoy learning new things. 3.39 .50I need to learn new farming skills. 3.21 .78I only came to the FFS to support the officer*. 3.16 .79I find that the teaching methods used in FFS are too childish*. 3.05 .77I know enough about farming and do not need the FFS*. 2.84 1.00I like learning by myself more than with a group of people. 2.76 1.03The ministry does not have anything to offer me*. 2.68 .96I like learning with a group of people rather than by myself. 2.58 1.03
Construct 2.96 .49Notes: 1=Strongly Disagree; 2=Disagree; 3=Agree; 4=Strongly Agree *Reverse coded 5b. Determine if a Significant Relationship Exists Between the Factors That Impact
Participation and Participation Status
A one-way between-groups analysis of variance was conducted to explore the
relationships between participation status and the constructs Life Situation Factors,
Institutional Factors, and Personal Preference Factors (Table 33). There was a
statistically significant relationship between participation status and all of the constructs,
except one: life situation factors and participation status [F(2,106)=.70, p>.05]. The
finding was that completer, non-completers, and non-participants did not differ in their
degree of agreement with the statements concerning the life situation factors.
A statistically significant relationship was found between participation status and
the Institutional factors: Convenience [F(2,106)=23.6, p<.05]. The effect size (Cohen,
1988) was large (eta squared=.31). Thirty-one percent of the variance in their
perceptions of convenience factors was explained by their participation status. The post-

123
hoc analysis (Table 34) indicated that the mean score for completers (M=3.41, SD=.43)
was significantly different from that of the non-participants (M=2.74, SD=.53) and non-
completers (M=2.61, SD=.14). The finding was that completers agreed much more
strongly than did non-completers or non-participants with the statements regarding the
schedule and meeting place convenience factors.
A statistically significant relationship was found between participation status and
the Institutional factors: Process and Application scores [F(2,106)=14.9, p<.05]. The
effect size (Cohen, 1988) was large (eta squared=.22). Twenty-two percent of variance
in the processes and application scores can be explained by participation status. The
post-hoc analysis (Table 35) indicated that the mean score for completers (M=3.19,
SD=.39) was significantly different from the mean of the non-participants (M=2.69,
SD=.59) and non-completers (M=2.70, SD=.42). The finding was that completers agreed
much more strongly than did non-completers and non-participants with the statements
regarding the process and application elements of the institutional factors.
A statistically significant relationship was found between participation status and
the Institutional factors: Outcomes [F(2,106)=10.7, p<.05]. The effect size (Cohen,
1988) was large (eta squared=.17). Seventeen percent of the variance in the Outcome

124
scores can be explained by participation status. The post-hoc test (Table 36) indicated
that the mean score for completers (M=3.31, SD=.46) was significantly different from
the mean of the non-completers (M=2.81, SD=.37) and non-participants (M=2.88,
SD=.60). The finding was that completers agreed much more strongly than did non-
completers and non-participants with the statements concerning their expectations of the
outcomes of FFS.
A statistically significant relationship was found between participation status and
the Personal Preferences scores [F(2,106)=3.85, p<.05]. The effect size (Cohen, 1988)
was moderate (eta squared=.08). Eight percent of the variance in Personal Preferences
scores was explained by participation status. The post-hoc analysis (Table 37) indicated
that the mean score for completers (M=3.16, SD=.37) was significantly different from
the mean of the non-completers (M=2.94, SD=.23) and non-participants (M=2.96,
SD=.49). The finding was that completers agreed much more strongly than did non-
completers and non-participants with the statements regarding their personal learning
preferences.

125
Table 33 Analysis of Variance: Factors Impacting Participation by Participation Status (N=109) Constructs N M SD F p dLife situation factors
Completers 56 2.49 .39 .70 .50 .01Non-Completers 15 2.61 .14 Non-Participants 38 2.50 .34
Institutional factors: Convenience
Completers 56 3.41 .43 23.6 .00* .31Non-Completers 15 3.01 .38 Non-Participants 38 2.74 .53
Institutional factors: Process and Application
Completers 56 3.19 .39 14.9 .00* .22Non-Completers 15 2.70 .42 Non-Participants 38 2.69 .59
Institutional factors: Outcomes
Completers 56 3.31 .46 10.7 .00* .17Non-Completers 15 2.81 .37 Non-Participants 38 2.88 .60
Personal Preferences
Completers 56 3.16 .37 3.85 .02* .08Non-Completers 15 2.94 .23 Non-Participants 38 2.96 .49
Notes: 1=Strongly Disagree; 2=Disagree; 3=Agree; 4=Strongly Agree *p<0.05 Cohen’s d (1988): 0.01-.059 (small effect), 0.06-.139 (moderate effect), 0.14 or more (large effect)

126
Table 34
Post Hoc: Institutional Factors (Convenience) by Participation Status (N=109) Participation Status Means for Groups (Subset for alpha=.05) Non-Participants 2.74 Non-Completers 3.01 Completers 3.41 Note: 1=Strongly Disagree; 2=Disagree; 3=Agree; 4=Strongly Agree
Table 35
Post Hoc: Institutional Factors (Process and Application) by Participation Status (N=109) Participation Status Means for Groups (Subset for alpha=.05) Non-Participants 2.69 Non-Completers 2.70 Completers 3.19 Note: 1=Strongly Disagree; 2=Disagree; 3=Agree; 4=Strongly Agree
Table 36
Post Hoc: Institutional Factors (Outcomes) by Participation Status (N=109) Participation Status Means for Groups (Subset for alpha=.05) Non-Completers 2.81 Non-Participants 2.88 Completers 3.31 Note: 1=Strongly Disagree; 2=Disagree; 3=Agree; 4=Strongly Agree

127
Table 37
Post Hoc: Personal Preferences by Participation Status (N=109) Participation Status Means for Groups (Subset for alpha=.05) Non-Completers 2.94 Non-Participants 2.96 Completers 3.16 Note: 1=Strongly Disagree; 2=Disagree; 3=Agree; 4=Strongly Agree
Statements on the construct Institutional Factors: Climate were asked of the FFS
program completers and non-completers based on their experience during the FFS
educational program. Not having participated in the educational program, non-
participants were not asked about their perceptions of the educational climate within
FFS. Therefore, it was appropriate to conduct an independent-samples t-test to
investigate whether there were statistically significant differences in the perceptions of
FFS program completers and non-completers regarding the educational climate in FFS.
A statistically significant relationship was found between completers (M=3.38,
SD=.42) and non-completers [M=3.06, SD=.31; t(69)=2.72, p<.05] regarding the
educational climate in the FFS (Table 38). The effect size (Cohen, 1988) was moderate
(eta squared=.10). Non-completers gave lower scores than did completers to all the
statements regarding the educational climate of the FFS. The finding was that
completers agreed more strongly than non-completers with the statements regarding the
educational climate in the FFSs.

128
Table 38 T-test: Completers’ (n=56) and Non-Completers’ (n=15) Perceptions of Institutional Factors (Climate) Constructs M SD t p d
Completers 3.38 .42 2.72 .01* .10Non-Completers 3.06 .31
Notes. 1=Strongly Disagree; 2=Disagree; 3=Agree; 4=Strongly Agree p<.05 Cohen’s d (1988): 0.01-.059 (small effect), 0.06-.139 (moderate effect), 0.14 or more (large effect)
Objective 6: Competitions
6a. Describe FFS Program Completers, Non-Completers, and Non-Participants by the
Usefulness of Competitions as a Means for Increasing the Popularity of FFS
Completers (M=3.16, SD=.52) and non-completers (M=2.93, SD=.49) tend to
agree with the statements regarding the usefulness of competitions as a way to increase
the popularity of FFS (Table 39).

129
Table 39 Completers’ (n=56) and Non-Completers’ (n=15) Perceptions of the Usefulness of Competitions as a Means for Increasing the Popularity of FFSs
Completers Non-
Completers M SD M SDStatements Competitions as a way to increase the popularity of FFS
An FFS-sponsored vegetable-growing competition for FFS participants will increase the popularity of FFS in my community.
3.30 .50 2.93 .46
An FFS-sponsored competition within FFSs will increase learning.
3.30 .66 3.00 .54
An FFS-sponsored competition between several FFSs will increase learning.
3.11 .84 2.93 .80
I like participating in competitions. 2.96 .76 2.87 .74Construct 3.16 .52 2.93 .49
Note. 1=Strongly Disagree; 2=Disagree; 3=Agree; 4=Strongly Agree Non-participants tended to disagree (M=2.35, SD=.90) with the statements
regarding the usefulness of competitions as a means for increasing the popularity of a
FFS (Table 40).

130
Table 40 Non-Participants’ (n=38) Perceptions of the Usefulness of Competitions as a Means for Increasing the Popularity of FFSs
Non-Participants
M SDStatements Competitions as a way to increase the popularity of the FFS
I like competitions. 2.61 .95A vegetable-growing competition will encourage me to join FFS. 2.13 .99
Construct 2.35 .90Note. 1=Strongly Disagree; 2=Disagree; 3=Agree; 4=Strongly Agree 6b. Determine if a Significant Relationship Exists Between Respondents’ Perceptions of
the Usefulness of Competitions as a Means for Increasing the Popularity of FFS and
Participation Status
A statistically significant relationship was found between participation status and
the perception as to whether or not competitions are a viable means for increasing the
popularity of FFS [F(2,106)=16.4, p<.05]. The effect size (Cohen, 1988) was large (eta
squared=.24) (Table 41). Twenty-four percent of the variance in their perceptions
regarding competitions was explained by their participation status. The post-hoc
comparison of means (Table 42) indicated that the mean score for non-participants
(M=2.35, SD=.90) was significantly different from non-completers (M=2.93, SD=.49)
and completers (M=3.16, SD=.52). The finding was that non-participants disagreed with
the statements regarding the use of competitions to increase the popularity of FFS while
the completers and non-completers agreed with the same statements.

131
Table 41 Analysis of Variance: Perceptions on Competitions as a Way to Increase the Popularity of FFS by Participation Status (N=109) Constructs N M SD F p dCompetitions as a way to increase the popularity of FFS
Completers 56 3.16 .52 16.4 .00* .24Non-Completers 15 2.93 .49 Non-Participants 38 2.35 .90
Notes: 1=Strongly Disagree; 2=Disagree; 3=Agree; 4=Strongly Agree *p<0.05 Cohen’s d (1988): 0.01-.059 (small effect), 0.06-.139 (moderate effect), 0.14 or more (large effect) Table 42
Post Hoc: Competitions as a Way to Increase the Popularity of FFS by Participation Status (N=109) Participation Status Means for Groups (Subset for alpha=.05) Non-Participants 2.35 Non-Completers 2.93 Completers 3.16 Note: 1=Strongly Disagree; 2=Disagree; 3=Agree; 4=Strongly Agree

132
CHAPTER V
SUMMARY, CONCLUSIONS, AND RECOMMENDATIONS
This chapter presents the problem the study addressed, the research objectives, a
summary of the methodology, a summary of the findings of the study, the conclusions
and implications emerging from the findings, recommendations for future practice, and
recommendations for further research.
Statement of the Problem
It has been noted (Dolly, 2005) that farmers’ indiscriminate use of pesticides was
causing great harm to human health, the environment, and unduly raising the cost of
inputs. Particularly alarming is the use of pesticide “cocktails,” containing up to 4 to 5
pesticides which may be applied between one to seven times weekly (Ramroop, et.al,
2000). To address this challenge, the Ministry of Agriculture, Lands, and Marine
Resources (MALMR) has funded and managed Farmer Field Schools in more than thirty
locations throughout Trinidad. The objective of the FFSs is to improve farmers’
capacities for critical analyses, decision-making, and stimulating innovation for
increased agricultural productivity while also safeguarding human health and the
environment.
David Dolly of the University of the West Indies and Pauline Dowlath of
MALMR identified participant attrition and non-participation as a challenge faced by
agricultural extension in Trinidad and Tobago. The researchable problem addressed in
this study was that the factors in completion, non-completion, and non-participation in

133
Farmer Field Schools in Trinidad and Tobago were not known. Farmer Field Schools
are used as a vehicle for agricultural extension in all regions of the world. Despite the
global phenomenon, “the issue of participation in farmer field schools has barely been
touched in the literature.” (p. 94) The absence of literature on the issues surrounding
participation in FFS in Trinidad and Tobago and elsewhere hinders the knowledge-base
required for effective scaling-up of this approach in Trinidad and Tobago and elsewhere.
This research constitutes a first step in the development of new promising lines of
inquiry.
Purpose and Objectives of the Study
The purpose of the study was to identify and analyze factors affecting
completion, non-completion, and non-participation in FFS in Trinidad and Tobago.
Following are the research objectives identified to accomplish the purpose of the study.
1. Determine the personal characteristics of FFS completers, non-completers, and
non-participants.
a. Describe selected personal characteristics of FFS completers, non-
completers, and non-participants.
b. Describe the relationship between participation status and personal
characteristics.
2. Identify the motivations for participation in a FFS.
a. Describe FFS completers’ and non-completers’ motivations for
participation in a FFS at the beginning of the program.

134
b. Determine if a significant relationship exists between motivations for
participation and completion or non-completion of FFSs.
3. Determine the perceptions of selected farming practices (i.e., integrated pest
management, financial factors, and the compatibility of integrated pest
management in the social setting).
a. Describe FFS completers’ and non-completers’ perceptions of selected
farming practices at the beginning of the FFS.
b. Determine if there is a statistically significant difference in completers’
and non-completers’ perceptions of selected farming practices at the
beginning of a FFS.
c. Describe FFS completers’ and non-completers’ perceptions of selected
farming practices at the end of a FFS.
d. Determine if there is a statistically significant difference in completers’
and non-completers’ perceptions of selected farming practices at the end
of the FFS.
e. Determine if there was a statistically significant change in completers’
perceptions at the beginning and end of a FFS on selected farming
practices.
f. Determine if there was a statistically significant change in non-
completers’ perceptions at the beginning and end of FFS on selected
farming practices.
g. Describe FFS program non-participants by selected farming practices.

135
h. Determine if a significant relationship exists between participation status
and perceptions about selected farming practices.
4. Establish the priority rankings of their sources of information for farming.
a. Describe completers’ priority ranking of their sources of information for
farming at the beginning and end of FFS.
b. Describe FFS non-completers’ priority ranking of their sources of
information for farming at the beginning and end of a FFS.
c. Describe FFS non-participants’ priority rankings of their sources of
information for farming.
5. Identify the deterrents to participation in the FFS.
a. Describe FFS program completers, non-completers, and non-participants
by the deterrents to participation (life situation factors, institutional
factors, and dispositional factors).
b. Determine if a significant relationship exists between the deterrents to
participation and participation status.
6. Determine the usefulness of competitions as a means for increasing the
popularity of FFSs.
a. Describe FFS program completers, non-completers, and non-participants
as to their perceptions of the usefulness of competitions as a means for
increasing the popularity of the FFSs.

136
b. Determine if a significant relationship exists between respondents’
perceptions of the usefulness of competitions as a means for increasing
the popularity of FFS and participation status.
Summary of the Methodology
Type of Research and Theoretical Framework
This study employed an ex post facto, causal comparative research design. The
theoretical framework of this study was based on the Androgogical Model, as presented
by Knowles (2005). Knowles’ theory of andragogy, that is, the principles of adult
learning that may be distinguished from the principles of child learning, inform
agricultural education and extension practice. Farmer Field Schools, an innovative
contemporary vehicle for agricultural education and extension, employs the principles of
adult education. In addition, this study focused on the issue of participation in FFS, a
topic largely overlooked in the literature.
Population and Sample
The population was FFS-participating and non-participating farmers in Trinidad
and Tobago. The sample was limited to farmers who participated (i.e., completers and
non-completers) in five specific FFSs and farmers who possessed knowledge of the
program but chose to not participate.
FFS completers began and were active participants until the end of the
educational program. These individuals were recognized at the end of the program as
FFS graduates at the graduate-recognition ceremony. FFS program non-completers were

137
those farmers who initiated participation in the FFS program but at the end of the
program were not active members of the FFS group. These individuals were not
recognized as FFS graduates at the graduate-recognition ceremony. Non-participants
were classified as such because they fit at least one of the following descriptions: 1) The
agricultural officer (i.e., extension agent) met with the intended participant and after
describing the Field School to the person, the person declined an invitation to participate.
2) The individual visited the introductory Farmer Field School activity and decided not
to continue to participate in the school. 3) A member of the community or someone else
described the school to the intended participant and the person decided not to participate.
There were one-hundred nine respondents: fifty-six completers (51.3%), fifteen
non-completers (13.7%), and thirty-eight non-participants (34.8%) across five Farmer
Field Schools. The five FFSs were at Transfer Village, La Trinidad, Grand Fond,
Cemetery Trace, and Platanite.
• Transfer Village FFS is located in the Debe District, County Victoria, in southern
Trinidad.
• La Trinidad FFS is located in the Talparo District, County Saint George East, in
north-central Trinidad.
• Grand Fond FFS is located in the Santa Cruz District, County Saint George West,
in northwest Trinidad.
• Cemetery Trace FFS is located in the Freeport District, County Caroni, in central
Trinidad.

138
• Platanite FFS is located in the Rochard District, County Saint Patrick East, in
south Trinidad.
These five FFS were selected by MALMR personnel and the researcher due to the
time frame established by the researcher, the overlapping schedules of operation of the
FFS, and the availability of extension personnel who served as data collectors.
Respondents were selected by the FFS facilitators and the data collectors. The data
collectors gathered information from all of the program participants (completers and
non-completers: n=71) for the questionnaire Participants at the Beginning of the
Educational Cycle. At the end of the educational cycle, the non-completers were
identified by the agricultural officers who serve as FFS facilitators on a weekly basis and
by the program completers. The non-participants were identified by the FFS facilitators,
program completers, and program non-completers.
Instrument Development
Three instruments (Participants at the Beginning of the Educational Cycle,
Completers and Non-Completers, and Non-Participants) were developed to gather
information from the program completers, non-completers, and non-participants. The
questionnaires included quantitative, closed-ended category scale questions on a four
point Likert-scale measuring the farmers’ agreement levels (1=Strongly Disagree,
2=Disagree, 3=Agree, 4=Strongly Agree) with statements. The open-ended questions
were limited to seven questions requesting personal information: the number of friends
who had previously participated in an FFS, the number of family members who had
previously participated in an FFS, age, the size of their farm, the number of years they

139
had lived in the community, the number of years they had farmed, and the percentage of
annual income derived from agriculture. The administration of each of the three
questionnaires took approximately fifteen to twenty minutes to complete.
Validity and Reliability
The instruments were checked for face and content validity by a panel of fifteen
MALMR extension agents with vast experience conducting FFSs in Trinidad and
Tobago. The panel gave suggestions to improve the clarity and cultural sensitivity of the
questions.
The constructs of the three instruments were reliable. By the standard of a
minimum Cronbach alpha of 0.7, only eight of the eighteen constructs suggested
sufficient reliability. Tuckman (1999) opined, however, that the minimum reliability for
attitude tests (i.e., perceptions) is .50. Ary, Jacobs, and Razavieh (1996) also supported
the minimum threshold of 0.50. By a minimum standard of Cronbach alpha of 0.50
(Tuckman, 1999; Ary, Jacobs & Razavieh, 1996), fourteen of the eighteen constructs
were considered sufficiently reliable.
Data Collection
Data were collected from May to September 2007. Five MALMR agricultural
officers who serve as FFS facilitators and were members of the panel were selected to
carry out the survey in the five FFS. The five extension agents were selected by
MALMR personnel to serve as data collectors due to their familiarity with the purposes
and methods used in FFS, their professionalism, and integrity.

140
Training was conducted to ensure that the interviewers would follow a standard
protocol, thus ensuring the content validity of the instruments. In addition, a measure for
reducing social desirability bias was established. The data collectors (i.e., the
agricultural officers) traveled to FFSs outside of their geographic region. They did not
know any of the respondents, thus reducing the possibility of social desirability bias.
The 109 respondents were not compensated for their contributions to the study.
The data collectors, however, were financially compensated for their services rendered.
At the onset of administering the survey, the data collectors ensured respondents’
confidentiality. Each respondent had the right to refuse participation in the study. The
questionnaires were coded to ensure confidentiality and to facilitate the exploration of
the relationships between the perceptions of FFS program completers, non-completers,
and non-participants. Data were collected in conformity with the research guidelines set
by the Texas A&M University Institutional Review Board (IRB).
Data Analysis
Quantitative data analysis was conducted via the Statistical Package for Social
Sciences (SPSS Version 15) to determine reliability of the instruments, frequencies,
percentages, means, standard deviations, chi-square test for independence, independent
samples t-tests, paired samples t-tests, one way analysis of variance (ANOVA), and
post-hoc tests of differences. Alpha for all statistical procedures was set a priori at 0.05.

141
Key Findings, Conclusions, Implications, and Recommendations for Future
Practice
This section presents a summary of the key findings, conclusions, implications,
and recommendations for future practice for each of the six research objectives.
Objective 1: Personal Characteristics
This study established that there were no statistically significant differences
between participation status and the following variables: the number of family members
who have participated in FFS, the size of their farm, the number of years lived in the
community, the number of years farmed, the percentage of annual income derived from
agriculture, marital status, educational background, and whether they had participated in
agricultural extension programs prior to FFS. This study found statistically significant
relationships between participation status and three personal characteristics: the number
of friends who have participated in FFS, age, and gender.
The first key finding was that completers had more friends who had participated
in FFSs than did non-completers and non-participants. The conclusion is that
individuals with a greater number of participating friends are more likely to complete the
program. The implication is that a greater number of individuals with many friends in
the FFS may decrease the likelihood of non-completion. A second implication is that
the participation of family members in the FFS has no bearing on participation status.
Therefore, it is recommended that in the process of initiating an FFS, FFS
facilitators make special efforts to encourage the potential program participants to invite

142
their friends. FFS facilitators may, of course, encourage the potential participants to
invite their family members, but the participation of friends, rather than family, is more
likely to increase the rates at which the farmers complete the program.
A second finding was that men disproportionately outnumbered women in the
FFS. The conclusion is that few women participated in the FFSs. The implication is
that more women should participate in FFSs.
Therefore, it is recommended that MALMR determine whether a concerted effort
to encourage the participation of women in the FFSs is merited or whether the
proportion of men to women in the FFSs mirror the cultural norms for gender roles, thus,
not requiring a campaign for increasing the participation of females in FFS. FFS
programs have historically sought to empower marginalized populations, including
women (Pontius, Dilts, & Bartlett, 2000; Davis, 2006). As mentioned in Chapter II,
Dolly (2005) pointed out that in the first two FFSs conducted in Trinidad and Tobago,
there were more female than male participants. In the five FFS upon which this study is
based, however, men far outnumbered the women. The total number of men (n=86;
78.9%) respondents across the classifications of completers, non-completers, and non-
participants vastly outnumbered women respondents (n=23; 21.1%). Men constituted
roughly two-thirds of the completers (73%) and non-completers (67%). This aligns with
Ramroop et.al.’s (2000) observation about gender roles in Trinidad and Tobago:
“Gender roles on the farm are clearly defined with the male being responsible for
decision-making, while females are merely assistants.” (p. 63)

143
The statistically significant difference found between participation levels and
gender is likely a function of sampling bias, particularly with regards to the sample of
non-participants (Males: n=35; 92.1% of non-participants; Females: n=3; 7.9% of non-
participants). Agriculture in Trinidad and Tobago is a male-dominated sector. It is
possible that non-participating males were resistant to letting their wives respond to the
survey. Non-participating females may have chosen to not respond to remain within the
socially acceptable norms.
The third finding was that, on average, the non-completers were the youngest
(M=40), the completers were the middle group in age, and non-participants were the
oldest (M=49). The average ages in the three groups ranged from forty to fifty. While it
is not feasible or ethical for the MALMR to target younger farmers to the exclusion of
older farmers, it is helpful to possess the awareness that there is a significant relationship
between age and participation status. It is unlikely that an increased awareness that there
is a significant relationship between age and participation status will impact FFS
practice.
Objective 2: Motivations for Participation
The first key finding is that at the beginning of the FFS program there already
existed some significant differences among program completers and non-completers. It
is likely that these differences were inherent to each group, thus serving as a filter for the
messages received and impacting their likelihood to persist or desist in the program. The
conclusion is that there is little, if anything, that the MALMR can do about the

144
individuals’ perceptions prior to the educational program. The implication is that the
FFS facilitators can change participants’ minds once they made the decision to join the
FFS group. It is recommended that MALMR agricultural officers note the differing
motivations of FFS completers and non-completers and implement strategies to meet the
participants’ needs, thus resulting in more effective FFSs.
As a result of this study, it was established that a significant relationship existed
between participation status and four of the five constructs testing their motivations for
participation in FFS. There were statistically significant differences between completers
and non-completers on 1) their social reasons for participating in FFS (with a small
effect size), 2) their concern for other people, community, humanity, and the
environment (with a moderate effect size), 3) their expectations for improving
occupational performance and status (with a moderate effect size), and 4) their cognitive
interest (with a moderate effect size). Completers and non-completers did not differ in
their perception of participation in FFS as a means for stimulation and escape (i.e., both
completers and non-completers disagreed with the idea that FFS provided an escape
from the routines of daily life.)
A second finding was that completers agreed more than did non-completers
with the statements regarding social reasons for participation. The conclusion is that
social reasons for participation are more important to completers than they are for non-
completers. An implication exists that completers are more driven by social reasons to
participate in FFS than were non-completers.

145
Therefore, it is recommended that FFSs facilitators emphasize the social aspects
of FFS. For example, the extension officers should ensure that participants invite their
friends and family to participate with them in FFS. As noted in Research Objective 1,
having a large number of friends participate in FFS is a statistically significant predictor
of completion. Having a large number of family members, however, is not a statistically
significant predictor of completion. The FFS facilitators should encourage participants
to first invite their friends, and second, their family members.
Another recommendation considers the difference in completers’ (M=2.63,
SD=1.12) and non-completers’ (M=1.73, SD=.59) responses to the statement, “I joined
FFS to belong to a group.” The FFS facilitators would do well not to neglect the “group
dynamic activities,” an essential component of the weekly FFS meeting (Gallagher,
2002). The group dynamic activities are designed to build group cohesion. Considering
that completers are drawn to FFS because they wanted to belong to a group, the group
dynamic activities should be duly emphasized.
A third key finding is that completers agreed more than did the non-completers
with the statements regarding their concern for other people and the environment. The
conclusion is that completers possessed a greater concern for their surroundings than did
non-completers. An implication exists that those individuals with less concern for the
environment are more likely to not complete the FFS program because they do not
understand the negative impacts of pesticides on eco-systems and their potentially
positive role by adopting IPM farming methods.

146
Therefore, it is recommended that the FFS facilitators emphasize, particularly
during the first few FFS weekly meetings, the potentially negative impacts of agriculture
in general on the environment, and especially the use of pesticides on local agro-
ecological systems. The goal is that the participants who expressed less concern for
other people and the environment (i.e., likely to be non-completers) would be convinced
of their responsibility to safeguard the local agro-ecosystem and human health. This
effort may be achieved through the use of educational materials and/or testimonials from
other farmers (i.e., near peers). Of these two approaches, the influence of near peers,
especially local opinion leaders, is most effective to convince individuals in the
persuasion and decision stages of the innovation-decision process (Rogers, 2003).
A second recommendation is that at the beginning of a FFS educational cycle,
the FFS facilitators have the participants complete a questionnaire regarding their
motivations for participation. The questionnaire would test the constructs presented in
research objective two. The information gathered through the questionnaire would
enable the FFS facilitators to more effectively target participants who enter FFS
according to their beliefs and perceptions regarding the environment, farming practices,
and other critical issues for FFS. If a pencil-and-paper questionnaire is not a viable
option due to low literacy rates, the FFS facilitators could use the rapid rural appraisal
(RRA) data-collection methodology.
A fourth key finding was that completers agreed more than did the non-
completers with the statements regarding their expectations for improving their
occupational performance and status. The conclusion is that completers had higher
147
expectations than did non-completers that participation in a FFS would improve their
occupational performance and status. An implication exists that those individuals (i.e.,
non-completers) who at the beginning of FFS possessed little hope that the training
received would improve their farming skills, income, and standing in the community
were more likely to not complete the educational program.
It is recommended that FFS facilitators emphasize from the beginning of the
educational cycle the ways in which IPM may improve farmers’ agricultural production,
and as a result, improve their standing in the community. In addition, it is recommended
that the FFS facilitators bring program completers from previous FFSs, especially the
local opinion leaders, to share their experiences. Visits by former FFS completers would
be most effective toward the beginning of the educational cycle, as perceptions about the
utility of IPM for improving production and the benefits to the environment are taking
shape early in the educational cycle.
A fifth key finding is that completers agreed more than did non-completers with
the statements regarding their cognitive interest as a motivation for participation in FFS.
For instance, completers and non-completers differed on the statements, “I like learning
just to know more” and “I enjoy learning new things.” The conclusion is that cognitive
interest is a motivation to participate for the FFS completers much more so than it is for
the non-completers. An implication exists that the individuals (i.e., non-completers)
who at the beginning of FFS gain less enjoyment from learning for the sake of learning,
are more likely to not complete the FFS program.

148
Again, it is recommended that the FFS facilitators use a questionnaire, either of a
pencil-and-paper variety or a rapid rural appraisal (RRA), to be able to distinguish who
is and is not motivated to participate in FFS due to a sense of cognitive interest. With
this information, the FFS facilitators may target their distinct audiences, thus increasing
the participants’ awareness of the usefulness of that which is to be learned. This task
may be accomplished through an iterative process of reminding the participants that
what they learn in FFS will help them confront the challenges they face daily: how to
better manage their crops for increased agricultural productivity while safeguarding
human health and the environment. According to Knowles (2005), the principle of
andragogy indicates that learners desire to know why they need to learn something
before attempting to learn it.
Objective 3: Farming Practices
To determine whether there were differences in the perceptions of completers
and non-completers regarding 1) the use of pesticides in farming, 2) the financial factors
involved in the adoption of IPM, and 3) the compatibility of IPM with the social setting
in Trinidad and Tobago, a multi-pronged approach was implemented. First, two
independent samples t-tests were run to determine whether there were significant
differences in completers’ and non-completers’ perceptions at the beginning and end of
the FFS. Second, two paired samples t-tests were run to determine whether there were
significant differences in completers’ and non-completers’ perceptions at the beginning
and end of the FFS.

149
The Use of Pesticides in Farming
As a result of this study, it was found that at the beginning of FFS, completers
and non-completers differed significantly in their perceptions of the use of pesticides in
farming (with a moderate practical significance). The finding was that at the beginning
of FFS, completers agreed more strongly than did non-completers with the statements
concerning the use of pesticides in farming. The conclusion is that before the educational
programming (i.e., FFS), completers possessed a greater belief than did non-completers
that pesticides negatively affect people and the environment. The implication is that
individuals (i.e., non-completers) who did not hold strong beliefs concerning the
negative impacts of pesticides on the environment are more likely to not complete the
FFS.
At the end of FFS, however, there was not a significant difference between
completers and non-completers on their views concerning the use of pesticides in
farming. At the beginning of the FFSs, there was a statistically significant difference in
the completers’ and non-completers’ views on the use of pesticide, but by the end of
FFS, there was not a statistically significant difference in the completers’ and non-
completers’ perceptions. The conclusion is that FFS completers’ decreased their
agreement with the statements on the use of pesticides in farming. This is an unexpected
result, considering that one would expect FFS to increase the completers’ perception that
pesticides are harmful to the agro-ecosystem. This issue is further addressed in the
following discussion on the pre/post test (i.e., paired-samples t-test).

150
A paired sample t-test was conducted to compare the completers’ and non-
completers’ perceptions at the beginning and end of FFS with regards to the use of
pesticides in farming at the beginning and end of FFS. Program completers displayed a
significant decrease from the beginning (M=3.17, SD=.47) to the end (M=2.83, SD=.58)
of FFS in their perceptions of the use of pesticides in farming. The magnitude of the
difference was large (eta squared).
There are two possible conclusions: first, at the beginning of FFS, completers
overestimated their opinions and, their actual opinions regarding the use of pesticide
were revealed on the post-test. A second, and more plausible conclusion, is that as a
result of their involvement in FFS, the completers became less concerned about the
negative aspects of pesticide upon human health and the environment. For example,
completers’ agreement level marked a decrease from the beginning (M=3.39, SD=.73)
and end (M=3.13, SD.52) of FFS with the statement, “I believe that farmers’ decisions
affect people, animals, plants, and land.” In addition, completers decreased their
agreement level from the beginning (M=2.50, SD=.87) and end (M=2.04, SD=.85) of
FFS on the statement, “Pollution from agricultural chemicals is a serious problem on my
farm.” This certainly was an unexpected finding.
A potential explanation for why the completers underwent such a dramatic
change is based upon something the researcher heard about on a couple of occasions
while in Trinidad, though he never saw it firsthand. In May 2007, the researcher visited
five FFSs over the course of five days. In two of those FFSs, the FFS facilitator
mentioned that a representative from an agro-shop had either visited the FFS the week

151
before or would visit with them the following week. The purpose of the visits was to
discuss with the farmers (at the invitation of the FFS facilitators) the inputs and services
offered by the agro-shop. It may be implied that the agro-shop representative dissuaded
the farmers, including the completers, from believing the message regarding the use of
pesticides and IPM that MALMR sought to transmit to the farmers.
In the pre/post test, non-completers did not increase their agreement with the
statements concerning the use of pesticides in farming. Moreover, at the end of FFS,
completers posted the lowest mean score of the three groups: completers (M=2.83,
SD=.58), non-completers (M=2.87, SD=.18), and non-participants (M=3.18, SD=.54).
An implication exists that the FFSs were ineffective in convincing the completers and
non-completers that pesticides negatively impact the local agro-ecosystem. It is
therefore recommended that MALMR assess the elements of the FFS program which
address the impacts of pesticides on the environment and the methods used to convey
that message.
The Financial Factors Involved in the Adoption of IPM
At the beginning of FFS, completers and non-completers did not differ in their
perceptions of the financial factors involved in the adoption of IPM. By the end of the
FFS program, there was a statistically significant difference in the perceptions of
completers and non-completers with regard to the financial factors involved in the
adoption of IPM. The conclusion is that completers were significantly more likely than
non-completers to be willing to take on the financial risks involved in the adoption of
IPM on their farms. The implication is that the non-completers were unwilling to take
152
on financial risk in order to adopt IPM on their farms and were uncertain of the financial
benefits to adopting IPM. Non-completers need more convincing evidence of the
financial payoff to adopting IPM methods. This finding corresponds to Dolly’s (2005)
observation that “if the school can show the possibilities to cut production cost while
producing a product which consumers demand at premium prices,” it will positively
impact participation. Implicit in Dolly’s statement is that farmers’ adoption of IPM is
dependent on the purchase and consumption preferences of the consumer. For this
reason, the set of questions on the compatibility of IPM in the context of Trinidad were
asked.
Compatibility of IPM in the Social Setting
At the beginning of FFS, completers and non-completers did not differ in their
perceptions regarding the compatibility of IPM within the social setting. By the end of
FFS, completers’ held statistically significant higher scores than non-completers’
concerning the belief that IPM is compatible with the setting of Trinidad and Tobago.
The conclusion is that completers believed more strongly than did non-completers that
IPM is compatible with agricultural practices and the market in Trinidad and Tobago.
The implication is that the individuals who held a weak belief concerning the
compatibility of IPM with the setting are more likely to not complete the FFS program.
The following recommendation applies to both the financial factors involved in
the adoption of IPM and the compatibility of IPM in the social setting. It is
recommended that MALMR conduct a study aimed at demonstrating that the farming
methods taught in FFS, namely IPM, 1) can indeed cut farmers’ production costs and 2)

153
that customers in Trinidad and Tobago want and are willing to pay for fruits and
vegetables and fruits with less pesticide used in its growth cycle, or perhaps even
consumers’ willingness to purchase pesticide-free (i.e., organic) vegetables and fruits.
The compatibility of IPM with the social setting is likely to be determined by whether
there is an adequate market for IPM-produced fruits and vegetables. Then, it is critical
that MALMR disseminate the findings of the study as a central component of the FFS
training.
Objective 4: Priority Ranking of Sources of Information
The finding is that in a pre/post test, completers’ priority rankings of their
sources of information about farming did not change. Completers’ most highly value the
information received from MALMR, then the agro-shops, and finally, the other farmers.
The conclusion is that for completers, their participation in FFS confirmed their belief
that information from MALMR is trustworthy and valuable.
At the beginning of FFS, the respondents who at the end of the program were
classified as non-completers, ranked MALMR as the most important source of
information about farming practices and agro-shops as the second most important source
(Table 27). At the end of FFS, however, non-completers ranked the agro-shops as the
most important source of information. The finding was that in a pre/post test, non-
completers’ priority rankings of their sources of information changed. The conclusion is
that non-completers’ opinions of MALMR as a source of information about farming
decreased. An implication exists that at the end of FFS, MALMR became less important

154
to the non-completers as a source of information.
One must approach this finding with caution, however. The small number of
non-completer respondents (n=15) places limits on what we can conclude from this
finding. At first glance, the pre-post test for program non-completers indicated that they
changed their opinion over the course of the program. A more nuanced approach
recognizes that non-completers did not undergo a meaningful change. At the beginning
of FFS, five of fifteen non-completers indicated that MALMR was their most important
source of information for farming while four of fifteen indicated that the agro-shops
were their most important source of information. At the end of FFS, six of fifteen
indicated that the agro-shops were their most important source of information while
three of fifteen indicated that MALMR was their most important source of information.
This means that it is possible that only one person changed their vote from the first to the
second assessment, thus greatly minimizing the perception that there had been a
meaningful change in the completers’ perceptions.
Consequently, three conclusions can be drawn. First, whereas completers were
likely to seek information from MALMR, the non-completers were more divided
between the agro-shops and MALMR. Second, completers’ and non-completers’
participation in FFS did little to change their perceptions about their most important
sources of information for farming. Third, it was likely that the small number of non-
completers (n=15) constrained the potential for determining whether non-completers
underwent any changes in their beliefs about their sources of information as a result of
their involvement in FFS.

155
Non-participants ranked agro-shops as their most important source of
information about farming. The conclusion is that for non-participants, MALMR did not
rank very highly as a source of information. An implication exists that non-participants
were more likely to seek information about farming from the agro-shops; they were
unlikely to seek out extension officers of MALMR or other MALMR entities for
information about farming.
Therefore, it is recommended that MALMR strengthen mechanisms for increased
visibility among agricultural producers who have not had previous contact with the
ministry. Dolly (personal communication, January 2006) reported that those who
participated in the earliest FFSs in Trinidad and Tobago were individuals who had
frequent contacts with the extension officers. He argued that for FFS to be a viable
option as method of conducting agricultural extension in Trinidad and Tobago, farmers
with little to no contact with the extension officers would have to be targeted. This study
shows that MALMR was successfully reaching farmers with no previous contacts with
the agricultural extension services. Completers (68%) and non-completers (60%)
indicated that their involvement in FFS was their first time to participate in any
agricultural extension program. This is a resounding success for MALMR. There are
many more farmers who have yet to participate or have contact with the extension
service; more than two-thirds (71%) of non-participants indicated that they had not
participated in any agricultural extension programs.
It is recommended that MALMR increase their visibility among farmers with
little to no previous contact. This may be accomplished by increasing the number of

156
FFSs around the country in addition to other agricultural education programming. It is
advised that MALMR conduct a needs analysis of small-scale farmers and develop
programs according to the needs analysis. This may increase the view of FFS non-
completers and non-participants of MALMR as a valuable source of information of
farming.
Objective 5: Deterrents to Participation
Dolly (2005) reported non-participants’ purported reasons for not attending FFS.
First, non-participants cited an unwillingness to give up their time, particularly
considering the time commitment of weekly meeting times of four hours each week
during the months of cultivation. Second, they believed that they did not need the
training. Third, they claimed that they were unaware of the educational programming
being offered.
This researcher explored the relationships between participation status in FFS
and the perceptions of the life situation factors, institutional factors, and dispositional
factors that inhibited participation and/or completion of FFS. The institutional factors
were categorized by convenience factors, process and application factors, climate
factors, and outcome factors. Within this study, Cross’s term, “dispositional factors,” is
referred to as “personal preferences.”
As a result of this study, a significant relationship was established between
participation status and five of the six constructs: 1) institutional factors (convenience),
2) institutional factors (process and application), 3) institutional factors (outcomes), 4)

157
institutional factors (climate), and 5) personal preferences. With the exception of the
personal preferences (moderate), all of the significant relationships held large practical
significance (eta squared). The post hoc tests reveal that in each of the significantly
different relationships, it is the completers who differed from the non-completers and
non-participants.
One finding is that completers, non-completers, and non-participants did not
differ in their degree of agreement with the statements concerning the life situation
factors. The conclusion is that completers, non-completers, and non-participants held
similar perceptions regarding the situational barriers that may have influenced
participation decisions. The implication is that completers, non-completers, and non-
participants did not view the life situation factors as presented in the construct as being
deterrents to their participation in FFS. For example, completers (M=1.71, SD=.73),
non-completers (M=1.73, SD=.70), and non-participants (M=1.50, SD=.69) disagreed
with the statement, “A health problem kept me from participating in FFS.” In addition,
completers (M=2.89, SD=.91), non-completers (M=2.73, SD=.70), and non-participants
(M=2.55, SD=.83) agreed with the statement, “A friend or family member encouraged
me to participate in FFS.”
Despite this finding, its reliability is uncertain. The construct’s alpha level was
quite low. This may be accounted for due to the researcher not having followed all of
the constructs in Morstain and Smart’s factor analysis. The researcher combined
Morstain and Smart’s two categories of “social relationships” and “external
expectations” into the single category “life situation factors.” In future research of this

158
kind, the questions on the construct should be divided according to the two constructs
laid out by Morstain and Smart in order to increase the reliability of the scale. In
addition, the statement “I saw FFS as a chance to learn how to improve my income”
should be transferred to the construct “Institutional factors: Process and Application.”
A second finding was that completers agreed much more strongly than did non-
completers or non-participants with the statements regarding the schedule and meeting
place convenience factors. The conclusion is that completers were more likely to
believe that the FFS was scheduled at a convenient location and time for them to attend
the FFS. The implication is that the individuals who were dissatisfied with the
convenience factors, for example, the weekly schedule and meeting place, were more
likely to not complete the FFS program (i.e., non-completers) or not enroll at all (i.e.,
non-participants). Completers believed that MALMR offered the FFS program at a high
degree of convenience for participants, whereas non-completers and non-participants
believed that MALMR did not make it convenient for individuals to participate. It is
recommended that MALMR conduct needs assessments before conducting an FFS in a
geographic area in order to determine a location and meeting time that suits as many
potential participants as possible.
A third finding was that completers agreed much more strongly than did non-
completers and non-participants with the statements regarding the process and
application elements of the institutional factors. The conclusion is that completers
believed that FFS was relevant to their needs whereas the non-completers and non-
participants did not. An implication exists that non-completers and non-participants

159
desisted from participating in FFS because they did not believe it to meet their needs. It
is recommended that MALMR conduct periodic assessments, whether they are formal
(pencil and paper) or informal (casual conversation) of the FFS participants’ perceptions
with regards to the relevance of the topics and practices covered in FFS to their farming
situations encountered on their own farms. Farmers must feel that their real problems on
their farms are being addressed. This is necessary in order for farmers to maintain
interest in the program.
A fourth finding was that completers agreed much more strongly than did non-
completers and non-participants with the statements concerning their expectations of the
outcomes of FFS. The conclusion is that completers held more positive beliefs than did
non-completers and non-participants concerning their expectations of the outcomes of
FFS. Completers possessed a higher satisfaction with the outcomes of FFS than did non-
completers; in fact, completers scored every statement on the construct Outcomes higher
than did the non-completers. An implication exists that the non-completers desisted and
the non-participants hesitated to join FFS because they believed that FFS would not
yield positive outcomes for them (or others).
It is recommended, therefore, that 1) MALMR institute the practice of having
one or two program completers from previous FFSs attend the first few meetings of a
newly-formed FFS group. This would allow new FFS farmers to hear personal
testimonials from fellow farmers about their successes in implementing new, more
environmentally-friendly farming methods. It is also recommended that FFS facilitators

160
implement a monitoring system to aid in assuring the satisfaction of the participants at
each meeting.
A fifth finding was that completers agreed much more strongly than did non-
completers and non-participants with the statements regarding their learning preferences.
The conclusion is that completers are different from non-completers and non-
participants with regards to their learning environment preferences and their perceptions
of what MALMR has to offer them. For example, completers are more inclined to enjoy
learning with a group of people than by themselves and non-completers and non-
participants were more likely to enjoy learning by themselves than with a group of
people. An implication exists that non-completers are likely to withdraw from FFS and
non-participants are likely to not join FFS because the learning exercises are based on
group-action. More specifically, the AESA, the special topic, and the group-dynamic
activities, which form the core of all FFS activities, are group-based activities.
It is recommended that MALMR find ways to incorporate more independent
activities within the FFS weekly programs. This may encourage the participation of
those individuals who prefer to learn independently from their peers, such as those
classified by this study as non-completers and non-participants.
A sixth finding was that completers agreed more strongly than non-completers
with the statements regarding the educational climate in FFS. The conclusion is that
completers believed more strongly than did non-completers that there was an
environment conducive to learning in the FFS. An implication exists that the non-
completers stopped attending FFS because they believed that the FFS lacked an adequate

161
environment in which they could best learn. Again, it is recommended that the FFS
facilitators implement a system for monitoring and evaluation that would allow them to
determine the participants’ perceptions of the learning environment, the applicability of
the topics and practices in FFS to their farming situation, and other issues.
Objective 6: Competitions
One of the topics that was approached during the feasibility study in October
2006 was the concept of using competitions, whether within the FFSs or between the
various FFSs, as a means for increasing the popularity of FFS for those already involved,
and to attract non-participants to join the program. It was recognized at that time that the
likelihood existed that there would be little, if any, literature on the use of competitions
within FFS. In addition, it is possible that competitions have never been used within
FFSs to spur learning and the program’s popularity among farmers. Regardless, the
researcher decided to explore the concept of whether competitions may be a vehicle for
increasing the popularity of FFS in Trinidad and Tobago.
An ANOVA was conducted to explore the relationship between participation
status and the perception whether competitions would be a viable means for increasing
the popularity of FFS. There was a statistically significant difference between
completers, non-completers, and non-participants regarding competitions. The
magnitude of the differences in the means is very large (eta squared=.24). A post hoc
test showed that non-participants were dissimilar from non-completers and completers.

162
Non-participants disagreed with the statements regarding the use of competitions
to increase the popularity of FFS while the completers and non-completers agreed with
the statements. The implication is that the completers and non-completers view
competitions favorably whereas non-participants are likely to view them unfavorably.
Non-participants are unlikely to perceive competitions as a reason to join a FFS.
Completers and non-completers viewed competitions more favorably and thus may be
interested in competitions as an activity.
If MALMR were to implement competitions within or between FFSs that use a
winners-and-losers approach, it is recommended that they proceed with caution in the
planning and implementation stages as completers posted a higher preference for
competitions than did non-completers. In addition, if MALMR were to use competitions
to increase the popularity of FFS, they should not expect non-participants to be drawn to
FFS as a result of the competitions. Taking these factors into consideration, it is
recommended that MALMR give careful consideration to the use of competitions in
FFSs (if the competitions use a winners-and-losers approach) until more research is
conducted on the perceptions of completers, non-completers, and non-participants on the
issue.
Given the completers’ and non-completers’ positive response to competitions, it
is highly recommended that MALMR establish as a regular part of its curriculum a
system to recognize the achievements of the participating farmers. A graduation
ceremony at the end of the educational cycle is already firmly institutionalized as a
component of the FFSs. Local communities are invited to participate in the ceremony.

163
These are important first steps. It is recommended that MALMR either include in the
graduation ceremony or as a separate ceremony, a service that recognizes a specific
achievement or accomplishment of each and every FFS participant. Inexpensive ribbons
(or some other tangible object) could be given as an award. This approach will create a
great deal of goodwill among the participating farmers, help retain the farmers who
expressed their doubts regarding FFS, and increase the receptivity of non-participating
farmers to join future FFS programs.
Recommendations for Future Research
1. It is recommended that future studies of this type have a larger sample size,
particularly concerning the program non-completers.
2. Farmer Field Schools are increasingly being used by the extension services in the
Caribbean. It is recommended that future studies focus on the factors of
participation in FFSs in order Caribbean island nations.
3. The study evaluated FFS completers, non-completers, and non-participants
during one FFS educational cycle, which parallels a cropping cycle. This time
period may be insufficient for the questionnaire respondents to gain a well-
balanced perspective on FFS. While this study takes a snap-shot approach, it is
recommended that a follow up study capture the respondents’ perceptions at a
later date.
4. Future researchers should ensure that a complete pilot study is conducted.

164
5. Future researchers should conduct a factor analysis of the questionnaires
provided in Appendices 2, 3, and 4.
6. The reliability of the scale could be improved by including more
statements/questions on each measure and removing the statements/questions
that do not fit the construct. For instance, on the two questionnaires Completers
and Non-Completers and Non-Participants, the researcher’s factor, “social
reasons”, encompassed the two factors found by Morstain and Smart (1974),
social relationships and external expectations. In future studies on the factors of
participation in FFS, the questionnaires should follow the factors laid out by
Morstain and Smart.
7. The personal characteristics questions should have included the question: Do you
own the land that you farm or do you rent it?
8. How do the five FFSs in this study (Transfer Village, La Trinidad, Grand Fond,
Cemetery Trace, and Platanite) differ in regards to…?
a. Personal characteristics
b. Motivations for participation in FFS
c. Perceptions of selected farming practices
d. Priority rankings of their sources of information about farming practices
e. Deterrents to participation
f. Perceptions of competitions
9. Why did the FFS completers post the lowest mean score of the three groups
(completers (M=2.83, SD=.58), non-completers (M=2.87, SD=.18), and non-

165
participants (M=3.18, SD=.54)) on the construct regarding the use of pesticides in
farming? A possible explanation is that FFS was ineffective in convincing them
that pesticides overuse and misapplication was a serious problem. Is this really
the case? This finding undermines the intent of the AESA approach: to
discontinue dependency on pesticides as the primary pest-control measure. It is
recommended that research on the other FFSs in Trinidad and Tobago be
conducted to determine the impacts of FFS on farmers’ perceptions of the use of
pesticides in farming.
10. Agriculture is a male-dominated sector in Trinidad and Tobago. Men are the
decision-makers on the farm while women assistant in the production and
commercialization. In similar fashion, the number of men vastly outnumbered
women in FFSs. In other regions of the world, FFS planners have sought to
increase the participation of women in the FFSs so that they could voice their
opinions with greater knowledge of agro-ecosystems and best practices. It is
recommended that future research determine the methods and practices by which
women may be encouraged to join FFSs in larger numbers.
11. One of the findings of the study was that non-completers were not convinced of
the financial payoff for adopting IPM methods. In other words, they are
uncertain that there is a cost-savings on pesticide and that consumers are willing
to pay higher prices for IPM-produced vegetables. Dolly’s (2005) observation
remains valid: FFS must show that farmers can cut production cost while
producing a product for which consumers will pay a premium price. It is

166
recommended that MALMR (if it has not already done so) conduct a cost-benefit
analysis of the market in Trinidad and Tobago, ranging from the producer’s
inputs to the consumer’s wallet. Implicit in Dolly’s statement is that farmers’
adoption of IPM is dependent on the purchase and consumption preferences of
the consumer. As a result of this study we know that FFS completers believe that
consumers will purchase IPM-vegetables at a premium price. What is unknown
is whether consumers feel the same way.

167
REFERENCES Anderson, J. R., & Feder, G. (2004). Agricultural extension: Good intentions and hard
realities. The World Bank Research Observer, 19(1), 41-60.
Anderson, J. R., Feder, G., & Ganguly, S. (2006). The rise and fall of training and visit
extension: An Asian mini-drama with an African epilogue. World Bank Policy
Research Working Paper 3928. Washington, DC.
Ary, D., Jacobs, L., & Razavieh, A. (1996). Introduction to research in education. (5th
ed.). Fort Worth: Holt, Rinehart, and Winston, Inc.
Beder, H. (1990). Reasons for nonparticipation in adult basic education. Adult Education
Quarterly, 40(4), 207-218.
Benor, D., Harrison, J. Q., & Baxter, M. (1984). Agricultural extension: The training
and visit system. Washington, DC: World Bank.
Boshier, R. W. (1971). Motivational orientations of adult education participants: A
factor-analytic exploration of Houle’s typology. Adult Education Quarterly,
21(2), 3-26.
Braun, A., Jiggins, J., Roling, N., van den Berg, H., & Snijders, P. (2006). A global
survey and review of farmer field school experiences. Retrieved January 17,
2008, from http://www.infobridge.org/asp/documents/1880.pdf
Braun, A. R., Thiele, G., & Fernandez, M. (2000). Farmer field schools and local
agricultural research committees: Complementary platforms for integrated
decision-making in sustainable agriculture. London, UK: Agricultural Research
168
and Extension Network, Overseas Development Institute, Network Paper No.
105.
Briggs, S. R., & Cheek, J. M. (1986). The role of factor analysis in the development and
evaluation of personality scales. Journal of Personality, 54, 106-148.
Britannica Student Encyclopedia. (2008). Trinidad and Tobago. Retrieved April 14,
2008, from http://student.britannica.com/ebi/art-55150
Bruin, G. C. & Meerman, F. (2001). New ways of developing agricultural technologies:
The Zanzibar experience with participatory integrated pest management.
Wageningen, Netherlands: Wageningen University and Research Center.
Bunch, R. (1982). Two ears of corn: A guide to people-centered agricultural
improvement. Oklahoma City: World Neighbors.
Bunyatta, D. K., Mureithi, J. G., Onyango, C. A., & Ngesa, F. U. (2006). Farmer Field
School effectiveness for soil and crop management technologies in Kenya.
Journal of International Agricultural and Extension Education, 13(3), 47-63.
Burgess, P. (1971). Reasons for adult participation in group educational activities. Adult
Education Quarterly, 22(1), 3-29.
Caribbean Agricultural Research and Development Institute. (1997). Update on the
regional action plan for the pink mealybug. St. Augustine, Trinidad and Tobago:
CARDI.
Caribbean Land and Water Resources Network (Ministry of Agriculture, Land, and
Marine Resources). (2005). Trinidad and Tobago. Retrieved January 20, 2008,
from http://www.procicaribe.org/networks/clawrenet/reports/z_tt/tt.htm

169
Carp, A., Peterson, R., & Roelfs, P. (1974). Adult learning interests and experiences. In
K. P. Cross & J. Valley (Eds.), Planning nontraditional programs (11-52). San
Francisco: Josey-Bass.
Central Intelligence Agency (CIA). (2008). The world factbook. Retrieved January 15,
2008, from http://www.cia.gov/cia/publications/factbook/index.html
Central Statistical Office, Ministry of Planning and Development, Government of the
Republic of Trinidad and Tobago. (2008). National income report, 2000-2006.
Retrieved January 15, 2008, from
http://cso.gov.tt/files/cms/National%20Income%20Report%202000%20-
%202006%20.pdf
Chambers, R. (1983). Rural development: Putting the last first. London: Longman
Publishing
Chambers, R., Pacey, A., & Thrupp, L.A. (1989). Farmer first: Farmer innovation and
agricultural research. London: Practical Action Publishing
Cohen, J. (1988). Statistical power analysis for the behavioral sciences. Hillsdale, NJ:
Erlbaum.
Cross, K. P. (1992.) Adults as learners. New York, New York: Jossey-Bass.
Darkenwald, G. G., & Gavin, W. J. (1987). Dropout as a function of discrepancies
between expectations and actual experiences of the classroom social
environment. Adult Education Quarterly, 37(3), 152-163.
Darkenwald, G. G., & Valentine, T. (1985). Factor structure of deterrents to public
participation in adult education. Adult Education Quarterly, 35(4), 177-193.
170
David, S. (2007). Learning to think for ourselves: Knowledge improvement and social
benefits among Farmer Field School participants in Cameroon, Journal of
International Agricultural and Extension Education, 14(2), 35-49.
Davis, K. (2004). Technology dissemination among small-scale farmers in Meru Central
District of Kenya: Impact of group participation. Dissertation Abstracts
International, 65(08), 2866. (UMI No. 3145901)
Davis, K. (2006). Farmer field schools: A boon or a bust for extension in Africa?
Journal of International Agricultural and Extension Education, 13(1), 91-97.
Dirkx, J. & Jha, L. R. (1994). Completion and attrition in adult basic education: A test of
two pragmatic prediction models. Adult Education Quarterly, 45(1), 269-285.
Dolly, D. (2005). Assessing the benefits of two Farmer Field Schools recently conducted
in Trinidad and Tobago. Proceedings of the Association for Agricultural and
Extension Education, 21, 539-550.
Feder, G., Murgai, R., & Quizon, J. B. (2004a). The acquisition and diffusion of
knowledge: The case of pest management training in Farmer Field Schools,
Indonesia. Journal of Agricultural Economics, 55(2), 221-243.
Feder, G., Murgai, R., & Quizon, J. B. (2004b). Sending farmers back to school: The
impact of Farmer Field Schools in Indonesia. Review of Agricultural Economics,
26(1), 46-62.
Feder, G., & Slade, R. (1986). A comparative analysis of some aspects of the training
and visit system of agricultural extension in India. Journal of Development
Studies, 22(2), 407-428.

171
Feder, G., & Slade, R. (1993). Institutional reform in India: The case of agricultural
extension. In K. Hoff, A. Braverman, & J.E. Stiglitz (Eds.), The economics of
rural organization: Theory, practice, and policy. (pp. 530-542). New York:
Oxford University Press.
Feder, G., Willett, A., & Zijp, W. (2000). Generic challenges and some ingredients for
solutions. Retrieved January 23, 2008, from
http://www.worldbank.org/html/dec/Publications/Workpapers/wps2000series/wp
s2129/wps2129.pdf
Foster, A., & Rosenzweig, M. (1995). Learning by doing and learning from others:
Human capital and technical change in agriculture. Journal of Political Economy,
103(6), 1176-1209.
Freire, P. (1970). Pedagogy of the oppressed. New York: Continuum Publishing
Company.
Gall, M. D., Gall, J. P., & Borg, W. R. (2007). Educational research: An introduction.
(8th ed.). Boston, MA: Pearson.
Gallagher, K. (1999). Farmer field schools (FFS): A group extension process based on
adult non-formal education methods. Retrieved November 15, 2007, from
http://www.farmerfieldschool.net/document_en/FFS_GUIDe.doc
Gallagher, K. (2003). Fundamental elements of a Farmer Field School. Retrieved
November 15, 2007, from
http://www.farmerfieldschool.net/document_en/05_06.pdf

172
Garrison, D. R. (1985). Predicting dropout in adult basic education using interaction
effects among school and nonschool variables. Adult Education Quarterly, 36(1),
25-38.
Garrison, D. R. (1988). A deductively derived and empirically confirmed structure of
factors associated with dropout in adult education. Adult Education Quarterly,
38(4), 199-210.
Godtland, E., Sadoulet, E., de Janvry, A., Murgai, R., & Ortiz, O. (2003). The impact of
Farmer-Field-Schools on knowledge and productivity: A study of potato farmers
in the Peruvian Andes. Department of Agricultural and Resource Economics,
CUDARE Working Paper 963, University of California, Berkeley, CA.
Accessed on October 7, 2007 at
http://repositories.cdlib.org/cgi/viewcontent.cgi?article=1061&context=are_ucb
Houle, C. O. (1961). The inquiring mind. Madison, WI: University of Wisconsin Press.
Indonesian National IPM Program Secretariat. (1991). Farmers as experts: The
Indonesian National IPM Program. Jakarta: Indonesian National IPM Program.
Johnstone, J. W. C. & Rivera, R. J. (1965). Volunteers for learning: A study of the
educational pursuits of American adults. Chicago, IL: Aldine Publishing Co.
Kolb, D. A. (1984). Experiential learning: Experience as the source of learning and
development. Englewood Cliffs, NJ: Prentice-Hall.
Kowalik, T. F. (1989). The validity of the Deterrents to Participation Scale-General:
Factor replicability, predictive power, and the effect of social desirability.
Dissertation Abstracts International, 51(05), 1478. (UMI No. 9024139)

173
Knowles, M. S., Holton, E. F., & Swanson, R. A. (2005). The adult learner. Burlington,
MA: Elsevier.
Knox, A. B. (1987). Reducing barriers to participation in continuing education. Lifelong
Learning, 10(5), 7-9.
Matteson, P. C. (2000). Insect pest management in tropical Asian irrigated rice. Annual
Review of Entomology, 45, 549-574.
McCann, E., Sullivan, S., Erickson, D., & De Young, R. (1997). Environmental
awareness, economic orientation, and farming practices: A comparison of
organic and conventional farmers. Environmental Management, 21(5), pp.747-
758.
McGivney, V. (1993). Participation and non-participation: A review of the literature. In
R. Edwards, S. Sieminski, & D. Zeldin (Eds.), Adult learners, education, and
training (pp. 11-30). London: The Open University.
Momsen, J. (2006). Sustainable food for sustainable tourism in the Caribbean: Integrated
pest management and changes in the participation of women. In J. Hill, A. Terry,
& W. Woodland (Eds.), Sustainable development: National aspirations, local
implementation (pp.159-174). Hampshire, England: Ashgate Publishing.
Morstain, B. R. & Smart, J. C. (1974). Reasons for participation in adult education
courses: A multivariate analysis of group differences. Adult Education
Quarterly, 24(2), 83-98.
Nagel, U. J. (1997). Alternative approaches to organizing extension. In B. Swanson, R.
P. Bentz, & A. J. Sofranko (Eds.), Improving agricultural extension: A reference

174
manual (pp.13-20). Rome: Food and Agriculture Organization of the United
Nations.
Norland, E. (1992). Why adults participate. Retrieved January 27, 2008, from
http://www.joe.org/joe/1992fall/a2.html
Nunnally, J. O. (1978). Psychometric theory. New Cork: McGraw-Hill.
Ortiz, O., & Valdez, A. (1993). Enfoque de sistemas y metodologia participativa para
desarollar medios escritos de comunicacion agricola: El caso de la papa en la
agricultura de subsistencia. Revista Latinoamericana de la papa, Vol. 5/6, 103-
121.
Ortiz, O., Garrett, K. A., Heath, J. J., Orrego, R., & Nelson, R. J. (2004). Management of
potato late blight in the Peruvian highlands: Evaluating the benefits of farmer
field schools and farmer participatory research. Plant Disease, 88, 565-571.
Perin, D. & Greenberg, D. (1994). Understanding dropout in an urban worker education
program. Urban Education, 29(2), 169-187.
Pallant, J. (2005). SPSS survival manual. London: Open University Press.
Parker, A. N. (1995). Decentralization: The way forward for rural development?
Retrieved January 27, 2008, from
http://www1.worldbank.org/wbiep/decentralization/library1/1475.pdf
Phillips-Flanagan, B. A. (1986). Indicators of pesticide illiteracy among Trinidad’s
small-scale farmers. Dissertation Abstracts International, 47(03), 762. (UMI No.
8612600)

175
Picciotto, R. & Anderson, J. R. (1997). Reconsidering agricultural extension. The World
Bank Research Observer, 12(2), pp. 249-59.
Pinto Pereira, L. M., Boysielal, K., & Siung-Chang, A. (2007). Pesticide regulation,
utilization, and retailers’ selling practices in Trinidad and Tobago, West Indies:
Current situation and needed changes. Pan-American Journal of Public Health,
22(2), 83-90.
Pontius, J., Dilts R., & Bartlett, A. (Eds.). (2002). Ten years of IPM training in Asia-
from farmer field school to community IPM. Bangkok: FAO.
Pryor, B. W. (1990). Predicting and explaining intentions to participate in continuing
education: An application of the theory of reasoned action. Adult Education
Quarterly, 40(3), 146-157.
Purcell, D. L. & Anderson, J. R. (1997). Agricultural extension and research:
Achievements and problems in national systems. Washington, DC: The World
Bank.
Quizon, J., Feder, G., & Murgai, R. (2000). A note of the sustainability of the Farmer
Field School approach to agricultural extension. Retrieved on June 18, 2007,
from
http://wbln0018.worldbank.org/ESSD/susint.nsf/a816cbacda716c9d85256ab4000
2d5cd/aa37a54b9730556f852569d8007676b6/$FILE/FFS_Sustainability.pdf
Ramroop, D. V., St. Hill, A., Ganpat, W., Narinesighn, S., Pierre, S., Boodlal, K, &
Dowlath, P. (2000). Integrated pest management/integrated crop management for
vegetables and other crops in Trinidad and Tobago: Status, potential, and

176
problems. In M. Kairo (Ed.), Regional training workshop on farmer
participatory methods for ecological crop management. (pp. 64-88). Port of
Spain, Trinidad and Tobago: CABI.
Rhoades, R. E. & Booth, R. H. (1982). Farmer back to farmer: A model for generating
acceptable agricultural technology. Lima, Peru: International Potato Center.
Rivera, W. M. (1996). Agricultural extension in transition worldwide: Structural,
financial and managerial strategies for improving agricultural extension. Public
Administration and Development, 16(2), pp. 151-161.
Rogers, C. R. (1969). Freedom to learn: A view of what education might become.
Columbus, OH: Merrill Publishing Co.
Rogers, E. (2003). Diffusion of Innovations. New York: Free Press.
Rola, A. C., Jamias, S. B., & Quizon, J. B. (2002). Do Farmer Field School graduates
retain and share what they learn? An investigation in Iliolo, Philippines. Journal
of International Agricultural and Extension Education, 9(1), 67-78.
Roling, N., & van de Fliert, E. (1994). Transforming extension for sustainable
agriculture: The case of integrated pest management in rice in Indonesia.
Agriculture and Human Values, 11(2), 96-108.
Schumacher, E. F. (1973). Small is beautiful: Economics as if people mattered. New
York: Harper and Row.
Seepsersad, J. (2003). Case study on ICTS in agricultural extension in Trinidad and
Tobago. Retrieved September 5, 2007, from

177
http://www.cta.int/observatory2003/case_studies/Case_study_Trinidad_Tobago.p
df
Seevers, B., Graham, D., Gamon, J., & Conklin, N. (1997). Education through
cooperative extension. Albany, NY: Delmar Publishers.
Silva, T., Cahalan, M., Lacireno-Paquet, N. (1998). Adult education participation
decisions and barriers. Washington, DC: National Center for Educational
Statistics.
St. Clair, R. (2006). Build it but they may not come: Subjective Factors in Participation
Decisions Among Under-Represented Groups. Retrieved September 17, 2007,
from
http://www.adulterc.org/applications/classifiedlistingsmanager/inc_classifiedlisti
ngsmanager.asp?ItemID=1015&CategoryID=128
Thiele, G., Nelson, R., Ortiz, O., & Sherwood, S. (2001). Participatory research and
training: Ten lessons from the Farmer Field School (FFS) in the Andes.
Currents- Swedish Academy of Agricultural Sciences, 28(1), 4-11.
Tight, M. (2002). Key concepts in adult education and training. London:
RoutledgeFalmer
Tripp, R., Wijeratne, M., & Piyadasa, V. H. (2005). What should we expect from Farmer
Field Schools? A Sri Lanka case study. World Development, 33(10), pp.1705-
1720.
Tuckman, B.W. (1999). Conducting educational research. Belmont, CA: Wadsworth
Group.
178
Umali, D. L. & Schwartz, L. (1994). Public and private agricultural extension: Beyond
traditional frontiers. World Bank Discussion Paper 236. Washington, DC.
United Nations Educational, Scientific, and Cultural Organization. (2000). Education for
all, year 2000 assessment. Retrieved January 8, 2008, from
http://www.unesco.org/education/wef/en-docs/findings/efastatdoc.pdf
Valentine, T., & Darkenwald, G. G. (1990). Deterrents to participation in adult
education: Profiles of potential learners. Adult Education Quarterly, 41(1), 29-
42.
van de Ban, A. W., & Hawkins, H. S. (1996). Agricultural extension (2nd ed.). Oxford:
Blackwell.
van den Berg, H. (2004, January). IPM Farmer Field Schools: A synthesis of 25 impact
evaluations. Retrieved January 10, 2007, from
ftp://ftp.fao.org/docrep/fao/006/ad487e/ad487e00.pdf
van de Fliert, E. (1993). Integrated pest management: Farmer Field Schools generate
sustainable practices. A case study in central Java Evaluating IPM Training.
Unpublished doctoral dissertation, Wageningen Agricultural University,
Wageningen, Netherlands.
van de Fliert, E., Thiele, G., Compilan, D., Ortiz, O., Orrego, R., Olanya, M., &
Sherwood, S. (2002). Development and linkages of farmer field schools and
other platforms for participatory research and learning. Paper presented at the
International Learning Workshop on Farmer Field School (FFS): Emerging
Issues and Challenges, 21-25 October 2002, Yogyakarta, Indonesia. Retrieved

179
January 20, 2008, from http://www.eseap.cipotato.org/upward/Events/FFS-
Workshop-Yogya2002/25-Fliert.pdf
Wiebers, U. C. (1993). Integrated pest management and pesticide regulation in
developing Asia. World Bank Technical Paper Number 211. Washington, DC:
World Bank.
Wilcox, J., Saltford, R. A., & Veres, H. C. (1975). Continuing education: Bridging the
information gap. Ithaca, NY: Institute for Research and Development in
Occupational Education.
World Bank. (2000). Rural development: From vision to action? Retrieved January 17,
2008, from
http://lnweb18.worldbank.org/oed/oeddoclib.nsf/DocUNIDViewForJavaSearch/8
6AD383239ACF36F85256D660075398E/$file/Rural_Development_20628.pdf
World Bank. (2007). World development report, 2008: Agriculture for development.
Washington, D.C.: World Bank.
Yen, I. C., Bekele, I., & Kalloo, C. (1999). Use patterns and residual levels of
organophosphate pesticides on vegetables in Trinidad, West Indies. Journal of the
Association of Official Analytic Chemists, 82(4), 991-9915.

180
APPENDIX 1
CONSENT FORM
The factors in completion, non-completion, and non-participation in Farmer Field School in Trinidad and Tobago
You have been asked to participate in a research study on the factors in completion, non-completion, and non-participation in Farmer Field Schools (FFS). You were selected because you are either a member of an FFS group or are familiar with the FFS program. A total of 75-100 people have been asked to participate. The purpose of this study is to gain a greater understanding of the reasons why people decide to participate in FFS, the factors leading to completion and non-completion, and to determine individuals’ perceptions regarding pesticide-free farming. Samuel Goff, the primary investigator, will use the information collected toward the completion of a Doctor of Philosophy dissertation at Texas A&M University.
If you are not an FFS participant, you will be asked to complete a questionnaire one time. If you are an FFS participant, you will be asked to complete a questionnaire at the beginning of the program (April 2007) and another questionnaire at the end of the program (June 2007). The questionnaires take about 30 minutes to complete. The risks involved in participating are no more than would normally be expected on a daily basis. The benefit of participation is that an increased awareness of the patterns of completion, dropout, and non-participation may be useful for MALMR for employing strategies that impair or eliminate the factors leading to non-completion and non-participation in FFS.
You will receive no monetary compensation. To minimize any risk to you for your participation in this study, your responses will be coded and a pseudonym will be given to you. This study is confidential. The records of this study will be kept private. No identifiers linking you to the study will be included in any sort of report that might be published. Written records will be stored securely and only Samuel Goff will have access to the records.
Your decision whether or not to participate will not affect your current or future relations with the Ministry of Agriculture, Land, and Marine Resources (MALMR), the University of the West Indies, or Texas A&M University. If you decide to participate, you are free to refuse to answer any of the questions. You may withdraw at any time without your relations with the any of the above named institutions being affected. You may contact Samuel Goff ([email protected]).
This research study has been reviewed by the Institutional Review Board-Human Subjects in Research, Texas A&M University. For research-related problems or questions regarding subjects’ rights, I can contact the institutional Review Board through Ms. Melissa McIlhaney, IRB Program Coordinator, Office of Research Compliance at 979-845-8585 ([email protected]). Please be sure you have read the above information, asked questions and received answers to your satisfaction. You will be given a copy of the consent form for your records. By signing this document, you consent to participate in the study. Signature: __________________________________________ Date: _______________ Investigator’s signature ________________________________ Date: _______________

181
APPENDIX 2
Participants at the Beginning of the Educational Cycle
You have joined this Farmer Field School. I need to know what caused you to join: the social reasons, concerns about the environment, expectations for personal improvement. I also need to understand whether you like to go to school and whether school helps you to relax. Say whether you strongly disagree, disagree, agree or strongly agree with the following statements.
Strongly Disagree Agree Strongly Disagree Agree 1 2 3 4
Social reasons for participating in FFS Meeting people with similar interests at FFS encouraged me to participate 1 2 3 4 I joined FFS to belong to a group 1 2 3 4 A friend or family member encouraged me to participate in FFS 1 2 3 4 The agricultural officer encouraged me to participate in FFS 1 2 3 4 I joined FFS to be accepted by my family or friends 1 2 3 4 I joined FFS because the agricultural officer suggested it to me 1 2 3 4 The farmers presently in the group influenced my decision to join FFS 1 2 3 4 Concern for other people, community, humanity, environment After FFS, members in my farming community can improve their incomes 1 2 3 4 I expect FFS to help me reduce my use of pesticides 1 2 3 4 I expect FFS to help me to make the people, animals, plants and land safer 1 2 3 4 My farm must not destroy the people, animals, plants and land 1 2 3 4 After FFS, I want to be able to teach others about pest control practices 1 2 3 4 Through the FFS I want to be able to produce healthier foods 1 2 3 4 Expectations for improving my own occupational performance and status I saw FFS as a chance to learn how to improve my income 1 2 3 4 After the FFS, my customers will like the healthier crops I produce 1 2 3 4 I joined FFS to be better off than I am now 1 2 3 4 I see FFS as a chance to improve my farming practices 1 2 3 4 I am aware of the benefits of FFS 1 2 3 4 FFS as Stimulation and Escape I joined FFS to have a few hours away from other responsibilities 1 2 3 4 FFS gives me a relaxation break (from the routine of home or work) 1 2 3 4 FFS is a different experience to the other activities now in my life 1 2 3 4 Cognitive interest FFS will teach me new skills to help me cope with life 1 2 3 4 I like learning just to know more 1 2 3 4 I joined FFS to improve the decisions I make on the farm 1 2 3 4 I enjoy learning new things 1 2 3 4 I need to learn new farming skills 1 2 3 4 I joined the FFS to find out more about the benefits of the field school 1 2 3 4

182
II. Say whether you strongly disagree, disagree, agree or strongly agree with the following statements about agricultural practices.
Strongly Disagree Agree Strongly Disagree Agree 1 2 3 4
Perceptions on the use of pesticides in farming I believe that farmers’ decisions affect people, animals, plants and land 1 2 3 4 Pesticides are a serious problem for people, animals, plants and land 1 2 3 4 Pesticides are a serious threat to human health 1 2 3 4 Pollution from agricultural chemicals is a serious problem on my farm 1 2 3 4 Loss of crops due to insects and disease is a serious problem 1 2 3 4 My use of pesticides affect people, animals, plants and land 1 2 3 4 Financial factors Making money from farming is my most important concern 1 2 3 4 I am willing to make less money this year and more money in the future to try new farming methods that protect people, animals, plants and land 1 2 3 4 I worry about how to keep my farm productive over the long term 1 2 3 4 Compatibility of integrated pest management with social setting Farmers will accept farming with less poisonous pesticides 1 2 3 4 Consumers want pesticide-free produce 1 2 3 4 Consumers will pay higher prices for pesticide-free produce 1 2 3 4 III. General information How many of your family _______ friends _______ have participated in an FFS? Did your family and friends support your decision to participate in FFS-IPM? Yes No If FFS-IPM did not exist, would you have sought educational programming on pest and crop management from a source other than MALMR? Yes No If yes, where? ________ What is your gender? Female Male What is your age? ________________________________________________________ What is your current marital status? Single Married Separated/Divorced Widowed What was the last class level you completed? Std 1-3 Std 4-5 Std 6 Form 1-3 Form 4-5 Form 6 other _____ What is the size of your farm? _______________________________________________ How long have you lived in your community? __________________________________ How many years have you farmed? ___________________________________________ What percentage of your annual income was derived from agriculture? ______________ Have you participated in any agricultural extension programs before FFS? Yes No If yes, in which program did you participate? ___________________________________ Where do you most often get information on farming? (Rank order)1.________________ 2. ___________________________________ 3. ________________________________ Is there anything else about your FFS experience you would like to share? You may use the back of this page. Thank you for your contributions to this study.

183
APPENDIX 3
Completers and non-completers I. You have participated in this Farmer Field School. I need to know the factors that contributed to your completion or non-completion of the program. Say whether you strongly disagree, disagree, agree or strongly agree with the following statements.
Strongly Disagree Agree Strongly Disagree Agree
1 2 3 4 Life Situation Factors I saw FFS as a chance to learn how to improve my income 1 2 3 4 Responsibilities at work/farming kept me from participating in the FFS 1 2 3 4 A friend or family member encouraged me to participate in FFS 1 2 3 4 A health problem kept me from participating in FFS 1 2 3 4 I joined FFS because the agricultural officer suggested it to me 1 2 3 4 I saw FFS as a chance to improve my farming practices 1 2 3 4 Responsibilities at home kept me from participating in FFS 1 2 3 4 The agricultural officer encouraged me to participate in FFS 1 2 3 4 Institutional Factors Convenience FFS was scheduled at a convenient time 1 2 3 4 I am satisfied with the length of the FFS meetings 1 2 3 4 I am happy with the frequency of the FFS meetings 1 2 3 4 FFS was offered at a convenient location 1 2 3 4 FFS was offered in a safe place 1 2 3 4 FFS was offered in an acceptable location Process and application Topics covered in FFS were important to my farming situation 1 2 3 4 The practices promoted in FFS are relevant to my farming situation 1 2 3 4 I have suggested to farmers in my community that they participate in FFS 1 2 3 4 My real problems are not addressed so I do not want to participate in FFS 1 2 3 4 Climate FFS program activities were well planned 1 2 3 4 I could freely voice my opinions during FFS meetings 1 2 3 4 The FFS facilitator asked the students what they wanted to learn 1 2 3 4 My FFS group usually accomplished our daily agenda 1 2 3 4 Outcomes I am happy with the quality of the FFS program 1 2 3 4 After FFS, I want to participate in other MALMR programs 1 2 3 4 FFS helped me improve the decisions I make on the farm 1 2 3 4 FFS gave me new skills to help me cope with life 1 2 3 4 FFS participants are using IPM on their farms 1 2 3 4

184
I am aware of the benefits of FFS 1 2 3 4 Personal preferences I like learning by myself more than with a group of people 1 2 3 4 I enjoy learning new things 1 2 3 4 I need to learn new farming skills 1 2 3 4 I like learning with a group of people rather than by myself 1 2 3 4 I am able to apply what I learned in FFS on my farm 1 2 3 4 I find that the teaching methods used in FFS are too childish 1 2 3 4 I know enough about farming and do not need the FFS 1 2 3 4 The ministry does not have anything to offer me 1 2 3 4 I only came to the FFS to support the officer 1 2 3 4 Rank (1-3) the reasons why some participants did not complete FFS. (1= The most important reason; 2= The median reason; 3= The least important reason) _____ Challenges of life, such as work pressures, hindered them _____ The educational programs offered did not apply to real life _____ Adults generally do not want to continue their education II. Say whether you strongly disagree, disagree, agree or strongly agree with the following statements about agricultural practices.
Strongly Disagree Agree Strongly Disagree Agree
1 2 3 4 Perceptions on the use of pesticides in farming I believe that farmers’ decisions affect the people, animals, plants and land 1 2 3 4 Pesticides are a serious problem for people, animals, plants and land 1 2 3 4 Agricultural pesticides are a serious threat to human health 1 2 3 4 Pollution from agricultural chemicals is a serious problem on my farm 1 2 3 4 Loss of crops due to insects and disease is a serious problem 1 2 3 4 My use of pesticides affect people, animals, plants and land 1 2 3 4 Financial factors Making money from agriculture is my most important concern 1 2 3 4 I am willing to make less money this year and more money in the future to try new farming methods that protect people, animals, plants and land 1 2 3 4 I worry about how to keep my farm productive over the long term 1 2 3 4 Compatibility of integrated pest management with social setting Farmers will accept farming with less poisonous pesticides 1 2 3 4 Consumers want pesticide-free produce 1 2 3 4 Consumers will pay higher prices for pesticide-free produce 1 2 3 4 IPM practices are better than the way I farmed before FFS 1 2 3 4 Consumers are more likely to buy FFS participants’ produce if

185
participants could display MALMR-issued certificates certifying the produce as “IPM practices produce” 1 2 3 4 MALMR-issued certificates guaranteeing FFS participants’ produce as “IPM practices produce” will increase sales 1 2 3 4 Integrated pest management fits in well with our way of agriculture 1 2 3 4 Competitions as a way to increase popularity of FFS I like participating in competitions 1 2 3 4 An FFS-sponsored competition between several FFSs will increase learning 1 2 3 4 An FFS-sponsored competition within FFSs will increase learning 1 2 3 4 An FFS-sponsored vegetable-growing competition for FFS participants will increase the popularity of FFS in my community 1 2 3 4 III. General information How many of your family _______ friends _______ have participated in an FFS? Did your family and friends support your decision to participate in FFS-IPM? Yes No If FFS-IPM did not exist, would you have sought educational programming on pest and crop management from a source other than MALMR? Yes No Where? ________________________________________________________________ What is your gender? Female Male What is your age? ________________________________________________________ What is your current marital status? Single Married Separated/Divorced Widowed What was the last class level you completed? Std 1-3 Std 4-5 Std 6 Form 1-3 Form 4-5 Form 6 other _____ What is the size of your farm? _____________________________________________ How long have you lived in your community? ________________________________ How many years have you farmed?_________________________________________ What percentage of your annual income was derived from agriculture? ____________ Have you participated in any agricultural extension programs before FFS? Yes No If yes, in which program did you participate? ___________________________________ Where do you most often get information on farming? (1= Get information from this source most often, etc.) 1. ___________________________________ 2. ___________________________________ 3. ___________________________________ Is there anything else about your FFS experience you would like to share? You may use the back of this page. Thank you for your contributions to this study.

186
APPENDIX 4
Non-participants
Are you aware of the training programs offered by MALMR? Yes No Are you familiar with the FFS-IPM program carried out by MALMR? Yes No Have you ever participated in FFS-IPM? Yes No How many of your ____ family ____ friends have participated in an FFS? I. You have not participated in the Farmer Field School. I need to know how important were the following statements in your decision to not participate in FFS. Say whether you strongly disagree, disagree, agree or strongly agree with the following statements.
Strongly Disagree Agree Strongly Disagree Agree 1 2 3 4
Life Situation Factors I saw FFS as a chance to learn how to improve my income 1 2 3 4 Responsibilities at work/farming kept me from participating in the FFS 1 2 3 4 A friend or family member encouraged me to participate in FFS 1 2 3 4 A health problem kept me from participating in FFS 1 2 3 4 Responsibilities at home kept me from participating in FFS 1 2 3 4 The agricultural officer encouraged me to participate in FFS 1 2 3 4 The farmers presently in the group influenced my decision not to join FFS 1 2 3 4 Institutional Factors Convenience FFS was scheduled at a inconvenient time 1 2 3 4 I am not satisfied with the length of the FFS meetings 1 2 3 4 I am not happy with the frequency of the FFS meetings 1 2 3 4 FFS was offered at a inconvenient location 1 2 3 4 FFS was offered in an unsafe place 1 2 3 4 FFS was offered in an unacceptable location 1 2 3 4 Process and application Topics covered in FFS were not important to my farming situation 1 2 3 4 The practices promoted in FFS are not relevant to my farming situation 1 2 3 4 I have suggested to farmers that they do not participate in FFS 1 2 3 4 My real problems are not addressed so I do not want to participate in FFS 1 2 3 4 Outcomes I want to participate in FFS sometime in the future 1 2 3 4 I expect that the FFS program will be of high quality 1 2 3 4 I want to participate in other MALMR programs 1 2 3 4 I expect that FFS participants are using IPM on their farms 1 2 3 4 I am interested in joining FFS 1 2 3 4 I am aware of the benefits of FFS 1 2 3 4

187
Personal Preferences I like learning by myself more than with a group of people 1 2 3 4 I enjoy learning new things 1 2 3 4 I need to learn new farming skills 1 2 3 4 I like learning with a group of people rather than by myself 1 2 3 4 I find that the teaching methods used in FFS are too childish 1 2 3 4 I know enough about farming and do not need the FFS 1 2 3 4 The ministry does not have anything to offer me 1 2 3 4 I may only come to the FFS to support the officer 1 2 3 4 Rank (1-3) the reasons why other adults do not participate in educational programs. (1= The most important reason; 2= The median reason; 3= The least important reason) _____ Challenges of life, such as work pressures, hinder them _____ The educational programs offered do not apply to real life _____ Adults generally do not want to continue their education II. Say whether you strongly disagree, disagree, agree or strongly agree with the following statements about agricultural practices.
Strongly Disagree Agree Strongly Disagree Agree
1 2 3 4 Perceptions on the use of pesticides in farming I believe that farmers’ decisions affect people, animals, plants and land 1 2 3 4 Pesticides are a serious problem for people, animals, plants and land 1 2 3 4 Pesticides are a serious threat to human health 1 2 3 4 Pollution from agricultural chemicals is a serious problem on my farm 1 2 3 4 Loss of crops due to insects and disease is a serious problem 1 2 3 4 My use of pesticides affect people, animals, plants and land 1 2 3 4 Financial factors Making money from agriculture is my most important concern 1 2 3 4 I am willing to make less money this year and more money in the future to try new farming methods that protect people, animals, plants and land 1 2 3 4 I worry about how to keep my farm productive over the long term 1 2 3 4 Compatibility of integrated pest management with social setting Farmers will accept farming with less poisonous pesticides 1 2 3 4 Consumers want pesticide-free produce 1 2 3 4 Consumers will pay higher prices for pesticide-free produce 1 2 3 4 IPM practices are not better than the way I farmed before FFS 1 2 3 4 Consumers are more likely to buy FFS participants’ produce if

188
participants could display MALMR-issued certificates certifying the produce as “IPM practices produce” 1 2 3 4 MALMR-issued certificates guaranteeing FFS participants’ produce as “IPM practices produce” will increase sales 1 2 3 4 IPM does not fit in well with our way of agriculture 1 2 3 4 Competitions as a way to increase the popularity of FFS I like competitions 1 2 3 4 A vegetable-growing competition will encourage me to join FFS 1 2 3 4 III. General information How many of your family _______ friends _______ have participated in an FFS? Did your family and friends support your decision to not participate in FFS-IPM? Yes No If FFS-IPM did not exist, would you have sought educational programming on pest and crop management from a source other than MALMR? Yes No Where? _________________________________________________________________ What is your gender? Female Male What is your age? ________________________________________________________ What is your current marital status? Single Married Separated/Divorced Widowed What was the last class level you completed? Std 1-3 Std 4-5 Std 6 Form 1-3 Form 4-5 Form 6 other _____ What is the size of your farm? _______________________________________________ How long have you lived in your community? __________________________________ How many years have you farmed? ___________________________________________ What percentage of your annual income was derived from agriculture? ______________ Have you participated in any agricultural extension programs before FFS? Yes No If yes, in which program did you participate? ___________________________________ Where do you most often get information on farming? 1. ___________________________________ 2. ___________________________________ 3. ___________________________________ Is there anything else about your FFS experience you would like to share? You may use the back of this page. Thank you for your contributions to this study.

189
VITA
SAMUEL NEAL GOFF PERMANENT ADDRESS
2511 Good Shepherd Brownwood, Texas 76801
BIOGRAPHICAL INFORMATION
Born on December 17, 1973 in Caracas, Venezuela to William and Emilee Goff
EDUCATION Doctor of Philosophy, Agricultural Education (2008)
Texas A&M University College Station, TX
Master of Science, Agricultural Education (2006)
Texas A&M University College Station, TX
Bachelor of Arts, Psychology and History (1996)
Baylor University Waco, TX
PROFESSIONAL EXPERIENCE
Departmental Graduate Assistant Department of Agricultural Leadership, Education, and Communications Texas A&M University (2004-2008)
Agricultural Cooperatives Project Coordinator
International Mission Board Zambezia Province, Mozambique (2001-2003)
HONORS AND AWARDS
Department of Agricultural Leadership, Education, and Communications, Texas A&M University, Outstanding PhD student (2006-2007)
Department of Agricultural Leadership, Education, and
Communications, Texas A&M University, Outstanding Master’s student (2005-2006)