the fabric year 2017 - groz-beckert.com · 4 personal copy for mr. martin weiler target and...
TRANSCRIPT

The Fabric Year 2017


Stuttgart
Frankfurt
Berlin
Hamburg
2015 Carding Product range expansion
2010 TEZ Technology and Development Center Albstadt
1998 Tufting Product range expansion
1980 Sewing & Felting Product range expansion
1960 India First production affiliate in Asia
1937 Merger Theodor Groz & Söhne and Ernst Beckert Foundation stone of today's Groz-Beckert KG
1888 Plant health fund Precursor of the current company health insurance fund
1852 Foundation Theodor Groz Albstadt
1871 Foundation Ernst Beckert Chemnitz
2013 GEBIZ Health and Education Center Albstadt
From Albstadt to the world 2000 Weaving Product range expansion
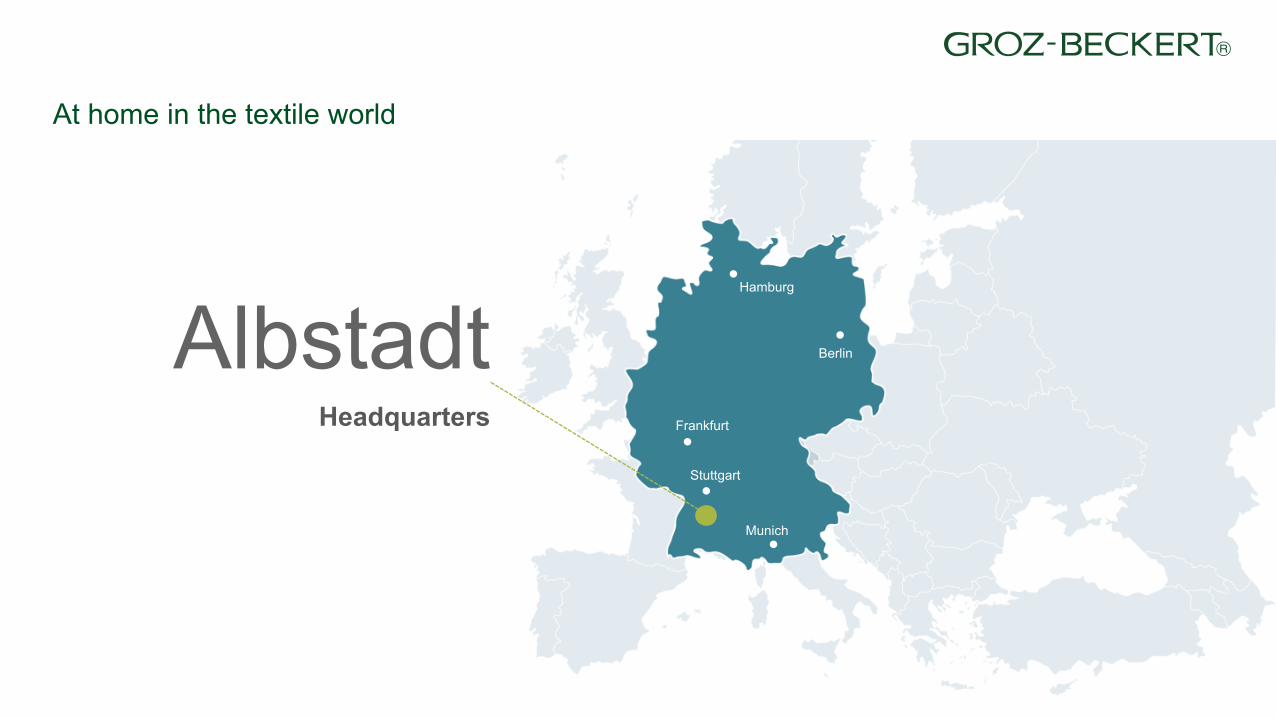
At home in the textile world
Munich
Stuttgart
Frankfurt
Berlin
Hamburg
Albstadt Headquarters
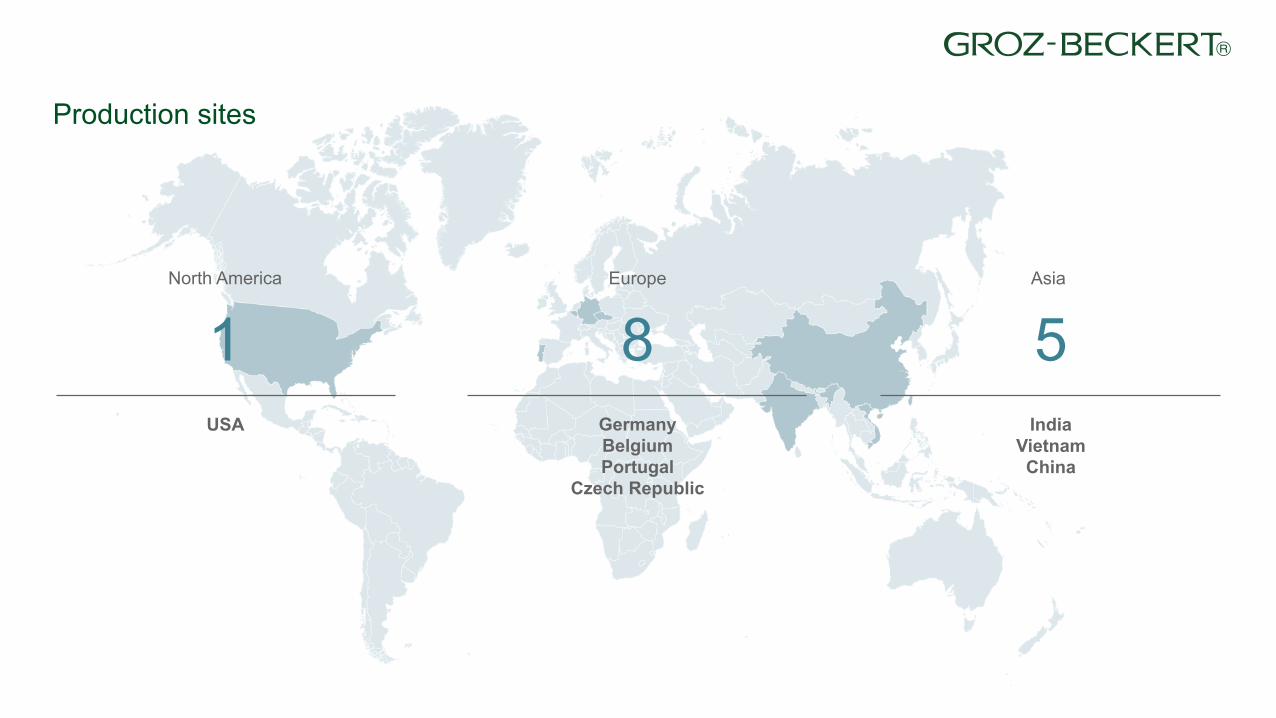
Production sites
8
Europe
1 North America
USA Germany Belgium Portugal
Czech Republic
5 Asia
India Vietnam China

Sales affiliates
9 17 Europe
Germany: Albstadt, Raesfeld | Belgium: Deerlijk | Great Britain:
Leicester | Spain: Barcelona | Italy: Milan | France: Paris | Czech
Republic: Budweis | Turkey: Istanbul
India: Ludhiana, Tirupur, Thene, Gurgaon, Ahmedabad, Coimbatore |
Vietnam: Ho Chi Minh City | China: Shanghai, Shenzhen, Peking,
Wuxi, Hongkong (S.A.R.), Taipeh | South Korea: Seoul | Japan: Osaka |
Indonesia: Bandung | Singapore: Singapore
2 North America
USA: Charlotte | Mexico: Naucalpan
Asia

Around 7,700 employees
4,530 (2,010 of which are in Albstadt)
120
Asia
3,040
Europe
North America
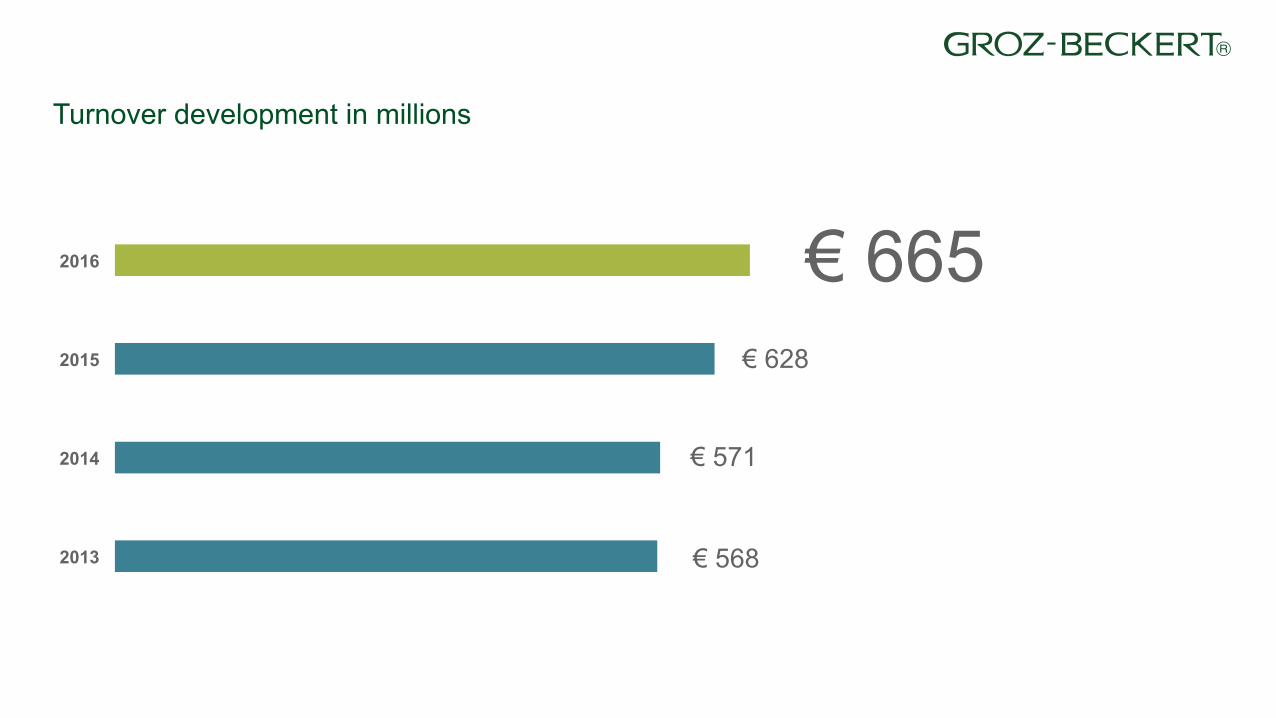
Turnover development in millions
2013
2014
2015
2016
€ 568
€ 665
€ 571
€ 628

Facets of precision
70,000 Around 70,000 different archived product types for textile production and joining methods
Textiles are found in fashion and medicine, in architecture, in vehicles, in aerospace technology, as well as household textiles and floor coverings and numerous other applications
Products for knitting and warp knitting, weaving, tufting, carding and sewing, as well as producing nonwovens
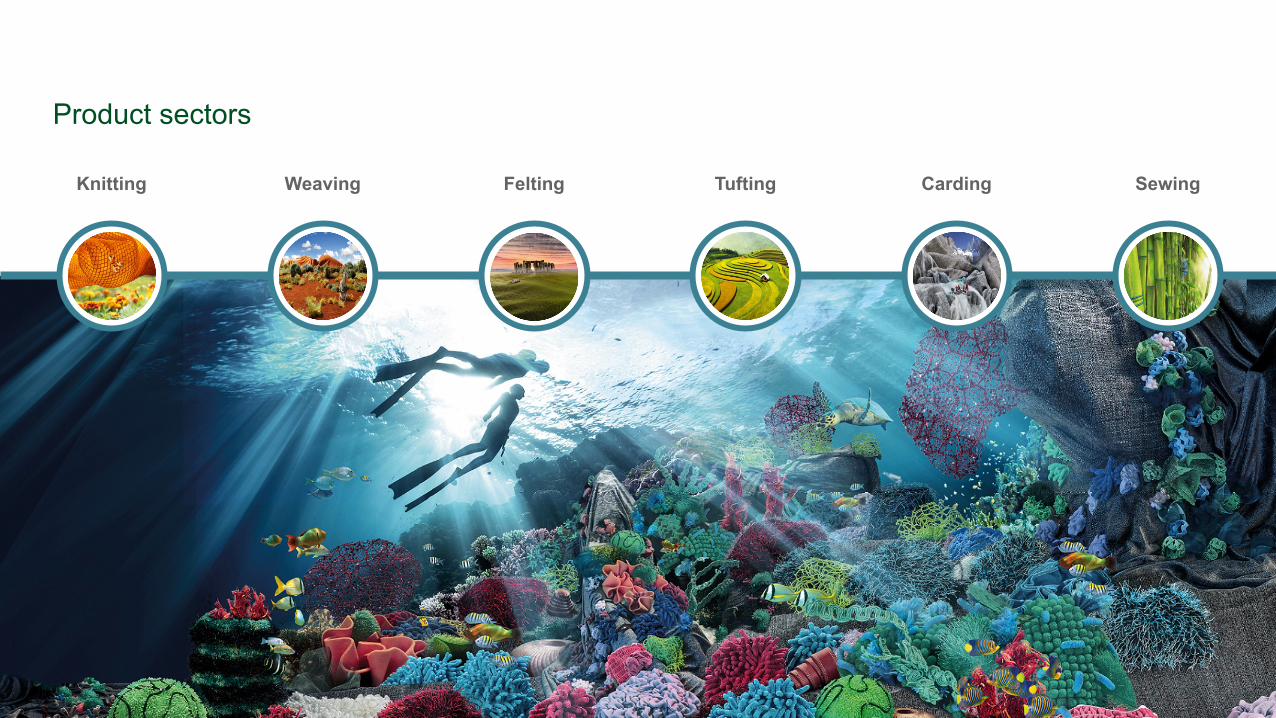
Knitting Weaving Felting Tufting Carding Sewing
Product sectors


Personal Copy for Mr. Martin WeilerThe Fabric Year2017

2
Personal Copy for Mr. Martin Weiler
© The Fiber Year GmbH 2017.
The copyright in the entire report is held by The Fiber Year GmbH. This report was exclusively produced for the event from Groz-Beckert KG in Albstadt on September 13, 2017. Recipients
are entitled to distribute the entire report or an optional excerpt within the group and its majority-owned affiliates.
All information investigated and compiled with reasonable care in this report is provided by The Fiber Year GmbH on an "as is" basis and The Fiber Year GmbH expressly disclaims any and
all warranties. In no event shall The Fiber Year GmbH be liable for any direct, indirect, incidental or consequential damages of any kind whatsoever with respect to this report.

3
Personal Copy for Mr. Martin Weiler
Table of Contents: page
Target and Methodology …………………………………………….……………………………………………………….. 4
Sources and Explanations ………..…..……………………………………………………………………………………….. 5
Executive Summary …………………………………………………………………………………………….…………….……… 6
Country Profiles …..…………………………………………..…..…………………………………………………………..…...… 13
Bangladesh ………………………………………………………………………………………………………………………………….…. 14
Brazil ........................................................................................................................................................ 16
China ………………………………………………………………………………………………………………………………………….…… 18
India ….…..........………………………………………………………………………………………………………………………………… 20
Indonesia ………………………………………………………………………………………………………………………………………… 22
tag page
Japan ………………………………………………………………………………………………………………………………………………… 24
Korea ………………………………………………………………………………………………………………………………………………… 26
Turkey …....………………………………………………………………………………………………………………………………………… 28
USA ………....………………………………………………………………………………………………………………………………………… 30
Vietnam …..………………………………………………………………………………………………………………………………………… 32

4
Personal Copy for Mr. Martin Weiler
Target and Methodology
The report „The Fabric Year“ pursues the goals to validate market data along the value chain, raise market transparency, improve reliability of planning, identify sales potential and deliver
insights at an early stage with a cross-process approach from raw materials to fibers and yarns and finally fabrics.
The national size of the market for processing into textile area bases on available fiber and yarn volumes (source: The Fiber Year 2017) including trade flows (source: International Trade
Centre, ITC) to arrive at a term „Fabric Making Potential“ (FMP). This volume is similar to all locally available fibers and yarns. The country-specific term „Fabric Making Potential“ is being
reduced later by unspun end-uses, mainly acetate tow, and sisal fibers which are traditionally used for ropes and twines by majority. This lowered volume enlarged by polymer-based
spunbonded nonwovens delivers a national figure for manufactured fabrics.
As a matter of common knowledge natural fibers production is not precisely projectable due to climatic and other natural imponderabilities. Hence, annual cotton production is quite
often in no accordance with consumption. It needs to be adjusted while basically manmade fiber stocks are controlled to match demand. As global cotton stocks have been traced by
international organizations like ICAC, consumption figures for cotton are included in a world-fiber-use figure. This data delivers a more accurate indication of the volumes for subsequent
processing in weaving, knitting and nonwovens.
Inventory changes of other natural fibers appear to be negligible on global stage despite a potential outlier for Bangladesh in the year 2011. The heavy fall of cotton prices starting March
2011 had affected the global fiber price level which had caused serious stockpiling of jute in Bangladesh. In the absence of corresponding inventory data the Bangladeshi FMP showed irre-
producible volumes for the year 2011 which have been taken into account for the subsequent processing. Furthermore, world data on manmade fiber stocks are not available although de-
sirable in the light of strong gains in the Chinese industry.
All ITC data have been double-checked at four- and six-digit customs tariff number as figures were partly missing or possessed a significant trend reversal and to some extent were just
displayed in units or square meters.
The fiber and yarn section includes the following types: a) natural fibers: cotton, wool, bast fibers (jute, flax, ramie, hemp, others) and other natural fibers (coir, sisal, kapok, silk, abaca and
agave), b) cellulosic fibers: viscose, modal and TENCEL® branded lyocell fibers, acetate tow, viscose yarn, acetate and cupro filament yarn, c) synthetic fibers: polyester, polyamide, po-
lypropylene, acrylic fibers as well as carbon, aramid and spandex fibers. The scope of fibers bases on the Fiber Year report. The large-scale segment of glass fibers, believed to account for
about five million tonnes at world stage, is not yet included in the report.

5
Personal Copy for Mr. Martin Weiler
Sources and Explanations
Sources:
· Asian Development Bank (ADB), www.adb.org
· Asia Nonwoven Fabrics Association (ANFA), www.asianonwovens.org
· Association of the Nonwoven Fabrics Industry (INDA), www.inda.org
· China Nonwovens and Industrial Textiles Association (CNITA), www.cnita.org.cn/en/
· EDANA, www.edana.org
· Eurostat, www.ec.europa.eu/eurostat/de
· Fiber Economics Bureau, www.fibersource.com/feb/
· Food and Agriculture Organization of the United Nations (FAO), www.fao.org/home/en
· Groz-Beckert KG, www.groz-beckert.com
· International Cotton Advisory Committee (ICAC), www.icac.org
· International Monetary Fund, World Economic Outlook Database April 2017, www.imf.org/external/pubs/ft/weo/2017/01/weodata/index.aspx
· International Trade Centre (ITC), www.intracen.org/itc/market-info-tools/trade-statistics
· International Wool Textile Organisation (IWTO), www.iwto.org
· The Fiber Year 2017, www.thefiberyear.com
· United States Census Bureau, U.S. Department of Commerce, www.census.gov/population/international
· World Bank Group, Doing Business 2017, www.doingbusiness.org
· World Trade Organization, www.wto.org
Explanations:
· All figures refer to the calendar year with the exception of data provided by ICAC that correspond to the marketing year starting August. Minor inaccuracy may result from this but
seems to be inevitable.
· Wool production provided by FAO in greasy weight was converted into clean weight by using an annual average world conversion factor. This factor was calculated by dividing world
output of greasy volume by official IWTO clean weight data. Bast and other natural fibers are derived from FAO and include estimates for the 2015/16 output.

6
Personal Copy for Mr. Martin Weiler
EXECUTIVE
SUMMARY

7
Personal Copy for Mr. Martin Weiler
Upstream Industry
The below chart illustrates the long-term supply for subsequent processing in weaving, knitting and nonwovens, up from 74 million tonnes in 2005 to 107 million tonnes in the previous
year. It corresponds with an average annual growth rate of 3.4% during the quota-free era although dynamics have slowed in the previous four years. Last year‘s expansion just accounted
for 1.7% which was the second worst value since 2005 and just outperformed in 2008 as direct response to the financial crisis. This volume, however, is theoretical as stock changes, waste
from secondary spinning, unspun end-uses, acetate tow and fibers that cannot be converted into yarns need to be deducted.
Apart from volumes it is also recommendable to have an overview on the fiber composition which may determine processing equipment. The long-term trend in favor of manmade fibers
is expected to continue, in particular viscose staple fibers and polyester fibers will benefit the most.
World Fiber, Yarn and Spunbond Supply
0
20
40
60
80
100
120
2005 2010 2012 2014 2016
Natural Cellulosic Synthetic Spunbond
million tonnes
Dynamics of Staple Fibers
-2%
0%
2%
4%
6%
8%
10%
Natural Cellulosic Synthetic
1970s 1980s 1990s 2000s 2010-16
AAGR in %

8
Personal Copy for Mr. Martin Weiler
Processing Technologies
The largest segment of about 57 million tonnes refers to knitting and has experienced average annual growth of almost 5% since 2005 while around 32 million tonnes woven fabrics have
advanced at less than 2% over this period. The world nonwovens industry succeeded to pursue the strongest growth strategy with fiber-based nonwovens expanding more than 7% yearly
to arrive at 7 million tonnes and spunlaid nonwovens even surging nearly 12% to reach 6 million tonnes in 2016. The remaining quantity of about three million tonnes each includes un-
spun end-uses and waste at the secondary spinning stage.
The current position in the market shows that knitted fabrics occupy about 57% of the world market. This industry has successfully defended its majority share over the entire period. The
relative share of woven fabrics has worsened from more than 40% to just less than a third at present. Meanwhile, global nonwovens output has more than doubled since 2005.
Dynamics of Processing Technologies 2005 - 2016
0%
2%
4%
6%
8%
10%
12%
Knitting Weaving Fiber-based Polymer-based
AAGR in %
Nonwovens
Processing Volumes by Technology 2016
Knitting
Weaving
Nonwovens*
Spunbond
57%32%
7%5%
* Drylaid

9
Personal Copy for Mr. Martin Weiler
Annual Growth Rates at Fabric Making Stage
It is quite surprising to notice that annual dynamics at the processing stage are more distinct than at the upstream business. Variation at the fiber market range from -7.3% during financial
crisis to +8.2% in 2010 whereas peaks at traditional technologies vary from -10% to almost +20%. Meanwhile, nonwovens have achieved robust growth rates over the entire period, a main
reason appears to be the strong usage in hygiene products which are quite insusceptible to risk and economic slump. The one-step process of spunlaid nonwovens has experienced the
highest dynamics in most of the time. This web forming process skips a production stage and delivers finished fabrics directly from polymers, predominantly polypropylene.
The volatility in the business has been tremendous and tough times for global economy increasingly raise uncertainty on trade and future market access as it appears that protectionism
may be on its way back. The current four-year annual slowing in demand is close to tie the historic low in modern textile industry. Five consecutive years with a decelerated growth in
consumption have solely taken place during the period 1986 to 1990.
Annual Growth Rates Knitting vs Weaving
-10%
-5%
0%
5%
10%
15%
20%
2005 2010 2012 2014 2016
Knitting Weaving
y-o-y in %
Annual Growth Rates Fiber- vs Polymer-Based Nonwovens
0%
2%
4%
6%
8%
10%
12%
14%
16%
2005 2010 2012 2014 2016
Fiber-based Polymer-based
y-o-y in %
10
Personal Copy for Mr. Martin Weiler
Market Share in Knitted Fabrics
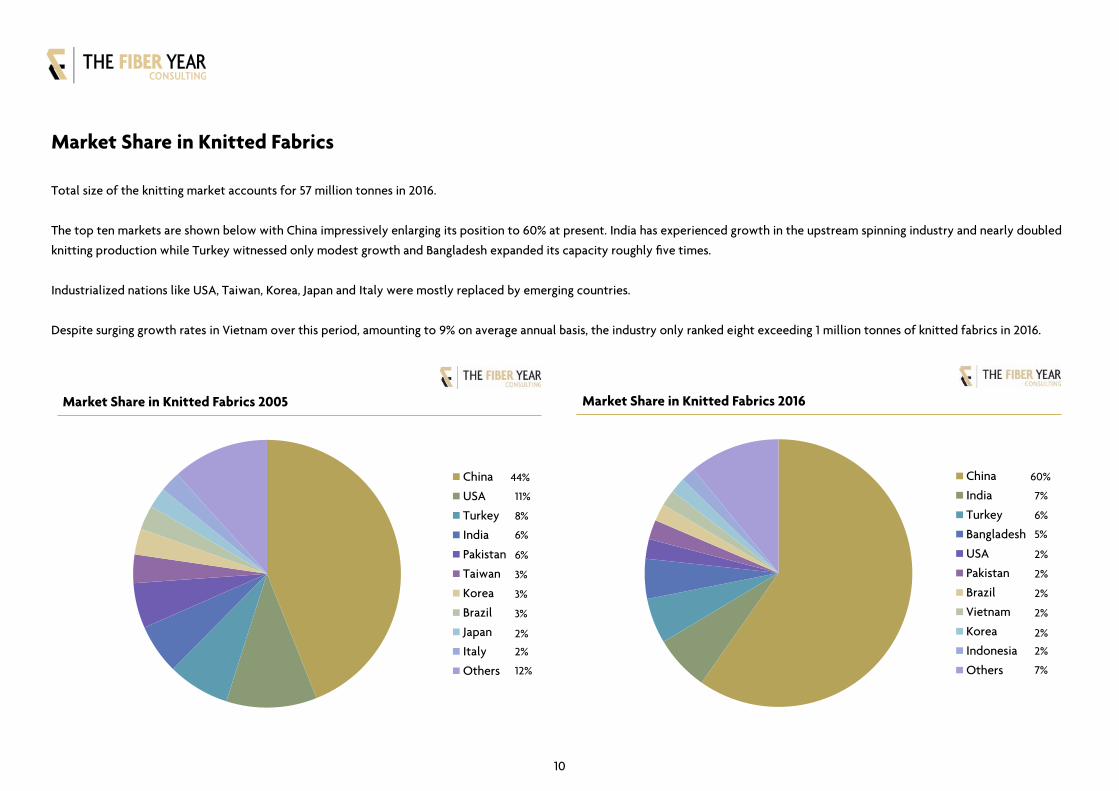
Total size of the knitting market accounts for 57 million tonnes in 2016.
The top ten markets are shown below with China impressively enlarging its position to 60% at present. India has experienced growth in the upstream spinning industry and nearly doubled
knitting production while Turkey witnessed only modest growth and Bangladesh expanded its capacity roughly five times.
Industrialized nations like USA, Taiwan, Korea, Japan and Italy were mostly replaced by emerging countries.
Despite surging growth rates in Vietnam over this period, amounting to 9% on average annual basis, the industry only ranked eight exceeding 1 million tonnes of knitted fabrics in 2016.
Market Share in Knitted Fabrics 2005
China
USA
Turkey
India
Pakistan
Taiwan
Korea
Brazil
Japan
Italy
Others
44%
11%
8%
6%
6%
3%
3%
3%
2%
2%
12%
Market Share in Knitted Fabrics 2016
China
India
Turkey
Bangladesh
USA
Pakistan
Brazil
Vietnam
Korea
Indonesia
Others
60%
7%
6%
5%
2%
2%
2%
2%
2%
2%
7%

11
Personal Copy for Mr. Martin Weiler
Market Share in Woven Fabrics
Total size of woven articles from the twenty analyzed countries rose to 32 million tonnes in 2016.
The top ten markets are shown below with China further expanding its market position to 55% at present while the second largest industry in India just maintained its share following mi-
nor investments of predominantly China-made machines. The decisive bottleneck, hampering higher share of apparel exports, is considered to be the midstream value chain. India has the
world's largest number of looms, thus, it is not a lack of capacity but rather structural deficiency. The vast majority of looms is installed in the unorganized sector which suffers from frag-
mentation, technology obsolescence, market knowledge, failing to produce high quality fabric and scarce access to funds. Hence, the government‘s attempt to attract foreign invest-
ments for domestic weaving machinery manufacturing may help tap the full potential.
Market Share in Woven Fabrics 2005
China
India
Pakistan
USA
Indonesia
Turkey
Brazil
Korea
Bangladesh
Russia
Others
52%
21%
4%
3%
3%
3%
2%
2%
2%
1%
7%
Market Share in Woven Fabrics 2016
China
India
Pakistan
Indonesia
Turkey
Vietnam
USA
Brazil
Bangladesh
Russia
Others
55%
20%
6%
2%
2%
2%
2%
1%
1%
1%
4%
12
Personal Copy for Mr. Martin Weiler
Market Share in Nonwovens
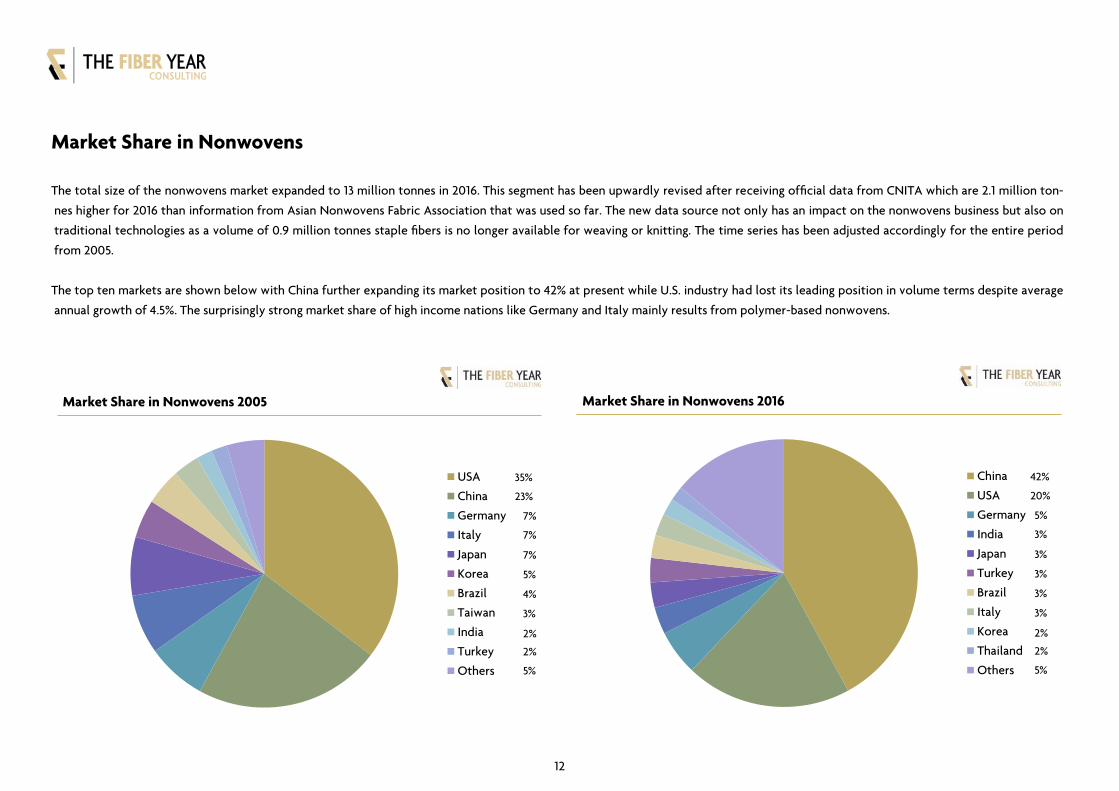
The total size of the nonwovens market expanded to 13 million tonnes in 2016. This segment has been upwardly revised after receiving official data from CNITA which are 2.1 million ton-
nes higher for 2016 than information from Asian Nonwovens Fabric Association that was used so far. The new data source not only has an impact on the nonwovens business but also on
traditional technologies as a volume of 0.9 million tonnes staple fibers is no longer available for weaving or knitting. The time series has been adjusted accordingly for the entire period
from 2005.
The top ten markets are shown below with China further expanding its market position to 42% at present while U.S. industry had lost its leading position in volume terms despite average
annual growth of 4.5%. The surprisingly strong market share of high income nations like Germany and Italy mainly results from polymer-based nonwovens.
Market Share in Nonwovens 2005
USA
China
Germany
Italy
Japan
Korea
Brazil
Taiwan
India
Turkey
Others
35%
23%
7%
7%
7%
5%
4%
3%
2%
2%
5%
Market Share in Nonwovens 2016
China
USA
Germany
India
Japan
Turkey
Brazil
Italy
Korea
Thailand
Others
42%
20%
5%
3%
3%
3%
3%
3%
2%
2%
5%

13
Personal Copy for Mr. Martin Weiler
COUNTRY
PROFILES

14
Personal Copy for Mr. Martin Weiler
Bangladesh
The local fiber output is predominantly depending on jute with a volume of around 1.4 million tonnes in recent years. Further fibers grown in Bangladesh are cotton, coir and manmade
fibers with a rather stable joint output of less then 0.1 million tonnes. The industry is quite active in fiber trade with expanded annual deficits from 0.2 million tonnes to more than one
million tonnes in the past three years. The predominant fiber type sourced abroad is cotton. This appears to be a serious concern as the South Asian country remains fully focused on
cotton products. Fiber exports virtually composing of jute fibers only used to account for roughly half a million tonnes but fell to significantly lower levels in recent years.
Production of woven fabrics has been rather flat for more than a decade despite growing local downstream demand. Knitted fabrics output has enjoyed an average annual growth rate of
17% to achieve 2.6 million tonnes last year. Imports are of negligible size although volumes tripled in the recent three years to about 120,000 tonnes.
Bangladesh: Fibers and Yarns
-0.5
0.0
0.5
1.0
1.5
2.0
2.5
3.0
2005 2010 2012 2014 2016
Supply Fiber Trade Yarn Trade Fabric Making Potential
in million tonnes
Bangladesh: Fabric Making
0.0
0.5
1.0
1.5
2.0
2.5
3.0
2005 2010 2012 2014 2016
Knitting Weaving Nonwovens
in million tonnes

15
Personal Copy for Mr. Martin Weiler
The knitting industry was characterized by almost no foreign trade. The average foreign sourcing volume of knitted fabrics has accounted for about 40,000 tonnes between 2008 and 2013
but was steadily enlarged since then to reach 120,000 tonnes in 2016 which may be a potential for future investments to raise self-sufficiency. The weaving industry does not deliver any
dynamics from the local manufacturing industry. Nevertheless, downstream garmenting demand has continuously grown in the previous ten years which has resulted in higher volumes to
be sourced abroad. The local processing has continuously lost its ability to meet downstream demand as less than a third of local consumption can be met locally by now. China has been
the largest supplier of woven cotton fabrics in the past five years whereas Thailand was prime source until 2011.
The expansion along the value chain has experienced significant growth at spinning and fabrics stage that still could not keep pace with the downstream garment industry. This has led to
rising imports of fiber material, in particular cotton, and mainly woven fabrics. The fabrics industry has seen rapid growth of knitted fabrics that clearly dominate the local market.
The country heavily relies on exports and remittances and remains vulnerable to any changes in the external environment. Garment exports are of paramount importance to the national
economy as their share in total exports amounts to virtually 90%. Last year‘s shipments to the European Union continued their growth in the ninth consecutive year after expanding 8.0%
to USD16.9 billion. Deliveries to the United States were slightly down 2.0% to USD5.5 billion and improved into Japan by 5.6% on yen basis to arrive at USD964 million.
Bangladeshi apparel exports have continued very slowly rising in the first half this year, being negatively affected by the recession of the UK import market after the fall of the Sterling.
The shift of the US market from cotton to manmade fiber is also weakening the South Asian country which remains fully focused on cotton products. In the first half 2017, exports to the
U.S. fell 4.9% to USD2.7 billion. Deliveries into the EU for the same period continued rising by 3.4% to EUR8.0 billion.
The recent development in Bangladesh has clearly favored the knitting industry that has succeeded to achieve an average annual growth rate of 17% since 2005 while the global average
accounted for nearly 5%. The country holds fourth place in volume terms. Meanwhile, manufacturing of woven fabrics contracted in Bangladesh. The industry still is the ninth largest pro-
ducer of woven fabrics but downstream garmenting demand has continuously expanded. Hence, woven fabric imports have more than quadrupled since 2005.
The vast majority of processing capacity is producing knitted fabrics, up from a 54% share in 2005 to 90% currently, while nonwovens at present are not being manufactured. Global de-
mand is increasingly shifting to cheaper polyester products where Bangladesh lacks available offer, being excessively focused on cotton products. Cotton yarn production has been deve-
loped since 2005, almost tripling to 1.2 million tonnes, as reflected by the sharp increase in cotton fiber imports, as Bangladesh does not grow cotton. In addition, Bangladesh is con-
fronted with emerging competition from Vietnam where sales to the Far Eastern countries have continued surging in the first half 2017.

16
Personal Copy for Mr. Martin Weiler
Brazil
More than three quarters of fiber and yarn production have natural origin, in particular cotton and sisal, and crop failure like in the years 2008, 2009 and 2012 has been compensated by
large destocking. Thus, the fiber volume has been hovering around 2.1 million tonnes including a long-term low in 2016 manmade fiber output. The fiber trade has been in surplus over the
whole period, mainly due to large quantities of cotton exports, on average 0.6 million tonnes per year. Meanwhile, filament and manmade-based yarns have been the main categories for
ongoing import surplus.
The long-term fabric making potential has been quite flat, amounting to almost 2.0 million tonnes in the entire period. Knitting output managed to defend its size above one million ton-
nes even if the recent development is weakening. Production of woven fabrics has softened in recent years and steadily lost market shares. Staple-based nonwovens did not show signs
of expansion whereas spunbonded nonwovens have steadily increased their output.
Brazil: Fabric Making
0.0
0.2
0.4
0.6
0.8
1.0
1.2
1.4
2005 2010 2012 2014 2016
Knitting Weaving Nonwovens
in million tonnes
Brazil: Textile Value Chain 2016
0.0
0.5
1.0
1.5
2.0
2.5
SupplyFiber&Yarn
Net TradeFiber&Yarn
Spunbond Knit/Weav/NW&Unspun
Net TradeFabrics
Net TradeApparel
Net TradeOthers *
Market Size
in million tonnes
* Other made-up textile articles; worn clothing; carpets; waste of fibers; ...including cotton stock changes and ICAC use data for subsequent calculation
17
Personal Copy for Mr. Martin Weiler
The only expanded segments along the entire textile value chain appear to be cotton cultivation, the spunbond and knitting sectors. Although cotton growing gained more than 40% over
this period, it still is nearly half a million tonnes below the maximum values in 2010/11. Spunbond output rose from 156,000 tonnes in 2005 to almost 280,000 tonnes at present while
production of knitted fabrics succeeded to annually grow almost 2% on average.
While the country used to have balanced trade in fabrics, apparel and other made-up textile articles, the need for foreign sourcing has continuously grown in recent years. Given the
decline in disposable income it remains to be seen whether local manufacturing industry can withstand price pressure from foreign manmade fiber articles. According to World Bank
data, the gross national income per capita in current U.S. dollar has continuously declined from its peak at USD12,730 in 2013 to USD8,840 in the previous year. As the share of natural
fibers fueling garmenting is about 80% the crucial question remains whether local industry can compete with lower priced manmade fiber apparel even if climatic reasons definitely favor
cotton items.
Total textile and apparel trade value for the world‘s fifth largest population at about USD6 billion is of minor relevance. However, drastic changes in the first five months of 2017 under-
line the long-term development of an increasing portion of textiles and clothing being sourced abroad. This may be consequence of a weakening local industry, price pressure from man-
made fiber articles and inadequate investments along the value chain.
In addition, the market has substantially lost attractiveness for foreign investors as last year‘s inflow of USD64 million was two thirds lower than in the previous year at USD199 million.
The sector of crop and livestock succeeded to lift FDI by 85% to 924 million but, apart from cotton, output of remaining natural fibers like jute, ramie, silk, sisal and wool has been in re-
verse in recent years.

18
Personal Copy for Mr. Martin Weiler
China
The rapid growth of fiber and yarn production in particular until 2015 has been spurred by manmade fibers while cotton output has suffered from a reduction from 7.4 million tonnes in
2011 to 4.9 million tonnes in 2016. The main reason for this decline although crop growing is essential from an employment issue is the high cotton minimum price which has led compa-
nies to increasingly purchase their cotton yarn requirements abroad, mainly in India, Pakistan and Vietnam. Thus, cotton yarn imports advanced from 0.8 million tonnes in 2005 beyond
two million tonnes at present while manmade filament exports jumped over the same period from 0.5 to more than 2.5 million tonnes.
Knitted fabric production has experienced a push in recent years and stabilized at high level while woven fabric output was rather stable. However, the both years 2013 and 2015 were
clearly in favor of woven items as the long-term trend was interrupted. Staple fiber-based nonwovens have witnessed strong relative growth rates accounting for 15% on average since
2005 while spunbonded nonwovens even surged more than 18% annually.
China: Fibers and Yarns
-10
0
10
20
30
40
50
60
2005 2010 2012 2014 2016
Supply Fiber Trade Yarn Trade Fabric Making Potential
in million tonnes
China: Fabric Making
0
5
10
15
20
25
30
35
40
2005 2010 2012 2014 2016
Knitting Weaving Nonwovens
in million tonnes

19
Personal Copy for Mr. Martin Weiler
The production of knitted fabrics managed to grow 8% annually on average. Although trading activities are of minor relevance the continuously increasing export volumes may either be
an indication for relocated downstream operations to cope with labor and/or political issues or may reflect necessity to serve foreign markets to realize economically feasible operation
rates.
Contrary, about 40% of woven fabrics have been shipped abroad and the long-term export trend seems to be in good order. Exports of cotton woven fabrics into Bangladesh, Cambodia,
Indonesia and Vietnam rose but quite surprisingly are more than doubling volumes at 207,000 tonnes (+121%) into Philippines. Tire cord fabrics expanded by 14% to 203,000 tonnes with
the top five sales destinations absorbing higher volumes each: Thailand 41,000 tonnes (+12%), India 34,000 tonnes (+19%), Japan 21,000 tonnes (+2%), Indonesia 16,000 tonnes (+16%) to the
United States 13,000 tonnes (+95%).
The fiber material and fabric industries have enjoyed doubling of capability since 2005. As a consequence of existing excess capacity at the spinning stage the volume of imports has
declined. Of course, it is a comprehensible development in the light of more than 10 million tonnes of cotton stocks which is equal to about 40% of global annual cotton consumption.
Last year‘s exports of fabrics have, anyway, exceeded 11 million tonnes as direct response of escalating wages, shortage in labor becoming more serious and increasing relocation of the
downstream manufacturing base.
The Chinese industry has experienced an exceptional growth of its exports, in particular after it was accepted as WTO member end of 2001. Textile and clothing exports jumped from
USD53 billion in 2001 to USD95 billion in 2004. After the abolishment of quotas in 2005, export growth has further gained momentum to peak at USD307 billion in 2014 before declining
in the previous two years to reach USD267 billion in 2016. The industry, crucial in job creation, may be assured of political support to stimulate exports and to invest abroad.
U.S. textile and apparel imports from China fell 10.8% in 2016 to arrive at USD38.5 billion. Hence, the Chinese market share amounted to almost 37% in the previous year. In the first half
2017, Chinese import value fell 4.3% to USD16.8 billion while total U.S. import during that period weakened 2.0% to USD49.5 billion. This is equal to a declining import share from China to
nearly 34% while deliveries from Vietnam managed to further expand 4.0% to USD5.7 billion.
Knitwear apparel shipments into EU(28) in the full year 2016 dropped 7.9% to EUR12.9 billion and marginally revived in the first half of 2017 by 0.2% to EUR5.1 billion. Woven apparel de-
liveries from China also softened 6.8% to EUR14.9 billion in 2016. During January to June 2017 they continued decreasing by 2.7% to EUR6.3 billion.
20
Personal Copy for Mr. Martin Weiler
India
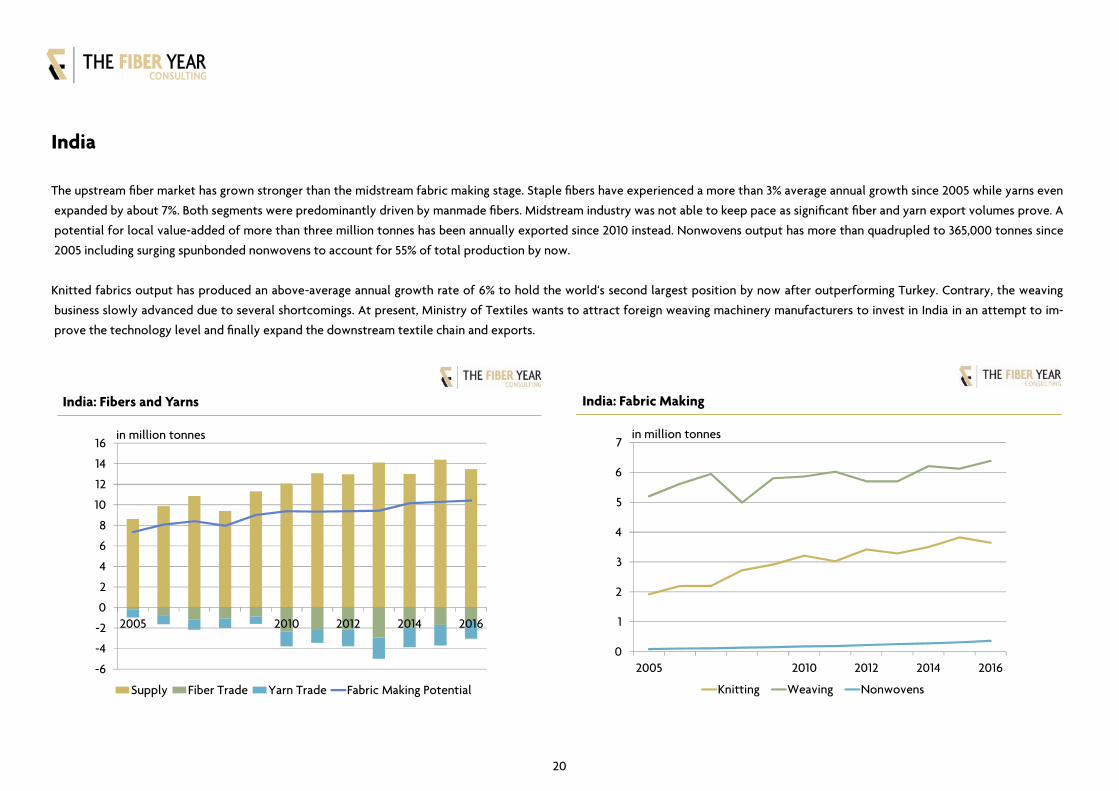
The upstream fiber market has grown stronger than the midstream fabric making stage. Staple fibers have experienced a more than 3% average annual growth since 2005 while yarns even
expanded by about 7%. Both segments were predominantly driven by manmade fibers. Midstream industry was not able to keep pace as significant fiber and yarn export volumes prove. A
potential for local value-added of more than three million tonnes has been annually exported since 2010 instead. Nonwovens output has more than quadrupled to 365,000 tonnes since
2005 including surging spunbonded nonwovens to account for 55% of total production by now.
Knitted fabrics output has produced an above-average annual growth rate of 6% to hold the world‘s second largest position by now after outperforming Turkey. Contrary, the weaving
business slowly advanced due to several shortcomings. At present, Ministry of Textiles wants to attract foreign weaving machinery manufacturers to invest in India in an attempt to im-
prove the technology level and finally expand the downstream textile chain and exports.
India: Fibers and Yarns
-6
-4
-2
0
2
4
6
8
10
12
14
16
2005 2010 2012 2014 2016
Supply Fiber Trade Yarn Trade Fabric Making Potential
in million tonnes
India: Fabric Making
0
1
2
3
4
5
6
7
2005 2010 2012 2014 2016
Knitting Weaving Nonwovens
in million tonnes
21
Personal Copy for Mr. Martin Weiler
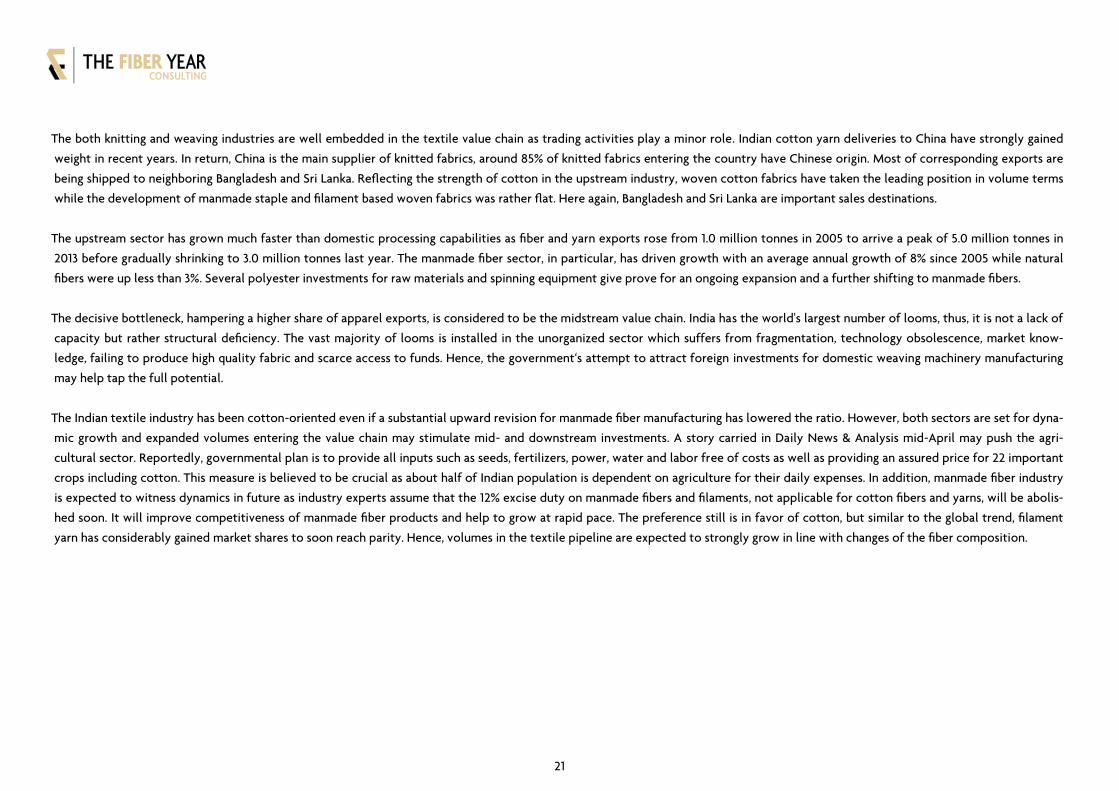
The both knitting and weaving industries are well embedded in the textile value chain as trading activities play a minor role. Indian cotton yarn deliveries to China have strongly gained
weight in recent years. In return, China is the main supplier of knitted fabrics, around 85% of knitted fabrics entering the country have Chinese origin. Most of corresponding exports are
being shipped to neighboring Bangladesh and Sri Lanka. Reflecting the strength of cotton in the upstream industry, woven cotton fabrics have taken the leading position in volume terms
while the development of manmade staple and filament based woven fabrics was rather flat. Here again, Bangladesh and Sri Lanka are important sales destinations.
The upstream sector has grown much faster than domestic processing capabilities as fiber and yarn exports rose from 1.0 million tonnes in 2005 to arrive a peak of 5.0 million tonnes in
2013 before gradually shrinking to 3.0 million tonnes last year. The manmade fiber sector, in particular, has driven growth with an average annual growth of 8% since 2005 while natural
fibers were up less than 3%. Several polyester investments for raw materials and spinning equipment give prove for an ongoing expansion and a further shifting to manmade fibers.
The decisive bottleneck, hampering a higher share of apparel exports, is considered to be the midstream value chain. India has the world's largest number of looms, thus, it is not a lack of
capacity but rather structural deficiency. The vast majority of looms is installed in the unorganized sector which suffers from fragmentation, technology obsolescence, market know-
ledge, failing to produce high quality fabric and scarce access to funds. Hence, the government‘s attempt to attract foreign investments for domestic weaving machinery manufacturing
may help tap the full potential.
The Indian textile industry has been cotton-oriented even if a substantial upward revision for manmade fiber manufacturing has lowered the ratio. However, both sectors are set for dyna-
mic growth and expanded volumes entering the value chain may stimulate mid- and downstream investments. A story carried in Daily News & Analysis mid-April may push the agri-
cultural sector. Reportedly, governmental plan is to provide all inputs such as seeds, fertilizers, power, water and labor free of costs as well as providing an assured price for 22 important
crops including cotton. This measure is believed to be crucial as about half of Indian population is dependent on agriculture for their daily expenses. In addition, manmade fiber industry
is expected to witness dynamics in future as industry experts assume that the 12% excise duty on manmade fibers and filaments, not applicable for cotton fibers and yarns, will be abolis-
hed soon. It will improve competitiveness of manmade fiber products and help to grow at rapid pace. The preference still is in favor of cotton, but similar to the global trend, filament
yarn has considerably gained market shares to soon reach parity. Hence, volumes in the textile pipeline are expected to strongly grow in line with changes of the fiber composition.

22
Personal Copy for Mr. Martin Weiler
Indonesia
The industry is almost completely relying on manmade fibers at a size of 1.7 million tonnes whereas the country only produces kapok fibers at commercially meaningful volume. It is the
world‘s largest kapok fiber producer of around 70,000 tonnes, equal to a two third market share. Cotton and other natural fiber quantities are negligible. Farmers rather prefer to grow
rice or corn. Hence, cotton requirements need to be imported from mainly the United States, Brazil and Australia.
The yarn business is characterized by slow shifting to cotton yarn, amounting to 2.1 million tonnes in 2016 versus 0.6 million tonnes filament yarn, which is contrary to the global trend. In
addition, net exports of more than 0.5 million tonnes of yarns pose quite a significant share of local production and hamper higher value-added in the country that has been complaining
about illegal imports at dumping prices for many years.
Indonesia: Fibers and Yarns
-1.0
-0.5
0.0
0.5
1.0
1.5
2.0
2.5
3.0
2005 2010 2012 2014 2016
Supply Fiber Trade Yarn Trade Fabric Making Potential
in million tonnes
Indonesia: Fabric Making
0.0
0.2
0.4
0.6
0.8
1.0
1.2
2005 2010 2012 2014 2016
Knitting Weaving Nonwovens
in million tonnes
23
Personal Copy for Mr. Martin Weiler
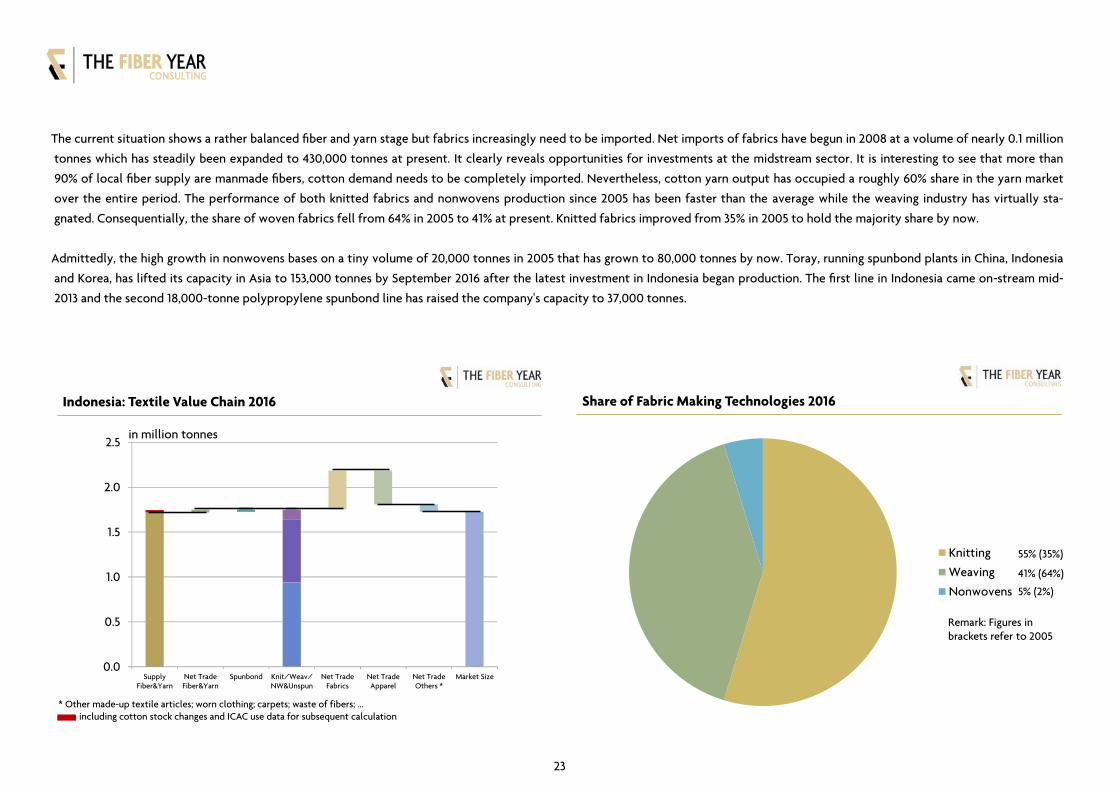
The current situation shows a rather balanced fiber and yarn stage but fabrics increasingly need to be imported. Net imports of fabrics have begun in 2008 at a volume of nearly 0.1 million
tonnes which has steadily been expanded to 430,000 tonnes at present. It clearly reveals opportunities for investments at the midstream sector. It is interesting to see that more than
90% of local fiber supply are manmade fibers, cotton demand needs to be completely imported. Nevertheless, cotton yarn output has occupied a roughly 60% share in the yarn market
over the entire period. The performance of both knitted fabrics and nonwovens production since 2005 has been faster than the average while the weaving industry has virtually sta-
gnated. Consequentially, the share of woven fabrics fell from 64% in 2005 to 41% at present. Knitted fabrics improved from 35% in 2005 to hold the majority share by now.
Admittedly, the high growth in nonwovens bases on a tiny volume of 20,000 tonnes in 2005 that has grown to 80,000 tonnes by now. Toray, running spunbond plants in China, Indonesia
and Korea, has lifted its capacity in Asia to 153,000 tonnes by September 2016 after the latest investment in Indonesia began production. The first line in Indonesia came on-stream mid-
2013 and the second 18,000-tonne polypropylene spunbond line has raised the company's capacity to 37,000 tonnes.
Indonesia: Textile Value Chain 2016
0.0
0.5
1.0
1.5
2.0
2.5
SupplyFiber&Yarn
Net TradeFiber&Yarn
Spunbond Knit/Weav/NW&Unspun
Net TradeFabrics
Net TradeApparel
Net TradeOthers *
Market Size
in million tonnes
* Other made-up textile articles; worn clothing; carpets; waste of fibers; ...including cotton stock changes and ICAC use data for subsequent calculation
Share of Fabric Making Technologies 2016
Knitting
Weaving
Nonwovens
55% (35%)
41% (64%)
5% (2%)
Remark: Figures inbrackets refer to 2005
24
Personal Copy for Mr. Martin Weiler
Japan
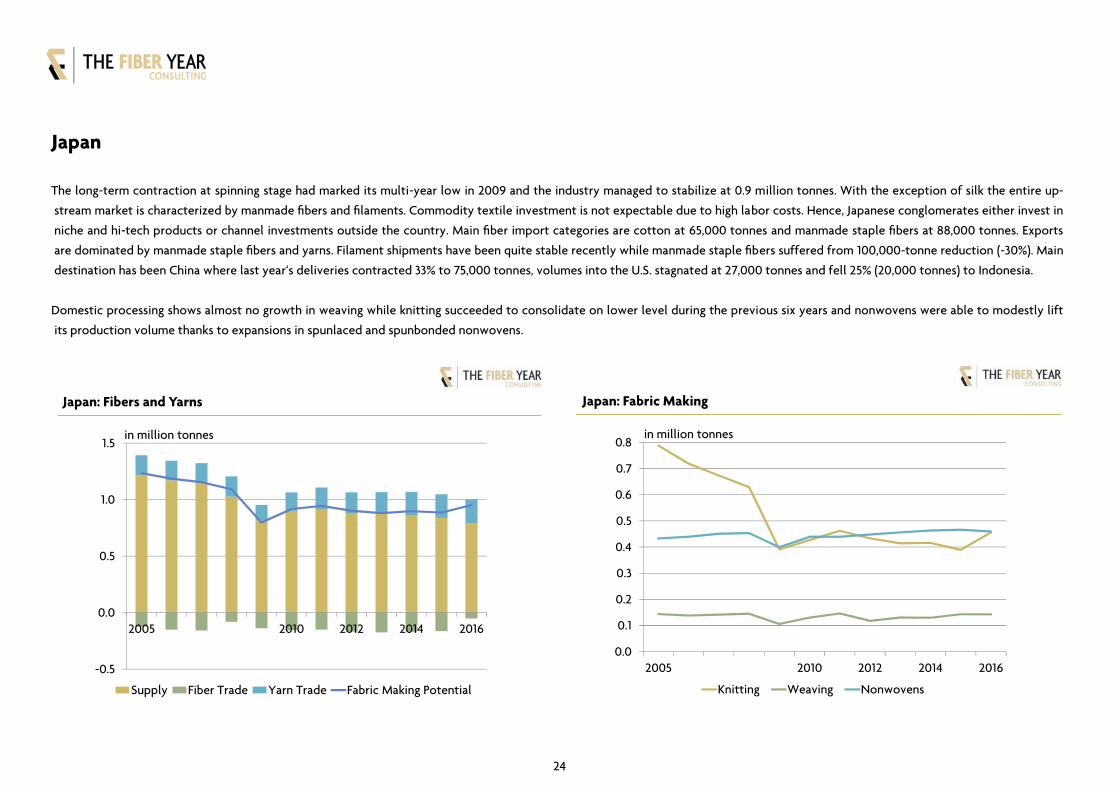
The long-term contraction at spinning stage had marked its multi-year low in 2009 and the industry managed to stabilize at 0.9 million tonnes. With the exception of silk the entire up-
stream market is characterized by manmade fibers and filaments. Commodity textile investment is not expectable due to high labor costs. Hence, Japanese conglomerates either invest in
niche and hi-tech products or channel investments outside the country. Main fiber import categories are cotton at 65,000 tonnes and manmade staple fibers at 88,000 tonnes. Exports
are dominated by manmade staple fibers and yarns. Filament shipments have been quite stable recently while manmade staple fibers suffered from 100,000-tonne reduction (-30%). Main
destination has been China where last year‘s deliveries contracted 33% to 75,000 tonnes, volumes into the U.S. stagnated at 27,000 tonnes and fell 25% (20,000 tonnes) to Indonesia.
Domestic processing shows almost no growth in weaving while knitting succeeded to consolidate on lower level during the previous six years and nonwovens were able to modestly lift
its production volume thanks to expansions in spunlaced and spunbonded nonwovens.
Japan: Fibers and Yarns
-0.5
0.0
0.5
1.0
1.5
2005 2010 2012 2014 2016
Supply Fiber Trade Yarn Trade Fabric Making Potential
in million tonnes
Japan: Fabric Making
0.0
0.1
0.2
0.3
0.4
0.5
0.6
0.7
0.8
2005 2010 2012 2014 2016
Knitting Weaving Nonwovens
in million tonnes

25
Personal Copy for Mr. Martin Weiler
The fiber and fabric industries both declined with traditional fabric making technologies even contracting a little more pronounced. The local fiber market is fully reliant on manmade
fibers apart from a tiny silk output and commodities witnessed a long-term contraction while hi-tech specialties like carbon fibers succeeded to grow. Trade in fibers and yarns was fairly
balanced until last year‘s slump of manmade staple fiber exports (-30%) and leads to a similar decline in the subsequent processing industry which was primarily affected by a reduction in
knitted fabrics. Meanwhile, local availability of woven fabrics has almost doubled between 2005 and 2016 to 200,000 tonnes due to slightly easing exports.
The country‘s trade deficit in textiles and clothing remained above USD27 billion. Shipments from China still dominate the import flow despite a further weakening share to 62% in line
with the governmental target announced a couple of years ago to reduce the Chinese flows in favor of other Asian suppliers. Double-digit growth rates in local currency terms have been
observed for Cambodia as seventh largest supplier. Bangladesh in fourth place increased shipments by nearly 6% and Myanmar (8th) was stable while other leading suppliers suffered
losses.
Japan: Textile Value Chain 2016
0.0
0.5
1.0
1.5
2.0
2.5
3.0
SupplyFiber&Yarn
Net TradeFiber&Yarn
Spunbond Knit/Weav/NW&Unspun
Net TradeFabrics
Net TradeApparel
Net TradeOthers *
Market Size
in million tonnes
* Other made-up textile articles; worn clothing; carpets; waste of fibers; ...
Japan: Performance of Fabric Making Technologies
-6%
-4%
-2%
0%
2%
4%
6%
8%
10%
Knitting Weaving Nonwovens
Japan Global Average
AAGR 2005 – 2016 in %
26
Personal Copy for Mr. Martin Weiler
Korea: Spinning Stage and Fabric Making
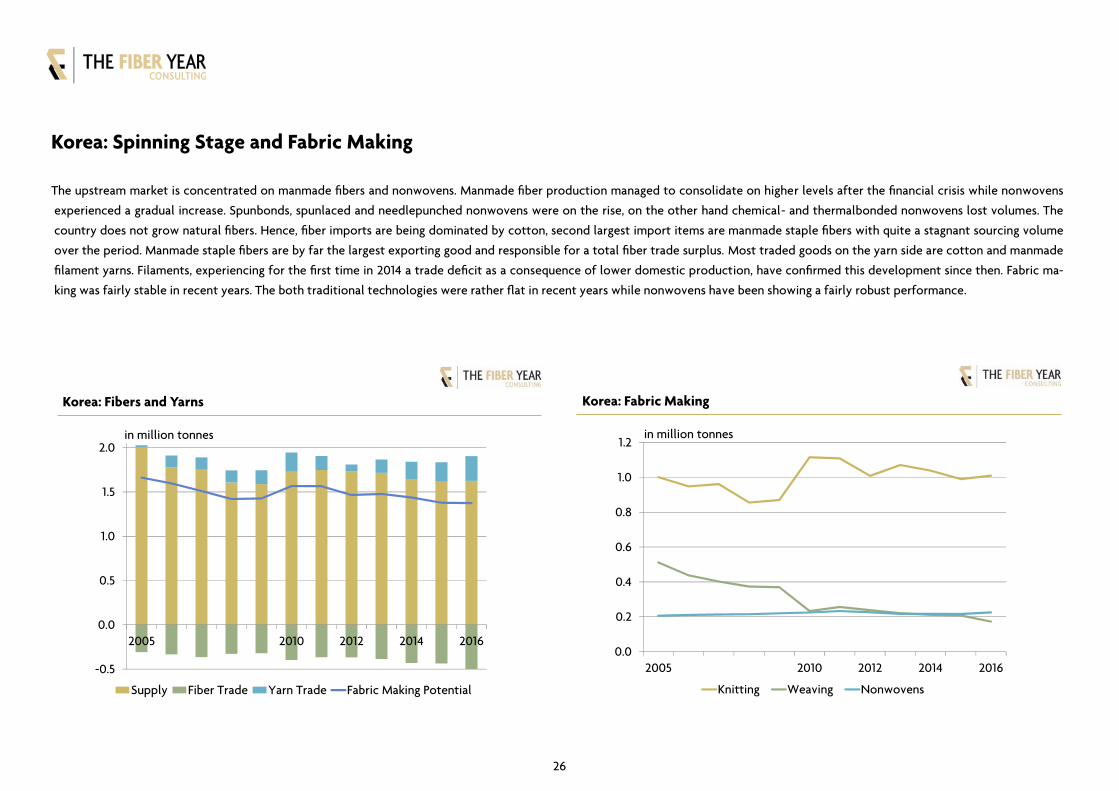
The upstream market is concentrated on manmade fibers and nonwovens. Manmade fiber production managed to consolidate on higher levels after the financial crisis while nonwovens
experienced a gradual increase. Spunbonds, spunlaced and needlepunched nonwovens were on the rise, on the other hand chemical- and thermalbonded nonwovens lost volumes. The
country does not grow natural fibers. Hence, fiber imports are being dominated by cotton, second largest import items are manmade staple fibers with quite a stagnant sourcing volume
over the period. Manmade staple fibers are by far the largest exporting good and responsible for a total fiber trade surplus. Most traded goods on the yarn side are cotton and manmade
filament yarns. Filaments, experiencing for the first time in 2014 a trade deficit as a consequence of lower domestic production, have confirmed this development since then. Fabric ma-
king was fairly stable in recent years. The both traditional technologies were rather flat in recent years while nonwovens have been showing a fairly robust performance.
Korea: Fibers and Yarns
-0.5
0.0
0.5
1.0
1.5
2.0
2005 2010 2012 2014 2016
Supply Fiber Trade Yarn Trade Fabric Making Potential
in million tonnes
Korea: Fabric Making
0.0
0.2
0.4
0.6
0.8
1.0
1.2
2005 2010 2012 2014 2016
Knitting Weaving Nonwovens
in million tonnes

27
Personal Copy for Mr. Martin Weiler
The recent development went along with a general decline of locally manufactured manmade fibers. The majority of manmade fibers are related to polyester that succeeded to grow by
1.3% to 1.2 million tonnes after three annual losses. Raw material investments are being installed for acrylonitrile, monoethylene glycol and paraxylene capacity. Natural fibers are virtual-
ly not being grown in the country. Thus, the annual demand in the range of 250,000 tonnes wool and cotton has to be imported. Lower manufacturing at the spinning and fabric making
stage have resulted in reduced export surpluses. At the same time, the volumes of ready-made garments sourced abroad has been enlarged. Total output from the processing industry
was affected by the upstream contraction process, tolerably unchanged for knitted fabrics but considerably dropping at the weaving chain. The nonwovens business has delivered a
mixed performance with chemical and thermal bonded nonwovens on the downswing while needlepunched and spunbonded nonwovens have lifted their volumes.
Growth is currently driven by strong momentum in merchandise trade and the government’s stimulus package. Most important for the country‘s future development, however, will be the
dispute settlement with North Korea. Business sentiment among both export- and domestic-oriented firms deteriorated slightly in August. Korea has a strong polyester raw material base
but massive PTA investments in China have already led local production to decline from its peak in 2011 at 6.6 million tonnes to 4.6 million tonnes last year. A similar development is ex-
pected for PX in a couple of years when all the announced Chinese capacities will come on-stream to lessen the enormous foreign sourcing demand.
Korea: Textile Value Chain 2016
0.0
0.5
1.0
1.5
2.0
SupplyFiber&Yarn
Net TradeFiber&Yarn
Spunbond Knit/Weav/NW&Unspun
Net TradeFabrics
Net TradeApparel
Net TradeOthers *
Market Size
in million tonnes
* Other made-up textile articles; worn clothing; carpets; waste of fibers; ...
Share of Fabric Making Technologies 2016
Knitting
Weaving
Nonwovens
72% (58%)
12% (30%)
16% (12%)
Remark: Figures inbrackets refer to 2005

28
Personal Copy for Mr. Martin Weiler
Turkey: Spinning Stage and Fabric Making
Turkey is the fourth largest cotton consuming country, processing about 1.5 million tonnes lately. The industry heavily relies on foreign cotton supplies. The national industry is also the
world‘s seventh largest manmade fiber producer with stable output of 1.2 million tonnes recently. The total volume is entirely related to synthetic fibers with polyester taking the lead
and acrylic fibers contributing a third. Nevertheless, majority of the fiber and yarn requirements need to be sourced abroad. A shortfall in production has been increasingly compensated
by higher fiber and yarn volumes from abroad.
While the weaving activity has been virtually stable after 2005, knitting output succeeded to enlarge its higher level established after the financial crisis. A continuous growth has been
observed at nonwovens, in particular the spunbond technology managed to lift its output after the installation of six new lines between 2011 and 2015, a further 35,000-tonne line from
Gülsan is planned for 2018.
Turkey: Fibers and Yarns
0.0
0.5
1.0
1.5
2.0
2.5
3.0
3.5
4.0
4.5
2005 2010 2012 2014 2016
Supply Fiber Trade Yarn Trade Fabric Making Potential
in million tonnes
Turkey: Fabric Making
0.0
0.5
1.0
1.5
2.0
2.5
3.0
3.5
2005 2010 2012 2014 2016
Knitting Weaving Nonwovens
in million tonnes

29
Personal Copy for Mr. Martin Weiler
The marginally growing knitting segment, but stagnant in the previous three years, allows surplus production to ship abroad, exports have more than doubled between 2005 from 97,000
tonnes and 2016 to 255,000 tonnes. Major export markets are Bulgaria and Italy with volumes of 44,000 tonnes each.
The situation in the weaving sector is quite similar but reveals a higher trade activity in both directions. Most active trade categories, both occupying a net exporting position by now, are
cotton and filament based fabrics.
The negative effects of political instability, regional tensions, flow of refugees and growing uncertainty at consumers is being reflected by a lower consumption level that is not expected
to change for the better in the next years. This will have the consequence that the Turkish textile and apparel market at retail stage will develop slower than world average and the an-
nounced minimum wage might put additional pressure on the entire textile value chain jeopardizing many of the 2.0 million jobs in textile and apparel manufacturing.
The basically fluctuating market for fibers and yarns which is result of the roughly 40% share of cotton did not keep pace with the downstream demand as being reflected by sharply in-
creased imports. The fiber import driven growth of the fabric making stage has resulted in a modest growth of woven fabrics, a stronger expansion of the knitting industry and surging
additions of nonwovens. However, much of the fabrics growth has led to higher exports instead of increase value-added production in Turkey. That is main reason for modest growth of
apparel products.
Textile and clothing imports into the United States from Turkey rose 5.5% to USD1.3 billion in 2016 and could even gain momentum in the first half 2017 as shipments by value further in-
creased 8.1% to USD699 million. Shipments into the EU(28) have produced a mixed performance last year. Knitwear deliveries shrank 0.7% to EUR5.7 billion while woven apparel increa-
sed 3.5% to EUR3.8 billion. In the first half 2017, both categories weakened, knitwear by 6.1% to EUR2.7 billion and woven articles by 0.3% to EUR2.0 billion. Political and economic
uncertainties could continue to curb the growth of export sales with the looming Brexit negotiations threatening the business over the long term.
The average annual 2% growth rate in fabric volume between 2005 and 2016 was realized by lower activity at upstream spinning stage and higher export surpluses in fibers and yarns. The
export volume of apparel and made-up textiles, however, was largely stable as fabric volumes were on the rise as well. Thus, the downstream industry has apparently not expanded their
capacities accordingly to tap the full potential. Traditional fabric making technologies have underperformed while spunbonded nonwovens in particular have experienced rapid growth
during the period.
Mounting political turmoil in Turkey will drag on business sentiment going forward. This situation, coupled with rising geopolitical risks, ongoing clashes with Kurdish militants and increa-
sed volatility in the financial markets following the Brexit vote, will impact growth. Thus, retailers may seek for options to safeguard stable and timely product flows.
30
Personal Copy for Mr. Martin Weiler
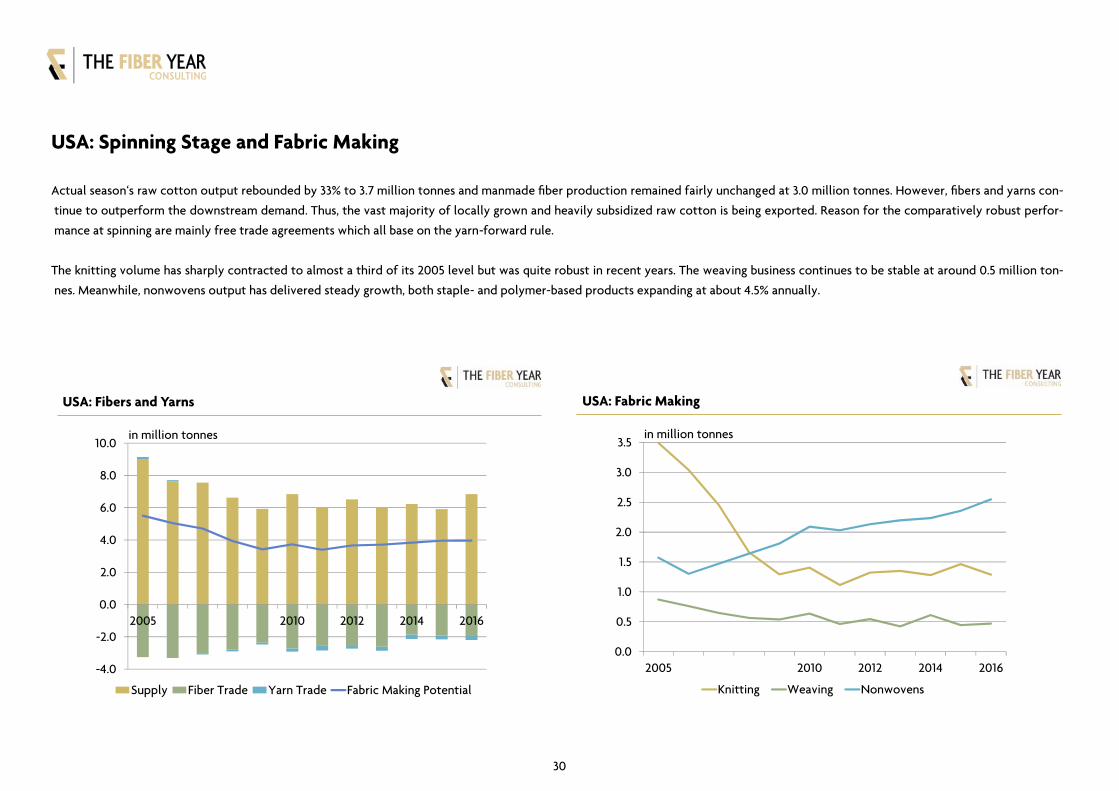
USA: Spinning Stage and Fabric Making
Actual season‘s raw cotton output rebounded by 33% to 3.7 million tonnes and manmade fiber production remained fairly unchanged at 3.0 million tonnes. However, fibers and yarns con-
tinue to outperform the downstream demand. Thus, the vast majority of locally grown and heavily subsidized raw cotton is being exported. Reason for the comparatively robust perfor-
mance at spinning are mainly free trade agreements which all base on the yarn-forward rule.
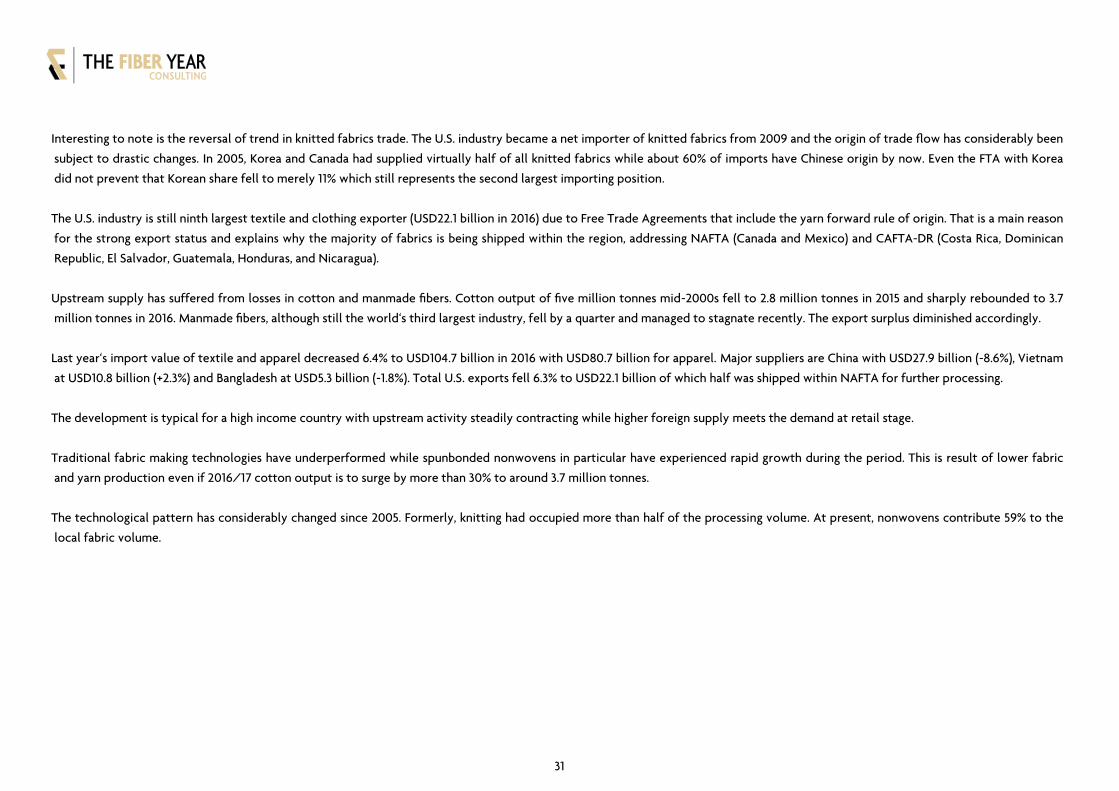
The knitting volume has sharply contracted to almost a third of its 2005 level but was quite robust in recent years. The weaving business continues to be stable at around 0.5 million ton-
nes. Meanwhile, nonwovens output has delivered steady growth, both staple- and polymer-based products expanding at about 4.5% annually.
USA: Fibers and Yarns
-4.0
-2.0
0.0
2.0
4.0
6.0
8.0
10.0
2005 2010 2012 2014 2016
Supply Fiber Trade Yarn Trade Fabric Making Potential
in million tonnes
USA: Fabric Making
0.0
0.5
1.0
1.5
2.0
2.5
3.0
3.5
2005 2010 2012 2014 2016
Knitting Weaving Nonwovens
in million tonnes
31
Personal Copy for Mr. Martin Weiler
Interesting to note is the reversal of trend in knitted fabrics trade. The U.S. industry became a net importer of knitted fabrics from 2009 and the origin of trade flow has considerably been
subject to drastic changes. In 2005, Korea and Canada had supplied virtually half of all knitted fabrics while about 60% of imports have Chinese origin by now. Even the FTA with Korea
did not prevent that Korean share fell to merely 11% which still represents the second largest importing position.
The U.S. industry is still ninth largest textile and clothing exporter (USD22.1 billion in 2016) due to Free Trade Agreements that include the yarn forward rule of origin. That is a main reason
for the strong export status and explains why the majority of fabrics is being shipped within the region, addressing NAFTA (Canada and Mexico) and CAFTA-DR (Costa Rica, Dominican
Republic, El Salvador, Guatemala, Honduras, and Nicaragua).
Upstream supply has suffered from losses in cotton and manmade fibers. Cotton output of five million tonnes mid-2000s fell to 2.8 million tonnes in 2015 and sharply rebounded to 3.7
million tonnes in 2016. Manmade fibers, although still the world‘s third largest industry, fell by a quarter and managed to stagnate recently. The export surplus diminished accordingly.
Last year‘s import value of textile and apparel decreased 6.4% to USD104.7 billion in 2016 with USD80.7 billion for apparel. Major suppliers are China with USD27.9 billion (-8.6%), Vietnam
at USD10.8 billion (+2.3%) and Bangladesh at USD5.3 billion (-1.8%). Total U.S. exports fell 6.3% to USD22.1 billion of which half was shipped within NAFTA for further processing.
The development is typical for a high income country with upstream activity steadily contracting while higher foreign supply meets the demand at retail stage.
Traditional fabric making technologies have underperformed while spunbonded nonwovens in particular have experienced rapid growth during the period. This is result of lower fabric
and yarn production even if 2016/17 cotton output is to surge by more than 30% to around 3.7 million tonnes.
The technological pattern has considerably changed since 2005. Formerly, knitting had occupied more than half of the processing volume. At present, nonwovens contribute 59% to the
local fabric volume.

32
Personal Copy for Mr. Martin Weiler
Vietnam: Spinning Stage and Fabric Making
The country has witnessed a rapid growth in fabric making potential despite a shortage in most fiber materials. Vietnam is the world‘s second largest coir producer but all the other fibers
need to be imported. Hence, the fiber trade deficit has increased from 0.2 million tonnes in 2005 to 1.4 million tonnes last year. Major import categories are cotton and manmade staple
fibers. The balance in yarn trade has changed into a surplus from 2009 as the local production of cotton and blended yarns has exceeded downstream processing capacity while necessity
of manmade filament imports has basically gained weight. The entire upstream sector has almost tripled its capability since 2005 to arrive at 1.8 million tonnes.
Both knitted and woven fabrics production have experienced above-average annual average growth since 2005 with recent installation of some nonwovens machinery, probably used
lines from China.
Vietnam: Fibers and Yarns
-1.0
-0.5
0.0
0.5
1.0
1.5
2.0
2.5
2005 2010 2012 2014 2016
Supply Fiber Trade Yarn Trade Fabric Making Potential
in million tonnes
Vietnam: Fabric Making
0.0
0.2
0.4
0.6
0.8
1.0
1.2
2005 2010 2012 2014 2016
Knitting Weaving Nonwovens
in million tonnes

33
Personal Copy for Mr. Martin Weiler
Surging imports of knitted and woven fabrics indicate a non-synchronized speed of expansion along the value chain and a rapidly growing market size for subsequent garmenting. At first
sight it may surprise to see growing woven fabrics exports since 2010. This is predominantly polyester and also nylon tire cord fabric of which more than half is being further processed
into tires in the United States, Korea and Japan.
The import value of woven cotton fabrics expanded from USD0.4 billion in 2005 to USD2.0 billion last year, of woven filament fabrics from USD250 million to USD2.3 billion and of syn-
thetic staple fiber based fabrics from USD1.1 billion to USD2.5 billion. This reveals a tremendous potential for future investments to achieve the governmental target for 2025 of pro-
ducing 11.9 billion square meters of fabrics.
The textile value chain has enjoyed rapid growth even if the pace was not harmonized as can be seen from the rising import deficit in fibers and yarns as well as fabrics. Trade figures re-
veal a bottleneck along the textile chain. Capacity expansions of fabric making did not keep pace with upstream spinning and downstream sewing operations. A current fabric output ex-
ceeding two billion square meters with more than six billion meters sourced abroad makes weaving and knitting investments promising. It becomes even more important when taking
into account the development plan up to the year 2025 that targets 11.9 billion square meters. The spinning sector is well on its way. Total capacity of installed short-staple spindles ac-
counts for almost 7.0 million compared with the target of 17.9 million by 2025. Ministry of Industry and Trade recently had agreed upon the textile and garment industry development
plan 2020 with a vision for 2030. Under the plan, the industry aims to achieve 55% localization rate by 2015, which will increase to 70% by 2030 respectively. After U.S. withdrawal from
TPP the outlook still is promising and maybe industry will use this short-dated downer for a consolidation process that seems recommendable after surging growth in the past.