the expanding ivivc toolbox to enable drug …the expanding ivivc toolbox to enable drug product...
TRANSCRIPT

THE EXPANDING IVIVC TOOLBOX TO ENABLE DRUG PRODUCT QUALITYCOMPLEMENTARY TRADITIONAL AND PBPK BASED APPROACHES
Filippos Kesisoglou, PhD, FAAPSBiopharmaceutics and Specialty Dosage Forms, Pharmaceutical SciencesMerck & Co., Inc., Kenilworth, NJ USA
PQRI BTC Webinar, 07-June-2019

Outline
1. Introduction – Role of Modeling in Clinically Relevant Drug Product Specifications
2. Part 1. A PQRI BTC Project – Understanding Multiple Level C Models for IR products
3. Part 2. Physiologically Based IVIVC Case Study
2

Enabling Drug Product Quality via Modeling
• QbD = understanding of how product attributes and process relate to product performance
• For Biopharmaceutics scientists this means:• Understanding of the formulation dissolution / release IN VIVO (and the
factors affecting that) that ensures the anticipated dose (PK and PD) response.
• Sufficient rate of dissolution to provide desired PK (and subsequently PD) profile across intended doses and with acceptable variability
• Linking the IN VIVO dissolution/release to an IN VITRO assay to ensure consistency of product administered to patients
3

Clinically Relevant Specifications Roadmap
4

IVIVCA Predictive Mathematical Model Describing the Relationship Between an In Vitro Property of an Extended Release Dosage Form (Usually the Rate or Extent of Drug Dissolution or Release) and a Relevant In VivoResponse, e.g., Plasma Drug Concentration or Amount of Drug Absorbed” (FDA Definition)
5
Level C and Multiple Level C
ModelLevel A Model

PBPK (Mechanistic Oral Absorption) Modeling
6

Modeling and Clinically Relevant Specifications
7
Regardless of the methodology used, the goal is to estimate a dissolution range that formulations are expected to be bioequivalent to the reference batch (i.e. pivotal clinical batch or BE batch)

Part 1. A PQRI BTC ProjectUnderstanding Application of Level C and Level A IVIVC to IR products

PQRI BTC WebinarJune 2019
Project Background• Success rate for IVIVCs remains generally low• While for MR products Level A models can be expected, the landscape
for IR products is less clear– E.g. Differences in in vitro (typically complete dissolution in 30 min) and in vivo
(typically over several hours) release rates may hinder development of Level A models
• While there have been a few examples of Multiple Level C models reported, their benefit on setting specification or projecting bioequivalence for IR has not been systematically studied
9
PQRI BTC WebinarJune 2019
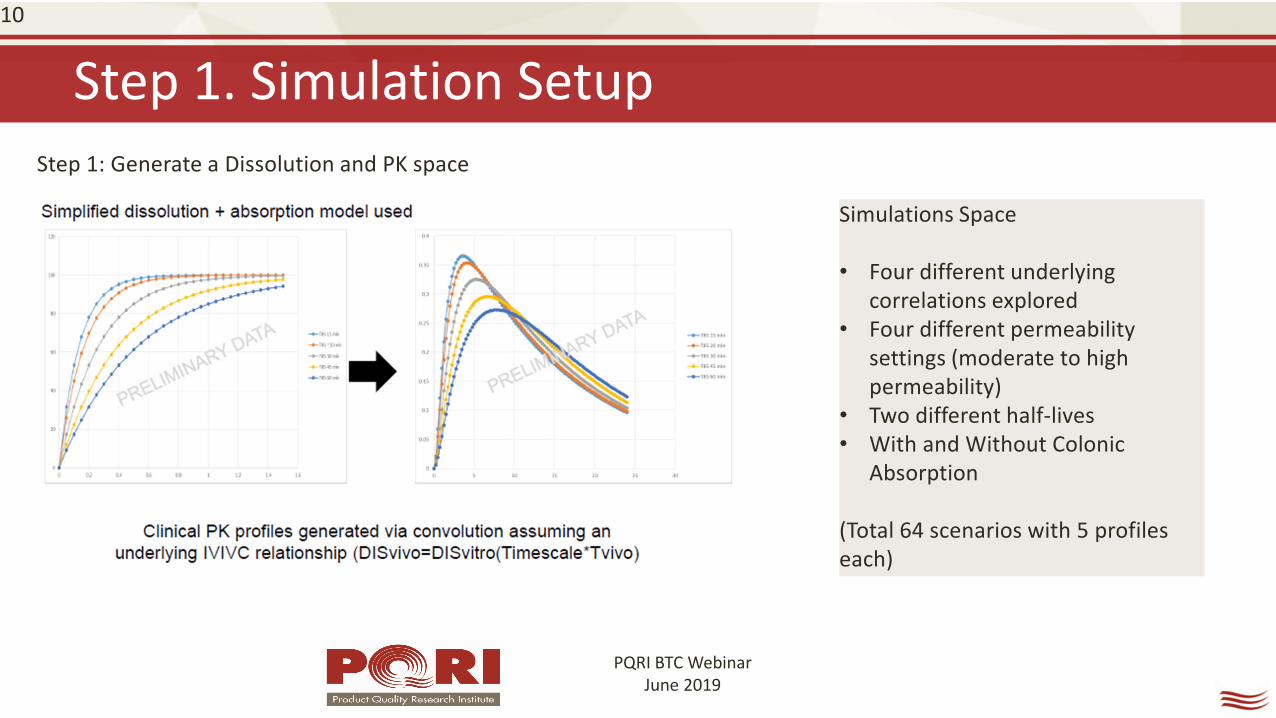
Step 1. Simulation Setup10
Simulations Space
• Four different underlying correlations explored
• Four different permeability settings (moderate to high permeability)
• Two different half-lives• With and Without Colonic
Absorption
(Total 64 scenarios with 5 profiles each)
Step 1: Generate a Dissolution and PK space

PQRI BTC WebinarJune 2019
Step 2. “Recover” Multiple Level C vs Level A IVIVC11
Step 2: Try to “recover” the Multiple Level C and Level A IVIVC using standard methodologies

PQRI BTC WebinarJune 2019
Step 3. Use derived model to project BE space12
Step 3: Project the BE space

PQRI BTC WebinarJune 2019
Overall Observations – “Safe space” a frequent outcome
• The majority of simulations conducted resulted in a “safe space” – i.e. difference between the fastest and slowest profile being less than 20%
• ALL scenarios simulated assuming a 1:1 correlation between in vitro and in vivo release rate resulted in safe space.
• Majority of scenarios for which meaningful PK differences (and thus potentially an IVIVC) were observed, were the ones with significant time scaling. These can be considered to represent relatively slow dissolving BCS II/IV compounds, including compounds with wetting issues.
13

PQRI BTC WebinarJune 2019
A case where both Level A and Level C IVIVC was seen14
Level A IVIVCObserved AUC Observed Cmax AUC %PE Cmax %PE
T85 15 min 2.08 0.33 -0.8% 2.8%T85 30 min 2.04 0.28 -1.4% -3.9%T85 45 min 1.91 0.25 -2.6% -2.5%
% PE for Cmax at each of the timepoints10 min 15 min 20 min 30 min 45 min
T85 15min
0.2% 0% 0.2% 0.7% 1.5%
T85 30min
1.4% 0.3% 0.6% 2.5% -5.2%
T85 45min
-0.5% -0.1% 0.3% 0.9% 0.9%
Sim 63-64: Very high permeability (10x10-4 cm/sec), time-scaling of 0.25 or 0.125, Tcutoff of 4 hrs (i.e. slow dissolving BCS II compound with limited colonic absorption)
Level C IVIVC:
Level A IVIVC:

PQRI BTC WebinarJune 2019
Differences between Level A and Level C model are small15

PQRI BTC WebinarJune 2019
A case where Level A failed but Level C “passed”16
Sim 55: Moderate permeability (1x10⁻⁴ cm/sec), time-scaling of 0.25, Tcutoff of 4 hrs (i.e. slow dissolving BCS IV compound with limited colonic absorption) The T85 15, 30 and 60 min formulations were used. While a successful Level A IVIVC was established for AUC (average error ~3%), it was not established for Cmax. Cmax prediction errors were just beyond those allowed in the IVIVC guidance (average error was 11%, individual errors 9%, 6% and 17%).

PQRI BTC WebinarJune 2019
Overall Observations – IVIVC successes 17
• Identification of the Level A IVIVC for at least Cmax was increasingly difficult with increasing permeability limitations.
• For low permeability (BCS IV) the Cmax model was not successfully established. The Multiple Level C was still successful.
• In general there were no significant differences observed between the Level A and the Multiple Level C estimations of BE; there was no clear bias that one provides more or less conservative/permissive bounds.
• It would appear that a Multiple Level C IVIVC is a reasonable (alternative to Level A) approach for application in estimating clinically relevant dissolution bounds for formulations where dissolution is the rate controlling factor to absorption.

A Real Life Multiple Level C Example
18
Time (hr)
0 12 24 36 48 60 72Mea
n Su
vore
xant
Pla
sma
Con
cent
ratio
n (µ
M)
0.0
0.2
0.4
0.6
0.8
1.0
1.2
1.4
1.6 Batch A: 14.8 kPaBatch C (Reference): 22.1 kPaBatch D: 32.0 kPaBatch E: 38.1 kPa
Time (min)
0 10 20 30 40 50 60
Suvo
rexa
nt %
Dis
solv
ed
0
20
40
60
80
100
Batch A: 14.8 kPaBatch C (Reference): 22.1 kPaBatch D: 32.0 kPaBatch E: 38.1 kPa
Formulations (manufactured by varying compression force) selected to cover a wide dissolution rangeAll dissolution curves outside F2 boundsNo meaningful differences in AUC observed – Modest Cmax differences seen
Kesisoglou F, Hermans A, Neu C, Yee KL, Palcza J, Miller J. Development of In Vitro-In Vivo Correlation for Amorphous Solid Dispersion Immediate-Release Suvorexant Tablets and Application to Clinically Relevant Dissolution Specifications and In-Process Controls. J Pharm Sci. 2015 Sep;104(9):2913-22.

Multiple Level C IVIVC for Dissolution
19

Use of IVIVC to Establish Clinically Relevant Dissolution Bounds
20

Can Multiple Level C be used to predict BE?
Bioequivalence study between strengths to support interchangeability (much faster dissolution for 15 vs 30 mg and 20 vs 40 mg tablets) IVIVC used to inform POS and power study (maximum 9.5% difference predicted based on 20 min dissolution)
21
AUC0-τ AUC0-inf Cmax Cmax IVIVC prediction
2x20 (n=59) vs 1x40 mg (n=60)
102.52% (99.09-106.07%)
102.33% (98.80-105.99%)
96.58% (90.96%-102.55%)
105.3%
2x15 (n=60) vs 1x30 mg (n=59)
99.71% (96.66%-102.85%)
99.66%(96.52%-102.91%)
108.74%(101.10%-116.95%)
109.5%

Part 2. Physiologically Based IVIVC Case Study
22

Traditional vs. PBPK IVIVC
23
Traditional IVIVC PBPK based IVIVC
Correlation is for the most part empirical Correlation is more mechanistic
Level A applicability/success rate largely for MR productsMultiple Level C models readily feasible for IR products
In principle same structural model suitable for both IR and MR products
Mostly successful with “well behaved” compounds Can accommodate more complex absorption processes
Due to empirical nature of correlation, Level A model difficult for IR products
Since dissolution is modeled more mechanistically, in principle higher POS for IR products
In vitro dissolution only product related input to models Model allows expansion to other CQAs/CMAs eg. API PSD
Due to empirical nature of correlation typically only uses data from a single controlled relative BA study
Due to more mechanistic nature of the model, may allow for incorporation of information from different studies
Available Regulatory Guidances and Reasonable Global Acceptability
No Regulatory Guidances – Acceptability primarily restricted to US

Case Study: Extended Release (ER) PBPK IVIVC
24
BCS IIIDose: 4 mgpKa: 1.75 (base); 10.95 (acid)Solubility: ~ 0.8 – 2 mg/ml (pH 1 – 10) LLC-PK1 Papp: ~ 9 X 10⁻⁶ cm/s
Kesisoglou F, Xia B, Agrawal NG. Comparison of Deconvolution-Based and Absorption Modeling IVIVC for Extended Release Formulations of a BCS III Drug Development Candidate. AAPS J. 2015 Nov;17(6):1492-500.

PK profiles for IR and ER Formulations
25

Level A Model Requires a Two-Step Correlation
26
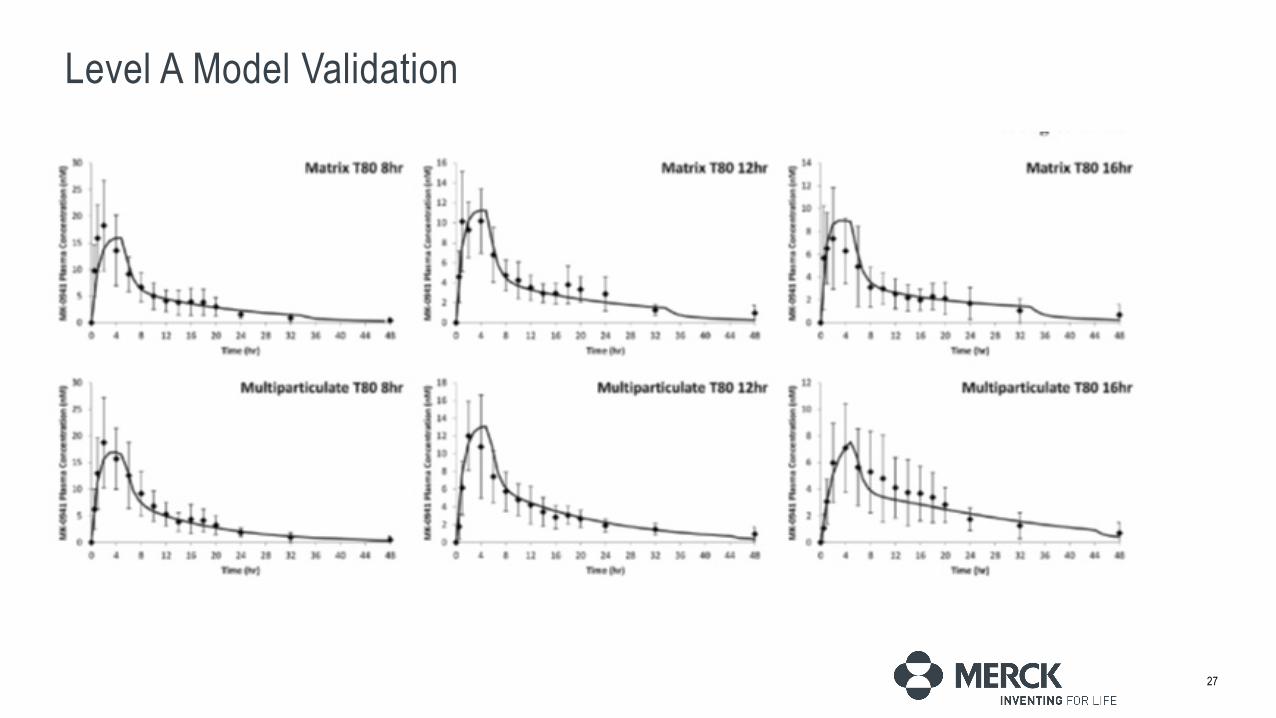
Level A Model Validation
27

Physiologically-Based IVIVC Strategy
•Fit Weibull Parameters Based on In Vitro Dissolution Profiles–Assumed 1:1 Relationship Between In Vitro and In Vivo Dissolution
•Optimize Regional Absorption/Permeability to Achieve an IVIVC•Models Separately Established for Matrix and MultiparticulateFormulations
•Assess Prediction Errors
28
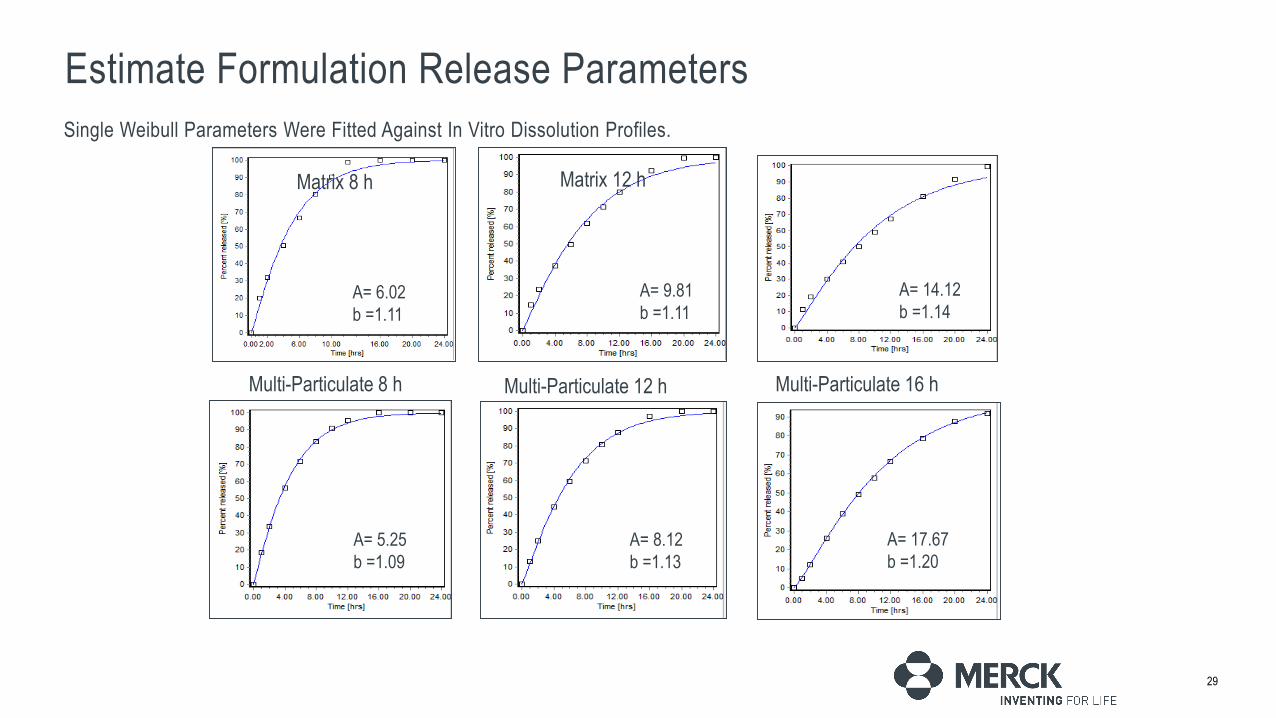
Estimate Formulation Release ParametersSingle Weibull Parameters Were Fitted Against In Vitro Dissolution Profiles.
29
A= 6.02b =1.11
Matrix 8 h Matrix 12 h
A= 9.81b =1.11
Matrix 16 h
A= 14.12b =1.14
Multi-Particulate 8 h Multi-Particulate 12 h Multi-Particulate 16 h
A= 5.25b =1.09
A= 8.12b =1.13
A= 17.67b =1.20

Optimize Regional Absorption Settings
30
Gastroplus Opt logD Model SA/V 6.1 User Optimized model
Optimized ASF (Permeability Modifier) Values Suggest Regional Absorption in Line with Preclinical Data. Exact Mechanism Not Known (Perhaps Related to Moderate Lipophilicity)

Project PK Profiles with Optimized Model
31

Assess Point Estimates and Deviations
32
FormulationsCmax (ng/mL) AUC0-last (ng*h/ml)
Observed Predicted PE(%) Observed Predicted PE(%)Matrix 8 hr 8.40 8.17 -2.7 81.01 74.72 -7.8Matrix 12hr 4.69 5.36 14.3 70.14 60.45 -13.8Matrix 16 hr 3.40 3.94 15.9 48.84 51.64 5.7
Matrix Average NA NA 11.0 NA NA 9.1Multiparticulate 8 hr 8.63 8.32 -3.6 92.12 87.67 -4.8Multiparticulate 12 hr 5.52 6.15 11.4 70.11 77.41 10.4Multiparticulate 16 hr 3.27 3.33 1.8 58.34 58.16 -0.31
Multiparticulate Average NA NA 3.2 NA NA 1.8

Case Study Summary
33
• A PBPK IVIVC Model was Successfully Developed for Both Matrix and MultiparticulateFormulations
• Prediction Errors Were Acceptable and Comparable to that Observed from a Deconvolution/Convolution IVIVC
• The PBPK Approach May Provide a More Physiological Relevance for the IVIVC, in this Case Linking the IVIVC to Regiodependent Absorption
• Increased Utilization of PBPK IVIVCs in the Future Will Advance the Field and Increase Acceptability of such Models

PBPK Absorption Modeling: Establishing the In Vitro–In Vivo Link—IndustryPerspective
34Stillhart C, Pepin X, Tistaert C, Good D, Van Den Bergh A, Parrott N, Kesisoglou F. PBPK Absorption Modeling: Establishing the In Vitro-In Vivo Link-Industry Perspective. AAPS J. 2019 Jan 23;21(2):19.

Acknowledgements
• PQRI BTC IVIVC WG: X. Zhang (US FDA), D. Sperry (Eli Lilly), D. Good (BMS), A. Narang (Genentech)• PQRI BTC members• C. Stillhart (Roche), X. Pepin (AZ), C. Tistaert (Janssen), D. Good (BMS), A. Van Den Bergh (Janssen), N.
Parrott N (Roche)• IQ Dissolution WG• Merck colleagues: A. Hermans, C. Neu, KL Yee, J Palcza, J Miller, B. Xia, N. Agrawal
35