the evolving theory of quality management: the role … there have been numerous case studies,...
TRANSCRIPT
The evolving theory of quality management:
The role of Six Sigma
Xingxing Zu a,*, Lawrence D. Fredendall b,1, Thomas J. Douglas c,2
a Department of Information Science & Systems, Morgan State University, Baltimore, MD 21251, United Statesb Department of Management, Clemson University, Clemson, SC 29634, United States
c Department of Management & Marketing, Southern Illinois University Edwardsville, Edwardsville, IL 62026, United States
Received 7 August 2006; received in revised form 21 January 2008; accepted 8 February 2008
Available online 16 February 2008
Abstract
While Six Sigma is increasingly implemented in industry, little academic research has been done on Six Sigma and its influence
on quality management theory and application. There is a criticism that Six Sigma simply puts traditional quality management
practices in a new package. To investigate this issue and the role of Six Sigma in quality management, this study reviewed both the
traditional quality management and Six Sigma literatures and identified three new practices that are critical for implementing Six
Sigma’s concept and method in an organization. These practices are referred to as: Six Sigma role structure, Six Sigma structured
improvement procedure, and Six Sigma focus on metrics. A research model and survey instrument were developed to investigate
how these Six Sigma practices integrate with seven traditional quality management practices to affect quality performance and
business performance. Test results based on a sample of 226 US manufacturing plants revealed that the three Six Sigma practices are
distinct practices from traditional quality management practices, and that they complement the traditional quality management
practices in improving performance. The implications of the findings for researchers and practitioners are discussed and further
research directions are offered.
# 2008 Elsevier B.V. All rights reserved.
Keywords: Quality Management; Six Sigma; Performance
www.elsevier.com/locate/jom
Available online at www.sciencedirect.com
Journal of Operations Management 26 (2008) 630–650
1. Introduction
Quality management (QM) has developed into a
mature field with sound definitional and conceptual
foundations (Sousa and Voss, 2002), but new QM
methods continue to grow. For example, Six Sigma,
which is ‘‘an organized and systematic method for
* Corresponding author. Tel.: +1 443 885 3837.
E-mail addresses: [email protected] (X. Zu),
[email protected] (L.D. Fredendall), [email protected]
(T.J. Douglas).1 Tel.: +1 864 656 2016.2 Tel.: +1 618 650 2731.
0272-6963/$ – see front matter # 2008 Elsevier B.V. All rights reserved.
doi:10.1016/j.jom.2008.02.001
strategic process improvement and new product and
service development that relies on statistical methods
and the scientific method to make dramatic reductions
in customer defined defect rates’’ (Linderman et al.,
2003, p. 194), generates intense interest in industry.
Since its initiation at Motorola in the 1980s, many
companies including GE, Honeywell, Sony, Caterpillar,
and Johnson Controls have adopted Six Sigma and
obtained substantial benefits (Pande et al., 2000; Snee
and Hoerl, 2003). However, Six Sigma is criticized as
offering nothing new and simply repackaging tradi-
tional QM practices (Clifford, 2001; Dalgleish, 2003;
Stamatis, 2000). It is argued that the large returns from
Six Sigma at some companies were due to the initial
X. Zu et al. / Journal of Operations Management 26 (2008) 630–650 631
quality level of these companies being so low that
anything would have drastically improved their quality
(Stamatis, 2000). Although there have been numerous
case studies, comprehensive discussions, books and
websites addressing Six Sigma, very little scholarly
research has been done on Six Sigma and its influence
on quality management theory and application (Goff-
nett, 2004; Schroeder et al., 2005).
This study explores what is new in Six Sigma by
identifying the practices that are critical for implement-
ing Six Sigma’s concept and method in an organization.
It then develops a model of how the Six Sigma practices
integrate with traditional QM practices to improve
performance. The model was tested using survey data
collected from 226 manufacturing plants in the US. The
empirical findings of this study strengthen our under-
standing of Six Sigma’s key practices and how it
complements traditional QM, and provide practitioners
with rigorous research-based answers about Six Sigma
implementation.
2. Theoretical development
Quality management is characterized by its princi-
ples, practices, and techniques (Dean and Bowen,
1994). The principles provide general guidelines, which
are implemented through the practices that are
themselves supported by multiple techniques (Dean
and Bowen, 1994). Empirical research that assesses QM
and what constitutes QM should be conducted at the
level of practices because the practices are the
observable facet of QM, and it is through them that
the QM implementation is accomplished and managers
work to achieve quality improvements (Sousa and Voss,
2002). Accordingly, in order to study Six Sigma and its
role in QM, this study focuses on identifying the
practices that are distinctively associated with Six
Sigma implementation and exploring their relationships
with traditional QM practices.
2.1. Traditional QM practices
There is substantial agreement in the literature
concerning what the key QM practices are (Sousa and
Voss, 2002). In this study, we examine seven traditional
QM practices that have been commonly investigated in
prior empirical QM research. These practices are top
management support, customer relationship, supplier
relationship, workforce management, quality informa-
tion, product/service design, and process management.
Since the seven traditional QM practices have been
extensively discussed in previous studies such as Flynn
et al. (1994, 1995) and Kaynak (2003), and in Nair’s
(2006) meta-analysis study, we will not discuss them in
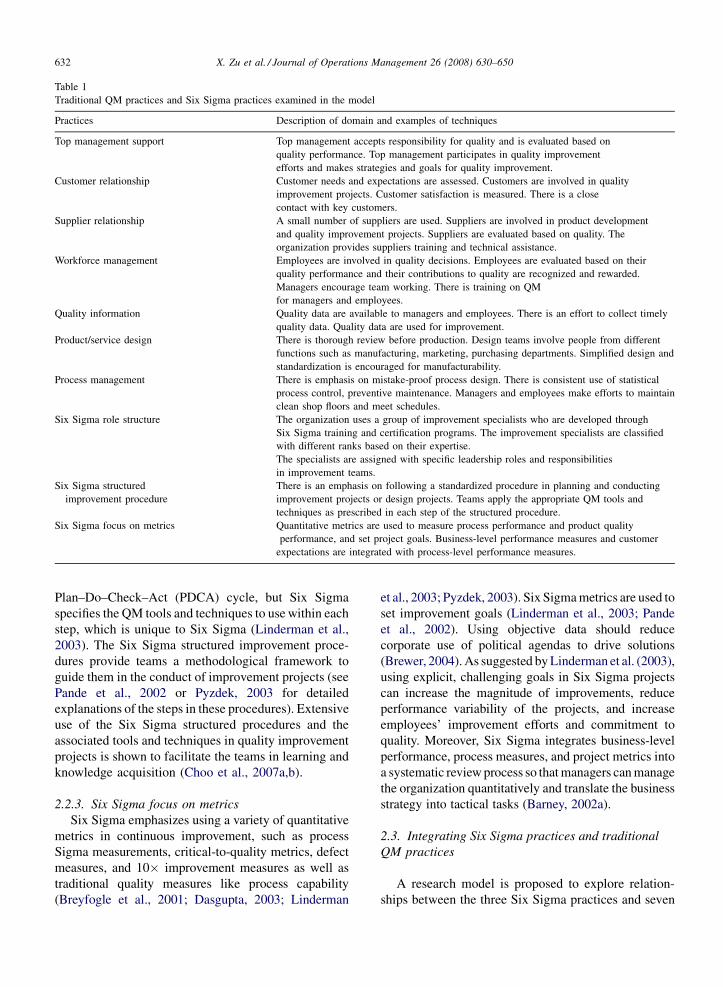
detail here. Table 1 offers a brief description of the
traditional QM practices as well as Six Sigma practices
which are discussed next.
2.2. Six Sigma practices
Based on a review of both research studies and
practitioner literature on Six Sigma, we identify three
practices that are critically associated with Six Sigma
implementation. These practices are Six Sigma role
structure, Six Sigma structured improvement proce-
dure, and Six Sigma focus on metrics.
2.2.1. Six Sigma role structure
Six Sigma uses a group of improvement specialists,
typically referred to as champions, master black belts,
black belts, and green belts (Henderson and Evans,
2000; Linderman et al., 2003). Those specialists receive
intensive differentiated training that is tailored for their
ranks and is designed to improve their knowledge and
skills in statistical methods, project management,
process design, problem-solving techniques, leadership
skill, and other managerial skills (Barney, 2002a;
Gowen and Tallon, 2005; Linderman et al., 2003; Snee
and Hoerl, 2003). With assigning the improvement
specialists to take different levels of roles and
responsibilities in leading the continuous improvement
efforts, the organization builds a Six Sigma role
structure for quality improvement. In the Six Sigma
role structure, there is a hierarchical coordination
mechanism of work for quality improvement across
multiple organizational levels (Sinha and Van de Ven,
2005). For example, the senior executives serve as
champions for making the organization’s strategic
improvement plans and black belts under them lead
Six Sigma projects and mentor green belts in problem
solving (Barney, 2002a,b; Sinha and Van de Ven, 2005).
This mechanism helps to coordinate and control work
across organizational levels to ensure that the tactical
tasks match with the overall business strategy (Sinha
and Van de Ven, 2005).
2.2.2. Six Sigma structured improvement procedure
Six Sigma applies a structured approach to managing
improvement activities, which is represented by
Define–Measure–Analyze–Improve–Control (DMAIC)
used in process improvement or Define–Measure–
Analyze–Design–Verify (DMADV) used in product/
service design improvement (Linderman et al., 2003).
Both of these procedures are grounded in the classic
X. Zu et al. / Journal of Operations Management 26 (2008) 630–650632
Table 1
Traditional QM practices and Six Sigma practices examined in the model
Practices Description of domain and examples of techniques
Top management support Top management accepts responsibility for quality and is evaluated based on
quality performance. Top management participates in quality improvement
efforts and makes strategies and goals for quality improvement.
Customer relationship Customer needs and expectations are assessed. Customers are involved in quality
improvement projects. Customer satisfaction is measured. There is a close
contact with key customers.
Supplier relationship A small number of suppliers are used. Suppliers are involved in product development
and quality improvement projects. Suppliers are evaluated based on quality. The
organization provides suppliers training and technical assistance.
Workforce management Employees are involved in quality decisions. Employees are evaluated based on their
quality performance and their contributions to quality are recognized and rewarded.
Managers encourage team working. There is training on QM
for managers and employees.
Quality information Quality data are available to managers and employees. There is an effort to collect timely
quality data. Quality data are used for improvement.
Product/service design There is thorough review before production. Design teams involve people from different
functions such as manufacturing, marketing, purchasing departments. Simplified design and
standardization is encouraged for manufacturability.
Process management There is emphasis on mistake-proof process design. There is consistent use of statistical
process control, preventive maintenance. Managers and employees make efforts to maintain
clean shop floors and meet schedules.
Six Sigma role structure The organization uses a group of improvement specialists who are developed through
Six Sigma training and certification programs. The improvement specialists are classified
with different ranks based on their expertise.
The specialists are assigned with specific leadership roles and responsibilities
in improvement teams.
Six Sigma structured
improvement procedure
There is an emphasis on following a standardized procedure in planning and conducting
improvement projects or design projects. Teams apply the appropriate QM tools and
techniques as prescribed in each step of the structured procedure.
Six Sigma focus on metrics Quantitative metrics are used to measure process performance and product quality
performance, and set project goals. Business-level performance measures and customer
expectations are integrated with process-level performance measures.
Plan–Do–Check–Act (PDCA) cycle, but Six Sigma
specifies the QM tools and techniques to use within each
step, which is unique to Six Sigma (Linderman et al.,
2003). The Six Sigma structured improvement proce-
dures provide teams a methodological framework to
guide them in the conduct of improvement projects (see
Pande et al., 2002 or Pyzdek, 2003 for detailed
explanations of the steps in these procedures). Extensive
use of the Six Sigma structured procedures and the
associated tools and techniques in quality improvement
projects is shown to facilitate the teams in learning and
knowledge acquisition (Choo et al., 2007a,b).
2.2.3. Six Sigma focus on metrics
Six Sigma emphasizes using a variety of quantitative
metrics in continuous improvement, such as process
Sigma measurements, critical-to-quality metrics, defect
measures, and 10� improvement measures as well as
traditional quality measures like process capability
(Breyfogle et al., 2001; Dasgupta, 2003; Linderman
et al., 2003; Pyzdek, 2003). Six Sigma metrics are used to
set improvement goals (Linderman et al., 2003; Pande
et al., 2002). Using objective data should reduce
corporate use of political agendas to drive solutions
(Brewer, 2004). As suggested by Linderman et al. (2003),
using explicit, challenging goals in Six Sigma projects
can increase the magnitude of improvements, reduce
performance variability of the projects, and increase
employees’ improvement efforts and commitment to
quality. Moreover, Six Sigma integrates business-level
performance, process measures, and project metrics into
a systematic review process so that managers can manage
the organization quantitatively and translate the business
strategy into tactical tasks (Barney, 2002a).
2.3. Integrating Six Sigma practices and traditional
QM practices
A research model is proposed to explore relation-
ships between the three Six Sigma practices and seven

X. Zu et al. / Journal of Operations Management 26 (2008) 630–650 633
Fig. 1. Proposed model of Six Sigma practices, traditional QM practices and performance.
traditional QM practices and their effects on perfor-
mance. To better illustrate the complex relationships of
these practices, this study adopts the classification of
infrastructure and core practices proposed by Flynn
et al. (1995), where the infrastructure practices are to
create an organizational environment supporting QM
implementation, and the core practices focus on
applying tools and techniques in continuous improve-
ment (Flynn et al., 1995; Sousa and Voss, 2002). As
shown in Fig. 1, the model starts with top management
support on the left to highlight the ultimate importance
of senior managers’ leadership and support for QM
implementation. The upper half consists of traditional
QM infrastructure practices (i.e., customer relation-
ship, supplier relationship, and workforce manage-
ment) and traditional QM core practices (i.e., quality
information, product/service design, and process
management). The lower half presents three Six Sigma
practices. Six Sigma role structure is considered as an
infrastructure practice in that it is part of human
resource infrastructure to assist the deployment of Six
Sigma (Antony, 2004; Breyfogle et al., 2001; Hender-
son and Evans, 2000; Pande et al., 2002). Six Sigma
structured improvement procedure and Six Sigma
focus on metrics are two core practices as they
represent the methodological elements of Six Sigma
by emphasizing use of scientific methods, statistical
tools, and quantitative metrics (Choo et al., 2007a;
Linderman et al., 2006). This model suggests that the
Six Sigma practices and traditional QM practices work
together to improve quality performance and business
performance.
2.3.1. Top management support
Top management support drives QM implementation
by providing direction and resources for quality
improvement (Ahire and O’Shaughnessy, 1998; Yeung
et al., 2005). Top management support reflects on
fostering a cooperative and learning environment
needed for QM implementation (Anderson et al.,
1994; Beer, 2003). The QM literature has found strong
empirical support for the effects of top management
support on traditional QM infrastructure practices such
as customer relationship, supplier relationship, and
workforce management. Top management support
nurtures customer relationship by inviting customers
to visit the plant and meeting with key customers,
providing resources for employees to visit customer
plants, requiring the collection of detailed information
about customer needs and expectations, and involving
customers in product design teams (Flynn et al., 1995).
A long-term cooperative relationship with suppliers is
possible only when top management prioritizes quality
and delivery performance over price in supplier
selection and retention policies, requires suppliers to
be certified for quality, and provides the assessment
tools for supplier quality (Flynn et al., 1995; Kaynak,
2003). Top management support facilitates workforce
management by allocating resources for training,
instituting a quality-based compensation policy, and
X. Zu et al. / Journal of Operations Management 26 (2008) 630–650634
supporting employee involvement (Ahire and
O’Shaughnessy, 1998; Anderson et al., 1995; Flynn
et al., 1995; Handfield et al., 1998; Kaynak, 2003).
Thus, it is suggested that:
H1a. Top management support is positively related to
the three traditional QM infrastructure practices.
Top management support is crucial in Six Sigma
implementation, as demonstrated by chief executives
such as Jack Welch of GE, Bob Galvin of Motorola, and
Lawrence Bossidy of AlliedSignal, who each led Six
Sigma implementation in their firm (Henderson and
Evans, 2000; Slater, 2000). Top management makes the
strategic decisions required for Six Sigma adoption (Lee
and Choi, 2006). Six Sigma role structure can only be
established if top management uses its authority and
power to integrate the Six Sigma black and green belt
system into the organization’s human infrastructure, to
adjust the performance appraisal and compensation
policy to incorporate Six Sigma performance, and to
provide resources for Six Sigma training (Antony and
Banuelas, 2002; Bhote, 2003; Breyfogle et al., 2001;
Hendricks and Kelbaugh, 1998). The support of top
management for Six Sigma role structure is suggested as:
H1b. Top management support is positively related to
the Six Sigma role structure.
Execution of the Six Sigma focus on metrics also
requires support from top management. Top manage-
ment sets its organization’s strategic visions and
objectives (Ahire and O’Shaughnessy, 1998). When
top management gives quality the highest priority
possible and demonstrates its commitment to quality by
providing adequate resources for quality improvement,
it conveys to employees in the organization the
philosophy that quality is critical (Ahire and O’Shaugh-
nessy, 1998). Especially, a mandate from top manage-
ment calling for Six Sigma helps to build the
organization-wide awareness of the importance of
using strict metrics and increase the employees’
commitment to achieving superior quality goals
(Linderman et al., 2003). Furthermore, Six Sigma
emphasizes the alignment of micro tactics with macro-
organizational strategy by using the Six Sigma metrics
to translate the organization’s strategic plans into
everyday operations (Barney, 2002a). Not all processes
need to operate at the Six Sigma level and the
appropriate target sigma level depends on the strategic
importance of the process and the cost of the
improvement relative to the benefit (Linderman et al.,
2003). Thus, how top management determines its
organization’s strategic objectives influences the
metrics and goals determined for the individual
improvement projects. It is then proposed that:
H1c. Top management support is positively related to
the Six Sigma focus on metrics.
2.3.2. Traditional QM infrastructure practices
In order to provide products and services that meet
customer needs and expectations, it is critical to
establish and maintain a close relationship with
customers (Hackman and Wageman, 1995). Open
communication with key customers allows companies
to quickly identify customers’ requirements and
determine whether these requirements are being met
and what improvement to make (Flynn et al., 1994;
Mohrman et al., 1995). The importance of having close
relationships with customers is demonstrated by
facilitating the collection and use of quality informa-
tion. When managers and employees have direct
contacts with customers, they can readily obtain first-
hand information about product and service quality and
use such information in making quality decision
(Mohrman et al., 1995). This suggests that:
H2a. Customer relationship is positively related to
quality information.
The creation of a partnership with key suppliers is
one major intervention that companies should make to
realize continuous improvement (Hackman and Wage-
man, 1995). When the buying firm involves its suppliers
in the product/service design process, the suppliers can
provide inputs about product or component simplifica-
tion and standardization and the capabilities of
prospective materials and parts (Flynn et al., 1995;
Forza and Flippini, 1998; Kaynak, 2003). Also, an
improved supplier relationship enhances process man-
agement through timely delivery of high quality
materials and parts (Kaynak, 2003). By selecting
suppliers based on quality, firms encourage the
suppliers to continuously improve their quality and
thus provide high quality parts, which helps to reduce
process variability due to purchased materials and parts
(Flynn et al., 1995). Thus, it is suggested that:
H2b. Supplier relationship is positively related to pro-
duct/service design.
H2c. Supplier relationship is positively related to pro-
cess management.
Workforce management develops competent and
committed employees who are loyal to the organiza-
tion’s goals of quality improvement (Flynn et al., 1994).
X. Zu et al. / Journal of Operations Management 26 (2008) 630–650 635
This practice includes a variety of human resource
management techniques including employee training
in QM principles and methods (Flynn et al., 1995;
Kaynak, 2003; Sila and Ebrahimpour, 2005),
employee involvement in quality decisions (Ahire
et al., 1996; Choi, 1995), recognition and compensa-
tion of employees’ contribution to quality improve-
ment (Daft, 1998), teamwork to solve problems (Daft,
1998; Flynn et al., 1995), communication to create an
awareness of organizational goals (Daft, 1998;
Kaynak, 2003), and employee fulfillment through
pride in workmanship, job satisfaction and job
commitment (Anderson et al., 1994, 1995). With a
well-trained and motivated workforce, a firm is more
likely to effectively improve its operations. There is
empirical evidence suggesting that workforce man-
agement directly affects the application of the three
traditional QM core practices. For example, workforce
management facilitates collection and use of quality
information by increasing employees’ continuous
awareness of quality-related issues (Kaynak, 2003)
and empowering employees in quality decision-
making (Flynn et al., 1995). The success of quality
improvement efforts in product/service design and
process management is dependent on the effectiveness
of the actual usage of QM tools, which is ensured by
management providing employees with rigorous
training and encouraging them to use the tools in
their job (Ahire and Dreyfus, 2000). Workforce
management also supports product/service design
and process management by promoting a team
problem-solving approach so that people from diverse
parts of the organization can provide inputs, which
helps to improve the manufacturability of the designed
products and to make process improvement proposals
(Flynn et al., 1995; Sila and Ebrahimpour, 2005).
Hence, the following hypothesis is proposed:
H2d. Workforce management is positively related to
the three traditional QM core practices.
2.3.3. Six Sigma infrastructure practice
As an infrastructure practice, the Six Sigma role
structure enhances the traditional workforce manage-
ment practice in five human resource management areas
that are considered important for QM: human resource
planning and management, employee involvement,
employee performance and recognition, employee
well-being and satisfaction, and employee education
and training (Dean and Bowen, 1994). The Six Sigma
role structure strengthens human resource planning and
management by offering a mechanism for employee
recruitment. QM requests firms to carefully recruit and
select potential employees in terms of their task-
oriented skills, their potential for working with a team,
their dedication to quality, and their motivation and
willingness to make improvements (Flynn et al., 1994).
Six Sigma black and green belt training and certification
is a useful mechanism to select and promote employees
with the above characteristics (Henderson and Evans,
2000). Six Sigma role structure also encourages
employees’ involvement in QM, offers recognition of
their good performance, and considers their interests
and satisfaction. Six Sigma connects employees’
promotion and rewards with the level of their Six
Sigma certifications and their involvement and achieve-
ment in Six Sigma projects (Henderson and Evans,
2000; Lee and Choi, 2006), which ignites the employ-
ees’ interest in quality improvement and increases their
commitment to the organization’s goal of high quality
(Linderman et al., 2003). Furthermore, Six Sigma’s
differentiated training augments traditional QM training
by tailoring the amount and content of training for
different levels of Six Sigma specialists to match their
tasks’ complexity so as to increase their capabilities of
solving complex problems, which helps to focus them
on challenging problems and increase the magnitude of
improvement efforts (Linderman et al., 2003). It thus
suggests that:
H3a. The Six Sigma role structure is positively related
to workforce management.
The Six Sigma role structure supports the use of Six
Sigma structured improvement procedure. As the
central part of Six Sigma knowledge body, the
DMAIC/DMADV procedures are often used as the
course outline for Six Sigma black and green belt
training, which reinforces their importance. This
training is given incrementally so that the trainees
apply it as they learn it. For example, after learning the
materials related to the ‘Define’ step, the trainees will
apply their knowledge to define an actual project
(Brewer, 2004). The intensive training teaches Six
Sigma black and green belts knowledge about the
structured procedures and develops their capability of
applying these procedures in real projects (Hendricks
and Kelbaugh, 1998). And, the black and green belts are
agents of change who spread Six Sigma philosophy
throughout the organization and have the responsibility
to teach other employees about Six Sigma (Antony and
Banuelas, 2002; Henderson and Evans, 2000). Their
leadership in the improvement teams will enhance the
application of Six Sigma structured improvement
procedure. This suggests that:

X. Zu et al. / Journal of Operations Management 26 (2008) 630–650636
H3b. The Six Sigma role structure is positively related
to the Six Sigma structured improvement procedure.
2.3.4. Traditional QM core practices
The QM literature has emphasized the importance of
availability, accuracy, and timeliness of quality infor-
mation (Flynn et al., 1994; Forza and Flippini, 1998;
Saraph et al., 1989; Sila and Ebrahimpour, 2005).
Quality information means to systematically collecting
data at every point in a problem-solving cycle to
identify critical problems, analyze their root causes, and
generate solutions (Hackman and Wageman, 1995).
Effective use of quality information affects quality
performance by providing accurate and timely informa-
tion about product and service quality and process
performance to facilitate management of supplier
relationship, product/service design, and process man-
agement. To help suppliers improve quality, firms need
to create a database about the suppliers’ performance
regarding material quality, on-time delivery, process
capability, purchase costs and pricing, etc., so that
managers and employees can identify and solve
problems from supplied materials and parts and provide
the suppliers timely and important feedbacks to
improve their performance (Kaynak, 2003). Product/
service design requires a wide range of quality
information from purchasing, marketing, manufactur-
ing, design, customers and suppliers in order to design
quality into products (Kaynak, 2003). Process manage-
ment is dependent on employees to collect and analyze
data at the source to take immediate problem-solving
action, to collect data about costs of poor quality (e.g.,
rework, scrap and warranty costs) to share feedback
about quality performance, and to use control charts to
identify quality problems and provide information on
the areas that need improvement (Flynn et al., 1994;
Kaynak, 2003). Thus, the following hypotheses are
proposed:
H4a. Quality information is positively related to sup-
plier relationship.
H4b. Quality information is positively related to pro-
duct/service design.
H4c. Quality information is positively related to pro-
cess management.
Systematic management of information and data
resources is also important to Six Sigma, which is itself
a data-driven approach to eliminating defects and
wastes in business processes (Gowen and Tallon, 2005;
Kwak and Anbari, 2004; Lee and Choi, 2006).
Execution of the Six Sigma focus on metrics relies
on the availability of accurate and timely quality
information because quality metrics can only be used to
reliably gauge processes and determine improvement
goals when they are calculated using good data (Antony,
2004; Breyfogle et al., 2001; Henderson and Evans,
2000; Pande et al., 2002). According to Linderman et al.
(2003), goal-setting starts in the early phases of a Six
Sigma project with data being collected for calculation
of baseline process performance measures like defects
per million opportunities or Process Sigma, which will
be the basis for establishing explicit goals. Accurate and
timely data help to determine the appropriate improve-
ment goals to ensure teams obtain the optimal
investment of time and effort in the improvement
endeavor (Linderman et al., 2003). In addition, it is
necessary to have a database about current quality
performance, customer needs and expectations, and
firm performance to tie the process-level outputs to the
market requirements and the firm’s financial perfor-
mance so that sufficient, better informed strategies can
be made to addresses customer satisfaction and the
firm’s profitability. The above discussion suggests that:
H4d. Quality information is positively related to the
Six Sigma focus on metrics.
Product/service design and process management are
the two primary practices that directly contribute to
improved quality performance as identified in the QM
literature (e.g., Ahire and Dreyfus, 2000; Flynn et al.,
1995; Kaynak, 2003), though they have different
focuses in terms of their targets of improvement,
visibility, and techniques (Ahire and Dreyfus, 2000).
Product/service design focuses on improving product
design performance with simplified designs and
standardized components, and incorporating customer
needs and expectations to reduce engineering changes
and quality problems, which will reduce the costs of
scrap and rework, increase product reliability, and
improve customer satisfaction (Ahire and Dreyfus,
2000; Flynn et al., 1995; Forza and Flippini, 1998;
Kaynak, 2003). On the other hand, process management
strives for improving manufacturing techniques and
processes by designing mistake-proof processes to
reduce process variation (Flynn et al., 1995; Saraph
et al., 1989); by using preventive maintenance to
increase machine reliability and to reduce production
interruptions which leads to improved productivity
(Kaynak, 2003); and by identifying and correcting
quality problems immediately which reduces reworks
and waste (Ahire and Dreyfus, 2000; Forza and Flippini,
1998). Accordingly, the following hypotheses are
proposed:
X. Zu et al. / Journal of Operations Management 26 (2008) 630–650 637
H4e. Product/service design is positively related to
quality performance.
H4f. Process management is positively related to qual-
ity performance.
Prior research also recognizes the synergy between
product/service design and process management on
quality improvement (Ahire and Dreyfus, 2000).
Specifically, effective product/service design supports
process management by designing reliable and manu-
factureable products and using simplified and standar-
dized components in products, which helps to reduce
process complexity and process variance and thus leads
to more efficient process management (Flynn et al.,
1995; Kaynak, 2003). Also, Ahire and Dreyfus (2000)
suggest that in firms with good design efforts, members
of cross-functional design teams often execute process
improvement projects as well so that their knowledge,
experience and attitudes toward teamwork, cooperation
and customer focus will be extended into the on-going
efforts of tracking and improving the quality of
manufacturing processes. Thus, it is suggested that:
H4g. Product/service design is positively related to
process management.
2.3.5. Six Sigma core practices
The Six Sigma structured improvement procedure is
expected to support product/service design and process
management. Both product/service design and process
management practices involve using different manage-
rial and technical tools and their effectiveness is
dependent on how well teams actually use these tools
(Ahire and Dreyfus, 2000). The DMAIC/DMADV
procedures offer a standardized approach for the teams
to follow, and prescribe appropriate tools to use at each
step, as well as systematic project management tools,
which enhances their problem-solving ability (Antony
and Banuelas, 2002; Choo et al., 2004; Kwak and
Anbari, 2004). In addition, these structured procedures
guide the teams search for solutions to complicated
problems by breaking complex tasks into elementary
components to reduce task complexity so that the teams
can be focused, which will increase their productivity
(Linderman et al., 2003, 2006). Likewise, the use of Six
Sigma metrics is more effective and efficient when
teams follow the structured procedures in conducting
Six Sigma projects. These procedures not only entail a
‘measure’ step to identify measurable customer
requirements and to develop baseline defect measures,
but also request using metrics throughout the project,
e.g., from determining project goals in the ‘define’ step
to establishing on-going process measures to continu-
ously control the key processes in the ‘control’ step
(Pande et al., 2002). Linderman et al. (2006) found that
when teams strictly follow the DMAIC steps and
faithfully complete each step, they are more likely to
meet the project goals, especially those challenging
goals, and to achieve improved project performance.
Thus, the following hypotheses are proposed:
H5a. The Six Sigma structured improvement proce-
dure is positively related to product/service design.
H5b. The Six Sigma structured improvement proce-
dure is positively related to process management.
H5c. The Six Sigma structured improvement proce-
dure is positively related to the Six Sigma focuses on
metrics.
The Six Sigma focus on metrics enhances product/
service design and process management by providing
quantitative objective measures to examine product
quality and process variability. During design for Six
Sigma, teams use quantitative metrics to define and
measure customer satisfaction and then incorporate the
identified critical-to-customer characteristics into the
design of products and production processes (Creveling
et al., 2003). These metrics can be used to track the
product through its entire life cycle to provide feedback
about product quality. Likewise, the process improve-
ment teams can use the metrics to evaluate the process
targeted in their projects and to closely monitor the
process over time, which increases the visibility of
quality problems and allows the teams to quickly respond
if needed (Pande et al., 2002; Snee and Hoerl, 2003).
And, as Six Sigma metrics can measure different types of
processes and functions, the teams may benchmark
different processes to identify more improvement
opportunities (Dasgupta, 2003). Moreover, as mentioned
earlier, Six Sigma metrics are used to set specific goals of
improvement projects. Linderman et al. (2003) suggest
that using the specific goals will encourage team
members to make more effort, to be more persistent in
their tasks, and to focus on more relevant activities to
accomplish improvement objectives. Thus, it is expected
that by practicing Six Sigma focus on metrics, there will
be more consistent efforts from employees to execute the
activities related to improving product design quality and
process quality. The effects of the Six Sigma focus on
metrics on product/service design and process manage-
ment are proposed as:
H5d. The Six Sigma focus on metrics is positively
related to product/service design.
X. Zu et al. / Journal of Operations Management 26 (2008) 630–650638
H5e. The Six Sigma focus on metrics is positively
related to process management.
2.3.6. Quality performance and business
performance
Garvin’s (1984) quality performance model suggests
that quality performance affects business performance
through two routes—the manufacturing route and the
marketing route (Sousa and Voss, 2002). In the
manufacturing route, improved quality performance
results in fewer defects, lower scrap and rework rates,
less waste, and more dependable processes, which lead
to lower manufacturing costs, lower warranty and
liability costs, higher efficiency and productivity, and
increased return on assets and profitability (Handfield
et al., 1998; Kaynak, 2003; Reed et al., 1996). In the
marketing route, improved quality increases customer
satisfaction that leads to increased sales and larger
market share (Ahire and Dreyfus, 2000; Choi and
Eboch, 1998; Handfield et al., 1998). By providing high
quality products and services, the firm has less elastic
demand and can charge higher prices, which brings
about more profits (Kaynak, 2003; Sousa and Voss,
2002). It is thus expected that:
H6. Quality performance is positively related to busi-
ness performance.
3. Research methods
3.1. Construction of survey instrument
Measures for each construct were obtained from a
review of the relevant literature. Validated measures
from extant empirical studies on QM were used to
evaluate traditional QM practices (e.g., Anderson
et al., 1995; Douglas and Judge, 2001; Flynn et al.,
1994, 1995; Kaynak, 2003). Measures of quality and
business performance were adapted from empirical
research on QM and performance (e.g., Choi and
Eboch, 1998; Douglas and Judge, 2001; Flynn et al.,
1995; Kaynak, 2003; Powell, 1995; Reed et al., 1996;
Samson and Terziovski, 1999). New measures were
developed to evaluate three Six Sigma practices. Due
to limited empirical research on Six Sigma, we
reviewed both practitioner publications (e.g., Bhote,
2003; Breyfogle et al., 2001; George, 2003; Pande
et al., 2000, 2002) and academic studies (Choo et al.,
2004; Linderman et al., 2003; Schroeder, 2000) to
create new items. Items were measured on 7-point
Likert scales with end points of ‘‘strongly disagree
(=1)’’ and ‘‘strongly agree (=7).’’
The initial instrument was reviewed by faculty in
operations management and strategic management for
comprehensibility and accuracy. Then, the question-
naire was pre-tested by seven quality managers who had
5–20 years of experience in implementing QM in
manufacturing plants. Each manager first filled out the
questionnaire, and then the manager discussed with
the researchers the issues including how well each scale
captured the construct that it was intended to measure,
whether the wording of each item was clear and
understandable, and whether the format was user
friendly. Using their feedback, the instrument was
revised further to ensure that the questionnaire was
comprehensive, understandable and valid from these
experts’ perspective. The items entering the survey are
listed in Appendices A and B.
3.2. Data collection
A target sample of 878 US manufacturing plants
(SIC codes of 20–39) was selected from the directory of
the American Society for Quality (ASQ) and the
Thomas Register. The research unit was an individual
plant because specific QM practices are carried out at
the plant level and the practices in different plants, even
those within the same company, may vary substantially
(Flynn et al., 1995). The respondents included plant
managers, operations managers, quality managers, Six
Sigma master black belts and black belts. The
instrument was administered as a web-based survey.
Following Dillman’s (2000) total design methodology,
four rounds of emails with a link to the web survey were
sent to the target sample, and responses were received
from a total of 226 plants resulting in an overall 26%
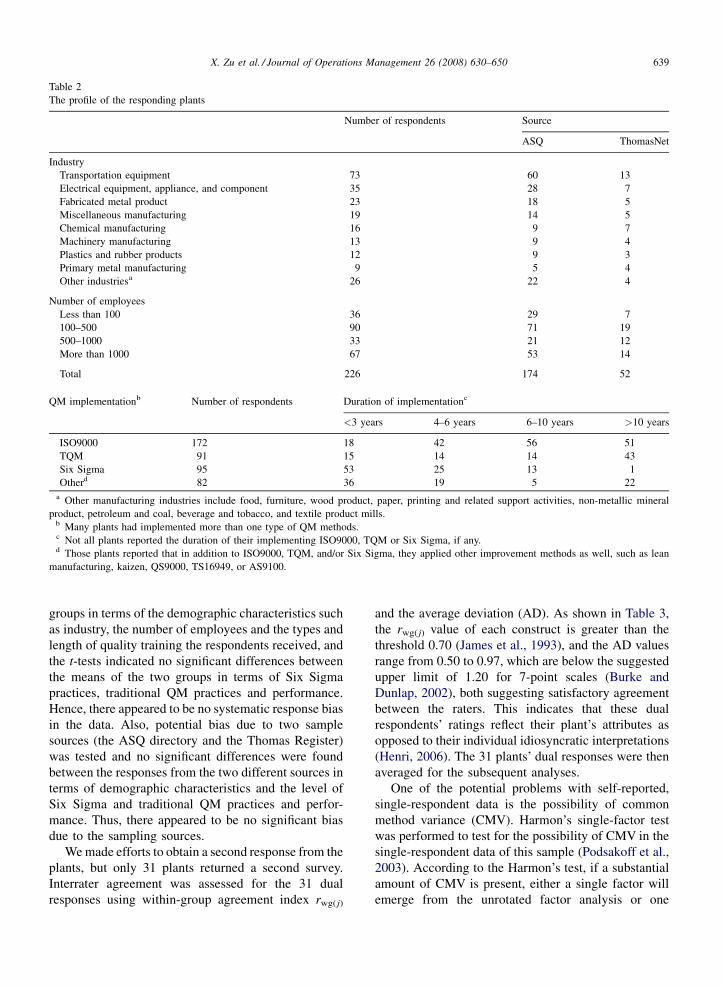
response rate. As shown in Table 2, the sample included
plants from a wide range of manufacturing industries
and the majority had over 100 employees. The
responding plants had been involved in a formal quality
improvement effort: most plants had implemented
ISO9000, TQM, and/or Six Sigma, and many plants
reported that they also applied other improvement
methods such as lean manufacturing, kaizen, QS9000,
TS16949, or AS9100.
To assess non-response bias, this study tested the
differences between the early and late respondents
(Armstrong and Overton, 1977; Kaynak, 2003). The
final sample was split into two, depending on the dates
they were received. The early group consisted of 161
replies received before the fourth email, while the late
group included 65 replies received after the fourth
email. The x2 tests showed that there were no
statistically significant differences between the two
X. Zu et al. / Journal of Operations Management 26 (2008) 630–650 639
Table 2
The profile of the responding plants
Number of respondents Source
ASQ ThomasNet
Industry
Transportation equipment 73 60 13
Electrical equipment, appliance, and component 35 28 7
Fabricated metal product 23 18 5
Miscellaneous manufacturing 19 14 5
Chemical manufacturing 16 9 7
Machinery manufacturing 13 9 4
Plastics and rubber products 12 9 3
Primary metal manufacturing 9 5 4
Other industriesa 26 22 4
Number of employees
Less than 100 36 29 7
100–500 90 71 19
500–1000 33 21 12
More than 1000 67 53 14
Total 226 174 52
QM implementationb Number of respondents Duration of implementationc
<3 years 4–6 years 6–10 years >10 years
ISO9000 172 18 42 56 51
TQM 91 15 14 14 43
Six Sigma 95 53 25 13 1
Otherd 82 36 19 5 22
a Other manufacturing industries include food, furniture, wood product, paper, printing and related support activities, non-metallic mineral
product, petroleum and coal, beverage and tobacco, and textile product mills.b Many plants had implemented more than one type of QM methods.c Not all plants reported the duration of their implementing ISO9000, TQM or Six Sigma, if any.d Those plants reported that in addition to ISO9000, TQM, and/or Six Sigma, they applied other improvement methods as well, such as lean
manufacturing, kaizen, QS9000, TS16949, or AS9100.
groups in terms of the demographic characteristics such
as industry, the number of employees and the types and
length of quality training the respondents received, and
the t-tests indicated no significant differences between
the means of the two groups in terms of Six Sigma
practices, traditional QM practices and performance.
Hence, there appeared to be no systematic response bias
in the data. Also, potential bias due to two sample
sources (the ASQ directory and the Thomas Register)
was tested and no significant differences were found
between the responses from the two different sources in
terms of demographic characteristics and the level of
Six Sigma and traditional QM practices and perfor-
mance. Thus, there appeared to be no significant bias
due to the sampling sources.
We made efforts to obtain a second response from the
plants, but only 31 plants returned a second survey.
Interrater agreement was assessed for the 31 dual
responses using within-group agreement index rwg( j)
and the average deviation (AD). As shown in Table 3,
the rwg( j) value of each construct is greater than the
threshold 0.70 (James et al., 1993), and the AD values
range from 0.50 to 0.97, which are below the suggested
upper limit of 1.20 for 7-point scales (Burke and
Dunlap, 2002), both suggesting satisfactory agreement
between the raters. This indicates that these dual
respondents’ ratings reflect their plant’s attributes as
opposed to their individual idiosyncratic interpretations
(Henri, 2006). The 31 plants’ dual responses were then
averaged for the subsequent analyses.
One of the potential problems with self-reported,
single-respondent data is the possibility of common
method variance (CMV). Harmon’s single-factor test
was performed to test for the possibility of CMV in the
single-respondent data of this sample (Podsakoff et al.,
2003). According to the Harmon’s test, if a substantial
amount of CMV is present, either a single factor will
emerge from the unrotated factor analysis or one

X. Zu et al. / Journal of Operations Management 26 (2008) 630–650640
Tab
le3
Des
crip
tive
stat
isti
csan
din
terr
ater
agre
emen
t,u
nid
imen
sio
nal
ity,
reli
abil
ity,
and
dis
crim
inan
tval
idit
yte
sts
Fac
tor
Mea
n/S
.D.
r wg(j
)A
ver
age
AD
CF
I1
23
45
67
89
10
11
12
1T
op
man
agem
ent
support
5.0
9/1
.55
0.8
30.5
40.9
80.9
5a
2C
ust
om
erre
lati
onsh
ip5.7
1/1
.17
0.8
70.5
00.9
90.5
6b,
184.8
5c
0.8
4
3S
uppli
erre
lati
onsh
ip3.8
7/1
.46
0.8
10.6
20.9
80.5
8,
190.5
20.4
0,
226.7
10.8
3
4W
ork
forc
em
anag
emen
t4.9
8/1
.38
0.8
30.6
30.9
40.7
7,
138.0
00.6
2,
156.4
30.6
4,
158.9
10.9
1
5Q
ual
ity
info
rmat
ion
5.4
6/1
.47
0.8
70.9
70.9
80.6
2,
507.5
80.5
5,
195.0
50.4
8,
236.6
80.7
1,
249.1
10.9
6
6P
roduct
/ser
vic
edes
ign
4.6
7/1
.45
0.8
20.6
70.9
90.6
8,
203.7
80.3
9,
241.5
50.6
5,
135.6
60.7
0,
170.6
50.5
5,
279.7
60.8
7
7P
roce
ssm
anag
emen
t5.0
4/1
.19
0.8
00.6
00.9
30.7
1,
163.2
80.4
1,
229.9
00.6
3,
139.9
50.7
8,
103.9
20.6
9,
184.4
70.7
4,
102.5
70.8
6
8S
Sro
lest
ruct
ure
3.4
0/1
.98
0.8
90.7
80.9
70.4
0,
675.7
20.1
8,
286.5
50.4
2,
253.7
60.4
5,
398.0
10.3
0,
1034.1
60.4
9,
311.0
20.3
9,
335.1
60.9
8
9S
Sst
ruct
ure
dpro
cedure
4.6
6/1
.80
0.9
10.5
50.9
90.6
1,
517.1
60.3
5,
260.6
40.6
0,
193.8
00.6
4,
290.5
40.5
1,
676.0
20.7
0,
196.6
30.5
8,
250.1
70.7
1,
65
9.8
50.9
7
10
SS
focu
son
met
rics
4.9
3/1
.56
0.8
70.5
90.9
60.6
9,
441.7
60.4
0,
246.6
90.5
7,
207.1
90.6
7,
268.8
70.6
4,
545.1
10.7
1,
190.5
80.6
8,
186.0
10.7
3,
641.4
20.5
3,
871.0
00.9
6
11
Qual
ity
per
form
ance
5.1
4/1
.20
0.9
10.5
30.9
80.6
50.4
60.6
10.6
30.5
30.6
30.7
00.5
80.4
00.7
90.9
3
12
Busi
nes
sper
form
ance
5.2
1/1
.45
0.9
00.5
40.9
50.4
20.2
40.3
40.4
30.3
10.3
50.3
80.3
80.4
00.5
00.5
9,
435.8
40.9
2
aV
alues
on
the
dia
gonal
are
the
com
posi
tere
liab
ilit
yes
tim
ates
.b
Val
ues
repre
sent
biv
aria
teco
rrel
atio
nfo
rth
efa
ctors
.c
Val
ues
repre
sentx
2dif
fere
nce
sbet
wee
nea
chunco
nst
rain
edm
odel
and
const
rain
edm
odel
.
general factor will account for the majority of the
covariance among the measures (Podsakoff et al.,
2003). The three Six Sigma factors and seven traditional
QM factors were each factor analyzed with the quality
performance factor and the business performance
factor, respectively (Kaynak and Hartley, 2006). The
results show that two factors emerged for each case. To
further evaluate the presence of CMV, we conducted
confirmatory factor analysis (CFA) to compare x2
difference between a single-factor model where all the
measurement items were loaded onto a single factor and
a model where the measurement items were loaded onto
the factor which they were intended to measure. EQS
6.1 was used throughout the study to test the CFA
models and later the structural model. A significant
difference (change in x2 = 3523.09 for 66 degrees of
freedom) was found between the single-factor model
and the proposed model. Although the above tests do
not completely eliminate the possibility of CMV, the
results indicates that single-respondent, self-report bias
does not appear to be a major problem in this study.
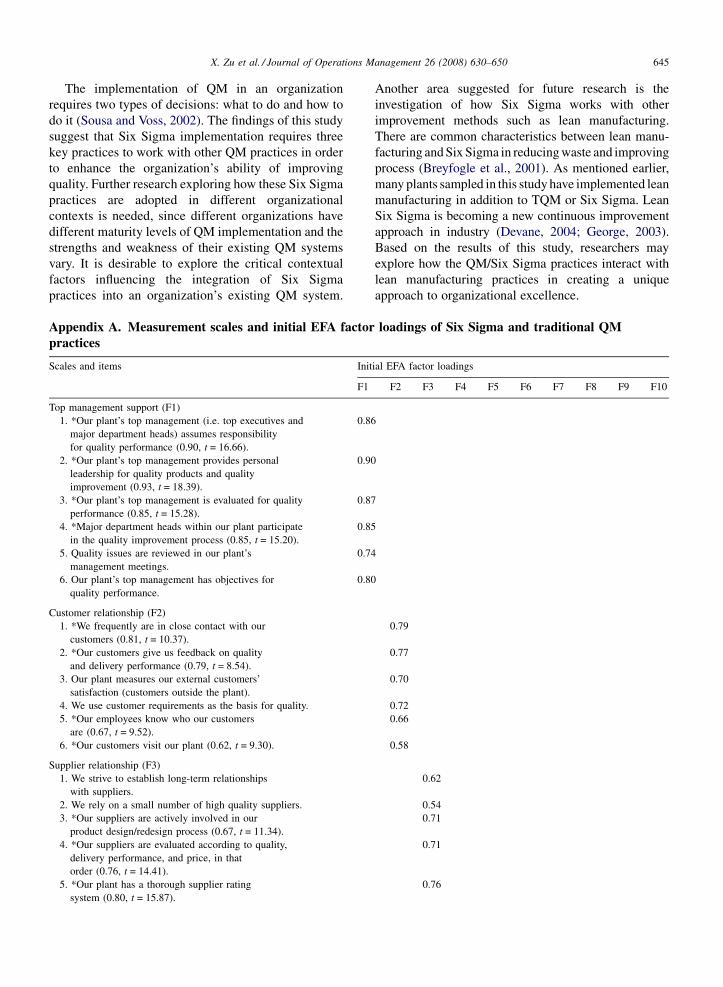
3.3. Factor analysis of Six Sigma practices and
traditional QM practices
In order to examine whether the Six Sigma practices
are distinct factors from the traditional QM practices,
we conducted exploratory factor analysis (EFA) on the
set of measurement items of the Six Sigma and
traditional QM practices. EFA was run using a principal
axis factoring analysis with promax rotation, and the
assessment of eigenvalues and scree test indicated ten
factors: the items measuring the Six Sigma practices
loaded onto three factors and the items measuring the
traditional QM practices loaded onto the other seven
factors. The items’ initial EFA loadings on their factors
are shown in Appendix A.
Next, CFA was performed to further evaluate these
ten factors. Multiple goodness-of-fit indices were
utilized, including the ratio of x2 to degrees of freedom,
comparative fit index (CFI), non-normed fit index
(NNFI), standardized root mean square residual
(SRMR) and root mean square error of approximation
(RMSEA) (Kline, 2004). In the light of recommended
values of fit indices (Byrne, 1998; Hu and Bentler,
1999), the ten-factor CFA model of Six Sigma and
traditional QM practices had a good fit to the data: x2
per degree of freedom (2256.18/1494) = 1.51, less than
2; CFI = 0.92, NNFI = 0.91, both greater than 0.90;
SRMR = 0.050, lower than 0.08; and RMSEA = 0.048,
lower than 0.06. Thus, the above EFA and CFA results
suggest that in addition to the seven traditional QM
X. Zu et al. / Journal of Operations Management 26 (2008) 630–650 641
practices, the three Six Sigma practices identified in this
study are implemented as distinctive practices in
industry.
3.4. Tests for measurement model
The measurement items of Six Sigma practices,
traditional QM practices, and quality and business
performance were evaluated for unidimensionality,
reliability and validity. For each construct, a CFA model
was run to assess its unidimensionality. All the CFA
models had a CFI of value higher than 0.90, indicating an
adequate model fit and thus satisfactory unidimension-
ality of the scales (Al-Hawari et al., 2005). Composite
reliability of these scales was then estimated using
weighted omega, which provides a realistic reliability
assessment for latent factors measured by multiple items
because it considers that the items are not equally loaded
onto the factor (Bacon et al., 1995). All the scales had a
composite reliability estimate above 0.75, suggesting
high construct reliability (Nahm et al., 2004).
Prior to testing the structural equation model, CFA
was performed on the entire set of measurement items
simultaneously (Anderson and Gerbing, 1988; Byrne,
1998). The measurement model was assessed by
examining the goodness-of-fit indices, factor loadings,
standardized residuals, and modification indices. The
process of evaluating the measurement model resulted
in deleting several items. These items were deleted
iteratively based on the criteria such as large
standardized residuals, modification indices, or factor
loadings less than 0.50 (Byrne, 1998; Kaynak, 2003;
Nahm et al., 2004). Before deleting a particular item,
the item and respective construct were evaluated to
assure that the loss of the item would not jeopardize the
integrity of the construct (Nahm et al., 2004). The
retained items are indicated in Appendices A and B.
Unidimensionality and composite reliability of each
construct were re-assessed and showed satisfactory
results (Table 3). The resulting measurement model had
an adequate model-to-data fit: x2 per degree of freedom
(2128.06/1418) = 1.50, CFI = 0.92, NNFI = 0.91,
SRMR = 0.050, and RMSEA = 0.047.
Based on the measurement model, convergent validity
and discriminant validity were assessed. Convergent
validity is demonstrated when the relationships between
the items and the construct are significant, i.e., t-values
are greater than 1.96 at the level of 0.05 (Al-Hawari et al.,
2005). In addition, a high standardized factor loading of
0.50 or higher, ideally 0.70 or higher, provides strong
evidence of convergent validity (Hair et al., 2005). In the
measurement model, all the items had significant factor
loadings, most of them greater than 0.70, suggesting
adequate convergent validity. Discriminant validity was
tested by conducting x2 difference tests between the
constrained model that sets the correlation between any
two factors at 1 and the unconstrained model that freely
estimates the correlation (Anderson and Gerbing, 1988).
A series of x2 difference tests were performed for the
three Six Sigma factors and seven traditional QM factors
with the significance a level adjusted to 0.0011 (0.05/45)
by dividing a by the number of tests performed (Kaynak
and Hartley, 2006). Similarly, discriminant validity
between two performance factors was examined. In
Table 3, the x2 difference tests between all pairs of factors
are significant (a significantly lower x2 value for the
unconstrained model), indicating strong discriminant
validity (Hair et al., 2005). Additionally, an instrument
has discriminant validity if the correlations between
different factors are lower than the reliability coefficients
(Crocker and Algina, 1986; Ghiselli et al., 1981). Table 3
shows that the correlations between the factors are all
lower than their composite reliability estimates, provid-
ing further evidence of discriminant validity.
3.5. Tests for structural model
A structural model was tested to examine the
relationships among Six Sigma practices, traditional
QM practices and performance. The model (Fig. 2) had
an adequate fit to the data: x2 per degree of freedom
(2242.33/1458) = 1.54, CFI = 0.91, NNFI = 0.90,
SRMR = 0.077, and RMSEA = 0.049. As shown in
Fig. 2, the R2 for the dependent factors range from 0.34
to 0.75, indicating that a large percentage of the
variance in the dependent factors is explained by the
independent factors. In the model, most proposed
relationships are supported, though several relation-
ships are not statistically significant. The non-signifi-
cant relationships are those between quality information
and product/service design, between quality informa-
tion and process management, between Six Sigma
structured procedure and product/service design,
between Six Sigma structured procedure and process
management, and between product/service design and
process management. The implications of the test
results are discussed next.
4. Discussion and conclusions
4.1. Theoretical implications
This study identified three new Six Sigma practices –
the Six Sigma role structure, the Six Sigma structured

X. Zu et al. / Journal of Operations Management 26 (2008) 630–650642
Fig. 2. Final model of Six Sigma practices, traditional QM practices and performance. *P < 0.10, **P < 0.05, ***P < 0.01.
improvement procedure, and the Six Sigma focus on
metrics – and developed a model to investigate how
these Six Sigma practices integrate with seven
traditional QM practices. The findings of this study
suggest a synergy between the Six Sigma practices and
traditional QM practices in improving quality perfor-
mance. This corroborates the view that QM practices
work as an integrated, interdependent system to achieve
competitive advantage (e.g., Flynn et al., 1995; Kaynak,
2003; Yeung et al., 2005). The structural model suggests
important paths by which the Six Sigma practices and
traditional QM practices complement each other in
improving performance as discussed below.
The QM literature has unanimously emphasized the
importance of top management support for QM (Beer,
2003; Yeung et al., 2005). This study once again
confirms that top management support is critical for
traditional QM and it is also important for Six Sigma.
Top management support directly supports the Six
Sigma role structure and the Six Sigma focus on metrics
as well as three traditional QM infrastructure practices.
The success of executing substantial changes required
for Six Sigma deployment relies on whether top
management understands and accepts Six Sigma
principles and whether they are willing to support
and enable the restructuring of the organization’s
policies (Antony and Banuelas, 2002; Lee and Choi,
2006).
The Six Sigma role structure’s support for workforce
management is a significant finding. It suggests the
potential of using Six Sigma to enhance traditional
human resource management practices, particularly in
the areas of human resource planning and management,
training, and employee recognition. Employee selection
has received little attention in QM research (Dean and
Bowen, 1994), however selection and planning of
employees, especially leaders, for continuous improve-
ment is critical for companies to achieve competitive
advantage (Schroeder et al., 2005). Establishment of the
Six Sigma role structure assists firms in recruiting the
right people with the requisite technical skills and
personality traits, and then developing them with
training and deploying them in leadership roles with
executive coaching to enhance their chances of success
in quality improvement. The black and green belt
system is used as a vehicle to develop the future leaders
in some firms (Schroeder et al., 2005). The Six Sigma
specialists have an organization-wide view of contin-
uous improvement and an in-depth knowledge of the
business processes and QM tools and methods. Such
human resource is rare and difficult to imitate and thus
is a critical resource for the firm to achieve sustainable
competitive advantage (Barney and Wright, 1998;
Gowen and Tallon, 2005; Saa-Perez and Garcıa-Falcon,
2002).
The Six Sigma role structure also supports the
structured improvement procedure. And, indirectly,
through its influence on workforce management and the
Six Sigma structured procedure, the Six Sigma role
structure affects all three traditional QM core practices
and the practice of the Six Sigma focus on metrics as
well. This supports the argument that not only does Six
Sigma receive support from traditional QM practices,
but also it adds a new element to the QM infrastructure.
This study found that customer relationship directly
affects quality information, and supplier relationship
directly affects product/service design and process
management. The significant relationships between
X. Zu et al. / Journal of Operations Management 26 (2008) 630–650 643
these practices are consistent with the findings of prior
studies such as Forza and Flippini (1998), Kaynak
(2003), and Mohrman et al. (1995). Quality information
is then found to have direct effects on supplier
relationship and Six Sigma focus on metrics. These
findings indicate that cooperation with external custo-
mers and suppliers continues to be very important, even
with Six Sigma. Firms that focus on satisfying their
customers’ needs and expectations are able to collect
comprehensive, accurate and timely information and
use the information to generate appropriate perfor-
mance measures and in working with their suppliers in
product design and process improvement.
Neither quality information nor the Six Sigma
structured improvement procedure has a direct effect on
product/service design or process management, but
those two practices are found to have a significant effect
on the Six Sigma focus on metric which in turn directly
affects product/service design and process manage-
ment. Therefore, at the level of core practices, the Six
Sigma focus on metrics mediates the effects of quality
information and structured procedure on product/
service design and process management. This finding
highlights the importance of data and objective
measurement in quality improvement. It is important
to gather quality information, but this information needs
to be gathered and used within an environment that
values the use of objective metrics. Using the Six Sigma
structured procedure ensures that teams use data and
metrics during the process of solving quality problems.
Moreover, such integration of Six Sigma core and
traditional QM core practices corroborates the impor-
tant role of goals (which is defined by various Six Sigma
metrics) in continuous improvement as promoted by
Linderman et al. (2003, 2006). Linderman et al. (2006)
found that goals can be effective in Six Sigma
improvement projects when the teams adhere to
rigorous application of QM tools and method. This
study further illustrates that when firms make efforts to
collect accurate and timely quality data and apply the
structured procedure as the paradigm of conducting
improvement projects, they are more likely to better use
Six Sigma metrics to monitor and motivate continuous
improvement activities, which finally will lead to more
effective product/service design and process manage-
ment practices.
Product/service design and process management are
shown to be the two practices that directly affect quality
performance. This finding reinforces the suggestion by
Ahire and Dreyfus (2000) that in order to achieve
superior quality outcomes, firms need to balance their
design and process management efforts and persevere
with the long-term implementation of these efforts.
However, unlike studies by Kaynak (2003) and Ahire
and Dreyfus (2000), this study did not find support for
the direct effect of product/service design on process
management. Flynn et al. (1995) suspected that product
design process would be significantly related to a
measure of the degree of process control present, rather
than a measure of the use of process improvement
practices. However, our process management scale
measured the use of various process improvement
practices, which did not reflect the impact of effective
design on manufacturability and process stability
(Flynn et al., 1995). Additional research examining
the influence of design management on process
management would be valuable.
Overall, the structural model suggests the impor-
tance of a sound QM foundation for effective adoption
of the new Six Sigma practices in the organization and
the potential of implementing the Six Sigma practices to
enhance its existing QM system. And, it shows that the
Six Sigma practices and traditional QM practices work
together to generate improved quality performance,
which then leads to higher business performance. While
there have been doubts about QM’s return on the
investment, more recent research found that effective
implementation of QM practices will contribute to
better financial, marketing, and even innovation
performance by improving quality performance and/
or operational performance (Kaynak, 2003; Nair, 2006;
Prajogo and Sohal, 2003; Sila and Ebrahimpour, 2005;
Sousa and Voss, 2002; Yeung et al., 2005). This study
adds to the literature by providing further evidence that
investments in QM/Six Sigma benefit an organization’s
bottom-line by significantly improving product and
service quality.
4.2. Managerial implications
This study investigates the question about whether
Six Sigma is simply a repackaging of traditional QM
methods or provides a new approach to improving
quality and organizational excellence. This question has
created some confusion about Six Sigma (Goffnett,
2004), and also put managers in a dilemma: on one
hand, if they do not adopt Six Sigma because it is
considered to be the same as traditional QM methods,
their company may lose the opportunity to gain
substantial benefits as GE and other companies
practicing Six Sigma have achieved from their Six
Sigma efforts; on the other hand, if Six Sigma is
different, there lacks solid answer to what are the new
practices that the company needs to implement to
X. Zu et al. / Journal of Operations Management 26 (2008) 630–650644
improve the current QM system (Schroeder et al.,
2008).
The empirical findings of this study help to clarify
the relationship of Six Sigma and traditional QM. Six
Sigma is grown out of traditional QM methods and
many traditional QM practices are recognized as
important for Six Sigma implementation (Bhote,
2003; Breyfogle et al., 2001; Gale, 2003; Henderson
and Evans, 2000; Hendricks and Kelbaugh, 1998; Lee
and Choi, 2006; Pyzdek, 2003; Schroeder et al., 2008).
However, Six Sigma does not eliminate the traditional
QM practices, nor does it simply repackage them. The
conceptual foundation and the empirical evidence
included in this study suggest that Six Sigma offers
managers three additional practices that augment the
traditional QM practices and provide new paths to
quality improvement.
The three Six Sigma practices identified in this study
suggests that the deployment of Six Sigma entails
establishing a Six Sigma role structure within the
organization’s human resource management system,
instituting the structured improvement procedure as a
formal paradigm of conducting improvement projects,
and emphasizing using quantitative objective metrics in
quality improvement. Managers can use the scales
developed in this study to assess the status of how each
of these practice is implemented in their organization.
Items in each scale of the Six Sigma practices may be
used as a preliminary checklist of the important areas
for the managers to address or the goals for the
organization to pursue when implementing that
practice.
The integrated model in this study then reveals some
important areas that managers need to consider when
they implement the Six Sigma practices in their
organization. Top management support directly affects
the implementation of Six Sigma role structure and Six
Sigma focus on metrics, which suggests that for
successful adoption of Six Sigma, it is critical that
top management accepts the concept of Six Sigma and
is willing to allocate resources to adapt the organiza-
tional structure, policies, and processes for Six Sigma.
At the level of infrastructure practices, managers may
complement the traditional workforce management
practice with the Six Sigma role structure to augment
their organization’s ability in developing employees for
continuous improvement. At the level of core practices,
it is important to emphasize using the Six Sigma
structured improvement procedure and performance
metrics to motivate and guide improvement activities in
product design and process management with the
supply of timely and accurate quality information.
4.3. Limitations
This study is subject to several limitations. First, the
majority of the data were gathered from a single
respondent of each plant, and thus common method
variance may be present in the results. Although
statistical tests indicated that common method variance
does not appear to be a major problem in this study,
future work should attempt to gather data from multiple
informants to provide a more accurate assessment of
construct validity and the relationship of the factors
(Ketokivi and Schroeder, 2004), and/or gather objective
performance data when possible (Kaynak and Hartley,
2006). Second, considering that the institution of QM
practices in an organization is a long-term process, the
time-frame for performance measures was set to be 3-
years in the questionnaire, but the data showed that
while most plants responding in the survey had
implemented ISO9000 and/or TQM for more than 3
years, over half of the plants practicing Six Sigma had
only implemented it for less than 3 years. While this is
not surprising because Six Sigma is a relatively new
method, we acknowledge that the outcomes of Six
Sigma implementation may not be fully revealed in the
reported performance. As Six Sigma gains acceptance
in industry, research can further examine the influence
of Six Sigma implementation on performance by
obtaining larger samples of firms with more experience
on Six Sigma.
4.4. Conclusions and future research
Despite the limitations discussed above, this study
contributes to the scholarly research beginning to
examine Six Sigma. Schroeder et al. (2008) started with
a definition of Six Sigma and its underlying theory to
argue that although the Six Sigma tools and techniques
appear similar to prior QM approaches, Six Sigma
provides an organizational structure not previously
seen. Schroeder et al. proposed that four relevant
constructs or elements of Six Sigma such as parallel-
meso structure, improvement specialists, structured
method, and performance metrics contribute to Six
Sigma’s performance. Correspondingly, this study
identified three Six Sigma practices which are
consistent with three of the four elements suggested
by Schroeder et al. (2008). Furthermore, this study used
a large-scale survey to test these Six Sigma practices
and their relationships with traditional QM practices,
and we found empirical support for these Six Sigma
constructs and their importance to QM and performance
improvement, which can provide a basis for more
research on Six Sigma.
X. Zu et al. / Journal of Operations Management 26 (2008) 630–650 645
The implementation of QM in an organization
requires two types of decisions: what to do and how to
do it (Sousa and Voss, 2002). The findings of this study
suggest that Six Sigma implementation requires three
key practices to work with other QM practices in order
to enhance the organization’s ability of improving
quality. Further research exploring how these Six Sigma
practices are adopted in different organizational
contexts is needed, since different organizations have
different maturity levels of QM implementation and the
strengths and weakness of their existing QM systems
vary. It is desirable to explore the critical contextual
factors influencing the integration of Six Sigma
practices into an organization’s existing QM system.
Appendix A. Measurement scales and initial EFA factor
practices
Scales and items Init
F1
Top management support (F1)
1. *Our plant’s top management (i.e. top executives and
major department heads) assumes responsibility
for quality performance (0.90, t = 16.66).
0.86
2. *Our plant’s top management provides personal
leadership for quality products and quality
improvement (0.93, t = 18.39).
0.90
3. *Our plant’s top management is evaluated for quality
performance (0.85, t = 15.28).
0.87
4. *Major department heads within our plant participate
in the quality improvement process (0.85, t = 15.20).
0.85
5. Quality issues are reviewed in our plant’s
management meetings.
0.74
6. Our plant’s top management has objectives for
quality performance.
0.80
Customer relationship (F2)
1. *We frequently are in close contact with our
customers (0.81, t = 10.37).
2. *Our customers give us feedback on quality
and delivery performance (0.79, t = 8.54).
3. Our plant measures our external customers’
satisfaction (customers outside the plant).
4. We use customer requirements as the basis for quality.
5. *Our employees know who our customers
are (0.67, t = 9.52).
6. *Our customers visit our plant (0.62, t = 9.30).
Supplier relationship (F3)
1. We strive to establish long-term relationships
with suppliers.
2. We rely on a small number of high quality suppliers.
3. *Our suppliers are actively involved in our
product design/redesign process (0.67, t = 11.34).
4. *Our suppliers are evaluated according to quality,
delivery performance, and price, in that
order (0.76, t = 14.41).
5. *Our plant has a thorough supplier rating
system (0.80, t = 15.87).
Another area suggested for future research is the
investigation of how Six Sigma works with other
improvement methods such as lean manufacturing.
There are common characteristics between lean manu-
facturing and Six Sigma in reducing waste and improving
process (Breyfogle et al., 2001). As mentioned earlier,
many plants sampled in this study have implemented lean
manufacturing in addition to TQM or Six Sigma. Lean
Six Sigma is becoming a new continuous improvement
approach in industry (Devane, 2004; George, 2003).
Based on the results of this study, researchers may
explore how the QM/Six Sigma practices interact with
lean manufacturing practices in creating a unique
approach to organizational excellence.
loadings of Six Sigma and traditional QM
ial EFA factor loadings
F2 F3 F4 F5 F6 F7 F8 F9 F10
0.79
0.77
0.70
0.72
0.66
0.58
0.62
0.54
0.71
0.71
0.76
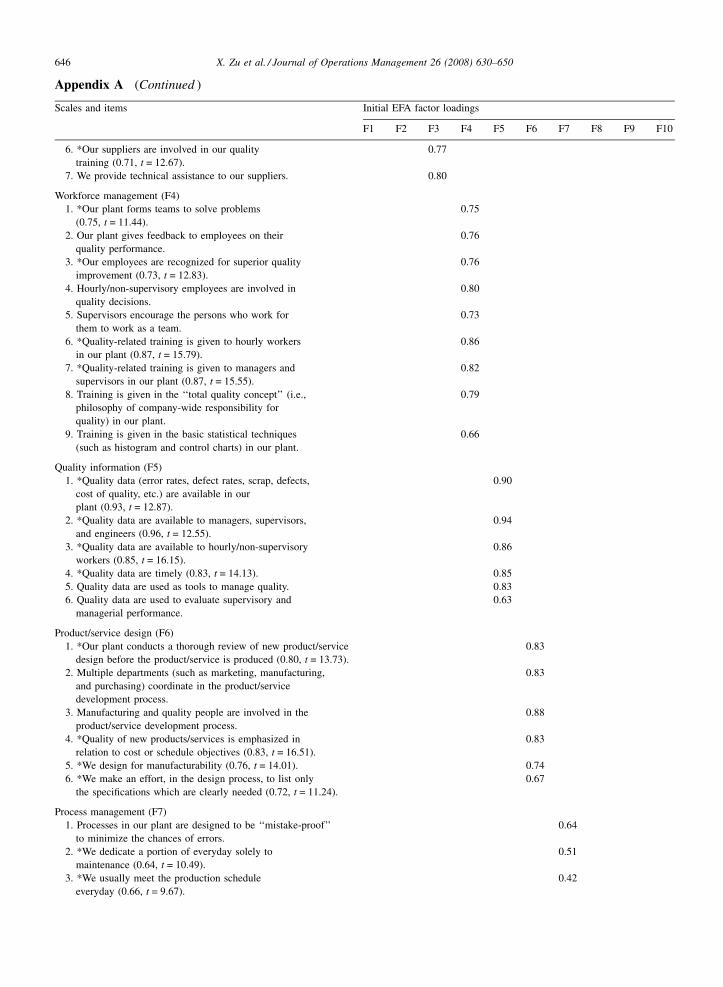
X. Zu et al. / Journal of Operations Management 26 (2008) 630–650646
Appendix A (Continued )
Scales and items Initial EFA factor loadings
F1 F2 F3 F4 F5 F6 F7 F8 F9 F10
6. *Our suppliers are involved in our quality
training (0.71, t = 12.67).
0.77
7. We provide technical assistance to our suppliers. 0.80
Workforce management (F4)
1. *Our plant forms teams to solve problems
(0.75, t = 11.44).
0.75
2. Our plant gives feedback to employees on their
quality performance.
0.76
3. *Our employees are recognized for superior quality
improvement (0.73, t = 12.83).
0.76
4. Hourly/non-supervisory employees are involved in
quality decisions.
0.80
5. Supervisors encourage the persons who work for
them to work as a team.
0.73
6. *Quality-related training is given to hourly workers
in our plant (0.87, t = 15.79).
0.86
7. *Quality-related training is given to managers and
supervisors in our plant (0.87, t = 15.55).
0.82
8. Training is given in the ‘‘total quality concept’’ (i.e.,
philosophy of company-wide responsibility for
quality) in our plant.
0.79
9. Training is given in the basic statistical techniques
(such as histogram and control charts) in our plant.
0.66
Quality information (F5)
1. *Quality data (error rates, defect rates, scrap, defects,
cost of quality, etc.) are available in our
plant (0.93, t = 12.87).
0.90
2. *Quality data are available to managers, supervisors,
and engineers (0.96, t = 12.55).
0.94
3. *Quality data are available to hourly/non-supervisory
workers (0.85, t = 16.15).
0.86
4. *Quality data are timely (0.83, t = 14.13). 0.85
5. Quality data are used as tools to manage quality. 0.83
6. Quality data are used to evaluate supervisory and
managerial performance.
0.63
Product/service design (F6)
1. *Our plant conducts a thorough review of new product/service
design before the product/service is produced (0.80, t = 13.73).
0.83
2. Multiple departments (such as marketing, manufacturing,
and purchasing) coordinate in the product/service
development process.
0.83
3. Manufacturing and quality people are involved in the
product/service development process.
0.88
4. *Quality of new products/services is emphasized in
relation to cost or schedule objectives (0.83, t = 16.51).
0.83
5. *We design for manufacturability (0.76, t = 14.01). 0.74
6. *We make an effort, in the design process, to list only
the specifications which are clearly needed (0.72, t = 11.24).
0.67
Process management (F7)
1. Processes in our plant are designed to be ‘‘mistake-proof’’
to minimize the chances of errors.
0.64
2. *We dedicate a portion of everyday solely to
maintenance (0.64, t = 10.49).
0.51
3. *We usually meet the production schedule
everyday (0.66, t = 9.67).
0.42
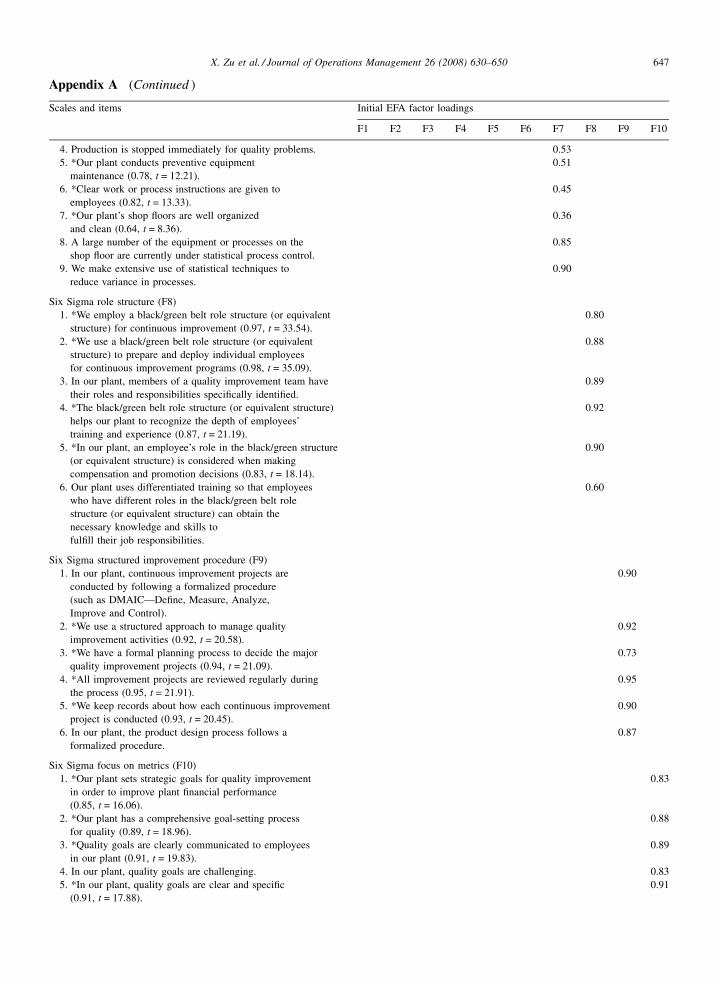
X. Zu et al. / Journal of Operations Management 26 (2008) 630–650 647
Appendix A (Continued )
Scales and items Initial EFA factor loadings
F1 F2 F3 F4 F5 F6 F7 F8 F9 F10
4. Production is stopped immediately for quality problems. 0.53
5. *Our plant conducts preventive equipment
maintenance (0.78, t = 12.21).
0.51
6. *Clear work or process instructions are given to
employees (0.82, t = 13.33).
0.45
7. *Our plant’s shop floors are well organized
and clean (0.64, t = 8.36).
0.36
8. A large number of the equipment or processes on the
shop floor are currently under statistical process control.
0.85
9. We make extensive use of statistical techniques to
reduce variance in processes.
0.90
Six Sigma role structure (F8)
1. *We employ a black/green belt role structure (or equivalent
structure) for continuous improvement (0.97, t = 33.54).
0.80
2. *We use a black/green belt role structure (or equivalent
structure) to prepare and deploy individual employees
for continuous improvement programs (0.98, t = 35.09).
0.88
3. In our plant, members of a quality improvement team have
their roles and responsibilities specifically identified.
0.89
4. *The black/green belt role structure (or equivalent structure)
helps our plant to recognize the depth of employees’
training and experience (0.87, t = 21.19).
0.92
5. *In our plant, an employee’s role in the black/green structure
(or equivalent structure) is considered when making
compensation and promotion decisions (0.83, t = 18.14).
0.90
6. Our plant uses differentiated training so that employees
who have different roles in the black/green belt role
structure (or equivalent structure) can obtain the
necessary knowledge and skills to
fulfill their job responsibilities.
0.60
Six Sigma structured improvement procedure (F9)
1. In our plant, continuous improvement projects are
conducted by following a formalized procedure
(such as DMAIC—Define, Measure, Analyze,
Improve and Control).
0.90
2. *We use a structured approach to manage quality
improvement activities (0.92, t = 20.58).
0.92
3. *We have a formal planning process to decide the major
quality improvement projects (0.94, t = 21.09).
0.73
4. *All improvement projects are reviewed regularly during
the process (0.95, t = 21.91).
0.95
5. *We keep records about how each continuous improvement
project is conducted (0.93, t = 20.45).
0.90
6. In our plant, the product design process follows a
formalized procedure.
0.87
Six Sigma focus on metrics (F10)
1. *Our plant sets strategic goals for quality improvement
in order to improve plant financial performance
(0.85, t = 16.06).
0.83
2. *Our plant has a comprehensive goal-setting process
for quality (0.89, t = 18.96).
0.88
3. *Quality goals are clearly communicated to employees
in our plant (0.91, t = 19.83).
0.89
4. In our plant, quality goals are challenging. 0.83
5. *In our plant, quality goals are clear and specific
(0.91, t = 17.88).
0.91

X. Zu et al. / Journal of Operations Management 26 (2008) 630–650648
Appendix A (Continued )
Scales and items Initial EFA factor loadings
F1 F2 F3 F4 F5 F6 F7 F8 F9 F10
6. *Our plant translates customers’ needs and expectation
into quality goals (0.88, t = 17.33).
0.87
7. We make an effort to determine the appropriate measures
for each quality improvement project.
0.90
8. *In our plant, measures for quality performance are connected
with the plant’s strategic quality goals (0.91, t = 19.93).
0.93
9. The expected financial benefits of a quality improvement
project are identified during the project planning phase.
0.79
10. Financial performance (e.g., cost savings, sales) is
part of the criteria for evaluating the outcomes of
quality improvements in our plant.
0.74
11. We assess the performance of core processes
against customers’ requirements.
0.78
12. *The measures for quality performance are connected
with critical-to-quality (CTQ) characteristics (0.71, t = 13.90).
0.75
13. *Our plant systematically uses a set of measures
(such as defects per million opportunities, sigma level,
process capability indices, defects per unit, and
yield) to evaluate process improvements (0.79, t = 17.15).
0.80
The items marked with * were retained after testing the measurement models. The first value in parenthesis for each retained item indicates the
standardized factor loading. The second value is the t-value.
Appendix B. Measurement scales for quality performance and business performance
Quality performance
1. *The quality of our plant’s products and services has been improved over the past 3 years (0.85, t = 12.15).
2. *The process variability in our plant has decreased over the past 3 years (0.80, t = 13.85).
3. *The delivery of our products and services has been improved over the past 3 years (0.86, t = 14.05).
4. *The cost of scrap and rework as a % of sales has decreased over the past 3 years (0.77, t = 12.80).
5. *The cycle time (from receipt of raw materials to shipment of finished products) has decreased over the past 3 years
(0.73, t = 11.66).
6. *Customer satisfaction with the quality of our products and services has increased over the past 3 years (0.85,
t = 14.67).
7. *The equipment downtime in our plants has decreased over the past 3 years (0.72, t = 11.19).
Business performance
1. *Our plant’s sales have grown over the past 3 years (0.80, t = 11.40).
2. *Our market share has grown over the past 3 years (0.80, t = 11.85).
3. The unit cost of manufacturing has decreased over the past 3 years.
4. *Our plant’s operating income has grown over the past 3 years (0.91, t = 14.45).
5. Our plant’s profits have grown over the past 3 years.
6. *Return on assets of our plant has increased over the past 3 years (0.90, t = 16.62).

X. Zu et al. / Journal of Operations Management 26 (2008) 630–650 649
References
Ahire, S.L., Dreyfus, P., 2000. The impact of design management and
process management on quality: an empirical examination. Jour-
nal of Operations Management 18, 549–575.
Ahire, S.L., O’Shaughnessy, K.C., 1998. The role of top management
commitment in quality management: an empirical analysis of the
auto parts industry. International Journal of Quality Science 31, 5–
37.
Ahire, S.L., Golhar, D.Y., Waller, M.A., 1996. Development and
validation of TQM implementation constructs. Decision Sciences
27, 23–56.
Al-Hawari, M., Hartley, N., Ward, T., 2005. Measuring banks’ auto-
mated service quality: a confirmatory factor analysis approach.
Marketing Bulletin 16, 1–19.
Anderson, J.C., Gerbing, D.W., 1988. Structural equation modeling in
practice: a review and recommended two-step approach. Psycho-
logical Bulletin 103 (3), 411–423.
Anderson, J.C., Rungtusanatham, M., Schroeder, R.G., 1994. A theory
of quality management underlying the Deming management
method. Academy of Management Review 19, 472–509.
Anderson, J.C., Rungtusanatham, M., Schroeder, R.G., Devaraj, S.,
1995. A path analytic model of a theory of quality management
underlying the Deming Management Method: preliminary empiri-
cal findings. Decision Sciences 26, 637–658.
Antony, J., 2004. Some pros and cons of Six Sigma: an academic
perspective. The TQM Magazine 16 (4), 303–306.
Antony, J., Banuelas, R., 2002. Key ingredients for the effective
implementation of a Six Sigma program. Measuring Business
Excellence 6 (4), 20–27.
Armstrong, J.S., Overton, T.S., 1977. Estimating non-response bias in
mail surveys. Journal of Marketing Research 14 (3), 396–402.
Bacon, D.R., Sauer, P.L., Young, M., 1995. Composite reliability in
structural equations modeling. Educational and Psychological
Measurement 55, 394–406.
Barney, M., 2002a. Macro, meso, micro: Six Sigma. The Industrial-
Organizational Psychologist 39 (4), 104–107.
Barney, M., 2002b. Motorola’s second generation. Six Sigma Forum
Magazine 1 (3), 13–16.
Barney, J.B., Wright, P.M., 1998. On becoming a strategic partner: the
role of human resources in gaining competitive advantage. Human
Resource Management 37, 31–46.
Beer, M., 2003. Why total quality management programs do not
persist: the role of management quality and implications for
leading a TQM transformation. Decision Sciences 34, 623–642.
Bhote, K.R., 2003. The Power of Ultimate Six Sigma: Keki Bhote’s
Proven System for Moving Beyond Quality Excellence to Total
Business Excellence. AMACOM American Management Asso-
ciation, New York, NY.
Breyfogle, F.W., Cupello, J.M., Meadows, B., 2001. Managing Six
Sigma: A Practical Guide to Understanding, Assessing, and
Implementing the Strategy that Yields Bottom-line Success. John
Wiley & Sons, Danvers, MA.
Brewer, P.C., 2004. Six Sigma helps a company create a culture of
accountability. Journal of Organizational Excellence 23 (3), 45–
59.
Burke, M.J., Dunlap, W.P., 2002. Estimating interrater agreement with
the average deviation index: a user’s guide. Organizational
Research Methods 52, 159–172.
Byrne, B.M., 1998. Structural Equation Modeling with LISREL,
PRELIS, and SIMPLIS: Basis Concepts, Application, and Pro-
gramming. Lawrence Erlbaum, Mahwah, NJ.
Choi, T.Y., 1995. Conceptualizing continuous improvement: implica-
tions for organizational change. Omega 23, 607–624.
Choi, T.Y., Eboch, K., 1998. The TQM paradox: relations among
TQM practices, plant performance, and customer satisfaction.
Journal of Operations Management 17, 59–75.
Choo, A.S., Linderman, K., Schroeder, R.G., 2004. Social and method
effects on learning behaviors and knowledge creation in Six Sigma
projects. In: Proceedings of 2004 Annual Meeting of the Academy
of Management, New Orleans, LA.
Choo, A.S., Linderman, K.W., Schroeder, R.G., 2007a. Method and
psychological effects on learning behaviors and knowledge crea-
tion in quality improvement projects. Management Science 53 (3),
437–450.
Choo, A.S., Linderman, K.W., Schroeder, R.G., 2007b. Method and
context perspectives on learning and knowledge creation in quality
management. Journal of Operations Management 25 (4), 918–931.
Clifford, L., 2001. Why you can safely ignore Six Sigma. Fortune
January, 140.
Creveling, C.M., Slutsky, J.L., Antis Jr., D., 2003. Design for Six
Sigma in Technology and Product Development. Prentice Hall,
Upper Saddle River, NJ.
Crocker, L., Algina, J., 1986. Introduction to Classical and Modern
Test Theory. Harcourt, Brace and Jovanovich, Forth Worth, TX.
Daft, R.L., 1998. Organization Theory and Design. South-Western
College Publishing, Cincinnati, OH.
Dalgleish, S., 2003. Six Sigma? No thanks. Quality 42 (4), 22.
Dasgupta, T., 2003. Using the six-sigma metric to measure and
improve the performance of a supply chain. Total Quality Manage-
ment & Business Excellence 14 (3), 355–367.
Dean, H.W., Bowen, D.E., 1994. Management theory and total
quality: improving research and practice through theory develop-
ment. The Academy of Management Review 19 (3), 392–418.
Devane, R., 2004. Integrating Lean Six Sigma and High-Performance
Organizations: Leading the Charge Toward Dramatic, Rapid and
Sustainable Improvement. Pfeiffer, San Francisco, CA.
Dillman, D.A., 2000. Mail and Internet Surveys: The Tailored Design
Method. John Wiley & Sons, New York, NY.
Douglas, T.J., Judge Jr., W.Q., 2001. Total quality management
implementation and competitive advantage: the role of structural
control and exploration. Academy of Management Journal 44,
158–169.
Flynn, B.B., Schroeder, R.G., Sakakibara, S., 1994. A framework for
quality management research and an associated measurement
instrument. Journal of Operations Management 11, 339–366.
Flynn, B.B., Schroeder, R.G., Sakakibara, S., 1995. The impact of
quality management practices on performance and competitive
advantage. Decision Sciences 26 (5), 659–692.
Forza, C., Flippini, R., 1998. TQM impact on quality conformance and
customer satisfaction: a causal model. International Journal of
Production Economics 55, 1–20.
Gale, S.F., 2003. Building framework for Six Sigma. Workforce
(May), 64–69.
Garvin, D., 1984. What does product quality really mean? Sloan
Management Review 25–43.
George, M.L., 2003. Lean Six Sigma for Service. McGraw-Hill, New
York, NY.
Ghiselli, E.E., Campbell, J.P., Zedeck, S., 1981. Measurement Theory
for the Behavioral Sciences. W.H. Freeman and Company, San
Francisco, CA.
Goffnett, S.P., 2004. Understanding Six Sigma: implications for
industry and education. Journal of Industrial Technology 20
(4), 1–10.
X. Zu et al. / Journal of Operations Management 26 (2008) 630–650650
Gowen III, C.R., Tallon, W.J., 2005. Effect of technological intensity
on the relationships among Six Sigma design, electronic-business,
and competitive advantage: a dynamic capabilities model study.
Journal of High Technology Management Research 16 (1), 59–87.
Hackman, J.R., Wageman, R., 1995. Total quality management:
empirical, conceptual, and practical issues. Administrative
Science Quarterly 40, 309–342.
Hair, J.F., Black, B., Babin, B., Anderson, R.E., Tatham, R.L., 2005.
Multivariate Data Analysis, sixth ed. Pearson Education Prentice
Hall, Upper Saddle River, NJ.
Handfield, R., Ghosh, S., Fawcett, S., 1998. Quality-driven change and
its effects on financial performance. Quality Management Journal
5 (3), 13–30.
Henderson, K.M., Evans, J.R., 2000. Successful implementation of
Six Sigma: benchmarking general electric company. Benchmark-
ing: An International Journal 7 (4), 260–281.
Hendricks, C.A., Kelbaugh, R., 1998. Implementing Six Sigma at GE.
The Journal of Quality and Participation 21 (4), 48–53.
Henri, J.F., 2006. Organizational culture and performance measure-
ment systems. Accounting, Organizations and Society 31 (1), 77–
103.
Hu, L., Bentler, P.M., 1999. Cutoff criteria for fit indexes in covariance
structure analysis: conventional criteria versus new alternatives.
Structural Equation Modeling 6, 1–55.
James, L.R., Demaree, R.G., Wolf, G., 1993. rWG: an assessment of
within-group interrater agreement. Journal of Applied Psychology
78 (2), 306–309.
Kaynak, H., 2003. The relationship between total quality management
practices and their effects on firm performance. Journal of Opera-
tions Management 21 (4), 405–435.
Kaynak, H., Hartley, J.L., 2006. Using replication research for just-in-
time purchasing construct development. Journal of Operations
Management 24 (6), 868–892.
Ketokivi, M., Schroeder, R.G., 2004. Perceptual measures of perfor-
mance: fact or fiction? Journal of Operations Management 22 (3),
247–264.
Kline, R.B., 2004. Principles and Practice of Structural Equation
Modeling, second ed. The Guilford Press, New York, NY.
Kwak, Y.H., Anbari, F.T., 2004. Benefits, obstacles, and future of Six
Sigma approach. Technovation 26 (5/6), 708–715.
Lee, K.C., Choi, B., 2006. Six Sigma management activities and their
influence on corporate competitiveness. Total Quality Manage-
ment & Business Excellence 17 (7), 893–911.
Linderman, K., Schroeder, R.G., Choo, A.S., 2006. Six Sigma: the role
of goals in improvement teams. Journal of Operations Manage-
ment 24 (6), 779–790.
Linderman, K., Schroeder, R.G., Zaheer, S., Choo, A.S., 2003. Six
Sigma: a goal-theoretic perspective. Journal of Operations Man-
agement 21, 193–203.
Mohrman, S.A., Tenkasi, R.V., Lawler, E.E., Ledford Jr., G.G., 1995.
Total quality management: practice and outcomes in the largest
US firms. Employee Relations 17 (3), 26–41.
Nahm, A., Vonderembse, M., Koufteros, X., 2004. The impact of
organizational culture on time-based manufacturing and perfor-
mance. Decision Sciences 35 (4), 579–607.
Nair, A., 2006. Meta-analysis of the relationship between quality
management practices and firm performance—implications for
quality management theory development. Journal of Operations
Management 24 (6), 948–975.
Pande, P.S., Neuman, R.P., Cavangh, R.R., 2000. The Six Sigma Way:
How GE, Motorola, and Other Top Companies Are Honing Their
Performance. McGraw Hill, New York, NY.
Pande, P.S., Neuman, R.P., Cavanagh, R.R., 2002. The Six Sigma way,
Team Fieldbook: An Implementation Guide for Process Improve-
ment Teams. McGraw-Hill, New York, NY.
Podsakoff, P.M., MacKenzie, S.B., Lee, J.Y., Podsakoff, N.P., 2003.
Common method biases in behavioral research: a critical review of
the literature and recommended remedies. Journal of Applied
Psychology 88, 879–903.
Powell, T.C., 1995. Total quality management as competitive advan-
tage: a review and empirical study. Strategic Management Journal
16, 15–37.
Prajogo, D.I., Sohal, A.S., 2003. The relationship between TQM
practices, quality performance, and innovation performance: an
empirical examination. International Journal of Quality & Relia-
bility Management 20 (8), 901–918.
Pyzdek, T., 2003. The Six Sigma Handbook: A Complete Guide for
Green Belts, Black Belts, and Managers at all Levels. McGraw-
Hill, New York, NY.
Reed, R., Lemak, D.J., Montgomery, J.C., 1996. Beyond process:
TQM content and firm performance. Academy of Management
Review 21, 173–202.
Samson, D., Terziovski, M., 1999. The relationship between total
quality management practices and operational performance. Jour-
nal of Operations Management 17, 393–409.
Saa-Perez, P.D., Garcıa-Falcon, J.M., 2002. A resource-based view of
human resource management and organizational capabilities
development. International Journal of Human Resource Manage-
ment 13 (1), 123–140.
Saraph, J.V., Benson, G.P., Schroeder, R.G., 1989. An instrument for
measuring the critical factors of quality management. Decision
Sciences 20, 810–829.
Schroeder, R.G., 2000. Six Sigma quality improvement: what is Six
Sigma and what are the important implications? In: Proceeding of
the Fourth Annual International POMS Conference, Seville,
Spain.
Schroeder, R.G., Linderman, K., Zhang, D., 2005. Evolution of
quality: first fifty issues of production and operations manage-
ment. Production & Operations Management 14 (4), 468–
481.
Schroeder, R.G., Linderman, K., Liedtke, C., Choo, A.S., 2008. Six
Sigma: definition and underlying theory. Journal of Operations
Management 26, 536–554.
Sila, I., Ebrahimpour, M., 2005. Critical linkages among TQM factors
and business results. International Journal of Operations & Pro-
duction Management 25, 1123–1155.
Sinha, K.K., Van de Ven, A.H., 2005. Designing work within
and between organizations. Organization Science 16 (4), 389–
408.
Slater, R., 2000. The GE Way Fieldbook: Jack Welch’s Battle for
Corporate Revolution. McGraw-Hill, New York, NY.
Snee, R.D., Hoerl, R.W., 2003. Leading Six Sigma: A Step-by-step
Guide Based on Experience with GE and Other Six Sigma
Companies. Financial Times Prentice Hall, Upper Saddle River,
NJ.
Sousa, R., Voss, C.A., 2002. Quality management re-visited: a reflec-
tive review and agenda for future research. Journal of Operations
Management 20, 91–109.
Stamatis, D.H., 2000. Who needs Six Sigma, anyway? Quality Digest
May. Available at http://www.qualitydigest.com/may00/html/six-
sigmacon.html.
Yeung, A.D.L., Cheng, T.C.E., Lai, K.H., 2005. An empirical model
for managing quality in the electronics industry. Production and
Operations Management 14 (2), 189–204.