the evolving hispanic consumer - nielseniq.com
TRANSCRIPT
© 2021 Nielsen Consumer LLC. All Rights Reserved.
The Evolving
Hispanic Consumer
2021
Diverse voices
Kymberly Graham
VP, Head of Diversity Initiatives
© 2021 Nielsen Consumer LLC. All Rights Reserved.2
First, the basics…
The evolving Hispanic consumer
2

© 2021 Nielsen Consumer LLC. All Rights Reserved.3
About the Latino community
Source: 2018 American Community Survey
% contribution to total population growth by race/ethnicity
-27%
-18%
2%
68%
65%
53%
22%
21%
19%
23%
22%
19%
13%
11%
8%
-50% -20% 10% 40% 70% 100% 130%
2020-2060
2020-2045
2020-2025
Non-Hispanic White Hispanic African American Asian Other
+11.6M
+48.8M
+71.8M
Latinos will contribute more growth than any
other population segment, a factor compounded
by a projected growth decline among the non-
Hispanic White population.
For the next 40 years, Latinos, the largest
minority population in the U.S., will be the
primary contributors to total U.S. population
growth,
Comprising 53% of the growth in just the
next five years and 68% of the growth
to 2060.

© 2021 Nielsen Consumer LLC. All Rights Reserved.4
Source: 2018 American Community Survey
Inside the Hispanic household
Median age % high income households
4429
38
White Non-
Hispanic
Average household size
($50,000+ household income)
55%
59%
Median household income
$55,270Median Hispanic HH income
3.40
2.63
$63,217Median non-Hispanic HH income
+6%
Since 2017
Multigenerational households
9%
15%
0% 10% 20%(% of population)
40%
More likely
Total U.S.U.S. Hispanics

© 2021 Nielsen Consumer LLC. All Rights Reserved.5
Hispanic buying power is increasing
Source: Selig Center for Economic Growth, Terry College of Business, The University of Georgia, June 2019
Hispanic buying power 2000-2024
0% 5% 10% 15% 20%
2024
2019
2010
2000
From 2010 to 2019, Hispanic buying
power increased by 69%, outpacing
non-Hispanics, who increased by 41%
during the same time.
$495 billion
$1 trillion
$1.7 trillion
$2.3 trillion
6.7%
9.1%
10.8%
11.6%
Hispanic % of total U.S. buying pow er
© 2021 Nielsen Consumer LLC. All Rights Reserved.6
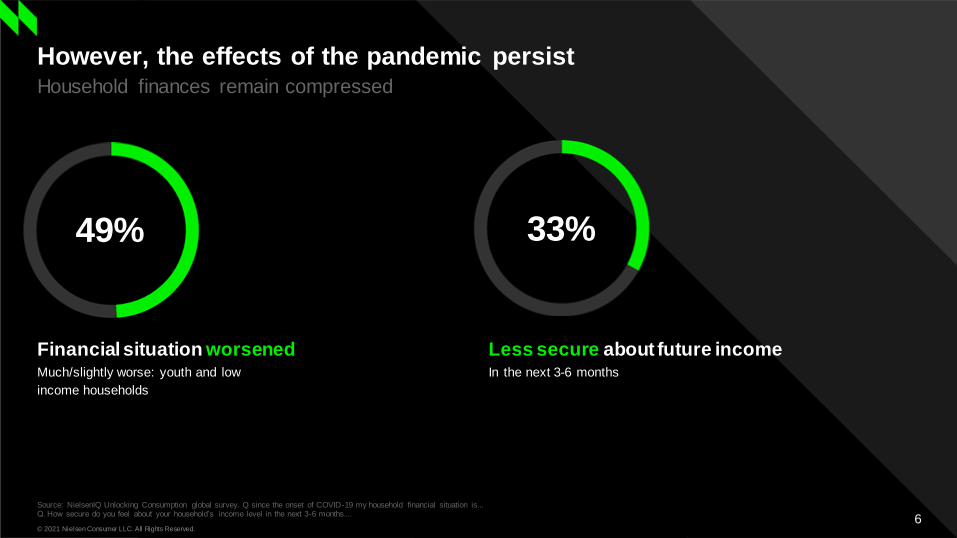
However, the effects of the pandemic persist
Source: NielsenIQ Unlocking Consumption global survey. Q since the onset of COVID-19 my household financial situation is...Q. How secure do you feel about your household’s income level in the next 3-6 months....
Household finances remain compressed
Financial situation worsenedMuch/slightly worse: youth and low
income households
Less secure about future incomeIn the next 3-6 months
49% 33%

© 2021 Nielsen Consumer LLC. All Rights Reserved.7
Four groups shaping consumption patterns
Source: NielsenIQ Unlocking Consumption global survey.
Newly constrained doubled,
cautious insulated are
proactively rationalising
Constrained and Insulated consumer groups - global
73% are cost-conscious consumers altering their
buying and consumption patterns

© 2021 Nielsen Consumer LLC. All Rights Reserved.88
But other consumers were
previously constrained
And insulated consumers have not been
entirely shielded from impacts

© 2021 Nielsen Consumer LLC. All Rights Reserved.9
Consumption groups for Hispanic consumers
Hispanic American
consumers more likely to be
cautious with their spending
White Hispanic
American
Sample size 16703 1912
Cautious middle 28% 35%
Constrained existing 20% 14%
Constrained new 23% 30%
Existing core 29% 20%
Index vs Total >120
Index vs Total <80

© 2021 Nielsen Consumer LLC. All Rights Reserved.2
Hispanics are not
homogenous.
They are a diverse and
dynamic population.
10
© 2021 Nielsen Consumer LLC. All Rights Reserved.11
Source: 2018 American Community Survey
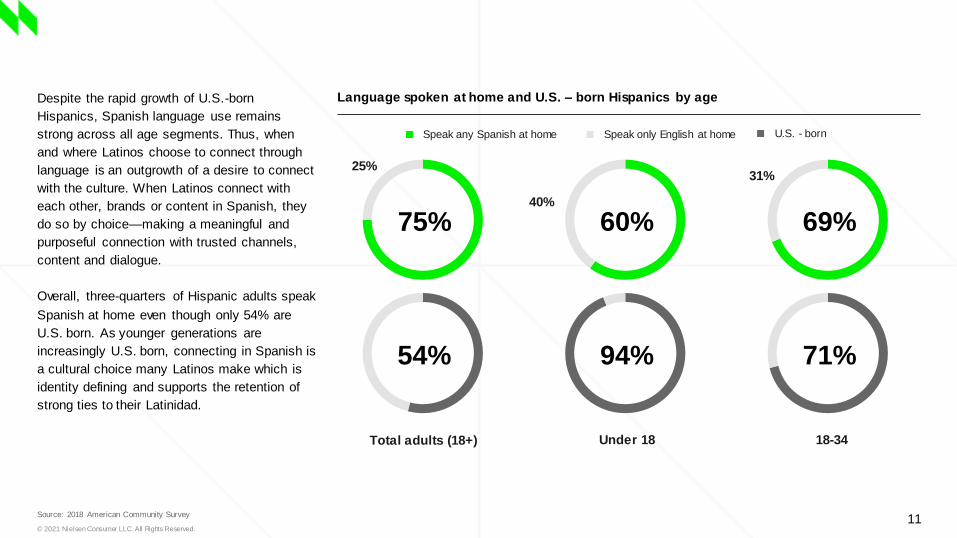
Language spoken at home and U.S. – born Hispanics by age
Total adults (18+)
Despite the rapid growth of U.S.-born
Hispanics, Spanish language use remains
strong across all age segments. Thus, when
and where Latinos choose to connect through
language is an outgrowth of a desire to connect
with the culture. When Latinos connect with
each other, brands or content in Spanish, they
do so by choice—making a meaningful and
purposeful connection with trusted channels,
content and dialogue.
Overall, three-quarters of Hispanic adults speak
Spanish at home even though only 54% are
U.S. born. As younger generations are
increasingly U.S. born, connecting in Spanish is
a cultural choice many Latinos make which is
identity defining and supports the retention of
strong ties to their Latinidad.
60%
94%
75%
54%
69%
71%
Speak any Spanish at home
Under 18 18-34
Speak only English at home U.S. - born
25%
40%
31%
© 2021 Nielsen Consumer LLC. All Rights Reserved.2
Hispanic contribution to
the marketplace
The evolving Hispanic consumer
13

© 2021 Nielsen Consumer LLC. All Rights Reserved.14
Hispanic growth outpaces non-Hispanic across most
departments of the store.
Dollars % CHG vs. YAGO by department: Hispanic & non-Hispanic
6.0%8.5%
0.1%
6.3% 5.5%
12.7%
22.7%
11.3%
7.3%4.7% 4.0% 4.8%
6.7% 6.8%
14.1%
26.1%
-5.4%
4.9% 6.9%
0.0%
5.3% 5.2%
11.2%
16.4%
8.7%
3.3%4.8% 1.6%
2.8% 5.0% 3.8%
11.1%
27.3%
-6.6%
-10%
-5%
0%
5%
10%
15%
20%
25%
30%
Tota
l sto
re
Alc
oho
l
Bab
y ca
re
Bak
ery
Dai
ry
Del
i
Flo
ral
Fro
zen
Ge
ner
al m
erch
and
ise
Gro
cery
Hea
lth
& b
eau
ty c
are
Hou
seh
old
car
e
Me
at
Pet
ca
re
Pro
du
ce
Sea
food
Tob
acco
alt
ern
ati
ves
Hispanic Non-Hispanic
© 2021 Nielsen Consumer LLC. All Rights Reserved.15
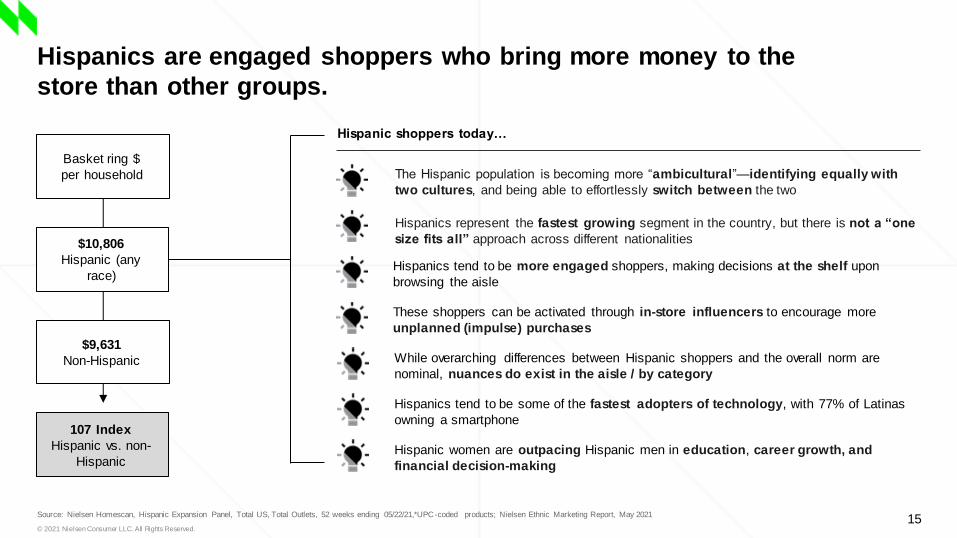
Hispanics are engaged shoppers who bring more money to the
store than other groups.
Source: Nielsen Homescan, Hispanic Expansion Panel, Total US, Total Outlets, 52 weeks ending 05/22/21,*UPC-coded products; Nielsen Ethnic Marketing Report, May 2021
The Hispanic population is becoming more “ambicultural”—identifying equally with
two cultures, and being able to effortlessly switch between the two
Hispanic shoppers today…
Hispanics represent the fastest growing segment in the country, but there is not a “one
size fits all” approach across different nationalities
Hispanics tend to be more engaged shoppers, making decisions at the shelf upon
browsing the aisle
These shoppers can be activated through in-store influencers to encourage more
unplanned (impulse) purchases
While overarching differences between Hispanic shoppers and the overall norm are
nominal, nuances do exist in the aisle / by category
Hispanics tend to be some of the fastest adopters of technology, with 77% of Latinas
owning a smartphone
Hispanic women are outpacing Hispanic men in education, career growth, and
financial decision-making
$10,806
Hispanic (any
race)
$9,631
Non-Hispanic
107 Index
Hispanic vs. non-
Hispanic
Basket ring $
per household

© 2021 Nielsen Consumer LLC. All Rights Reserved.16
$10,806
$10,527
$11,214
$10,915
$9,631
Total Hispanic English-preferred Spanish-preferred Bilingual Non-Hispanic
Spanish-preferred and bilingual households outspend
all other groups across outlets.
Source: Nielsen Homescan, Hispanic Expansion Panel, Total US – All Outlets, 05/24/20 - 05/22/21
Basket ring dollars per household: Hispanics by language usage
112 109 116 113 100 Index to non-Hispanics

© 2021 Nielsen Consumer LLC. All Rights Reserved.17
Bilingual households’ value to the store derives from more
frequent visiting.
Source: Nielsen Homescan, Hispanic Expansion Panel, Total US – All Outlets, 05/24/20 - 05/22/21
Hispanic shopping summary: Basket size & tripsBasket ring $ per trip (all outlets) Trips per shopper (all outlets)
$183
$191
$148
$186
$179
$0 $50 $100 $150 $200
Non-Hispanic
Bilingual
Spanish preferred
English preferred
Total Hispanic$76
Spanish preferred
$60
Total Hispanic$57
English preferred
$57
Bilingual
$53
Non-Hispanic
© 2021 Nielsen Consumer LLC. All Rights Reserved.18
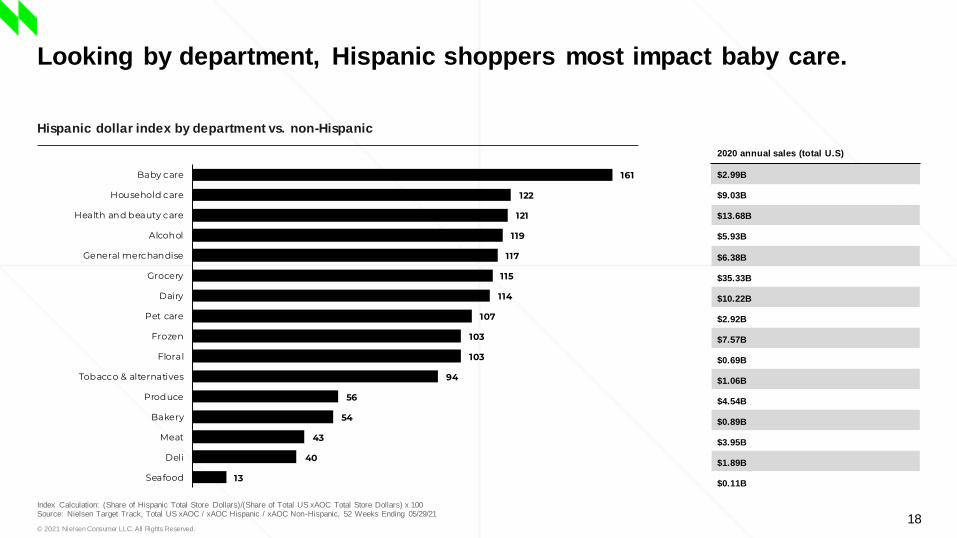
Looking by department, Hispanic shoppers most impact baby care.
Index Calculation: (Share of Hispanic Total Store Dollars)/(Share of Total US xAOC Total Store Dollars) x 100Source: Nielsen Target Track, Total US xAOC / xAOC Hispanic / xAOC Non-Hispanic, 52 Weeks Ending 05/29/21
13
40
43
54
56
94
103
103
107
114
115
117
119
121
122
161
Seafood
Deli
Meat
Bakery
Produce
Tobacco & alternatives
Floral
Frozen
Pet care
Dairy
Grocery
General merchandise
Alcohol
Health and beauty care
Household care
Baby care
Hispanic dollar index by department vs. non-Hispanic
2020 annual sales (total U.S)
$2.99B
$9.03B
$13.68B
$5.93B
$6.38B
$35.33B
$10.22B
$2.92B
$7.57B
$0.69B
$1.06B
$4.54B
$0.89B
$3.95B
$1.89B
$0.11B

© 2021 Nielsen Consumer LLC. All Rights Reserved.19
Beauty care indexes highly across all three language segments.
Index Calculation: (Hispanic Language Group Share of Sales)/(Hispanic Language Group Share of Population) x 100Source: Nielsen Homescan, Hispanic Expansion Panel, Total US – All Outlets, 05/24/20 - 05/22/21
Index vs. total Hispanic: Dollars spent by department and language usage
Index > 115
Index > 85 and < 115
Index < 85
Index
Department Hispanic Non-Hispanic English preferred Spanish preferred Bilingual
Total score 100 100 100 100 100
Alcohol 88 102 98 86 76
Baby care 196 84 160 247 213
Bakery 94 101 99 79 95
Dairy 102 100 99 105 104
Deli 83 103 93 49 91
Floral 93 101 86 86 105
Frozen 84 103 95 55 86
General merchandise 99 100 100 85 105
Grocery 100 100 99 108 97
Health & beauty care 117 97 106 131 123
Household care 115 97 103 142 115
Meat 90 102 106 58 89
Pet care 82 103 97 52 81
Produce 95 101 95 86 100
Seaf ood 72 105 64 79 77
Tobacco alternativ es 49 108 70 20 40

© 2021 Nielsen Consumer LLC. All Rights Reserved.20
$75.9
$82.0
$84.6
$87.8
$88.3
$89.1
$91.3
$91.9
$92.4
$94.2
$100.7
$111.0
$114.4
$115.2
$116.3
$123.8
$131.0
$168.0
$185.3
$325.9
Still wine
Home appliances
Chocolate
Chicken
Cellular phone accessories
Specialty
Multi purpose cleaners
Beer
Fruit drink
Bacon
Energy beverages
Sport drinks
Shrimp
Hand sanitizer
Supplements
Frozen novelty
FMB/Cider
Kitchen appliances
Medical masks
Soft drinks
The top three categories in absolute growth also over-index with
Hispanics.
Index Calculation: (Share of Hispanic Total Store Dollars)/(Share of Non-Hispanic xAOC Total Store Dollars) x 100Source: Nielsen Target Track, Total US xAOC / xAOC Hispanic / xAOC Non-Hispanic, 52 Weeks Ending 05/29/21
Hispanic $ - 2020 change vs. previous year: Top 20 categories ($ CYA MM)
Index > 115
vs. non-Hispanic xAOC
Index > 85 and < 115
Index < 85
(119)
(115)
(137)
(104)
(127)
(103)
(129)
(98)
(138)
(116)
(100)
(153)
(162)
(138)
(97)
(122)
(39)
(102)
(117)
(78)

© 2021 Nielsen Consumer LLC. All Rights Reserved.21
35.5%
26.8%
12.8%
4.5%
4.6%
2.4%
13.4%
Grocery Mass merch Warehouse club
Drug Dollar / value Convenience / gas
A/O outlets
Assessing channels, club spikes among all Hispanic language
groups vs. non-Hispanics.
Index Calculation: (Share of Hispanic Language Group Total Outlet Dollars)/(Share of Non-Hispanic Total Outlet Dollars) x 100
Source: Nielsen Homescan, Hispanic Expansion Panel, Total US – All Outlets, 05/24/20 - 05/22/21
% of Hispanic dollars (all outlets)
English
preferred
Spanish
preferred Bilingual
Grocery 94 105 96
Mass 98 101 101
Club 131 85 101
Drug 123 85 106
Value 92 100 105
Convenience 119 104 82
A/O 81 103 107
Index > 115 Index > 85 and < 115 Index < 85
Index of Hispanic channel spend by language preference vs. non-
Hispanics
© 2021 Nielsen Consumer LLC. All Rights Reserved.22
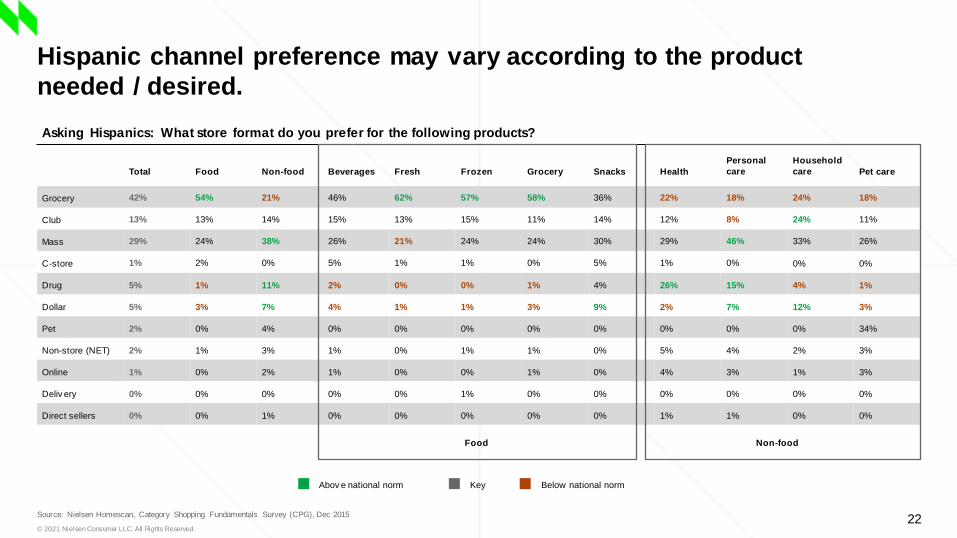
Hispanic channel preference may vary according to the product
needed / desired.
Source: Nielsen Homescan, Category Shopping Fundamentals Survey (CPG), Dec 2015
Asking Hispanics: What store format do you prefer for the following products?
Total Food Non-food Beverages Fresh Frozen Grocery Snacks Health
Personal
care
Household
care Pet care
Grocery 42% 54% 21% 46% 62% 57% 58% 36% 22% 18% 24% 18%
Club 13% 13% 14% 15% 13% 15% 11% 14% 12% 8% 24% 11%
Mass 29% 24% 38% 26% 21% 24% 24% 30% 29% 46% 33% 26%
C-store 1% 2% 0% 5% 1% 1% 0% 5% 1% 0% 0% 0%
Drug 5% 1% 11% 2% 0% 0% 1% 4% 26% 15% 4% 1%
Dollar 5% 3% 7% 4% 1% 1% 3% 9% 2% 7% 12% 3%
Pet 2% 0% 4% 0% 0% 0% 0% 0% 0% 0% 0% 34%
Non-store (NET) 2% 1% 3% 1% 0% 1% 1% 0% 5% 4% 2% 3%
Online 1% 0% 2% 1% 0% 0% 1% 0% 4% 3% 1% 3%
Deliv ery 0% 0% 0% 0% 0% 1% 0% 0% 0% 0% 0% 0%
Direct sellers 0% 0% 1% 0% 0% 0% 0% 0% 1% 1% 0% 0%
Abov e national norm Key Below national norm
Food Non-food
© 2021 Nielsen Consumer LLC. All Rights Reserved.2
The evolving Hispanic consumer
23
Reaching Hispanic
consumers & shoppers
© 2021 Nielsen Consumer LLC. All Rights Reserved.24
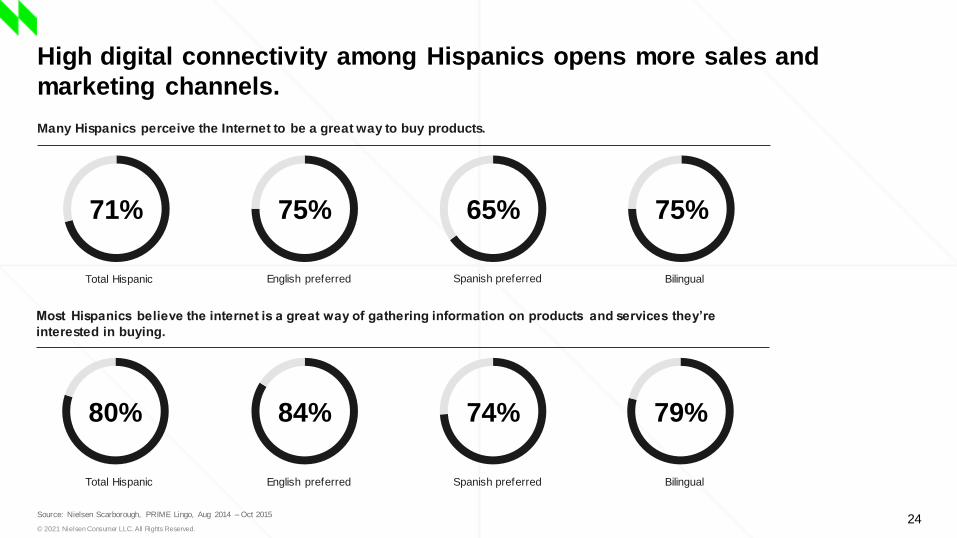
High digital connectivity among Hispanics opens more sales and
marketing channels.
Source: Nielsen Scarborough, PRIME Lingo, Aug 2014 – Oct 2015
Many Hispanics perceive the Internet to be a great way to buy products.
71% 75% 65% 75%
Most Hispanics believe the internet is a great way of gathering information on products and services they’re
interested in buying.
80%
Total Hispanic
Total Hispanic
84%
English preferred
English preferred
74%
Spanish preferred
Spanish preferred
79%
Bilingual
Bilingual
© 2021 Nielsen Consumer LLC. All Rights Reserved.25
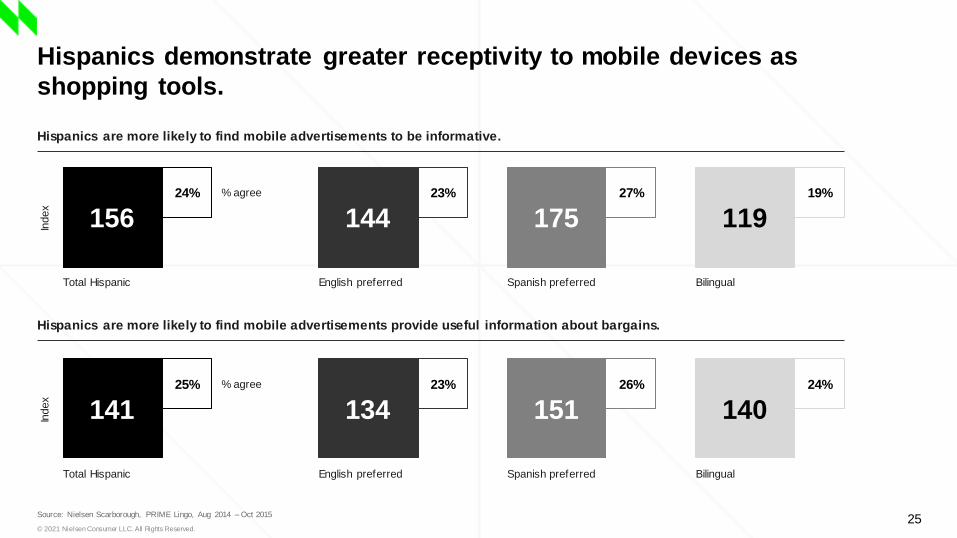
Hispanics demonstrate greater receptivity to mobile devices as
shopping tools.
Source: Nielsen Scarborough, PRIME Lingo, Aug 2014 – Oct 2015
Hispanics are more likely to find mobile advertisements to be informative.
Hispanics are more likely to find mobile advertisements provide useful information about bargains.
156
Total Hispanic
Index
24% % agree
144
English preferred
23% 27%
175
Spanish preferred
19%
119
Bilingual
141
Total Hispanic
Index
25% % agree
134
English preferred
23% 26%
151
Spanish preferred
24%
140
Bilingual
© 2021 Nielsen Consumer LLC. All Rights Reserved.27
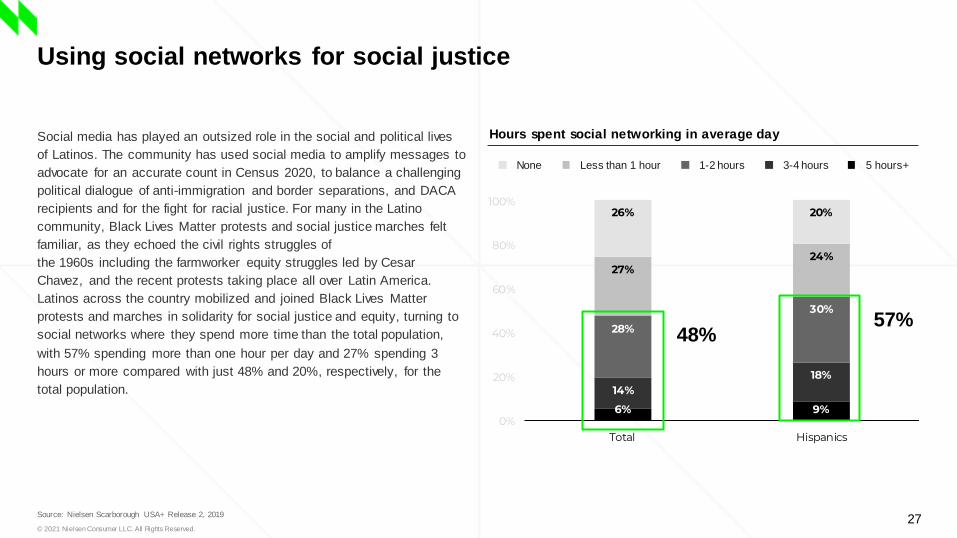
Using social networks for social justice
Source: Nielsen Scarborough USA+ Release 2, 2019
Hours spent social networking in average day
6% 9%
14%18%
28%
30%
27%24%
26% 20%
0%
20%
40%
60%
80%
100%
Total Hispanics
Social media has played an outsized role in the social and political lives
of Latinos. The community has used social media to amplify messages to
advocate for an accurate count in Census 2020, to balance a challenging
political dialogue of anti-immigration and border separations, and DACA
recipients and for the fight for racial justice. For many in the Latino
community, Black Lives Matter protests and social justice marches felt
familiar, as they echoed the civil rights struggles of
the 1960s including the farmworker equity struggles led by Cesar
Chavez, and the recent protests taking place all over Latin America.
Latinos across the country mobilized and joined Black Lives Matter
protests and marches in solidarity for social justice and equity, turning to
social networks where they spend more time than the total population,
with 57% spending more than one hour per day and 27% spending 3
hours or more compared with just 48% and 20%, respectively, for the
total population.
48%57%
None Less than 1 hour 1-2 hours 3-4 hours 5 hours+

© 2021 Nielsen Consumer LLC. All Rights Reserved.28
% Hispanic Americans more likely to purchase a brand if social
causes are supported
Racial injustice
33%
Hunger and food
insecurity
41%
Equality
36%
Unhoused/homelessness
38%

© 2021 Nielsen Consumer LLC. All Rights Reserved.2
Summary
The evolving Hispanic consumer
29
© 2021 Nielsen Consumer LLC. All Rights Reserved.30
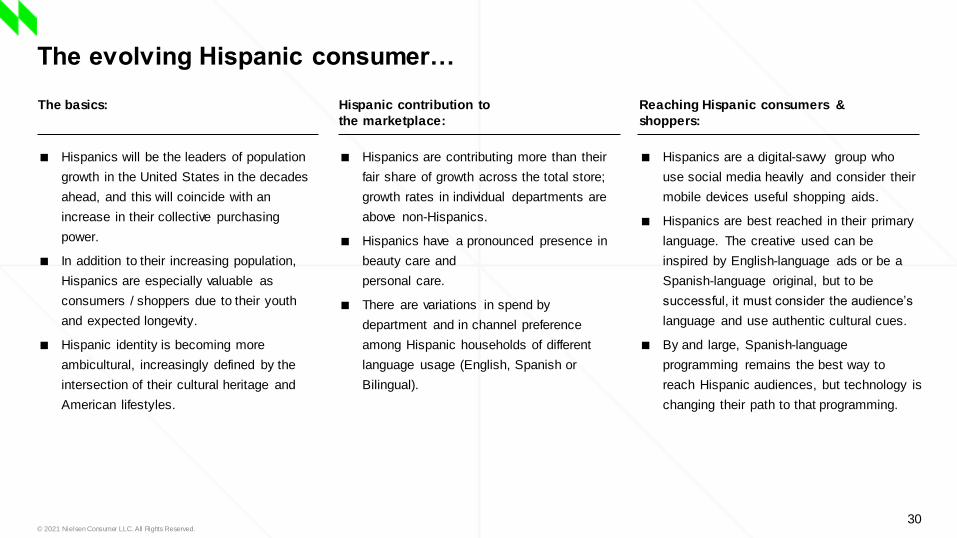
The evolving Hispanic consumer…
■ Hispanics will be the leaders of population
growth in the United States in the decades
ahead, and this will coincide with an
increase in their collective purchasing
power.
■ In addition to their increasing population,
Hispanics are especially valuable as
consumers / shoppers due to their youth
and expected longevity.
■ Hispanic identity is becoming more
ambicultural, increasingly defined by the
intersection of their cultural heritage and
American lifestyles.
The basics:
■ Hispanics are contributing more than their
fair share of growth across the total store;
growth rates in individual departments are
above non-Hispanics.
■ Hispanics have a pronounced presence in
beauty care and
personal care.
■ There are variations in spend by
department and in channel preference
among Hispanic households of different
language usage (English, Spanish or
Bilingual).
Hispanic contribution to
the marketplace:
■ Hispanics are a digital-savvy group who
use social media heavily and consider their
mobile devices useful shopping aids.
■ Hispanics are best reached in their primary
language. The creative used can be
inspired by English-language ads or be a
Spanish-language original, but to be
successful, it must consider the audience’s
language and use authentic cultural cues.
■ By and large, Spanish-language
programming remains the best way to
reach Hispanic audiences, but technology is
changing their path to that programming.
Reaching Hispanic consumers &
shoppers:

Thank you.
© 2021 Nielsen Consumer LLC. All Rights Reserved.31