the evolution of the goddard profiling algorithm...
TRANSCRIPT
NOVEMBER 2001 1801K U M M E R O W E T A L .
q 2001 American Meteorological Society
The Evolution of the Goddard Profiling Algorithm (GPROF) for Rainfall Estimationfrom Passive Microwave Sensors
CHRISTIAN KUMMEROW,* Y. HONG,1 W. S. OLSON,# S. YANG,# R. F. ADLER,@ J. MCCOLLUM,&
R. FERRARO,& G. PETTY,** D.-B. SHIN,* AND T. T. WILHEIT11
*Department of Atmospheric Science, Colorado State University, Fort Collins, Colorado1The Aerospace Corporation, Los Angeles, California
#Joint Center for Earth Systems Technology, University of Maryland, Baltimore County, Baltimore, Maryland@NASA Goddard Space Flight Center, Greenbelt, Maryland
&NOAA/NESDIS, Camp Springs, Maryland**University of Wisconsin—Madison, Madison, Wisconsin
11Texas A&M University, College Station, Texas
(Manuscript received 28 November 2000, in final form 5 June 2001)
ABSTRACT
This paper describes the latest improvements applied to the Goddard profiling algorithm (GPROF), particularlyas they apply to the Tropical Rainfall Measuring Mission (TRMM). Most of these improvements, however, areconceptual in nature and apply equally to other passive microwave sensors. The improvements were motivatedby a notable overestimation of precipitation in the intertropical convergence zone. This problem was traced backto the algorithm’s poor separation between convective and stratiform precipitation coupled with a poor separationbetween stratiform and transition regions in the a priori cloud model database. In addition to now using animproved convective–stratiform classification scheme, the new algorithm also makes use of emission and scat-tering indices instead of individual brightness temperatures. Brightness temperature indices have the advantageof being monotonic functions of rainfall. This, in turn, has allowed the algorithm to better define the uncertaintiesneeded by the scheme’s Bayesian inversion approach. Last, the algorithm over land has been modified primarilyto better account for ambiguous classification where the scattering signature of precipitation could be confusedwith surface signals. All these changes have been implemented for both the TRMM Microwave Imager (TMI)and the Special Sensor Microwave Imager (SSM/I). Results from both sensors are very similar at the stormscale and for global averages. Surface rainfall products from the algorithm’s operational version have beencompared with conventional rainfall data over both land and oceans. Over oceans, GPROF results compare wellwith atoll gauge data. GPROF is biased negatively by 9% with a correlation of 0.86 for monthly 2.58 averagesover the atolls. If only grid boxes with two or more atolls are used, the correlation increases to 0.91 but GPROFbecomes positively biased by 6%. Comparisons with TRMM ground validation products from Kwajalein revealthat GPROF is negatively biased by 32%, with a correlation of 0.95 when coincident images of the TMI andKwajalein radar are used. The absolute magnitude of rainfall measured from the Kwajalein radar, however,remains uncertain, and GPROF overestimates the rainfall by approximately 18% when compared with estimatesdone by a different research group. Over land, GPROF shows a positive bias of 17% and a correlation of 0.80over monthly 58 grids when compared with the Global Precipitation Climatology Center (GPCC) gauge network.When compared with the precipitation radar (PR) over land, GPROF also retrieves higher rainfall amounts (20%).No vertical hydrometeor profile information is available over land. The correlation with the TRMM precipitationradar is 0.92 over monthly 58 grids, but GPROF is positively biased by 24% relative to the radar over oceans.Differences between TMI- and PR-derived vertical hydrometeor profiles below 2 km are consistent with thisbias but become more significant with altitude. Above 8 km, the sensors disagree significantly, but the informationcontent is low from both TMI and PR. The consistent bias between these two sensors without clear guidancefrom the ground-based data reinforces the need for better understanding of the physical assumptions going intothese retrievals.
1. Introduction
Microwave remote sensing of clouds and precipita-tion has been successfully used for a number of years
Corresponding author address: Dr. Christian D. Kummerow, De-partment of Atmospheric Science, Colorado State University, FortCollins, CO 80523.E-mail: [email protected]
and continues to improve as new sensors become avail-able. The Tropical Rainfall Measuring Mission (TRMM)carries the TRMM Microwave Imager (TMI), which issimilar to the existing Special Sensor Microwave Imager(SSM/I) sensor but has an additional 10-GHz channeland significantly better spatial resolution. The instru-ment characteristics are described in Kummerow et al.(1998). TRMM employs two distinct algorithms to ob-
1802 VOLUME 40J O U R N A L O F A P P L I E D M E T E O R O L O G Y
tain rainfall from the TMI instrument. The first algo-rithm is designed to provide instantaneous rainfall rates,the vertical structure of precipitation and the associatedlatent heating. The algorithm, described here, is knownas the Goddard profiling algorithm (GPROF) eventhough it now extends to researchers well beyond God-dard Space Flight Center. It was first described in theliterature by Kummerow et al. (1996) but has undergonesignificant improvements in the last five years.
The second algorithm, for reference, is based uponthe emission signatures of the 19.3- and 21.3-GHz chan-nels to retrieve rainfall over radiometrically cold oceans.It is a very robust emission-based algorithm that min-imizes retrieval assumptions but in the process is re-stricted to monthly mean oceanic rainfall accumulationsover 58-lat 3 58-long boxes instead of pixel-level re-trievals. It has been used in the Global PrecipitationClimatology Project (GPCP) estimate (Huffman et al.1997) as well as TRMM. The algorithm is based on thetechnique developed by Change et al. (1993) and Wilheitet al. (1991). Chang et al. (1999) compared results ofthe technique from TMI and SSM/I data for six monthsof 1998 and found no significant differences betweenthe two products.
In contrast to the emission algorithm described above,GPROF aims to retrieve the instantaneous rainfall andthe rainfall vertical structure. This is made possible bythe response functions for different channels peaking atdifferent depths within the raining column. There are,however, more independent variables within rainingclouds than there are channels in the observing system.The solution to this problem therefore requires addi-tional assumptions or constraints. Radiative transfer cal-culations can be used to determine a brightness tem-perature vector, Tb, given a vertical distribution of hy-drometeors represented by R. An inversion procedure,however, is needed to find the hydrometeor profile, R,given a vector Tb. The present retrieval method has itsfoundation in Bayes’s theorem. In Bayes’s formulation,the probability of a particular profile R, given Tb canbe written as:
Pr(R | Tb) 5 Pr(R) 3 Pr(Tb | R), (1)
where Pr(R) is the probability with which a certain pro-file R will be observed and Pr(Tb | R) is the probabilityof observing the brightness temperature vector, Tb, giv-en a particular rain profile R. The first term on the right-hand side of Eq. (1) is derived using cloud-resolvingmodels (CRM). While the models are only reviewedbriefly, those aspects of the model that are important tothe current discussion are described in detail in section1a. To obtain the second term on the right-hand side ofEq. (1), radiative transfer schemes are used to computethe brightness temperatures corresponding to the CRMoutput. Together, the radiative transfer and the convo-lution of these temperatures to the appropriate sensorresolution scheme compose the forward modeling por-tion of the retrieval algorithm, which is covered in sec-
tion 1b. The inversion scheme (section 1c) follows thedescription of the forward problem. Section 2 is devotedto a description of the algorithm improvements that havebeen undertaken in the last five years. Section 3 com-pares results from the operational algorithm to groundand complimentary spaceborne observations, and sec-tion 4 discusses the known shortcomings and future de-velopment strategies.
a. The cloud-resolving models
During the past two decades, convective-scale modelshave advanced sufficiently to study the dynamic andmicrophysical processes associated with mesoscale con-vective systems. The basic feature of these models isthat they are nonhydrostatic and include an explicit rep-resentation of microphysical processes. The latter is crit-ical in that it affects the computed brightness temper-atures that must eventually be matched to the brightnesstemperatures observed by the satellite. GPROF cur-rently uses two cloud-resolving models in its database,the Goddard Cumulus Ensemble Model (GCE) and theUniversity of Wisconsin Nonhydrostatic Modeling Sys-tem (UW-NMS). A description of the GCE model canbe found in Tao and Simpson (1993). The cloud mi-crophysics include a parameterized Kessler-type two-category liquid water scheme (cloud water and rain),and parameterized Lin et al. (1983) three-category ice-phase schemes (cloud ice, snow, and graupel). The dis-tributions of rain, snow, and graupel are taken to beinverse exponential with respect to the liquid equivalentdiameter D such that
N(D) 5 N exp(2lD),0 (2)
where N(D) is the number of drops of diameter betweenD and D 1 dD per unit volume, N0 is the interceptparameter, and l is the slope of the distribution given by
0.25pr Nx 0,xl 5 . (3)1 2rqx
The intercept parameters, N0,x, used in the GCE modelfor rain, snow, and graupel are 0.08, 0.04, and 0.04cm24, respectively. The density rx of rain, snow, andgraupel are 1, 0.1, and 0.4 g cm23, respectively. Cloudwater and cloud ice are assumed monodisperse with adiameter of 20 mm and a density of 1.0 and 0.917 gcm23, respectively. The density of air is given by r,while the mass density of the different hydrometeor spe-cies is given by qx. The shapes of liquid and ice particlesare not specified by the model. They are assumed spher-ical for the radiative transfer computations.
A stretched vertical coordinate (height incrementsfrom 220 to 1050 m) with 31 grid points is used in orderto maximize the resolution of the lowest levels, withthe model top at 20 km for the simulations used byGPROF. The GPROF algorithm makes use of three sep-arate simulations from this model. Two simulations are

NOVEMBER 2001 1803K U M M E R O W E T A L .
initialized using Tropical Ocean and Global AtmosphereCoupled Ocean–Atmosphere Response Experiment(TOGA COARE) soundings, while a third one usesGlobal Atmospheric Research Program (GARP) Atlan-tic Tropical Experiment (GATE) soundings. The firstTOGA COARE simulation was run with a 1-km spatialresolution over a 128 km 3 128 km domain. Eightmodel time steps starting at 30 min and ending at 240min are used. The second simulation has a 3-km spatialresolution over a 384 km 3 384 km domain. Six modelsteps are again used from 60 to 360 min in the simu-lation. The GATE model has a 1.5-km horizontal res-olution over a 96 km 3 96 km domain. Five modeltimes, from 30 to 184 min in the simulation, are used.
The second model used is UW-NMS model describedby Tripoli (1992a). Two simulations from this modelare used in the GPROF database. These are the Coop-erative Huntsville Meteorological Experiment (COH-MEX) simulation and the hurricane simulation as de-scribed at length by Panagrossi et al. (1998). Aside fromdifferences in the dynamical assumptions in the model,the UW-NMS considers four classes of ice: graupel,pristine crystals, snow crystals, and aggregates that needto be treated differently in the generation of the GPROFcloud model database. A detailed description of theseice categories and their interaction may be found inTripoli (1992b). Unlike the GCE, snow crystals as wellas aggregates have a size-dependent density given by
1523r 5 (kg m ), (4)
0.6(2r)
where the liquid equivalent radius r is specified in cen-timeters. In the hurricane simulation, snow and aggre-gates are assumed to be a single category with a meanradius of 1.65 mm. In the COHMEX simulation, thesecategories are treated separately, with snow having amean radius of 0.5 mm and aggregates having a meandiameter of 1.65 mm. The pristine ice category is as-sumed to have a uniform mass of 1.5 3 1029 kg m23,and the density is assumed to be 0.22 gm cm23. Graupel,like the GCE model, follows a Marshall and Palmer(1948) distribution but is assumed to have a density of0.6 gm cm23 in this model.
The COHMEX simulation was carried out with a 1-km spatial resolution over a 50 km 3 50 km domain.Twelve time steps from 45 to 180 min in the simulationare used. The hurricane model has 3.3-km spatial res-olution over a domain of 205 km 3 205 km. Time stepsfrom 40 to 220 min are used. The time steps selectedin all the models are intended to represent a good sam-pling of early, mature and decaying portions of eachstorm. The somewhat larger number of COHMEX timesteps was intended to insure that enough models wereselected from this simulation that had a more limitedspatial domain.
b. The radiative transfer model
The observed microwave radiances at the top of theatmosphere originate partly at the earth’s surface andpartly from atmospheric constituents. The contributionfrom the earth’s surface depends primarily upon the na-ture of the surface (i.e., water or land) and on the tem-perature of that surface. Atmospheric constituents suchas oxygen, water vapor and cloud water act to absorband emit upwelling radiation. Large precipitation dropsfurther act to scatter upwelling radiation. Because of thevaried, and often complex nature of each of these com-ponents, it is necessary to first understand the radiativeproperties of each of these components before attempt-ing to understand the propagation of radiation throughthe medium.
The emissivity « of a surface at a particular frequency,polarization, and incidence angle is determined by thecomplex index of refraction of the surface as describedby the Fresnel relations (Jackson 1962), as well as thesurface roughness. Ocean and land surfaces must betreated separately. Over ocean, the index of refractionat the TMI frequencies depends primarily upon the sur-face temperature. In the current model, the salinity istaken to be constant at 34.5 ppb. The surface roughnessis typically related to wind-driven waves and thus isrelated to the near-surface wind speed. While the effectsof temperature and salinity are well understood, the ef-fect of surface roughening is much more uncertain. Inthis study, the model of Wilheit (1979) is used to com-pute the ocean emissivity as a function of near-surfacewind speed. While this model provides a satisfactoryfirst-order correction to account for wind-inducedroughening, it is recognized that this is an area of on-going research that requires attention. However, it is notthought to be a dominant source of uncertainty at thistime. Over land, the emissivity depends primarily uponthe soil moisture but also on the soil and vegetationtypes. The surface emissivity is therefore assumed tobe 0.9 corresponding to moderately dry, bare soil, andmodified with a variable fraction of water-covered sur-face (between 0% and 20%) to represent various soilmoistures. The very indirect way in which soil moistureenters into the rainfall retrieval over land has not war-ranted improvement of this parameterization to date.
Among atmospheric absorbers of microwave radia-tion, water vapor, molecular oxygen, and cloud watermust be considered. Water vapor has a weak pressure-broadened absorption line at 22.235 GHz and a strongline at 183 GHz. The 22.235-GHz line is of specialsignificance since all sensors currently used for precip-itation make a measurement near this line (SSM/I at22.235 GHz; TMI at 21.3 GHz, and AMSR at 23.8GHz). Oxygen displays a strong complex of lines at 60GHz as well as a single transition line at 118 GHz. Theatmosphere is relatively clear in the window regionsbetween these absorption lines. In this study, both thewater vapor absorption and the oxygen absorption are

1804 VOLUME 40J O U R N A L O F A P P L I E D M E T E O R O L O G Y
calculated from Liebe et al. (1993). Nonprecipitatingcloud particles of 20 mm are specified in the cloud mod-els. This dimension is much smaller than typical wave-lengths under consideration (3.5 mm to 3 cm), thus per-mitting the use of the Rayleigh approximation. The ab-sorption cross section in this case depends only uponthe dielectric constant of the liquid and upon the thirdpower of the diameter of the cloud droplets. Thus, theabsorption of the cloud water is simply proportional tothe total mass of cloud water and is independent of thedroplet size distribution. Scattering is negligible in thislimit.
As cloud drops coalesce into raindrops, their dimen-sions can get comparable to microwave wavelengths andthe Rayleigh approximation becomes invalid. If parti-cles are assumed spherical, Mie theory may be em-ployed. For shapes other than spheres, solutions like theExtended Boundary Condition Method (Barber and Hill1990), or the discrete dipole approximation (Draine andFlatau 1988) must be employed. The difficulties intro-duced by any of these methods are threefold. The firstis due to scattering parameters exhibiting resonance fea-tures that effectively increase the scattering efficiencybeyond the third power of the drop diameter. This causesthe volume scattering characteristics to depend upon thedrop size distribution. The second difficulty introducedby the larger size parameters is that scattering becomesimportant. In the case of 85 GHz, ice scattering fromprecipitation-size hydrometeors becomes the dominantcharacteristic. Last, it must be mentioned that compu-tationally these codes are all far more intensive than theclosed-form expression of the Rayleigh approximation.The operational version of GPROF uses Mie theory tocompute all single particle scattering properties. This,as noted above, implies that all particles are assumedspherical—even when this is known not to be the case.Assuming spherical particles for rainfall introduces er-rors in the extinction cross section and asymmetry pa-rameter that can account for up to 4 K at very heavyrainfall rates at 19 GHz, with smaller maximum errorsat 10 GHz and slightly larger errors at 37 and 85 GHz.Ice particles are more complicated yet, with unknownparticle sizes, densities, and shapes all affecting the up-welling brightness temperatures. These are currentlyalso treated as spheres despite evidence that orientedice particles can cause polarization differences of up to10 K in stratiform regions associated with strong con-vection. Last, the effect of melting particles is currentlynot considered by GPROF because, once again, thereis not enough observational evidence to suggest howthe bright band should be modeled at this time. Recentstudies by Bauer et al. (1999) and Olson et al. (2001a)begin to address this issue.
Once the radiative properties of the surface and at-mosphere are known or assumed, it is straightforwardto apply radiative transfer techniques to compute thebrightness temperatures emerging at the top of the at-mosphere. A one-dimensional Eddington approximation
is currently being used in the operational version ofGPROF. The details of the Eddington approximation, aswell as its accuracy (1–2 K for the present application),are summarized by Kummerow (1993). While one-di-mensional models can be constructed to better accountfor the inhomogeneity of variability in adjacent cloudmodel profiles and three-dimensional methods havebeen available for a number of years now (e.g., Petty1994; Roberti et al. 1994), these are not used in theoperational version. Sensitivity tests have shown onlyminor impacts on the retrieved rainfall (;1%), and itwas felt that the faster one-dimensional methods wouldbe more practical at this time.
When high-resolution brightness temperature fieldshave been calculated using either plane parallel or Mon-te Carlo methods, it is necessary to simulate the radi-ances as they would be measured from a downviewingmicrowave sensor. For simplicity, GPROF uses the pub-lished resolution of each channel (as defined by the 3-dB gain) to determine the number of cloud model gridelements that must be averaged to best match the res-olution of each channel. Sensitivity studies show thatthe more precise convolution with the exact antennagain function has little effect upon the retrieved rainfallrates. The effects of deconvolution schemes that in-crease the spatial resolution of the observed brightnesstemperatures at the expense of some additional noise(Robinson et al. 1992; Farrar and Smith 1992) have notbeen examined in the context of GPROF.
c. The retrieval procedure
The retrieval procedure follows the Bayesian ap-proach outlined in Kummerow et al. (1996). The vectorx is used to represent all of the physical quantities tobe retrieved in the inversion method, and the vector y0
represents the set of available sensor observations. Fol-lowing Lorenc (1986), it is assumed that the ‘‘best’’estimate of x, given the set of observations y0, is theexpected value,
E(x) 5 · · · xp df (x) dx, (5)EE Ewhere the probability density function pdf(x) is pro-portional to the conditional probability that x representsthe true earth–atmosphere state, xtrue, given that y isequal to the observed y:
pdf(x) } P(x 5 x | y 5 y ).true 0 (6)
The expected value E(x) in Eq. (5) is known as theminimum variance solution for x. The multiple integralsigns in Eq. (5) indicate integration over all dimensionsof the state vector x. Using Bayes’s theorem (again fol-lowing Lorenc 1986), Eq. (6) may be rewritten as
pdf(x) } P(y 5 y | x 5 x ) 3 P(x 1 x )0 true true
} P |y 2 y (x) , «| 3 P (x 5 x ), (7)OS 0 s AS true

NOVEMBER 2001 1805K U M M E R O W E T A L .
where POS is equivalent to the probability that the set ofobservations y0 deviate from the set of simulated obser-vations ys(x) by a certain amount, given the earth–atmo-sphere state x, and « is the uncertainty introduced by theforward modeling assumptions discussed in section 2b. Infuture discussions, POS will be called the probability of theobservational deviation, and PAS is the a priori probabilitythat x is the true state of the earth–Atmosphere.
If it is further assumed that the errors in the obser-vations and the simulated observations are Gaussian,uncorrelated, and with zero mean, then the probabilityof observational deviation can be expressed as
P [y 2 y (x)]OS 0 s
T 21} exp{20.5[y 2 y (x)] 3 (O 1 S)0 s
3 [y 2 y (x)]}, (8)0 s
where O and S are the observation and model errorcovariance matrices, respectively. Substituting for POS
in Eq. (7) using Eq. (8) and then using the resultingexpression to substitute for pdf in Eq. (5), the final ex-pression for the minimum variance solution is
T 21x exp{20.5[y 2 y (x)] (O 1 S) [y 2 y (x)]}0 s 0 sE(x) 5 · · · P (x 5 x ) dx, (9)EE E AS trueA
where A is the normalization factor
T 21A 5 · · · exp{20.5[y 2 y (x)] (O 1 S)EE E 0 s
3 [y 2 y (x)]}P (x 5 x ) dx.0 s AS true
(10)
The approach utilized in the present study is to make
an approximate evaluation of the integral form of theminimum variance solution, Eq. (9). A sufficiently largedatabase of atmospheric profiles and associated bright-ness temperatures is generated using output of the cloud-resolving models (section 2a) in conjunction with theforward passive microwave radiometer model (section2b). Using the large atmospheric profile–radiative da-tabase, the integral form of the minimum variance so-lution, Eq. (9) can be approximated by
T 21exp{20.5[y 2 y (x )] (O 1 S) [y 2 y (x )]}0 s j 0 s jE(x) 5 x , (11)O j Aj
where A is the normalization factor:T 21A 5 exp{20.5[y 2 y (x )] (O 1 S)O 0 s j
j
3 [y 2 y (x )]}. (12)0 s j
The integrals in Eqs. (9) and (10) are replaced by thesummations in Eqs. (11) and (12) over all model sim-ulated profiles (xj) in the atmosphere–radiative modeldatabase. Here the main assumption is that profiles inthe model database occur with nearly the same relativefrequency as those found in nature, or at least with thesame frequency as those found in the region where theinversion method is to be applied. Under this assumptionthe weighting by PAS(x 5 xtrue) in the integral form [Eq.(9)] is represented simply by the relative number ofoccurrences of a given profile type xj in the summation[Eq. (11)]. Since the profiles are simulated using a modelthat incorporates most relevant physical processes of theearth and atmosphere, the relative abundance of profilesof a certain type should be roughly the same as thoseof naturally occurring profiles if 1) the atmosphericmodel is used to simulate cloud development over the
range of environments that are observed in the regionof interest; 2) each cloud model simulation is sampledat regular time intervals, such that no particular stageof cloud or cloud system development is favored overanother; and 3) the model is sufficiently complete as toyield realistic simulations. The degree to which a break-down of these assumptions can cause random and sys-tematic errors is a topic of current research.
2. Algorithm improvements
Figure 1 shows a comparison of rainfall rates derivedbefore (version 4) and after (version 5) improvement ofthe GPROF algorithm. As can be seen from Fig. 1, thegeneral patterns are quite similar but the latest versionhas much better defined convective areas and much lessrainfall in the stratiform regions between rain bands thanits predecessor. Qualitatively, this agrees much betterwith the rainfall structure derived from the precipitationradar (bottom panel). Validation of rainfall rates andaccumulations, as will be seen in the subsequent section,yields often contradictory information. Changes to the

1806 VOLUME 40J O U R N A L O F A P P L I E D M E T E O R O L O G Y
FIG. 1. Comparison of the TRMM GPROF algorithms: (top) theat-launch algorithm (version 4), (middle) the current product (version5), and (bottom) current PR estimated rainfall.
algorithm were therefore motivated primarily by phys-ical arguments rather than agreement with validationdata. A list of improvements, as well as the rationalefor undertaking these improvements, is presented next.
a. Improved freezing level over oceans
While already incorporated in version 4 of the al-gorithm, a change in the freezing-level height deter-mination is included here because it represents a sig-nificant change from the algorithm description pub-lished previously. Early versions of the GPROF algo-rithm (pre-1998) made use of climatological freezinglevel data in order to choose from the appropriate subsetof a priori cloud models (those matching the presumedfreezing level). This caused the algorithm to signifi-cantly overestimate the rainfall at mid- and high lati-tudes. An example of this overestimation occurred dur-ing the Third WetNet Precipitation Intercomparison Pro-ject (PIP-3) intercomparison (Adler et al. 2000). Thecause for this overestimation was the very low freezinglevel prescribed by the climatological data at high lat-itudes during winter conditions. Comparisons betweenradar-derived freezing levels and those prescribed byclimatological data were used to verify that freezinglevels within raining systems were often significantlyhigher than that prescribed by climatological data. Thefreezing-level height determined from the microwavesensor itself, as described by Wilheit et al. (1991), andsubsequently validated (Bellows 1999) was thereforeimplemented. The modified algorithm reduced the ar-tificially high rainfall at high latitudes to values thatwere comparable to both the emission algorithm de-scribed earlier as well as available climatological da-tasets of rainfall.
b. Convective–stratiform discrimination
The most significant improvement of GPROF, as men-tioned at the outset, is an improved treatment of theconvective–stratiform separation by the algorithm. Thisclassification is done prior to the inversion. The areafraction of convection within the TMI footprint, derivedfrom the brightness temperature data, is then treated asan additional parameter that needs to be matched in theBayesian solution. The method used to calculate the areafraction of convection within a TMI footprint drawsupon measures of the local horizontal gradients (or tex-ture) of brightness temperatures as well as the polari-zation of 85.5-GHz scattering signatures; see Olson etal. (2001b). To date, the convective–stratiform discrim-ination is applied only over oceans where the trueBayesian scheme can be applied. There is some evidencethat it is also a useful parameter over land, but studiesare still ongoing.

NOVEMBER 2001 1807K U M M E R O W E T A L .
1) TEXTURE-BASED ESTIMATES OF CONVECTIVE
FRACTION
The basis of this technique is the common observationthat, in convective regions, which are characterized bylocally strong updrafts and downdrafts, the horizontalvariations of liquid and ice-phase precipitation are rel-atively large. In contrast, stratiform regions are char-acterized by relatively weak and horizontally uniformupdrafts and downdrafts, and these are associated withfairly uniform distributions of precipitation.
The difference of the horizontal texture of convectiveand stratiform precipitation fields was first exploited byChurchill and Houze (1984), who identified convectivecenters in horizontal radar scans using the local maxi-mum of reflectivity as an indicator. Similarly, Hong etal. (1999) related local maxima of emission and scat-tering in SSM/I brightness temperature imagery (asso-ciated with local maxima of liquid and ice-phase pre-cipitation, respectively) to the areal fraction of convec-tion within a footprint. The method was calibrated usingcollocated observations from the TOGA COARE ship-board radars. The relationships between emission andscattering texture and convective fraction were gener-alized to observations of the TMI by synthesizing TMIradiances using the radar data in combination withcloud-resolving model simulations.
2) POLARIZATION-BASED ESTIMATES OF
CONVECTIVE FRACTION
A second method for estimating convective fractionfrom passive microwave data was spurred by analysesof SSM/I observations by Spencer et al. (1989) andHeymsfield and Fulton (1994a,b). These authors foundsignificant differences, on the order of 5 K or greater,between the vertically and horizontally polarized 85.5-GHz brightness temperatures in stratiform rain regionsover land, whereas regions of strong convection werenearly unpolarized at 85.5 GHz. Although the physicalbasis of these polarization differences has not been ver-ified, the aforementioned authors hypothesized that pre-cipitation-sized ice particles such as snow or aggregateswould tend to become oriented as they fall through therelatively weak updrafts or downdrafts of stratiform rainregions, resulting in preferential scattering in the hori-zontal polarization. The more turbulent, vigorous up-drafts of convective regions would cause ice hydro-meteors to lose any preferred orientation, leading tosimilar scattering signatures in both polarizations. Thishypothesis is supported by recent radiative modelingstudies by Petty and Turk (1996), Schols et al. (1997),and Haferman (1999).
Polarization signatures in SSM/I observations wererelated to the areal fraction of convection within a foot-print by Olson et al. (1999), who used these to constrainGPROF retrievals of precipitation and latent heating.The method was later refined to account for the increase
of polarization with scattering at 85.5 GHz in stratiformareas (Olson et al. 2001b).
3) MERGER OF TECHNIQUES
The texture and polarization-based estimates of con-vective area fraction within a TMI footprint are mergedby taking a weighted average of the estimates. Theweighting is specified as the inverse of the error varianceof each of the estimates, which allows for an optimalcombined estimate (Daley 1991). An estimate of theerror variance of the texture-based convective fractionis based upon previous intercomparisons of TMI-basedconvective fractions and coincident ground-based radarobservations. The authors of this study found greateruncertainty in convective fraction estimates when therewas a mixture of convective and stratiform precipitationwithin the radiometer footprint, while in the middle oflargely convective or stratiform regions the uncertaintywas reduced. From theoretical considerations, the errorof the polarization-based convective fraction estimate isinversely proportional to the 85.5-GHz scattering de-pression. Formulas for the convective fraction estimates,error variances, and the combined estimate of convec-tive area fraction may be found in Olson et al. (2001b).
4) ADDITION OF THE ‘‘CONVECTIVE PROFILE’’ TO
THE SEARCH CRITERIA
One shortcoming of earlier versions of GPROF thatbecame apparent immediately after the launch of theTRMM satellite was the artificially large extent of heavyprecipitation surrounding convective cells. This is ap-parent in Fig. 1. In contrast, radar observations of or-ganized precipitation systems typically show a stronggradient of rain intensity, with the highest rain ratesassociated with convection but falling off quickly in thetransition and ‘‘purely’’ stratiform regions.
The apparent positive bias of early GPROF rain ratesin regions surrounding convection was attributed to twofactors. First, theoretical studies indicate greater micro-wave emission from horizontally uniform precipitationfields than from horizontally inhomogeneous fields, fora given footprint-averaged rain rate. This is known asthe ‘‘beamfilling’’ problem and has been discussed inthe literature (Wilheit et al. 1991). Because of the al-iasing caused by the inhomogeneity of rainfall within asatellite footprint, the mean rain rate associated with agiven set of brightness temperatures in the GPROFcloud model database tends to be much lower for thesubset of simulated stratiform footprints relative to themean rain rate associated with the subset of convectivefootprints. Since the database contains a mixture of sim-ulated convective and stratiform footprints, a searchbased upon brightness temperature data alone wouldtend to yield a positive bias of rain estimates in strat-iform regions and a negative bias of rain estimates inconvection.

1808 VOLUME 40J O U R N A L O F A P P L I E D M E T E O R O L O G Y
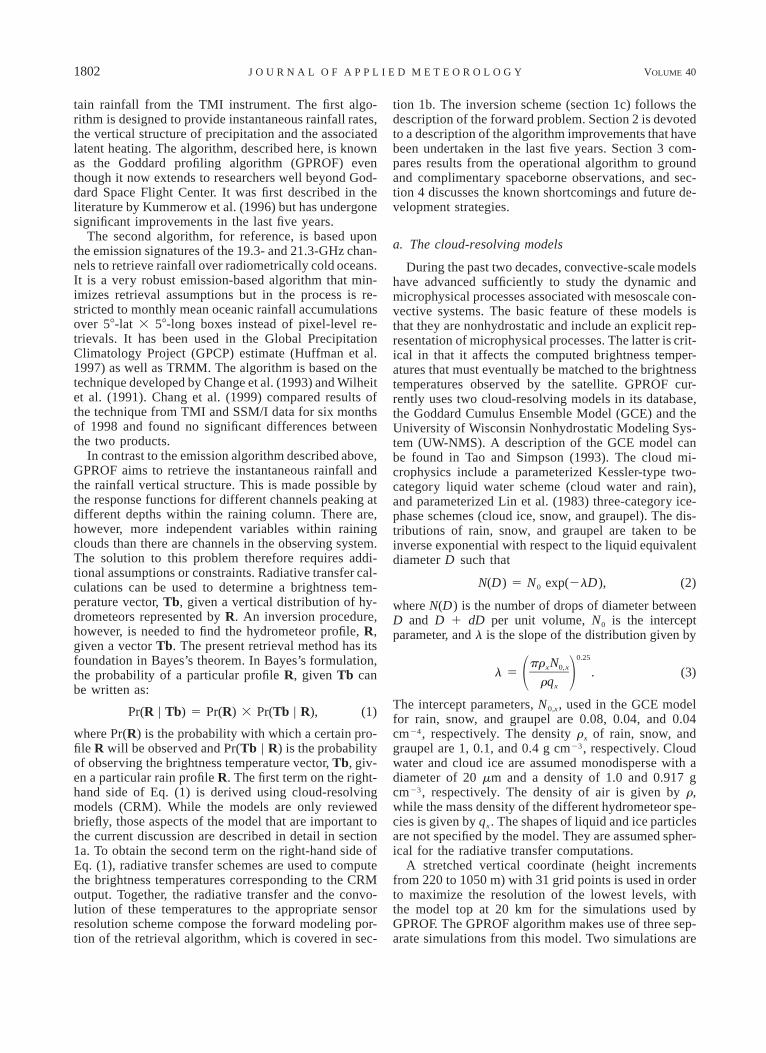
FIG. 2. Comparison of 30-min mean mesonet estimates with estimates from a correspondingTMI overpass around 0815 UTC 12 Mar 1999. Rainfall rates are in millimeters per hour.
A second factor is related to the statistical distributionof rain rates in the GPROF database. Most of the cloudmodel simulations in the current database favor con-vection; that is, horizontally extensive stratiform rainregions are not represented in proportion to their oc-currence in nature. This means that stratiform rainevents represented in the cloud model database typicallyoccur in close proximity to convection. The reasons forthis ‘‘convective bias’’ may be due to deficiencies inthe current cloud model microphysical schemes or to
the fact that the environmental forcing prescribed in themodel simulations (e.g., vertical wind shear and the na-ture of the dynamic forcing) is not favorable for thedevelopment of extended stratiform regions. The neteffect of this statistical bias is that even if the searchroutine in GPROF is constrained to consider only sim-ulated stratiform footprints in the database, these willlikely come from regions in close proximity to convec-tion where rain rates are typically far less homogeneousthan those at greater distances from convection.

NOVEMBER 2001 1809K U M M E R O W E T A L .
To help to reduce the aforementioned biases associ-ated with stratiform rain, a filter is applied to derive thehorizontal profile of maximum convective area fractionwithin three scan lines (about 40 km) of the footprintbeing analyzed by GPROF (see Olson et al. 1999). Thesearch method in GPROF is also modified to identifysimulated footprints in the cloud model database thatmatch not only the observed radiance data but also theobserved profile of maximum convective fraction.Therefore, if a stratiform footprint is analyzed byGPROF, and the nearest ‘‘convective’’ footprint in theTMI swath is 30 km distant, then the search routine inGPROF is modified to look for a similar stratiform foot-print in the cloud model database. Mathematically, theadditional search criteria take the form of an additionalconstraint term in the arguments of the exponentials inEqs. (11) and (12).
The result of this modification to GPROF is a sig-nificant decrease of precipitation in stratiform areas, es-pecially in those areas far from convection. The result-ing vertical hydrometeor profiles also show the correctbehavior, with a general absence of cloud liquid waterand evidence of rain evaporation below the freezinglevel in stratiform regions.
c. Use of emission and scattering indices
The Bayesian methodology requires that each channelbe weighted by the inverse of the variance or uncertaintyin that channel. The uncertainty is the sum of the un-certainty in the measurement (sensor noise, NEDT) plusthe uncertainty in the forward model. The latter is notwell defined at this time, as it depends upon errors inthe cloud dynamical model, the radiative transfer meth-ods, or linkages between them (e.g., the spherical dropassumption). Version 4 of GPROF assigned equalweights to all sensor channels. Version 5 uses the po-larization-based emission and scattering indices as de-fined by Petty (1994). The indices have the advantagein that they isolate the signal coming from the rain clouditself from the background variability and they aremonotonic functions of the rainfall emission or ice scat-tering intensity. They also decouple the effects of scat-tering from emission–attenuation effects, thus facilitat-ing the discrimination of frozen hydrometeor from liq-uid precipitation and cloud. As such, they are betterrelated to the uncertainties needed by the inversionmethod that should lead to improvements in the future.At present, however, little progress has been made indefining the uncertainties. The emission indices and theconvective–stratiform (C–S) classification vary between0 and 1 and are given equal weight. Scattering indicesmeasure the net scattering signal coming from the cloudand vary between zero, no scattering, and ;150 K invery strong thunderstorms. Scattering indices are nor-malized by a factor of 100, so that scattering indiceshave approximately the same magnitude as the otherindices. The covariance matrix [O 1 S in Eq. (11)] in
this formulation is therefore replaced by a diagonal 73 7 matrix for the four emissions, two scattering andthe convective–stratiform index. Because cross corre-lations among indices are not well understood, partic-ularly from the modeling perspective, they are currentlyignored. The value of the matrix elements representingthe brightness temperature uncertainties is currently setat an equivalent of approximately 8 K for all elements.Work is under way to improve upon this initial frame-work, but the value of 8 K was chosen empirically asthe smallest value before the algorithm begins to findno matches between observations and database simu-lations and thus becomes artificially noisy.
d. Use of the NESDIS operational rainfallrelationship over land
The TMI GPROF land rainfall algorithm was mergedwith the National Environmental Satellite, Data, andInformation Service (NESDIS) operational algorithm.While version 4 routines are still used to quality controldata, the NESDIS operational rainfall relations were im-plemented in version 5. Since rainfall over land dependsupon the scattering signature only, not enough radio-metric information exists to justify the physical inver-sion carried out over oceans. As such, rainfall relationsover land need to be calibrated using independent mea-sures of precipitation. In addition, a great deal of caremust be used to screen a multitude of cold surfaces,which, under the right conditions, can be easily mis-interpreted as rainfall. Implementing the broadly usedNESDIS algorithm over land was intended to reducethe number of parallel algorithms in order to concentratethe improvement efforts. Incorporating the algorithminto the GPROF structure was done in order to facilitateaccess to rainfall products for users needing rainfall overboth land and ocean.
1) RAINFALL RELATION
GPROF was modified to produce rainfall rates similarto those of the NESDIS operational rainfall algorithm(Ferraro 1997). The basis of the NESDIS algorithmcomes from the work of Grody (1991), who developeda global, empirical, scattering index (SI) using the 19-,22-, and 85-GHz vertically polarized SSM/I channels.Ferraro and Marks (1995) calibrated the SI with ground-based radar rainfall estimates to produce instantaneousrain rates. The form of the rainfall rate estimation equa-tion is
1.9468RR 5 (0.005 13) 3 (SI) , (13)
where RR is in millimeters per hour, and SI is definedby:
SI 5 (451.9 2 0.044Tb 2 1.775Tb19V 22V
21 0.005 75Tb ) 2 Tb , (14)22V 85V

1810 VOLUME 40J O U R N A L O F A P P L I E D M E T E O R O L O G Y
where Tb denotes the brightness temperature and thesubscript refers to the appropriate channel.
The NESDIS algorithm was reconstructed within theGPROF framework by restricting the models in the apriori database to only those that fit the predeterminedregression line established in Eqs. (13) and (14). Anadvantage of this procedure is that once the regressionis established, it can easily be applied to other sensors.The relations of Eqs. (13) and (14) were derived for theSSM/I sensor. The appropriate TMI database was thencomputed using the radiative transfer simulations withthe same cloud model output as for the SSM/I database,accounting for the changes in frequency and resolutionbetween the two sensors. Because the differences be-tween the brightness temperatures at 21 and 22 GHzover land are very small, these can be interchangedwhen adopting the NESDIS algorithm for use with theTMI.
The difference between the 21V and the 85V bright-ness temperatures is used to compare the satellite bright-ness temperatures with those of the vertical hydrometeorprofile database. In GPROF version 4, the only criterionused to select profiles was the horizontally polarized 85GHz. While it is generally not beneficial to use low-frequency channels over land because of the variableemissivity of the land surface, it is possible to take thetemperature of the land surface into account by usinga combination of low-frequency channels to determinethe background temperature field. The NESDIS algo-rithm uses a combination of the 19- and 21-GHz chan-nels to accomplish this goal as seen in Eq. (14). Thevertical polarization is used to reduce the sensitivity toemissivity changes over land areas (Grody 1991).
2) IMPROVED COLD SURFACE SCREENING
In addition to modifying the estimated rainfall rates,however, a new procedure was developed to better clas-sify (‘‘screen’’) each land pixel as ‘‘raining,’’ ‘‘non-raining,’’ or unclassifiable (‘‘indeterminate’’). GPROFversion 4 used the screening methodology of the God-dard scattering algorithm GSCAT2 (Adler et al. 1994).As shown in Ferraro et al. (1998), there are many viablescreening techniques available for use with the SSM/I.The new algorithm incorporates the best features of theNESDIS and GSCAT2 screening methodologies.
SSM/I data were used for a comparison of the NES-DIS and GSCAT2 screening procedures. The conclu-sions from this comparison should apply to both theSSM/I and TMI algorithms, because both simulated andactual data were used to show that the slight differencesin frequency do not result in significantly differentbrightness temperatures for the SSM/I and TMI. TheGSCAT2 screening procedure appears to be more glob-ally robust, because there are regions and times whenthe NESDIS algorithm incorrectly classifies meltingsnow as rain, while the GSCAT2 screening results inan indeterminate classification. Thus, the GSCAT2
methodology with a new postprocessing procedure isused in version 5.
Visual inspection of estimated rainfall fields showsthat GSCAT2 often makes indeterminate classificationsnext to legitimate rainfall areas, which suggests thatpixels with rain are classified as indeterminate. Some-times the indeterminate pixels are even surrounded byrain. To help to resolve these situations, a postprocessingstep that uses spatial information to reclassify indeter-minate pixels was added. This postprocessing consistsof searching the vicinity of the indeterminate pixels andif there is a consensus of either rain or no-rain classi-fications in the vicinity, the indeterminate pixels arereclassified to match the surrounding pixels.
Figure 2 illustrates the benefit of using spatial infor-mation to reclassify indeterminate pixels. The figureclearly shows that large areas that were previously clas-sified as indeterminate are now classified as raining.This agrees qualitatively with the Oklahoma Mesonetdata (Brock et al. 1995). The mesonet consists of 113rain gauges throughout Oklahoma. The rain gauge datawithin each 0.58 are averaged to produce the meansshown in the figure. No estimates were made in fourgrid boxes because of the lack of rain gauges at theselocations. The mesonet data support the version-5 non-zero rain estimates that are not made using the GSCAT2screen because of indeterminate classifications.
A sample comparison of instantaneous rainfall esti-mates from SSM/I and TMI overpasses occurring atapproximately the same time on 8 January 1999 isshown in Fig. 3. As with other days tested, there is veryclose correspondence between the NESDIS SSM/I(SSM/I SI) algorithm estimates produced from Eqs. (13)and (14) (top panel), the SSM/I GPROF rainfall esti-mates (middle panel), and the TMI GPROF (version 5)estimates (bottom panel). In addition, the screens de-veloped using SSM/I data show even better performancewith the TMI data, because there are fewer indetermi-nate classifications. This is due to the reduced inho-mogeneity within the smaller TMI fields-of-view.
3. Comparisons with independent rainfall data
Because of the difference in the underlying physicsof the GPROF algorithm over oceans and land, com-parisons with other data sources are carried out inde-pendently for the two background types. The compar-isons, as will be seen, yield mixed results, with no clearindication that there is, or is not, any systematic problemwith the rainfall products.
a. Rain gauge data
1) PACIFIC ATOLL DATA
Rain gauges located on Pacific atolls are used forcomparisons with GPROF version-5 results. The areacovered by the atolls extends from approximately 258S

NOVEMBER 2001 1811K U M M E R O W E T A L .
FIG. 3. Instantaneous rainfall estimates (mm h21) from SSM/I andTMI overpasses occurring at nearly the same time on 8 Jan 1999.The estimates are from the following algorithms: (top) NESDIS SSM/I, (middle) the new SSM/I GPROF, and (bottom) the new TMIGPROF.
to 158N and from 1308E to 1308W. While the numberof quality-controlled gauges varies from month tomonth, the numbers vary between 20 and 40. Only 3–4 grid boxes (depending upon the number of gauges)typically contain more than one gauge in any given 2.58grid box. Details of the gauge network and the qualitycontrol procedures can be found in Morrissey et al.(1995). The sources of error are multiple. From the sat-ellite side, the algorithm errors depend both on the sam-pling errors as well as the retrieval errors. Samplingerrors for satellite platforms are primarily a function ofthe revisit times and rainfall frequency, which is wellrelated to rainfall accumulation in the Tropics. As such,locations with higher rainfall amounts should havesmaller relative errors. Fortunately, this error is randomand for the time interval considered here should produce
no overall bias. From the rain gauge perspective, onemust allow for three possible error sources: 1) rainfallmay not be homogeneous over the 2.58 grid box therain gauge is supposed to represent—while this maysound like a simple assumption, the movement of theITCZ may at times make this assumption less than idealfor individual gauges; 2) the rain gauges may, at times,operate improperly—with few rain gauges, it can bedifficult to apply perfect quality control procedures—and thus, while great care is taken of these gauges, thereis no guarantee that they are all estimating properly,which could lead to an underestimate by the gauge net-work; and 3) the atolls themselves are assumed not tobe enhancing convection and thus providing higher-than-average rainfall relative to the surrounding gridbox.
Figure 4a shows a scatter plot of the satellite accu-mulation over 30-day, 2.58 grids, versus the 30-day raingauge average when all atoll gauges are considered.Figure 4b shows the same results, but considering onlythose 2.58 grid boxes that contain at least two atoll gaug-es. The scatter of points is due primarily to the samplingdifference between the two data sources. Biases wouldindicate fundamental problems with one dataset or theother. In this case, biases are small (29%, GPROF un-derestimates) when all gauges are used, and reversingto 16% (GPROF overestimates) when only grid boxeswith two gauges are considered. Correlations are highin both cases, namely, 0.85 for all gauges and 0.91 forgrid boxes with two or more rain gauges.
2) GPCC RAIN GAUGES
Figure 5 shows a scatterplot of the GPROF version-5 rainfall in comparison with rain gauge data collectedand analyzed by the Global Precipitation ClimatologyCentre (GPCC) of the Deutscher Wetterdienst. TheGPCC begins by interpolating available rain gauge datainto a 0.58 latitude–longitude grid. These points are thenaveraged over a 2.58 grid. Rudolph et al. (1996) give adetailed description of the procedure. The rain gaugeproduct incorporates approximately 6700 rain gauges,but the quality of the estimate varies depending uponthe number available in any given grid box. The num-bers vary from less than 1 gauge per 2.58 grid in sometropical locations to as many as 50 in the highly pop-ulated industrial countries.
Rain gauge data represent the continuous accumu-lation over a few square centimeters as compared withthe large area averages from approximately 30 instan-taneous overpasses by the TRMM satellite. A largeamount of scatter is therefore expected. Bell et al. (2001)present details of the expected sampling errors from aTRMM-like orbit. Results indicate that random sam-pling errors may be approximated by s/R (%) 50.26R20.27 (R: mm21), which leads to a sampling errorof approximately 30% for accumulations of 500 mm

1812 VOLUME 40J O U R N A L O F A P P L I E D M E T E O R O L O G Y
FIG. 4. Comparison of monthly (2.58) GPROF version-5 oceanic rain estimates with rain gauge data from low-lying atoll sites: (a) all gridboxes having at least one atoll gauge; (b) grid boxes having at least two rain gauges.
FIG. 5. Comparison of monthly (2.58) GPROF version-5 land rainestimates with rain gauge data from the GPCC project.
month21. Sparse rain gauges in a number of grid boxescontribute to an additional source of uncertainty.
Despite significant random errors, biases should besmall when 6700 gauges are considered. Overall, theGPROF version-5 algorithm is seen to have a positivebias (117%) and a correlation of 0.80 with the analyzedgauge product. While it appears that significant numbers
of gauges are available over land, it must be recognizedthat most of these gauges are concentrated over indus-trialized nations and do not necessarily represent a trueglobal mean.
b. Kwajalein Atoll radar data
GPROF ocean rain estimates are compared with rain-fall derived from the ground-based radar operated at theKwajalein Atoll. This S-band polarized (WSR-93D) ra-dar has been operated at Kwajalein Atoll, Republic ofthe Marshall Islands, since the launch of TRMM as partof the TRMM validation effort. The radar is located at8.728N, 167.738W. It has been operated continuouslyexcept for a 3-month period (mechanical difficulties)and maintenance periods. (Details on the radar and itsoperation can be found at http://trmm.gsfc.nasa.gov.)Two groups, using separate techniques, make rainfallestimates from this radar. The first is the TRMM officialalgorithm.
The official algorithm recognized that radar calibra-tion would always be a large source of error in makingquantitative rainfall estimates. To overcome this prob-lem, a bulk-adjustment approach was adopted to forcethe radar data into agreement with collocated rain gaug-es. Rain maps are generated by interpolating the rawpolar radar data onto Cartesian coordinates with a hor-izontal resolution of 2 km. Rainfall is classified intoconvective and stratiform rain according to the hori-zontal radar reflectivity structure developed by Steineret al. (1995). For each type of rainfall, the monthlyaccumulation of the radar pixels [derived using a default

NOVEMBER 2001 1813K U M M E R O W E T A L .
FIG. 6. Comparison of instantaneous GPROF version-5 oceanicrainfall estimated with operational TRMM estimates made from theKwajalein radar. The size of the open circles indicates the percentageof the radar covered during a given satellite overpass. FIG. 7. Surface classification used by GPROF in the Kwajalein
vicinity. Shaded areas correspond to coastal grid boxes, while whiteareas are deemed oceanic.
relationship of Z 5 300R1.4, Fulton et al. (1998)] directlyabove each gauge location is compared with the 7-minrain gauge accumulation for the corresponding gauge.A final, gauge-adjusted relationship between radar re-flectivity (Z) and rainfall rate (R) is derived for eachsite and for each month using
1.4 1.4Z 5 300(R /G ) R ,i i i i (15)
where R is the total rainfall accumulated by the radarover the locations of the gauges that passed a qualitycontrol procedure, G is the rainfall accumulated fromtipping-bucket rain gauge data, and the subscript i refersto either convective or stratiform rainfall. Rain ratesfrom gauge and radar data were both accumulated over7-min intervals, but tests showed that results do notchange much for different time intervals. This bulk ad-justment is applied to one month of data from each site,with separate Z–R relationships derived for convectiveand stratiform rainfall. If the total rainfall accumulatedover all of the gauges for a month is less than 250 mm,then the bulk adjustment procedure is applied to con-secutive months of data.
Comparisons between the GPROF product and therainfall products generated by the above algorithm forall overpasses in 1998 are presented in Fig. 6. The ab-sence of points on either axis points out that over areasof 18 or so, discrimination between rain and no rain isnearly perfect over oceans. Of the 283 overpasses hav-ing data in 1998, 144 were classified as having no rainin both the satellite and radar; 126 were classified ashaving at least 0.01 mm h21 in both satellite and radar,and only 13 cases were recorded in which either thesatellite or radar recorded greater than 0.01 mm h21,while the other one recorded no rain. This represents
less than 4.5% misclassification, and it is always withlight rain. At a resolution of 25 km commensurate withthe TMI low-resolution channels, approximately 22 300coincident grid boxes were observed. Of these, 20 240were classified as nonraining by both the TMI and theKwajalein radar, while 1606 grid boxes were correctlyclassified as raining by both instruments, and 474 weremisclassified as raining (R . 0.5 mm h21) by either theTMI or the radar but not the other. The number of mis-classified pixels reduces to 234 if a threshold of 1 mmh21 is used to define rainfall.
The results shown in Fig. 6 correspond to accumu-lations over the radar coverage that is deemed to be‘‘ocean’’ by the retrieval algorithm. While Kwajaleincan be thought of as a pure oceanic environment, theGPROF surface-type mask has sufficient spatial reso-lution (0.258) that it recognizes the atoll as being a mix-ture of land and ocean. As such, it classifies some ofthe pixels as coastline. Figure 7 shows the classificationof the area surrounding Kwajalein. The dark areas areconsidered to be ‘‘coast.’’ In the operational version ofthe algorithm, coastline is treated as ‘‘land’’ and thesepixels are therefore excluded from the comparison. Thecomparisons are for instantaneous rainfall averaged overthe entire area of overlap between the satellite and theground-based radar. The different size circles are usedto indicate the percent coverage of the domain, with100% signifying the entire ocean area. Given the mix-ture of ocean and coast areas, as well as an often in-complete coverage of the entire radar FOV, the meanarea of overlap is approximately 18 3 18 but varies fromoverpass to overpass. The correlation between the two

1814 VOLUME 40J O U R N A L O F A P P L I E D M E T E O R O L O G Y
FIG. 8. Mean zonal profiles of precipitation from selected TRMMproducts over (a) ocean and (b) land. Numbers indicate the productreferenced to the TRMM Data and Information System, where‘‘2A12’’ is the current GPROF-V5 algorithm, ‘‘2A25’’ refers to thePR rainfall products, and ‘‘3A11’’ refers to the microwave emissionalgorithm described in the introduction.
TABLE 1. Major sources of uncertainty in three TRMM algorithms.
Algorithm Freezing-level height Rain inhomogeneity DSD
TMI–Emission (3A11) Error in freezing level linearlyrelated to error in surface rain
Constant factor Not a significant source oferror
GPROF-V5 (2A12) Same procedure as 3A11 Factor varies with C/S ra-tio
Not a significant source oferror
Precipitation radar (2A25) Not a significant source of error Small effect A priori assumption sensi-tive to errors
estimates is quite high, with r 5 0.95 for the entire yearof 1998. Biases, however, are significant, with theGPROF estimate being 32% lower than the ground-based radar. This result would imply that GPROF, de-spite being positively biased relative to the other TRMMproducts, is still too low when compared with the Kwa-jalein radar data.
An independent estimate of rainfall over Kwajaleinis made by the University of Washington TRMM group(http://www.atmos.washington.edu/gcg/MG/KWAJ). Intheir estimate, the overall calibration of the Kwajaleinradar is first adjusted to match the TRMM precipitationradar, which is known to be quite stable and thought tobe calibrated to 61 dBZ (Kummerow et al. 2000). Un-like the bulk adjustment method, this technique usesclimatological drop size distributions measured byMueller and Sims (1967) and recently confirmed duringthe TRMM field experiment at Kwajalein. While resultswere not yet available for all of 1998 from this tech-nique, monthly accumulations during the three mostrainy months (accounting for over 80% of the total ob-served rain in 1998) tend to be significantly lower thanthe ‘‘official’’ products described above. Rainfall totalsfor the three months of overlap show this techniqueyields only 57% of the rainfall produced by the bulkadjustment technique. When compared with this tech-nique, GPROF would therefore overestimate rainfall byapproximately 17% (instead of underestimating by32%). In short, even ‘‘calibrated’’ radar rainfall esti-mates are still uncertain to at least 625%.
c. Other TRMM estimates
1) SURFACE RAIN-RATE COMPARISONS
Figure 8 compares zonal mean rainfall estimates fromthe GPROF algorithm with other TRMM products. Thetop panel of Fig. 8 corresponds to oceanic estimateswhere GPROF is compared with the TMI emission al-gorithm described in the introductory section and theTRMM precipitation radar (PR) algorithms. The PR al-gorithm is described in detail by Iguchi et al. (2000).Of greatest importance to this paper may be the factthat, for light and moderate rainfall rates (,10 mm h21),the PR algorithm must use an a priori drop size distri-bution, while for heavy rainfall the PR must correct forattenuation of the radar beam. Both factors can introduceerrors into the PR products. Table 1 presents a shortsynopsis of the main uncertainties of the three algo-

NOVEMBER 2001 1815K U M M E R O W E T A L .
FIG. 9. Histograms of rainfall rates derived from GPROF (2A12)vs PR (2A25) for (top) individual footprints and (bottom) rainfallaveraged over 0.58 grid boxes.
rithms compared in Fig. 8. The double peak in the Trop-ics occurs from the preferred location of the intertropicalconvergence zone (ITCZ) during the course of one yearat these two locations. Comparisons with the emissionalgorithm at the 58 monthly gridbox level reveals a verysmall bias (16% for GPROF) and a correlation of 0.97.The zonal means are generally in good agreement out-side the Tropics, but the emission algorithm displays amarkedly smaller amplitude in the ITCZ. The cause forthe emission algorithm’s smaller dynamic range acrossthe ITCZ is speculative at this time but is consistentwith the fixed beamfilling correction applied by theemission algorithm as opposed to the dynamic assign-ment made by the convective–stratiform partitioning.Convective fractions are higher in the ITCZ as deter-mined by both the GPROF algorithm and the PR al-gorithms and would therefore lead to larger dynamicrange than if the rain type (and hence horizontal in-homogeneity) were held constant. This argument is sup-ported by the precipitation radar, which is less sensitiveto the beamfilling errors. It shows lower overall accu-mulations but similar trends in the zonal means. Thebias, with respect to the PR, is 123% over oceans, andthe correlation with GPROF on a monthly 58 grid boxis 0.94. The reason for the 23% bias remains an areaof active research. The somewhat smaller correlation(despite the greater similarity in the shapes of the zonalmeans) is likely due, at least in part, to the differentsampling of the two instruments.
Over land (Fig. 8, bottom panel), comparisons of theGPROF version-5 rain estimates also appear higher thanthe PR. The bias in this case is 120% and the correlationfor monthly 58 grids is 0.90. This bias is consistent withthe GPCC gauges examined in the previous section. Thebiggest differences in magnitude, however, are presentin the ITCZ where there are very few gauges. The GPCCgauges are concentrated in the 208–308 latitude beltwhere both sensors agree quite well. As such, the tworesults are not yet fully consistent.
The top panel of Fig. 9 presents histograms of rainfallrates at the individual pixel level for GPROF version-5 results in comparison with the precipitation radar.While there are differences at the very light rainfall rateswhere both sensors lose sensitivity, the overall shape ofthe histograms is seen to agree quite well except forsecondary peaks in the GPROF products. These peaksare the result of incomplete databases that tend to clusterresults around some preferred values. More profiles infuture releases will solve this problem. Histogramsshown in the bottom panel of Fig. 9 correspond to 0.58average rainfall rates. These histograms are nearly in-distinguishable.
2) VERTICAL STRUCTURE COMPARISONS
The vertical structure from the TMI and PR algo-rithms is compared in Fig. 10. Comparisons are madefrom the surface to 8 km with an interval of 1 km. Direct
comparisons, however, cannot be made because the TMIgenerates liquid–ice water concentrations above the sur-face while the PR derives an equivalent rainfall rate. Anequivalent rainfall rate is obtained for the TMI productsby applying the technique described by Yang and Smith(1999, 2000). This rain profile is further scaled to theoriginal TMI estimate in order not to introduce any ad-ditional biases from the conversion algorithm. TMI andPR rain profiles are first grouped into monthly meansat 58 3 58. Their monthly mean rainfall structures arethen compared over ocean and land separately.
Figure 10 presents comparison results of rain verticalstructure for February 1998, which has been used as abenchmark month for TRMM product intercomparisons.The ratio of the average rainfall rates is shown in the

1816 VOLUME 40J O U R N A L O F A P P L I E D M E T E O R O L O G Y
FIG. 10. Comparison of GPROF and PR vertical profiles of hy-drometeor profiles converted to an equivalent rainfall rate: (top) thebias in equivalent rainfall rates, (middle) the bias between the twoestimates, and (bottom) the correlation.
upper panel. TMI oceanic rainfall is about 20% greaterthan PR rainfall near surface (consistent with the pre-vious results), but the TMI rainfall rate continues toincrease relative to PR with increasing height above thesurface. Differences in the oceanic ratios become ex-treme at the 6-km level, but an examination of the biasreveals that the bias has gone to nearly zero at thisaltitude. This is due to the loss of meaningful signal bythe PR at this height. The explanation for the increasingdiscrepancy with height lies in the inability of the pas-sive microwave sensor to properly observe the verticalextent of shallow clouds. Because the entire a prioridatabase consists of cloud profiles that extend above thefreezing level, the resulting profiles therefore also ex-tend to at least the freezing level. The precipitation radar,on the other hand, observes these shallow systems butwill underestimate the small liquid water contents aloftwhen these fall below the sensitivity of the sensor. Thesetwo conditions add to produce the apparent large dis-crepancy shown in Fig. 10 at top. While the mean ratioof TMI–PR reaches almost a factor of 2, the bias overoceans remains a comparatively small 40% as indicatedin Fig. 10 at middle. This indicates that the large dis-crepancies occur primarily at the light rainfall rates(which dominate the average ratio) but contribute lessto the overall rainfall accumulations than do the heavyrainfall cases that dominate the overall bias (Fig. 10,middle). The correlation coefficient remains nearly con-stant below the freezing level. This is an indication thatsome systematic differences are being observed. Thedrop in correlation above the freezing level is to beexpected because ice hydrometeors are more difficult tointerpret—particularly any conversions from ice scat-tering signatures to an effective rainfall rate. Results arenearly identical for land precipitation below the freezinglevel. This further lends credence to the hypothesis thatthe cloud model profiles, which in the case of land pre-cipitation simply relate the amount of ice scattering tothe surface rainfall, do not properly match the verticalhydrometeor structure seen by the PR. Above the freez-ing level, the TMI land profiles become much smallerthan the PR profiles. This is likely due to the differentassumptions about ice densities (and hence scatteringefficiency) between the two algorithms.
Monthly rainfall bias over ocean and land is shownin the middle panel. It can be seen that TMI rain over-estimates as much as 42 (58) mm around 3–4 km, whileonly about 19 (10) mm near the surface over ocean(land).
Their correlation coefficient below 4 km is about 0.91for ocean and 0.90 for land. Over ocean, the correlationcoefficient is always greater than 0.6 above 4 km. How-ever, it decreases dramatically above 4 km over land.Since the two algorithms assume somewhat different icecharacteristics, this implies that oceanic precipitation isless variable when it comes to ice characteristics thancontinental convection. A completed comparison anal-ysis of TRMM version-4 rain products can be found in

NOVEMBER 2001 1817K U M M E R O W E T A L .
FIG. 11. Scatter plot for 58 3 58 monthly rainfall accumulationsfrom GPROF and PR. Correlation is 0.91 over oceans and 0.90 overland. Some of the noise is due to the larger sampling volume observedby the TMI.
FIG. 12. Comparison of mean monthly rainfall (Apr–May 1999)over land for 58 latitude bands. The two GPROF TMI versions arecompared with the GPCP satellite-gauge product and the NESDISSSM/I product.
a technical report by Smith and Yang (1998). Compar-ison of that report with the current progress report showsimprovements in the correlation coefficients from 0.6to 0.9 for TRMM version-5 products. The scatterplot of58 monthly mean surface rainfall for TMI and PR isshown in Fig. 11. Much of the scatter is due to thedifferences in the sampling of the two sensors.
d. Comparisons with the NESDIS operationalproducts
As mentioned at the outset of this paper, the NESDISoperational algorithm was adopted over land. This wasdone in part because neither algorithm was demonstra-bly superior to the other. In addition, a lot of effort wasbeing put into improving rainfall estimates in idealizedsituations and not enough attention was being placedon difficult operational issues such as screening of snowcovered surfaces or the careful validation over differentclimatic regimes. The first comparison is therefore be-tween the TMI version-5 algorithm and the NESDISSSM/I rainfall products. These should, by design, bevery similar if not identical. Figure 12 shows the com-parisons of the zonal means and indeed verifies that theTMI version 5 and the SSM/I SI are nearly identical.Both are also very similar to the GPCP product [al-though somewhat higher (;12%)], while version 4 ofthe TRMM algorithm is seen to have had some problemsthat were primarily due to poor screening routines.
4. Known issues and concluding remarks
The GPROF algorithm is continuously evolving asnew sensors [e.g., advanced microwave scanning radi-ometer (AMSR) and AMSR-E] become available, newcloud model databases are generated, or our understand-ing of clouds and precipitation processes improves.Based upon available ground-based data, GPROF ap-pears to be performing within the uncertainties of thesemeasurements. There are, nonetheless, a number of openissues that must still be addressed in order to put thealgorithm on a theoretically firmer ground and to pavethe way for physically derived uncertainty estimates.These are discussed next.
a. Improvements in database and radiative transfermodeling
As a result of the TRMM field campaign, cloud-re-solving models are undergoing significant changes intheir treatment of ice microphysics. This, coupled withcontinuous improvements in the formulation of thesecloud models, will result in even more sophisticatedmodels that are available for the a priori database. New

1818 VOLUME 40J O U R N A L O F A P P L I E D M E T E O R O L O G Y
model simulations will be incorporated into GPROF asthey become available. Uniformly computed latent heat-ing profiles are given as a requirement for the next ver-sion of the GPROF algorithm.
In addition to the improved models, the next versionof GPROF will also replace the simplified one-dimen-sional radiative transfer computation with a fully three-dimensional Monte Carlo code as developed by Robertiet al. (1994), as well as explicit antenna gain functionto convolve the model brightness temperature field toobserved resolution. These changes are not believed tohave a large impact upon the results but do represent amore exact treatment of the problem. The new modelsand radiative transfer codes are explicitly accounted formelting particles. Including the melting layer is ex-pected to reduce the stratiform rainfall by 5% to 10%.
b. Physical inconsistency between PR and TMI
The GPROF and TRMM radar differences need to beresolved through a physically consistent model of pre-cipitation physics, backed by in-cloud observations.Early work by Viltard et al. (2000) has shown that thecurrent PR-retrieved rainfall amounts, when combinedwith a cloud model to fill in the unknown cloud wateramounts, do not yield the observed radiometer bright-ness temperatures. A number of factors or combinationof these can be responsible for the current lack of agree-ment. Smaller drops in the PR-assumed rain profilewould yield consistency, as would a slight reclassifi-cation of PR convective and stratiform rainfall cate-gories [(because these have intrinsically different dropsize distributions (DSD)]. A third issue could be thelack of a melting level in the radiometer algorithm. Eachof these three issues has the correct effect of bringingthe radar and radiometer closer to a physically consistentset of observations. The TRMM field experiments mea-sured all three of the phenomena. While the experimentshave been completed, the data analysis has just begun.It is therefore too early to draw conclusions.
c. High-latitude precipitation
It should be noted that all the model simulations cur-rently used in the GPROF database are tropical in na-ture. This is a reasonably good assumption for TRMMbut is not adequate outside the Tropics. To retrieve rain-fall outside the Tropics, the current database is adjustedby removing the lowest levels of the cloud model sim-ulations until the appropriate surface temperature isreached. This is a poor representation of the actual cloudsystems in extratropical zones. Work is under way toincorporate realistic simulations corresponding to a va-riety of extratropical environments.
Because integrated liquid water is directly related tothe brightness temperatures, one can assume that therainfall rates in the Tropics should appear reasonable.The same cannot be said for latent heating. Latent heat-
ing derived from GPROF depends strongly upon therealism of the cloud model simulations and is thereforenot retrieved in extratropical zones at this time. Detailsof the vertical hydrometeor profiles are retrieved butshould be viewed with suspicion.
d. Improvements over land
Based upon a consistent bias from the GPCC raingauge as well as the TRMM PR comparisons, GPROFversion-5 data will be carefully compared with addi-tional TRMM sources as well as other ground validationdata. If a consistent bias can be identified with additionaldata sources, the GPROF land algorithm (as well as theNESDIS SSM/I) algorithms will be modified to matchthe existing validation data. This is justifiable becauseland retrievals are by their very nature empirical. Theonly useful radiometric signature comes from precipi-tation-size ice scattering, which is not physically relatedto the rainfall itself. Oceans, in contrast, offer a strongphysical basis for both the radar and radiometer algo-rithms, and no tuning is planned unless there is phys-ically direct evidence to indicate that a change in thecurrent assumptions is warranted.
Despite a number of areas in which improvementsare being sought, GPROF appears to be performing atleast at the level at which ground-based validation ispossible. Over the atoll rain gauge network, GPROF isessentially unbiased (29% or 16% depending on theatoll selection criterion). Over the Kwajalein radar, cor-relations were quite high, but the magnitude is different.The magnitude was brought into question because ofinherent uncertainties in ground-based radar rainfall es-timates. The consistent bias between TMI and PR, how-ever, offers hope that the two estimates can be broughtwithin a few percent once the underlying causes of thedifferences are understood. This problem will thereforereceive the greatest attention, using the field experimentdata to test all the assumptions that could lead to thecurrent differences. Over land, a more consistent pictureis beginning to emerge. Some additional comparisonswill be undertaken to verify the GPROF positive bias.
Acknowledgments. The authors thank NASA and Ra-mesh Kakar in particular for funding the effort to con-tinuously update the rainfall retrieval algorithms. Theauthors also thank Toshio Iguchi of the CommunicationsResearch Laboratory of Japan for many helpful discus-sions about the potential sources of discrepancies amongour algorithms.
REFERENCES
Adler, R. F., G. J. Huffman, and P. R. Keehn, 1994: Global tropicalrain estimates from microwave-adjusted geosynchronous IRdata. Remote Sens. Rev., 11, 125–152.
——, ——, D. T. Bolvin, S. Curtis, and E. J. Nelkin, 2000: Tropicalrainfall distributions determined using TRMM combined with

NOVEMBER 2001 1819K U M M E R O W E T A L .
other satellite and rain gauge information. J. Appl. Meteor., 39,2007–2023.
Barber, P. W., and S. C. Hill, 1990: Light Scattering by Particles:Computational Methods. World Scientific, 276 pp.
Bauer, P., J. P. V. Poiares Baptista, and M. Iulis, 1999: On the effectof the melting layer on microwave emission of clouds over theocean. J. Atmos. Sci., 56, 852–867.
Bell, T. L., P. K. Kundu, and C. D. Kummerow, 2001: Sampling errorsof SSM/I and TRMM rainfall averages: Comparison with errorestimates from surface data and a simple model. J. Appl. Meteor.,40, 938–954.
Bellows, C. T., 1999: Consistency testing of models used to inferrainfall from TRMM passive microwave observations. M.S. the-sis, Department of Atmospheric Science, Texas A&M Univer-sity, College Station, TX, 53 pp.
Brock, F. V., K. C. Crawford, R. L. Elliott, G. W. Cuperus, S. J.Stadler, H. L. Johnson, and M. D. Eilts, 1995: The OklahomaMesonet: A technical overview. J. Atmos. Oceanic Technol., 12,5–19.
Chang, A. T. C., L. S. Chiu, and T. T. Wilheit, 1993: Oceanic monthlyrainfall derived from SSM/I. Eos, Trans. Amer. Geophys. Union,74, 505–513.
——, ——, C. Kummerow, and J. Meng, 1999: First results of theTRMM microwave imager (TMI) monthly oceanic rain rate:Comparison with SSM/I. Geophys. Res. Lett., 26, 2379–2382.
Churchill, D. D., and R. A. Houze Jr., 1984: Development and struc-ture of winter monsoon cloud clusters on 10 December 1978. J.Atmos. Sci., 41, 933–960.
Daley, R., 1991: Atmospheric Data Analysis. Cambridge UniversityPress, 457 pp.
Draine, B. T., and P. J. Flatau, 1988: Discrete dipole approximationfor scattering calculations. Astrophys. J., 333, 848–872.
Farrar, M. R., and E. A. Smith, 1992: Spatial resolution enhancementfor terrestrial features using deconvolved SSM/I microwavebrightness temperatures. IEEE Trans. Geosci. Remote Sens., 30,349–355.
Ferraro, R. R., 1997: Special Sensor Microwave Imager-derived glob-al rainfall estimates for climatological applications. J. Geophys.Res., 102 (D14), 16 715–16 735.
——, and G. F. Marks, 1995: The development of SSM/I rain rateretrieval algorithms using ground-based radar measurements. J.Atmos. Oceanic Technol., 12, 755–770.
——, E. A. Smith, W. Berg, and G. J. Huffman, 1998: A screeningmethodology for passive microwave precipitation retrieval al-gorithms. J. Atmos. Sci., 55, 1583–1600.
Fulton, R. A., J. P. Breidenbach, D.-J. Seo, and D. A. Miller, 1998:The WSR-88D rainfall algorithm. Wea. Forecasting, 13, 377–395.
Grody, N. C., 1991: Classification of snow cover and precipitationusing the Special Sensor Microwave Imager. J. Geophys. Res.,96, 7423–7435.
Haferman, J. L., 1999: Microwave scattering by precipitation. LightScattering by Nonspherical Particles: Theory, Measurements,and Applications. M. I. Mishchenko, J. W. Hovenier, and L. D.Travis, Eds., Academic Press, 481–524.
Heymsfield, G. M., and R. Fulton, 1994a: Passive microwave andinfrared structure of mesoscale convective systems. Meteor. At-mos. Phys., 54, 123–139.
——, and ——, 1994b: Passive microwave structure of severe tor-nadic storms on 16 November 1987. Mon. Wea. Rev., 122, 2587–2595.
Hong, Y., C. D. Kummerow, and W. S. Olson, 1999: Separation ofconvective and stratiform precipitation using microwave bright-ness temperature. J. Appl. Meteor., 38, 1195–1213.
Huffman, G. J., and Coauthors, 1997: The Global Precipitation Cli-matology Project (GPCP) combined precipitation dataset. Bull.Amer. Meteor. Soc., 78, 5–20.
Iguchi, T., T. Kozu, R. Meneghini, J. Awaka, and K. Okamoto, 2000:Rain-profiling algorithm for the TRMM precipitation radar. J.Appl. Meteor., 39, 2038–2052.
Jackson, J. D., 1962: Classical Electrodynamics. John Wiley andSons, 848 pp.
Kummerow, C., 1993: On the accuracy of the Eddington approxi-mation for radiative transfer in the microwave frequencies. J.Geophys. Res., 98, 2757–2765.
——, W. S. Olson, and L. Giglio, 1996: A simplified scheme forobtaining precipitation and vertical hydrometer profiles frompassive microwave sensors. IEEE Trans. Geosci. Remote Sens.,34, 1213–1232.
——, W. Barnes, T. Kozu, J. Shiue, and J. Simpson, 1998: The Trop-ical Rainfall Measuring Mission (TRMM) sensor package. J.Atmos. Oceanic Technol., 15, 808–816.
——, and Coauthors, 2000: The status of the Tropical Rainfall Mea-suring Mission (TRMM) after two years in orbit. J. Appl. Me-teorol., 39, 1965–1982.
Liebe, H. J., G. A. Hufford, and M. G. Cotton, 1993: Propagationmodeling of moist air and suspended water/ice particles at fre-quencies below 1000 GHz. AGARD Conf. Proc., 542, 3.1–3.10.
Lin, Y.-L., R. D. Farley, and H. D. Orville, 1983: Bulk parameteri-zation of the snow field in a cloud model. J. Climate Appl.Meteor., 22, 1065–1092.
Lorenc, A. C., 1986: Analysis methods for numerical weather pre-diction. Quart. J. Roy. Meteor. Soc., 112, 1177–1194.
Marshall, J. S., and W. M. Palmer, 1948: The distribution of raindropswith size. J. Meteor., 5, 165–166.
Morrissey, M. L., M. A. Shafer, S. Postawko, and B. Gibson, 1995:Pacific raingauge data. Water Resour. Res., 31, 2111–2113.
Mueller, E. A., and A. L. Sims, 1967: Raindrop distributions at MajuroAtoll, Marshall Islands. Tech. Rep. ECOM-02071-RR1, UnitedStates Army Electronics Command, 93 pp.
Olson, W. S., C. D. Kummerow, Y. Hong, and W.-K. Tao, 1999:Atmospheric latent heating distributions in the Tropics derivedfrom satellite passive microwave radiometer measurements. J.Appl. Meteor., 38, 633–664.
——, P. Bauer, C. D. Kummerow, Y. Hong, and W.-K. Tao, 2001a:A melting-layer model for passive/active microwave remotesensing applications. Part II: Simulation of TRMM observations.J. Appl. Meteor., 40, 1164–1179.
——, Y. Hong, C. D. Kummerow, and J. Turk, 2001b: A texture-polarization method for estimating convective–stratiform pre-cipitation area coverage from passive microwave radiometerdata. J. Appl. Meteor., 40, 1577–1591.
Panegrossi, G., and Coauthors, 1998: Use of cloud model micro-physics for passive microwave-based precipitation retrieval: Sig-nificance of consistency between model and measurement man-ifolds. J. Atmos. Sci., 55, 1644–1673.
Petty, G. W., 1994: Physical retrievals of over-ocean rain rate frommultichannel microwave imager. Part I: Theoretical character-istics of normalized polarization and scattering indices. Meteor.Atmos. Phys., 54, 79–99.
——, and J. Turk, 1996: Observed multichannel microwave signa-tures of spatially extensive precipitation in tropical cyclones.Preprints, Eighth Conf. on Satellite Meteorology and Ocean-ography, Atlanta, GA, Amer. Meteor. Soc., 291–294.
Roberti, L., J. Haferman, and C. Kummerow, 1994: Microwave ra-diative transfer through horizontally inhomogeneous precipitat-ing clouds. J. Geophys. Res., 99, 16 707–16 718.
Robinson, W., C. Kummerow, and W. S. Olson, 1992: A techniquefor matching the resolution of microwave measurements fromthe SSM/I instrument. IEEE Trans. Geosci. and Remote Sens.,30, 419–429.
Rudolf, B., H. Hauschild, W. Ruth, and U. Schneider, 1996: Com-parison of raingauge analyses, satellite-based precipitation es-timates, and forecast model results. Adv. Space Res., 18, 53–62.
Schols, J., J. Hafermann, J. Weinman, C. Prabhakara, M. Cadeddu,and C. Kummerow, 1997: Polarized microwave radiation modelof melting deformed hydrometeors. Preprints, Ninth Conf. onAtmospheric Radiation, Long Beach, CA, Amer. Meteor. Soc.,270–273.
Smith, E. A., and S. Yang, 1998: On validation of TMI, PR and

1820 VOLUME 40J O U R N A L O F A P P L I E D M E T E O R O L O G Y
combined TRMM facility rain algorithms. TRMM Science TeamMeeting Rep. 2, 89 pp.
Spencer, R. W., H. M. Goodman, and R. E. Hood, 1989: Precipitationretrieval over land and ocean with SSM/I: Identification andcharacteristics of the scattering signal. J. Atmos. Oceanic Tech-nol., 6, 254–273.
Steiner, M., R. A. Houze Jr., and S. E. Yuter, 1995: Climatologicalcharacterization of three-dimensional storm structure from op-erational radar and rain gauge data. J. Appl. Meteor., 34, 1978–2007.
Tao, W.-K., and J. Simpson, 1993: Goddard Cumulus Ensemble Mod-el. Part I: Model description. Terr. Atmos. Oceanic Sci., 4, 35–72.
Tripoli, G. J., 1992a: A nonhydrostatic model designed to simulatescale interaction. Mon. Wea. Rev., 120, 1342–1359.
——, 1992b: An explicit three-dimensional nonhydrostatic numericalsimulation of a tropical cyclone. Meteor. Atmos. Phys., 49, 229–254.
Viltard, N., C. Kummerow, W. S. Olson, and Y. Hong, 2000: Com-bined use of the radar and radiometer of TRMM to estimate theinfluence of drop size distribution on rain retrievals. J. Appl.Meteor., 39, 2103–2114.
Wilheit, T. T., 1979: A model for the microwave emissivity of theocean’s surface as a function of wind speed. IEEE Trans. Geosci.Electron., 17, 244–249.
——, A. Chang, and L. Chiu, 1991: Retrieval of monthly rainfallindices from microwave radiometric measurements using prob-ability distribution function. J. Atmos. Oceanic Technol., 8, 118–136.
Yang, S., and E. A. Smith, 1999: Moisture budget analysis of TOGACOARE area using SSM/I-retrieved latent heating and large-scale Q2 estimates. J. Atmos. Oceanic Technol., 16, 633–655.
——, and ——, 2000: Vertical structure and transient behavior ofconvective-stratiform heating in TOGA COARE from combinedsatellite–sounding analysis. J. Appl. Meteor., 39, 1491–1513.