the evolution of audit market structure and the emergence ... · the evolution of audit market...
TRANSCRIPT
The evolution of audit market structure and the emergence of the Big 4: Evidence from Australia*
Colin Ferguson, Matthew Pinnuck, and Douglas J. Skinner
Initial draft: January 2013 This revision: July 2013
Abstract:
We use evidence from a large panel of Australian audit market data to shed light on how changes in the demand for audits affects costs and market structure in the audit industry. The panel spans nearly 50 years, and begins before the emergence of the Big 4 in Australia. Over this period, the size distribution of companies becomes increasingly bifurcated, with the market increasingly dominated by a small number of large, complex entities. We argue that this change caused a structural shift in the demand for audit services and led to the emergence of the Big 4. Specifically, we argue that auditing these increasingly large and complex entities necessitated investments by their auditors in endogenous sunk costs (Sutton, 1991), which led to the emergence of a small set of increasingly dominant audit firms (the Big 4). We provide evidence consistent with these ideas. The results have implications for the current regulatory debate on audit market concentration and the role of the Big 4. ________________________________________________________________________ *Ferguson and Pinnuck are from the University of Melbourne, Faculty of Business and Economics; Skinner is from the University of Chicago, Booth School of Business. Skinner acknowledges financial support from Chicago Booth. We have benefited from comments from Joseph Gerakos, Chad Syverson, and workshop participants at the CAPANA conference at HKU, Florida International University, University of Melbourne, and MIT.
1
1. Introduction
We use an extensive panel of Australian audit firm data to address fundamental
questions related to the determinants of audit market structure and audit pricing. Because
the data begin in the early 1960s, a period that we show predates the Big 8 in Australia,
and extends through the present time, we are able to examine factors that determine the
emergence of the Big 8, which helps us understand the economics of the current Big 4.1
Our evidence is consistent with the Big 4 emerging after an increase in both overall
market size and the relative importance of large, complex client companies in the
economy. We also provide evidence on systematic changes in the pricing of audits that is
consistent with what the market structure analysis implies. As such, the evidence is
consistent with audit market concentration being driven by changes in the structure of the
underlying economy that drive changes in the relative importance of endogenous sunk
costs (Sutton, 1991). We believe our evidence helps to inform the current regulatory
debate about the role of the Big 4 in the global economy.
The role of the Big 4 remains unclear and controversial.2 One view is that the Big
4 provides higher quality audit services and so receives a corresponding audit fee
premium. Under this view, the existence of a two-tiered audit market is justified by
economics. For example, there may be economies of scale or scope in audit firms’
production functions that prevent smaller firms from being substitutes for the Big 4.3
1 In most countries around the world the audit market is dominated by the Big 4 (Deloitte, Ernst & Young, KPMG, and PricewaterhouseCoopers), which evolved, through merger and attrition, from the Big 8, the Big 6, and the Big 5. To avoid confusion, we hereafter refer to this set of audit firms collectively as the Big 4 even though the number of such firms has actually ranged from eight to four. 2 See, for example, GAO (2003), European Commission (2010), Oxera (2006) for regulatory reports on audit market concentration and other issues in the U.S., EU, and U.K., respectively. 3 See Dopuch and Simunic (1980), Eichenseyer and Danos (1981) for early arguments that the structure of the market for audit services is characterized by economies of scale.
2
This view is largely consistent with our arguments and evidence. However, Sutton’s
framework implies that the Big 4/non-Big 4 distinction is not simply due to differences in
scale or scope and does not necessarily imply that there will be a difference in audit
quality, as we explain further below (also see Doogar and Easley, 1998).
Another non-mutually exclusive possibility is that auditor size and reputation is a
way for the Big 4 to credibly commit to higher quality audits (DeAngelo, 1981; Watts
and Zimmerman, 1981, 1983). Under this general view the Big 4 deliver a product
distinct from that delivered by other firms (a higher quality audit), justifying a pricing
premium, and their incentives to deliver higher quality audits arise (i) to preserve their
reputation and stream of quasi-rents and/or (ii) because the size of these firms provides a
form of insurance, via litigation, to those who rely on audit reports. Under both of these
arguments, Big 4 auditors have incentives to provide higher quality audits.4
Going back at least to the 1970s, regulators have had concerns about
concentration in the market for audit services because of the potential for anticompetitive
practices (Simunic, 1980). Given concerns about the increased concentration that arose
after the merger that formed PwC and the demise of Andersen, regulators in the EU have
made a number of proposals to reduce audit market concentration (EU, 2010). These
proposals include mandating both audit firm rotation and a dual-auditor system under
which one auditor would be from outside the Big 4. In the UK, regulators have even
suggested that the failure of another Big 4 firm should result in the remaining firms being
4 Audit quality is the probability that the auditor both (i) uncovers accounting irregularities (competence), and (ii) reports the irregularities (independence) (DeAngelo, 1981). Audit quality is effectively unobservable except for indirect proxies such as the rate of accounting restatements.
3
broken up (Lennox and Liu, 2012). Regulators have also suggested an “audit only”
model, under which audit firms are prohibited from offering non-audit services.5
Regulators also argue that the current level of concentration in the market for
audit services poses a form of systemic risk because failure of one of the remaining Big 4
would reduce the supply of audit services and jeopardize the functioning of capital
markets (EU, 2010; Oxera, 2006). The implicit assumption is that non-Big 4 firms are
incapable of providing equivalent levels of audit services to large public company clients.
Regulators also express doubts about whether differences between the Big 4 and
non-Big 4 firms are “real or perceived” (EU, 2010; Oxera, 2006). While it is clear that
managers of large public companies prefer Big 4 auditors, regulators are unsure about
whether this is due to differences in the audit product or to differences in perception. A
report commissioned by regulators in the U.K. mentions the “IBM effect,” under which
choice of a Big 4 auditor is justified by the argument that “no one has ever been fired for
hiring a Big 4 auditor” (Oxera, 2006).
Our evidence helps to inform this regulatory debate because our predictions about
how and why the Big 4 emerged in Australia are based on arguments about the
economics of the audit market, and specifically about the economic forces that led to the
emergence of a small set of dominant audit firms. These arguments (and our evidence)
imply that there are systematic differences in the audit capabilities of Big 4 and non-Big
4 audit firms that are attributable to the underlying structure of the market for audit
5 In the U.S., the Government Accountability Office (GAO) has issued two reports on the audit industry (GAO, 2003, 2008) the most recent of which concludes that there is no immediate need for regulatory action to address concentration. However, the U.S. Public Company Accounting Oversight Board (PCAOB) recently issued a concept release again suggesting mandatory audit firm rotation (PCAOB, 2011).

4
services. The nature of these differences implies that it would be costly for regulators to
require large public companies to use non-Big 4 auditors or to forcibly break up the Big 4.
There are three broad findings that collectively support the idea that the audit
market, including the emergence of the Big 4, evolved over time as a result of structural
changes in both the demand for and supply of audit services. First, we show that the size
distribution of public companies changes appreciably over time, from a distribution that
was relatively homogeneous in the 1960s and early 1970s to a distribution increasingly
dominated by the largest companies in the economy, such that a dual structure naturally
emerges in the market for audit services. The aggregate size of the market also grew
substantially over this period.
Second, we show that the size distribution of audit fees and the size and
concentration of the audit market also changes over time. In the earlier part of our
sample period (1960s and early 1970s), before the emergence of the Big 4, there is little
evidence of audit market concentration. We show how the Big 4 emerges during the late
1970s and early 1980s, and that this set of firms increasingly dominates the market,
especially the market for audits of large public companies. These changes are consistent
with what the Sutton framework implies.
Third, the pricing of audit services changes systematically over time, consistent
with changes in market structure. In the earlier part of our sample period, audit fees were
essentially proportional to firm size. There is no evidence of a Big 4 premium in the
earlier part of the sample period; the pricing function is similar across the size
distribution.

5
In the latter part of the sample period, and roughly coincident with changes in the
underlying size distribution and the emergence of the Big 4, the cost structure changes
significantly, with evidence that fixed costs become more important over time, and
marked differences in pricing between the large and small company segment of the
market. Further, an economically significant Big 4 premium emerges in the small
company segment of the market. These results suggest that while most audit costs appear
to have been variable in nature early on, over time auditing has become more of a fixed
cost business where larger firms are able to take greater advantage of operating leverage.
Consistent with the Sutton (1991) framework, our evidence supports the view that the Big
4 incurred relatively large fixed costs, likely due to the increased use of information
technology, the establishment of centralized technical expertise, recruiting staff, etc., and
that these fixed costs help explain the emergence of the Big 4 firms.
Our findings are important in a number of respects. First, there is an extensive
literature on audit pricing but a number of important issues remain unresolved, including
the existence and economic nature of the Big 4 premium (see Causholli et al., 2011, for a
review of the literature, which we discuss in more detail in Section 2). Second, important
issues related to structure and pricing of the audit market remain unresolved at a time
when regulators are struggling to reach conclusions about what to do about
unprecedented levels of market concentration, discussions that have become more urgent
in the wake of the recent global financial crisis.
Section 2 provides a fuller discussion of the economic framework, as well as the
existing auditing literature as it pertains to our research. Section 3 provides details of our
6
sample and data. Section 4 reports our evidence. Section 5 provides a summary and
discusses implications.
2. Economic framework and development of empirical predictions
We first provide more detail on the framework that Sutton (1991) provides as well as
how this applies to the audit market (Section 2.1). We then relate this discussion to
previous work in the auditing literature (Section 2.2) before discussing certain features of
the Australian setting (Section 2.3) and our empirical predictions (Section 2.4).
2.1 Economic framework
The goal of our empirical analysis is to provide evidence on the economic forces
that led to the emergence of the Big 4 in Australia and to investigate the effect of this
change on audit pricing. To develop empirical predictions, we use a framework
developed in the industrial organization literature by Sutton (1991).6
Sutton’s framework has spawned a large amount of empirical work in economics
(see Sutton, 2007, for a review). The goal of his work is to develop a robust theory to
explain market structure across a broad range of industries, and in particular to model the
relationship between market size and structure, where structure refers to concentration.
The basic insight of Sutton’s model is that the nature of sunk costs in an industry
plays an important role in determining its structure. Sutton distinguishes two types of
sunk costs. “Exogenous” sunk costs are determined by technological characteristics of
the industry and determine its minimum efficient scale (MES). If such exogenous sunk
costs are all that is important in an industry, concentration will decline as market size
6 Sirois and Simunic (2011) also apply the Sutton framework to the audit market but do not test the implications of the model empirically.

7
increases, as more firms are able to achieve MES. This is consistent with basic intuition
that an industry supports more firms of a given size as it grows.
Sutton argues that “endogenous” sunk costs are also important in certain
industries. By investing in these costs, firms increase the demand for their products and
the price customers are willing to pay (demand shifts outwards). Such costs are
endogenous in the sense that they are firm-level choices.7 Sutton describes this in terms
of an “arms race” in spending in which a small number of firms aggressively increase
spending to increase their market shares and margins; these firms may thus capture “first
mover” advantages. This leads to the prediction that concentration increases with market
size in industries where endogenous sunk costs are important.
Sirois and Simunic (2011) use Sutton’s endogenous sunk cost to develop a model
that explains concentration in the audit market. They argue that the extant auditing
literature largely takes the existence of the Big 4 as given and tests cross-sectional
predictions about differences between Big 4 and non-Big 4 firms. They further argue that
the Big 4 emerges endogenously as a result of investments in “technology,” broadly
defined to include various types of fixed cost investments by audit firms. These
investments lead to increases in audit quality that are priced in the market for audit
services and that lead to a Big 4 premium. Similar to the way that Coke and Pepsi
emerged as the dominant players in soft drinks, the Big 4 emerged as dominate players in
the audit industry, leading to a dual structure in which a small number of large firms
coexist with a large number of smaller firms.
7 Sutton uses R&D and advertising as examples of endogenous costs but there is no reason that other fixed costs could not play the same role. In the early years of the U.S. soft drink industry, Coke and Pepsi invested large amounts in advertising to increase market share, which eventually led to a “dual” industry structure under which these two companies had very large shares while the rest of the industry comprised small firms that did not spend significantly on advertising.

8
While this argument provides a useful understanding of the forces that drive the
structure of the audit market, we believe it is incomplete in the sense that it is largely a
supply-based view that does not explain why changes in the market occurred when they
did. A critical element of Sutton’s argument is that customers are willing to pay for
product enhancements that result from endogenous sunk cost expenditures (there is a shift
in demand).
We predict that the Big 4 emerges in Australia as a result of structural changes in
the nature of the underlying economy that leads to such a demand shift. As we document
below, beginning in the 1970s the skewness of the size distribution of publicly-listed
Australian companies becomes increasingly more pronounced. The emergence of large,
complex client companies such as BHP led to a demand for audit firms that could
effectively audit such large entities. 8 Auditing these large and complex entities
necessitated investment in endogenous sunk costs of the type described by Sutton. For
example, as audit firms grew to meet client demand, it became increasingly important to
maintain staff quality (through more sophisticated hiring and training programs) and to
invest in technology to enhance auditor efficiency as the necessary scale increased.9 Both
types of investments fit Sutton’s notion of endogenous sunk costs.
8 This argument parallels Watts and Zimmerman’s (1983) characterization of the emergence of audit firms in England in the second half of the 19th century. Watts and Zimmerman point to three factors that led to the emergence of audit firms during this period: increasing complexity in the accounts, increasing size and number of companies driven by an expansion in the size of capital markets, and the introduction of legal liability for company directors. 9 More specifically, from discussion with prior and current partners of Big 4 firms, these fixed costs include the establishment of human resource departments, recruitment costs, staff training, development of audit programs, substantial investment in information technology which began in the 1980s; investment in technical departments to provide accounting guidance to staff and develop technical bulletins for clients, and investment in promotional material including advertising, sponsorship and corporate style offices. Material investment in these fixed costs began in the late 1970s and escalated significantly during the 1980s through to the present. Some circumstantial evidence consistent with the timing of the emergence of these fixed costs is for example, in Australia it was only in 1970 that accounting firms began requiring new employees to have an accounting degree; it was not until 1972 that large accounting firms began to require
9
Over the sample period (1960s to the present) it is also likely that the relative
importance of fixed and variable costs changes for the audit industry as a whole. In the
1960s, auditing in Australia was essentially a variable cost business, with labor as the
primary input. Over time, advances in technology and increasing complexity of
accounting and auditing rules, including more rigorous regulation of the industry, likely
meant that fixed costs became relatively more important for the audit industry as a whole,
increasing the MES of audit firms (these are Sutton’s exogenous sunk costs).10 Thus, we
expect to see fixed costs become more important over time for all audit firms, but that
this would be most pronounced at the top end of the market where the larger audit firms
also invest in endogenous sunk costs. Further, we expect that small audit firms (that
increasingly fall below MES) do not survive in the market for publicly-listed companies.
This argument does not necessarily imply that audits by the Big 4 are of higher
quality than those of non-Big 4 firms, the argument conventionally used in the literature
to explain the Big 4 pricing premium. Instead, changes in the size and complexity of
audit clients (on the demand side) led to increasing endogenous sunk cost investments by
staff members to undertake a Professional Year examination to become members of accounting associations. Consistent with this, the annual percentage growth in membership of the Institute of Chartered Accountants in Australia shifted from 2.3% during the 1960 to 1969 period to 7.05% during the 1970 to 1979 period. Finally, it was not until the late 1970s that large accounting firms first employed partners who were solely responsible for technical advice to staff and clients (Burrows 1996). 10 There was a significant increase in the level of financial statement disclosure and thus fixed disclosure cost from the 1960s to the present, due to both increased mandated disclosure by accounting standards, legislation, and increased regulation of the audit industry. The first technical accounting standards in Australia were introduced in 1970. Subsequently over the period until 2007 the number of standards has increased to 45 pronouncements. As an example of the fixed costs associated with this mandated disclosure the length of the annual report of Woolworths Limited, a large retailer, increased from 11 pages in 1960 to 160 pages in 2007. The Australian Audit Standards Committee was not established until 1974 at which point there was only a single audit standard on the general principles of auditing. Subsequently over the period to 2007 the number of auditing standards has increased to 40 pronouncements. In summary, in the early part of our sample period, the 1960s, the mandated disclosure and thus fixed disclosure costs associated with producing and auditing financial statements were insignificant and at the end of our sample period they were substantial.
10
the large audit firms (on the supply side). That is, over time the Big 4 and non-Big 4
adopt different production technologies, which led to different cost structures, which in
turn implies differences in pricing (assuming some level of competitiveness). The Sutton
argument implies that the large audit firm segment of the market is characterized by
investment in endogenous fixed costs, so that fixed costs became relatively more
important in this segment of the market. We test this idea by looking at how changes in
audit pricing differ across the two market segments.
An important part of Sutton’s analysis has to do with the intensity of competition
within the market, which drives the relation between costs and equilibrium prices. In the
audit market, we follow recent research in assuming that different segments of the market
(Big 4 and non-Big 4) are likely to be competitive, so that differences in pricing reflect
differences in costs that are due to differences in underlying cost structures (e.g., see
Dunn et al., 2011, 2013; Lennox and Liu, 2012). On this basis, we use data on audit fees
to test our predictions about the cost structure of the audit market.
One question that naturally arises in the context of these arguments is why some
audit firms grew to become part of the Big 4 while others did not. Sutton argues that in
certain industries endogenous sunk costs help create “first mover” advantages, an
argument that seems likely to be helpful in the auditing context. Under our arguments,
certain audit firms were initially endowed with clients that were successful and so grew
over time. To service these clients, these audit firms invested in endogenous sunk costs
that then provided them with the ability to service other large clients and, importantly,
prevented smaller audit firms from servicing those clients, leading to the emergence of a
dual structure.

11
The reputation/litigation arguments conventionally advanced in the literature to
explain the Big 4 premium are complementary to our arguments. As Sirois and Simunic
(2011) point out, however, the reputation/litigation argument does not explain the
emergence of the Big 4. Nor does this view predict that this emergence occurs in
response to changes in the size distribution of the underlying set of public companies. On
the other hand, if the Big 4 premium is partly due to auditor reputation, consistent with
the traditional view, it could be that investment in reputation is one of the endogenous
sunk costs.
We now turn to a discussion of how our work relates to previous work in the
auditing literature.
2.2 Previous literature
The arguments above imply that there have been significant changes in auditors’
production functions over time and that these shifts differ in a systematic way across Big
4 and non-Big 4 auditors. We argue that these changes were precipitated by changes in
the nature of the market for audit services over time, with increases in the size and
complexity of the largest public companies in the economy, a more general increase in
the complexity of the corporate sector and capital markets, as well as an increase in the
complexity of accounting and auditing and the regulation of public companies. These
arguments relate to several streams of the auditing literature.
A number of papers explain concentration in the audit market using economic
arguments, some of which relate to the audit production process. Early papers such as
Dopuch and Simunic (1980), Eichenseyer and Danos (1981), Danos and Eichenseyer
(1986), Francis and Stokes (1986), among others, argue that the audit market is
12
characterized by fixed costs and economies of scale, which naturally leads to
concentration.
DeAngelo (1981) offers a different explanation for market concentration, which
also predicts that audit quality increases with audit firm size. DeAngelo argues that
auditors incur client-specific start up costs, and that these costs mean that auditors then
receive a stream of quasi-rents specific to each client. Because this stream of rents
provides incentives for auditors to “cheat” (lower independence) to retain clients, having
a larger number of clients becomes important because it means that the auditor has more
to lose if its lack of independence comes to light. Consequently, larger firms (measured
as those with more clients and so, on average, more to lose) have incentives to provide
higher quality audits.
Interestingly and related to our arguments above, DeAngelo (1981, p. 194) uses
Klein and Leffler’s (1981) framework to argue that investing in productive sunk costs,
which include not only client-specific start-up costs but also investments in industry or
SEC expertise, is more efficient than investing in brand name capital solely for the
purpose of providing assurance as to product quality (the brand name argument is also
employed in the literature, and also helps to explain concentration in the sense that it is a
fixed cost). This follows because these costs have already been incurred and are
necessary to service the client while investments in brand name are not.
The notion that auditing particular industries requires an investment by audit
firms in the expertise necessary to understand that industry has a long history in the
literature (e.g., Eichenseyer and Danos, 1981; Hogan and Jeter, 1999). Consistent with
this argument, studies have found evidence of auditor concentration by industry at the
13
city, national, and global levels, including studies that use Australian data.11 We view
investments in industry expertise as part of the endogenous sunk costs that helped
separate the Big 4 from other audit firms. Notice that the industry specialization
argument is clearly linked to the arguments about audit firm size—as Carson and Fargher
(2007) point out, it likely that industry specialists are naturally likely to be large firms
with large clients, an observation consistent with our arguments.
There is limited evidence in the auditing literature that speaks directly to the
nature of audit firms’ production functions. Kinney (1986) characterizes audit
technology along a continuum from structured to unstructured. Structured audit firms are
more likely to use statistical sampling, structured internal control evaluations, and formal
scoring or rules to integrate audit test results. Unstructured audit firms are less likely to
use such techniques (or to use them in a less formal way) and rely more on qualitative
judgments of audit personnel in the field. He finds that audit firm technology measured
in this way is negatively related to the firm’s staff to partner ratio, indicating that
structured firms tend to use fewer staff per partner than unstructured firms. This supports
the view that both of these variables capture audit technology, consistent with O’Keefe et
al (1994).
Some papers use auditor labor hours to more directly test theories about audit
production functions. Perhaps most prominent among these studies is O’Keefe et al.
(1994), who provide evidence on the nature of the audit production function by
examining the relation between hours spent by auditors at different levels (partners,
managers, in-charge, staff) and client characteristics, enabling them to avoid relying on
11 See Carson (2009), Craswell, Francis, and Taylor (1995), Ferguson, Francis, and Stokes (2003), among others.
14
auditor fee data, and so obtain cleaner inferences about differences in auditors’
production functions.12
Perhaps most directly related to our paper, Doogar and Easley (1998) predict and
find a relation between the nature of auditors’ production functions and market
concentration. These authors begin with the observation that audits are indivisible, which
means that the size of audit clients directly affects the size of audit firms.13 However,
they note that this fact alone is not sufficient to explain concentration in the audit market
in their model and simulations. In addition, they examine variation across audit firms in
a simple but important measure of differences in audit technology—the ratio of staff to
partners (“leverage”). The basic idea is that leverage varies across firms depending on
the relative productivity of their partners and staff, and that concentration arises from the
interaction of client size distributions, audit production technology (leverage), and the
indivisible nature of audit assignments. This argument is closely related to our argument
about the role of endogenous sunk costs in that audit firm leverage is likely to vary as a
function of the extent of investment in these costs. Doogar and Easley show that their
model does a good job of predicting shares of three groups of audit firms (Big 6, next 10
national firms, other firms) in six client size buckets.
12 Hackenbrack and Knechel (1997) extend the O’Keefe et al. (1994) paper by looking at the relation between audit hours spent by audit level (partner, manager, in-charge accountant, staff) and audit activity type (planning, internal control review, substantive testing). This is based on survey evidence from one audit firm. 13 Related to this point, we observe dual audits in Australia in the early part of our sample period. For example, in the 1960s a number of Australian public firms are audited by both Cooper Brothers & Co and Way & Hardie, a smaller firm. This practice disappeared, however, later in the sample period, and so likely helps explain the emergence of the Big 4. In other words, the fact that audits were effectively divisible early in the sample period helps explain why the Big 4 did not emerge at this time. Consistent with Doogar and Easley, the indivisibility of audits is a necessary but not sufficient condition for the emergence of the Big 4.

15
A large body of research examines audit fee pricing and is reviewed in Hay et al.
(2006), Causholli et al. (2011), and Hay (2012). The bulk of this research is cross-
sectional and focuses on the determinants of audit fees, classified by Hay et al. (2006)
into: (1) client attributes, (2) auditor attributes, and (3) engagement attributes, with size
being the most important determinant of audit fees. As recognized by Causholli et al.
(2011), there have been very few longitudinal studies of audit fees and we are not aware
of any study that examines how audit fees have behaved over a time-period of 50 years.
A large number of papers investigate the effect of the Big 4 on audit fees. In
these papers the predicted effects are usually attributed to either the litigation effects of
Simunic (1980), the audit quality effects of DeAngelo (1981), or to market concentration
and competition effects. Both Causholli et al. (2011) and Hay (2012) conclude that the
evidence in regard to the existence of Big 4 premium is mixed and that there are a wide
variety of results.14 In summary, there is little consensus as to either (i) the existence of
the Big 4 premium, or (ii) the reason for its existence.
While our study does not hypothesize or test for audit quality effects of the Big 4
this stream of research is of some indirect relevance. There are some empirical studies,
based on the predictions of DeAngelo (1981), and using a variety of audit-quality proxies,
that find evidence suggesting that Big 4 auditors provide higher-quality audits than non-
Big 4 auditors (e.g., Palmrose 1988; Becker et al. 1998; Khurana and Raman 2004; Behn
et al. 2008). However, Lawrence et al. (2011) find that after controlling for client
14 Some studies find no audit fee premiums in either large or small companies [Simunic 1980; Chung and Lindsay 1988; Rubin 1988; Firth 1985; Firth 1997], some find premiums in both the large and small segments of the market [Francis 1984; Chan et al. 1993; Anderson and Zéghal 1994; Gul 1999], and some find premiums only for small clients [Francis and Stokes 1986; Palmrose 1986; Lee 1996]. More recently Carson et al. (2012) report evidence of an increase in the Big 4 premium over the period of 1996-2007 in Australia which they attribute to increasing market power. However Lennox and Liu (2012) find that an audit market with just a few large audit firms can deliver lower audit fees.
16
characteristics, the effects of Big 4 auditors on audit quality are insignificantly different
from those of non-Big 4 auditors. Their results suggest that differences in these proxies
between Big 4 and non-Big 4 auditors largely reflect client characteristics and, more
specifically, client size. Our theory and empirical predictions provide an explanation for
why Big 4 and non-Big 4 auditors have different sized clients and predict that there will
be no difference in audit quality. Similarly, Minutti-Meza (2013) shows that the audit fee
premium for industry specialization disappears once client characteristics are
appropriately controlled for.
2.3 Important features of the Australian setting
There are a number of features of the Australian setting that help us draw
inferences about the emergence of the Big 4. First, in contrast to the US and UK, the Big
4 (that is, the Big 8) had not emerged in Australia by the 1960s, something that we
provide direct evidence on below.15 Our evidence also shows that the US- and UK-based
operations of the Big 8 did not have much influence on their Australian counterparts until
later in our sample period. Although these firms did have some presence in Australia in
the 1960s through Australian affiliates, these were effectively small branch offices of the
international firms.
Second, as discussed above, dual auditors were common in the Australian market
in the 1960s, which means that audit engagements were effectively divisible. The
disappearance of this practice during the sample period helps explain the emergence of
the Big 4.
15 Wooton and Wolk (1992) and Zeff (2003) discuss the history of the audit industry in the U.S. It is clear from these accounts that the Big 8 emerges in the US (and the UK) by 1960, and that the dual structure of the industry had, in fact, emerged well before this in both countries.

17
Third, it has long been the case that the Australian economy is relatively separate
from influences from other parts of the world, so the long-standing trend towards
globalization of the world economy, the emergence of multinational firms, is not likely to
have a very large influence on our results. Put differently, the Australian economy is
likely to serve as a useful laboratory in which to study the audit market because it is
relatively free of foreign influence. To see this, notice that many of the largest Australian
companies, including the big four banks but also large industrial firms such as
Wesfarmers, Woolworths, AMP, Telstra and others continue to have operations that are
concentrated in the Australian market.
2.4 Empirical predictions
Our empirical analysis that follows tests several predictions that follow from the
discussion in the preceding sections:
• Increases in the concentration of the audit market are related to increases in the size
of Australian public companies. The relation between audit market concentration and
firm size is likely to be related to industry specialization and concentration in the
audit market.
• In the early part of the sample period (before the emergence of the Big 4) audit
pricing is consistent with an underlying variable cost structure that is similar across
the entire market; that is, there is a linear relation between total audit costs (which we
measure as total fees) and client size. In addition, there is no evidence of a Big 4
premium in this period.
• In the later part of the sample period (after the emergence of the Big 4), audit pricing
is consistent with the emergence of a fixed cost structure that is more evident in the

18
large company segment of the market, consistent with the large audit firms investing
in endogenous sunk costs. In addition, there is a Big 4 premium in the small
company segment of the market (if smaller companies want the signal associated with
a Big 4 auditor, they need to incur the additional fixed costs).
There is no implication in our argument that the Big 4 collude on price and/or earn
economic rents, a claim sometimes made by regulators. Instead, as in Sutton’s
framework, the market for audits among the Big 4 firms could be highly competitive,
with these firms earning normal returns on cost structures that are different from those of
the non-Big 4, and which naturally lead to differential pricing. That is, there are two
distinct audit markets: a market for audits of the largest public companies dominated by
the Big 4, and a market for audits of the large number of much smaller public companies,
which is less likely to be dominated by the Big 4. This view is generally consistent with
recent evidence on the competitiveness of the audit market (Dunn et al., 2013; Lennox
and Liu, 2012).
3. Sample and Data Sources
This section describes our panel of audit firm, audit fee, and client company
data.16 In brief, we have data on audit firms, their client companies, and audit fees from
the 1960s to 2007. Prior to 1978, we have data that covers around 40% of listed
companies in Australia but that over-samples large companies, so our coverage is
substantially larger than 40% when value-weighted. From 1978 to the present our sample
covers approximately 80% or more of listed Australian companies.
16 To avoid confusion, we use “firm” to refer to audit firms, and “company” to refer to publicly-traded companies that are the audit firm clients.
19
The disclosure of audit fees was mandated in Australia beginning in the early
1960s.17 This means that we have a much longer time series of audit fee data than is
available in previous studies (the disclosure of audit fees was mandated in the U.S. in
2001 and in the U.K. in 1992). This also means that we have audit fee data that predates
the emergence of the Big 4 in Australia, an important advantage of our data. The sample
is comprehensive, covering the majority of listed companies in Australia.
We obtain audit firm and fee data from: (a) the AGSM database of Annual
Reports, which contains reports for around half of publicly-listed Australian companies
from 1950 to 1985; (b) the Craswell (1999) “Who Audits Australia” database of audit
fees for listed companies from 1980 to 1999; (c) hand-collected annual report data on
audit fees paid to auditors of Australian public companies from 2000 through 2007; (d)
hand collected data on auditor names from the Jobson yearbook for the period from 1959
until 1979.18
We first use the sample of observations for which we have company/year data on
both audit fees and total assets. This yields an initial sample of 41,041 company-year
observations from 1962 through 2007 (see column (2) of Table 1, labeled Sample 1).
Table 1 shows that this sample covers a large fraction of Australian listed
companies, beginning at around 35% in 1962 but soon increasing to over 40% for the
remainder of the decade. This fraction falls to the mid-30% range in the first part of the
17 Over the period 1961 to 1962 the states of Australia adopted what came to be known as the Uniform Companies Acts of 1961-1962, one goal of which was to make the Acts consistent across different states (See http://cclsr.law.unimelb.edu.au/go/history-of-australian-corporate-law-/index.cfm last accessed April 5, 2012). Part of this legislation mandated the disclosure of statutory audit fees, a requirement which took effect for annual reports filed in 1962. 18The Jobson yearbook is an annual digest of significant financial and non-financial information for Australian listed companies.
20
1970s but then increases to over 70% and more typically 80% or more for the remainder
of the sample period.19
For our audit pricing tests we also require audit firm name and certain company
variables; we label this Sample 2. We remove 78 observations for which we unable to
find the original annual report (for auditor name). Company-year observations were then
dropped if they did not have the variables necessary for the audit pricing regressions.
From 1962 to 1979, the company variables were sourced from the AGSM database.
From 1980 to 1985 we obtain these variables from the Craswell database, which provides
a more limited set of variables (AGSM does not provide coverage during this period).
After 1985 we obtain these variables from both the AGSM database and the Craswell
database. For the period after 1985, the data also become available from Aspect
Huntley20 Overall, requiring companies to have data for net profit, accounts receivable,
inventory, and long-term debt results in a loss of 8,216 company-year observations
mainly attributable to the 1980s and early 1990s when there was no source of these data
(note especially the attrition in the late 1980s).
A significant break in the sample occurs in 1977 when the number of companies
for which the AGSM database collected financial accounting variables almost doubles.
In the periods before and after this point our sample coverage relative to the set of all
listed Australian firms is relatively constant: before 1977 our sample size is
approximately 40% of the population of listed companies; after 1977 our sample size is
typically 80% or more of the population of listed firms.
19 The denominator of this fraction (the number of listed firms in Australia) is approximate before 1970. 20Aspect Huntley began covering Australian firms in the late 1980s and has become the standard data-base of financial statement variables used in empirical archival studies of Australian firms. These studies typically have the early 1990s as their starting point.
21
Prior to 1977 the AGSM focuses on larger companies. The median company in
the pre-1977 sample lies approximately at the 65th percentile of the size distribution of
the population of listed companies (size is measured as total assets). This means that
50% of the companies we sample before 1977 are above the 65th size percentile of the set
of companies we sample after 1977. To maintain consistency in the attributes of sample
companies over time, we report results for two subsamples: companies above and below
the estimated 65th size percentile of the set of listed firms. From 1962 to 1976 (1977
onwards) companies above the 65th percentile of size distribution of all listed companies
are those above the 50th (65th ) size percentile of the sample. For convenience, we refer
to these subsamples as the set of large and small companies, respectively, even though
the “small” firms include some firms above the median of the size distribution. This
partition is an important feature of our tests because our predictions about market
structure differ for the large and small company segments of the audit market.
4. Evidence
4.1 Evolution of the size distribution of public companies in Australia
Our central thesis is that a dominant set of large audit firms (the Big 4) emerges in
response to changes in the size distribution of the underlying population of listed
companies—there was not only an increase in market size, but also an increase in the
importance of the largest companies in the economy (an increase in concentration). We
predict that an increased divergence between the size of the largest listed companies and
the remaining companies led to an increasing demand for the type of large audit firms
necessary to service these companies.
22
We first report, in Table 2, on the size distribution of listed companies and how it
changes from 1962 to 2007. We measure size as total assets, in thousands of (constant
2007) Australian dollars. As discussed in Section 3, we report results for the large and
small subsamples of companies as well as for the sample as a whole (where large firms
are those above the 65th percentile of the size distribution and “small” firms are the rest).
To economize on the numbers we report, in most tables we provide summary statistics
for five year sub-periods, 1962-1965, 1966-1970, etc., through the final two-year sub-
period, 2006-2007, rather than reporting the full set of annual numbers.
Panel A of Table 2 shows that average company size increases significantly over
the sample period while the median declines, consistent with an increase in right
skewness. The increasing spread of the distribution is also evident from the steady
increase in the coefficient of variation, from 4.01 in the first half of the 1960s (1962-
1965) to 10.52 in 2006-2007.
For the subsample of smaller companies (below the 65th percentile—see Panel B
and Figure 1B), after 1975 the mean and median are roughly flat to declining across the
full sample period, and the mean is not markedly above the median. In the latter half of
the 1960s, mean (median) size is around $26 million ($22 million) compared to $20
million ($12 million) for 2006-2007. The coefficient of variation is smaller than that for
the sample overall and increases modestly, from 0.68 in the latter half of the 1960s to
0.96 in 2006-2007. Thus, small firms tend to remain small over the full sample period.
In contrast, the size distribution for large firms (Panel C and Figure 1A) shows a
strong upward trend in right skewness, indicating that the distribution is increasingly
dominated by the very largest firms. For this set of firms, there is some tendency for the
23
median to increase through the early 1980s (from $157 million in the early 1960s to $316
million in the early 1980s) but after that it does not show a clear trend. In contrast, the
mean increases monotonically from around $400 million in the early 1960s to over $6
billion in 2006-2007, while the coefficient of variation increases from 2.92 to 6.16. The
increase is concentrated in the very largest firms, as evidenced by substantial increases in
both the 95th and 99th percentiles (but not the 75th percentile).
We next use data on total assets for sample companies to estimate the total size of
the audit market as well as growth therein.21 We report this aggregate audit market data
in Figure 2 (using a log scale in billions of real Australian dollars), which shows market
size in total, as well as for the large and small company segments (as previously
defined—note that the line for the total market essentially sits under that for the large
company line, and so is not visible).
The size of the market grows significantly over time, from less than $100 billion
in the early 1960s to about $3,400 billion in 2007.22 More relevant for our purposes,
however, is that this growth in market size is due almost exclusively to the large firm
segment of the market. The total size of the market for audits of small companies is
roughly flat in real terms over the full period, varying between $10 billion and $20 billion
from 1974 to the present. Because the number of listed companies has increased over
time, this is consistent with the Table 2 numbers that show a decline in average and
median size of the smaller companies. In contrast, the market for large company audits
grows from $187 billion in 1970 to $3,361 billion in 2007, largely due to increases in the
21 To the extent we do not have the full set of Australian public companies in our sample, this computation understates the size of the Australian audit market. This number excludes audits of private companies and public sector (government) entities, which likely represent a significant part of the market for audit services. 22 About half of this latter amount is attributable to the four largest Australian banks (Commonwealth Bank of Australia, Wespac, National Australia Bank, and ANZ).

24
size of the very largest companies. This shows the increased concentration of aggregate
corporate assets in a relatively small group of very large companies.
Overall, our evidence on the size of public companies in Australia shows a clear
tendency for smaller companies to get smaller while the very largest companies get larger,
consistent with an increasingly dichotomous size distribution. This leads to an increasing
two-tiered market for audits, divided between a large number of increasingly small
companies that account for a stable aggregate amount of corporate assets and a small
number of increasingly large companies that account for the increasingly large majority
of aggregate corporate assets. We next discuss evidence on changes in the size of audit
firms.
4.2 Evidence on audit fees and audit market structure
Table 3 reports on the distribution of audit fees over time, for the sample as a
whole as well as for the large and small company segments, again measured in real 2007
dollars. Median audit fees for the full sample are roughly flat over the full period. For
example, the median audit fee in 1966 to 1970 was around $63,000 while that in 2006 to
2007 was around $66,000 although there is more time series variation than these
endpoints imply. The mean increases from $159,000 in the latter half of the 1960s to
$329,000 in 2006-2007, leading to increasing cross-sectional variation and positive
skewness, although most of the increase occurs in the 1970s. This is expected given
changes in the way the underlying distribution of company assets changes, per the
discussion above.
Similar to what we observe for company size, there is much less evidence of
skewness and increases therein for the audit fees of smaller companies (Panel B) while
25
there is evidence of more skewness in the audit fees of the larger companies (Panel C) as
well as more evidence of an increase in both mean fees and skewness. There is less of a
tendency for skewness for the audit fees of large companies to increase as there is for the
skewness of the size of the companies themselves to increase—for example, most of the
increase in standard deviation and the 95th percentile occurs by the 1980s—something
that becomes more explicit when we look at changes in audit fees deflated by total
company assets below (this is expected if there is an increasing fixed cost component
embedded in audit fees).
Our main prediction is that the Big 4 emerges as a result of changes in the size
distribution of underlying companies. To assess this, we next present evidence on
changes in the size distribution of audit firms, including measures of industry
concentration.
4.2.1 The Big 4 in Australia
We start by assessing when the Big 4 emerges in Australia. To do this in direct
way, Table 4 reports the top ten audit firms by revenue at the beginning of each of the
sub-periods, beginning with 1962 and ending in 2007.
We begin with the most recent year shown (2007) and work back in time to
establish when the Big 4 first emerges in Australia. In 2007, the Big 4 is unambiguously
defined as PwC, KPMG, E&Y, and Deloitte, which together account for 89.7% of total
revenues. The next biggest firm, Pannell Kerr Foster, has a share of only 1.65%, so there
is a clear demarcation between the Big 4 and other firms. The numbers are similar in
2002, with the Big 4 accounting for 92.9% of revenue, and the next largest firm, BDO,
accounting for only 1.0%.
26
In 1997, before the demise of Andersen and the merger that brought about PwC,
the Big 6 accounts for 88.1% of total revenue, with the smallest of this set (Price
Waterhouse) again being markedly larger, with a 7.16% share, than the next largest firm,
BDO, at 1.94%. In 1992, the delineation between the then-Big 6 and the remaining firms
is less clear: although these firms have 82.3% of revenue, the smallest Big 6 firm (E&Y)
has 4.5% of revenue which is not markedly greater than that of Duesburys, at 2.7%.
Nevertheless, it seems clear that there is a definitive Big 4/6 during the 1990s and 2000s.
In 1987, the Big 8 accounts for 69.9% of revenues, but the smallest three firms in
the Big 8 at this time—KMG Hungerfords (which becomes KPMG), Arthur Young, and
Arthur Andersen—have revenues of 4.4%, 4.3%, and 3.9%, which is not very different to
the next largest firms, Thompson Douglass & Co. and Parnell Kerr Forster, both at 2.9%.
The distinction is even less clear in 1982—although the largest seven firms account for
59.4% of revenue, the break in the size distribution between the smallest of this group
(Hungerford Hancock & Co., with 5.0%) and then next largest firm (Pannell Kerr Foster,
with 2.8%) is less obvious than in later years. However, it does seem clear that the Big 8
had emerged in Australia by the early 1980s.
In 1977, while four firms that are identifiably Big 8 firms (Coopers & Lybrand,
Price Waterhouse, Touche Ross, and Peat Marwick) are clearly large relative to other
firms, with a total share of 42.3%, the next largest firm, Yarwood and Vane with 6.6%, is
not much smaller than Peat Marwick (8.8%), and is not a firm we think of as being part
of the Big 8. So the Big 8 as subsequently constituted in Australia (or as constituted in
the U.S. by this time) had not fully emerged by 1977.23 The 1972 numbers show even
23 Yarwood and Vane becomes Deloitte, Haskins & Sells in 1980, which we interpret as part of the emergence of the Big 8.

27
less evidence of a Big 8. While Peat Marwick Mitchell & Co. has a share of 17.4% and
Price Waterhouse has 9.8%, the third largest firm is Yarwood Vane with 6.8%, and the
size of firms declines relatively smoothly after this, with no obvious breakpoint.
The distribution is even more fragmented in the 1960s, when there is little
evidence of big firm dominance. This is so even though the Big 8 had clearly emerged in
the U.S. by this time (Wootton and Wolk, 1992; Zeff, 2003). In 1967, there are three
relatively large firms—Price Waterhouse, Yarwood Vane & Co., and Cooper Brothers &
Co.—each with share of around 8% along with a number of smaller firms, with only
small differences in size. In 1962 (the first year data are available), the largest firm is
Flack & Flack (which eventually became part of Price Waterhouse), with 9.3% of total
revenue, followed by Yarwood Vane & Co with 4.6%, and Cooper Brothers with 4.4%,
after which there is a smooth decline in size. This evidence clearly indicates that what
would become the Big 8 had not emerged in Australia during the 1960s, even though
these firms were already dominant in the U.S. by this time.
In summary, the Big 8 in Australia did not clearly emerge until the late 1970s or
early 1980s. To provide some corroborative contextual evidence for this view, we count
the number of mentions of the term ‘Big 8’ (or ‘Big Eight’) in articles appearing in the
Australian bi-monthly accounting publication, CHARTAC (self-described as “The
Independent Digest of Latest Accounting News & Development”). This count is plotted
in Figure 3. We start the count from 1990 (a point in time when we know that there is a
significant Big 4 presence in Australia) and, going back in time, continue the count
annually to a year when there are no mentions of the term. In 1990, there are 23
mentions; in 1985, there are 13 mentions; and, in 1980, there are five mentions. The
28
trend continues downward until there is only one mention in 1977, and none in 1976.
This evidence is consistent with our observations above about the emergence of the Big 8.
4.2.2 Changes in the size distribution of Australian audit firms
To investigate how concentration in the Australian audit market changes over the
sample period, Table 5 reports on the size distribution of audit firms, while Table 6
reports several concentration measures.
To measure audit firm size we aggregate audit fee data by audit firm. To the
extent these firms audit entities not captured by our data (including private companies
and government entities), these numbers understate the size of audit firms. Because of
our differential predictions regarding the two size segments of the audit market, we again
report the data overall as well as partitioned into small and large company segments.
Figures 4A and 4B plot the mean, median, and 75th percentile of the size distribution of
audit firms in the two market segments. We again report real 2007 Australian dollars.
Tables 5 and 6 both show a fairly persistent decline in the number of audit firms
over the sample period, from a high of 194 in the late 1970s to 90 in 2006 and 2007 (full
sample data not reported in tables).24 Table 5 shows that in the small company segment,
the number of audit firms increased from 105 in the early 1960s to 158 in the late 1970s,
with the average and median size of these firms increasing as well. After this, however,
the number of audit firms in this segment falls steadily, reaching 82 in 2006-2007. Over
this same period (late 1970s through the 2000s), average firm size increases while median
firm size does not, even showing some tendency to decline. So there is some evidence of
increased concentration in the small company segment of the market (see also Figure 4A).
24 The tables report the average number of audit firms by year for each subperiod. The numbers we report for 1976-1980 represent an average of 194 audit firms per year.

29
In the large company segment of the market, the number of audit firms peaks at
100 in the late 1960s, after which it declines steadily, reaching 34 in 2006-2007, less than
half the number of firms in the small company segment. Consistent with our predictions,
the skewness of this distribution increases substantially over this period, with a
substantial increase in mean firm size (from $527,000 in the late 1960s to around $12
million in 2006-2007) accompanied by a decline in median firm size, from around
$484,000 in the late 1970s to $179,000 in 2006-2007, with the 75th percentile also
declining over most of this period (see also Figure 4B). This is evidence of a sustained
increase in concentration in the large company segment of this market that is more
pronounced than in the small company segment of the market.
The increased concentration is also clear in Table 6, which reports two
concentration measures: (a) the Herfindahl Index, measured using both number of
companies and total assets, and (b) the percentage of companies, audit fees, and assets
accounted for by the Big 4 (defined as the largest 8 audit firms measured by number of
clients prior to 1980, and as the conventionally-defined set of Big 8/6/5/4 firms
thereafter).
The Herfindahl Index based on total assets shows a clear increase in concentration
over the sample period for the large company subsample, increasing steadily from 0.06 in
the early 1960s to around 0.31 in the 2000s. (As a benchmark, the U.S. Department of
Justice considers index values of 0.15 to 0.25 to indicate moderate concentration, and
values above 0.25 as indicating high concentration.) The index crosses the 0.15 threshold
during the 1980s, roughly consistent with our claim above that this is when the Big 4
emerges in Australia.
30
The concentration numbers also reported in Table 6 confirm this impression and
give a clearer picture of the timing of dominance of the market by the Big 4. For the
smaller company segment, there is a steady increase in the market share of the largest
firms, from 17% of assets in the early 1960s to 54% in the early 1980s. (The fractions
are similar if we look at the fraction of companies or fees rather than the fraction of
assets.) After this, the Big 4 share increases to around 60% over the late 1980s and 1990s,
before declining to 55% in the early 2000s and then to 45% in 2006-2007. The relatively
modest Big 4 market share for the smaller company segment as well as the decline in that
share in the 2000s is consistent with our prediction that the increasingly fixed cost nature
of the business likely makes it increasingly less likely that the Big 4 will audit relatively
small companies.
In the large company segment of the market, concentration levels increase more
rapidly than in the small company segment of the market, reaching 60% by 1980
(measured using fees or total assets). After this the fraction of assets audited by the Big 4
continues to increase, to 72% in the first part of the 1990s, 93% in the latter half of the
1990s, and then to 98% in the 2000s, with a very similar increase for share of fees (as
expected, the numbers are not as large for the fraction of companies, which is 80% or just
above that level for the 1990s and 2000s). The contrast between what we observe for the
large and small companies is very clear in Figure 6.
4.3 Evidence on Audit Pricing
Section 2.1 develops a number of predictions regarding audit pricing, which
include arguments about the nature of the audit cost structure (fixed versus variable), the
existence of a Big 4 premium, and how both aspects of pricing change over time as the
31
market for audit services evolves. To test these arguments, we first present evidence on
average audit costs, defined as audit fees deflated by total assets, in both the small and
large company segments, and how these change over time (Table 7 and Figure 7). We
then report OLS regressions, estimated by sub-period, of the natural log of audit fees on
various hypothesized determinants, to investigate how the determination of audit fees
change over time (Table 10). Tables 8 and 9 provide descriptive statistics for the
companies in our audit pricing regressions.
We first discuss the average unit cost of audit services, defined using company-
year observations as audit fees deflated by total assets, reported in Table 7 and Figure 7.
We again report the data for all companies, as well as for the small and large company
market segments. As expected, the distribution of this number is skewed, with means
noticeably larger than medians (to address the small denominator problem that skews the
mean, we report and discuss winsorized means).
For the full sample, winsorized mean (median) audit fees generally increase over
the sample period, from 0.12% (0.10%) in the latter part of the 1960s to 0.48% (0.20%)
in 2006-2007. The increase is not monotonic, however, with the numbers nearly
doubling from the latter part of the 1960s to the latter part of the 1970s, when the
winsorized mean (median) is 0.27% (0.18%). After this, the trend is flat or downward for
the median, while the mean is roughly flat before substantially increasing in the 2000s
(the median also increases noticeably in the 2000s). This indicates that the trends are not
consistent across the sample, as is clear when we look at the size segments. In addition, it
is clear that per unit audit costs generally increase over time—the median doubles over

32
the sample period—so auditing generally has become more expensive, perhaps because
of increased complexity, increased litigation, and/or related factors.
Panel B reports the numbers for the small company segment. Although the trend
is not monotonic, per unit audit costs generally increase over the sample period for the
smaller firms, with the winsorized mean (median) increasing from 0.17% (0.13%) in the
late 1960s to 0.50% (0.27%) by the early 1990s and then to 0.65% (0.32%) by the early
2000s (see also Figure 7, which plots the medians by year). This is a substantial increase
in economic terms and is generally consistent with our prediction that fixed costs become
more important relative to variable costs over time, which would result in an increase in
per unit costs that manifests more strongly in the small company segment (for these firms,
this is partly due to in an increase in the Big 4 premium over time, as we show below).
In strong contrast, per unit audit fees in the large company segment generally
display a flat or declining pattern after the latter part of the 1970s, also broadly consistent
with the increasing importance of fixed costs (see Figure 7, which clearly shows the
different trends for the large and small company segments of the market). In the latter
part of the 1960s, mean (median) audit fees are 0.09% (0.08%), numbers slightly lower
than those for the small company segment, suggestive of a modest level of fixed audit
costs even at that time. Similar to the small company segment, these numbers increase
through the late 1970s, to 0.14% (0.13%), with the median identical to that for the small
company segment. After this, however, the numbers generally decline, to 0.08% (0.06%)
in the early part of the 2000s, numbers substantially below those for the small company
segment, of 0.65% (0.32%). This is evidence that different cost structures emerge for the
large and small company segments of the market over the sample period, broadly

33
consistent with our prediction that fixed costs become more important and do so to a
greater extent in the large company segment of the market. We investigate these
predictions more specifically in the regressions below.
Before turning to the regressions, we present descriptive statistics for the sample
companies. Table 8 reports the industry distribution of the sample over time, again
divided into the large and small company segments. There are a number of changes in
the relative importance of different sectors, the most notable being the emergence of a
large number of mining companies, especially smaller gold mining companies, over the
sample period: by 1995, around 25% (9%) of smaller (larger) companies are in gold
mining, and another 10% (6%) are in other types of mining. There are declines in the
fraction of companies in the building materials, food, engineering, and retail sectors. The
number of companies in investments and financial services declines in the small company
segment but increases in the large company segment, indicating increased concentration
in this sector. We use industry fixed effects in our regressions to account for these
changes.
Table 9 reports descriptive statistics for two key variables that previous research
finds are important in audit pricing, profitability and leverage (measured as net profit on
assets and long-term debt on assets, respectively). Panel A shows the numbers for
profitability. One notable feature of these numbers is the decline in overall profitability
and the increase in the cross-sectional dispersion of profitability for the small company
segment, with the majority of these firms reporting losses after the mid-1980s. In
contrast, numbers for the large company segment are stable, with mean (median)

34
profitability varying in a tight range between 3% and 5% although, similar to the small
company group, cross-sectional variability increases after the mid-1980s.
Panel B of Table 9 reports on leverage. Consistent with prior research, larger
firms are more highly levered (also expected given their higher levels of profitability),
with smaller firms displaying relatively low levels of leverage, with medians less than 5%.
There is a modest upward trend in the leverage of the larger firms, with mean (median)
leverage increasing from 13% (10%) in the late 1960s to 22% (20%) by the early 2000s.
Overall, the evidence shows that the large company segment is characterized by firms
with stable and moderate levels of both profitability and leverage, factors that are also (in
addition to size) likely to make them attractive audit clients.
Table 10 reports OLS audit fee regressions similar to those conventionally
estimated in the audit pricing literature. We regress the natural log of audit fees on a Big
4 dummy (as previously defined), the natural log of total assets, profitability, leverage,
ARINV (the sum of receivables and inventory on total assets), and a loss dummy, as well
as industry and firm fixed effects. Including firm fixed effects means that the R-squares
are very high (well over 90%) but also allows us to interpret the coefficient on size more
meaningfully.
Our main predictions relate to differences in the results for the large and small
company segments as well as to differential time trends for the two sets of firms. Further,
our main predictions relate to the Big 4 dummy and size variables, so we concentrate on
these in our discussion (the profitability, leverage, and ARINV variables are sometimes
significant, especially for the smaller companies, consistent with prior research). There
are three key sets of results, which are related.

35
First, there is a downward trend in the coefficient on size for both sets of
companies. For the large companies, the coefficient on size is around 1.0 for the latter
part of the 1960s and early part of the 1970s but declines to around 0.5 in the early 1990s,
0.6 in the later 1990s, and 0.7 in the first part of the 2000s (because both variables are
natural logs, these coefficients can be interpreted as elasticities). For the small
companies, the coefficient on size is around 0.8 in the latter part of the 1960s and 0.9 in
the early 1970s—levels not very different to those of the larger companies—but decline
more strongly over the sample period, to levels consistently around 0.3 from the latter
part of the 1980s through the 2000s. The differential is consistent with the emergence of
a fixed cost component to audit fees that is more important in the small company audit
segment.
Second, there is a clear and distinct trend in the intercept in these regressions. For
both sets of companies, the intercept is negative in the early part of the sample period but
trends upward over time, becoming positive by the late 1980s (and earlier for the smaller
companies). When combined with the results on the size coefficients, this is clear
evidence of a change in the cost structure over time, with the coefficients on size (of
around 1.0) being suggestive of an essentially proportional relation between audit fees
and firm size, and so of a largely variable cost structure. Over time, however, the
increasingly positive intercept and decline in the size coefficient are suggestive of an
increase in the relative importance of fixed costs, with a much flatter relationship
between fees and size, consistent with our predictions. We include Figure 8 to illustrate
36
this more clearly (Figure 8A for smaller companies and Figure 8B for larger companies),
where the lines are based on representative coefficients from the table.25
As shown in Figure 8A, the relation between audit fees and size is less than
proportional for the smaller companies in the earlier part of the sample period, with fees
increasing from about $4,000 for a $5 million company, to about $12,000 for a $20
million company, and then to about $26,000 for a $50 million company, so there are
some evident economies of scale, perhaps due to labor costs (the cost of more senior
audit personnel, such as partners and senior managers, are likely to have a fixed
component which is likely to be important in small company audits). In contrast (see
Figure 8B), in the early period for the large companies, fees are close to being directly
proportional to size, from about $91,000 for a $100 million company, to $456,000 for a
$500 million company, and to $912,000 for a $1,000 million company. Notice also the
jump in fees from the small to the large company segment (from $26,000 for a $50
million small company to $91,000 for a $100 million large company), a rather steep jump
perhaps indicating that there is a difference in the cost of auditing the largest companies
before the emergence of the Big 4.
In the later period, the relation between audit fees and size is quite different in a
way that is consistent with our arguments. For the small companies, audit fees increase
substantially relative to the earlier period, presumably reflecting a significant increase in
fixed costs (see Figure 8A). For example, for a $5 million company, audit fees jump
from around $4,000 in the early period to around $41,000 in the latter period, a tenfold
25 For the small companies, the lines plot the functions in the early (late) periods with an intercept of -4 (+6) and a size coefficient of 0.8 (0.3). In the later period, we show this same function with a Big 4 coefficient of 0.3. For the large companies, we use an intercept of -7 (+2) and a size coefficient of 1.0 (0.5) for the early (late) periods. There is no Big 4 coefficient for the larger companies. These numbers are rough averages taken from the Table 10 numbers.

37
increase; for a $50 million company, the jump is from $26,000 to $82,000, a threefold
increase. Further, there is now a clear scale effect—as company size increases from $5m
to $20m to $50m, audit fees increase from $41,000 to $51,000 to $82,000, much less than
proportionally. For large companies (Figure 8B), costs actually decline in real terms
relative to the early period, with the decrease increasing in size due to the scale effect—
for a $100m company, audit fees decline from $91,000 in the early period to $74,000 in
the later period; for a $500m company, the decline is from $456,000 to $165,000, a
striking decline, and very different from what we observe for smaller companies. The
scale effect is also evident within the large company segment.
As we had predicted, the Big 4 effect is not evident in either subsample in the
earlier period, consistent with a single and relatively homogeneous audit market at this
time. However, in the later period, we see clear evidence of a Big 4 premium for the
smaller companies but not for the larger companies, consistent with our predictions. For
the smaller companies, there is no evidence of a Big 4 premium until the later part of the
1980s, when we obtain a coefficient of around 0.3 (highly statistically significant). This
timing coincides with our earlier evidence of when the Big 4 emerges. There continues
to be a clear Big 4 premium after this time, with coefficient magnitudes of between 0.1
and 0.4, which is substantial in economic terms and highly significant statistically. The
effect of this premium is illustrated in Figure 8A. This result suggests that those smaller
companies that choose a Big 4 auditor in the later period pay a premium for the higher
fixed costs, a result that can also be interpreted in terms of the conventional
signaling/reputation view. In contrast, for the large companies, there is no evidence of a
Big 4 premium (ignoring two subperiods, one early and one late). This is not surprising

38
given our earlier arguments and evidence—this segment of the market is now essentially
dominated by the Big 4.
Overall, this evidence suggests that there is a structural change in pricing in the
Australian audit over time. In the earlier part of the sample period, before the emergence
of the Big 4, audit fees are proportional to firm size, with modest evidence of a fixed cost
component for smaller companies only. There is no evidence of a Big 4 (large audit
firm) effect at this time. In the latter part of the sample period, the relation between audit
fees and firm size becomes much flatter, with clear evidence of a fixed cost component,
which results in a clear increase (decrease) in audit costs for smaller (larger)
companies. Further, there is evidence of an economically significant Big 4 premium in
the latter part of the sample period for smaller but not larger companies. These results
are generally consistent with our arguments about how audit costs would be expected to
change as a result of underlying changes in the market for audit services in Australia.
5. Summary and Conclusion
We use data from the Australian audit market to provide evidence on how the
audit market changes over time in response to changes in the economy. Specifically, we
argue and provide evidence that our data predates the emergence of the Big 4 in Australia,
which allows us to provide evidence on the economic factors that lead to the Big 4, and
so more generally to provide evidence on why the audit market has naturally become
concentrated over time to the point that four firms dominate the market for audit services
among large public companies. Consequently, our evidence helps shed light on concerns
of regulators about the dominance of the Big 4.
39
Before the Big 4 emerges, our evidence shows that the size distribution of
publicly-listed companies becomes increasingly skewed, with a relatively small number
of companies dominating the distribution. Combined with changes in the complexity of
the economy and corresponding changes in the nature of accounting and auditing (for
example, the emergence of increasingly detailed and complex accounting rules), we
argue that this lead to investments by a small number of audit firms in what Sutton (1991)
calls endogenous sunk costs, and so to the emergence of a small set of large audit firms,
which ultimately become the Big 4. We provide evidence that is generally consistent
with this argument, including changes in the extent of concentration of the market for
audit services, especially for large companies, as well as changes in the pricing and cost
structure of audits. This evidence includes clear evidence of an increase in the
importance of fixed costs relative to variable costs in this market and to the emergence of
a Big 4 premium in the small company segment only.

40
References Anderson, T., and D. Zeghal. 1994. The Pricing of Audit Services: Further Evidence
from the Canadian Market. Accounting and Business Research 24: 195-207. Becker, C., M. DeFond, J. Jiambalvo, and K. R. Subramanyam. 1998. The effect of audit
quality on earnings management. Contemporary Accounting Research 15, 1: 1–24.
Behn, B., J. H. Choi, and T. Kang. 2008. Audit Quality and Properties of Analysts’
Earnings Forecasts. The Accounting Review 83: 327-349. Burrows, G. 1996. A History of the Australian Accounting Research Foundation.
published by Australian Accounting Research Foundation, Melbourne. Carson, E. 2009. Industry specialization by global audit firm networks. The Accounting
Review 84: 355-382. Carson, E., and N. Fargher. 2007. Note on audit fee premiums to client size and industry
specialization. Accounting and Finance 47: 423-446. Carson, E. R. Simnett B. Soo, and A. Wright. 2012. Changes in Audit Market
Competition and the Big N Premium. Auditing: A Journal of Practice and Theory 31: 47-73
Causholli, M., De Martinis, M., Hay, D., and R. Knechel. 2011. Audit Markets, Fees
and Production: Towards an Integrated View of Empirical Audit Research. Journal of Accounting Literature, Forthcoming.
Chan, P., M. Ezzamel, and D. William. 1993. Determinants of audit fees for quoted UK
companies. Journal of Business Finance and Accounting 20, 6: 765-786. Chung, D., and W. Lindsay. 1988. The pricing of audit services: The Canadian
perspective. Contemporary Accounting Research 5, 1: 19-46. Craswell, A., 1999, Who audits Australia? University of Sydney Accounting Foundation. Craswell, A. T., J. R. Francis, and S. L. Taylor., 1995. Audit brand name reputations and
industry specializations. Journal of Accounting and Economics 20: 297-322. Danos, P., and J. W. Eichenseher. 1986. Long-term trends toward seller concentration in
the U.S. audit market. The Accounting Review 61: 633-650. DeAngelo, L. 1981. Auditor size and audit quality. Journal of Accounting and
Economics 3: 183-199.
41
Doogar, R., and R. F. Easley. 1998. Concentration without differentiation: A new look at the determinants of audit market concentration. Journal of Accounting and Economics 25: 235-253.
Dopuch, N., and D. Simunic. 1980. The nature of competition in the accounting
profession, in Regulation and the accounting profession, edited by J. W. Buckly and J. F. Weston (Lifetime Books).
Dunn, K., M. Kohlbeck, and B. W. Mayhew. 2011. The impact of the Big 4
consolidation on audit market share equality. Auditing: A Journal of Practice & Theory 30: 49-73.
Dunn, K., M. Kohlbeck, and B. W. Mayhew. 2013. The impact of market share on audit
price and quality. Unpublished paper, April 29. Electronic copy available at:http://ssrn.com/abstract=2258091.
Eichenseher, J. W., and P. Danos. 1981. The analysis of industry-specific auditor
concentration: Towards an explanatory model. The Accounting Review 56: 479-492.
European Commission. 2010. Green Paper. Audit policy: Lessons from the Crisis.
Available at: http://eurlex.europa.eu/LexUriServ/LexUriServ.do?uri=COM:2010:0561:FIN:EN:PDF
Ferguson, A., J. R. Francis, and D. J. Stokes. 2003. The effects of firm-wide and office-
level industry expertise on audit pricing. The Accounting Review 78: 429-448. Firth, M. 1985. An analysis of audit fees and their determinants in New Zealand.
Auditing: A Journal of Practice and Theory 4, 2: 23-37. Firth, M. 1997. The Provision of Non-audit Services and The Pricing of Audit Fees.
Journal of Business Finance & Accounting 24, 3 & 4: 511-525. Francis, J. R. 1984. The effect of audit firm size on audit prices: A study of the
Australian market. Journal of Accounting and Economics 6, 2: 133-151. Francis, J. R., and D. J. Stokes. 1986. Audit prices, product differentiation, and scale
economies: Further evidence from the Australian market. Journal of Accounting Research 24, 2: 383-393.
GAO (U.S. Government Accounting Office). 2003. Public accounting firms: Mandated
study on consolidation and competition. Available at: http://www.gao.gov/products/GAO-03-864.

42
GAO (U.S. Government Accounting Office). 2008. Audits of public companies: Continued concentration in audit market for large public companies does not call for immediate action. Available at: http://www.gao.gov/new.items/d08163.pdf.
Gul, F. A. 1999. Audit Price, Product Differentiation and Economic Equilibrium.
Auditing: A Journal of Practice & Theory, Spring: 90-100. Hackenbrack, K., and W. R. Knechel. 1997. Resource allocation decisions in audit
engagements. Contemporary Accounting Research 14: 481-499. Hay, D., W. R. Knechel, and N. Wong. 2006. Audit fees: A meta-analysis of the effect
of supply and demand attributes. Contemporary Accounting Research 23, 1: 141-192.
Hay, D. 2012. Further Evidence from Meta-Analysis of Audit Fee Research.
International Journal of Auditing, Forthcoming. Hogan, C. E., and D. C. Jeter. 1999. Industry specialization by auditors. Auditing: A
Journal of Practice & Theory: 18: 1-17. Jobson's Yearbook of Public Companies. Dun & Bradstreet Marketing Pty. 1993 (Sydney,
N.S.W.) Khurana, I., and K. Raman. 2004. Litigation risk and the financial reporting credibility
of Big 4 versus non-Big 4 audits: Evidence from Anglo-American countries. The Accounting Review 79, 2: 473–495.
Kinney, W. R. 1986. Audit technology and preferences for auditing standards. Journal
of Accounting and Economics 8: 73-89. Klein, B., and K. Leffler. 1981. The role of market forces in assuring contractual
performance. Journal of Political Economy 89: 615-641. Lawrence A., M. Minutti-Meza, and P. Zhang. 2011. Can Big 4 versus Non-Big 4
Differences in Audit-Quality Proxies Be Attributed to Client Characteristics? The Accounting Review 86: 259-286.
Lee, D. S. 1996. Auditor market share, product differentiation and audit fees.
Accounting and Business Research 26, 4: 315-324. Lennox, C., and W. Liu. 2012. Does the presence of just a few large audit firms make
the audit market uncompetitive? Working Paper. Nanyang Technological University.
Minutti-Meza, M. 2013. Does auditor specialization improve audit quality? Journal of
Accounting Research 51: 779-817.

43
O’Keefe, T. B., D. A. Simunic, and M.T. Stein. 1994. The production of audit services:
Evidence from a major public accounting firm. Journal of Accounting Research 32: 241-261.
Oxera (Oxera Consulting Limited). 2006. Competition and choice in the UK audit
market. April. Available at: http://www.frc.org.uk/FRC-Documents/FRC/Competition-and-Choice-in-the-UK-Audit-Market.aspx.
Palmrose, Z. 1986. Audit fees and auditor size: Further evidence. Journal of Accounting
Research 24, 4: 97-110. Palmrose, Z. V. 1988. An analysis of auditor litigation and audit service quality. The
Accounting Review 63, 1: 55–73. PCAOB (Public Company Accounting Oversight Board). 2011. Rethinking the
Relevance, Credibility and Transparency of Audits. Available at: http://pcaobus.org/News/Speech/Pages/06022011_DotyKeynoteAddress.aspx.
Rubin, M. A. 1988. Municipal audit fee determinants. The Accounting Review 18: 219-236.
Simunic, D. A. 1980. The pricing of audit services: Theory and evidence. Journal of Accounting Research 22, 3: 161-190.
Sirois, L. P., and D. A. Simunic. 2011. Auditor size and audit quality revisited: The
importance of audit technology. Unpublished paper, University of British Columbia. July. Available at http://papers.ssrn.com/sol3/papers.cfm?abstract_id=1694613.
Sutton, J. 1991. Sunk costs and market structure. The MIT Press (Cambridge, MA). Sutton. 2007. Market structure: Theory and evidence. In Handbook of Industrial
Organization (eds.: R. Schmalanee and R. Willig). Elsevier. Chapter 35. Watts, R. L., and J. L. Zimmerman. 1981. The markets for independence and
independent auditors. Unpublished manuscript, University of Rochester. March. Watts, R. L., and J. L. Zimmerman. 1983. Agency problems, auditing, and the theory of
the firm: Some evidence. Journal of Law and Economics 26 (October): 613-634. Wootton, C.W. and Wolk, C.M. 1992. The development of “The Big Eight” Accounting
Firms in the United States, 1900 to 1990. The Accounting Historians Journal, June, 19: 1-27.
Zeff, S. A. 2003. How the U.S. accounting profession got where it is today: Part I.
Accounting Horizons 17, 3: 189-205.

Figure 1A Size Distribution of Large Australian Companies
Figure 1B Size Distribution of Small Australian Companies
Figure 1A and 1B plots the size distribution of the Australian listed companies across time (x-axis). The size of companies (y–axis) is total assets in $A millions measured using 2007 real dollars. Large (small) companies are those above (below) the 65th percentile of total assets in each year.
0
2000
4000
6000
8000
10000
12000
14000
16000
1960
1965
1970
1975
1980
1985
1990
1995
2000
2005
p95
p75
Mean
Median
0
20
40
60
80
100
120
1960
1965
1970
1975
1980
1985
1990
1995
2000
2005
p95
p75
Mean
Median

Figure 2 Total Market Size Log Scale ( $billions of total assets)
Figure 2 presents in log-scale the aggregate sum of the total assets of Australian listed companies (y-axis) across time (x-axis). Large (small) companies are those above (below) the 65th percentile of total assets in each year.
Figure 3 Count of mentions of “Big8” in the accounting industry journal
Figure 3 presents a count of the frequency with which the term ‘Big 8’ (or ‘Big Eight’) appears in articles appearing in the Australian bi-monthly accounting publication, CHARTAC (self-described as “The Independent Digest of Latest Accounting News & Development”) over the period from 1976 to 1990. We start the count from 1990 (a point in time when we know that there is a significant Big 4 presence in Australia) and, going back in time, continue the count annually to a year when there are no mentions of the term.
1
10
100
1,000
10,000
1962
1967
1972
1977
1982
1987
1992
1997
2002
2007
All Companies
Large Companies
Small Companies
0
5
10
15
20
25
1976
1977
1978
1979
1980
1981
1982
1983
1984
1985
1986
1987
1988
1989
1990
Count of Big 8 media menBons

Figure 4A Audit firm size in the Small Company Market (based on fees, 2007 $A Millions)
Figure 4B Audit firm size in Large Company Market (based on fees, 2007 $A Millions)
Figure 4A and 4B plots the size distribution of the Australian audit firms across time (x-axis). The size of audit firms (y–axis) is measured using audit fees in $A millions using 2007 real dollars. Large (small) market segments are those companies above (below) the 65th percentile of total assets in each year.
0.00
0.10
0.20
0.30
0.40
0.50
0.60
0.70
0.80
0.90
1962
1967
1972
1977
1982
1987
1992
1997
2002
2007
Mean
p75
Median
0.00
2.00
4.00
6.00
8.00
10.00
12.00
14.00
1962
1967
1972
1977
1982
1987
1992
1997
2002
2007
Mean
p75
Median

Figure 5 Herfindahl Index for Australian audit market
Figure 5 presents the Herfindahl Index for the Australian audit market over the period from 1962 to 2007 calculated for each year as the sum of the square of the each auditor’s market share measured as the size of companies audited as a percent of total size of companies. Large (small) company market segments are those companies above (below) the 65th percentile of total assets in each year.
Figure 6 BIG 4 Market Share (percent of assets audited)
Figure 6 presents the percent of the large and small company market segments audited by the BIG 4 over the period from 1962 to 2007. Large (small) market segments are those above (below) the 65th percentile of total assets in each year The percent (y-axis) is the sum of the total assets of the companies audited by the BIG 4 as a percent of the total assets of all companies. The BIG 4 subsequent to 1980 is taken to be the conventional Big Eight, then the Big Six, Big Five and Big Four. Prior to 1980 the top 8 ranked audit firms measured by number of companies was taken to be the BIG 4.
0
0.05
0.1
0.15
0.2
0.25
0.3
0.35
0.4
1962
1967
1972
1977
1982
1987
1992
1997
2002
2007
Large Companies
Small Companies
0.0000
0.2000
0.4000
0.6000
0.8000
1.0000 1962
1967
1972
1977
1982
1987
1992
1997
2002
2007
Large Companies
Small Companies

Figure 7 Median audit fees/total-asset ratio for large and small companies
Figure 7 plots the median of the audit fees/total-asset ratio across time for large and small companies. Large (small) companies are those above (below) the 65th percentile of total assets in each year.
0.00000
0.00050
0.00100
0.00150
0.00200
0.00250
0.00300
0.00350
0.00400
1960
1965
1970
1975
1980
1985
1990
1995
2000
2005
Small Companies
Large Companies

TABLE 1 Number of company observations by year
This table presents that number of company observations by year for each of the two samples used in this study. Sample1 are those company-year observations for which we have both audit fees and total assets. Sample2 are those company-year observations for which we have the control variables net profit, accounts receivable, stock and long-term debt. ASX Listed Population is the number of companies listed on the Australian Stock Exchange. Percent Coverage is the sample observations as a percent of the ASX Listed Population Observations ASX Listed
Population Percent Coverage
Sample1 Sample2 Sample1 Sample2 1962 329 327 950 0.3463 0.3442 1963 383 381 950 0.4032 0.4011 1964 398 396 950 0.4189 0.4168 1965 404 402 950 0.4253 0.4232 1966 414 412 950 0.4358 0.4337 1967 418 416 950 0.4400 0.4379 1968 423 421 950 0.4453 0.4432 1969 429 427 940 0.4564 0.4543 1970 438 436 1092 0.4011 0.3993 1971 445 443 1257 0.3540 0.3524 1972 455 453 1317 0.3455 0.3440 1973 464 462 1350 0.3437 0.3422 1974 475 473 1358 0.3498 0.3483 1975 477 475 1313 0.3633 0.3618 1976 478 476 1254 0.3812 0.3796 1977 901 897 1183 0.7616 0.7582 1978 884 880 1124 0.7865 0.7829 1979 873 869 1070 0.8159 0.8121 1980 724 530 1043 0.6942 0.5081 1981 837 632 1010 0.8287 0.6257 1982 866 700 975 0.8882 0.7179 1983 861 671 956 0.9006 0.7019 1984 885 644 985 0.8985 0.6538 1985 820 540 1133 0.7237 0.4766 1986 1045 13 1375 0.7600 0.0095 1987 1459 23 1805 0.8083 0.0127 1988 1521 31 1869 0.8138 0.0166 1989 1297 563 1819 0.7130 0.3095 1990 1178 655 1604 0.7344 0.4084 1991 1074 683 1372 0.7828 0.4978 1992 964 696 1216 0.7928 0.5724
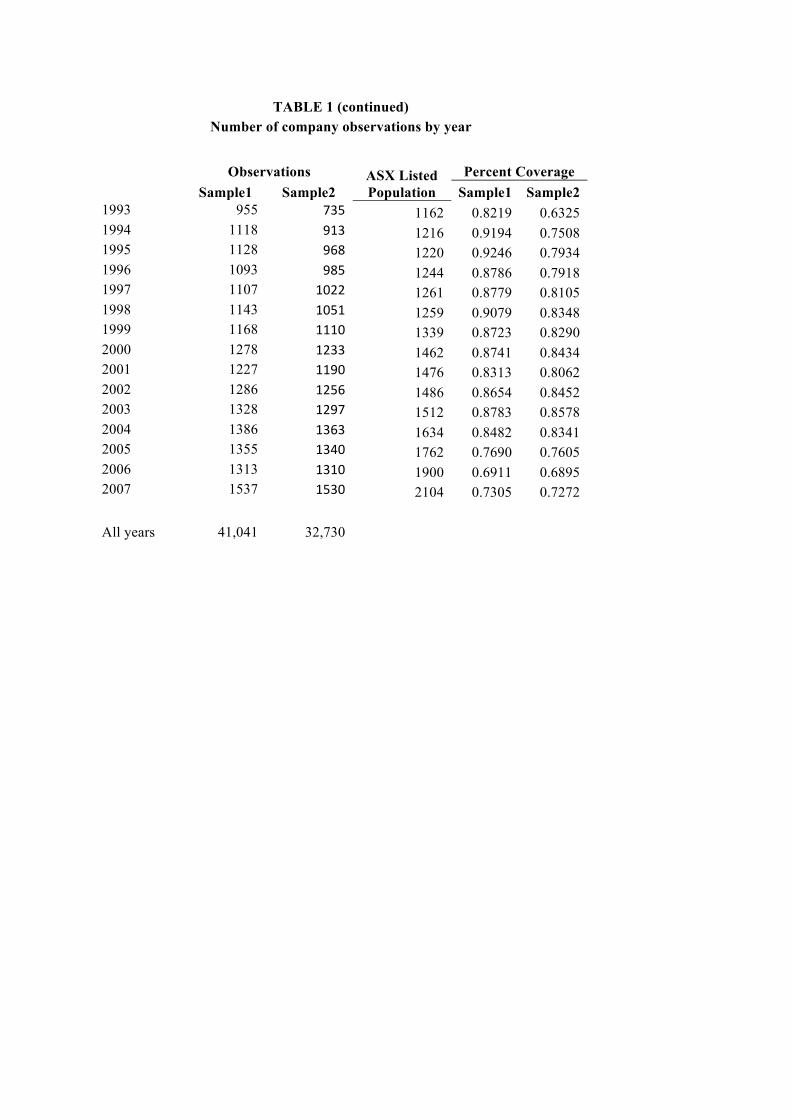
TABLE 1 (continued) Number of company observations by year
Observations ASX Listed
Population Percent Coverage
Sample1 Sample2 Sample1 Sample2 1993 955 735 1162 0.8219 0.6325 1994 1118 913 1216 0.9194 0.7508 1995 1128 968 1220 0.9246 0.7934 1996 1093 985 1244 0.8786 0.7918 1997 1107 1022 1261 0.8779 0.8105 1998 1143 1051 1259 0.9079 0.8348 1999 1168 1110 1339 0.8723 0.8290 2000 1278 1233 1462 0.8741 0.8434 2001 1227 1190 1476 0.8313 0.8062 2002 1286 1256 1486 0.8654 0.8452 2003 1328 1297 1512 0.8783 0.8578 2004 1386 1363 1634 0.8482 0.8341 2005 1355 1340 1762 0.7690 0.7605 2006 1313 1310 1900 0.6911 0.6895 2007 1537 1530 2104 0.7305 0.7272
All years 41,041 32,730

TABLE 2 Descriptive Statistics for Total assets ('000) reported in real dollars
The table reports the descriptive statistics, presented in five-yearly intervals, for total assets for the 41,041 company-year observations across the period from 1961 to 2007. All figures are in $'000 and 2007 real dollars. Large (small) companies are those companies above (below) the 65th percentile of total assets in each year.
Year Obs Mean Median Std
Coeff Var Skewness p25 p75 p95 p99 Max
Panel A All Companies 1962 to 1965 1514 212,096 51,591 851,778 4.01 20.12 18,893 157,129 867,478 2,169,089 25,849,260 1966 to 1970 2122 347,098 62,246 1,896,045 5.46 14.46 22,450 184,963 1,088,133 3,632,996 34,347,357 1971 to 1975 2316 569,864 88,329 3,305,171 5.80 12.39 32,713 252,221 1,441,243 5,956,271 55,534,223 1976 to 1980 3860 450,693 52,534 2,947,989 6.54 13.85 13,334 173,884 1,155,103 4,961,481 54,116,466 1981 to 1985 4269 586,672 40,040 4,613,829 7.86 16.74 12,102 167,477 1,588,183 5,776,698 111,055,983 1986 to 1990 6500 698,975 30,219 6,722,215 9.62 19.30 9,274 120,893 1,548,876 8,254,696 179,699,724 1991 to 1995 5239 1,030,972 24,102 9,337,941 9.06 15.50 5,689 129,852 2,470,982 11,793,927 200,602,410 1996 to 2000 5789 1,536,767 37,344 14,448,287 9.40 17.07 9,862 179,665 2,833,114 21,772,690 429,318,542 2001 to 2005 6582 1,782,284 25,243 18,525,022 10.39 17.88 7,222 143,542 2,876,032 27,963,805 447,047,652 2006 to 2007 2850 2,193,639 30,636 23,074,861 10.52 17.65 8,467 176,844 3,375,520 27,384,600 565,000,000 Panel B Small Companies 1962 to 1965 756 21,391 18,890 14,289 0.52 0.43 9,190 32,717 47,348 51,011 54,755 1966 to 1970 1060 25,631 22,437 17,324 0.68 0.55 11,093 38,446 57,527 67,936 72,292 1971 to 1975 1156 37,335 32,683 24,692 0.66 0.44 16,416 56,842 81,538 91,285 95,646 1976 to 1980 2454 29,669 19,874 27,633 0.93 0.98 6,768 46,597 84,340 101,812 127,695 1981 to 1985 2795 25,674 17,820 22,624 0.88 1.06 7,658 38,782 72,657 89,145 102,511 1986 to 1990 4256 19,450 13,400 17,316 0.89 1.08 5,689 28,892 56,330 67,144 74,231 1991 to 1995 3430 15,815 8,758 17,325 1.10 1.56 3,355 22,495 54,067 72,154 85,287 1996 to 2000 3792 24,024 14,923 23,807 0.99 1.30 6,101 35,651 77,551 95,640 102,700 2001 to 2005 4311 16,889 10,724 16,484 0.98 1.29 4,404 24,155 53,387 65,018 77,844 2006 to 2007 1867 20,043 12,854 19,295 0.96 1.23 5,328 29,152 62,279 76,703 81,052

TABLE 2 (continued) Descriptive Statistics for Total assets ('000) reported in real dollars
Year Obs Mean Median Std
Coeff Var Skewness p25 p75 p95 p99 Max
Panel C Large Companies 1962 to 1965 758 402,299 157,093 1,174,604 2.92 15.10 84,519 372,051 1,376,234 2,686,516 25,849,260 1966 to 1970 1062 667,961 184,368 2,641,968 3.96 10.33 101,858 484,630 1,809,762 9,429,139 34,347,357 1971 to 1975 1160 1,100,557 251,177 4,610,281 4.19 8.78 138,839 625,179 2,477,940 26,696,917 55,534,223 1976 to 1980 1406 1,185,537 275,259 4,797,766 4.05 8.37 153,835 670,653 2,544,362 26,719,627 54,116,466 1981 to 1985 1474 1,650,437 316,428 7,742,709 4.69 9.86 156,907 887,532 3,854,861 31,848,025 111,055,983 1986 to 1990 2244 1,987,771 216,390 11,331,037 5.70 11.34 114,307 679,537 5,227,500 31,550,698 179,699,724 1991 to 1995 1809 2,955,786 261,437 15,714,909 5.32 9.06 120,764 933,472 8,103,456 128,291,750 200,602,410 1996 to 2000 1997 4,409,236 410,022 24,346,213 5.52 10.00 168,195 1,164,080 9,696,143 157,237,937 429,318,542 2001 to 2005 2271 5,133,504 324,921 31,269,064 6.09 10.46 131,342 1,253,182 10,561,211 90,730,189 447,047,652 2006 to 2007 983 6,321,924 401,961 38,970,633 6.16 10.32 166,111 1,597,645 13,623,189 126,000,000 565,000,000
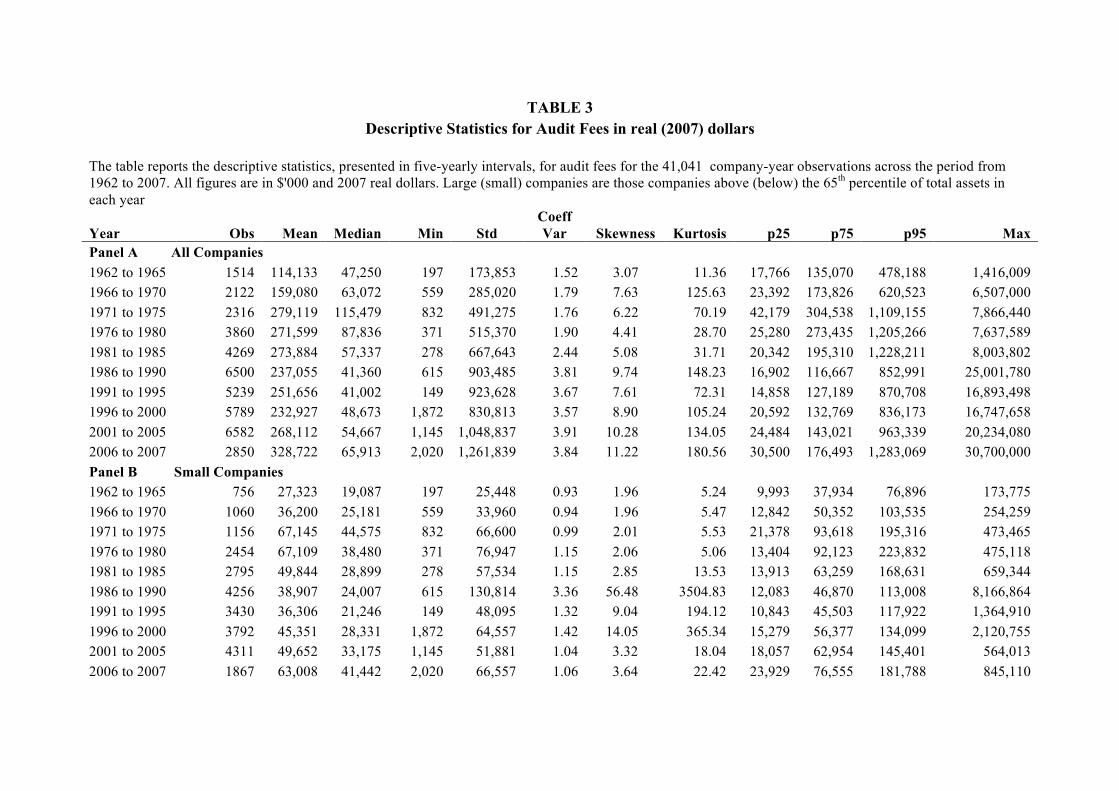
TABLE 3 Descriptive Statistics for Audit Fees in real (2007) dollars
The table reports the descriptive statistics, presented in five-yearly intervals, for audit fees for the 41,041 company-year observations across the period from 1962 to 2007. All figures are in $'000 and 2007 real dollars. Large (small) companies are those companies above (below) the 65th percentile of total assets in each year
Year Obs Mean Median Min Std Coeff Var Skewness Kurtosis p25 p75 p95 Max
Panel A All Companies 1962 to 1965 1514 114,133 47,250 197 173,853 1.52 3.07 11.36 17,766 135,070 478,188 1,416,009 1966 to 1970 2122 159,080 63,072 559 285,020 1.79 7.63 125.63 23,392 173,826 620,523 6,507,000 1971 to 1975 2316 279,119 115,479 832 491,275 1.76 6.22 70.19 42,179 304,538 1,109,155 7,866,440 1976 to 1980 3860 271,599 87,836 371 515,370 1.90 4.41 28.70 25,280 273,435 1,205,266 7,637,589 1981 to 1985 4269 273,884 57,337 278 667,643 2.44 5.08 31.71 20,342 195,310 1,228,211 8,003,802 1986 to 1990 6500 237,055 41,360 615 903,485 3.81 9.74 148.23 16,902 116,667 852,991 25,001,780 1991 to 1995 5239 251,656 41,002 149 923,628 3.67 7.61 72.31 14,858 127,189 870,708 16,893,498 1996 to 2000 5789 232,927 48,673 1,872 830,813 3.57 8.90 105.24 20,592 132,769 836,173 16,747,658 2001 to 2005 6582 268,112 54,667 1,145 1,048,837 3.91 10.28 134.05 24,484 143,021 963,339 20,234,080 2006 to 2007 2850 328,722 65,913 2,020 1,261,839 3.84 11.22 180.56 30,500 176,493 1,283,069 30,700,000 Panel B Small Companies 1962 to 1965 756 27,323 19,087 197 25,448 0.93 1.96 5.24 9,993 37,934 76,896 173,775 1966 to 1970 1060 36,200 25,181 559 33,960 0.94 1.96 5.47 12,842 50,352 103,535 254,259 1971 to 1975 1156 67,145 44,575 832 66,600 0.99 2.01 5.53 21,378 93,618 195,316 473,465 1976 to 1980 2454 67,109 38,480 371 76,947 1.15 2.06 5.06 13,404 92,123 223,832 475,118 1981 to 1985 2795 49,844 28,899 278 57,534 1.15 2.85 13.53 13,913 63,259 168,631 659,344 1986 to 1990 4256 38,907 24,007 615 130,814 3.36 56.48 3504.83 12,083 46,870 113,008 8,166,864 1991 to 1995 3430 36,306 21,246 149 48,095 1.32 9.04 194.12 10,843 45,503 117,922 1,364,910 1996 to 2000 3792 45,351 28,331 1,872 64,557 1.42 14.05 365.34 15,279 56,377 134,099 2,120,755 2001 to 2005 4311 49,652 33,175 1,145 51,881 1.04 3.32 18.04 18,057 62,954 145,401 564,013 2006 to 2007 1867 63,008 41,442 2,020 66,557 1.06 3.64 22.42 23,929 76,555 181,788 845,110

TABLE 3 (continued) Descriptive Statistics for Audit Fees in real (2007) dollars
Obs Mean Median Min Std
Coeff Var Skewness Kurtosis p25 p75 p95 Max
Panel C Large Companies 1962 to 1965 758 200,715 133,576 5,876 211,498 1.05 2.20 5.45 65,625 235,851 684,316 1,416,009 1966 to 1970 1062 281,729 168,711 7,113 362,082 1.29 6.44 86.52 90,947 343,538 945,000 6,507,000 1971 to 1975 1160 490,362 285,411 3,327 623,040 1.27 5.09 46.00 145,451 610,010 1,599,735 7,866,440 1976 to 1980 1406 628,511 388,208 2,423 720,186 1.15 2.89 12.59 191,303 787,500 2,031,899 7,637,589 1981 to 1985 1474 698,708 321,504 9,247 1,004,703 1.44 3.00 10.46 150,727 797,669 2,952,523 8,003,802 1986 to 1990 2244 612,865 169,024 2,847 1,454,955 2.37 5.90 55.35 78,749 439,463 3,056,568 25,001,780 1991 to 1995 1809 659,976 185,731 3,120 1,487,387 2.25 4.44 24.16 88,102 468,042 3,605,422 16,893,498 1996 to 2000 1997 589,107 186,136 3,645 1,341,604 2.28 5.32 37.15 84,607 446,872 2,629,382 16,747,658 2001 to 2005 2271 682,810 212,264 3,678 1,709,212 2.50 6.15 47.09 96,964 517,937 2,632,251 20,234,080 2006 to 2007 983 833,388 274,068 3,754 2,054,711 2.47 6.80 65.97 116,797 611,116 3,002,000 30,700,000
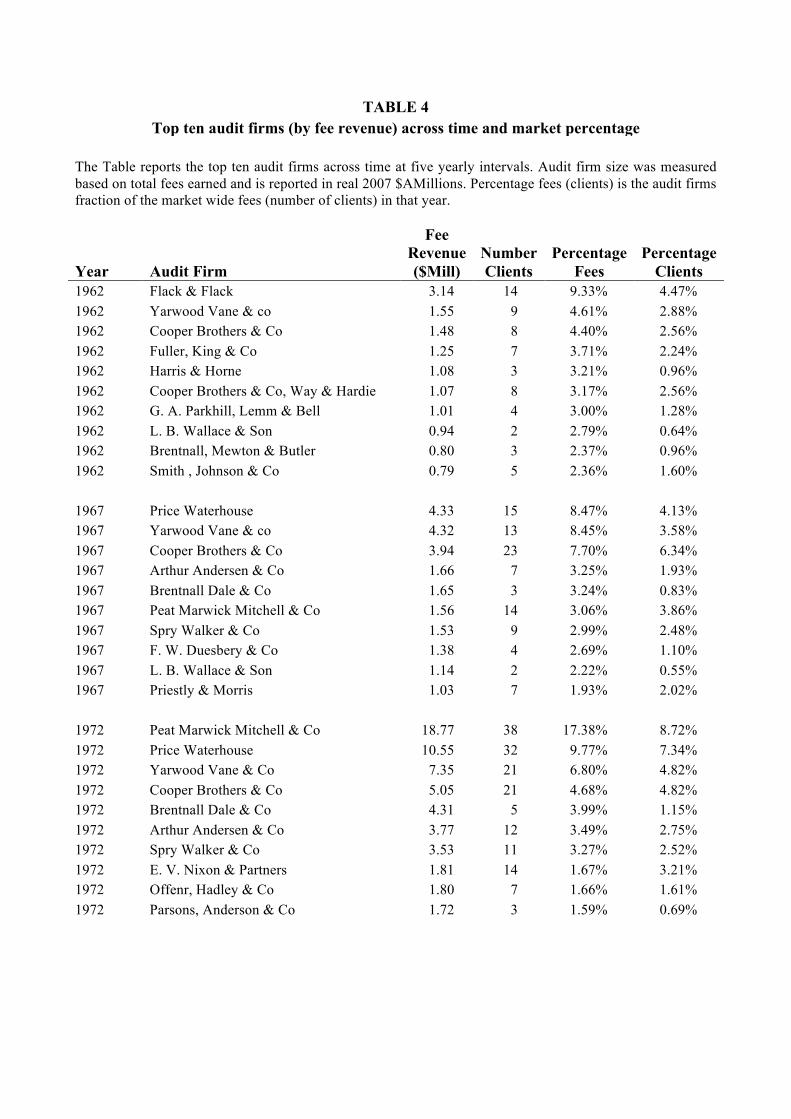
TABLE 4 Top ten audit firms (by fee revenue) across time and market percentage
The Table reports the top ten audit firms across time at five yearly intervals. Audit firm size was measured based on total fees earned and is reported in real 2007 $AMillions. Percentage fees (clients) is the audit firms fraction of the market wide fees (number of clients) in that year.
Fee
Revenue ($Mill)
Number Clients
Percentage Fees
Percentage Clients Year Audit Firm
1962 Flack & Flack 3.14 14 9.33% 4.47% 1962 Yarwood Vane & co 1.55 9 4.61% 2.88% 1962 Cooper Brothers & Co 1.48 8 4.40% 2.56% 1962 Fuller, King & Co 1.25 7 3.71% 2.24% 1962 Harris & Horne 1.08 3 3.21% 0.96% 1962 Cooper Brothers & Co, Way & Hardie 1.07 8 3.17% 2.56% 1962 G. A. Parkhill, Lemm & Bell 1.01 4 3.00% 1.28% 1962 L. B. Wallace & Son 0.94 2 2.79% 0.64% 1962 Brentnall, Mewton & Butler 0.80 3 2.37% 0.96% 1962 Smith , Johnson & Co 0.79 5 2.36% 1.60%
1967 Price Waterhouse 4.33 15 8.47% 4.13% 1967 Yarwood Vane & co 4.32 13 8.45% 3.58% 1967 Cooper Brothers & Co 3.94 23 7.70% 6.34% 1967 Arthur Andersen & Co 1.66 7 3.25% 1.93% 1967 Brentnall Dale & Co 1.65 3 3.24% 0.83% 1967 Peat Marwick Mitchell & Co 1.56 14 3.06% 3.86% 1967 Spry Walker & Co 1.53 9 2.99% 2.48% 1967 F. W. Duesbery & Co 1.38 4 2.69% 1.10% 1967 L. B. Wallace & Son 1.14 2 2.22% 0.55% 1967 Priestly & Morris 1.03 7 1.93% 2.02%
1972 Peat Marwick Mitchell & Co 18.77 38 17.38% 8.72% 1972 Price Waterhouse 10.55 32 9.77% 7.34% 1972 Yarwood Vane & Co 7.35 21 6.80% 4.82% 1972 Cooper Brothers & Co 5.05 21 4.68% 4.82% 1972 Brentnall Dale & Co 4.31 5 3.99% 1.15% 1972 Arthur Andersen & Co 3.77 12 3.49% 2.75% 1972 Spry Walker & Co 3.53 11 3.27% 2.52% 1972 E. V. Nixon & Partners 1.81 14 1.67% 3.21% 1972 Offenr, Hadley & Co 1.80 7 1.66% 1.61% 1972 Parsons, Anderson & Co 1.72 3 1.59% 0.69%
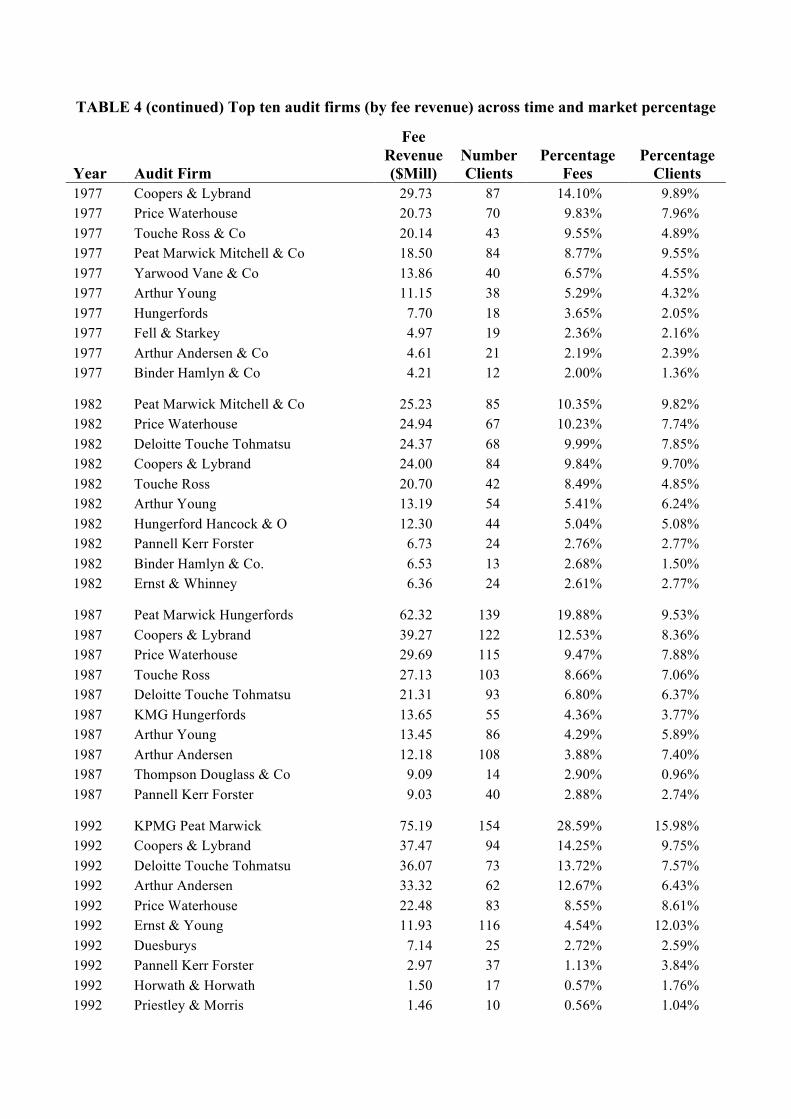
TABLE 4 (continued) Top ten audit firms (by fee revenue) across time and market percentage
Fee Revenue ($Mill)
Number Clients
Percentage Fees
Percentage Clients Year Audit Firm
1977 Coopers & Lybrand 29.73 87 14.10% 9.89% 1977 Price Waterhouse 20.73 70 9.83% 7.96% 1977 Touche Ross & Co 20.14 43 9.55% 4.89% 1977 Peat Marwick Mitchell & Co 18.50 84 8.77% 9.55% 1977 Yarwood Vane & Co 13.86 40 6.57% 4.55% 1977 Arthur Young 11.15 38 5.29% 4.32% 1977 Hungerfords 7.70 18 3.65% 2.05% 1977 Fell & Starkey 4.97 19 2.36% 2.16% 1977 Arthur Andersen & Co 4.61 21 2.19% 2.39% 1977 Binder Hamlyn & Co 4.21 12 2.00% 1.36%
1982 Peat Marwick Mitchell & Co 25.23 85 10.35% 9.82% 1982 Price Waterhouse 24.94 67 10.23% 7.74% 1982 Deloitte Touche Tohmatsu 24.37 68 9.99% 7.85% 1982 Coopers & Lybrand 24.00 84 9.84% 9.70% 1982 Touche Ross 20.70 42 8.49% 4.85% 1982 Arthur Young 13.19 54 5.41% 6.24% 1982 Hungerford Hancock & O 12.30 44 5.04% 5.08% 1982 Pannell Kerr Forster 6.73 24 2.76% 2.77% 1982 Binder Hamlyn & Co. 6.53 13 2.68% 1.50% 1982 Ernst & Whinney 6.36 24 2.61% 2.77%
1987 Peat Marwick Hungerfords 62.32 139 19.88% 9.53% 1987 Coopers & Lybrand 39.27 122 12.53% 8.36% 1987 Price Waterhouse 29.69 115 9.47% 7.88% 1987 Touche Ross 27.13 103 8.66% 7.06% 1987 Deloitte Touche Tohmatsu 21.31 93 6.80% 6.37% 1987 KMG Hungerfords 13.65 55 4.36% 3.77% 1987 Arthur Young 13.45 86 4.29% 5.89% 1987 Arthur Andersen 12.18 108 3.88% 7.40% 1987 Thompson Douglass & Co 9.09 14 2.90% 0.96% 1987 Pannell Kerr Forster 9.03 40 2.88% 2.74%
1992 KPMG Peat Marwick 75.19 154 28.59% 15.98% 1992 Coopers & Lybrand 37.47 94 14.25% 9.75% 1992 Deloitte Touche Tohmatsu 36.07 73 13.72% 7.57% 1992 Arthur Andersen 33.32 62 12.67% 6.43% 1992 Price Waterhouse 22.48 83 8.55% 8.61% 1992 Ernst & Young 11.93 116 4.54% 12.03% 1992 Duesburys 7.14 25 2.72% 2.59% 1992 Pannell Kerr Forster 2.97 37 1.13% 3.84% 1992 Horwath & Horwath 1.50 17 0.57% 1.76% 1992 Priestley & Morris 1.46 10 0.56% 1.04%

TABLE 4 (continued) Top ten audit firms (by fee revenue) across time and market percentage
Fee Revenue ($Mill)
Number Clients
Percentage Fees
Percentage Clients Year Audit Firm
1997 KPMG 81.65 169 31.23% 15.56% 1997 Coopers & Lybrand 43.44 126 16.61% 11.60% 1997 Arthur Andersen 32.59 84 12.46% 7.74% 1997 Ernst & Young 27.26 142 10.43% 13.08% 1997 Deloitte Touche Tohmatsu 26.68 98 10.20% 9.02% 1997 Price Waterhouse 18.72 56 7.16% 5.16% 1997 BDO 5.08 45 1.94% 4.14% 1997 Pannell Kerr Forster 3.52 44 1.35% 4.05% 1997 Price Waterhouse 2.00 33 0.77% 3.04% 1997 Grant Thornton 1.36 31 0.52% 2.86%
2002 Ernst & Young 130.38 262 38.53% 20.63% 2002 PriceWaterhouseCoopers 81.26 221 24.02% 17.40% 2002 KPMG 77.04 190 22.77% 14.96% 2002 Deloitte Touche Tohmatsu 25.78 118 7.62% 9.29% 2002 BDO 3.40 61 1.01% 4.80% 2002 Pannell Kerr Forster 2.79 58 0.83% 4.57% 2002 Grant Thornton 1.83 37 0.54% 2.91% 2002 WHK Horwath 1.71 25 0.51% 1.97% 2002 Pitcher Partners 1.34 11 0.40% 0.87% 2002 Hall Chadwick 0.87 22 0.26% 1.73%
2007 PriceWaterhouseCoopers 157.85 181 32.31% 11.82% 2007 KPMG 135.69 187 27.78% 12.21% 2007 Ernst & Young 98.50 244 20.16% 15.93% 2007 Deloitte Touche Tohmatsu 46.18 141 9.45% 9.20% 2007 Pannell Kerr Forster 8.05 99 1.65% 6.46% 2007 BDO 7.86 122 1.61% 7.96% 2007 Pitcher Partners 6.44 35 1.32% 2.29% 2007 Grant Thornton 3.68 51 0.75% 3.33% 2007 Moore Stephens 3.00 25 0.61% 1.63% 2007 Bentleys 2.20 36 0.45% 2.35%

TABLE 5 Distributional Properties of Audit Firm Size measured as the sum of audit fees (in 2007 dollars)
This table reports the number of auditors and descriptive statistics for the size of audit firms across time from 1962 to 2007. The size of an audit firm is measured each year as the sum of the auditor’s audit fees. All figures are in 2007 real dollars. Large (small) companies are those companies above (below) the 65th percentile of total assets in each year.
Coeff Var Year Obs Mean Median Std Skew Kurtosis Min p25 p75 p95 p99 Max
Panel A Small Companies 1962 to 1965 105 39,760 26,972 44,556 1.12 2.42 6.76 700 10,560 50,266 132,657 225,663 257,166 1966 to 1970 122 55,974 32,394 74,345 1.33 3.63 19.38 783 13,733 69,033 197,595 362,358 747,747 1971 to 1975 118 125,934 55,611 223,214 1.77 4.81 30.7 892 25,679 128,571 496,764 1,262,197 2,241,652 1976 to 1980 158 203,012 56,717 486,919 2.40 4.78 25.68 606 22,676 145,101 1,017,180 3,210,394 3,719,815 1981 to 1985 134 207,923 46,234 512,966 2.47 4.29 19.82 616 20,021 127,865 1,065,564 2,838,317 3,796,120 1986 to 1990 127 260,081 43,409 722,879 2.78 5.04 33.54 768 16,875 111,647 1,776,342 3,216,381 8,166,864 1991 to 1995 107 233,640 40,663 652,712 2.79 4.4 21.21 149 14,410 106,859 1,684,795 3,525,054 5,069,857 1996 to 2000 98 348,293 49,774 970,108 2.79 4.23 18.97 2,228 19,344 155,287 2,044,636 5,393,399 6,775,029 2001 to 2005 93 455,577 49,028 1,359,742 2.98 4.38 20.3 2,229 20,031 146,752 3,031,551 7,406,114 10,604,921 2006 to 2007 82 719,778 71,488 1,859,145 2.58 3.71 14.45 2,020 27,163 272,458 5,824,593 10,783,841 11,273,554 Panel B Large Companies 1961 to 1965 88 353,810 153,069 477,809 1.35 3.22 14.21 7,350 67,736 456,616 1,068,791 2,832,200 3,541,584 1966 to 1970 100 526,958 186,581 972,155 1.84 5.08 35.46 7,113 88,792 596,176 1,630,256 5,225,771 10,708,281 1971 to 1975 97 1,078,775 292,061 2,296,433 2.13 4.65 25.08 3,616 139,729 1,084,821 3,937,409 13,615,791 19,801,331 1976 to 1980 79 2,127,631 483,783 4,349,289 2.04 3.34 11.34 2,423 211,169 1,802,791 14,082,100 21,239,663 27,223,620 1981 to 1985 60 3,410,249 428,153 6,516,522 1.91 2.51 5.89 9,247 139,221 3,205,479 20,107,948 29,855,157 34,994,466 1986 to 1990 67 4,109,747 240,413 10,886,598 2.65 4.47 25.92 2,847 98,341 1,691,314 25,240,368 59,375,975 99,442,427 1991 to 1995 50 4,737,684 200,305 12,938,809 2.73 3.81 16.1 3,120 84,082 836,903 31,932,022 76,240,264 77,651,363 1996 to 2000 38 6,200,910 205,092 15,753,592 2.54 2.94 8.23 3,645 90,606 770,466 43,017,246 78,211,936 78,251,146 2001 to 2005 35 8,668,962 192,306 25,139,390 2.90 3.15 8.9 11,446 89,693 719,967 83,201,671 112,414,221 123,285,371 2006 to 2007 34 12,197,526 179,000 34,357,888 2.82 2.95 7.55 5,280 87,450 1,336,474 114,991,832 149,424,709 149,424,709

TABLE 6 Number of Auditors, Herfindahl Index and Percent of Market audited by BIGN
This table reports the number of audit firms within each five-yearly interval and five alternate measures of auditor industry concentration. The Herfindahl Index is calculated for each year as the sum of the square of the each auditor’s market share measured as the number (size) of companies audited as a percent of total number (size) of companies. Percent of Companies is the percent of the total number of companies audited by the BIG N. Percent of Fees is the sum of the audit fees charged by the BIGN as a percent of the total audit fees of all companies. Percent of Total Assets is the sum of the total assets of the companies audited by the BIGN as a percent of the total assets of all companies. The BIGN subsequent to 1980 is taken to be the conventional Big Eight, then the Big Six, Big Five and Big Four. Prior to 1980 the top 8 ranked audit firms measured by number of companies was taken to be the BIGN.
Number of Auditors
Herfindahl Index Big N Percent of Market
Year No. of
Companies Total Assets
No. of Companies Fees Total Assets
Panel A Small Companies 1962 to 1965 122 0.0119 0.0155 0.15 0.18 0.17 1966 to 1970 122 0.0152 0.0185 0.25 0.28 0.28 1971 to 1975 118 0.0229 0.0300 0.35 0.40 0.40 1976 to 1980 158 0.0311 0.0380 0.43 0.49 0.47 1981 to 1985 134 0.0398 0.0490 0.50 0.56 0.54 1986 to 1990 127 0.0491 0.0585 0.55 0.59 0.60 1991 to 1995 107 0.0601 0.0749 0.53 0.63 0.62 1996 to 2000 98 0.0708 0.0867 0.54 0.62 0.62 2001 to 2005 93 0.0741 0.0905 0.47 0.60 0.55 2006 to 2007 82 0.0615 0.0780 0.36 0.53 0.45 Panel B Large Companies 1962 to 1965 102 0.0171 0.0534 0.25 0.30 0.28 1966 to 1970 100 0.0239 0.0963 0.33 0.42 0.29 1971 to 1975 97 0.0345 0.1195 0.41 0.51 0.48 1976 to 1980 79 0.0575 0.1158 0.57 0.60 0.61 1981 to 1985 60 0.0704 0.1474 0.67 0.67 0.63 1986 to 1990 67 0.0778 0.1719 0.70 0.72 0.64 1991 to 1995 50 0.1206 0.2242 0.80 0.86 0.75 1996 to 2000 38 0.1478 0.2877 0.83 0.93 0.93 2001 to 2005 35 0.1859 0.3146 0.83 0.95 0.98 2006 to 2007 34 0.1779 0.3153 0.81 0.95 0.98

TABLE 7 Audit Fees/Total Assets
The Table reports descriptive statistics for the ratio of audit fees to total assets, presented in five-yearly intervals, for the 41,041 company-year observations across the period from 1962 to 2007. Large (small) companies are those companies above (below) the 65th percentile of total assets in each year. W-Mean is the mean winsorized at the 99th percentile
Year Obs Mean W-Mean Median P25 P75 P95 P99 Max Panel A All Companies 1962 to 1965 1514 0.0012 0.0012 0.0009 0.0005 0.0015 0.0034 0.0054 0.0111 1966 to 1970 2122 0.0013 0.0013 0.0010 0.0006 0.0017 0.0035 0.0057 0.0106 1971 to 1975 2316 0.0016 0.0016 0.0013 0.0007 0.0020 0.0039 0.0060 0.0135 1976 to 1980 3860 0.0034 0.0027 0.0018 0.0010 0.0031 0.0078 0.0193 0.6944 1981 to 1985 4269 0.0031 0.0023 0.0015 0.0008 0.0027 0.0063 0.0173 0.9278 1986 to 1990 6500 0.0032 0.0026 0.0014 0.0007 0.0028 0.0077 0.0254 0.6667 1991 to 1995 5239 0.0047 0.0036 0.0017 0.0007 0.0036 0.0127 0.0439 0.8091 1996 to 2000 5789 0.0039 0.0027 0.0013 0.0006 0.0029 0.0089 0.0322 1.0333 2001 to 2005 6582 0.0088 0.0045 0.0019 0.0008 0.0044 0.0185 0.0736 8.7500 2006 to 2007 2850 0.0100 0.0048 0.0020 0.0008 0.0048 0.0198 0.0668 11.4000 Panel B Small Companies 1962 to 1965 756 0.0016 0.0015 0.0012 0.0007 0.0019 0.0040 0.0061 0.0111 1966 to 1970 1060 0.0017 0.0017 0.0013 0.0007 0.0021 0.0043 0.0071 0.0106 1971 to 1975 1156 0.0020 0.0020 0.0016 0.0010 0.0025 0.0047 0.0075 0.0135 1976 to 1980 2454 0.0046 0.0035 0.0023 0.0013 0.0039 0.0099 0.0319 0.6944 1981 to 1985 2795 0.0041 0.0030 0.0020 0.0010 0.0034 0.0078 0.0222 0.9278 1986 to 1990 4256 0.0044 0.0035 0.0020 0.0010 0.0038 0.0102 0.0415 0.6667 1991 to 1995 3430 0.0068 0.0050 0.0027 0.0015 0.0050 0.0176 0.0648 0.8091 1996 to 2000 3792 0.0056 0.0038 0.0021 0.0012 0.0040 0.0118 0.0485 1.0333 2001 to 2005 4311 0.0129 0.0065 0.0032 0.0017 0.0067 0.0263 0.1058 8.7500 2006 to 2007 1867 0.0148 0.0069 0.0035 0.0018 0.0073 0.0286 0.1037 11.4000
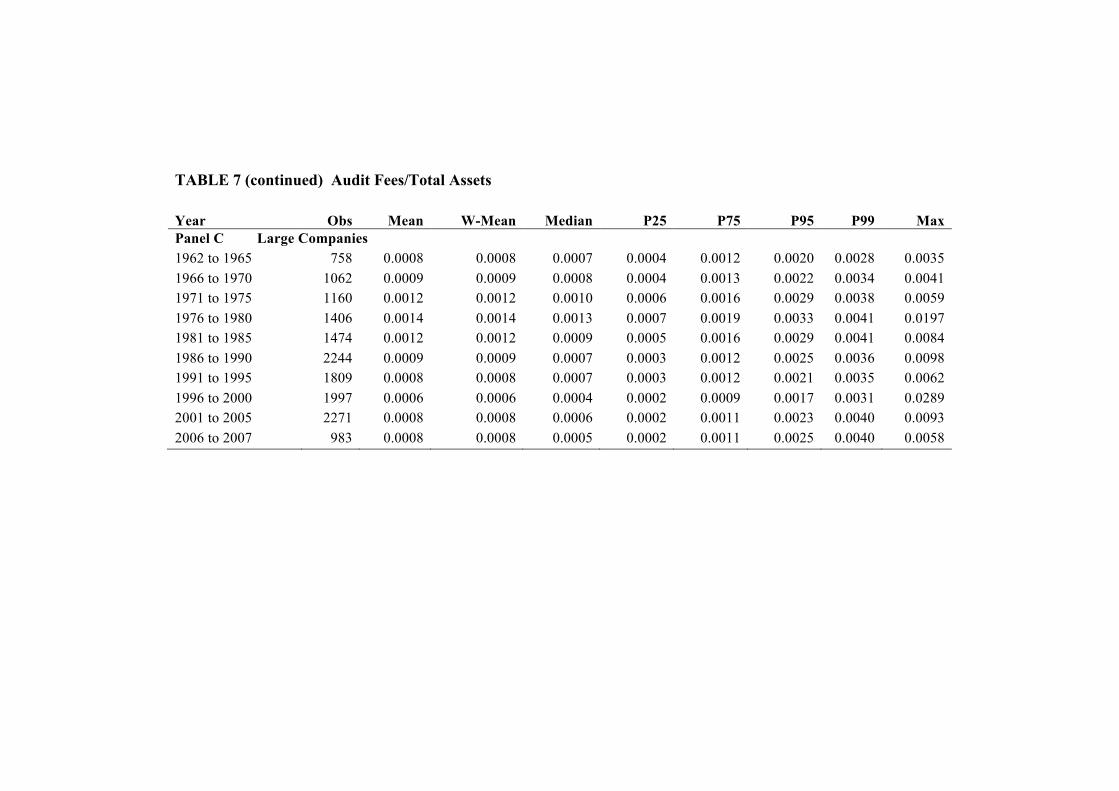
TABLE 7 (continued) Audit Fees/Total Assets
Year Obs Mean W-Mean Median P25 P75 P95 P99 Max Panel C Large Companies 1962 to 1965 758 0.0008 0.0008 0.0007 0.0004 0.0012 0.0020 0.0028 0.0035 1966 to 1970 1062 0.0009 0.0009 0.0008 0.0004 0.0013 0.0022 0.0034 0.0041 1971 to 1975 1160 0.0012 0.0012 0.0010 0.0006 0.0016 0.0029 0.0038 0.0059 1976 to 1980 1406 0.0014 0.0014 0.0013 0.0007 0.0019 0.0033 0.0041 0.0197 1981 to 1985 1474 0.0012 0.0012 0.0009 0.0005 0.0016 0.0029 0.0041 0.0084 1986 to 1990 2244 0.0009 0.0009 0.0007 0.0003 0.0012 0.0025 0.0036 0.0098 1991 to 1995 1809 0.0008 0.0008 0.0007 0.0003 0.0012 0.0021 0.0035 0.0062 1996 to 2000 1997 0.0006 0.0006 0.0004 0.0002 0.0009 0.0017 0.0031 0.0289 2001 to 2005 2271 0.0008 0.0008 0.0006 0.0002 0.0011 0.0023 0.0040 0.0093 2006 to 2007 983 0.0008 0.0008 0.0005 0.0002 0.0011 0.0025 0.0040 0.0058

TABLE 8 Industry Composition of Sample (in percentage)
Panel A Small Companies
1965 1970 1975 1980 1985 1986 1995 2000 2005 2007
Gold 1.32 1.42 1.21 10.00 20.90 24.26 25.55 23.05 22.81 27.50 Other Metals 1.59 1.79 1.47 11.14 12.54 8.59 9.84 10.25 11.00 8.27 Diversified Resources 0.00 0.00 0.00 0.00 0.14 0.02 0.06 0.24 0.14 0.00 Energy 4.23 4.53 4.07 8.57 10.29 5.98 6.83 7.45 8.00 10.42 Infrastructure/Utilities 0.53 0.47 0.43 0.24 0.43 0.45 0.67 0.77 1.02 0.43 Developers and Contractors 4.50 3.96 3.98 3.84 3.44 3.51 3.04 3.30 2.14 1.93 Building Materials 7.01 8.49 7.79 5.71 3.44 2.00 1.72 0.92 0.84 1.24 Alcohol & Tobacco 0.00 0.00 0.26 0.37 0.39 0.73 1.17 1.24 0.65 0.59 Food & Household 5.29 5.75 6.23 4.98 3.80 2.71 2.63 2.27 1.88 1.88 Chemicals 0.79 1.42 1.47 0.61 0.07 0.64 0.41 0.32 0.26 0.21 Engineering 9.39 7.83 9.78 7.14 5.27 3.67 3.45 2.88 1.65 1.45 Paper & Packaging 0.40 0.38 0.69 0.45 0.32 0.24 0.12 0.24 0.00 0.05 Retail 8.60 8.68 8.74 4.98 3.19 2.89 2.25 3.14 2.58 2.69 Transport 0.53 0.47 0.52 0.78 0.82 0.26 0.26 0.26 0.12 0.05 Media 6.08 6.32 5.80 5.27 4.12 1.86 2.34 2.98 2.98 2.26 Banks & Finance 0.53 0.47 0.69 0.69 0.32 0.28 0.26 0.32 0.42 0.16 Insurance 1.59 0.94 0.52 0.45 0.32 0.16 0.18 0.03 0.00 0.00 Telecommunications 0.00 0.00 0.00 0.00 0.18 1.15 2.01 2.72 3.77 3.33 Investment & Financial Services 16.40 17.17 15.31 11.35 10.25 15.69 12.76 10.83 10.05 9.24 Property Trusts 0.00 0.00 0.26 1.02 1.54 0.73 1.02 0.90 0.53 0.54 Healthcare 0.00 0.00 0.35 0.29 0.43 2.59 4.47 6.26 9.47 10.53 Miscellaneous Industrials 29.50 27.74 28.72 20.45 15.77 19.62 16.09 16.05 16.84 15.31 Diversified Industrials 1.19 1.32 0.87 1.10 1.25 1.01 0.85 0.71 0.33 0.16 Tourism & Leisure 0.53 0.85 0.87 0.57 0.75 0.96 2.04 2.88 2.53 1.77

TABLE 8 (continued) Industry Composition of Sample (in percentage)
Panel B Large Companies
1965 1970 1975 1980 1985 1986 1995 2000 2005 2007
Gold 0.00 0.00 0.00 0.93 2.73 10.51 9.21 7.30 5.08 7.76 Other Metals 2.00 1.62 2.00 5.38 6.14 5.99 6.10 4.93 4.42 5.51 Diversified Resources 0.53 0.48 0.43 1.08 1.71 1.07 1.11 1.01 0.84 0.92 Energy 2.53 2.09 2.43 4.59 8.94 7.15 6.32 4.73 5.34 6.63 Infrastructure/Utilities 0.00 0.00 0.00 0.07 0.34 0.40 0.67 1.76 2.43 2.76 Developers and Contractors 2.67 2.76 3.22 3.73 5.39 7.02 5.21 5.28 5.25 4.59 Building Materials 11.60 11.12 11.04 9.12 9.35 5.86 4.44 3.77 3.31 2.96 Alcohol & Tobacco 3.73 3.52 3.04 2.44 1.84 1.12 2.00 1.96 1.68 0.51 Food & Household 11.33 11.60 11.57 9.91 7.44 3.71 3.66 3.67 2.69 2.04 Chemicals 2.67 2.85 2.78 2.44 1.98 1.56 1.61 1.41 0.75 0.61 Engineering 11.33 12.36 10.52 9.62 8.60 4.78 3.00 1.76 1.85 1.53 Paper & Packaging 4.27 3.99 4.09 3.37 2.18 1.25 1.39 1.61 1.85 1.33 Retail 8.00 8.17 7.22 6.82 3.82 4.20 5.27 4.63 5.39 4.80 Transport 1.07 0.95 1.13 1.15 0.82 0.45 0.72 0.50 0.22 0.20 Media 2.53 2.47 2.43 3.02 3.28 3.49 4.49 3.93 4.19 3.57 Banks & Finance 3.87 4.47 4.96 5.67 4.85 2.82 4.22 4.08 3.53 3.57 Insurance 1.87 2.38 2.52 2.58 2.53 1.43 1.77 2.26 1.41 1.43 Telecommunications 0.00 0.00 0.00 0.00 0.00 0.40 1.28 2.52 3.13 2.45 Investment & Financial Services 6.13 5.70 7.57 6.60 6.83 12.20 10.87 9.06 11.08 13.27 Property Trusts 0.53 0.48 0.43 0.86 2.12 4.60 6.54 11.58 7.59 7.96 Healthcare 0.40 0.48 0.09 0.07 0.27 1.30 1.89 2.92 3.89 3.88 Miscellaneous Industrials 17.73 18.54 18.61 16.51 15.22 13.54 11.04 11.78 16.60 15.71 Diversified Industrials 4.13 3.42 3.48 3.73 3.34 3.22 3.94 3.57 3.84 3.16 Tourism & Leisure 1.07 0.57 0.43 0.29 0.27 1.92 3.27 3.98 3.58 2.86
This Table report the percentage industry composition, presented in five-yearly intervals, for the 32,730 company-year observations across the period from 1962 to 2007.

TABLE 9 Descriptive Statistics for Profitability and Leverage
The table reports the descriptive statistics, presented in five-yearly intervals, for the ratios Net Profit/Total Assets (Panel A) and Long Term Debt/Total Assets (Panel B) for the 32,730 company-year observations across the period from 1962 to 2007. Large (small) companies are those companies above (below) the 65th percentile of total assets in each year
Panel A Descriptive Statistics for Net Profit/Total Assets
Percent
Loss Year Obs Mean Median Std Min p25 p75 p99 Max Small Companies 1962 to 1965 756 0.05 0.05 0.04 -0.21 0.03 0.07 0.17 0.32 0.05 1966 to 1970 1060 0.05 0.05 0.05 -0.67 0.04 0.08 0.17 0.26 0.05 1971 to 1975 1156 0.05 0.05 0.06 -0.88 0.03 0.08 0.21 0.42 0.08 1976 to 1980 2311 -0.05 0.05 0.18 -63.71 0.00 0.09 0.45 77.34 0.25 1981 to 1985 1973 -0.08 0.02 0.20 -24.17 -0.07 0.07 0.37 8.53 0.40 1986 to 1990 783 -0.42 -0.09 0.77 -26.53 -0.37 0.02 0.33 4.53 0.68 1991 to 1995 2541 -0.15 -0.05 0.78 -26.25 -0.24 0.04 0.71 391.90 0.62 1996 to 2000 3497 -0.32 -0.05 0.62 -105.89 -0.25 0.04 0.44 48.86 0.61 2001 to 2005 4249 -0.64 -0.13 0.90 -822.43 -0.46 0.01 0.60 1847.73 0.73 2006 to 2007 1860 -0.35 -0.11 0.78 -36.62 -0.40 0.03 0.57 44.39 0.70 Large Companies 1962 to 1965 750 0.05 0.05 0.03 -0.27 0.03 0.07 0.12 0.18 0.02 1966 to 1970 1052 0.05 0.05 0.03 -0.20 0.03 0.06 0.12 0.41 0.02 1971 to 1975 1150 0.05 0.05 0.03 -0.11 0.03 0.06 0.14 0.19 0.03 1976 to 1980 1341 0.05 0.05 0.05 -0.92 0.03 0.07 0.19 0.52 0.05 1981 to 1985 1214 0.04 0.04 0.05 -0.48 0.02 0.07 0.16 0.36 0.10 1986 to 1990 502 0.03 0.05 0.14 -1.61 0.01 0.08 0.33 0.51 0.16 1991 to 1995 1454 0.03 0.04 0.12 -1.79 0.01 0.07 0.21 0.38 0.17 1996 to 2000 1904 0.03 0.04 0.18 -5.41 0.01 0.07 0.24 0.83 0.15 2001 to 2005 2197 0.03 0.04 0.17 -3.63 0.01 0.08 0.30 0.84 0.18 2006 to 2007 980 0.05 0.05 0.14 -2.41 0.01 0.09 0.38 1.22 0.17

TABLE 9 (continued) Descriptive Statistics for Profitability and Leverage
Panel B Descriptive Statistics for Leverage (Long-Term Debt/Total Assets)
Year Obs Mean Median Minimum p25 p75 p95 p99 Max Small Companies 1962 to 1965 756 0.0727 0.0344 0.0000 0.0000 0.1156 0.2685 0.3869 0.4460 1966 to 1970 1060 0.0786 0.0409 0.0000 0.0000 0.1198 0.2868 0.4850 0.7860 1971 to 1975 1156 0.0888 0.0494 0.0000 0.0000 0.1260 0.3183 0.6040 0.8250 1976 to 1980 2311 0.0883 0.0323 0.0000 0.0000 0.1271 0.3669 0.6296 1.5890 1981 to 1985 1973 0.0738 0.0112 0.0000 0.0000 0.1047 0.3273 0.5618 1.4800 1986 to 1990 783 0.0926 0.0092 0.0000 0.0000 0.1091 0.3990 0.8577 1.9850 1991 to 1995 2541 0.2420 0.0119 0.0000 0.0000 0.1338 0.4823 2.6894 115.6860 1996 to 2000 3497 0.1337 0.0163 0.0000 0.0000 0.1345 0.4489 0.9921 23.3800 2001 to 2005 4249 0.2876 0.0072 0.0000 0.0000 0.0807 0.4168 1.1357 667.3940 2006 to 2007 1860 0.0984 0.0077 -0.0056 0.0000 0.0860 0.4070 0.9233 15.5450 Large Companies 1962 to 1965 750 0.1236 0.0896 0.0000 0.0119 0.1784 0.4374 0.5845 0.6820 1966 to 1970 1052 0.1289 0.1002 0.0000 0.0217 0.1802 0.4502 0.5905 0.6910 1971 to 1975 1150 0.1507 0.1270 0.0000 0.0526 0.2086 0.4220 0.6071 0.7930 1976 to 1980 1341 0.1623 0.1350 0.0000 0.0658 0.2116 0.4323 0.6834 1.1400 1981 to 1985 1214 0.1737 0.1461 0.0000 0.0591 0.2438 0.4617 0.6899 0.8840 1986 to 1990 502 0.1900 0.1434 0.0000 0.0273 0.3100 0.5454 0.8134 0.9030 1991 to 1995 1454 0.2049 0.1676 0.0000 0.0467 0.2962 0.5776 0.9196 1.6460 1996 to 2000 1904 0.2279 0.2044 0.0000 0.0896 0.3278 0.5120 0.7741 7.4280 2001 to 2005 2197 0.2187 0.1938 0.0000 0.0687 0.3293 0.5201 0.8150 1.3990 2006 to 2007 980 0.2556 0.2225 0.0000 0.0806 0.3604 0.6899 0.9734 1.6740

TABLE 10 Audit Price Regressions
The table reports the results from the estimation of the following audit price regression Log (AuditFeesit) =ά + βBIGNit + βSizeit + βProfitit +βLeverageit +βARINVit +βDummlossit. Where all variables are for company i in year t. BIGN is a dummy variable that takes the value of 1 if the auditor of the company is a BIGN auditor and zero otherwise. Size is the log of total assets of company. Profit is Net Profit scaled by total assets. Leverage is long-term debt scaled by total assets. ARINV is the sum of inventory and accounts receivable scaled by total assets. Dummloss is a dummy variable that takes the value of 1 if the company reports a loss and zero otherwise. The regression is estimated across the panel of company/years at the five-yearly interval in the column headers. Large (small) companies are those companies above (below) the 65th percentile of total assets in each year. Standard errors are in parenthesis. Panel A Small Companies
1962 to 1965
1966 to 1970
1971to 1975
1976 to 1980
1981 to 1985
1986 to 1990
1991 to 1995
1996 to 2000
2001 to 2005
2006 to 2007
Intercept -3.6169*** -3.7853*** -5.0012*** 3.9624** 3.3569* 5.8869** 4.9048*** 5.6308*** 6.1479*** 5.8283*** (0.7375) (0.4269) (0.5324) (0.5618) (0.5172) (0.9599) (0.2881) (0.2774) (0.2464) (0.4617) BIGN 0.0083 -0.0368 0.0053 0.0498 0.0691 0.3318*** 0.1092*** 0.1856*** 0.3077*** 0.3637*** (0.0419) (0.0460) (0.0514) (0.0372) (0.0446) (0.0985) (0.0408) (0.0372) (0.0341) (0.0733) Size 0.7438*** 0.7833*** 0.8981*** 0.3753*** 0.4019*** 0.2583*** 0.3177*** 0.2894*** 0.2589*** 0.2890*** (0.0484) (0.0269) (0.0331) (0.0158) (0.0216) (0.0567) (0.0143) (0.0143) (0.0109) (0.0262) Profit 0.7916** -0.3269 0.1107 -0.1812** -0.4560*** -0.0596 -0.1250*** -0.1771*** -0.1367*** -0.1167***
(0.3837) (0.2950) (0.2498) (0.0812) (0.0770) (0.0398) (0.0151) (0.0167) (0.0110) (0.0252)
Leverage -0.1338 -0.3008 -0.2683 0.0418 0.2582* 0.0695 0.0357 0.1471** 0.1848** 0.0749 (0.2305) (0.1930) (0.2160) (0.1260) (0.1344) (0.2203) (0.0753) (0.0712) (0.0636) (0.1307) ARINV 1.0291*** 0.2298* 0.8417*** 0.5500*** 0.5602*** 0.0501 0.3230*** 0.2278*** 0.4059*** -0.0683 (0.1709) (0.1237) (0.1391) (0.1013) (0.1047) (0.1943) (0.0705) (0.0725) (0.0645) (0.1543) Dummloss 0.0708 0.0468 0.1539** 0.0027 0.0240 -0.0199 0.0124 -0.0299 -0.0844*** -0.0352 (0.0624) (0.0567) (0.0607) (0.0351) (0.0315) (0.0714) (0.0265) (0.0238) (0.0235) (0.0459)
R-Squared 0.9579 0.9585 0.9402 0.9515 0.9292 0.9325 0.8819 0.8693 0.8501 0.9332 Observations 756 1060 1156 2311 1973 783 2541 3497 4249 1860 Firm FE Yes Yes Yes Yes Yes Yes Yes Yes Yes Yes Industry FE Yes Yes Yes Yes Yes Yes Yes Yes Yes Yes
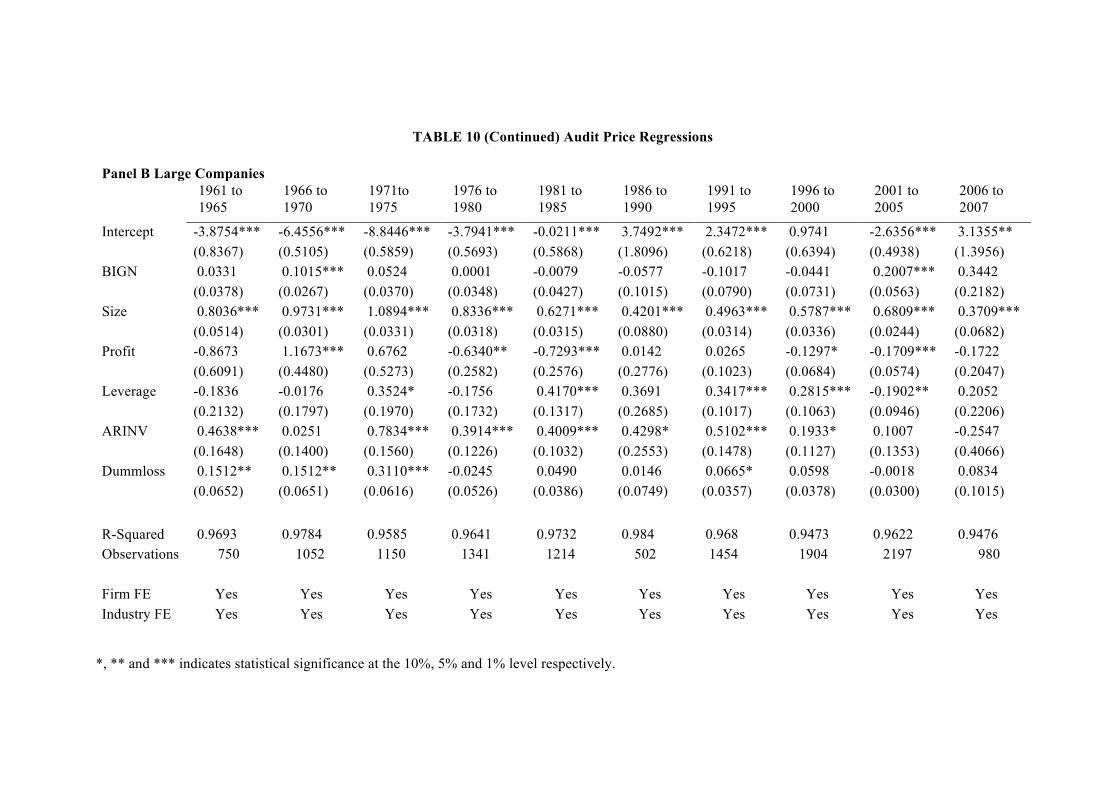
TABLE 10 (Continued) Audit Price Regressions
Panel B Large Companies
1961 to 1965
1966 to 1970
1971to 1975
1976 to 1980
1981 to 1985
1986 to 1990
1991 to 1995
1996 to 2000
2001 to 2005
2006 to 2007
Intercept -3.8754*** -6.4556*** -8.8446*** -3.7941*** -0.0211*** 3.7492*** 2.3472*** 0.9741 -2.6356*** 3.1355** (0.8367) (0.5105) (0.5859) (0.5693) (0.5868) (1.8096) (0.6218) (0.6394) (0.4938) (1.3956) BIGN 0.0331 0.1015*** 0.0524 0.0001 -0.0079 -0.0577 -0.1017 -0.0441 0.2007*** 0.3442 (0.0378) (0.0267) (0.0370) (0.0348) (0.0427) (0.1015) (0.0790) (0.0731) (0.0563) (0.2182) Size 0.8036*** 0.9731*** 1.0894*** 0.8336*** 0.6271*** 0.4201*** 0.4963*** 0.5787*** 0.6809*** 0.3709*** (0.0514) (0.0301) (0.0331) (0.0318) (0.0315) (0.0880) (0.0314) (0.0336) (0.0244) (0.0682) Profit -0.8673 1.1673*** 0.6762 -0.6340** -0.7293*** 0.0142 0.0265 -0.1297* -0.1709*** -0.1722
(0.6091) (0.4480) (0.5273) (0.2582) (0.2576) (0.2776) (0.1023) (0.0684) (0.0574) (0.2047)
Leverage -0.1836 -0.0176 0.3524* -0.1756 0.4170*** 0.3691 0.3417*** 0.2815*** -0.1902** 0.2052 (0.2132) (0.1797) (0.1970) (0.1732) (0.1317) (0.2685) (0.1017) (0.1063) (0.0946) (0.2206) ARINV 0.4638*** 0.0251 0.7834*** 0.3914*** 0.4009*** 0.4298* 0.5102*** 0.1933* 0.1007 -0.2547 (0.1648) (0.1400) (0.1560) (0.1226) (0.1032) (0.2553) (0.1478) (0.1127) (0.1353) (0.4066) Dummloss 0.1512** 0.1512** 0.3110*** -0.0245 0.0490 0.0146 0.0665* 0.0598 -0.0018 0.0834 (0.0652) (0.0651) (0.0616) (0.0526) (0.0386) (0.0749) (0.0357) (0.0378) (0.0300) (0.1015)
R-Squared 0.9693 0.9784 0.9585 0.9641 0.9732 0.984 0.968 0.9473 0.9622 0.9476 Observations 750 1052 1150 1341 1214 502 1454 1904 2197 980
Firm FE Yes Yes Yes Yes Yes Yes Yes Yes Yes Yes Industry FE Yes Yes Yes Yes Yes Yes Yes Yes Yes Yes
*, ** and *** indicates statistical significance at the 10%, 5% and 1% level respectively.