the evidence-based story of savings groups:
TRANSCRIPT

September 2013
SEEP
Res
earc
hThe Evidence-Based Story of Savings Groups: A Synthesis of Seven Randomized Control Trials Authors: Megan Gash and Kathleen Odell A publication of the Savings-led Financial Services Working Group at SEEP

Copyright © 2013 The SEEP Network
Sections of this publication may be copied or adapted to meet local needs without the permission of The SEEP Network, provided that the parts copied are distributed for free or at cost—not for profit. Please credit The SEEP Network and “The Evidence-Based Story of Savings Groups: A Synthesis of Seven Randomized Control Trials” for those sections excerpted.
The publication of this document is made possible by the generous support of The Bill and Melinda Gates Foundation. The contents are the responsibility of The SEEP Network and do not necessarily reflect the views of The Bill and Melinda Gates Foundation. For any commercial reproduction, please obtain permission from:
The SEEP Network 1611 N. Kent St., Suite 610Arlington, Virginia 22209 USA(tel): 1 202-534-1400 (fax): 1 703-276-1433Email: [email protected]
Printed in the United States of America
To access this publication online, visit www.seepnetwork.org.

The Evidence-Based Story of Savings Groups: A Synthesis of Seven Randomized Control Trials
Authors: Megan Gash & Kathleen Odell
The SEEP Network1611 N. Kent St., Suite 610, Arlington, VA 22209Tel.: 1 202-534-1400 Fax: 1 703-276-1433
OCTOBER 2013
2
ABOUT SEEP
SEEP Network, founded in 1985, is a global network of practitioner organizations dedicated to combating poverty through promoting inclusive markets and financial systems. SEEP represents the largest and most diverse network of its kind, comprised of international development organizations and global, regional, and country-level microfinance and livelihoods development networks. Members are active in 170 countries and support nearly 100 million entrepreneurs and their families. Through a shared commitment to reduce global poverty, SEEP members work together and with other stakeholders to increase knowledge and foster innovation, creating opportunities for meaningful collaboration and, above all, for scaling impact.
About the Savings-led Financial Service Working Group (SLWG)
The Savings-led Financial Services Working Group (SLWG) brings together practitioners that support the development and expansion of Savings Groups as a mechanism to promote financial inclusion and other development objectives. Known by many different names—for example, VSLAs (Village Savings and Loan Associations) and SILCs (Savings and Internal Lending Communities)—Savings Groups are growing in number and in popularity within SEEP’s membership and beyond. Established in 2007, SEEP’s Savings-led Financial Services Working Group was at the forefront of this new movement and helped set the stage for broad-based industry coordination and the establishment of common definitions and methodological improvements. During this time, more than 160 individuals from 70 organizations1 have contributed to the working group in developing shared learning products and knowledge mobilization through virtual and in-person practitioner-led events and conferences.
OVERVIEW
1 These include active members, as well as those who are signed up to receive working group information but may not participate in all working group activities.
3
Megan Gash is a Research and Evaluation Specialist at Freedom from Hunger. She works closely with partner organizations to design, implement, and analyze research activities that measure the efficacy of Freedom from Hunger’s global programs, with a special focus on poverty assessment and food security. Much of her recent work involves understanding industry research on the impacts of member participation in Savings Groups, especially on adults and youth in West Africa.
Kathleen Odell teaches economics at Dominican University’s Brennan School of Business and co-directs the Brennan School’s Center for Global Peace through Commerce, which studies the role of business and commerce in promoting peace, economic development, and human rights. Her recent research has focused on program evaluation and information dissemination in economic development, specifically on evaluation of financial access programs.
ABOuT ThE AuThORs

4
A global learning community is coalescing around Savings Groups, motivated by their promise to create access to community-based financial services and so much more. Energized by two conferences, virtual discussions, professional trainings, and many reports, studies, and publications, this community has touched in some way most of those involved in supporting Savings Groups, from field workers to donors, encouraging all to raise critical questions, share innovations, and solve problems. This paper, “The Evidence-Based Story of Savings Groups: A Synthesis of Seven Randomized Control Trials,” continues that tradition, marking a unique moment in the evolution of Savings Groups when the results of seven experimental evaluation studies, conducted at more or less the same time, have become available for our collective learning.
For the opportunity to build such a community, we are thankful to the Bill and Melinda Gates Foundation (BMGF), which recognized the potential impact of Savings Groups and made a significant investment early on to spur their growth.
We further acknowledge the professional efforts of the research teams from Innovations for Poverty Action, Woller Associates, DanChurchAid, and the International Rescue Committee, who undertook these major efforts, following standards that are widely recognized for their rigor.
This synthesis of these studies is the result of a shared vision held by the BMGF team that supported the investments in Savings Groups projects and the members of the SEEP Network’s Savings-led Financial Services Working Group (SLWG). In late 2011, as the organizations involved with the studies began sharing preliminary findings, stimulating eager anticipation of the final results, both the working group members and the BMGF team embraced the idea of synthesizing results from multiple studies. The team at BMGF encouraged us to also incorporate reactions from a wider group of SG practitioners, to learn how these findings would inform their programs going forward. This paper strives to meet this goal, and we are grateful to Salah Goss at BMGF for recognizing the added value that the SG community of practitioners can bring to rigorous research. She has been both a champion of and an intellectual partner in this effort from its inception.
We acknowledge the commitment of time and thought that this input requires. For sharing their views and experience with the individual studies, we thank Sybil Chidiac (CARE USA); Sophie Romana, Clelia Anna Mannino, Janina Matuszeski, and Eloisa Devietti (Oxfam America); Ole Dahl Rasmussen (DanChurchAid); Helene Bie Lilleør (Rockwool Foundation); Mike Ferguson, Tom Shaw, and marc bavois (Catholic Relief Services); Eugenia Gusev, Juliette Seban, and Eduardo Garcia Rolland (International Rescue Committee); Laura Fleischer Proaño (Freedom from Hunger); and Hugh Allen (VSL Associates).
A second group of practitioners whose Savings Groups programs were not the subject of study provided critical input to the paper. They read an early draft and responded to specific questions about the research results. We appreciate the contributions of Mark Staehle (Aga Khan Foundation); Christine Baingana (Hope International); Courtney O’Connell (World Relief); Michaela Kelly (Plan International); and Pieter Vandermeer and Alfred Hamadziripi (World Vision). As we have had the pleasure of saying in the past, it is our privilege to coordinate the efforts of the committed group of professionals who participate in the SLWG.
Finally, we extend our heartfelt thanks to the paper’s authors, Megan Gash and Kathleen Odell. They were steadfast, meticulous, thoughtful, and responsive. They listened well. They accepted comments from many and revised many times. That this synthesis is so accessible and easy to digest is due to their expertise as researchers and the strength and clarity of their pens.
Candace Nelson, Co-coordinator, SLWGNisha Singh, The SEEP Network
ACKNOWLEDGMENTs

5
List of Acronyms 6Executive summary 7
Key Findings 8
Putting the Research to Work 10
section 1: Introduction 11Objectives 12
Methodology 12
section 2: Why RCTs? 13
section 3: Key Questions 17
section 4: Existing Evidence 19
section 5: The Wave of Experimental Research 21
section 6: RCT and Other New Research Findings 27
section 7: Reconciling New Findings with Prior Research 48
section 8: Putting the Research to Work 52
section 9: Conclusion 54
References 55
TABLEs AND FIGuREs
Table 1: RCT study Details 21
Table 2: Program Take-up Rates (Rounded) 28
Table 3: Poverty Outreach Estimates Below $1.25 a day (PPP) 29
Table 4: household Economic Impacts 38
Table 5: Business Impacts 40
Table 6: health and Educational Impacts 41
Table 7: social Impacts (social Capital and Women’s Empowerment) 43
Figure 1: updated Generalized Theory ofChange for savings Groups 51
TABLE OF CONTENTs

6
BARA Bureau of Applied Research in Anthropology
BMGF Bill and Melinda Gates Foundation
CARE Cooperative for Assistance and Relief Everywhere
CRS Catholic Relief Services
DCA Dan Church Aid
FA Field Agent
FFH Freedom from Hunger
HFC Healing Families and Communities
IPA Innovations for Poverty Action
IRC International Rescue Committee
ITT Intention-to-treat
MIS Management Information System
NGO Non-governmental organization
OA Oxfam America
PAT Poverty Assessment Tool
PSP Private Service Provider
RCT Randomized Control Trial
SAVIX Savings Groups Information Exchange
SEEP Network Small Enterprise Education and Promotion Network
SfC Saving for Change
SG Savings Group
SILCs Savings and Internal Lending Communities
SLWG Savings Led Financial Services Working Group
TOC Theory of Change
TOT Treatment on the Treated
USAID United States Agency for International Development
VSL Village Savings & Loans
VSLAs Village Savings and Loan Associations
LIsT OF ACRONyMs

7
The Evidence-Based Story of Savings Groups: A Synthesis of Seven Randomized Control Trials
Executive SummarySince the mid-1990s, a number of international development organizations have promoted Savings Groups (SGs), in which groups of 15 to 30 people, usually women, meet on a regular basis to save what money they can in a common fund. This common fund is then used to support loans to group members as needed, with the interest on the loans providing a return (dividend) on the savings investment. At the end of a set cycle (usually nine to twelve months), the savings, with accumulated interest and fees, are “shared out” among the group members and a new cycle is initiated. SGs are relatively easy to establish and require very little infrastructure; usually, a knowledgeable facilitator and a strong, heavy lock box are all that are required to get started. Group members who have learned the methodology can teach it to others, starting new groups within and outside of their own communities. For these reasons, Savings Groups are seen as a powerful strategy to create savings and borrowing capacity, even for the very poor and for those living far from bank branches.
Rapid growth of SGs globally raises a number of questions about how well these groups are serving their members and acting as an effective development intervention overall. Many SG programs have been studied extensively from various perspectives since the 1990s, using a variety of research methodologies. In 2008 and 2009, funders such as the Bill and Melinda Gates Foundation, the United States Agency for International Development (USAID), and the Rockwool Foundation (Denmark) pushed forward renewed learning agendas by financing several large-scale randomized controlled trials (RCTs), a method not widely used with SGs before. Because the RCT methodology provides insight into causality, interest in these results is active and widespread.
This paper surveys the results from seven recent, prominent RCT evaluations of SGs in seven countries. It consolidates the findings in a single document that reflects upon the commonalities and differences across the results and places them within the broader body of evidence about the role of SGs in the lives of their members. The paper presents ways in which the SG community is using the body of evaluation research to inform and improve its programs. Information about the implementation and results of the RCTs has been collected through publicly available results, results not yet publicly available, and a series of interviews with researchers and programming specialists in the field. The goal of this synthesis paper is to consolidate knowledge about general outcomes of SG participation; the paper should not be interpreted as a comparison of programs across facilitating agencies.
The seven RCTs included in this paper studied the following programs: (1) CARE USA’s Save Up Village Savings and Loan Association (VSLA) program in Malawi; (2) CARE USA’s Save Up VSLA program in Uganda; (3) CARE Ghana’s ESCAPE VSLA program; (4) DanChurchAid’s (DCA) VSLA program in Malawi; (5) Oxfam America, Freedom from Hunger, and the Strømme Foundation’s (OA/FFH) Saving for Change (SfC) program in Mali; (6) Catholic Relief Services’ (CRS) Private Service Provider (PSP) program within its Savings and Internal Lending Communities (SILC) programs in Kenya, Tanzania, and Uganda; and (7) the International Rescue Committee’s (IRC) New Generation VSLA program in Burundi. Each study looked at household impact, although there are important differences across the studies in terms of specific measurements. The CARE, OA/FFH, and DCA studies looked at general household impact. The CRS studies compared its fee-for-service PSP delivery channel model against the traditional field agent (FA) delivery channel model. The IRC study compared IRC’s standard VSLA groups with VSLA groups that participated in a family-based discussion series. The OA/FFH study included an examination of their malaria education program and their structured (trained) replication strategy.
Valuable details to keep in mind when reviewing results concern both methodological and program implementation issues. With the exception of the IRC study, which reports directly on outcomes for SG participants, the studies
8
discussed in this paper measure and report on the estimated impacts of SGs on average residents in the villages where they are established, not the impacts of group participation on members themselves. Section 2 on research methods explains the significance of this difference, as well as presenting a discussion of the RCT methodology in general. Timing issues are important. Many practitioners assume the impacts of SGs will appear only after at least one full cycle and share-out has been completed; however, in the CARE, OA/FFH, and DCA studies, only relatively small proportions of participants completed a full savings cycle. Data are pulled from surveys taken at the individual, household, and community levels, with most outcomes presented at the household level. Approximately 75– 80 percent of the SG members in the studied programs are women. Individual outcomes are sometimes reported as impacts on women, but often gender is not specified.
Key Findings
1. Who joins Savings Groups? SG members tend to be relatively wealthier and more socially and financially active than non-members, although overall the programs reach the very poor. Marginalized (or less socially integrated) women join later. Take-up rates of five programs ranged from 22–40 percent over 2–2.5 years, which is lower than practitioners’ previous estimates.
2. Do Savings Groups reach the very poor in various contexts? The evidence from the RCTs confirms that SGs are reaching the very poor, and that the proportion of participants who are very poor can vary per geographic area (very poor is defined as living below the US$ 1.25 PPP/day2). Outreach estimates range from 34–81 percent of SG participants below the $1.25 poverty line across the studies. The CRS study shows that FAs and PSPs reach similar levels of the very poor, demonstrating that the very poor can pay for SG services. Furthermore, two of the seven studies capture changes in poverty levels. The OA/FFH study finds a suggestive, small decrease in those living below the national poverty line in treatment villages, and the IRC study finds a remarkable net impact of a 14 percentage point reduction in poverty rates.
3. What are the household economic impacts? The availability of SGs clearly increases savings and the use of credit in treatment areas, but findings on asset ownership are mixed, with a somewhat small increase in small animal ownership in the CARE Malawi program and a relatively larger difference in livestock holdings in the OA/FFH program in Mali. Although the studies show an increase in savings wherever measured, these same studies find no measurable negative impact on household expenditures or consumption, suggesting that the increased saving does not occur at the expense of consumption spending or reductions in expenditures. There is some evidence that SG availability or participation increases expenditures, but this evidence is not consistent across all seven studies. Because income is not consistently included as an outcome in the RCTs, it is not considered as a key household impact. Only the CRS study included income as a measure; that study found no significant differences in income between PSP-supported and FA-supported households.
4. What are the business impacts? The collective evidence from the RCTs is mixed. Although selected studies show evidence of increased business-related spending, profits, and the likelihood that a woman owns a business, these outcomes are not observed in all of the RCTs. Previous studies consistently showed increased business-related spending as well as increases in the number of businesses owned and existing businesses expanded. This slight disagreement between the RCTs and the pre-existing evidence can plausibly be explained by the limited time horizons of the RCTs, as many of the business outcomes are expected to take some time to appear. It is reasonable to expect that increases in business-related spending in the short-term study period may lead to increases in profits over a longer period, as supported by an observed increase in business profits in the CARE Uganda program. In addition, the OA/FFH study took place in Mali during a period of intense political instability, which may have shifted group participants’ priorities from business expansion to food security and other basic needs.
2 Note that for the remainder of the paper, “$” will denote United States Dollar.

9
5. What are the health and educational impacts? The mixed and limited impacts on health and education spending and enrollment in the RCTs are similar to mixed and limited evidence from earlier studies. Positive effects include suggestive increases in primary enrollment in Ghana and mixed increases in education spending (or use of SG funds for education) in Ghana, Mali, and Burundi. These findings are surprising. Conversations with researchers and practitioners suggest that members may be using SG money instead of money from other sources to fund education and health care costs, as opposed to increasing overall amounts spent, and payments may be more timely due to the more predictable access to funds. Positive impacts are observed in food security in several different locations across a variety of measures. The OA/FFH study showed the greatest increase with treatment households, with 10 percent less likely to be chronically food insecure and experiencing a smaller decline in food consumption during the lean season. Overall, a reasonable body of evidence suggests that SG participation supports food security.
6. What are the social impacts? Here, the RCT results differ notably from the earlier research, which presents an abundance of evidence in the areas of social capital and women’s empowerment The CARE and OA/FFH RCTs looked extensively at both community engagement and individual empowerment, and found very little impact. In discussing these outcomes, some researchers and practitioners suggest that the RCTs did not address social impacts adequately and that questions in future studies should be re-framed using more social-psychological terms rather than economic terms. Since this finding proved to be one of the most surprising and puzzling of the RCTs’ outcomes, it is suggested as an area of further study.
7. Are Savings Groups members more resilient in the face of shocks? Earlier studies suggested that group participation contributed to consumption smoothing over time, with members indicating that they greatly appreciated the availability of credit, especially emergency loans, during times of crisis. Findings from the RCTs suggest some impact on resilience; increased food security among treatment households suggests that shocks may have less catastrophic results for group members. There is evidence that treatment households are more likely to take SG loans to mitigate shocks.
8. Is the CRS fee-for-service model viable? The CRS experiment with its PSP program showed that its fee-for-service model is both viable and successful. PSP-supported groups outperform FA-supported groups on key financial measures and member growth rates, although individual PSP productivity and earnings vary greatly. Country-level average earnings ranged from $17–$103 per month, with some PSPs earning no money. PSP-supported households appear more entrepreneurial, and FA-supported households more risk averse, although, as mentioned earlier, the poverty rates of members in both PSP and FA groups are similar.
9. What are the relative merits of the structured and organic replication strategies of the OA/FFH model? Although prior research showed that groups can easily and quickly replicate, before the RCTs no publicly available study comparing the cost or impact of various models existed. The OA/FFH study outcomes show that a simple, three-day training program with a pictorial guide and certificate (structured replication) can be cost-effective and have a greater impact than organic replication.
10. How effective are additional services delivered through SGs? Prior evidence suggested that SGs can be an effective platform for supporting other development services, and that programs can be effectively designed to be delivered to SG members via the groups. Evidence from the education and dialogue series of the OA/FFH and IRC studies further supports this claim with several positive outcomes for knowledge and behavior indicators. Overall, however, the impact of these services likely depends largely on the quality of their content and delivery.
Overall, the RCT results are quite consistent with the results of earlier research, particularly in regard to the impact questions. The main divergence is in the area of social capital and women’s empowerment. Strong positive effects were expected but not observed in the RCTs. There are several important considerations around these results, and it seems quite plausible that these social impacts exist but were not captured by the RCTs. Setting this difference in social impacts aside, the consistency of the earlier and new research suggests that despite the limitations faced by the various study designs, the body of evidence on SGs tells a fairly consistent story.

10
Putting the Research to Work
The combined results of the RCTs and other research provide a number of concrete findings that will be of use to the entire SG community going forward. The studies found several positive impacts, as well as a number of opportunities for improvement and refinement of SG programming. Most notably, the collected findings of limited or no evidence of impacts on business, social, health, and education outcomes surprised the practitioner community, given their field experiences. Many who participated in this paper suggested that these findings present a challenge to practitioners to consider adding services to SGs as a means of increasing measurable impact in these areas.
Along with the practice-oriented outcomes, this synthesis offers a number of important lessons about SG evaluation. Numerous practitioners commented that while RCTs can demonstrate impact, the studies surveyed in this paper did not shed light on why certain impacts occur. For this reason, one recommendation included planning for qualitative research to follow any quantitative study. Timing issues must be considered as evaluations are designed. In many cases, the impacts of SGs are expected to appear after at least one full cycle (through a share-out) has been completed, and there is some evidence that the strongest effects occur well into the second cycle. This group of RCTs, however, evaluated impacts where the many groups had not completed even one full cycle, and control groups still showed substantial contamination. Finally, there was a broad consensus about the importance of sharing evaluation results across both research and program implementation organizations.
Practitioners shared a number of program-specific responses to the RCT research, including the following: (1) CRS has proceeded with the global roll-out of the PSP program, although the high variability in PSP performance has led CRS to rethink recruitment, targets, and remuneration for agents; (2) CARE is introducing a gender-based SG manual that incorporates key programming principles and techniques to purposefully foster gender empowerment; (3) OA and FFH will include the structured replication component in future programming, and both organizations will use the results of their study to adjust their theory of change (TOC) for SGs; (4) Freedom from Hunger is rethinking the malaria education program and considering an approach that is broader and more integrated in scope; and (5) IRC has made several adjustments to the curriculum of the family-based discussion program to improve caregiver-child interaction and encourage parent support groups. All facilitating agencies that engaged in an RCT are continuing their SG programs and trying to expand them.
This synthesis of recent research on SGs presents clear evidence that there are positive impacts for SG participants. Positive impacts are revealed in various lengths of participation, in various countries, and for various program components. The RCT studies satisfy a desire for evidence on the effects of SG programs on a number of important outcomes, and they contribute significant additional information to the body of evidence on SGs. All of the practitioners involved in the studies are continuing and expanding SG services, but now in smarter ways and with more accurate expectations for impact. As practitioners put these findings to good use, this synthesis will hopefully assist stakeholders in the wider development community to understand the importance and value of SGs and ultimately support their growth.

11
Section 1: Introduction
There is widespread agreement that financial inclusion for the very poor is a critically important aspect of economic development. Access to reliable and affordable financial services is essential not only for growing businesses and improving living standards, but also for managing the unpredictability of daily life. Yet, an estimated 2.5 billion people across the world have no access to formal banking services.3 A variety of services have been developed to address this gap, including microloans, low-balance savings accounts, mobile-enabled payments and financial services, and various micro-insurance products. Since the mid-1990s, a number of international development organizations have promoted a savings strategy called Savings Groups (SGs). An SG may consist of 15 to 30 people, usually women, who meet on a regular basis to contribute to a common fund that is then used to support loans to group members as needed. The interest on the loans provides a return on the savings investment. At the end of a set cycle (usually nine to twelve months), the savings (with accumulated interest and fees) are “shared out” among group members and a new cycle begins.
SGs are relatively easy to establish and require very little infrastructure, with a knowledgeable facilitator and a strong, heavy lock box being all that are required to get started. In addition, group members who have learned the methodology can teach it to others, starting new groups within and outside of their own communities. For these reasons, SGs are seen as a powerful strategy to create savings and borrowing capacity, even for the very poor and for those living far from bank branches.
Today, there are approximately 7 million SG members in 300,000 groups across five continents.4 While SGs are most widely observed in Africa, there are also increasing numbers of groups in Asia and Latin America, and a handful of groups in North America and Europe. Their popularity has been recent; from 2009–2013 alone, the number of members has grown from 1.5 to 7 million.5 This tool has been taken up around the world as a savings and borrowing strategy for the poor, often providing financial services to populations with little access to formal institutions. As SG practice has evolved, the groups have been used as a platform to introduce additional development services, such as education or health, or to link to additional financial services, such as formal accounts or mobile money transfer.
The rapid growth in SGs raises a number of questions about how well these groups are serving their members and acting as an effective development intervention overall. In response to these questions, many SG programs have been studied extensively from various perspectives, including the profiles of group members, members’ saving and borrowing behaviors, the effectiveness of different group formation strategies, and whether and how group membership has affected members’ incomes, wealth, education, health, and so on. Research questions have focused on impact and outreach questions, as well as delivery method (operational) and effectiveness in delivering additional services. Since 2008, several evaluations have been conducted using a tool called the randomized controlled trial (RCT). Because the RCT methodology provides insight into causality (see Section 2), interest in these results is active and widespread. It seems appropriate at this point to consider the collective information provided in the relatively substantial body of evaluation research that is now available. To that end, this paper surveys the results from seven prominent RCT evaluations.
3 See Demirguc-Kunt and Klapper 2012 for a thorough discussion of World Bank measures of global financial inclusion.4 Hendricks 2013. Data from SAVIX and self-reported data collected by Hugh Allen.5 Ibid.
12
Objectives
This paper has two main objectives. First, it aims to consolidate the findings from seven recently completed RCT studies of SGs to give an overview of the findings in one concise document. Beyond simply presenting the findings of each study, the paper reflects upon the commonalities and differences across the RCT results, and places them within the broader body of evidence about the role of SGs in the lives of their members. Although a common criticism of the RCT methodology is that results lack generalizability, in the case of SGs the emergence of several studies of programs with similar characteristics across numerous African countries offers a unique opportunity to discern broader implications for the field.
A second objective of this paper is to study the ways in which the SG community is using the body of evaluation research, especially the results of the RCTs, to inform and improve its programs. This is especially relevant for organizations with programs evaluated with an RCT—CARE, DanChurchAid (DCA), Oxfam America/Freedom from Hunger (OA/FFH), Catholic Relief Services (CRS), and the International Rescue Committee (IRC)—but given the investment of time and money in these studies, the hope is that the results will be useful more broadly to any organization promoting SGs. The goal of this synthesis paper is to consolidate knowledge about general outcomes of SG participation; the paper should not be interpreted as a comparison of programs across facilitating agencies.
Methodology
Information about the implementation and results of the RCTs has been collected through three channels. First, several of the organizations that have conducted the studies have made their results publicly available through research briefs, final reports, or both. Second, in selected cases where the information was not publicly available, organizations have made their results available to the authors in order to be included in this paper. Third, the authors have conducted a series of interviews with researchers and programming specialists both at the organizations studied directly and at several organizations that work with SGs that were not studied directly. The primary aim of the interview process was to gather information about how this wave of research is feeding back into the SG community and supporting the development of effective programming.
Organization
Following this introductory section, Section 2 outlines the various research methodologies that have been used to study SGs, including an overview of the strengths and limitations of the different approaches. Section 3 discusses the ten key questions on which this paper focuses, and Section 4 provides additional information about the ways that international development organizations expect SGs to function, as well as briefly reviews the evidence on these key questions available prior to the publication of this paper. Sections 5 through 8 describe the RCTs and summarize their results in light of the key questions. These results are also considered within the broader context of SG research and practice in general. Section 9 concludes the paper.

13
Section 2: Why RCTs?
Anecdotal, qualitative, and non-randomized quantitative research conducted prior to 2012 provided some evidence that SG participation is welfare-enhancing, with both financial and social benefits to individual members and their families. Within the development community, however, confidence levels in the early research have varied widely. Those less confident have raised issues of bias as potentially overestimating effects and invalidating some conclusions, leaving in doubt the assumptions of impact—just how much have SGs contributed financially and socially? In recent years, funders, academics, practitioners, and other stakeholders have sought to address these concerns by undertaking rigorous research that can more reliably demonstrate a causal link between SGs and a variety of outcomes. In 2008 and 2009, funders such as the Bill and Melinda Gates Foundation, the United States Agency for International Development (USAID), and the Rockwool Foundation (Denmark) took action to push forward new learning agendas by financing several large-scale RCTs. These RCTs have made an invaluable contribution to the body of evidence on the impact of SGs. There are a number of important considerations regarding their implementation and the interpretation of their results.
The ability of a program evaluation to demonstrate causality between a program and its intended outcomes hinges on whether the evaluation reliably eliminates other factors that could contribute to the outcomes. For example, if researchers observe increased self-confidence in women after they have joined an SG, this does not necessarily mean that participation in the SG caused this increase in self-confidence. The increase may have been the result of another factor, such as attendance at a literacy program or involvement in a labor association in the village. Women who join SGs may have intrinsic qualities that lead to increased self-confidence—or there may be some other explanation.
Social Science Research Design Terminology
Treatment group: The group of individuals, households, or villages to which the program being studied is offered.
Control group or comparison group: The group of individuals, households, or villages that do not receive the program but are included in the study for comparison.
Experimental design: A study design that includes a randomly assigned control group that is statistically comparable to the treatment group.
Quasi-experimental design: A study design that includes a comparison group that was not randomly assigned. In the absence of random assignment, the researcher must make a convincing case that the comparison group is comparable to the treatment group in order to be confident that observed differences between groups are attributable to the program being studied.
Non-experimental design: A study design that does not have a control or comparison group. Examples include qualitative case studies, member profiles, field observations, and anecdotes.
To achieve any certainty about cause and effect, a study must attempt to estimate the “counterfactual”—what would have happened in the absence of the program—in order to understand the program effects. In any experimental or quasi-experimental program evaluation, the role of the control group is to provide this estimate. If the treatment and control groups are similar in all aspects except for participation in the program, it is reasonable to attribute differences between the groups to program participation. However, unless the control group is randomly selected, it is likely that there will be other systematic differences between the treatment and control groups (e.g., all treatment villages have

14
better geographic locations, early-stage SG participants tend to be more willing to take risks, etc.). Any systematic differences between groups make it impossible to know for sure what can be attributed to program participation and what can be attributed to other factors.6 Although strategies other than randomization can be used to estimate the counterfactual, RCTs are considered the most reliable and straightforward way to get this estimate, and their results reliably show causal relationships.
Because well-designed RCTs effectively demonstrate causality, they are generally considered to produce unbiased and accurate estimates of program effects. However, as with any assessment methodology in social science, they have shortcomings and limitations. In terms of SG evaluation, there are several important considerations about RCT-based evaluation regarding both methodology and implementation.
First, implementing random assignment can be quite complicated and costly to researchers, participating NGOs, and program recipients (as well as potential recipients). The costs are not only monetary. RCT implementation presents many challenges and difficulties in the field and requires a high level of commitment from the local NGO. There is also a significant time demand on participants who must complete at least two rounds of surveys. One practitioner described the process as “extractive” on participating communities.
Second, random assignment raises concerns about ethics and fairness, since the study design necessarily denies some potential participants the ability to benefit from a program in order to establish a control group. Implementers generally have plans to introduce the program to the control group after the study ends, but since studies often last two to three years, this can still cause concern.
A third related consideration has to do with timing. Implementing organizations know that while some of the expected impacts of SGs will occur within a short-to-intermediate time frame, many impacts are not expected until groups are well established and have had time to learn and build confidence in the model. However, it is generally not possible to run an RCT for longer than two or three years in a social science setting because maintaining the control group for that long becomes unfeasible. This is especially true of SGs, where a known characteristic is the groups’ tendency to replicate organically. This is seen as a positive characteristic of SGs from a practical standpoint, but spontaneous replication means that it is common for groups to spontaneously form in control areas, and this tendency increases with time. A good study design can embrace this contamination and allow the program to continue in the village, but implementers sometimes try to terminate the program in control areas, which can cause confusion and frustration for potential recipients. In any case, for ethical and practical reasons, control groups cannot be maintained indefinitely, which means that pure RCTs are not practical for evaluating long-term effects. In fact, in several of the studies surveyed in this paper, some participating groups had been established for less than one year and had not completed a full cycle of membership through share-out, meaning the impacts measured were very short term for some.
Fourth, random assignment can require NGOs to alter their programs and to work in areas where they might not in the absence of the RCT. A good study design ideally limits the geographic area of the study to the region where the implementing organization normally works. Still, the realities of evaluation implementation can mean starting a program in an unfamiliar village, using more or fewer facilitators than normal, or other study-driven program changes. If this occurs, the evaluation is no longer measuring the impact of the normal implementation of the program. However, many RCT designs try to limit or avoid these challenges.
Fifth, some RCTs may offer little information on the mechanisms behind the causal relationships that they uncover. Ideally, the results will make sense within the context of the program and the implementing organization’s understanding of how the program works. In some cases, however, the results are unexpected or counterintuitive.
6 A variety of systematic differences, or biases, can occur if not addressed in the research design. For more details on common biases in financial inclusion research, such as selection bias or non-random program placement bias, see other research design technical explanations. One such resource is Karlan and Goldberg 2007.

15
Without making an effort to capture additional information about factors that can explain results at some point during the data collection and interpretation process, the RCT methodology may offer no insight into what might be driving these unexpected results. There are several examples in Section 6 of results that surprised practitioners and were either not predicted by the theory of change (TOC) or not in line with other research. Secondary qualitative research might be able to answer some of the questions that these results raise.
Finally, there is often confusion about the interpretation of RCT results. With one exception, the studies discussed in this paper measure and report on the estimated impacts of SGs on average residents in the villages where they are established, not the impacts of group participation on members themselves. This is because, within villages, households are randomly chosen to be surveyed for the evaluation, and the randomly selected households may or may not have SG members living in them. Surveys in treatment villages may be completed by households whose members do not participate in SGs at all. Therefore, the results reflect the impact on villagers with access to SGs, not the impact on members of participation in an SG. In technical terms, this is called the intention-to-treat (ITT) effect, where what is measured is the effect of program availability as opposed to program participation. The effect of a program specifically on its participants is called the effect of treatment on the treated (ToT). The CARE, OA/FFH, CRS, and DCA studies all measure the ITT effect, while the IRC study measures ToT.
Further, ITT analysis answers the question “On average, how is the well-being of the entire village affected by the introduction of the SG program?” not “What was the impact of the program directly on the participant?” (BARA and IPA 2013). In some cases, the question of village-level impact may be the question an evaluation is seeking to answer—“How well did this program work as an anti-poverty strategy for the villages in this study?” On the other hand, in some cases an organization may be more interested in the question of impact on program participants. In situations where the rate of participation in the program is less than 100 percent in the village (which is the case in the six studies with ITT design that are included in this paper), the magnitude of estimates of impact on program participants is diluted by the ITT design. The BARA and IPA 2013 report on the OA/FFH study points out “the lower the take-up rate, the lower the average size of the impact at the village level since lower take-up means that the program impacts are more diluted” (pp. 47–48). For example, if 12 households are interviewed in a treatment village and take-up is 35 percent, then on average, only 4 of the 12 households are participants. Outcomes are not reported on only those four households; rather, they are reported on the four member households aggregated with the other eight non-member households. The report states that this is an unavoidable challenge with the ITT analysis approach (BARA and IPA 2013, p. 48). An evaluation with ITT design will accurately estimate the effect of the program on the average villager but will likely underestimate the effect of the program on households or individuals who participated in it.
Know What You’re Reading
Intention to Treat (ITT) effect: The effect on the average villager of having access to SGs. If 30 percent of households in a village have at least one SG member living in them, the ITT measures the average effect on anyone living in the village, based on how 30 percent of his or her neighbors are saving in groups.
Treatment on the Treated (ToT) effect: The effect that participation in an SG has on a group member. While the ToT effect can be mathematically derived from the ITT based on the participation rate in a village, the estimate will be inaccurate if there are spillover effects within the village.
Note: Six of the seven studies surveyed in this paper report ITT, not ToT effects.

16
Benefits of analyzing the data in the ITT framework are the ability to capture spillover effects within a village and to avoid certain biases. Spillover effects are the effects on members of the community who did not join the program but have been affected positively (or negatively) by the existence of the program.7 The ITT design and analysis also minimize or eliminate biases that may be present when looking at data on members alone.8 It is important to consider these parameters when reviewing the outcomes for the six studies in this synthesis with ITT design, since the magnitudes of the impacts are diluted and would likely be higher with greater program take-up at the village level.9 The IRC study, in contrast, directly measures the ToT effect by including only active SGs in the treatment group. There are obvious advantages to directly measuring the ToT effect—namely, a clear estimate of the effect of the program on participating households. However, this method has the disadvantage of being unable to detect any spillover effects that are realized by non-participating households and therefore does not measure the full impact of the program. Neither type of analysis is free from complications.
7 It can be argued that Savings Groups are a community-level intervention “in that the outreach is to the community as a whole, and provides services to all in the community,” supporting that the capture of spillover effects can be a helpful way to understand total impact (IPA 2012, p. 38).
8 For more information on these biases, such as self-selection and non-random program placement bias, see Karlan and Goldberg 2007.
9 There is a statistical strategy for estimating the ToT effect based on the assumption of no spillover effects. This calculation is performed, and its limitations discussed, in the CARE report (IPA 2012), pp. 38–39.

17
Section 3: Key Questions
Evaluation research can generally be separated into two categories: research that looks at the impact of programs on their participants (How do programs affect income, poverty levels, business activity, use of health care services, etc.?), and research that looks at programming questions (Who joins? How well does this or that implementation strategy work?). For this paper, ten key questions have been identified. These key questions have been chosen based on the design of the seven RCTs and represent a range of both impact and programming results.
Many of the research questions included in the studies described in this paper were derived from the expectation of certain impacts from individual participation in SGs. These expectations, based upon field observations and theoretical assumptions of program operations, have been formalized by various international non-governmental organizations (INGOs) through theories of change (TOCs), which lay out anticipated causal relationships between the SG intervention and expected outcomes or impacts. In general, the TOCs suggest that SG participation leads to impacts in the following areas: strengthened economic capacity (savings, credit, income, business-related spending), increased social capital (solidarity, collective activities), improved women’s empowerment (confidence and decision-making power), improved food security, and “other” targeted program effects, coming from explicit areas addressed with additional services.10 Although perhaps not explicit in some TOCs, increased resiliency through better consumption smoothing and risk management in general is expected.
1. Who joins Savings Groups? Understanding characteristics of SG members is a critical component to understanding program success. Are the people whom a program intends to reach actually joining? A related question is whether there are differences between people who join as soon as the program is introduced and people who join later, after they have had a chance to observe the groups working for the early adopters. As research provides more information about the characteristics of people most likely to join SGs at various stages, organizations can tailor their programs either to better serve the existing members or to be more attractive to those who are not currently joining.
2. Do Savings Groups reach the very poor in various contexts? Knowledge about poverty outreach of group members is particularly important, as one common claim about SGs is that they can provide financial services to the very poor. If they succeed in doing this, in what proportions do they reach the very poor? Do outcomes vary by geographic area?
3. What are the household economic impacts? How do SGs affect household income and asset ownership (a measure of wealth)? Do SGs increase savings and borrowing? TOCs presented by development organizations suggest that access to SGs should initially increase savings and borrowing, and should eventually lead to increases in asset ownership and income.
4. What are the business impacts? In theory, the ability to save up a substantial amount of money and/or access loans should increase business-related investment and encourage the establishment of new income-generating activities. Members often say they use loans and share-out money for their businesses, but is there evidence that this actually happens? If loans and share-outs are not used for business purposes, then how are they being used? If significant business investment does occur, at what point during participation is this more likely to happen?
5. What are the health and educational impacts? The prediction is that access to loans and saved funds should allow for additional spending on food, health care, and education. In cases of illness or injury, more money should be available to pay for care, and for households with children, additional resources should be available to pay for school fees and related expenses. In addition, business expansion, which is predicted to increase income over time, should also increase
10 For a greater analysis of TOCs from facilitating agencies, see Chapter 5, “Pathways to Change: The Impact of Group Participation” (Gash 2013), in Savings Groups at the Frontier, ed. Nelson (2013).

18
household income and/or wealth, potentially leading to an increase in spending on health and education. Alternatively, access to SG savings and credit offers different resources for health and education costs. Members may prefer to use funds from SGs rather than using their personal savings or taking loans elsewhere because SG funds may be more convenient, private, or less expensive or have lower opportunity costs.
6. What are the social impacts? Group members often speak about solidarity with others in their group and how they work together to solve problems. In theory, membership both builds existing social ties and potentially creates new ones. Women who serve in the management committee of their group have a chance to gain leadership experience and potentially transfer new skills to other opportunities in their communities. Participating in financial decision making within the group, and controlling significant lump sums of money (with interest), can empower a woman to seek greater decision-making power within her community and within her own household. Social impacts such as these are believed to be a primary outcome of SG participation.
7. Are Savings Group members more resilient in the face of shocks? Again, access to saved funds and easily accessible loans are expected to reduce the negative impact of shocks on SG members. Practitioners expect to see more predictable levels of consumption over the years. Members can use saved resources or loans (paid back over time) to maintain spending levels when income levels drop. This should lead to an increase in food security.
8. Is the CRS fee-for-service model viable? The most common strategy for establishing SGs in new areas is for a development organization to bring in paid, trained facilitators to set up groups. The facilitators help the groups get organized, train them in the SG methodology, answer questions, and support the community of SG members, usually for the duration of the first cycle. The disadvantage of this approach is the required ongoing subsidy to pay the facilitator. A fee-for-service strategy is an alternative, whereby the groups themselves pay the facilitator. How do groups facilitated by fee-for-service agents compare to groups with agency-paid facilitators? Are participants willing to pay for the services of a facilitator? How does paying the facilitator affect the benefits of group participation?
9. What are the relative merits of the structured and organic replication strategies of the OA/FFH model? One of the most exciting characteristics of SGs is the ease with which they can replicate within and beyond communities where SG programs are established. Given the minimal infrastructure requirements, it is relatively easy for new groups to form, often assisted by members of existing groups without additional external intervention or support. This type of replication is considered organic, or spontaneous. Alternatively, under a structured replication model, existing SG members or other community members can be formally trained to form new groups. How can replication best be supported by development organizations to not only ensure an increase in the number of groups but also to maintain their quality management? Is structured training helpful, or would it be just as effective to let replication occur organically without intervention?
10. How effective are additional services delivered through SGs? Another promising aspect of SGs as a development intervention is the ability of the group mechanism to serve as a platform upon which to offer additional services. Many different organizations have experimented with adding services such as education, empowerment programs, agricultural promotion programs, and others. How well can the additional service function as an add-on? Do members benefit from these programs?
These ten questions are the focus of this paper in part because these are the questions best addressed by the existing research. While there are numerous other issues to explore with SGs, this subset attempts to focus on the subject areas within the RCT research.11
11 Although topics such as linkages to formal financial services and the use of mobile technology are quite valuable in the discussion of the power and potential of SGs as a development intervention, they are not included in this analysis because research in those areas was not included in the RCTs and was limited otherwise at the time of publication. It is considered premature to make research-based conclusions on linkages and mobile technology at this point.

19
Section 4: Existing Evidence
Building on the framework of the ten key questions outlined in Section 3, the following summarizes knowledge about SGs prior to 2012.12 Historically, research on operational issues has been limited and less defined by the industry than that on individual or household-level impacts. Although many organizations have conducted research on operations through field observations and/or discussions with other facilitating agencies, much of this work is informal and unpublished.
1. Who joins Savings Groups? Generally, practitioners knew their programs reached the poor since the programs were often introduced into areas with poor populations (according to national and regional statistics). Members were socially active, and perhaps some engaged in leadership roles in other contexts. However, practitioners knew few details about the common characteristics of members.
2. Do Savings Groups reach the very poor in various contexts? Although programs were introduced in geographic areas with populations who were poor or very poor, a finer understanding of the poverty levels of members was lacking—how many of these members were very poor? Some past studies included economic indicators aimed at assessing the poverty level of members, but outcomes were not definitive. Although standardized poverty assessment tools exist, prior research has not shown a wide or systematic use of them to indicate where members lie in relation to national poverty lines.
3. What are the household economic impacts? A summary of prior research13 concluded that there is a high likelihood of positive impact in the following areas: asset accumulation, consumption smoothing, investment in income-generating activities, management of finances, savings and lump-sum creation, and solidarity with other members. Data from the practitioners’ MIS systems that were reported to SAVIX support these findings. Prior research showed a low likelihood of an impact on income.
4. What are the business impacts? Prior research found a high likelihood of investment in new and/or existing businesses of members, including increases in the expansion of current businesses, inventory, and creation of new businesses.
5. What are the health and educational impacts? The prior research did not demonstrate strong outcomes for education enrollment or health outcomes, although these were expected impacts based on field observations and the organizational theories of change. There was some evidence that food security is improved.
6. What are the social impacts? Despite a strong belief on the part of practitioners that there are many social benefits to SG participation, prior research showed mixed evidence of social capital and women’s empowerment. Whereas there is a sizeable of amount of evidence of solidarity among members, there is limited evidence that group participation has an impact on collective activities, decision-making power in the household, and leadership roles.
7. Are Savings Group members more resilient in the face of shocks? Although it is believed that there is a medium-to-high likelihood of impact on risk management and possibly poverty alleviation, prior research did not discuss the outcomes in these terms (i.e, there is no discussion of the combination and interplay of outcomes, which provide direct evidence of shock-coping and resilience-building).
12 This section draws extensively on the summary in Gash 2013. Note that with the exception of the mid-term evaluation of the IRC’s RCT on its New Generation project, all of the studies summarized in the chapter are either non-experimental or quasi-experimental.
13 Gash 2013

20
8. Is the CRS fee-for-service model viable? Prior to the RCT, very little formal research was conducted on the CRS fee-for-service model, and limited research was conducted on similar models from other organizations.
9. What are the relative merits of the structured and organic replication strategies of the OA/FFH model? Although many programs have seen spontaneous or organic replication and have experimented with training replicators, formal research was not conducted on the OA/FFH structured replication model (although some research recorded rates of organic replication for other agencies).
10. How effective are additional services delivered through SGs? Conclusions from both a collection of case studies14 and a mid-term evaluation from the IRC’s RCT15 indicated that programs can be effectively designed to be delivered through SGs, and that SGs can be an effective platform upon which to deliver these services.
14 Rippey and Fowler 2011.
15 Annan et al. 2011.

21
Section 5: The Wave of Experimental Research
The availability of seven RCTs that consider dimensions of similar programs across several countries and time periods creates a rare richness of experimental evidence about the impact and effectiveness of SGs as a development intervention. This section provides a description of each of the RCTs included in this paper. Although each practitioner has a slightly different SG model, the term Savings Groups, or SG, is used throughout this paper, and only in this section are the different model names from each facilitating organization referenced. Table 1 provides an overview of the studies, including the location, time period, and key questions addressed by each study. These details are critical in terms of understanding the results of each study within a broader context.
The last column in Table 1 lists the reports that summarize the individual study outcomes. Full citations are provided in the References section. This paper summarizes information from these reports in a concise and purposeful manner; for further details on findings, see the full reports.
Table 1: RCT Study DetailsOrganization/Model Name
Geographic Location
Time Frame of Study
Main Study Research Questions
Synthesis Key Questions Addressed
Relevant Reports
CARE/Village Savings and Loan Association (VSLA)
Ghana 2008–2012 Who joins VSLA groups? 1. Who joins; 2. Poverty outreach; 3. Household impacts; 4. Business impacts; 5. Health & education impacts; 6. Social impacts; 7. Resilience
IPA 2012
CARE/VSLA Malawi 2009–2012 What is the impact of VSLA membership on households? (Various measures.)
1. Who joins; 2. Poverty outreach; 3. Household impacts; 4. Business impacts; 5. Health & education impacts; 6. Social impacts; 7. Resilience
IPA 2012
CARE/VSLA Uganda 2009–2011 Who joins VSLA groups? 1. Who joins; 2. Poverty outreach; 3. Household impacts; 4. Business impacts; 5. Health & education impacts; 6. Social impacts; 7. Resilience
IPA 2012
DanChurchAid/ VSLA
Malawi 2009–2011 What is the impact of VSLA membership on households? (Various measures.)
2. Poverty outreach; 3. Household impacts; 4. Business impacts; 5. Health & education impacts (food security); 7. Resilience
Ksoll et al. 2013; Lønborg and Rasmussen 2013

22
Table 1: RCT Study DetailsOrganization/Model Name
Geographic Location
Time Frame of Study
Main Study Research Questions
Synthesis Key Questions Addressed
Relevant Reports
Oxfam America and Freedom from Hunger/Saving for Change (SfC)
Mali 2008–2011 Who joins SfC groups? What is the impact of SfC membership on households (various measures)? Does a structured approach to replication improve group performance? Can malaria education be successfully delivered to SfC groups, resulting in knowledge and behavior changes?
1. Who joins; 2. Poverty outreach; 3. Household impacts; 4. Business impacts; 5. Health & education impacts; 6. Social impacts; 7. Resilience; 9. Replication; 10. Additional services
BARA and IPA 2013
-Catholic Relief Services/PSPs in Savings and Internal Lending Communities (SILC) and SILC Innovations
Kenya, Uganda, Tanzania
2008–2012 (rolling one-year interval during this period)
A selection of programming and impact questions comparing traditional NGO paid facilitators (Field Agents, or FAs) with fee-for-service facilitators (Private Service Providers, or PSPs).
2. Poverty outreach; 3. Household impacts; 5. Health & education impacts; 6. Social impacts; 7. Resilience; 8. Fee-for-service; 9. Replication
Ferguson 2012a–e; Ferguson 2013
International Rescue Committee/New Generation VSLA and VSLA Plus (two project phases)
Burundi 2010– 2012, with a midline survey in 2011
Do VSLAs improve economic outcomes in poor households? What is the incremental impact of the family-based discussion series* delivered with the VSLA, especially in terms of child well-being?
2. Poverty outreach; 3. Household impacts; 5. Health & education impacts; 7. Resilience; 10. Additional services
Annan et al. 2011; Annan et al. 2013
*As part of the IRC intervention, 39 of 80 SGs participated in the Healing Families and Communities discussion sessions. These ten, two-hour ses-sions were administered weekly and aimed to increase caregivers’ knowledge of actions to improve their children’s protection, well-being, and development (Annan et al. 2013).
CARE’s Village Savings and Loan Association Programs
CARE USA and CARE Ghana (henceforth referred to as “CARE” to represent the organization and its studies) partnered with Innovations for Poverty Action (IPA) to study its Village Savings and Loans Association (VSLA) programs in Ghana, Malawi, and Uganda. Although the study methodology was similar in each of the three countries, this set of studies is considered to be three separate RCTs. In all three studies, researchers conducted household, adult, village, and market surveys covering a number of welfare and social measures including health, education, consumption, and community engagement, as well as measures to understand community context, such as presence of schools, primary income-generating activities of villagers, and the prices of food. In CARE’s final report,16 findings are reported for each country as well as overall; pooled data are used for the overall results. Each of the three evaluations reported intention-to-treat (ITT) effects, measuring the impact of the availability of SGs in the treatment villages rather than the explicit impact
16 The full report should be available through the SEEP Network in fall 2013.

23
of SG membership on group members. Households included in the surveys were randomly selected and did not necessarily include a VSLA member. In all three studies, members had been part of a group for 15 months on average (pooled findings for Ghana, Malawi, and Uganda). In Ghana, 70 percent of members had completed a full savings cycle; in Malawi, 57 percent had completed a full cycle; and in Uganda, 56 percent had completed a full cycle (61 percent pooled). Therefore, the three studies should be considered as assessing relatively short-term impacts on young groups (IPA 2012). Approximately 74 percent of VSLA members in Malawi and Uganda are female; CARE estimates a similar gender breakdown in Ghana.
In Ghana, the evaluation occurred in rural areas across five regions in the northern part of the country. The program, implemented by CARE Ghana under the ESCAPE program, began in 2008. Villages in the study areas had little previous exposure to SGs. Of the 175 villages included in the study, 88 were randomly chosen to receive the VSLA program (the “treatment” villages), and the remainder of the villages did not receive the program (the “control” villages). Random assignment of villages to the treatment or control groups eliminated most significant differences between the two groups, although treatment villages were slightly wealthier and demonstrated higher rates of school enrollment even before the introduction of SGs. In early 2008, the researchers conducted the baseline survey. Program roll-out took place in treatment villages following the baseline survey, and a follow-up (“end line”) survey occurred in February 2011. Following the end line survey, the control villages received the VSLA program.
CARE Malawi implemented the program under the Save Up program in Malawi. As a way to observe the effects of informal group replication (organic replication), the study design included a cluster methodology. Rather than assigning single villages to the treatment and control groups, on average two geographically related villages were assigned to the groups as a cluster. One was designated as the primary village that would be targeted for the VSLA. The second village, located within a 4-kilometer radius of the primary village, was not intentionally targeted for the VSLA by the implementing partner NGO, but allowed for the replication of new groups by selected village agents when demand for the program existed.17 The study area (the “sample”) included 190 clusters (380 villages), with very limited previous exposure to the VSLA program. Each cluster of two villages became a treatment or a control cluster. The baseline survey of about 4,000 households across the 380 villages took place between April and June 2009. The end line survey took place between April and June 2011.
As in Malawi, CARE Uganda implemented the program under the Save Up program and identified clusters consisting of two villages each. The 196 clusters were randomly assigned to either receive the VSLA program or not receive it. In total, the researchers surveyed about 4,200 households in 392 villages between April and June 2009 (the baseline survey) and again between April and June 2011 (the end line survey).
DanChurchAid’s VSLA Program
Researchers from the University of Ottawa, the Rockwool Foundation in Denmark, the University of Southern Denmark, and DanChurchAid (DCA) assessed the impact of VSLAs in 46 villages in Northern Malawi over a two-year period from 2009 to 2011 (henceforth referred to as the “DCA study”). DCA trained a local NGO partner in Northern Malawi on the VSLA methodology, and the local partner implemented the project.
This study randomly assigned 23 of the 46 study villages to participate in VSLA implementation starting in 2009 (immediately following the baseline survey in all 46 villages). The researchers assigned the remaining 23 villages to the control group, which did not receive VSLA implementation until 2011, after the end line survey. Data collection included village, household-head, spouse, and short questionnaires. In 2009, 1,775 households participated in household-head, spouse, and short questionnaires, repeated in 2011. The primary outcomes of interest in the study were food security, income-generating activities, and household income. Approximately 39 percent of the households in treatment villages
17 See IPA 2012 for more details on the village agent replication model used in the Malawi and Uganda studies.

24
became SG members. Within the treatment villages, 16 percent of households were SG members and had completed at least one share-out during the study period. Approximately 75 percent of SG members were female.
Because the randomization took place at the village level, the primary estimation in this study is the intention-to-treat effect, which, as discussed above, is the average effect across households in villages where the VSLA program was implemented. The authors employed the local average treatment effect to better reach an estimate of the potential effect on participants. However, since this method cannot disentangle direct effects from spillover effects, this estimate is somewhat unreliable.
Oxfam America, Freedom from Hunger, and Strømme Foundation’s Saving for Change Program
Oxfam America, Freedom from Hunger, and the Strømme Foundation collaboratively designed the Saving for Change (SfC) program. Oxfam America and Freedom for Hunger, together with IPA and the Bureau of Applied Research in Anthropology (BARA), designed a mixed-methods evaluation of the SfC program in Mali (henceforth referred to the “OA/FFH study”). This evaluation includes an RCT implemented by IPA alongside a longitudinal qualitative study conducted by BARA. The RCT included 500 villages randomly assigned to either receive the SfC program or not receive it. In 2009, the researchers interviewed approximately 6,000 women for the baseline study, and again for the end line study in 2012 (all SfC members are women). Data collection for the RCT included small household, large household, adult, high-frequency,18 social-networking, and market questionnaires. By the end line survey, 36 percent of households in treatment villages had joined the program, and only 22 percent of those who joined the program shared-out at least once19 (BARA and IPA 2013).
Along with questions about who joins the SfC groups and a selection of household impact questions, the RCT looked at knowledge and behavior outcomes regarding its malaria education component and also compared the effectiveness of a structured group replication strategy with organic replication. As part of membership in a SfC group, participants received seven 30-minute sessions on malaria education, each delivered during a separate weekly SG meeting during their first savings cycle. For the replication comparison, the structured replication involves identifying members of existing SfC groups who are leaders and training them to replicate groups. They are given three days of training, a pictorial manual, and a certificate of completion of the training. Organic replication occurs when members of existing groups volunteer to form new groups, receiving no formal training, manual, or certificate; they do, however, receive a small amount of guidance from NGO facilitators (note that this model is different from that studied in the CARE RCTs in that CARE did not study the differences in replication).To study the difference between organic and structured replication, the treatment villages were randomly assigned to receive the structured replication training or to receive only informal replication training. Similar to the CARE evaluations, the quantitative analysis here measures the impact of the availability of SfC in a village, not the explicit impact of group membership.
Catholic Relief Services’ Savings and Internal Lending Communities Program
Catholic Relief Services supports SG formation through its Savings and Internal Lending Communities (SILC) program. To scale up SILC, CRS developed the Private Service Provider (PSP) model, which replaces traditional agency-paid group facilitators (Field Agents, or FAs). CRS evaluated the PSP pilot (2008–2012) with an RCT conducted in Kenya, Tanzania,
18 Between the 2009 baseline and 2012 end line surveys, shorter adult surveys called high-frequency surveys were administered on a subset of 600 randomly selected women in order to better understand details of respondent behavior, especially concerning risk-coping, vulnerability, and the timing of impacts (BARA and IPA 2013). These outcomes are not included in the overall RCT results. See BARA and IPA 2013 for more information on outcomes.
19 However, of the 29 percent of households in treatment villages who joined in the first two years, by April 2011 77 percent had shared-out at least once.

25
and Uganda (henceforth referred to as the “CRS study”). All agents undertook one year of paid training as FAs, followed by an examination to be certified as a PSP. Among agents who completed the certification, researchers selected 333 to participate in the RCT. Two-thirds of these agents were randomly assigned to become PSPs immediately and to offer SG services to communities on a long-term, fee-for-service basis (villages assigned PSPs comprised the treatment group), and the other agents remained FAs for an additional year (FA-assigned villages made up the control group). Within the study, all agents were trained and supported identically. The only difference was in how they were paid; The FAs were paid by the program, while the PSPs were paid by the groups they facilitated. Sampling focused on 240 randomly selected villages served by agents randomly assigned PSP or FA status, for the one-year research interval (Ferguson, 2012a).
The study looked at the agents and the households they served to understand group performance, agent earnings and productivity, poverty outreach, and a variety of household impacts. For the household survey, the researchers selected a subset of 240 of the 333 agents, along with one village served by that agent (Ferguson 2012a). Similar to many of the other RCTs in this synthesis, the CRS study used the intention-to-treat design. For each village selected, ten randomly selected households were surveyed, including five SILC and five non-SILC households. Surveys occurred after groups had been formed. Overall, researchers surveyed approximately 2,400 households, with a subset also participating in qualitative data collection (Ferguson 2012a). The baseline took place in July and August of 2010, with the end line in July and November of 2011. Household findings reflect average effects in PSP-served villages. On average, females made up approximately 72–73 percent of group members in both PSP- and FA-served villages. Information about gender breakdown of the agents was not available.20
International Rescue Committee’s VSLA and VSLA Plus Program
The International Rescue Committee (IRC) used in-house researchers to conduct an RCT (henceforth referred to as the “IRC study”) to evaluate the impacts of its VSLA program (which included financial education21), as well as the incremental impact of adding a family-based discussion series—Healing Families and Communities (HFC)—to the VSLA. The HFC discussion sessions included ten weekly discussion sessions of two hours each, with the overall objective of increasing caregivers’ knowledge of actions to improve their children’s protection, well-being, and development (Annan et al. 2013). The bundled VSLA and discussion series package is referred to as VSLA Plus (this is sometimes referenced as SG+). To form the VSLAs, IRC staff visited the treatment provinces in 2009 to introduce the program to community members and encourage them to self-select into groups of 15 to 25 people in order to join the program (Annan et al. 2013). Eligible participants had to have children living in their households. The study included 77 of these groups, representing almost 1,600 households. Of the 77 groups, 40 were randomly assigned by lottery to receive support to launch the VSLA program at the beginning of the study period (hence becoming treatment groups). The remaining 37 groups were to receive support to launch the program in the second phase of the evaluation period (hence becoming control groups). In addition, among the 40 treatment groups, 20 were selected to participate in the HFC discussion series during the first phase of the project. Therefore, there were 20 treatment groups with the SG only, 20 treatment groups with SG+, and 37 control groups waiting to join the program.22
The baseline survey took place between January and March 2010. The first project cycle then ran from April 2010 to March 2011 with the 77 groups, followed by a mid-term survey conducted between April and May 2011. In the second phase of the evaluation, three new groups were added to the 37 original control groups, bringing the study total to 80
20 The percentage of those groups completing at least one cycle was not included in the report statistics, but this point is less relevant since it is not an impact study in the same way as the CARE, DCA, and OA/FFH studies.
21 The IRC’s standard bundling of financial (or business) education covering topics such as business, marketing, pricing, and financial planning information with the SG program is an important difference relative to other SG programs in this study that did not include this education.
22 Some academic evaluation researchers point out that this research design may introduce bias since the control group consists of individuals who have been informed about the program and who have expressed a desire to join. The process of informing the control group about the program may affect their behavior in terms of saving as well as survey participation, and this creates uncertainty about whether the evaluation results are truly unbiased. See the IRC study for more detail on the study methodology.

26
groups. Of the original 37 control groups plus the three new groups (40), 19 received the SG program and 21 received the SG+ program. Therefore, the 37 “pure” control groups in the first phase of the evaluation in 2010 were now SG and SG+ 2011 groups. In addition, the remaining 20 SG 2010 treatment groups added the plus program, or the family-based discussion program. The second evaluation cycle ran from June 2011 to April 2012, and the final survey ran from June to July 2012.
At all stages, the survey consisted of a set of household questions answered by the VSLA member. In addition, at the baseline and at the end of the first cycle, a separate child survey was administered to a randomly selected child in the household between the ages of 10 and 14. The surveys looked at a variety of household impacts (poverty rates, asset ownership, etc.) as well as a set of measures of child well-being. Women made up approximately 80 percent of the SG participants, and 91 percent of VSLA members had completed one savings cycle by the end of the first phase.
Among the studies discussed in this paper, the IRC methodology sets it apart as the only study that measures the direct effect of VSLA participation on households that participate in groups, measuring the effect of “treatment on the treated”(ToT) rather than the effect of VSLA availability on the average household in a program village (the ITT effect). See Section 2 of this paper for a discussion of the ITT versus ToT effects. Results from both project phases are summarized in the final evaluation report published in March 2013.

27
Section 6: RCT and Other New Research Findings
In this section, findings from the seven RCTs, as well as selected additional studies, are summarized using the ten key questions. As mentioned in Sections 2 and 5, all studies but the IRC study present results reflecting outcomes of treatment villages (ITT effect) in contrast to outcomes of treatment participants (ToT effect). Substantial contamination occurred in the control groups as well. Timing issues are important; many practitioners assume the impacts of SGs are expected to appear after at least one full cycle and share-out has been completed, when members have a greater understanding and trust of the methodology. For the CARE, OA/FFH, and DCA studies, however, only relatively small proportions of participants completed a full savings cycle. Outcomes from members with varying lengths of participation have been combined due to both the need to maintain accuracy of the study design and complications from the staggered roll-out approach (groups can start at any and all months of the year, creating a large variation in length of participation among groups in the study).
Data have been pulled from surveys taken at the individual, household, and community levels. Most outcomes are presented at the household level in order to understand how participation of one member can affect her or his entire household. If the outcomes are not presented at the household level, the unit of analysis is noted. Approximately 75–80 percent of SG members in the studied programs are women (although 100 percent of the OA/FFH members are women), and therefore member or individual outcomes usually reflect impacts on women. When possible, outcomes are reported as impacts on women, but often gender is not specified.
1. Who joins Savings Groups? The studies that spoke to the question of “who joins” are the OA/FFH evaluation and the three CARE studies. The other RCTs did not report on member profiles in detail, with the exception of the DCA study, which issued a separate report looking at outreach (see Lønborg and Rasmussen 2013). It is important to remember that the following characteristics are not impacts of the program but pre-existing differences among women who joined and did not join at the time of the study (BARA and IPA 2013).
The three CARE studies had somewhat similar findings. Overall, members were relatively wealthier than non-members (as measured by an asset-based index), were more socially integrated in the community, came from larger households, were more likely to have had a business before, had more experience in managing money, and were more literate, although some variation existed among countries (IPA 2012). Adopters had slightly older children, more household assets (like cell phones and bicycles), and better housing conditions (metal roofs and access to electricity). Some of these differences were observed in each country—literacy and wealth, better social integration, and having at least one business in Malawi; use of credit, wealth, and having at least one business in Ghana; and literacy and better social integration in Uganda.
The OA/FFH study found differences between adopters and non-adopters, as well as those who joined early versus later. Adopters were relatively wealthier than non-adopters (as measured by food consumption per capita), older, more socially connected, from larger households, more likely to own a business or livestock, more financially active in terms of savings and borrowing, more likely to be a leader in the village, and more likely to engage in decisions at the village and household level (BARA and IPA 2013). Although several differences existed between those who joined and those who did not join, there were only a few differences between early and late, or “second,” adopters (those who joined more than six months after the first group formed in their village). Late adopters came from smaller households and were younger and less socially integrated, suggesting that SfC reaches the more marginalized over time.
The DCA study found that even though a large share of program participants ranked as very poor, SG participants were richer than the non-participants. Participants ate more meals per day and had a shorter hungry period (Lønborg and Rasmussen 2013).

28
Why do these differences exist between members and non-members? Practitioners have made observations on this issue for several years, and discussions between researchers and practitioners during the data collection and interpretation process helped inform the issue further. Conversations with people in CARE’s program communities who had not yet joined a group revealed that they either misunderstood the program or were initially distrustful of it. However, after learning more about how the program worked, they waited for the opportunity to start a group (IPA 2012; as informed by CARE staff). Only those who are in a better position to take a financial risk may be willing to participate at first, which is why “wealthier” members of the community may join first. Even so, both early and late adopters could be poor in terms of food consumption, asset wealth, or relationship to poverty lines, with the difference being that the “wealthier” group is relatively better off than the “poorer” group.23 Evidence otherwise is not clear in these outcomes but could matter in communities with a lot of economic disparity. After the first participants try the program, find it to be trustworthy (they get their money back at the end of the cycle), and profit from it socially or financially, they will speak well of it and others will be eager to join in. Also, cultural and social issues may come into play with the introduction of the program, such as giving preference to elders, or perhaps those who are more socially integrated simply learn about it first and are able to take up available spots when group size is limited.
In addition to who joins, several of the studies looked at how many people joined after the program was offered in the village. Table 2 exhibits take-up rates available from the seven RCTs. The reported percentages indicate what proportion of respondent households in treatment villages were members of an SG by the end of the study period, which should reflect the general proportion of households in the community as a whole.24 For the CARE Malawi, CARE Uganda, and DCA studies, these figures represent take-up approximately 2 years after introduction of the program; for the CARE Ghana and OA/FFH studies, it was approximately 2.5 years
Table 2: Program Take-Up Rates (rounded)
Study Treatment Group
Control Group
CARE Ghana 36% 8%
CARE Malawi 22% 3%
DCA (Malawi) 39% 15%
OA/FFH (Mali) 30% 6%
CARE Uganda 36% 6%
Although figures vary per country, in combination, overall take-up rates after 2 to 2.5 years are 22–40 percent. The levels could be higher after more time, allowing for greater saturation from more replication within villages. Rates within a 2- to 2.5-year time frame could be higher if the facilitating agency is particularly aggressive in the number of groups started in each village, but agencies must consider the trade-offs in increasing the number of groups per village in comparison to starting groups in more villages. Notably, for all of the studies, the program “spilled” over into the control communities. This contamination (in research terms) is a natural part of the way SGs work, and it shows that it is quite difficult to prevent the spread of this model, likely due to its popularity, the need for its services and features, and the ease in organic or spontaneous replication.
23 For example, in the SfC study household food consumption for members was higher at $2.92 per capita as compared to $2.68 per capita for non-members, but overall consumption could be considered low. Additionally, 81 percent of both members and non-members in treatment villages fell below the $1.25/day poverty line
24 For example, with the SfC study, out of the 12 households randomly selected for surveying, 30 percent were members of an SfC group. This data came from individually sampled women and their husbands. For more information about household structure and survey administration, see the BARA and IPA 2013 report.

29
Main conclusions:
• SG members tend to be relatively wealthier (although still poor or very poor) and more socially and financially active than non-members, with other characteristics varying per country.
• More marginalized women join later.
• Results show that 2 to 2.5 years after introduction of the program, take-up rates varied from 22–40 percent per country.
2. Do Savings Groups reach the very poor in various contexts? Before these RCTs, many practitioners knew their programs reached the poor, but questioned the extent to which they reached the very poor. Here, the term very poor refers to populations living on a daily income level that ranks below the national or international poverty lines or rates, such as those living on $1.25 a day (purchasing power parity, or PPP). Several of the RCTs collected data on both national and international poverty levels of respondents to report on either member averages or averages for respondents living in treatment villages. If the averages are for respondents in treatment villages, the assumption is that the poverty levels of members would likely reflect those averages. Although these two types of estimates are not directly comparable, they are included together in Table 3 since both provide a general estimation of the proportion of the very poor reached by the program at the time of data collection.
Table 3: Poverty Outreach Estimates Below $1.25 a day (PPP)
Study Study Average Study Study Average
IRC (Burundi) 64% OA/FFH (Mali) 81%
CARE Ghana 66%* CRS (Tanzania) 66%
CRS (Kenya) 39% CARE Uganda 45%*
CARE Malawi 66%* CRS (Uganda) 34%
DCA (Malawi) 51%
*Outcomes reflect averages for households living in treatment villages at the end line survey, not for SG households specifically.
The estimates in Table 3 are somewhat complicated to interpret further. All nine study average outcomes show that the SG programs reached the very poor (or very likely reached them in the case of treatment village estimates).25 Each of the studies occurred in rural areas. However, the proportion of the very poor reached varies per country and per program. Time can also be a factor in the ability of a program to reach the very poor in large proportions, if the relatively wealthier join first, as seen in the OA/FFH and CARE RCTs (although it is important to note that the OA/FFH study findings suggest that the poorest women are not excluded).
A program’s depth of outreach also likely depends very much on deliberate geographic targeting. By knowing what proportions of the very poor are reached, we know the converse—the proportions of the not very poor reached—which demonstrates that the methodology appeals to others besides the very poor. If the program appeals to people of varying wealth (although we cannot say to what degree it varies) and intends to reach a high number of very poor, it will likely be more successful in introducing the program in specific districts or regions that have high proportions of the very poor.
25 Note that although the CRS study is otherwise discussed as one study, outcomes for each of the three participating countries are noted here.

30
Experimenting with programmatic features could increase depth—for example, using wealth-ranking exercises in communities and having facilitators target specific households, or identifying obstacles that prevent the poorest in specific communities from joining and finding ways to overcome them.
An additional outcome on outreach came from the CRS study. CRS found no significant difference in depth of poverty outreach between PSP- and FA-supported members. The finding suggests that the “financial burden” of having to pay agents does not prevent the project from reaching the very poor, meaning that the very poor are willing and able to pay (Ferguson 2012a).
Finally, both the OA/FFH and the IRC studies show that SG participation reduced poverty overall. In the IRC study, SG households saw a remarkable net impact of a 14 percentage point reduction in poverty rates (estimated by per capita expenditures; income was not measured). This outcome suggests that SG members have more resiliency than non-members. In addition, the OA/FFH study used the Progress out of Poverty Index (PPI) to measure poverty and found a suggestive, small increase in the PPI score in treatment villages. Though this finding is encouraging, the magnitude of the change is small. These outcomes raise the question of why the IRC study is the only one of the seven RCTs to show a substantial reduction in poverty based on SG participation. It is difficult to say, but two main differences in the IRC study are the geography and the population. The study occurred in areas of Burundi recovering from a somewhat recent civil war and massive displacement of its population, and the targeted populations were considered highly vulnerable since many were likely returnees from refugee camps. If these differences account for the ability of this program to create poverty-level changes, then overall this study clearly suggests that SGs could be an especially effective development intervention to economically assist highly vulnerable populations such as returnees. However, the IRC study methodology was different from the methodologies of other papers included in this review, and some academic evaluation specialists have unanswered questions about potential bias that may be introduced by the methodology.
Evidence of Poverty-Level Impact
The IRC study in Burundi is the only study thus far to demonstrate that SG participation reduces poverty levels (though the OA/FFH study shows a modest reduction in poverty as well). The IRC introduced its SG program to a target population of highly vulnerable families in two rural provinces of Burundi with high numbers of returnees previously displaced due to several years of civil war in the 1990s and 2000s. Between the 2010 baseline and 2011 mid-term data collection, the percentage of control group households living below the $1.25 PPP poverty line increased from 65 percent to 75 percent (a 10 percentage point increase), while the poverty rate of the treatment group decreased from 67 percent to 63 percent (a 4 percentage point decrease). Treatment households thus effectively avoided a downturn, resulting in a net impact of a 14 percentage point reduction in poverty.
Main conclusions:
• SGs can and do reach the very poor, although depth of outreach likely depends on geographic targeting.
• There is no difference in poverty outreach for PSP and FA members. Therefore, the very poor are willing and able to pay for fee-for-service providers.
• SGs can be an effective development intervention to economically assist vulnerable populations.

31
3. What are the household economic impacts? Some key economic impacts studied in these evaluations include the level of savings, the number and amount of loans taken, the ownership of a significant asset, and levels of expenditures and/or consumption. The household economic impacts are summarized in Table 4.
SG participation resulted in an increase in savings in every study that looked at the impact of SGs on savings levels and savings rates. In each of the three CARE studies, survey respondents in treatment villages showed higher levels of total savings than respondents in control villages (IPA 2012). At the end line survey in Ghana, total savings deposits were $14 in treatment villages versus $10 in control villages. In Malawi, total savings balances were $17 in treatment villages and $11 in control villages. And in Uganda, total savings balances were $41 in treatment villages versus $34 in control villages. Similarly, the availability of the OA/FFH program in Mali found that respondents in treatment areas had higher savings balances than respondents in control areas; net savings in treatment areas were $17 compared to $13 in control areas, though no significant difference in savings levels existed at the baseline (BARA and IPA 2013). The DCA program in northern Malawi found significant increases in SG savings (Ksoll et al. 2013). While this study found an increase in total savings, this increase is not statistically significant. However, there are no significant measured decreases in the amount saved through other means (with a friend/relative, at home, or with a bank) despite the increase in SG savings. The DCA study does not specify total amount saved.
CRS found that being a PSP village versus a FA village did not have a significant impact on total savings. However, this study also found respondents in PSP villages as more likely to save for business purposes. The IRC evaluation did not compare savings in treatment versus control households. However, researchers did look at the level of savings for SG members, which averaged about $56 at the time of the mid-term survey (Annan et al. 2013).
Several studies found that the availability of SGs in villages increased the use of credit, in terms of both the number of loans taken and the size of the loans. An increase in the likelihood of taking a loan occurred in Ghana (CARE), Malawi (CARE), Uganda (CARE), and Mali (Oxfam/FFH). The DCA study found an increase in the likelihood of taking a loan over the past 12 months (13 percentage points) as well as a 216 percent increase in total loan amounts in treatment village households. CRS’s evaluation of PSP versus FA villages found that respondents from PSP villages took on more credit than their counterparts in FA villages. The IRC evaluation observed active use of the lending feature among the 40 SGs in that study, though this was not compared to the control group.
In terms of asset ownership, the findings were less consistent. CARE’s evaluations in Ghana and Uganda found no significant impact of SG availability on asset ownership. In Malawi, a small but significant difference was found in the household ownership of fowls; 6.2 fowls on average in treatment villages versus 5.6 in control villages. The OA/FFH evaluation found no significant differences between treatment and control villages in terms of household or agricultural asset ownership, although in this study the value of livestock owned by households in treatment villages was higher than in control villages. These households owned, on average, $120 more in livestock than households in the control villages, reflecting a 13 percent difference (BARA and IPA 2013). The IRC mid-term evaluation found a significant impact on household asset ownership using a composite asset index; treatment households had the asset equivalent of one additional head of cattle compared to control households.
The CRS comparison of asset ownership in PSP versus FA households mostly found no significant differences between the two groups. Where differences did emerge, they were small and favored the FA households (Ferguson 2012e). The DCA study did not measure asset ownership directly, although this study did find a significant (at the 5 percent level) increase in the size of homes, measured by number of rooms, in treatment village households.
Finally, several studies looked at the impact of SGs on expenditures and/or consumption. CARE’s evaluations in Ghana, Malawi, and Uganda all found no significant impacts (positive or negative) on total expenditures (IPA 2012). The OA/FFH evaluation found no significant impact on total household expenditures over the study period. The IRC mid-term evaluation found a statistically significant difference of about $6 ($37.70 for the treatment group versus $31.90 for the

32
control group) in total expenditures. The DCA study found an increase in total consumption, measured using a USAID Poverty Assessment Tool (PAT).26
CRS looked at the impact on total expenditures and total consumption in PSP-supported villages versus FA-supported villages and found slightly higher levels of expenditures and consumption in the PSP villages, although this finding did not prove statistically significant.
Income was not considered as a key household impact because it was included and measured inconsistently. In most studies, expenditures and/or consumption were used as a proxy for income. Of the seven studies surveyed here, only the CRS study included a direct income measure. This study compared incomes of PSP vs. FA households and found no significant differences.
It is worth noting that although savings increased in treatment areas wherever measured (CARE, OA/FFH, and DCA), these same studies found no measurable negative impact on household expenditures or consumption. This is an important point for the findings on savings, suggesting that increased savings do not occur at the expense of consumption spending or reductions in expenditures.
Main conclusions:
• The availability of SGs increases savings in treatment areas.
• The availability of SGs increases the use of credit in treatment areas.
• Within the study period, there was mixed evidence that SGs positively affect asset ownership. Negative effects were not observed.
• There was some evidence within the study period that SG availability/participation increases expenditures, but this evidence is not consistent across all seven studies.
4. What are the business impacts? In the area of business impacts, some interesting results emerge around business-related spending, business ownership, and business profits. Business is defined here as any income-generating activity, since there is an assumption that most of the respondents in these studies engaged in petty commerce as at least one source of income. The results relating to business impacts are summarized in Table 5.
As a measure of business-related spending, the CARE studies looked at the likelihood that a survey respondent took a loan for her or his business. In each of the three countries studied, respondents in treatment villages were more likely to have taken a loan for business purposes over the study period. The OA/FFH study found a suggestive27 increase in business-related spending in treatment villages. Also, 42 percent of women who took a SG loan reported using the loan for business purposes (by nature, this measure could not be compared to the control group) (BARA and IPA 2013). The DCA study found increases in the likelihood of taking a loan for business purposes and the number of business-related loans taken, though not in the total amount borrowed for business purposes. In the CRS study, PSP-supported households showed a slightly higher level of business-related spending relative to FA-supported households (Ferguson 2012e).
The IRC study did not look at any measures of business performance.
Another measure of the impact of SGs upon businesses is the rate of business ownership. In the CARE studies, the pooled data showed a small (20.1 percent versus 18.3 percent) but statistically significant difference between the
26 The USAID Poverty Assessment Tools (PATs) are short, country-specific household surveys used to calculate the percent of a population living below one or more national or international poverty lines (retrieved from http://www.povertytools.org on July 29, 2013).
27 Throughout this paper, the word suggestive means that the finding was statistically significant at the 10 percent level. Unless so noted, readers can assume that findings are statistically significant at the 5 percent level or higher.

33
treatment and control groups, with respondents from treatment villages being slightly more likely to own a business. This was driven mostly by a 3 percentage point difference in Uganda, where women in treatment villages were 3 percentage points more likely to own a business at the time of the end line survey, and yearly business profits increased by $12 in treatment areas. A small positive difference came about in Ghana and Malawi, but this difference did not prove statistically significant in either case. The OA/FFH study showed no measurable difference in the rate of business ownership between the treatment and control villages; in both groups, the business ownership rate was just over 40 percent of respondent households. Similarly, the DCA study did not find any change in the total number of income-generating activities per household when including agriculture and livestock. When agriculture and livestock were excluded, there was suggestive evidence of an increase in the number of income-generating activities.
A striking finding of the CRS study was that PSP-supported households (i.e., households from villages where the SILC program was facilitated by a PSP) were about 5 percent more likely to own a business, assuming that being a PSP was not considered a business by respondents (Ferguson 2012e). Overall, PSP-supported households appear more entrepreneurial, and FA-supported households more risk averse.
Finally, several studies looked at whether SG availability or participation led to an increase in business profits. Similar to the findings on business ownership, in the CARE studies the pooled data showed a statistically significant difference between the treatment and control groups, with profits in treatment villages being about $25 versus $19.64 in control villages. This was driven mostly by a $12 difference in profits in treatment versus control villages in Uganda. No significant impact on business profits was clear in the CARE studies in Ghana or Malawi, or in the OA/FFH study. The OA/FFH study did find suggestive increases in business expenses ($167 in treatment villages versus $131 in control villages) and sales ($215 versus $176), which could be a precursor to increased profits. The DCA study looked at various measures of business income and found no significant impacts. The CRS study did not compare business profits in PSP-supported versus FA-supported communities.
The mixed impacts on businesses for members in SGs seem somewhat analogous to the findings in the first microcredit RCTs. Outcomes were not as strong as expected, but there were some positive findings.28 We see an increase in business-related spending, and in some cases likelihood of business ownership, but only limited evidence of an increase in profits. There are numerous possible explanations. The more entrepreneurial households may see a greater business impact than others, but if that is only a small percentage of all households, those findings could be lost when analyzing large sets of aggregated data. Perhaps the realities of SG members’ lives make them more likely to increase spending on consumption needs such as assets and food. Since general SG participation is clearly not leading to large impacts on businesses in the one-to-three-year time frame at the aggregate level, practitioners who want a greater impact could consider more explicit business development components to programming, such as business education, business skills training, or linking to local value chains. It is plausible that business impacts will be seen later, as several practitioners indicated that they were not surprised that business impacts were not observed within the time frame of these studies, given their knowledge about the amount of time that business impacts realistically can take. An alternative explanation is that limited access to financing is only one of many barriers to business development.
Main conclusions:
• The evidence on business impacts of SGs is limited and mixed.
• Within the study period, there was some evidence of an increase in business-related spending.
• It is reasonable to expect that increases in business-related spending in the short term (study period) may lead to increases in profits over a longer period. This is supported by an observed increase in business profits in Uganda.
28 See Bauchet et al. 2011.

34
5. What are the health and educational impacts? Key measures of educational impacts include expenditures on education and education enrollment rates. Key measures of health impacts are total expenditures on health and health care usage. As hunger is directly related to health and well-being, food expenditures and food security are included here as well. The health and educational impacts are summarized in Table 6.
The CARE studies found no statistically significant differences on education expenditures, although there is suggestive evidence, driven by the data from Ghana, of increased enrollment in primary school. There is evidence that households use SG loans and share-outs to pay for education costs. With respect to health, evidence exists that households use SG services (especially loans and emergency funds) to pay for health-related expenses. There is suggestive evidence that SG participation makes participants less likely to sell an asset to finance health expenses. Otherwise, no significant differences were found between treatment and control villages.
The OA/FFH evaluation found no differences in spending on health and no differences in educational enrollment or outcomes, only a small, suggestive increase in education spending.
The IRC study found that at the mid-term, spending on children’s education was significantly higher for SG participants relative to the control group. Spending on children’s health dropped in all groups after the first project cycle, with a significantly bigger drop in the SG and SG+ households (19 percent in these households versus 11 percent in control households). Several researchers and practitioners identified this as an unexpected and surprising finding given their experience working with SGs. This could be interpreted as a negative finding, suggesting that SG participation decreases spending on children’s health. On the other hand, it is possible that SG participation leads to earlier treatment of ailments that prevent further spending on healthier children who require less spending on health care overall. Observed impacts on food security and consumption smoothing support this latter idea, since a food-secure child is likely to be a healthier child. The study as designed did not provide any insights into why health care spending in SG and SG+ households dropped more than in control households. Several practitioners noted that, in light of the RCT findings, additional research on how group members behave with respect to health and education spending and the reasons for those behaviors would be very helpful.
The DCA study did not look at impact measures of health care usage or spending and educational enrollment or spending.
The CRS study did not find any significant differences between PSP- and FA-supported households in terms of the number of school absences among children in the households. The study did identify an important difference between the two groups in terms of why children missed school when they did: PSP-supported households were more likely to report that children were not sent to school due to inability to pay the related costs (Ferguson 2012e).
These results on health and education were quite surprising to practitioners interviewed for this paper. If members often say they spend loan and share-out money on their children’s education and health, why did it not show up in the RCTs? Regarding expenditures, the answer may be due to a substitution effect rather than an addition effect: members use SG money to pay for education and health instead of money from other sources, not in addition to money from other sources. One practitioner noted that, during discussions, members said that before SG participation they would still pay school fees “but with the shame” of begging, borrowing, engaging in demanding labor, disposing some of their assets, or delaying enrollment (Hamadziripi 2013). In speaking with school authorities about parents in SGs, he said they mentioned that they now pay fees on time, suggesting overall that the impact of SGs on education may be the ease, timeliness, and pattern of payments rather than an increase in payments (Hamadziripi 2013). The same issue may apply to health expenditures. With or without SG participation, the health care cost is covered, but SG money allows easier, faster payments with more consistency. There are fewer anecdotal or qualitative insights to shed on explaining school enrollment, however. Perhaps the parents’ decision to enroll a child is more complex than simply having the money to pay for it. To have an impact on enrollment, practitioners must identify and address other issues, such as community

35
norms around the future value of education and the perceived use of children’s time with explicit programmatic components (such as additional services).
Turning to the impact of SG programs on food security, the CARE studies found that SG members listed food purchases as an important use of SG loans. Treatment households showed a small but statistically insignificant effect on food insecurity using an index generated by asking households how often they skipped or reduced meals in the last year, and how often they lacked food to feed the household (IPA 2012). When only the Uganda data were considered, a suggestive increase in food security was observed with a decreased likelihood that adults in the household reduced daily food consumption (this is 4 percentage points less likely in treatment villages).
The OA/FFH study examines food security in several ways. Looking at food consumption in the previous seven days, this study found a suggestive increase of 13 cents per capita (about a 3 percent increase) in the treatment villages (BARA and IPA 2013). In addition, a 4 percentage point drop (from 51 percent to 47 percent) in Freedom from Hunger’s (FFH) food insecurity index was observed in treatment areas.29 The FFH measure of chronic food insecurity showed a significant drop in treatment villages; this statistic is 43 percent in control villages and 39 percent in treatment villages. Ultimately, households in OA/FFH villages were 10 percent less likely to be chronically food insecure. In addition, households in treatment villages experienced a smaller decline in food consumption during the lean season, spending 39 cents more per adult per week during this difficult period (BARA and IPA 2013). Taken together, this evidence strongly supports the argument that the SG program improved food security in the study area.
The IRC study found that relative to the control group, food expenditures were $4.70 higher in the treatment group at the mid-term survey ($30.50 in the treatment group versus $25.80 in the control group). Notably, food expenditures dropped in the control group but increased in the treatment group.
The DCA study found a statistically significant increase in the number of meals consumed the day before the survey for treatment versus control villages. Households in treatment villages consumed on average an additional 0.13 meals relative to treatment households.
The CRS study found that PSP-supported households were less food secure than FA-supported households by two measures: how often households went to sleep hungry in the past month, and how often households failed to meet food needs in the past year. The differences are significant at the 5 percent level (Ferguson 2012e). This phenomenon might be related to household livelihood strategies, whereby FA-supported households produced more food, while PSP-supported households engaged in more business activities and purchased more food, opening themselves up to greater variation.
Main conclusions:
• The bulk of the evidence suggests little impact on health or education outcomes or expenditures.
• Positive effects identified in limited contexts include increased primary enrollment in Ghana and increased spending on children’s education in Burundi.
• Positive impacts were observed in food security in several different locations across a variety of measures, although outcomes are mixed. There is a reasonable body of evidence suggesting that SG participation supports food security.
29 The Freedom from Hunger food security scale (FSS) is a nine-question survey instrument adapted from a United States Department of Agriculture food security survey to address international contexts that measure household access to food through available resources to purchase or barter for food. Outcomes of the scale indicate food security, insecurity, or chronic insecurity.

36
6. What are the social impacts? The social impacts are summarized in Table 7.
The CARE evaluations looked at a selection of measures of social capital and women’s empowerment, including women’s influence on various household decisions, women’s influence on business decision making, and an index of such indicators of community engagement as participation in village meetings and the frequency with which women raised issues with peers and authorities. In terms of decision making in the household, the study found an overall increase in women’s influence on household decisions in treatment areas. This included effects on food consumption, school expenses, children’s health, and business actions. These results were observed across all three study countries (Ghana, Malawi, and Uganda), but results are statistically significant on all measures only in Malawi. Significant increases in business decision making were observed in Uganda (in addition to Malawi). This study included inquiries regarding engagement outside of SGs. Overall, there were no substantial effects on community participation and no measured effects on women’s perceptions of their own participation (IPA 2012).
Similarly, the OA/FFH study looked at a variety of measures of both social capital and women’s empowerment within the household. Social capital measures include engagement in community and questions on the strength of social networks. Women’s empowerment measures focus mainly on female decision-making power, which was measured using questions about the extent to which a woman is free to decide on her own about food expenses, education expenses, health expenses, and business decisions. The evaluation did not find impact on any of these dimensions.
The CRS study compared households in PSP villages with households in FA villages in terms of various measures of leadership and activism, and found that households in PSP-supported villages were significantly more likely to get involved in community activism and to question a neighbor or village leader in case of a disagreement. This study did not look specifically at individual women’s decision-making power (Ferguson 2012e).
The DCA study did not look at any measures of social impact. The IRC study also did not look at social capital or women’s empowerment.
Among the practitioners interviewed for this paper, this set of results was almost universally identified as the most surprising outcome of the RCTs. Experience working with SGs in the field in numerous contexts has suggested that group members view the solidarity and community within the groups as one of the most valuable aspects of participation. Further, there is extensive anecdotal and qualitative evidence of increased independence and decision-making power for women participants. For instance, not only did Malian men and women speak consistently of an increased role of women in household decisions, but the husbands of participating wives reported that SG participation was a means to relieve their economic burden (BARA and IPA 2013). This presents a puzzle: if group members generally reported social impacts such as community solidarity, increased self-confidence, and increased decision-making power as significant benefits of the program, why did this not show up in the RCTs? Do SGs actually not have much social impact? Or did the RCTs fail to accurately pick up impacts that actually occur? Several practitioners involved with the OA/FFH study suggested that in retrospect the survey questions in the RCT may not have addressed the areas of impact adequately. Many survey questions asked about new relationships and connections, whereas BARA’s qualitative research suggested that members are more likely to strengthen existing ties.30 In addition, many of the questions were framed in economic rather than social-psychological terms, although engagement and empowerment are very much social phenomena. Thinking about the next wave of SG research, practitioners repeatedly identified a deeper study of social impacts as an important follow up to the RCTs.
Main conclusions:
• Despite qualitative evidence and practitioner experience of increased social integration and women’s decision-making power, evidence of these effects was limited in the RCTs.
• Households in PSP villages are significantly more likely to get involved in community activism.
30 Interested readers should refer to pages 118–120 of the “Saving for Change” final report (BARA and IPA 2013) for a discussion of these findings within the context of BARA’s qualitative research.

37
7. Are Savings Group members more resilient in the face of shocks? Based on research over the past few years, there is disagreement about the impact that access to financial services can have in terms of increasing income and poverty reduction. However, there is general agreement that financial access is helpful in terms of alleviating the daily challenges faced by the poor. In other words, having access to savings tools, credit, and insurance can make the poor more resilient to the shocks and challenges that they are certain to face.
USAID defines resilience as “the ability of people, households, communities, countries, and systems to mitigate, adapt to and recover from shocks and stresses in a manner that reduces chronic vulnerability and facilitates inclusive growth.”31 In the case of SGs, this is most relevant at the individual and household level. The RCTs did not collect indicators explicitly aimed at measuring resilience, nor did the analyses compile an index examining the issue. Therefore, a discussion about how SGs contribute to resilience relies on indicators already discussed in previous sections of this paper. Access to funds in cases of emergencies, the ability to save substantial lump sums, and the availability of credit when it is needed (especially if it is an additional source of funding compared to previous sources) all contribute to resilience at the individual and household levels. An increase in asset ownership can contribute as well, although in a less direct way. Since Malians often sell livestock to acquire cash to cover expenses (in effect, using the livestock as savings), the OA/FFH findings of increased livestock holdings can be interpreted as engaging in a risk mitigation strategy and therefore contributing to household resiliency. The evidence from all seven RCTs shows that SG participation increases total savings without reducing consumption and that members actively use the credit mechanism. Taken together, this expansion of financial access suggests that members should be more resilient.
To assess whether members are more resilient, one important indicator is the increase in food security that was observed across several studies. The fact that SG availability contributes to food security suggests that participation makes members and communities less vulnerable to shocks. In addition, the CARE studies and the OA/FFH study included some investigation of how households manage shocks. Overall, the CARE evaluations found that households in treatment areas were more likely than households in control areas to take an SG loan in response to a shock (5.5 percent of treatment households reported doing this versus 3.9 percent of control households). On the other hand, there was no difference in the likelihood that a household would sell a significant asset to mitigate a shock; about 27 percent of households in both the treatment and the control groups employed this strategy (IPA 2012). The OA/FFH study found that treatment households were slightly more likely to report taking an SG loan to respond to a shock (1 percent treatment versus 0 percent control). This study also found that treatment households were 2 percentage points (6 percent versus 8 percent) less likely to migrate in response to a shock, though it is unclear whether this is an improvement for SG participants (more stability) or whether having assets committed to an SG makes migration a less viable coping strategy.
Main conclusions:
• Based on increased access to financial services, there is reason to believe that SG membership increases individual and household resilience.
• Increased food security in treatment areas demonstrates evidence of increased resilience.
• While use of SG loans for shock mitigation increased, this response was minor relative to more extreme responses like asset liquidation and migration. Although migration was less likely in treatment areas, there was no difference observed in the likelihood that a household would sell a significant asset.
31 http://www.usaid.gov/resilience.
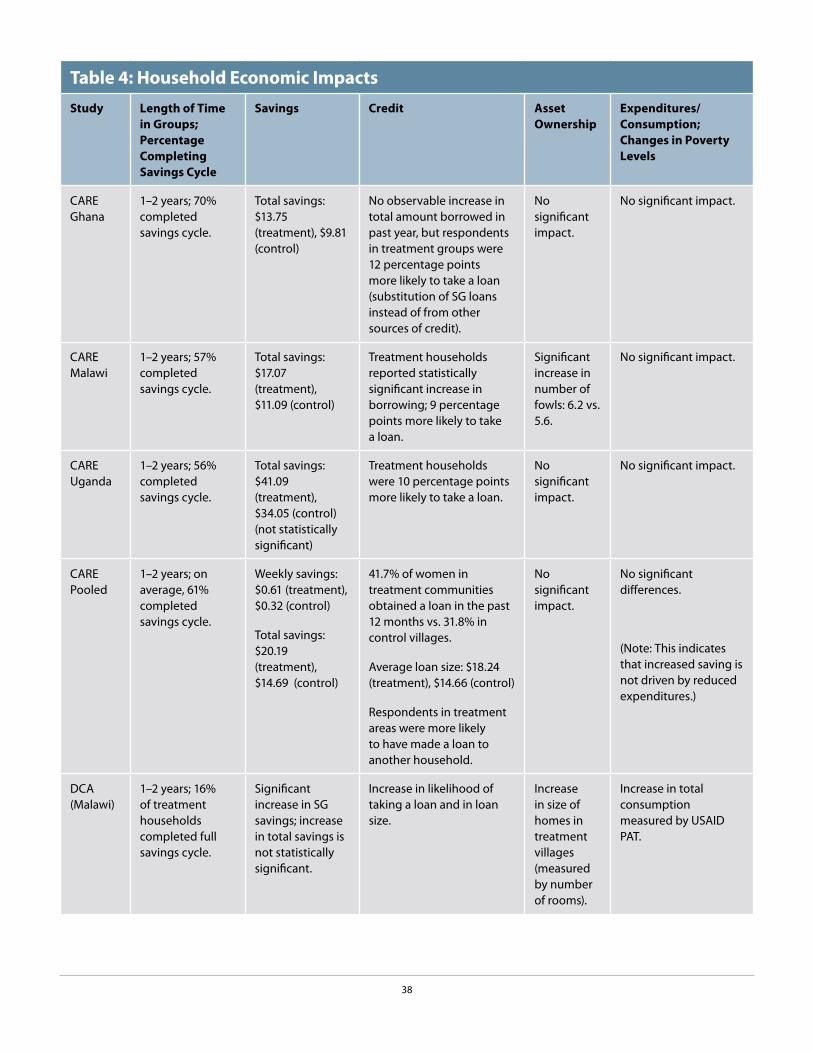
38
Table 4: Household Economic ImpactsStudy Length of Time
in Groups; Percentage Completing Savings Cycle
Savings Credit Asset Ownership
Expenditures/ Consumption; Changes in Poverty Levels
CARE Ghana
1–2 years; 70% completed savings cycle.
Total savings: $13.75 (treatment), $9.81 (control)
No observable increase in total amount borrowed in past year, but respondents in treatment groups were 12 percentage points more likely to take a loan (substitution of SG loans instead of from other sources of credit).
No significant impact.
No significant impact.
CARE Malawi
1–2 years; 57% completed savings cycle.
Total savings: $17.07 (treatment), $11.09 (control)
Treatment households reported statistically significant increase in borrowing; 9 percentage points more likely to take a loan.
Significant increase in number of fowls: 6.2 vs. 5.6.
No significant impact.
CARE Uganda
1–2 years; 56% completed savings cycle.
Total savings: $41.09 (treatment), $34.05 (control) (not statistically significant)
Treatment households were 10 percentage points more likely to take a loan.
No significant impact.
No significant impact.
CARE Pooled
1–2 years; on average, 61% completed savings cycle.
Weekly savings: $0.61 (treatment), $0.32 (control)
Total savings: $20.19 (treatment), $14.69 (control)
41.7% of women in treatment communities obtained a loan in the past 12 months vs. 31.8% in control villages.
Average loan size: $18.24 (treatment), $14.66 (control)
Respondents in treatment areas were more likely to have made a loan to another household.
No significant impact.
No significant differences.
(Note: This indicates that increased saving is not driven by reduced expenditures.)
DCA (Malawi)
1–2 years; 16% of treatment households completed full savings cycle.
Significant increase in SG savings; increase in total savings is not statistically significant.
Increase in likelihood of taking a loan and in loan size.
Increase in size of homes in treatment villages (measured by number of rooms).
Increase in total consumption measured by USAID PAT.

39
Table 4: Household Economic ImpactsStudy Length of Time
in Groups; Percentage Completing Savings Cycle
Savings Credit Asset Ownership
Expenditures/ Consumption; Changes in Poverty Levels
OA/FFH (Mali)
1–3 years; overall, 22% completed full savings cycle (although of groups created in first 2 years, 77% completed one).
Overall savings in treatment villages higher than in control villages; savings in treatment villages increased over the course of the study.
59% of women in treatment group vs. 56% of women in control group reported taking a loan in past 12 months; women in treatment villages were 12% more likely to borrow from an SG and 4% less likely to borrow from family/friends.
Value of household livestock holdings 13% ($120) higher in treatment versus control areas.
No significant differences in total expenditures on non-food items. Suggestive evidence of a modest increase in PPI scores for treatment group (a smaller percentage of treatment households may live under the $1.25/day PPP line).
CRS (Kenya, Uganda, Tanzania)
1.5 years; N/A PSP vs. FA format did not affect total savings; PSP-supported respondents were more likely to save for business purposes.
PSP-supported respondents took on more credit than their FA-supported counterparts.
No major differences observed; some small differences in favor of FA-supported households.
Slightly higher consumption and expenditures in PSP-supported villages; not statistically significant.
IRC (Burundi)
11 months to 2 years, with mid-term and end line surveys; N/A
Not studied. Not studied. Large differences observed across a variety of assets; treatment group had higher asset holdings in most categories.
Significant net difference in mean per capita consumption expenditures of $7 in treatment relative to control group, estimated at a 23% increase in consumption per capita.
Net impact of a 14 percentage point reduction of poverty rates (at $1.25 PPP poverty line).

40
Table 5: Business ImpactsStudy Length of Time in
Groups; Percentage Completing Savings Cycle
Likelihood of Taking a Loan for Business Purposes
Business Ownership
Business Profits
CARE Ghana 1–2 years; 70% completed savings cycle.
16% in treatment areas vs. 8% in control areas.
Small but statistically insignificant positive difference.
No significant difference.
CARE Malawi 1–2 years; 57% completed savings cycle.
22% in treatment areas vs. 8% in control areas
Small but statistically insignificant positive difference.
No significant difference.
CARE Uganda 1–2 years; 56% completed savings cycle.
14% in treatment areas vs. 8% in control areas.
2.7 percentage point positive difference; statistically significant.
Yearly business profits $12.1 higher in treatment areas.
CARE Pooled 1–2 years; on average, 61% completed savings cycle.
17.4% in treatment areas vs. 8% in control areas.
20.2% in treatment areas, 18.3% in control areas (small but statistically significant).
$25 in treatment villages vs. $19.64 in control villages.
DCA (Malawi) 1–2 years; 16% of treatment households completed full savings cycle.
Suggestive increase in the likelihood of taking a loan for business purposes.
Statistically significant decrease in the number of IGAs in treatment households.
No significant differences.
OA/FFH (Mali) 1–3 years; overall, 22% completed full savings cycle (although of groups created in first 2 years, 77% completed one).
42% of women reported using an SG loan for business purposes (not compared to control group).
No significant differences.
No significant differences.
CRS (Kenya, Uganda, Tanzania)
1.5 years; N/A PSP-supported households showed slightly higher levels of business-related spending than FA-supported households.
PSP-supported households were significantly more likely to own a business than FA-supported households.
Not studied.
IRC (Burundi) 11 months to 2 years, with mid-term and end line surveys; N/A
Not studied. Not studied. Not studied.

41
Table 6: Health and Educational ImpactsStudy Length of Time
in Groups; Percentage Completing Savings Cycle
Health Education Food Security and Food Expenditures
CARE Ghana 1–2 years; 70% completed savings cycle.
Small but significant increase in use of loans from SGs to finance health expenditures.
Suggestive evidence of increase in primary enrollments. Small but significant increase in use of loans from SGs to finance education expenditures.
No significant Impact.
CARE Malawi 1–2 years; 57% completed savings cycle.
No significant impact. No significant impact. No significant impact.
CARE Uganda 1–2 years; 56% completed savings cycle.
Increased use of SG financial services to fund health expenditures.
SG members were less likely to use savings or sell an asset to fund health expenses.
Increased use of loans from SGs to finance education expenditures.
Suggestive evidence of decrease in chance that an adult reduced food intake.
CARE Pooled 1–2 years; on average, 61% completed savings cycle.
Increased use of SG financial services to fund health expenditures.
Suggestive evidence that SG members were less likely to sell an asset to fund health expenses.
SG services were used to fund education expenses. Suggestive evidence of increased primary school enrollments.
No significant impact.
DCA (Malawi) 1–2 years; 16% of treatment households completed full savings cycle.
Not studied. Not studied. Treatment village households consumed on average 0.13 more meals per day than control households.

42
Table 6: Health and Educational ImpactsStudy Length of Time
in Groups; Percentage Completing Savings Cycle
Health Education Food Security and Food Expenditures
OA/FFH (Mali) 1–3 years; overall, 22% completed full savings cycle (although of groups created in first 2 years, 77% completed one).
No significant differences in health expenditures.
No changes observed in school enrollment; slight increase in education spending in treatment villages (8%, suggestive).
Food insecurity was significantly lower in treatment villages.
Suggestive evidence of increase (about 3%) in total food consumption per adult in treatment villages.
Households in treatment villages spent an additional 39 cents per adult per week on food during the lean season.
CRS (Kenya, Uganda, Tanzania)
1.5 years; N/A N/A No significant differences in attendance between PSP- and FA-supported households; PSP-supported households were more likely to report inability to pay fees when absences did occur.
PSP-supported households were less food secure (by two measures) than FA-supported households.
IRC (Burundi) 11 months to 2 years, with mid-term and end line surveys; N/A
At mid-term, decrease in spending on children’s health care for all groups, with significantly larger decrease for VLSA and VSLA+ participants.
At mid-term, increase in spending on children’s education for all groups, with significantly larger increase for VSLA participants.
At mid-term, suggestive evidence of positive difference of $4.7 in food expenditures.

43
Table 7: Social Impacts (Social Capital and Women’s Empowerment) Study Length of Time in
Groups; Percentage Completing Savings Cycle
Social Capital (Community Engagement and Social Networks)
Women’s Empowerment (Female Decision-making Power)
CARE Ghana 1–2 years; 70% completed savings cycle.
No significant impact measured.
No significant impact.
CARE Malawi 1–2 years; 57% completed savings cycle.
No significant impact measured.
Significant increase in an index of measures of decision-making power, including influence on business decisions.
CARE Uganda 1–2 years; 56% completed savings cycle.
No significant impact measured.
Significant increase in women’s influence on business decisions.
CARE Pooled 1–2 years; on average, 61% completed savings cycle.
No significant impact measured.
Significant increase in an index of measures of decision-making power.
DCA (Malawi) 1–2 years; 16% of treatment households completed full savings cycle.
N/A N/A
OA/FFH (Mali) 1–3 years; overall, 22% completed full savings cycle (although of groups created in first 2 years, 77% completed one).
No significant impacts observed in the quantitative study.
No significant impacts observed in the RCT.
CRS (Kenya, Uganda, Tanzania)
1.5 years; N/A PSP-supported households were significantly more likely to be involved in community activism and to question neighbors and village leaders.
N/A
IRC (Burundi) 11 months to 2 years, with mid-term and end line surveys; N/A
Not studied. Not studied.

44
8. Is the CRS fee-for-service model viable? The CRS study, which compared its PSP to the FA delivery channel model, yielded important insights into the question of whether fee-for-service models are viable. The conclusion is that they are not only viable, but successful—the groups formed by PSPs outperformed those of the FAs on a variety of measures.
In the CRS fee-for-service model, FAs responsible for forming and supporting SGs are recruited and paid by the project for up to one year. They then undergo a certification process to become PSPs, after which they offer SG facilitation services to communities on a long-term, fee-for-service basis (Ferguson 2012a–e). CRS’s evaluation of the PSP model allowed for experimentation with different delivery channels not only as a means of increasing the outreach of SGs, but also as part of the search for a sustainable model to help cover costs. The study explored three main areas in terms of operational outcomes: group performance, agent productivity, and agent earnings. Outcomes from three countries—Kenya, Uganda, and Tanzania—were compared.
Regarding group performance, CRS found that PSP-supported groups outperformed FA-supported groups on key financial measures, including individual members’ savings levels (both individual balances and per-week contributions), member assets, and group assets (Ferguson 2012c). The CRS report pointed out that members of PSP-supported groups took significantly larger loans on average and received greater returns, as measured via the Return on Savings (ROS) and Annualized Return on Assets (AROA) metrics32 (Ferguson 2012c). PSP-supported groups outperformed FA-supported groups on membership growth rates (not overall numbers of groups), but had comparable results for dropout and gender composition (Ferguson 2013). Also, PSP-supported groups had more members per group on average, driven by the Kenya outcomes, and membership grew faster within the cycle. The poverty level of members was similar in both PSP-supported and FA-supported groups, with averages of 34 percent of members falling below the national poverty line in Uganda, 41 percent in Kenya, and 66 percent in Tanzania.
With regard to productivity in terms of average number of members and groups mobilized per month, the FAs outperformed the PSPs. The difference between FA and PSP productivity was most narrow in Kenya, with FAs mobilizing 13 percent more members per month and 16 percent more groups per month than the PSPs. Tanzania followed, with FAs recruiting 32 percent more members and 35 percent more groups. FAs in Uganda recruited 64 percent more members and 66 percent more groups per month. The gaps in mobilization did not narrow over time. However, the study found great variation in productivity among PSPs, with some agents mobilizing more members and groups than others (Ferguson 2012c).
Regarding earnings, CRS found that the incomes of PSPs varied widely among the three countries. Earnings were reported in terms of the mean and median monthly earnings for a PSP and the average group payment to the PSP. The final quarter results showed average earnings for Kenya PSPs at $103/month, Uganda PSPs at $36/month, and Tanzania PSPs at $17/month. While some PSPs made a significant amount of money, others made little or none. The PSP non-earners comprised a significant group; 38 percent in Uganda, 27 percent in Kenya, and 15 percent in Tanzania reported no earnings. The CRS report pointed out that the average earnings of the PSPs did not correlate with the depth of poverty in each country. For example, the Kenyan program reached the highest percentage of very poor of the three programs (41 percent), but the average earnings for PSPs was the highest reported, not the lowest (Ferguson 2012d).
32 ROS is defined as net profit divided by savings. AROA is defined as total profits divided by total assets, annualized. See http://thesavix.org for more information.

45
Why Are Some PSPs More Successful Than Others?
CRS identified the finding about variability in PSP performance (earnings and productivity) as a critical programmatic aspect to address before further expansion of the program. The high variability has led CRS to rethink not only agent recruitment (profiling), but also the targets and remuneration for agents prior to their certification (to better mimic how they will earn as PSPs) and the group formation strategy to promote “seeding” of demonstration groups. Ensuring a smooth and upward trajectory from FA to PSP status is key to the delivery channel model’s success.
Main conclusions:
• PSP groups outperform FA groups on key financial measures and member growth rates.
• Individual PSP productivity and earnings vary greatly.
• The poverty level of members in both PSP and FA groups are similar.
• The PSP model is viable and can be very successful.
9. What are the relative merits of the structured and organic replication strategies of the OA/FFH model? Replication is one of the most appealing aspects of the SG methodology as a development intervention. Because of their minimal infrastructure requirements, new groups can form easily, allowing programs to grow rapidly. For instance, in the OA/FFH program from 2005–2012, 60 percent of the 19,000 groups were formed by replicators. In a 2007 study of a CARE program in Zanzibar, membership increased by 258 percent in the four years after CARE left (Anyango et al. 2007).
There are different forms of replication with differences among various NGOs, but the two main models outside of fully funded NGO field agents are spontaneous (or organic) replication and the village agent model. In spontaneous replication, the program is introduced in a community by an NGO and someone in the group can start additional groups by teaching the methodology to others, without formal support from the NGO. In the village agent model, NGOs train and certify volunteers who are then recognized as formal replicators. Whether this person is paid depends on the program. While the OA/FFH program does not suggest payment of trained replicators by community members, the CRS fee-for-service model does. The length and depth of training of the village agent vary per program. Although there are several types of replication, the RCTs looked only at the OA/FFH structured model and the CRS PSP model (outcomes from the latter are explored in the prior section).
In addition to examining the impacts of SGs on its participants, the OA/FFH RCT tested the relative merits of its structured and organic replication strategies (BARA and IPA 2013). Structured replication is somewhat like a village agent model, in which volunteers receive three days of training, a pictorial guide, and a certificate. Organic replicators are spontaneous replicators and receive no formal training, no pictorial guide, and no certificate. Paid NGO field agents provide advice to replicators in both the structured and the organic replication approaches. The study aimed to test if the cost of providing the training and support to a volunteer resulted in greater outreach and program impact than organic replication.
The OA/FFH study showed that significantly more women joined SGs in villages with structured replicators (40 versus 32 percent). Households in villages where structured replicators started groups had less food insecurity (45 versus 50 percent); held $61 more in livestock; scored higher, on average, on the Progress Out of Poverty Index (had less poverty);

46
and had better housing. There were better behavior outcomes for malaria education; more pregnant women in the past two years took drugs to prevent malaria (85 versus 79 percent). Volunteer replicators can be formally trained and supplied with a pictorial guide for as little as $40 per replicator. With an assumption of reaching 100 members (or 4 groups of 25 each), the cost of structured replication is as low as 40 cents per household. The clear conclusion is that structured replication is a cost-effective program strategy.
The CRS RCT showed that the PSP delivery channel model is another effective method with a myriad of interesting outcomes. For the sake of not repeating the discussion, readers are directed to the previous section for further details.
Main conclusion:
• Trained replicator programs can be cost-effective and have greater impact than non-trained replicator programs.
10. How effective are additional services delivered through SGs? An emerging trend in SG practice is to link groups to additional development services, or to integrate the services into the weekly meetings of the group. Practitioners are exploring this area of programming both as a way to potentially increase the benefits of SG membership and as a way to extend outreach for existing services. Some services already function as a stand-alone intervention and can be linked to groups, while other services (such as education sessions) have an adapted delivery to fit into weekly SG meetings. Both the OA/FFH and the IRC studies looked at education sessions specifically designed to be delivered to SG members during weekly meetings. These studies examined whether the education was designed effectively enough to increase members’ knowledge and influence behaviors. The findings are as follows.
As described in Section 5, “The Wave of Experimental Research,” the IRC New Generation project compared SGs (with financial education sessions including business, marketing, pricing, and financial planning information) to groups that had SG+ Healing Families and Communities (HFC) discussion sessions. The HFC discussion sessions aimed to increase caregivers’ knowledge of actions to improve their children’s protection, well-being, and development (Annan et al. 2013). They included a wide variety of topics to reach this objective: children’s perspectives and reality, access to health and education, positive discipline and communication, child protection in the family and community, daily life and income use in the household, family budgeting, and pledges to make changes and to share what they learn (Annan et al. 2013).
Outcomes showed that SG participation plus the HFC discussion sessions lead to a positive impact on harsh discipline practices. Participants in the HFC discussion sessions reported 30 percent less use of harsh discipline than those who participated in the SG intervention alone. The greatest differences between participants in the SG and SG+ groups became clear in the following practices: shaking the child; hitting the child with a belt, stick, or other object; calling the child “dumb,” “lazy,” or a similar name; hitting or slapping the child on the hand, arm, or leg; beating up the child, and the belief that children must be physically punished for a good education. Researchers also found an increase in the use of the positive discipline technique of complimenting the child when he or she has done something good. However, there was no impact on parent-child communication, child labor, family functioning, family problems, overall child well-being, or child mental health. Although not part of the baseline and end line questionnaires, a children’s survey conducted after the first project cycle showed an improvement in family problems, children’s well-being, children’s distress, and parent-child communication. The evidence demonstrates that a skills-focused program can improve caregivers’ behaviors toward their children, even in low-resource and conflict-affected settings (Annan et al. 2013).
As part of the OA/FFH study, outcomes measured included knowledge and behavior indicators focused on the malaria education program. As mentioned in Section 5, participants received seven 30-minute sessions on
47
malaria education focused on the prevention, transmission, and treatment of the illness, each delivered during a separate weekly SG meeting. The study found that women in SG villages were more likely to mention mosquitoes as a sole cause of malaria and to correctly identify at least two ways to prevent malaria. Consideration of the entire treatment group showed that there were no significant differences in malaria prevention behaviors. However, in structured replication villages, more women who had been pregnant in the past two years took drugs to prevent malaria (85 versus 79 percent) (BARA and IPA 2013).
Both the IRC and the OA/FFH studies found that the education programs designed to be delivered through SGs were ultimately effective, particularly in terms of spreading knowledge. There are several other questions for the SG field, however, regarding best practices in adding services such as education. For instance, when should additional services be added? To what degree must the group facilitator or management committee endorse or be connected with the implementation of the additional service? How much is “too little” or “too much” of an additional service in order to get desired results, and how can changes in knowledge be translated to changes in behavior? Some of these questions are addressed in the Aga Khan Foundation–funded report “Beyond Financial Services: A Synthesis of Studies on the Integration of Savings Groups and Other Developmental Activities,”33 but with the increased interest in additional services for SGs, more research in this area would be of great value to the field.
Main conclusion:
• Additional services can be designed to be effectively delivered through SGs, but the impact of the additional service likely varies widely, depending on its content and delivery.
33 Rippey and Fowler 2011.

48
Section 7: Reconciling New Findings with Prior Research
One of the key objectives of this paper is to situate new research on SG impacts, especially the seven RCTs, within the broader body of evidence. Comparing the combined RCT results with the earlier evidence,34 it is striking that in many cases the new research findings are quite similar. The comparison shows very few important disagreements or big surprises. How the RCT findings compare to existing evidence with regard to the ten key questions follows.
1. Who joins Savings Groups? Evidence from the RCTs revealed a member profile that was not clearly identified before. Members of SG programs tend to be relatively wealthier and more socially and financially active than non-members, although overall the programs reach the very poor. Marginalized (or less socially integrated) women join later. The findings on take-up rates are also new. With findings reflecting a 22–40 percent take-up rate over 2 to 2.5 years, these rates may be lower than practitioners’ previous estimates.
2. Do Savings Groups reach the very poor in various contexts? The evidence from the RCTs confirmed that SG practitioners are reaching the very poor and that the proportion of participants who are very poor can vary by geographic area. Additionally, the CRS study shows that that FAs and PSPs reach similar levels of the very poor, demonstrating that the very poor can pay for SG services.
3. What are the household economic impacts? The RCT results on household economic impacts are very similar to the results from earlier non-experimental studies that suggested that group participation has positive impacts on savings and credit, and modest impacts on asset ownership. Pre-existing studies did not comment extensively on expenditures and consumption, but the RCTs’ mixed results on these quantities seem to be very much in line with mixed evidence on income in earlier studies.
4. What are the business impacts? Prior research indicated a high likelihood of investment in new and/or existing business of members, including increases in expansion of current businesses, inventory, and creation of new businesses. The collective evidence from the RCTs is mixed. Although there is evidence of increased business-related spending, profits, and the likelihood a woman owns a business in selected studies, these outcomes are not observed in all of the RCTs. Previous studies consistently showed increased business-related spending as well as increases in the number of businesses owned and expansion of existing businesses. This slight disagreement between the RCTs and the pre-existing evidence can plausibly be explained by the limited time horizons of the RCTs, as many of the business outcomes are expected to take some time to appear. It is worth noting that new business ownership and business expansion are not necessarily positive outcomes if they are linked to increased household labor, child labor, and school absenteeism (Gash 2013).
5. What are the health and educational impacts? The mixed and limited impacts on health and education spending and enrollment in the RCTs are similar to mixed and limited evidence from the earlier studies. Numerous earlier studies showed positive outcomes for food security, and some new non-RCT evidence shows positive outcomes,35 although the evidence was not unanimous. Based on the pre-existing evidence, enhanced food security was considered to be a somewhat likely impact of SG participation. Within the RCTs, the evidence is mixed, although there are a number of findings of positive impacts on food security. Again, the RCT evidence seems to be very much in line with the earlier findings.
34 Gash 2013 is the basis for comparison here. It is assumed that Chapter 5, “Pathways to Change: The Impact of Group Participation,” in Savings Groups at the Frontier provides a clear picture of the evidence through 2012.
35 McFadyen 2013. Outcomes from the Save the Children STRIVE project are recent and include positive outcomes in household food security, household and child food diversity, child anthropometric measures, income, assets, and social capital.

49
6. What are the social impacts? Findings on social impacts can be broken into two categories: social capital (community engagement and social networks) and women’s empowerment (decision-making power) within the household. Earlier studies presented an abundance of evidence in the areas of social capital and women’s empowerment. In member surveys, group solidarity was widely mentioned as being a highly valued consequence of group participation. The research found increases in collective activities as well as some increases in women’s participation in community leadership. At the individual level, there was mixed evidence of increased decision-making power for women within the household.
Here, the RCT results differ notably from the earlier research. The CARE evaluations and the OA/FFH evaluation all looked extensively at both social capital and women’s empowerment, and the RCTs found very little impact. Considering additional measurements of these concepts could help further explain their dynamics. Proving to be one of the most surprising and puzzling of the RCTs’ outcomes, it is suggested as an area of further study.
7. Are Savings Groups members more resilient in the face of shocks? Earlier studies suggested that group participation contributed to consumption smoothing over time. In particular, members indicated that they greatly appreciated the availability of credit, especially emergency loans, during times of crisis. Although the studies did not explicitly address the question, findings from the RCTs suggest some impact on resilience. Increased food security among treatment households suggests that shocks may have less catastrophic results for group members. There is evidence that treatment households are more likely to take SG loans to mitigate shocks. Still, the use of these loans is minor compared to other responses, and the effect of SG participation on these other responses is minimal. Overall, the RCT results are in line with earlier studies, though the use of SG loans as a coping strategy is quite low.
8. Is the CRS fee-for-service model viable? Since little-to-no formal research has been done on this question before, the findings are new—and welcomed. The CRS experimentation with its PSP program showed that its fee-for-service model is both possible and successful. Many lessons from its findings can be applied to other experimentations with this delivery channel model.
9. What are the relative merits of the structured and organic replication strategies of the OA/FFH model? Prior research showed that groups can easily and quickly replicate, but lacked a comparison of cost or impact of spontaneous or village agent models of replication.36 The OA/FFH study outcomes show that a simple, three-day training program (with a pictorial guide and certificate) can be cost-effective and have a greater impact than organic (or spontaneous) replicators.
10. How effective are additional services delivered through SGs? Prior evidence suggested that SGs can be a useful platform for supporting other development services, which can be effectively delivered to SG members. Evidence from the IRC and OA/FFH studies further supports this latter claim. The ability of an additional service to have a small or great impact likely depends on its content and delivery.
Looking at the impact questions, we see that the RCT results are actually quite consistent with the results of earlier research. The main divergence is in the area of social impacts, or social capital and women’s empowerment. Here, strong positive effects were expected but not observed in the RCTs. As discussed above, there are several important considerations around these results, and it seems quite plausible that these social impacts exist but were not adequately captured by the RCTs.
Setting this difference in social impacts aside, the consistency of the earlier and new research suggests that despite the limitations faced by the various study designs, the body of evidence tells a fairly congruous story.
36 Note that effective methods for replication (in terms of impact or cost-effectiveness) differ from a discussion about rates of replication (how quickly groups replicate over time and geography).

50
What Are Expected Survival Rates for SGs?
Although the RCTs did not address survival rates of groups directly, it is useful to provide some information from other research on operational sustainability for consideration in assessing SGs as a development intervention. Many practitioners and donors want to know how long groups continue to function after an NGO withdraws formal support. Anecdotal evidence and limited studies suggest that groups may survive for a surprisingly long time. An ongoing study by Hugh Allen of VSL Associates looking at SG MIS data through SAVIX (http://thesavix.org) is comparing outcomes for a sample of 331 groups implemented under CARE, CRS, and Oxfam. The data look at groups across six countries—Cambodia, Kenya, Malawi, Mali, Tanzania, and Uganda—over a five-year period, from 2010–2014. Early outcomes show that 92 percent of the 331 groups have remained active for four years after the end of NGO support. A 2007 study in Zanzibar showed 88 percent of groups surviving four years later (Anyango et al. 2007), and a 2008 study in Nepal showed 64 percent of groups surviving after eight years (Valley Research Group and Mayoux 2008). These results seem similar to the VSL Associates outcomes, assuming that rates decline over time. However, a study in Cambodia alone showed a different experience, with 50 percent of groups surviving three to four years after the NGOs withdrew support—improper training of original groups is considered to be a reason for the low survival rate (especially when the same program in Mali has a 90 percent survival rate) (EMC 2012). A key unanswered question is: If groups dissolve, at what rate do members join new groups versus abandon the group methodology altogether? There is little information on this issue, although the SAVIX study is showing that about half of dissolved groups have amalgamated with others, and the Cambodia study showed that as much as 27 percent of Pact’s groups had dissolved at one point and had re-formed as a new group (EMC 2012). It would be beneficial if future sustainability studies collected information on this aspect of membership. Many factors affect the survival of a group; they range from the quality of internal management, acceptance and appreciation of the methodology in the community, and competing available financial services, to the general social and political environment of the community. Although the early evidence is quite promising, there is still a lot to learn about the long-term sustainability of independent groups.
Drawing from both the RCT research and the prior research and expectations, Figure 1 presents an updated generalized TOC for SG impact (at the household level).37 It includes speculation for outcomes for less than one savings cycle to three savings cycles, three to five savings cycles, and five to ten savings cycles, with support from a few studies that looked at older groups.38 It speaks to both the degree of confidence we have in the impacts and the time frame for when they should occur.
37 Updated from generalized TOC in Gash 2013, p. 103.
38 See Valley Research Group and Mayoux 2008; Fleischer Proaño et al. 2010; and Bermudez and Matuszeski 2010.

51
Figure 1: Updated Generalized Theory of Change for Savings Groups
Less than 1 savings cycle to 3 savings cycles
• Increased savings and credit• Increased asset ownership• Increased expenditures• Increased business investment• Increased business profits• Increased social capital• Increased women’s decision-making power • Increased community leadership roles
• Increased activism• Increased primary school enrollment and
education spending• Increased food security • Increased resilience• Ability of program to include the very
poor• Ability to see various outcomes for
additional services
3 to 5 savings cycles
• Increased savings and credit• Increased asset ownership (household
and agricultural)• Increased expenditures• Increased business investment, number
of businesses• Business expansion• Increased business profits• Increased social capital• Increased women’s decision-making
power for business and home
• Increased community leadership roles• Increased activism, collective activities• Increased primary school enrollment
and education spending• Better health and nutrition• Increased food security• Increased resilience• Ability of program to include higher
percentage of the very poor and socially marginalized
• Ability to see various outcomes for additional services
5 to 10 savings cycles
• Increased savings and credit• Increased asset ownership (household
and agricultural)• Increased expenditures• Increased business investment, number
of businesses• Business expansion• Increased business profits• Increased social capital, more extensive
social network• Increased women’s decision-making
power for business and home
• Increased community leadership roles• Increased activism, collective activities• Increased primary school enrollment
and education spending • Better health and nutrition • Increased food security, larger stocks of
food• Increased resilience• Ability of program to include higher
percentage of the very poor and socially marginalized
• Ability to see various outcomes for additional services
Time Frame for Outcomes at the Household Level
Savings Group +Possible Additional Service
Chart Key: Boldfaced outcomes indicate strong evidence; supporting evidence was found in multiple RCTs and several other areas of prior research.
Italicized outcomes reflect weaker evidence, found in one RCT (mixed outcomes) or a few non-experimental studies.
Underlined outcomes are not yet supported by any solid evidence.

52
Section 8: Putting the Research to Work
Ultimately, program evaluation research in economic development serves several purposes: answering academic questions, assuring the effective deployment of scarce funds, and, perhaps most importantly, feeding back to practitioners in the field about whether programs are working as expected and how to make them better. One of the two main objectives of this paper is to outline the ways that the SG community is using the recent research to inform and improve its programming. Conversations with SG practitioners have demonstrated that the current wave of RCT research has provided a vast amount of information that has been or will be incorporated into practice. In addition, practitioners have identified challenges and shortcomings of the studies in terms of providing guidance and direction for future work.
The combined results of the RCTs and other research provide a number of concrete findings that will be of use to the entire SG community going forward. The studies found numerous positive impacts. There is extensive evidence that SG programs promote savings and the use of credit. In addition, the evidence so far suggests that SGs create a flexible safety net for participants and build household resiliency. In terms of reaching the targeted audience, the evidence shows that SGs can reach high numbers of the very poor and can be especially beneficial economically to vulnerable populations. Based on the CRS study, there is good evidence that the market-based model works and has some advantages over the standard model. There is evidence that providing some structured support for group replication is a cost-effective way to improve the performance of replicated groups relative to organic (or spontaneous) replication. Finally, these studies show that SGs have been effective as a method for providing linked services; OA/FFH’s malaria education program and IRC’s family-based discussion program both increased awareness of these services.
This group of studies presents a number of opportunities for improvement and refinement of SG programming. Most notably, the collected findings of limited or no evidence of impacts on business, health, and education outcomes surprised the practitioner community, given their field experiences. Many practitioners who contributed to this paper suggested that these findings present a challenge to increase measurable impact in these areas. In response, they are considering adding related services to SGs that more directly target desired outcomes.
Along with the practice-oriented outcomes discussed above, this synthesis offers a number of important lessons about SG evaluation. Numerous practitioners commented on the fact that while RCTs can demonstrate impact, the studies surveyed in this paper did not shed light on why certain impacts occur. When a study finds unexpected results, there is often a lack of information about how and why these results arise. For this reason, one recommendation suggested that qualitative research should follow any quantitative study; the qualitative work can explore questions generated about the processes underlying the quantitative findings.
Several practitioners, especially those involved with the implementation of their organizations’ RCTs, noted that going forward it is not practical to study all research questions with RCTs; more important questions should be prioritized. RCTs are not only financially expensive, but costly in terms of the time and energy required of practitioners and the communities being studied. Nearly everyone agreed on the importance of rigorous evaluation research being used strategically and emphasized that organizations should be open to getting results that may initially seem “disappointing,” as these can be very helpful for refining and improving programs. Several practitioners stressed that there are other evaluation methodologies, in addition to RCTs, that qualify as “rigorous.”
Some practitioners argued that in order to improve SG programs, future program evaluations should contain questions that will lead to actionable results for program operations (such as questions comparing replication strategies or inquiring about additional services). General impact questions (such as whether the program increased consumption expenditures or decreased poverty rates) are important but may not translate into program improvements.

53
Timing issues also must be considered as evaluations are designed. In many cases, the impacts of SGs are expected to appear after at least one full cycle (through a share-out) has been completed, and there is some evidence that the strongest effects occur well into the second cycle. This group of RCTs, however, evaluated impacts where many groups had not completed even one full cycle, and control groups still showed substantial contamination. With the intention of better understanding program impacts over a longer time period, CARE advocates and is building monitoring strategies with longer study periods that monitor actual SG program participants and their households for two or more cycles.
Finally, there was broad consensus about the importance of sharing evaluation results across organizations in the field. Sharing evaluation results, good and bad, broadens the base of knowledge for everyone, so transparency is strongly advocated. Evaluation results should be shared with the local NGOs that implemented the program as well as local researchers, to ensure local use of the findings. This is another way that practitioners emphasized the importance of research that can be converted into action and program improvements in the field.
In addition to these general outcomes, practitioners shared a number of concrete, program-specific responses to the RCT research. A selection of these responses is included in the list below.
• The CRS study aimed to answer the question of whether the Private Service Provider delivery channel model, in which groups pay the facilitator, would work better or at least as well as their original Field Agent model, in which facilitators receive a stipend from CRS. The RCT demonstrated that the PSP model was viable, and based on these findings, CRS is proceeding with the global roll-out of the PSP program.
• The high variability in PSP performance (earnings and productivity) has led CRS to rethink agent recruitment (profiling), the targets and remuneration for agents prior to their certification (to better mimic how they will earn as PSPs), and the group formation strategy to promote “seeding” of demonstration groups.
• In response to the limited impact findings on women’s empowerment, CARE undertook a process in early 2013 to design a gender-based SG manual that incorporates key programming principles and techniques to purposefully foster gender empowerment among SG members. This manual is being rolled out across key countries.
• Although the findings of the OA/FFH study showed that more vulnerable women tend to join SGs in the second wave (six months later, on average), Oxfam America will not modify the way members self-select into groups as the organization is confident that SGs reach the very poor, even if they are not the first to join.
• OA/FFH found good evidence that their structured replication model was effective at improving group performance; based on this finding, the SG program will include the structured replication component in the future.
• Freedom from Hunger and Oxfam America are using the results of their study to adjust their TOC for SGs.
• Based on the finding that the linked program on malaria education increased knowledge about malaria but did not change behaviors, Freedom from Hunger is rethinking this program and considering an approach that is broader and more integrated in scope.
• Based on the outcomes of the International Rescue Committee’s study, the organization has made several adjustments to the curriculum of the family-based discussion program, such as including direct caregiver-child interaction, providing handouts to participants, and encouraging parent support groups.
• All facilitating agencies that engaged in a RCT are continuing their SG programs and trying to expand them.

54
Section 9: Conclusion
This synthesis of recent research on SGs has presented clear evidence that there are positive impacts for participants of SGs. Positive impacts come across in various lengths of participation, in various countries, and for various program components. The significance of the CARE, OA/FFH, and DCA studies in particular can be likened to the significance of the 2009 studies on microcredit in India and the Philippines,39 where they serve as the first RCTs demonstrating impacts confidently attributed to the program. The CRS study is the first RCT, and first large-scale study, to show the viability of fee-for-service programs, and the IRC’s New Generation RCT is the first widely publicized study to show impacts of an educational discussion series in a post-conflict setting. The RCT studies satisfy a desire for evidence on the effects of SG programs on a number of important outcomes, and they contribute significant additional information to the body of evidence on SGs.
Discussions with practitioners about the outcomes demonstrate that lessons from the studies are already being applied to future programming. Areas with less robust outcomes are now seen as opportunities to enhance SG programs through adaptations to programming or the addition of other development services. All of the practitioners involved in the studies are continuing and expanding SG services, but now in smarter ways and with more accurate expectations for impact. As practitioners put these findings to good use, this paper will hopefully assist stakeholders in the wider development community to understand the importance and value of SGs and ultimately support their growth.
39 Bauchet et al. 2011.

55
REFERENCES
Annan, J., M. Armstrong, and T. Bundervoet (2011). “Urwaruka Rushasha(New Generation): A Randomized Impact Evaluation of Village Savings and Loans Associations and Family-Based Interventions in Burundi.” Evaluation Brief. International Rescue Committee.
Annan, J., T. Bundervoet, J. Seban, and J. Costigan (2013). “Urwaruka Rushasha (New Generation): A Randomized Impact Evaluation of Village Savings and Loans Associations and Family-Based Interventions in Burundi.” Final Evaluation. International Rescue Committee.
Anyango, E., E. Esipisu, L. Opoku, S. Johnson, M. Malkamaki, and C. Musoke (2007). “Village Savings and Loan Associations—Experience from Zanzibar.” Small Enterprise Development Journal 18(1): 11–24.
Bauchet, J., C. Marshall, L. Starita, J. Thomas, and A. Yalouris (2011). “Latest Findings from Randomized Evaluations of Microfinance.” Access to Finance Forum, Reports by CGAP and Its Partners, No. 2. Consultative Group to Assist the Poor.
Bermudez, L., and J. Matuszeski (2010). “Ensuring Continued Success: Saving for Change in Older Program Areas of Mali.” Oxfam America.
Bureau of Applied Research in Anthropology and Innovations for Poverty Action (BARA and IPA). (2013). “Final Impact Evaluation of the Saving for Change Program in Mali, 2009–2012.” The University of Arizona and Innovations for Poverty Action.
Demirguc-Kunt, A., and L. Klapper (2012). “Measuring Financial Inclusion: The Global Findex Database.” World Bank Policy Research Paper 6025.
Emerging Markets Consulting (EMC). (2012). “Sustainability Study of Savings Group Programs in Cambodia for CARE, Oxfam and Pact: Final Report.”
Ferguson, M. (2012a). “SILC Innovations Research Brief 1: Poverty Outreach in Fee-for-Service Savings Groups.” Catholic Relief Services.
Ferguson, M. (2012b). “SILC Innovations Research Brief 2: Agent Productivity in Fee-for-Service Savings Groups.” Catholic Relief Services.
Ferguson, M. (2012c). “SILC Innovations Research Brief 3: Group Performance in Fee-for-Service Savings Groups.” Catholic Relief Services.
Ferguson, M. (2012d). “SILC Innovations Research Brief 4: An Analysis of Agent Earnings in Fee-for-Service Savings Groups.” Catholic Relief Services.
Ferguson, M. (2012e). “SILC Innovations Research Brief 5: An Evaluation of Household Impact Among Fee-for-Service Savings Groups.” Catholic Relief Services.
Ferguson, M. (2013). “Fee-for-Service vs. Project-Paid Savings Groups: Results from an RCT.” Presentation at Savings Group Conference, March 4–5, 2013, Washington, D.C. Catholic Relief Services.
Fleischer Proaño, L., M. Gash, and A. Kuklewicz (2011). “Durability of Savings Group Programmes: A Decade of Experience in Ecuador.” Enterprise Development and Microfinance, 22(2): 147–160. doi: 10.3362/1755-1986.2011.017.

56
Gash, M. (2013). “Pathways to Change: The Impact of Group Participation,” in Savings Groups at the Frontier, ed. Candace Nelson (Rugby, UK: Practical Action Publishing).
Hendricks, L. (2013). “Savings Group Snapshot.” Presentation at Savings Group Conference, March 4–5, 2013, Washington, D.C. Access Africa, CARE USA.
Innovations for Poverty Action (IPA). (2012). “Impact Assessment of Savings Groups: Findings from Three Randomized Evaluations of CARE Village Savings and Loan Association programs in Ghana, Malawi and Uganda: Final Report.”
Karlan, D. and N. Goldberg (2007). “Impact Evaluation for Microfinance: Review of Methodological Issues.” Doing Impact Evaluation No. 7. The World Bank.
Ksoll, C., H. B. Lilleør, H. J.Lønborg, and O. D. Rasmussen, (2013). ”Impact of Village Savings and Loans Associations: Evidence from a Cluster Randomized Trial.” Study Paper No. 56. Rockwool Foundation Research Unit.
Lønborg, H. J., and O. D. Rasmussen (2013). “Can Microfinance Reach the Poorest? Evidence from a Community-Managed Microfinance Intervention.” Study Paper No. 55. Rockwool Foundation Research Unit.
McFadyen, N. (2013). “Economic Strengthening and Child Wellbeing: Understanding and Measuring Outcomes; STRIVE Mozambique Case Study.” Presentation for SEEP: Children, Youth, & Economic Strengthening (CYES) Network, June 6, 2013. Save The Children US.
Rippey, P., and B. Fowler (2011). “Beyond Financial Services: A Synthesis of Studies on the Integration of Savings Groups and Other Developmental Activities.” Aga Khan Foundation.
Valley Research Group and L. Mayoux, (2008). “Women Ending Poverty: The WORTH Program in Nepal—Empowerment Through Literacy, Banking and Business 1999–2007.” Retrieved from http://www.microfinancegateway.org/p/site/m/template.rc/1.9.34360, on June 10, 2013.
Practitioner Interviews Conducted
Baingana, C., M. Kelly, C. O’Connell, M. Staehle, M. and P. Vandermeer. (2013, July 9). Skype group discussion (with Candace Nelson and Nisha Singh).
Chidiac, S. (2013, May 23). Skype interview.
Ferguson, M. (2013, May 2). Telephone interview.
Fleischer Proaño, L. (2013, May 8). Skype interview (with Candace Nelson and Nisha Singh).
Hamadziripi, A. (2013, July). Written communication.
International Rescue Committee (2013, May). Written communication.
Lilleør, H. B. (2013, July). Written communication.
Matuszeski, J. (2013, May 10). Skype interview (with Candace Nelson).
Rasmussen, O. D. (2013, July). Written communication.
Romana, S. (2013, May 22). Skype interview (with Candace Nelson).

57

The SEEP Network 1611 North Kent Street, Suite 610
Arlington, VA 22209Phone: 1 202 534 1400
Fax: 1 703 276 1433Email: [email protected]