the eu’s fiscal crisis and policy - oecd. · pdf filethe eu’s fiscal crisis and...
TRANSCRIPT

The EU’s Fiscal Crisis and Policy
Response: reforming economic
governance in the EU
By Heliodoro Temprano Arroyo
Head of Unit
Neighbourhood Countries – Macro-Financial Assistance
Directorate General for Economic and Financial Affairs
EUROPEAN COMMISSION

Slide 2
Outline
I. Impact of the crisis on fiscal deficits/public debt
II. Medium-term and long-term challenges
III. Exit strategies
IV. What went wrong?
IV. The EU’s response
a) Filling the gaps in the EU’s fiscal framework:
towards a SGP III?
b) Reinforcing economic governance
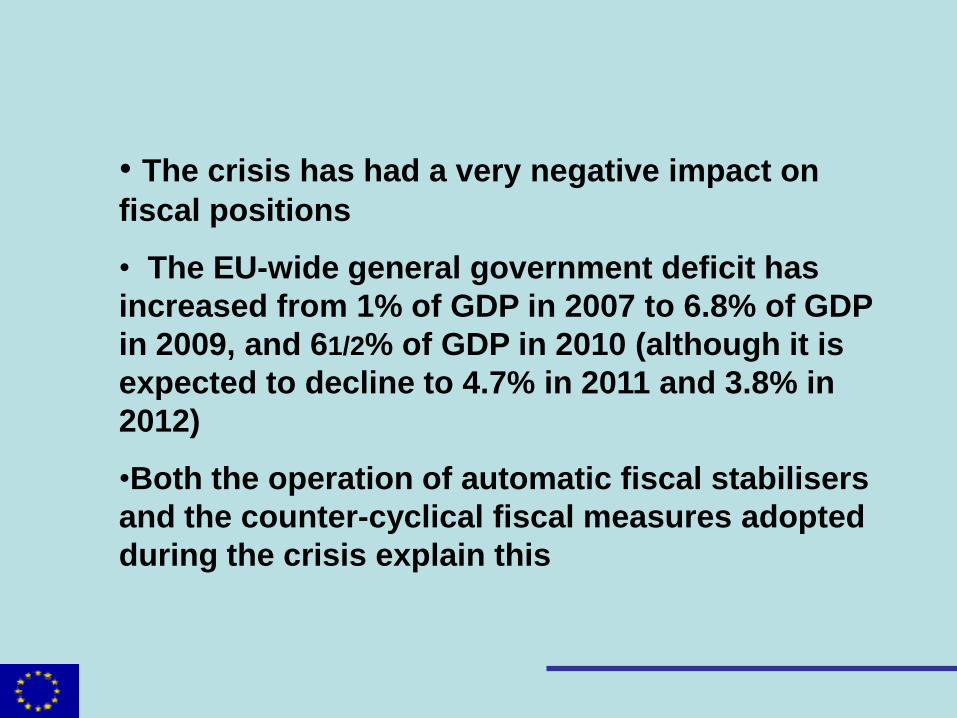
• The crisis has had a very negative impact on
fiscal positions
• The EU-wide general government deficit has
increased from 1% of GDP in 2007 to 6.8% of GDP
in 2009, and 61/2% of GDP in 2010 (although it is
expected to decline to 4.7% in 2011 and 3.8% in
2012)
•Both the operation of automatic fiscal stabilisers
and the counter-cyclical fiscal measures adopted
during the crisis explain this
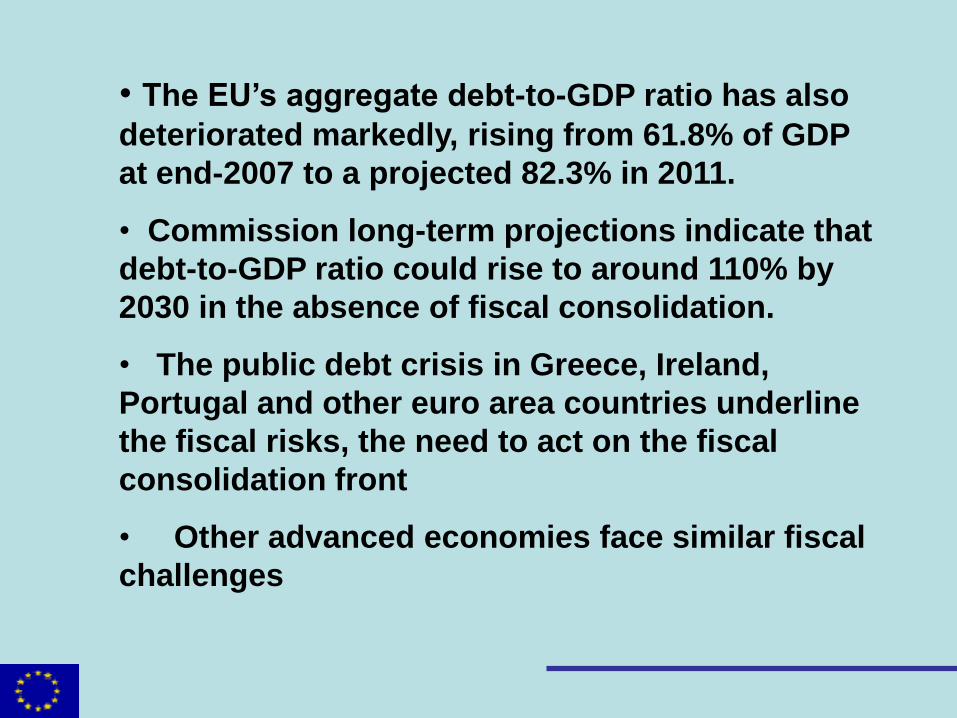
• The EU’s aggregate debt-to-GDP ratio has also
deteriorated markedly, rising from 61.8% of GDP
at end-2007 to a projected 82.3% in 2011.
• Commission long-term projections indicate that
debt-to-GDP ratio could rise to around 110% by
2030 in the absence of fiscal consolidation.
• The public debt crisis in Greece, Ireland,
Portugal and other euro area countries underline
the fiscal risks, the need to act on the fiscal
consolidation front
• Other advanced economies face similar fiscal
challenges

2006 2007 2008 2009 2010 2011
General government balance
EU -1.4 -0.9 -2.4 -6.8 -6.4 -4.7
Euro area -1.4 -0.6 -2.3 -6.8 -6.4 -4.7
USA -2 -2.8 -6.2 -11.2 -11.2 -10
Japan -1.6 -2.4 -2.2 -8.7 -9.3 -9.8
Gross public debt
EU 61.5 58.8 62.3 74.4 80.2 82.3
Euro area 68.4 66 64.8 76.8 82.9 85.2
Source: European Commission's Spring 2011 Forecast
Impact of the Crisis on Fiscal Deficits and Public Debt
(in percent of GDP)
Slide 6
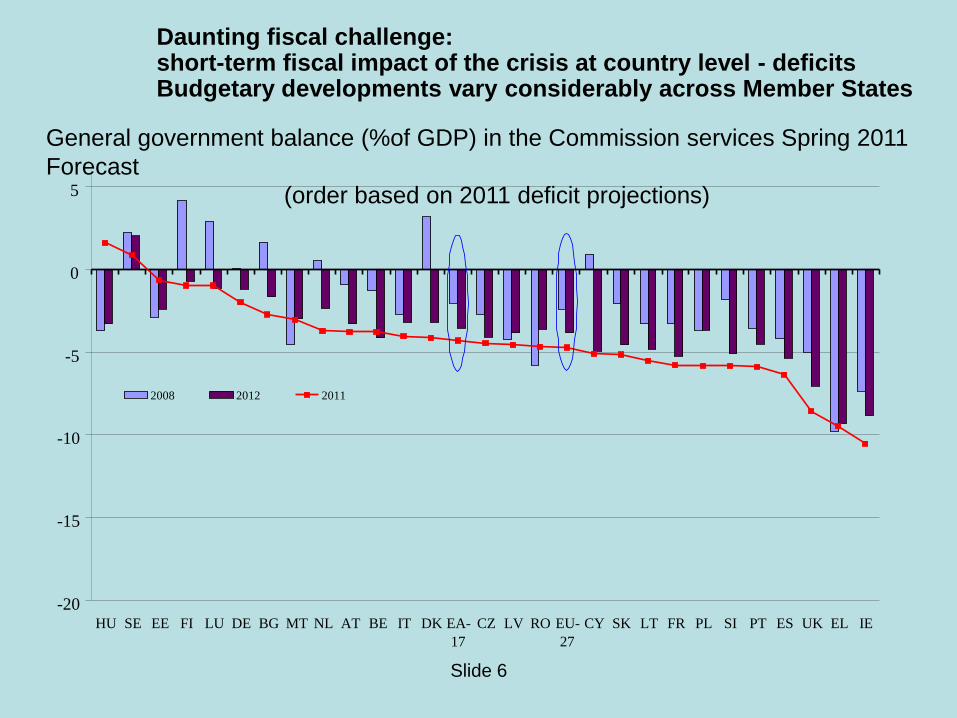
General government balance (%of GDP) in the Commission services Spring 2011
Forecast
(order based on 2011 deficit projections)
Daunting fiscal challenge: short-term fiscal impact of the crisis at country level - deficits Budgetary developments vary considerably across Member States
-20
-15
-10
-5
0
5
HU SE EE FI LU DE BG MT NL AT BE IT DK EA-
17
CZ LV RO EU-
27
CY SK LT FR PL SI PT ES UK EL IE
2008 2012 2011

Slide 7
Short-term fiscal impact of the crisis –
general government debt
0%
20%
40%
60%
80%
100%
120%
140%
160%
180%
EE BG LU RO SE LT CZ SI SK DK LV FI PL CY MT ES HU NL AT DE EU FR UK EA BE PT IE IT EL
% of GDP
2007 2012

8
• The previous slide shows how easy it is to lose
quickly previous achievements in fiscal
consolidation
• See in particular, the 2007-12 deteriorations
projected for Ireland (over 110 pp of GDP!), Greece
(60 pp), Latvia (40 pp), the UK (45 pp), Spain (35 pp)
• Non-complacency and perseverance in fiscal
discipline is the name of the game, particularly if
countries want to build safety margins to respond to
future shocks
European Commission

9
Part of the fiscal deterioration in the EU reflects an
unprecedented policy stimulus to counter the crisis
• Fiscal stimulus overall roughly 5-6% of GDP in 2009
(half of this reflects automatic stabilisers which are large
in EU)
• Measures to stabilise the financial system: resources
potentially committed worth some 30% of GDP, of which
13% of GDP have been implemented, including
recapitalisation measures (1.9%), guarantees (7.7%)
and asset relief (2.8%).
• This is in addition to the monetary policy stimulus
European Commission

Slide 10
EU public interventions in the banking sector
in the form of capital injections
0
5
10
15
20
25
BG CY CZ EE FI HU LT MT PL PT RO SK SI SE ES IT FR EA EU AT DE GR BE LV DK UK NL LU IE
% GDP
Source: Commission; cut off date – October 2010.

Discretionary measures in 2010 relative to 2008: Government support was linked to starting position: larger in countries
with comfortable external and budgetary positions
BG
CZ
DE
IE
EL
ES
CY
LU
HU
NL
PL
PTRO
SI
FI
SE
Support >1.5% of
Support <1.5% of
GDP
Discretionary
tighteningBE DK
EE
FR IT
LVLT
MT
AT
SK
UK
-24
-22
-20
-18
-16
-14
-12
-10
-8
-6
-4
-2
0
2
4
6
8
10
12
14
16
-10 -8 -6 -4 -2 0 2 4 6
Government balance 2008 (% GDP)
Ext
ern
al bala
nce
2008 (
% G
DP)

Slide 12
Daunting fiscal challenge: unsustainable debt trends A recovery in economic growth and tax ratios is not sufficient to bring debt ratios on a
declining path. Ageing adds to sustainability concerns
40
50
60
70
80
90
100
110
120
2007 2008 2009 2010 2011 2012 2013 2014 2015 2016 2017 2018 2019 2020 2021 2022 2023 2024 2025 2026 2027 2028 2029 2030
EU27: long-term debt projections
Scenario 2
(Consolidation 0.5% of GDP)
Scenario 3
(Consolidation 1% of GDP)
Scenario 1
(No consolidation)
% of GDP

Effort (change in primary balance) required to bring the debt ratio below 60% of GDP by 2020
-5
0
5
10
15
20
LU SK SI FI AT MT DE CY NL EA BE IT FR PT ES EL IE
% of GDP
RPB Budgetary effort Slide 13
On average, EU countries would need a primary balance of 4½% of GDP in the medium term in order to reach the 60% threshold, which corresponds to a budgetary effort of almost 9 pp of GDP spread over the years 2011-15
Slide 14
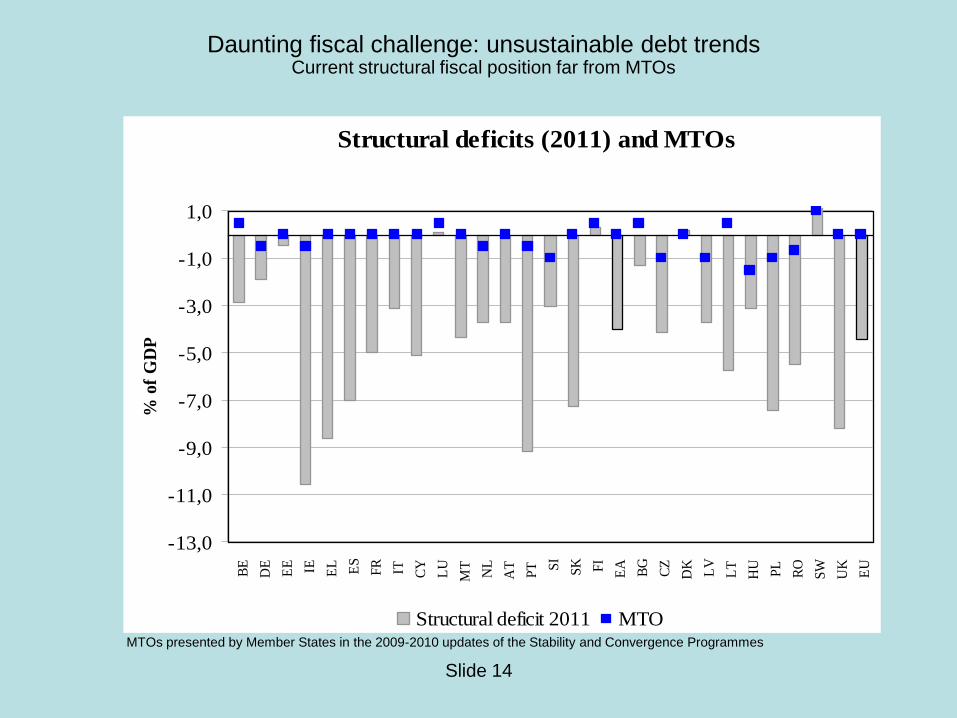
Structural deficits (2011) and MTOs
-13,0
-11,0
-9,0
-7,0
-5,0
-3,0
-1,0
1,0
BE
DE
EE IE EL ES
FR IT CY
LU
MT
NL
AT
PT S
I
SK FI
EA
BG
CZ
DK
LV
LT
HU
PL
RO
SW
UK
EU
% o
f G
DP
Structural deficit 2011 MTOMTOs presented by Member States in the 2009-2010 updates of the Stability and Convergence Programmes
Daunting fiscal challenge: unsustainable debt trends Current structural fiscal position far from MTOs

0
500
1000
1500
2000
2500
07
/20
09
10
/20
09
01
/20
10
04
/20
10
07
/20
10
10
/20
10
01
/20
11
04
/20
11
07
/20
11
France Italy Greece Portugal Spain Ireland Belgium
Spreads of bond yields increased sharply and remain
very wide despite policy response
Spreads (in basis points) of 10-year euro area government bond yields to German Bund
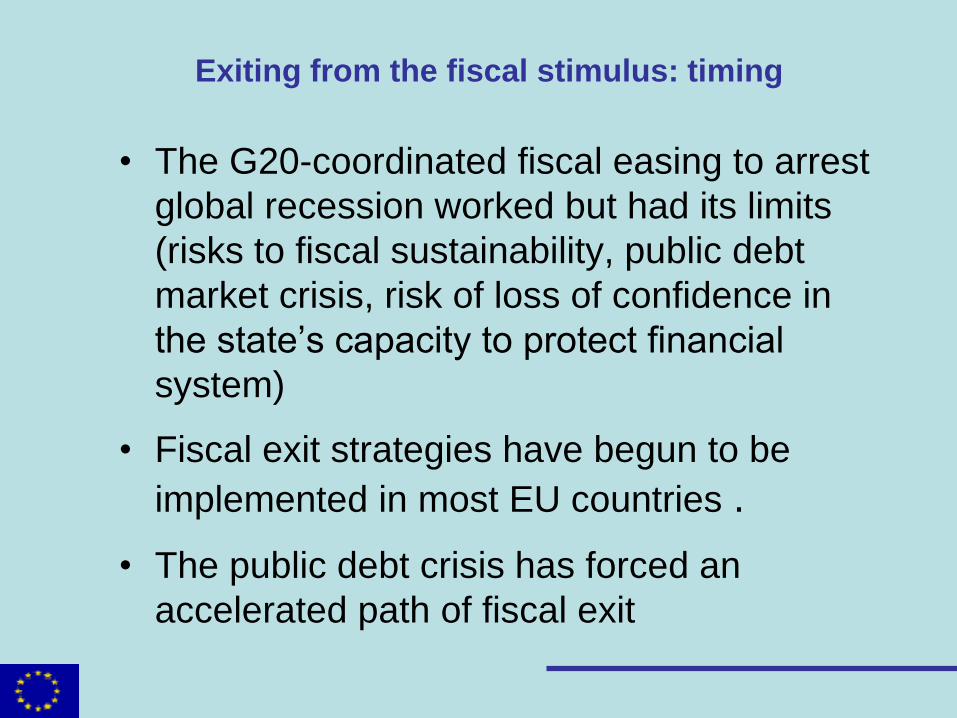
Exiting from the fiscal stimulus: timing
• The G20-coordinated fiscal easing to arrest
global recession worked but had its limits
(risks to fiscal sustainability, public debt
market crisis, risk of loss of confidence in
the state’s capacity to protect financial
system)
• Fiscal exit strategies have begun to be
implemented in most EU countries .
• The public debt crisis has forced an
accelerated path of fiscal exit
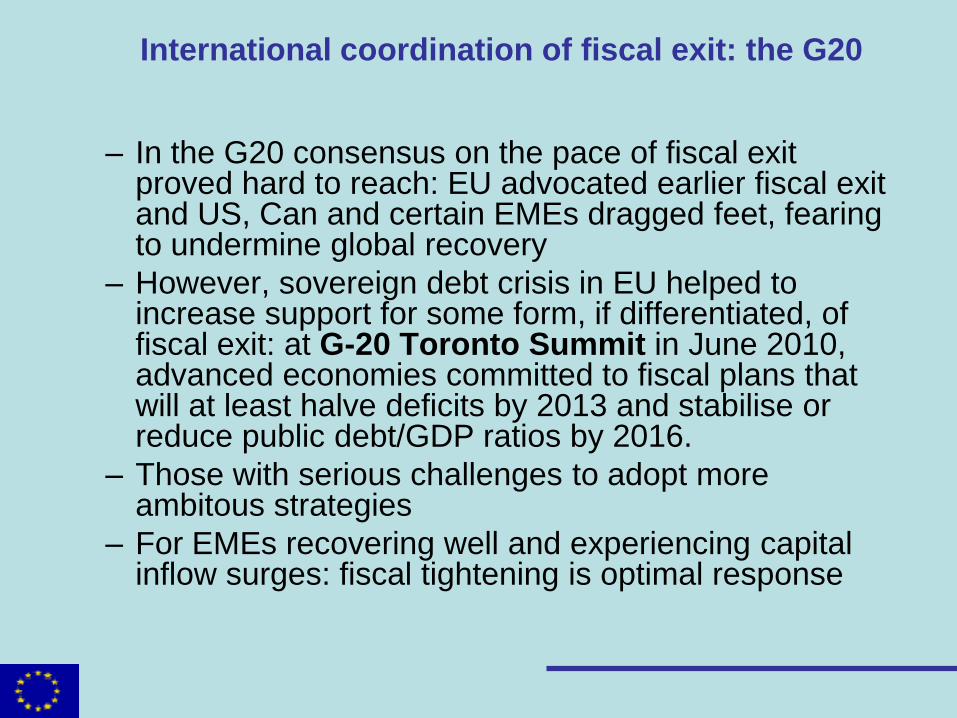
International coordination of fiscal exit: the G20
– In the G20 consensus on the pace of fiscal exit proved hard to reach: EU advocated earlier fiscal exit and US, Can and certain EMEs dragged feet, fearing to undermine global recovery
– However, sovereign debt crisis in EU helped to increase support for some form, if differentiated, of fiscal exit: at G-20 Toronto Summit in June 2010, advanced economies committed to fiscal plans that will at least halve deficits by 2013 and stabilise or reduce public debt/GDP ratios by 2016.
– Those with serious challenges to adopt more ambitous strategies
– For EMEs recovering well and experiencing capital inflow surges: fiscal tightening is optimal response

Slide 18
Short-term fiscal impact of the crisis – Fiscal
stimulus and exit
-8
-6
-4
-2
0
2
4
2001 2002 2003 2004 2005 2006 2007 2008 2009 2010 2011 2012
% GDP
0
10
20
30
40
50
60
70
80
90% GDP
Cyclical component Output Gap (% pot. GDP)
General government debt (rhs) Headline deficit

Ambitious fiscal consolidation efforts
announced by EU countries
• In the context of the public debt crisis, a number of EU
countries have announced extraordinary fiscal adjustment
packages:
• Greece to cut deficit from 13.6% of GDP in 2009 to 3% of GDP
in 2014 as part of bold programme agreed with EU and IMF.
• Ireland to cut deficit from 12.2% of GDP (net of one-off banking
support measures) to 3% of GDP by 2015 as part of EU/IMF
programme
• Portugal to cut deficit from 9.1% of GDP in 2010 to 3% of GDP
by 2013 in context of IMF/EU programme
• Spain is also implementing an ambitious fiscal consolidation
programme. And Italy has just announced new measures forced
by the deterioration in public debt market during the summer.
• Other EU countries have also announced important budget cuts
Slide 20
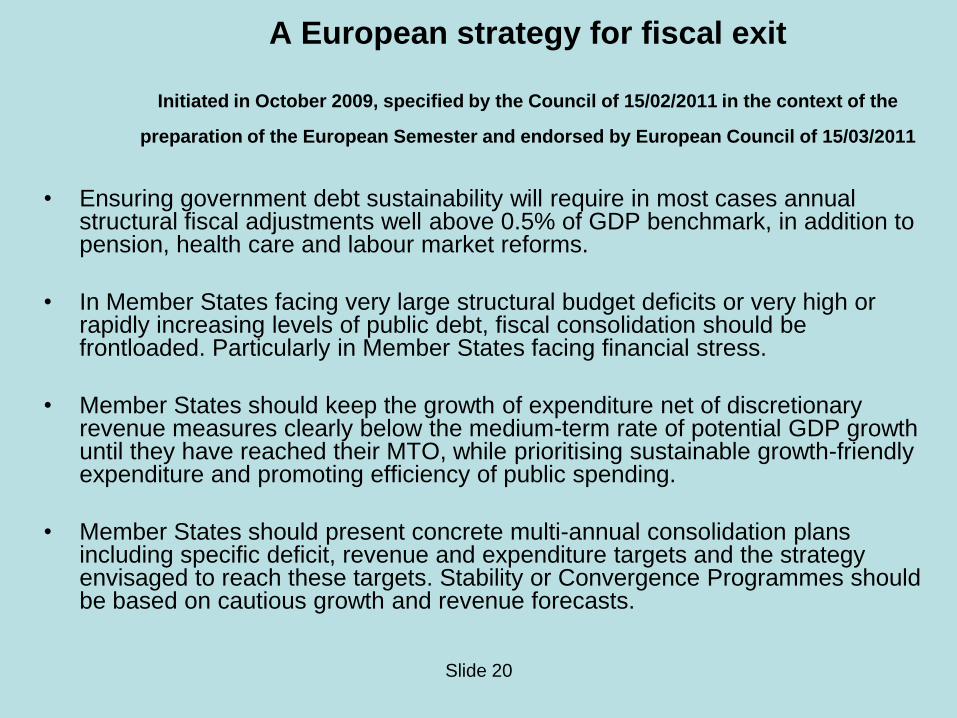
A European strategy for fiscal exit
Initiated in October 2009, specified by the Council of 15/02/2011 in the context of the
preparation of the European Semester and endorsed by European Council of 15/03/2011
• Ensuring government debt sustainability will require in most cases annual structural fiscal adjustments well above 0.5% of GDP benchmark, in addition to pension, health care and labour market reforms.
• In Member States facing very large structural budget deficits or very high or rapidly increasing levels of public debt, fiscal consolidation should be frontloaded. Particularly in Member States facing financial stress.
• Member States should keep the growth of expenditure net of discretionary revenue measures clearly below the medium-term rate of potential GDP growth until they have reached their MTO, while prioritising sustainable growth-friendly expenditure and promoting efficiency of public spending.
• Member States should present concrete multi-annual consolidation plans including specific deficit, revenue and expenditure targets and the strategy envisaged to reach these targets. Stability or Convergence Programmes should be based on cautious growth and revenue forecasts.

Slide 21
Consolidation under the excessive deficit procedure Euro area - Differentiated fiscal effort and flanking policies
MS
EDP
triggering
deficit
Deadline
Deficit 2010
(% GDP)
Structural adjustment Recommendations on:
Annual average
(p.p. of GDP)
Starting year
Budgetary
framework
Sustainability
AT 2009 2013 4.6 3/4 2011
BE 2009 2012 4.1 3/4 2010
CY 2009 2012 5.3 ≥1½ 2011 yes yes
DE 2009 2013 3.3 ≥0.5 2011
EL* 2007 2014 10.5 >2 2010 specific
measures
specific
measures
ES 2008 2013 9.2 >1.5 2010
FR 2008 2013 7.0 >1 2010
IE 2008 2015 32.4** 2 2011 yes yes
IT 2009 2012 4.6 ≥0.5 2010
MT 2008 2011 3.6 3/4 2011 yes
NL 2009 2013 5.4 3/4 2011
PT 2009 2013 9.1 1¼ 2010 yes
SI 2009 2013 5.6 3/4 2010 yes
SK 2009 2013 7.9 1 2010 yes
* Notice under Article 126 (9) ** of which 19.8% of GDP one-off
Slide 22
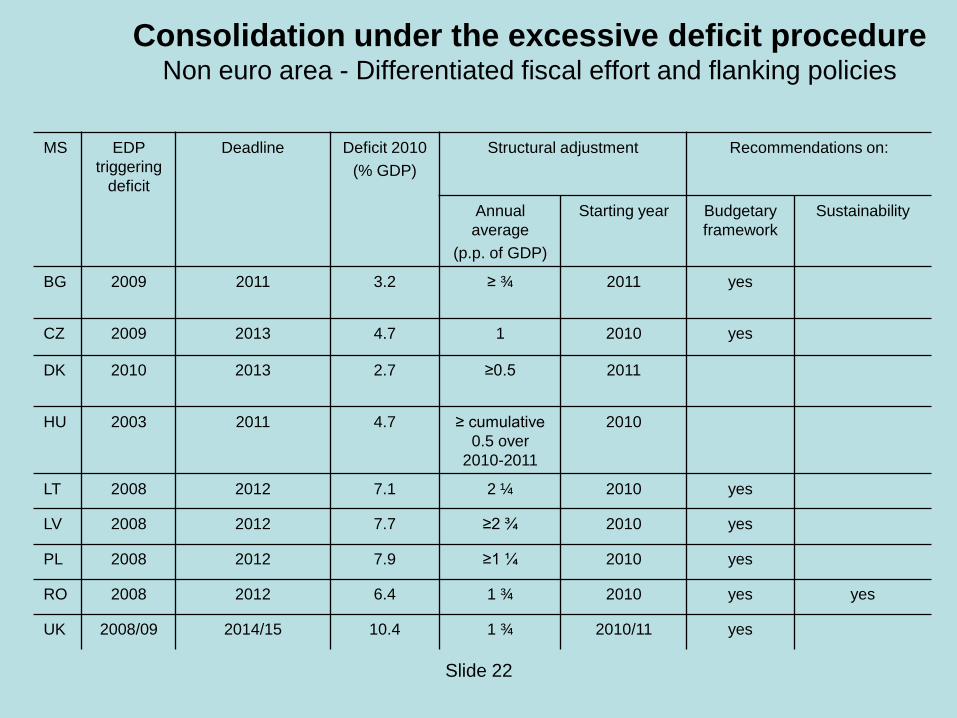
Consolidation under the excessive deficit procedure Non euro area - Differentiated fiscal effort and flanking policies
MS
EDP
triggering
deficit
Deadline
Deficit 2010
(% GDP)
Structural adjustment Recommendations on:
Annual
average
(p.p. of GDP)
Starting year Budgetary
framework
Sustainability
BG 2009 2011 3.2 ≥ ¾
2011 yes
CZ 2009 2013 4.7 1 2010 yes
DK 2010 2013 2.7 ≥0.5
2011
HU 2003 2011 4.7 ≥ cumulative
0.5 over
2010-2011
2010
LT 2008 2012 7.1 2 ¼ 2010 yes
LV 2008 2012 7.7 ≥2 ¾ 2010 yes
PL 2008 2012 7.9 ≥1 ¼ 2010 yes
RO 2008 2012 6.4 1 ¾ 2010 yes yes
UK 2008/09 2014/15 10.4 1 ¾ 2010/11 yes

What went wrong?
Four weaknesses have been exposed
• Despite improvements introduced by 2005 reform of SGP, the preventive arm of the SGP has failed to encourage the buildup of sufficient buffers in good times.
• Insufficient focus on debt levels and debt dynamics
• Weak governance/enforcement and narrow focus on procedural aspects and formal deficit limits in corrective arm
• Statistical misreporting crippled fiscal surveillance.
• Macroeconomic surveillance too narrowly focused on fiscal policy
Slide 23

• The Treaty (Article 126) – deficit < 3% of GDP, unless it has declined and reached a level close to 3% or the
excess is small, exceptional (‘severe economic downturn’) and temporary
– debt < 60% of GDP, or should be on a decreasing trend and approaching 60% at a satisfactory pace
•The Stability and Growth Pact
(Regulations 1466/97 and 1467/97, amended in 2005)
Preventive arm: Pursuit of medium-term budgetary objectives (MTOs)
Stability and convergence programmes and annual updates. Early warning mechanism
Corrective arm: Specifies the steps of the excessive deficit procedure (EDP)
Sets up a timetable for the correction of excessive deficits
and possible sanctions
The EU fiscal framework in a nutshell

What is being done? The EU’s policy response
to the public debt crisis • The EU/IMF packages for Greece (May 2010), Ireland
(November 2010) and Portugal (May 2011): For Greece, €110 bn for 36 months. EA MS contribute €80 bn (bilateral loans pooled centrally by European Commission similarly to a syndicated loan) and IMF €30 bn. For Ireland, €85 bn. For Portugal €78 bn.
• The European Financial Stabilisation Mechanism (EFSM): €60bn increase (from €50 bn to €110 bn) in BoP support facility and extension to euro area countries. Continuation subject to six-monthly reviews
• The European Financial Stability Facility (EFSF) of up to €440 bn (special purpose vehicle owned by all EA countries, which can issue bonds on the markets using MS guarantees; funds provided on same terms as those for Greece)
• EFSF complemented with IMF funds of up to €250 bn

What is being done? The EU’s policy
response to the public debt crisis
• Adjustment packages for Hungary, Latvia and Romania, approved
during 2008-09, financed by the EU’s BoP-support facility and IMF
(total used: a bit less than 15 bn euros)
• Exceptional fiscal adjustment packages announced by many MS, as
noted
• Reinforcing the SGP and European economic governance:
• CEBS Stress Test Exercise: successfully conducted
• Reinforcement of EU’s financial supervision system (ESRB, 3
financial supervising agencies).
27
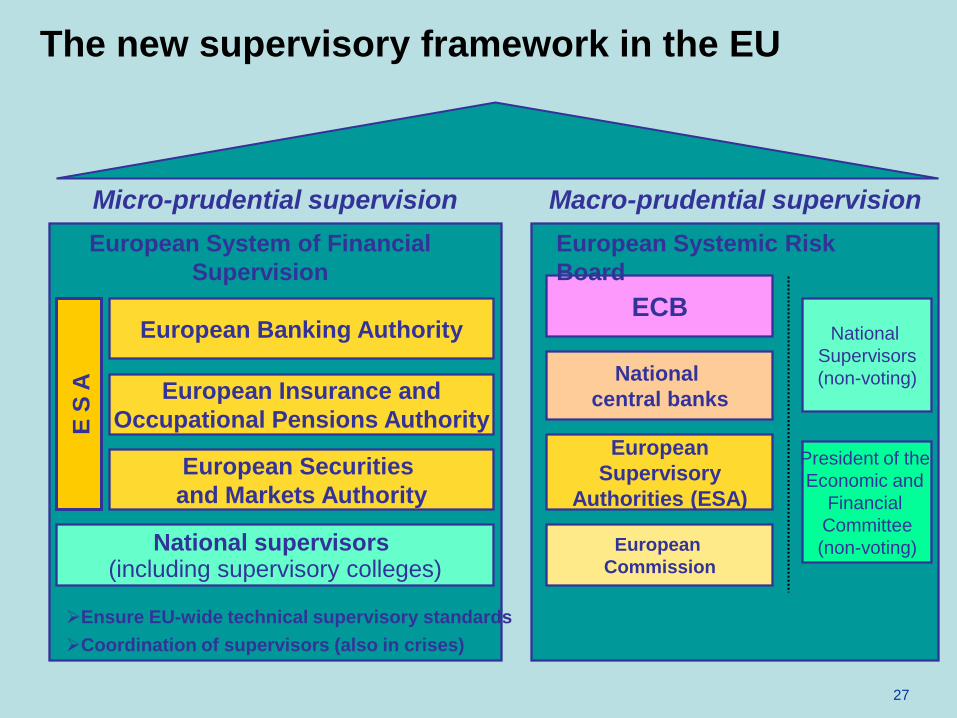
The new supervisory framework in the EU
European Banking Authority
European Insurance and
Occupational Pensions Authority
National supervisors (including supervisory colleges)
ECB National
Supervisors
(non-voting) National
central banks
European
Supervisory
Authorities (ESA)
European
Commission
Macro-prudential supervision Micro-prudential supervision
European Systemic Risk
Board
European System of Financial
Supervision
President of the
Economic and
Financial
Committee
(non-voting)
European Securities
and Markets Authority
Ensure EU-wide technical supervisory standards
Coordination of supervisors (also in crises)
E S
A
What has been done?
European Financial Stability Facility (EFSF) agreed on 10 May 2010
• EFSF can issue bonds using EA Member States guarantees in order to raise funds for loans to individual EA countries in difficulty. The loans are subject to strict policy conditionality and in conjunction with the IMF. Bonds are guaranteed proportionally by all Euro area Member States (pro-rata according to their participation in the capital of ECB) up to a total of €440 billion.
• EFSF has been awarded AAA rating by S&P, Moody’s and Fitch.
• Of a temporary nature: no new lending programmes after 30 June 2013, although it can continue to issue bonds and provide loans under existing programmes after that date

Slide 29
Integrated surveillance
•SGP to be complemented by broader macroeconomic surveillance, notably competitiveness and structural reforms
Recommendations and corrective measures for MS with serious imbalances, jeopardising functioning of EMU (« excessive imbalances positions »)
• Introduction (starting in H1 2011) of a « European Semester » (endorsed by ECOFIN Council of 7 September), integrating surveillance of fiscal, macroeconomic imbalances and structural reforms (stability and convergence programmes, BEPS…). But SGP and EU2020 strategy to remain formally separated
Fiscal surveillance Macroeconomic
Surveillance
Europe 2020
Structural reform
Enforcement mechanisms

What has been done? The European Semester
for integrated policy coordination
Policy guidance to EU and euro area Country-specific surveillance
Council of
Ministers
European
Commission
European
Parliament
European
Council Spring EU summit
January March April February May June July
Adoption of National Reform Programmes ( NRPs ) & Stability and Convergence Programmes ( SCPs )
Autumn: Decisions at national
level
Debate & orientations
Endorsement of guidance
Finalisation & adoption of guidance
Member
States
Annual Growth Survey
Policy guidance including possible recommendations
Debate & orientations
Council of
Ministers
European
Commission
European
Parliament
European
Council Spring EU summit
January March April February May June July January March April February May June July
Adoption of National Reform Programmes ( NRPs ) & Stability and Convergence Programmes ( SCPs
Autumn: Decisions at national
level
Debate & orientations
Endorsement of guidance
Finalisation & adoption of guidance
Member
States
Annual Growth Survey
Policy guidance including possible recommendations
Debate & orientations
Slide 31
What has been done?
Improvement of governance and the surveillance
framework
On 29 September 2010, the Commission presented legislative proposals for economic governance reforms:
1. Reinforcing the SGP by strengthening preventive arm, increasing emphasis on debt criterion (corrective arm), strengthening EUROSTAT’s role in ensuring high quality fiscal statistics and setting minimum requirements on national fiscal frameworks
2. Broadening surveillance to intra-euro area (and intra-EU) macroeconomic and competitiveness developments
3. More effective enforcement through appropriate incentives and early sanctions: automatic trigger unless Council decides otherwise
The legislative package (5 regulations and 1 directive) is expected to be adopted before end of 2011 and enter into force next year
Slide 32
What has been done?
Improvement of governance and the surveillance
framework
The Commission’s six legislative proposals:
1. Reinforcing the preventive arm of the SGP (Regulation amending Regulation 1466/97) (co-dec)
2. Strengthening the corrective arm of the SGP (Regulation amending Regulation of 1467/97 on the EDP)
3. Directive on minimum requirements for budgetary frameworks
4. Regulation on the prevention and correction of macroeconomic imbalances (to broaden surveillance to intra-intra-EA CA and competitiveness developments) (co-dec)
5. Regulation on enforcement of budgetary surveillance in EA (co-dec)
6. Regulation on enforcement of measures to correct excessive imbalances in EA (co-dec)

Slide 33
What has been done?
Improvement of governance and the surveillance
framework
European Councils of December 2010 and March 2011:
• Agreed to establish a permanent European Stability Mechanism (ESM) for euro area countries to replace the EFSF and the EFSM, both of which will remain in force only until June 2013
• It will require a limited amendment of the Treaty (Article 136) to enable EA countries to « establish a stability mechanism…granting financial assistance…under strict conditionality ». This can be ratified through the simplified procedure provided for in Art. 48(6) of TEU
• Target date for entry into force is July 2013 (national approval procedures to be completed by end-2012)

Slide 34
What has been done?
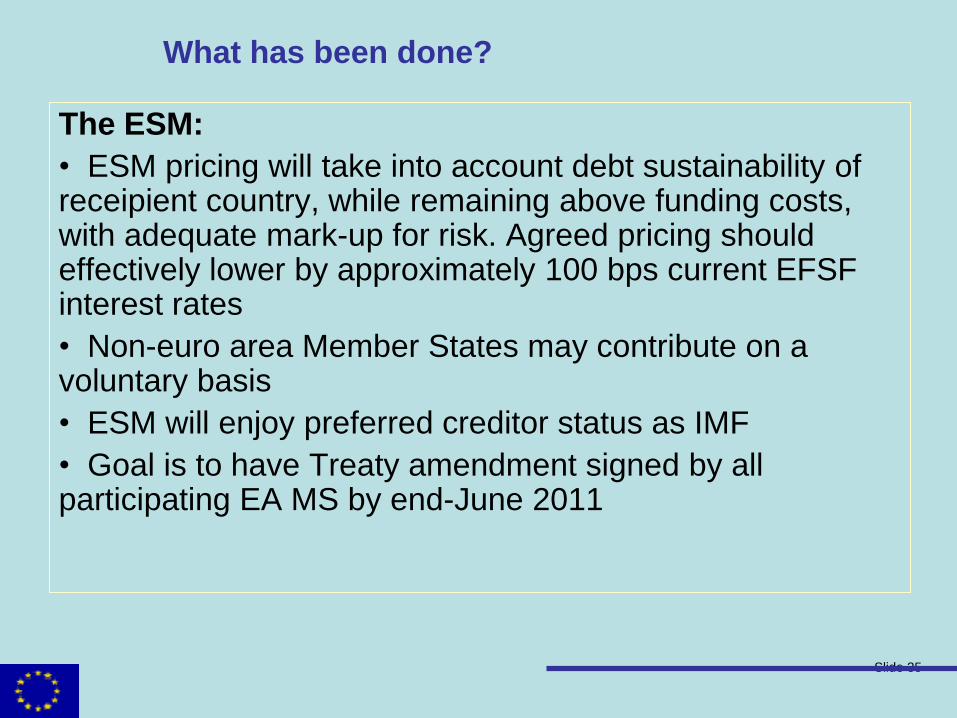
The ESM:
• Will be set up as an IFI under international public law, will be located in Luxembourg
• One of world’s largest IFIs
• Will have an effective lending capacity of €500 bn, including outstanding loans of the EFSF
• Its lending capacity will be ensured by a combination of paid-in capital (€80 mn), callable capital and guarantees (together amounting to €620 m): total financial base amounts to €700 mn
• Can provide loans and, in exceptional circumstances, intervene in primary and secondary debt markets. It will also be able to provide loans for bank recapitalisation
Slide 35
What has been done?
The ESM:
• ESM pricing will take into account debt sustainability of receipient country, while remaining above funding costs, with adequate mark-up for risk. Agreed pricing should effectively lower by approximately 100 bps current EFSF interest rates
• Non-euro area Member States may contribute on a voluntary basis
• ESM will enjoy preferred creditor status as IMF
• Goal is to have Treaty amendment signed by all participating EA MS by end-June 2011
Slide 36
What has been done?
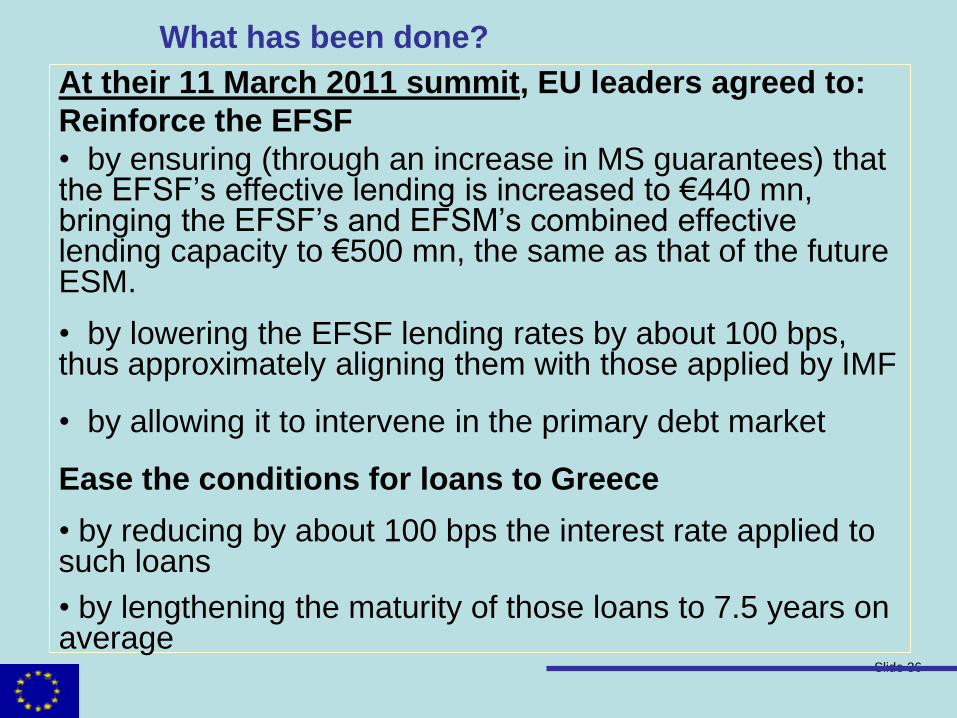
At their 11 March 2011 summit, EU leaders agreed to:
Reinforce the EFSF
• by ensuring (through an increase in MS guarantees) that the EFSF’s effective lending is increased to €440 mn, bringing the EFSF’s and EFSM’s combined effective lending capacity to €500 mn, the same as that of the future ESM.
• by lowering the EFSF lending rates by about 100 bps, thus approximately aligning them with those applied by IMF
• by allowing it to intervene in the primary debt market
Ease the conditions for loans to Greece
• by reducing by about 100 bps the interest rate applied to such loans
• by lengthening the maturity of those loans to 7.5 years on average
Slide 37
What has been done?
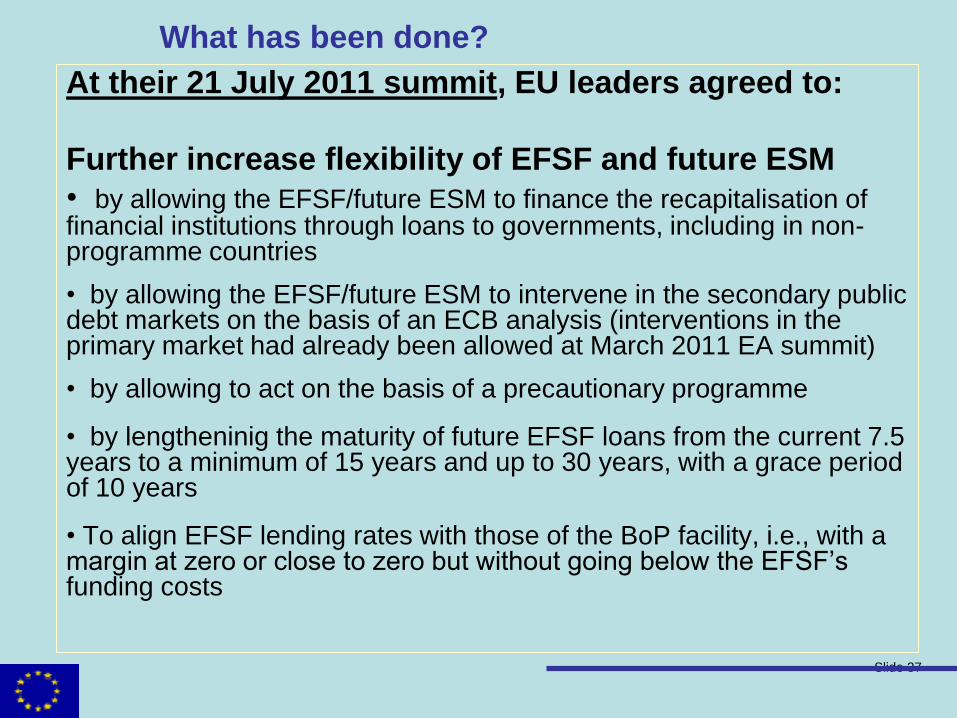
At their 21 July 2011 summit, EU leaders agreed to:
Further increase flexibility of EFSF and future ESM
• by allowing the EFSF/future ESM to finance the recapitalisation of financial institutions through loans to governments, including in non-programme countries
• by allowing the EFSF/future ESM to intervene in the secondary public debt markets on the basis of an ECB analysis (interventions in the primary market had already been allowed at March 2011 EA summit)
• by allowing to act on the basis of a precautionary programme
• by lengtheninig the maturity of future EFSF loans from the current 7.5 years to a minimum of 15 years and up to 30 years, with a grace period of 10 years
• To align EFSF lending rates with those of the BoP facility, i.e., with a margin at zero or close to zero but without going below the EFSF’s funding costs

Slide 38
What has been done?
At their 21 July 2011 summit, EU leaders agreed to:
Greece
• Agreed on principle of a new EU/IMF programme for Greece to take into account larger than expected financing needs for current programme period (May 2010-June 2013), which are due to: unforeseen settlement of arrears and the fact that the assumed restoration of long-term market access in early 2012 is now unlikely
• Programme will amount to an estimated €109 bn, spanning the period between late 2011 and mid-2014
• It will be co-financed by the EFSF and the IMF
• to supports new reform and adjustment measures adopted by Greece during the summer, including substantial privatisation
• Agreed to Private Sector Participation through voluntary debt roll-overs and buy backs
• Also, the maturities of the existing Greek facility will be extended
• Credit enhancements to underpin quality of collateral so as to allow continued access to Eurosystem liquidity operations by Greek banks

Thank you for your attention!