the european origins of economic...
TRANSCRIPT
J Econ Growth (2016) 21:225–257DOI 10.1007/s10887-016-9130-y
The European origins of economic development
William Easterly1,2 · Ross Levine2,3
Published online: 9 May 2016© Springer Science+Business Media New York 2016
Abstract Although a large literature argues that European settlement outside of Europeduring colonization had an enduring effect on economic development, researchers have beenunable to assess these predictions directly because of an absence of data on colonial Europeansettlement. We construct a new database on the European share of the population duringcolonization and examine its association with economic development today.We find a strong,positive relation between current income per capita and colonial European settlement thatis robust to controlling for the current proportion of the population of European descent, aswell as many other country characteristics. The results suggest that any adverse effects ofextractive institutions associated with small European settlements were, even at low levelsof colonial European settlement, more than offset by other things that Europeans brought,such as human capital and technology.
Keywords Institutions · Human capital · Political economy · Natural resources
Steven Pennings and Diego Anzoategui provided superb research assistance in the final stages of this paper.The data collection project also lasted across many generations of RAs and we have received excellentresearch assistance and heroic data collection efforts from Alejandro Corvalan, Tomislav Ladika, AlexLevkov, Julia Schwenkenberg, Tobias Pfutze, and Liz Potamites. We also received very helpful commentsfrom the editor Oded Galor, three anonymous referees, Andrei Shleifer, from our discussant Enrico Spolaoreand participants in the UCLA Long Term Persistence Conference in May 2012 including Romain Wacziargand David Weil, and seminar participants at Brown University, Harvard University, Johns HopkinsUniversity, University of California, Berkeley, and Yale University.
Electronic supplementary material The online version of this article (doi:10.1007/s10887-016-9130-y)contains supplementary material, which is available to authorized users.
B William [email protected]
1 New York University, New York, NY, USA
2 The NBER, Cambridge, MA, USA
3 University of California, Berkeley, Berkeley, CA, USA
123
226 J Econ Growth (2016) 21:225–257
JEL Classification Codes 043 · 01 · P48 · N5
1 Introduction
Countries have followed divergent paths of economic development since European coloniza-tion. Some former colonies, such as the Congo, Guinea-Bissau, Malawi, and Tanzania, haveexperienced little economic development over the last few centuries, with current per capitaGross Domestic Product (GDP) of about $2 per day. Others are among the richest countriesin the world today, including Australia, Canada, and the United States, with per capita GDPlevels of about $140 per day. Others fall along the spectrum between these extremes.
To explain these divergent paths, many researchers emphasize that the European share ofthe population during colonization shaped national rates of economic growth through sev-eral mechanisms. Engerman and Sokoloff (1997) (ES) and Acemoglu et al. (2001, 2002)(AJR) stress that European colonization had enduring effects on political institutions. Theyargue thatwhenEuropeans encountered natural resourceswith lucrative internationalmarketsand did not find the lands, climate, and disease environment suitable for large-scale settle-ment, only a few Europeans settled and created authoritarian political institutions to extractresources. The institutions created by Europeans in these “extractive colonies” impeded long-run development. But, when Europeans found land, climate, and disease environments thatwere suitable for smaller-scale agriculture, they settled, forming “settler colonies” with polit-ical institutions that fostered development. This perspective has two testable implications:(1) former settler colonies with a large proportion of Europeans during colonization willcreate more inclusive political institutions that foster greater economic development thanformer extractive colonies with a small proportion of Europeans, and (2) colonial Europeansettlement will have a stronger association with development today than current Europeansettlement (the proportion of the population that is of European descent today) because ofthe enduring effect of institutions created during the colonial period.
As an additional, potentially complementary mechanism, ES and Glaeser et al. (2004)(GLLS) note that the European share of the population during colonization influenced the rateof human capital accumulation. They argue that Europeans brought human capital and humancapital creating institutions that shape long-run economic growth, as emphasized by Galor(2011). According to this human capital view, European settlers directly and immediatelyadded human capital skills to the colonies and also had long-run effects on human capitalaccumulation.
These long-run effects emerge because human capital disseminates throughout the popu-lation over generations and it takes time to create, expand, and improve schools. Furthermore,this human capital view suggests that a larger share of Europeans during colonization couldfacilitate human capital accumulation across the entire population both because it wouldincrease interactions among people of European and non-European descent and because itmight accelerate expanded access to schools, as emphasized in ES. This human capital viewalso yields two testable implications: (1) the proportion of Europeans during colonizationwill be positively related to human capital development and hence economic developmenttoday, and (2) the proportion of Europeans during colonizationwill matter more for economicdevelopment than the proportion of the population of European descent today because of theslow dissemination of human capital and creation of well-functioning schools. Although thepolitical institutions and human capital views emphasize different mechanisms, they pro-
123
J Econ Growth (2016) 21:225–257 227
vide closely aligned predictions about the impact of colonial European settlement on currenteconomic development.
Other researchers, either explicitly or implicitly, highlight additional mechanisms throughwhich European migration had positive or negative effects on development. North (1990)argues that the British brought comparatively strong political and legal institutions that weremore conducive to economic development than the institutions brought by other Europeannations. This view stresses the need for a sufficiently strong European presence to instill thoseinstitutions, but does not necessarily suggest that the proportion of Europeans during colo-nization will affect economic development today beyond some initial threshold level. Morerecently, Spolaore and Wacziarg (2009) stress that the degree to which the genetic heritageof a colonial population was similar to that of the economies at the technological frontierpositively affected the diffusion of technology and thus economic development, where Euro-pean migration materially affected the genetic composition of economies. Putterman andWeil (2010) and Chanda et al. (2014) emphasize that the experiences with statehood andagriculture of the ancestors of people currently living within countries help explain cross-country differences in economic success. And, Comin et al. (2010) likewise find that theancient technologies of the ancestors of populations today help predict per capita income ofthose populations. In all of these papers, the ancestral nature of a population helps accountfor cross-country differences in economic development, where European colonization mate-rially shaped the composition of national populations.1 As in the human capital view, theemphasis is on things that Europeans brought with them, such as technology.
Although this considerable body of research emphasizes the role of European settlementduring colonization on subsequent rates of economic development, what has been missingin the empirical literature is the key intermediating variable: colonial European settlement.While researchers, including AJR, have examined the European share of the populationin 1900, this is well after the colonial period in several countries, including virtually allof the Western Hemisphere. To the best of our knowledge, researchers have not directlymeasured colonial European settlement and examined its association with current economicdevelopment.
In this paper, we construct a new database on the European share of the population duringcolonization and use it to examine the historical determinants of colonial European settlementand the relation between colonial European settlement and current economic development.Although we do not isolate the specific mechanisms linking colonial European settlementwith current levels of economic development as emphasized in each of the individual theoriesdiscussed above, we do assess the core empirical predictions emerging from the literatureon the relationship between European settlement and economic development. In particular,we assess whether the proportion of Europeans during colonization is positively related toeconomic development today andwhether the proportion of Europeans during colonization ismore important in accounting for cross-country differences in current economic developmentthan the proportion of the population of European descent today.
1 An extensive and growing body of research explores the historical determinants of economic development,which has been insightfully reviewed by Spolaore and Wacziarg (2013). For example, Michalopoulos andPapaioannou (2013) show that pre-colonial political institutions had enduring effects on regional economicdevelopment,whileMichalopoulos and Papaioannou (2014) show that variation betweenAfrican ethnic groupsis more important than variations between nations in Africa in explaining comparative economic development,advertising the broader notion that different peoples carry growth-shaping features with them across borders.Furthermore, as suggested by the work of Bisin and Verdier (2000), Fernandez and Fogli (2009), and Tabellini(2008), culture also extend beyond national borders with prominent effects on economic development. And,other scholars address the deep historical roots of modern-day levels of social capital, civic capital, or democ-racy, including Haber (2014), Persson and Tabellini (2010), and Tabellini (2010).
123

228 J Econ Growth (2016) 21:225–257
We begin by compiling a new database on the European share of the population duringcolonization. For each country, we gather data from an assortment of primary and secondarysources for as many years as possible going back the sixteenth century. From these data, weconstruct several measures of European settlement that differ with respect to the date used tomeasure colonial European settlement. We first construct a country-specific measure basedon the colonial history of each country. To do this, we use information on when Europeansfirst arrived in the country and when the colony became independent to select a date on whichto measure colonial European settlement. For this country-specific measure, we seek a date,subject to data limitations, that is early in its colonial period but sufficiently after Europeansfirst arrived to allow for the formation of colonial institutions.We next constructmeasures thatuse a common date. For each country, we average the annual observations on the Europeanshare of the population over 1500–1800, 1801–1900, and 1500–1900. We obtain consistentresults using these different methods for dating and measuring colonial European settlement.
We then examine the historical determinants of colonial European settlement both tocheck the credibility of our new data and to examine differing views about the factors shap-ing European colonization. As a guide, we employ a very simple model of the costs andbenefits of European settlement. Some determinants have already been discussed in the lit-erature, such as pre-colonial population density, latitude, and the disease environment facingEuropeans. Pre-colonial population density raises the costs to Europeans of obtaining andsecuring land for new settlers, and might also raise the benefits since the European oftenexploited and enslaved the indigenous population. Latitude raises the benefits of simplytransferring European technologies (such as for agriculture) to the newly settled areas. Aharsh disease environment facing Europeans raises the expected costs of settlement.
To this list of common determinants of European settlement, we construct and examinean indicator of whether a large proportion of the indigenous population died from European-borne diseases during the colonization period. Indigenous mortality from European diseasesis a tragic natural experiment that might help account for European settlement because itremoved or weakened indigenous resistance to Europeans invading new lands, and madefertile land more readily available to settlers. The phenomenon is limited to lands that hadessentially zero contact with Eurasia for thousands of years, since even a small amount ofprevious contact was enough to share diseases and develop some resistance to them. Forexample, trans-Sahara and trans-Indian Ocean contacts were enough to make Africa part ofthe Eurasian disease pool (McNeil 1976; Karlen 1995; Oldstone 1998). Historical studies andpopulation figures show that only the NewWorld (the Americas and Caribbean) and Oceania(includingAustralia andNewZealand) suffered large-scale indigenousmortality due to a lackof resistance to European diseases (McEvedy and Jones 1978). Thus, our measure of large-scale indigenous mortality from European-borne diseases is captured by a dummy variablefor the New World and Oceania.
Our examination of the historical determinants of colonial European settlement yieldsthree findings. First, we find that colonial European settlement tends to be smaller (as a shareof total population) in areas where there was a highly concentrated population of indigenouspeople and where there was not large-scale indigenous mortality during colonization. Thisfinding provides the first direct empirical support for AJR’s (2002) hypothesis that in areaswith a high concentration of indigenous people, Europeans did not settle in large numbers andinstead established extractive regimes. This finding is a key building block in AJR’s (2002)theory of a “reversal of fortunes,” in which formerly successful areas, i.e., areas with a highconcentration of indigenous people, became comparatively poorer due to the enduring effectsof extractive political regimes. Second, Europeans tended to settle in large concentrationsin lands further from the equator. Third, although biogeography—a measure of the degree
123

J Econ Growth (2016) 21:225–257 229
to which an area is conducive to the domestication of animals and plants—explains humanpopulation density before the era of European colonization (Ashraf and Galor 2011), it doesnot account for colonial European settlement after accounting for indigenous populationdensity.
We next assess the two key predictions emerging from the political institutions and humancapital views concerning colonial European settlement and current economic developmentand discover the following. First, colonial European settlement is strongly, positively associ-ated with economic development today. This relationship holds after controlling for Britishlegal heritage, the percentage of years the country has been independent since 1776, and theethnic diversity of the current population. The strong, positive association between Europeansettlement and economic development today is also robust to controlling for the mortalityof the indigenous population during colonization, latitude, availability of precious metals,distance from London, ability to cultivate storable plants and domesticate animals, malariaecology, and Europeanmortality during colonization, as well as soil quality, access to naviga-ble waterways, and continent dummy variables. However, the relationship between economicdevelopment today and the proportion of Europeans during colonization weakens markedlywhen controlling for either current educational attainment or government quality, which isconsistent with the views that human capital and political institutions are intermediatingmechanisms through which European settlement shaped current economic development.
Second, the European share of the population during colonization is more strongly associ-ated with economic development today than the percentage of the population today that is ofEuropean descent. Europeans during the colonization era seem to matter more for economicdevelopment today than Europeans today. This finding is consistent with the view that Euro-peans brought growth-promoting characteristics—such as institutions, human capital, tech-nology, connectionswith internationalmarkets, and cultural norms—that had enduring effectson economic development. This result de-emphasizes the importance of Europeans per se andinstead emphasizes the impact of what Europeans brought to economies during colonization.
The estimated positive relation between colonial European settlement and current devel-opment is economically large. Based our parameter estimates, we compute for each countrythe projected level of income in 2000 if colonial European settlement had been zero. We thencompare this counterfactual level of current income to actual current income and compute theshare of current income attributable to colonial European settlement. The data and estimatesindicate that 40 % of current development outside of Europe is associated with the share ofEuropeans during the colonial era. Though such projections must be treated cautiously, theysuggest that the European origins of economic development deserve considerable attention.
We check the robustness of the positive relation between colonial European settlementand current economic development in several ways. First, we were concerned that the rela-tion between colonial European settlement and current development might breakdown wheneliminating “neo-Europes,” such as Australia, Canada, New Zealand, and the United States,or other countries that had a comparatively high proportion of Europeans during coloniza-tion. Thus, we redid the analyses while omitting countries with colonial European settlementgreater than 12.5 %, which represents a natural break in the data that omits the neo-Europes,Argentina, and a few, small Latin American countries.
Rather than the results breaking down when the sample is restricted to countries witha small proportion of Europeans during colonization, the estimates become larger. Whenexamining only those former colonies with colonial European settlement less than 12.5 %,we find that the estimated positive relation between current income and colonial Europeansettlement is more than double the estimate from examining the full sample of non-Europeaneconomies.
123
230 J Econ Growth (2016) 21:225–257
We were also concerned that the inclusion of many countries for which our data indicatezero colonial European settlement might affect the parameter estimates. Besides statisticalrobustness, the previous literature has not explicitly addressed whether colonial institutionswith small European settlement during colonization are better or worse than those with nosettlement. Even if small colonial European settlements created worse institutions than thosecreated in areas with no Europeans during colonization, the positive things that Europeansbrought with them, such as human capital or technology, could offset the negative develop-ment effects of worse institutions. Our data allow us to provide a first evaluation of theseissues and to assess the few non-European countries that escaped colonization altogether.
We address concerns about countries with “zero” Europeans during colonization in twoways. First, we omit all of these “zero” countries from the analyses and confirm the results.Second, we include a dummy variable for these “zero” countries and continue to find thatcolonial European settlement enters positively and significantly in the economic developmentregressions. We also find that the dummy variable for zero European settlement often enterswith a positive coefficient, which provides some empirical support for the political institu-tions view that small European settlements that create extractive institutions are worse forcurrent economic development than countries with essentially no European settlers duringthe colonial era. Combining the coefficient estimates on colonial European settlement and thedummy variable, the findings indicate that once colonial European settlement is above 4.8 %,any adverse effects from extractive institutions associated with small colonial European set-tlements were more than offset by other things that Europeans brought during colonization,such as human capital, technology, familiarity with global markets, and institutions, that hadenduring, positive effects on economic development.
Ample qualifications temper our conclusions. First, we do not assess the welfare impli-cations of European colonization. Europeans often cruelly oppressed, enslaved, murdered,and even committed genocide against indigenous populations, as well as the people that theybrought as slaves (see Acemoglu and Robinson 2012 for compelling examples). Thus, GDPper capita today does not measure the welfare effects of European colonization; it only pro-vides a measure of economic activity today within a particular geographical area. Althoughthere is no question about European oppression and cruelty, there are questions about thenet effect of European colonization on economic development today. Second, we do notseparately identify each potential channel through which the European share of the popu-lation during colonization shaped long-run economic development. Rather, we provide thefirst assessment of the relationship between colonial European settlement and comparativeeconomic development and thereby inform debates about the sources of the divergent pathsof economic development taken by countries around the world since the colonial period.
The remainder of the paper is organized as follows. Section 2defines anddiscusses the data,while Sect. 3 provides preliminary evidence on the determinants of human settlement priorto European colonization and the factors shaping European settlement. Section 4 presentsthe paper’s core results on the relationship between colonial European settlement and currenteconomic development. Section 5 reports an exercise in development accounting to calculatewhat share of global development can be attributed to Europeans. Section 6 concludes.
2 Data
This section describes the two data series that we construct: (1) the European share of thepopulation during colonization and (2) the degree to which a region experienced large scaleindigenous mortality due to the diseases brought by European explorers in the fifteenth and
123

J Econ Growth (2016) 21:225–257 231
sixteenth centuries. The other data that we employ are taken from readily available sources,and we define those variables when we present the analyses below.
2.1 Euro share
We compile data on the European share of the population during colonization (Euro share)from several sources. Since colonial administrators were concerned about documenting thesize and composition of colonial populations, there are abundant—albeit disparate—sourcesof data. Of course, there was hardly anything like a modern statistical service in colonialtimes, so that different administrators across different colonies in different time periods useddifferent and often undocumented methods for assembling population statistics. Thus, weuse a large variety of primary and secondary sources on colonial history to piece togetherdata on the European share of the population.
Although the Data Appendix (available online) provides detailed information on oursources, the years for which we compiled data on each country, and discussions about thequality of the data, it is worth emphasizing a few points here. First, we face the challenge ofchoosing a date to measure European share. We would like a date as early as possible afterinitial European contact to use European settlement as an initial condition affecting subse-quent developments. At the same time, we do not want to pick a date that is too early afterEuropean contact since it is only after some process of conquest, disease control, and build-ing of a rudimentary colonial infrastructure that it became possible to speak of a Europeansettlement. Given these considerations, we try to choose a date at least a century after initialEuropean contact, but at least 50 years before independence. This means that for conceptualreasons we do not seek to use a uniform date across all colonies. For example, Europeanswere colonizing and settling Latin America long before colonizing Africa. We also lack acontinuous time series for each country; rather, the data reflect dates when colonial adminis-trators in particular locales happened to measure or estimate populations.2 Given these datalimitations, we cannot always adhere to our own guidelines for choosing the date on whichto measure Euro share. In sensitivity analyses discussed below, we show that the results arerobust to measuring Euro share as the average value over three different uniform periods: (i)1500–1800, (ii) 1801–1900, or (iii) 1500–1900.
Second, we adopt a “dog did not bark” strategy for recording zero European settlement.If we find no historical sources documenting any European settlement in a particular colony,we assume that there were no such settlers. This procedure runs the risk of biasing down-ward European settlement. However, we believe colonial histories (which are virtually allwritten by European historians) are extremely unlikely to fail to mention significant Euro-pean settlements. We checked and confirmed the validity of this procedure of setting colonialEuropean settlement to zero using the Acemoglu et al. (2001) Online Data Appendix, whichgives the share of Europeans in the population in 1900. Furthermore, as presented below, theresults hold when eliminating all countries with zero colonial European settlement or whenincluding a fixed effect for these countries in the regression analyses.
2.2 Indigenous mortality
We examine several predetermined factors that potentially influenced European settlement—including the degree to which Europeans brought diseases that wiped out the indigenouspopulation. Others have carefully documented this tragic experience, but we believe that
2 When we have several observations near our “ideal” date for measuring colonial European settlement, wetake the average. The online dataset provides the date of each observation.
123

232 J Econ Growth (2016) 21:225–257
we are the first to use it to explain the nature of colonization and its effect on subsequenteconomic development.
Although Europeans established at least a minimal level of contact with virtually all pop-ulations in the world during the colonial period, this contact had truly devastating effectson indigenous populations in some regions of the world but not in others. Some regionshad been completely isolated from Eurasia for thousands of years, and thus had no previ-ous exposure or resistance to Eurasian diseases. When Europeans then made contact withthese populations—which typically occurred during the initial stages of global Europeanexploration and hence long before anything resembling “European settlements,” Europeandiseases such as smallpox and measles spread quickly through and decimated the indigenouspopulation. For example, when the Pilgrims arrived in New England in 1620, they foundthe indigenous population already very sparse because European fisherman had occasionallylanded along the coast of New England in the previous decades. Similarly, De Soto’s expe-dition through the American South in 1542 spread smallpox and wiped out large numbers ofindigenous people long before British settlers arrived.
Thus, we construct a dummy variable, Indigenous mortality, which equals one when aregion experienced large-scale indigenous mortality due to the spread of European diseasesduring the initial stages of European exploration. To identify where Europeans brought dis-eases that caused widespread fatalities, we use the population data of McEvedy and Jones(1978) and three epidemiological world histories (McNeil 1976; Karlen 1995; Oldstone1998). Diseases had circulated enough across Eurasia, Africa and the sub-continent, so thatindigenousmortality did not shoot upwith increased exposure to European explorers, traders,and slavers during European colonization. The New World (Americas and Caribbean) andOceania (the Pacific Islands, Australia, and New Zealand) were different. When Europeanexplorers and traders arrived, themicrobes that they brought triggered extremely highmortal-ity rates, which accords with their previous isolation from European diseases. The evidencesuggests that mortality rates of 90 % of the indigenous population after European contactwere not unusual.
Althoughwe compiled a country-by-country indicator of whether the country experiencedlarge-scale indigenous mortality during colonization, our data indicate little measurable vari-ation within the New World and Oceania, so that Indigenous mortality wound up beinga simple dummy for countries in the New World and Oceania. (As discussed below, ourfindings on the associations of current development and colonial European settlement arerobust to including continent fixed effects.) This dummy variable measure suggests cautionin interpreting the results on Indigenous mortality. Although the data indicate that large-scaleindigenous mortality occurred in the New World and Oceania but not elsewhere (McEvedyand Jones 1978; McNeil 1976; Karlen 1995; Oldstone 1998), Indigenous mortality is ulti-mately a dummy variable for these regions of the world and might proxy for other features ofthese regions, such as geographic isolation, rather than European-induced mortality. Thesesame areas that were isolated from Europeans prior to colonization—and hencemore suscep-tible to European-borne diseases—also had lower population densities in 1500 AD. This maybe related to Spolaore and Wacziarg’s (2009) result on diffusion of technology as a functionof when different branches of humanity became separated. Populations in Oceania and theWestern Hemisphere had been isolated from the rest for a very long time, and hence they didnot get either (1) the more advanced technology originating in the OldWorld that would havehelped support a larger population or (2) the exposure to European diseases before coloniza-tion that would have helped them become more resistant to European diseases and hence toEuropean settlement. We will see that this combination of low indigenous population density
123
J Econ Growth (2016) 21:225–257 233
and vulnerability to European diseases plays a large role in accounting for where Europeanssettled.
3 Preliminaries: where did Europeans settle?
Table 2 provides regression results concerning which factors shaped European settlementduring colonization. The dependent variable is the proportion of Europeans in the colonialpopulation (Euro share).
The regressors are as follows. First, we include Population density 1500. Note that thisis a measure of the pre-Columbian population for the New World (i.e., before 1492) eventhough the date is conventionally rounded off to 1500. Hence, this number does NOT includeany initial population decrease due to indigenous mortality from European-borne diseases.Since the regressions control for the attractiveness of the land for settlement, a plausibleinterpretation of the impact of Population density 1500 on Euro share is that it gauges theability of the indigenous population to resist European settlement.3
Second, we include Indigenous mortality, which we designed to provide additional infor-mation on the ability of the indigenous population to resist European settlers. If Europeandiseases eliminated much of the indigenous population, this would reduce their ability toopposeEuropean settlement.However, since Indigenous mortality in practice equals a dummyvariable for the NewWorld and Oceania, we cannot separately identify the impact of Indige-nous mortality and continent fixed effects on Euro share.
Third, Latitude might have special relevance for European settlers to the extent that theyare attracted to lands with the same temperate climate as in Europe. Latitude measures theabsolute value of the distance of the colony from the equator.
Fourth, Precious Metals is an indicator of whether the region has valuable minerals sincethismight have affected European settlement. Fifth, one cost of settling in a particular countrymight be its distance from Europe, so we use the distance from London to assess this view(London). Finally, we examine other possible determinants of the attractiveness of the land forsettlement, including Biogeography, Malaria ecology, and Settler mortality. Biogeographyis an index of the prehistoric (about 12,000 years ago) availability of storable crops anddomesticable animals, where large values signifymoremammalian herbivores and omnivoresweighing greater than 45 kg and more storable annual or perennial wilds grasses, which arethe ancestors of staple cereals (e.g., wheat, rice, corn, and barley).4 Malaria ecology is anecologically-based spatial index of the stability of malaria transmission in a region, where
3 Although there could also be a mechanical negative relation between indigenous Population density 1500and Euro share because the denominator of Euro share is the sum of the indigenous and settler populations, wenormalize European settlers by total colonial population because the political institutions and human capitalviews frame their predictions about the enduring effects of the colonial period on economic development interms of the proportion of Europeans in the colonial population. The indigenous population could potentiallyattract European settlers to the extent that the indigenous peoples represent a readily available labor supplyto be exploited by the Europeans. Thus, the net effect of the indigenous population on European settlement isan empirical question. Our result of Euro share responding negatively to log indigenous population density isconsistent with some positive response of absolute numbers of European settlement to indigenous populationas long as the elasticity of that response is less than one.4 Taken from Hibbs and Olsson (originally 2004, later expanded to a larger sample), Biogeography equalsthe first principal component of (a) the number of annual perennial wild grasses known to exist in the region inprehistoric times with mean kernel weight of greater than ten milligrams and (b) the number of domesticablelarge mammals known to exist in the region in prehistoric times with a mean weight of more than 45 kilos.Ashraf and Galor 2011 found another version of this measure to be a good predictor of the timing of transitionto agriculture and through that channel a good predictor of 1500 AD population density.
123
234 J Econ Growth (2016) 21:225–257
larger values signify a greater propensity for malaria transmission.5 Settler mortality equalshistorical deaths per annum per 1000 European settlers (generally soldiers, or bishops inLatin America) and is taken from AJR (2001).
The results show that three factors account for the bulk of cross-country variation inEuropean settlement. First, the density of the indigenous population matters. In regions witha high concentration of indigenous people who could resist European occupation, Europeanscomprised a much smaller fraction of the colonial population than in other lands. Second,in countries where the indigenous population fell drastically because of European diseases,i.e., in the New World and Oceania, European settlers were more likely to settle. Third,there is a positive relationship between Euro share and Latitude, even when conditioning onPopulation density 1500 and Indigenous mortality. Europeans were a larger proportion of thecolonial population in higher (more temperate) latitudes, plausibly because of the similaritywith the climate conditions in their home region.6,7
These three variables, Population density 1500, Indigenous mortality, and Latitude helpexplain in a simple way the big picture associated with European settlements, or the lackthereof, in regions around the world. Where all three factors were favorable for Europeansettlement, such as Australia, Canada, New Zealand, and the United States, the Europeanshare of the colonial population was very high. When only some of the three factors werefavorable, there tended to be a small share of European settlers. Latin America suffered large-scale indigenous mortality, but only some regions were temperate, and most regions hadrelatively high pre-Columbian population density (which is why more people of indigenousorigin survived in Latin America compared to North America, even though both regionsexperience high indigenous mortality rates when exposed to European diseases). SouthernAfrica was temperate and had low population density, but did not experience large-scaleindigenous mortality. These factors can also explain where Europeans did not settle. The restof sub-Saharan Africa was tropical and again did not experience much indigenous mortalityfrom exposure to the microbes brought by Europeans during colonization. And, most of Asiahad high population density, did not suffer much indigenous mortality from European bornediseases, and is in or near the tropics, all of which combine to explain the low values of Euroshare across much of Asia.
None of the other possible determinants that we consider are significant after controllingfor these three determinants. Indeed, European colonial settlement, unlike pre-Columbianpopulation (the latter as verified by Ashraf and Galor (2011, 2013)), was NOT associatedwith the intrinsic, long-run potential of the land—as measured by Biogeography.
One of the most famous variables in the literature on explaining European settlement isSettler mortality. Our data on colonial settlement allows for the first assessment of the abilityof this variable to explain European settlement during colonization. The results are mixed.Settler mortality has a negative and significant simple correlation with colonial Europeansettlement (not shown), confirming the prediction in AJR. It becomes insignificant when
5 The Malaria ecology index is from Kiszewski et al. (2004) and measures the biological characteristicsof mosquitoes that influence malaria transmission, such as the proportion of blood meals taken from humanhosts, daily survival of the mosquito, and duration of the transmission season and of extrinsic incubation.6 Ashraf and Galor (2011) find that latitude had the opposite effect on areas that had dense populations before1500—there was less settlement in temperate regions and more in tropical regions.7 These results are robust to controlling for several other potential influences on Euro share. For example, theresults hold when including Soil suitability and Distance to waterways from Ashraf and Galor (2011, 2013).Furthermore, the results hold when including continent fixed effects. Furthermore, we find that each dummyvariable for Oceania and the Americas enters positively and significantly in a manner that is consistent withthe results on Indigenous mortality in Table 2.
123
J Econ Growth (2016) 21:225–257 235
including the three variables that we found most robust in accounting for colonial Europeansettlement, and does not materially alter the statistical significance of the other variables. Yet,when we include all RHS variables simultaneously (in column 8 of Table 2), Settler mortalityreturns to significance. In sum, the relation betweenEuro share and Settler mortality is highlysensitive to changes in the sample and the control variables.
4 Results: Europeans during colonization and current economicdevelopment
4.1 Simple graphical analyses
To assess the relationship between the European share of the population during colonizationand the current level of economic development, we begin with simple graphs. We measurethe current level of economic development as the average of the log of real per capita GDPover the decade from 1995 to 2005 (Current income). Using data averaged over a decadereduces the influences of business cycle fluctuations on the measure of current economicdevelopment.
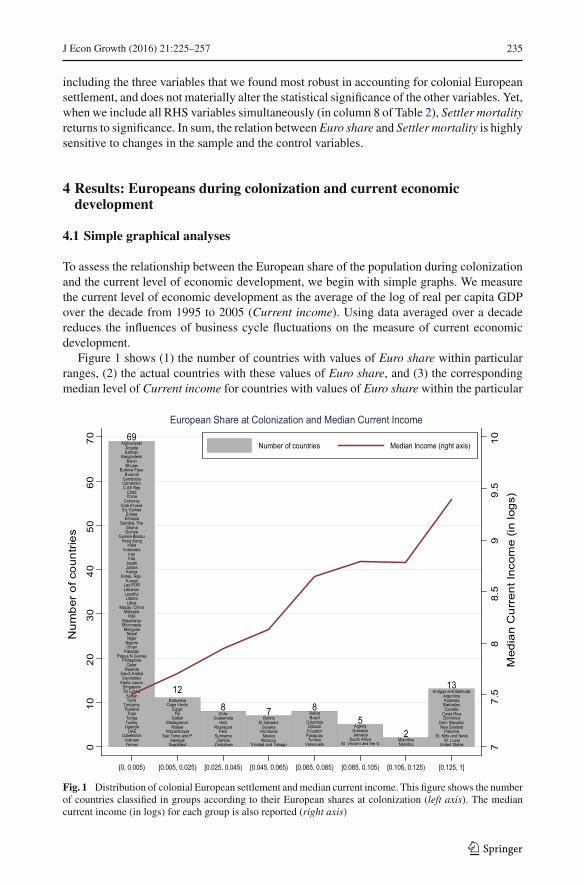
Figure 1 shows (1) the number of countries with values of Euro share within particularranges, (2) the actual countries with these values of Euro share, and (3) the correspondingmedian level of Current income for countries with values of Euro share within the particular
AfghanistanAngolaBahrain
BangladeshBenin
BhutanBurkina Faso
BurundiCambodiaCameroonC Afr Rep
ChadChina
ComorosCote d'IvoireEq Guinea
EritreaEthiopia
Gambia, TheGhanaGuinea
Guinea-BissauHong Kong
IndiaIndonesia
IranIraq
JapanJordanKenya
Korea, Rep.Kuwait
Lao PDRLebanonLesothoLiberiaLibya
Macao, ChinaMalaysia
MaliMauritaniaMicronesiaMongolia
NepalNiger
NigeriaOman
PakistanPapua N Guinea
PhilippinesQatar
RwandaSaudi ArabiaSeychelles
Sierra LeoneSingaporeSri Lanka
SudanSyria
TanzaniaThailand
TogoTongaTurkeyUganda
UAEUzbekistan
VietnamYemen
BotswanaCape Verde
EgyptFiji
GabonMadagascar
MalawiMozambique
Sao Tome and PSenegal
Swaziland
ChileGuatemala
HaitiNicaragua
PeruSurinameZambia
Zimbabwe
BoliviaEl Salvador
GuyanaHonduras
MexicoMorocco
Trinidad and Tobago
BelizeBrazil
ColombiaDjiboutiEcuador
ParaguayTunisia
Venezuela
AlgeriaGrenadaJamaica
South AfricaSt. Vincent and the G
MauritiusNamibia
Antigua and BarbudaArgentinaAustraliaBarbadosCanada
Costa RicaDominica
Dom RepublicNew Zealand
PanamaSt. Kitts and Nevis
St. LuciaUnited States
69
12
8 7 85
2
13
77.
58
8.5
99.
510
Med
ian
Cur
rent
Inco
me
(in lo
gs)
010
2030
4050
6070
Num
ber
of c
ount
ries
[0, 0.005) [0.005, 0.025) [0.025, 0.045) [0.045, 0.065) [0.065, 0.085) [0.085, 0.105) [0.105, 0.125) [0.125, 1]
)sixathgir(emocnInaideMseirtnuocforebmuN
European Share at Colonization and Median Current Income
Fig. 1 Distribution of colonial European settlement andmedian current income. This figure shows the numberof countries classified in groups according to their European shares at colonization (left axis). The mediancurrent income (in logs) for each group is also reported (right axis)
123
236 J Econ Growth (2016) 21:225–257
ranges. Two key patterns emerge. First, median Current income is positively associated withEuro share. Second, very few countries have Euro share greater than 0.125. While ES andAJR do not provide an empirical definition of a “settler colony,” we use 12.5 % as a usefulbenchmark.
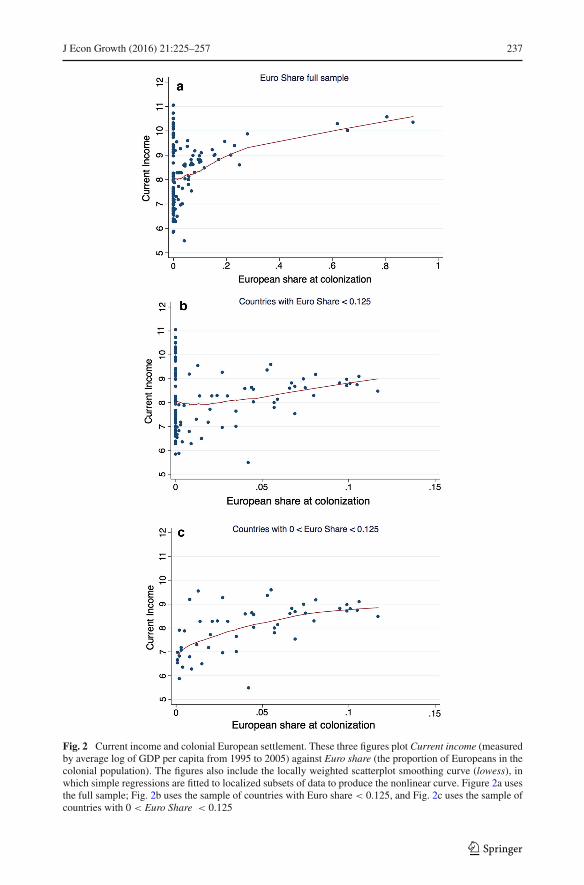
Figure 2a and b illustrate the relationship between Current income and Euro share usingLowess, which is a nonparametric regression method that fits simple models to localizedsubsets of the data and then smooths these localized estimates into the curves provided inFig. 2a and b. Figure 2a illustrates the relationship for the full sample of non-Europeancountries. Figure 2b provides the curve for the sub-sample of countries with measured valuesof Euro share less than 12.5 %. Figure 2c omits zero observations from Fig. 2b. As shown,the relationship between Euro share and Current income is positive throughout. There is noapparent region in which an increase in Euro share is associated with a reduction in Currentincome, although 2c shows a steeper relationship at very low values of Euro share than 2b.We examine this more formally below.
4.2 Euro share and economic development today
In this section, we use regressions to condition on a range of national characteristics andassess the independent relationship between Current income and Euro share, where we usesubscript i to represent an individual country.
We consider the following cross-country regression:
Current incomei = α + β∗Euro sharei + γ ′Xi + ui , (1)
where Xi is a matrix of the characteristics of country i that we define below and ui is anerror term, reflecting economic growth factors that are idiosyncratic to country i , as well asomitted variables, and mis-specification of the functional form. Different theories providedistinct predictions about (a) the coefficient on the share of Europeans in country i (β), (b)whether β changes when conditioning on particular national characteristics, and (c) how β
changes across sub-samples of countries.We get some insight into the channels connecting Euro share and Current income by
examining how β changes when controlling for the different potential channels discussedabove: political institutions and human capital. If Euro share is related to current levels ofeconomic development through the formation of enduring political institutions, then Euroshare may not enjoy an association with economic development today conditioning on polit-ical institutions. And, if Euro share is related to economic development today through thespread of human capital, then Euro share may not have an association with developmenttoday conditioning on educational attainment today. Of course, both current political institu-tions and educational attainment are endogenous to current economic development, so thesefindings must be interpreted cautiously.
We begin by evaluating Eq. (1) while conditioning on an array of national characteristics(X). Legal origin is a dummy variable that equals one if the country has a common law(British) legal tradition. This dummy variable both captures the argument by North (1990)that the United Kingdom instilled better growth-promoting institutions than other Europeanpowers and the view advanced by La Porta et al. (1998) that the British legal tradition wasmore conducive to the development of growth-enhancing financial systems than other legalorigins, such as the Napoleonic Code passed on by French and other European colonizers.Further differentiating across different civil law traditions, as inLaPorta et al. (1998), does notalter the results.Education equals the average gross rate of secondary school enrollment from1995 to 2005 and is taken from the World Development Indicators. Independence equals the
123
J Econ Growth (2016) 21:225–257 237
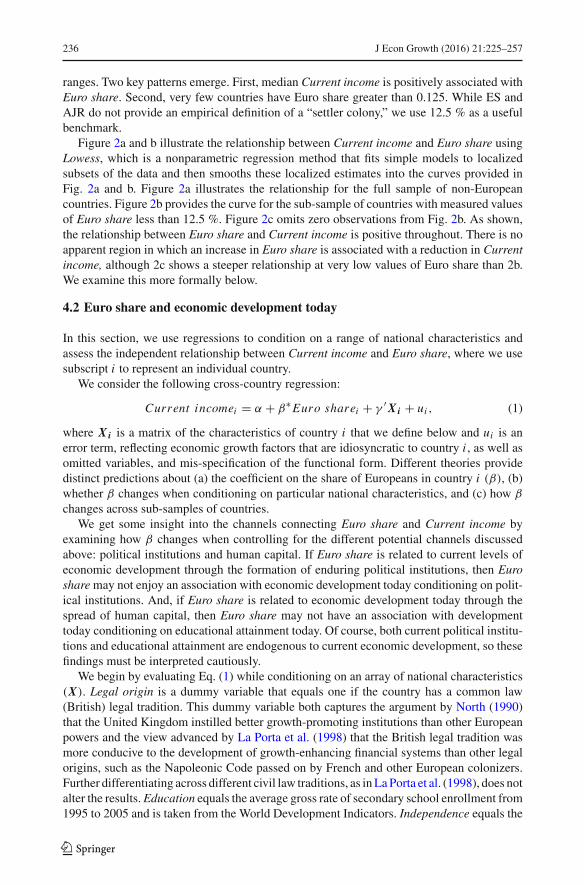
Fig. 2 Current income and colonial European settlement. These three figures plot Current income (measuredby average log of GDP per capita from 1995 to 2005) against Euro share (the proportion of Europeans in thecolonial population). The figures also include the locally weighted scatterplot smoothing curve (lowess), inwhich simple regressions are fitted to localized subsets of data to produce the nonlinear curve. Figure 2a usesthe full sample; Fig. 2b uses the sample of countries with Euro share < 0.125, and Fig. 2c uses the sample ofcountries with 0 < Euro Share < 0.125
123
238 J Econ Growth (2016) 21:225–257
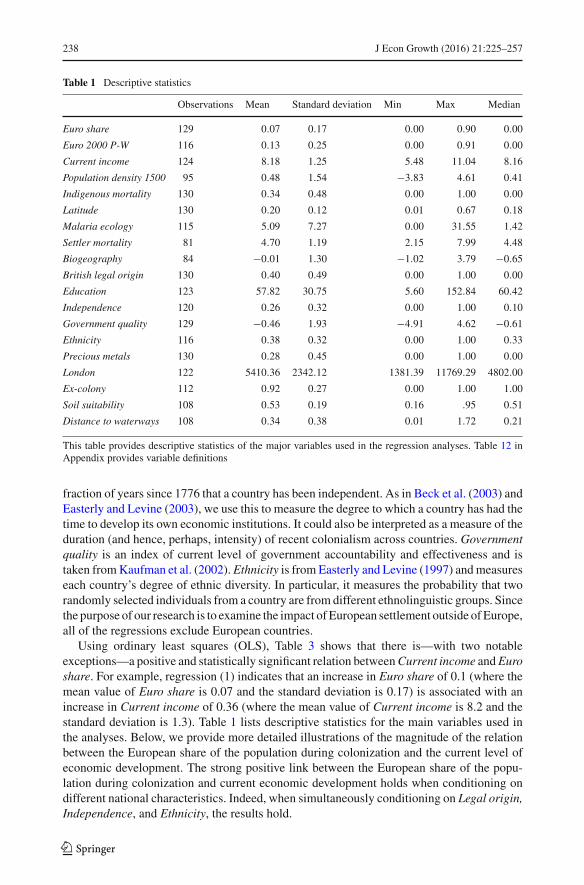
Table 1 Descriptive statistics
Observations Mean Standard deviation Min Max Median
Euro share 129 0.07 0.17 0.00 0.90 0.00
Euro 2000 P-W 116 0.13 0.25 0.00 0.91 0.00
Current income 124 8.18 1.25 5.48 11.04 8.16
Population density 1500 95 0.48 1.54 −3.83 4.61 0.41
Indigenous mortality 130 0.34 0.48 0.00 1.00 0.00
Latitude 130 0.20 0.12 0.01 0.67 0.18
Malaria ecology 115 5.09 7.27 0.00 31.55 1.42
Settler mortality 81 4.70 1.19 2.15 7.99 4.48
Biogeography 84 −0.01 1.30 −1.02 3.79 −0.65
British legal origin 130 0.40 0.49 0.00 1.00 0.00
Education 123 57.82 30.75 5.60 152.84 60.42
Independence 120 0.26 0.32 0.00 1.00 0.10
Government quality 129 −0.46 1.93 −4.91 4.62 −0.61
Ethnicity 116 0.38 0.32 0.00 1.00 0.33
Precious metals 130 0.28 0.45 0.00 1.00 0.00
London 122 5410.36 2342.12 1381.39 11769.29 4802.00
Ex-colony 112 0.92 0.27 0.00 1.00 1.00
Soil suitability 108 0.53 0.19 0.16 .95 0.51
Distance to waterways 108 0.34 0.38 0.01 1.72 0.21
This table provides descriptive statistics of the major variables used in the regression analyses. Table 12 inAppendix provides variable definitions
fraction of years since 1776 that a country has been independent. As in Beck et al. (2003) andEasterly and Levine (2003), we use this to measure the degree to which a country has had thetime to develop its own economic institutions. It could also be interpreted as a measure of theduration (and hence, perhaps, intensity) of recent colonialism across countries. Governmentquality is an index of current level of government accountability and effectiveness and istaken fromKaufman et al. (2002). Ethnicity is from Easterly and Levine (1997) andmeasureseach country’s degree of ethnic diversity. In particular, it measures the probability that tworandomly selected individuals from a country are from different ethnolinguistic groups. Sincethe purpose of our research is to examine the impact of European settlement outside ofEurope,all of the regressions exclude European countries.
Using ordinary least squares (OLS), Table 3 shows that there is—with two notableexceptions—a positive and statistically significant relation betweenCurrent income andEuroshare. For example, regression (1) indicates that an increase in Euro share of 0.1 (where themean value of Euro share is 0.07 and the standard deviation is 0.17) is associated with anincrease in Current income of 0.36 (where the mean value of Current income is 8.2 and thestandard deviation is 1.3). Table 1 lists descriptive statistics for the main variables used inthe analyses. Below, we provide more detailed illustrations of the magnitude of the relationbetween the European share of the population during colonization and the current level ofeconomic development. The strong positive link between the European share of the popu-lation during colonization and current economic development holds when conditioning ondifferent national characteristics. Indeed, when simultaneously conditioning on Legal origin,Independence, and Ethnicity, the results hold.
123

J Econ Growth (2016) 21:225–257 239
Table2
Determinantsof
colonialEuropeansettlem
ent
(1)
(2)
(3)
(4)
(5)
(6)
(7)
(8)
Eur
oSh
are
Popu
lati
onde
nsit
y15
00−0
.0376**
−0.0272***
−0.0277***
−0.0275***
−0.0224*
−0.0270***
−0.0323**
−0.0177
(0.02)
(0.01)
(0.01)
(0.01)
(0.05)
(0.01)
(0.01)
(0.24)
Indi
geno
usm
orta
lity
0.140***
0.136***
0.139***
0.131***
0.104***
0.139***
0.0818**
0.0243
(0.00)
(0.00)
(0.00)
(0.00)
(0.00)
(0.00)
(0.04)
(0.65)
Lat
itud
e0.704***
0.715***
0.728***
0.748***
0.728***
0.707***
0.767***
(0.00)
(0.00)
(0.00)
(0.00)
(0.00)
(0.00)
(0.00)
Pre
ciou
sm
etal
s−0
.0128
0.0177
(0.66)
(0.62)
Lon
don
−2.06e-06
−5.71e-06
(0.78)
(0.56)
Bio
geog
raph
y−0
.0184
−0.0481**
(0.12)
(0.02)
Mal
aria
ecol
ogy
0.00116
5.56e-05
(0.37)
(0.98)
Sett
ler
mor
tali
ty−0
.0146
−0.0489**
(0.22)
(0.03)
Num
berof
observations
9494
9490
7188
7257
R-squared
0.352
0.541
0.542
0.544
0.586
0.539
0.580
0.675
Thistablepresentsregression
results
concerning
which
factorsshaped
Europ
eansettlem
entduringcolonizatio
n.The
sampleisno
n-Europ
eancoun
tries.The
depend
entvariableis
Eur
osh
are,which
givestheprop
ortio
nof
Europ
eans
inthecolonialpo
pulatio
n.Po
pula
tion
dens
ity
1500
iscomputedas
thelogarithm
ofpopulatio
ndensity
in1500.I
ndig
enou
sm
orta
lity
takesavalueof
oneiftheregion
experiencedalargedrop
intheindigeno
uspo
pulatio
nfrom
diseases
brou
ghtby
Europ
eans,and
zero
otherw
ise.
Lat
itud
emeasures
theabsolutevalueof
thedistance
ofthecolony
from
theequator.
Pre
ciou
sm
etal
sisan
indicatorof
whether
theregion
hasvaluablemineralsthatmay
have
affected
European
settlem
ent.
Lon
donmeasuresthedistance
ofthecolony
from
Lon
don.
Bio
geog
raph
yisan
indexof
theprehistoricavailabilityof
storablecropsanddomesticableanim
als,where
largevalues
signifyhigher
availability.
Mal
aria
ecol
ogyisan
ecologically-based
spatialindexof
thestability
ofmalaria
transm
ission
inaregion,w
here
larger
values
signify
agreaterpropensity
formalaria
transm
ission.S
ettl
erm
orta
lity
equalshistorical
deaths
perannum
per1000
Europeansettlers.Allspecificatio
nsareestim
ated
usingOLSwith
heteroskedasticity
-consistentstandarderrors.P
values
arereported
inparentheses.*,
**,and
***indicatesignificanceatthe10,5
,and
1%
levels,respectively.Moredetailed
variabledefin
ition
sandsourcesareprovided
inTable12
inApp
endixandtheOnlineDataApp
endix
123
240 J Econ Growth (2016) 21:225–257
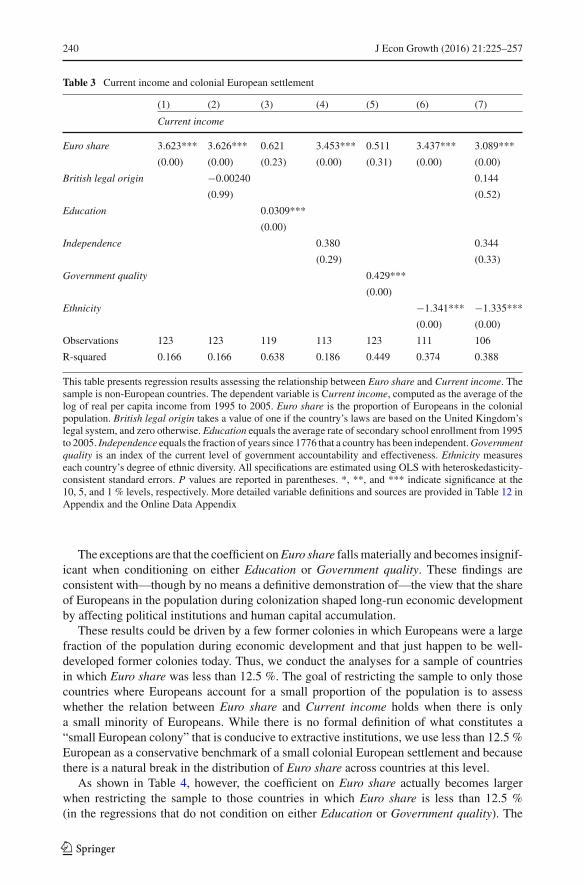
Table 3 Current income and colonial European settlement
(1) (2) (3) (4) (5) (6) (7)
Current income
Euro share 3.623*** 3.626*** 0.621 3.453*** 0.511 3.437*** 3.089***
(0.00) (0.00) (0.23) (0.00) (0.31) (0.00) (0.00)
British legal origin −0.00240 0.144
(0.99) (0.52)
Education 0.0309***
(0.00)
Independence 0.380 0.344
(0.29) (0.33)
Government quality 0.429***
(0.00)
Ethnicity −1.341*** −1.335***
(0.00) (0.00)
Observations 123 123 119 113 123 111 106
R-squared 0.166 0.166 0.638 0.186 0.449 0.374 0.388
This table presents regression results assessing the relationship between Euro share and Current income. Thesample is non-European countries. The dependent variable is Current income, computed as the average of thelog of real per capita income from 1995 to 2005. Euro share is the proportion of Europeans in the colonialpopulation. British legal origin takes a value of one if the country’s laws are based on the United Kingdom’slegal system, and zero otherwise. Education equals the average rate of secondary school enrollment from 1995to 2005. Independence equals the fraction of years since 1776 that a country has been independent.Governmentquality is an index of the current level of government accountability and effectiveness. Ethnicity measureseach country’s degree of ethnic diversity. All specifications are estimated using OLS with heteroskedasticity-consistent standard errors. P values are reported in parentheses. *, **, and *** indicate significance at the10, 5, and 1 % levels, respectively. More detailed variable definitions and sources are provided in Table 12 inAppendix and the Online Data Appendix
The exceptions are that the coefficient onEuro share fallsmaterially and becomes insignif-icant when conditioning on either Education or Government quality. These findings areconsistent with—though by no means a definitive demonstration of—the view that the shareof Europeans in the population during colonization shaped long-run economic developmentby affecting political institutions and human capital accumulation.
These results could be driven by a few former colonies in which Europeans were a largefraction of the population during economic development and that just happen to be well-developed former colonies today. Thus, we conduct the analyses for a sample of countriesin which Euro share was less than 12.5 %. The goal of restricting the sample to only thosecountries where Europeans account for a small proportion of the population is to assesswhether the relation between Euro share and Current income holds when there is onlya small minority of Europeans. While there is no formal definition of what constitutes a“small European colony” that is conducive to extractive institutions, we use less than 12.5 %European as a conservative benchmark of a small colonial European settlement and becausethere is a natural break in the distribution of Euro share across countries at this level.
As shown in Table 4, however, the coefficient on Euro share actually becomes largerwhen restricting the sample to those countries in which Euro share is less than 12.5 %(in the regressions that do not condition on either Education or Government quality). The
123

J Econ Growth (2016) 21:225–257 241
Table 4 Current income and colonial European settlement, Euro share < 12.5 %
(1) (2) (3) (4) (5) (6) (7)
Current income
Euro share 8.378*** 8.401*** −0.904 8.093*** 3.612 9.846*** 8.987***
(0.00) (0.00) (0.69) (0.00) (0.14) (0.00) (0.00)
British legal origin −0.0365 0.0831
(0.88) (0.72)
Education 0.0326***
(0.00)
Independence 0.427 0.419
(0.29) (0.28)
Government quality 0.427***
(0.00)
Ethnicity −1.212*** −1.161***
(0.00) (0.00)
Observations 110 110 108 100 110 98 93
R-squared 0.047 0.047 0.600 0.065 0.361 0.244 0.260
This table presents regression results assessing the relationship between Euro share and Current income.The sample is non-European countries with Euro share values of less than 0.125. The dependent variableis Current income, computed as the average of the log of real per capita income from 1995 to 2005. Euroshare is the proportion of Europeans in the colonial population.British legal origin takes a value of one ifthe country’s laws are based on the United Kingdom’s legal system, and zero otherwise. Education equalsthe average rate of secondary school enrollment from 1995 to 2005. Independence equals the fraction ofyears since 1776 that a country has been independent. Government quality is an index of the current levelof government accountability and effectiveness. Ethnicity measures each country’s degree of ethnic diversity.All specifications are estimated using OLS with heteroskedasticity-consistent standard errors. P values arereported in parentheses. *, **, and *** indicate significance at the 10, 5, and 1 % levels, respectively. Moredetailed variable definitions and sources are provided in Table 12 in Appendix and the Online Data Appendix
increase in the coefficient on Euro share when restricting the sample to former colonies withEuro share less than 12.5 %, suggests that the relationship between the European share ofthe population during colonization and the level of economic development does not simplyrepresent the economic success of “settler colonies.” Rather, a marginal increase in Euroshare is associated with a bigger increase in subsequent economic development in colonieswith only a few Europeans—one might characterize this as the diminishing marginal long-run development product of Euro share.8 Table 4 also shows that the relationship betweenCurrent income and Euro share remains sensitive to controlling for political institutionsand human capital accumulation. The association between Current income and Euro shareshrinks and becomes insignificant when conditioning on Education or Government quality.
The coefficient on the British legal origin dummy variable is never significant (nor willit be in the rest of the paper). It is also of interest that many of the colonies with Euroshare < 0.125 were Spanish colonies. Hence we find no evidence for the popular view thatBritish colonization or legal origin led to more development than Spanish colonization orlegal origin.
8 To assess this interpretation further, we included linear and quadratic expressions for Euro share.Wefind thatthe linear term enters positively and significantly, while the quadratic term enters negatively and significantly.Canada and the United States are beyond the apex of the curve, which is very flat in this region.
123

242 J Econ Growth (2016) 21:225–257
Table5
Current
incomeandcolonialEuropeansettlem
ent,sensitivity
analyses
(1)
(2)
(3)
(4)
(5)
(6)
(7)
Dependent
variable
Cur
rent
inco
me
Add
ition
alcontrols
Leg
alor
igin
Edu
cati
onIn
depe
nden
ceG
over
nmen
tqua
lity
Eth
nici
tyL
egal
orig
in,i
ndep
ende
nce,
ethn
icit
y
Panel1
:Sam
pleof
non-Europ
eancoun
tries
Eur
oSh
are
2.68
1***
2.72
7***
1.45
0***
2.60
7***
1.05
2*2.59
0***
2.62
8***
(0.00)
(0.00)
(0.00)
(0.00)
(0.10)
(0.00)
(0.00)
Observatio
ns63
6361
6263
6362
R-squ
ared
0.77
70.77
70.86
90.78
80.84
90.78
30.79
6
Panel2
:Sam
pleof
non-Europ
eancoun
trieswith
Eur
osha
re<
0.12
5
Eur
oSh
are
12.00*
**12
.14*
**3.10
910
.81*
**8.63
4***
12.50*
**11
.38*
**
(0.00)
(0.00)
(0.37)
(0.01)
(0.00)
(0.00)
(0.00)
Observatio
ns55
5553
5455
5554
R-squ
ared
0.72
20.72
20.81
80.73
40.80
90.72
90.74
1
The
depend
entvariable
isC
urre
ntin
com
e,compu
tedas
theaverageof
thelogof
real
percapita
incomefrom
1995
to20
05.E
uro
shar
eistheprop
ortio
nof
Europ
eans
inthe
colonialpo
pulatio
n.L
egal
orig
intakesavalueof
oneifthecountry’slawsarebasedon
theUnitedKingdom
’slegalsystem,and
zero
otherw
ise.
Edu
cati
onequalstheaverage
rateof
second
aryscho
olenrollm
entfrom19
95to20
05.I
ndep
ende
nceequalsthefractio
nof
yearssince17
76thatacoun
tryhasbeen
independ
ent.
Gov
ernm
entq
uali
tyisan
index
ofthecurrentlevelof
governmentaccountabilityandeffectiveness.
Eth
nici
tymeasureseach
coun
try’sdegree
ofethn
icdiversity.A
llof
theregression
scontrolfor
Indi
geno
usm
orta
lity
,Lat
itud
e,P
reci
ous
met
als,
Lon
don,
Bio
geog
raph
y,M
alar
iaec
olog
y,Se
ttle
rm
orta
lity,and
thecontinentdum
myvariables.The
textandTable12
inApp
endixdefin
ethe
variables.Allspecificatio
nsareestim
ated
usingOLSwith
heteroskedasticity
-consistentstandarderrors.P
values
arereported
inparentheses.*,**,and
***indicatesignificance
atthe10,5,and
1%
levels,respectively.Moredetailedvariabledefin
itionsandsourcesareprovided
inTable12
inApp
endixandtheOnlineDataApp
endix.
123

J Econ Growth (2016) 21:225–257 243
Fig. 3 Colonial European share and European share today. This figure shows a simple scatter plot comparingthe proportion of Europeans in the Colonial population with the same proportion in 2000
As robustness tests, we next expand the conditioning information set (X) and report theresults in Table 5. In particular, we repeat the analyses in Tables 3 and 4 except that inall of the regressions we include the control variables from Table 2 (Indigenous mortality,Latitude, Precious metals, London, Biogeography, Malaria ecology, and Settler mortality)and continent fixed effects. We use the UN coding and definitions of populated continents—Europe,Africa,Asia, theAmericas, andOceania. TheUNcoding of continents seems to us theleast susceptible to later, possibly endogenous, splits of regions such asNorthAfrica and Sub-SaharanAfrica, orNorth andSouthAmerica.9 Since our sample excludesEuropean countries,we do not include a dummy variable for the continent of Europe, and since Indigenousmortality is the summation of the Americas and Oceania dummy variables, it drops from theanalyses.
Although expanding the conditioning information set reduces the sample by about 50%, the results hold. In no case does expanding the conditioning information set cause thecoefficient onEuro share to become statistically insignificant compared to the results reportedand already discussed in the Table 3 and 4 analyses.10
4.3 Is it Europeans during colonization or Europeans today?
If Euro share proxies for the proportion of the population today that is of European descent,then it would be inappropriate to interpret the results in Tables 3 and 4 on Euro share as
9 Ashraf and Galor (2011, 2013) likewise say “a single continent dummy is used to represent the Americas,which is natural given the historical period examined.”10 These results are robust to several additional checks that will be discussed more below. First, although thesample size drops still further, the results on Euro share hold when adding key variables fromAshraf and Galor(2013), such as Soil suitability or Distance to waterways, to the Table 5 regressions. Second, the results arealso robust to including a dummy variable for whether the country is a former colony, i.e., Ex-colony as definedin the Online Data Appendix and constructed by AJR (2001). All robustness checks described throughout thepaper are available from the authors on request.
123
244 J Econ Growth (2016) 21:225–257
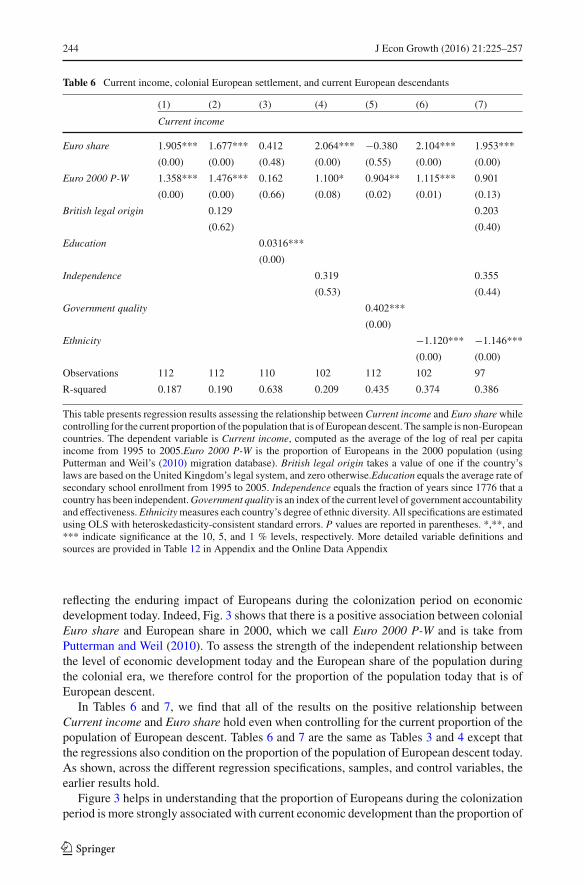
Table 6 Current income, colonial European settlement, and current European descendants
(1) (2) (3) (4) (5) (6) (7)
Current income
Euro share 1.905*** 1.677*** 0.412 2.064*** −0.380 2.104*** 1.953***
(0.00) (0.00) (0.48) (0.00) (0.55) (0.00) (0.00)
Euro 2000 P-W 1.358*** 1.476*** 0.162 1.100* 0.904** 1.115*** 0.901
(0.00) (0.00) (0.66) (0.08) (0.02) (0.01) (0.13)
British legal origin 0.129 0.203
(0.62) (0.40)
Education 0.0316***
(0.00)
Independence 0.319 0.355
(0.53) (0.44)
Government quality 0.402***
(0.00)
Ethnicity −1.120*** −1.146***
(0.00) (0.00)
Observations 112 112 110 102 112 102 97
R-squared 0.187 0.190 0.638 0.209 0.435 0.374 0.386
This table presents regression results assessing the relationship between Current income and Euro share whilecontrolling for the current proportion of the population that is of European descent. The sample is non-Europeancountries. The dependent variable is Current income, computed as the average of the log of real per capitaincome from 1995 to 2005.Euro 2000 P-W is the proportion of Europeans in the 2000 population (usingPutterman and Weil’s (2010) migration database). British legal origin takes a value of one if the country’slaws are based on the United Kingdom’s legal system, and zero otherwise.Education equals the average rate ofsecondary school enrollment from 1995 to 2005. Independence equals the fraction of years since 1776 that acountry has been independent.Government quality is an index of the current level of government accountabilityand effectiveness.Ethnicitymeasures each country’s degree of ethnic diversity. All specifications are estimatedusing OLS with heteroskedasticity-consistent standard errors. P values are reported in parentheses. *,**, and*** indicate significance at the 10, 5, and 1 % levels, respectively. More detailed variable definitions andsources are provided in Table 12 in Appendix and the Online Data Appendix
reflecting the enduring impact of Europeans during the colonization period on economicdevelopment today. Indeed, Fig. 3 shows that there is a positive association between colonialEuro share and European share in 2000, which we call Euro 2000 P-W and is take fromPutterman and Weil (2010). To assess the strength of the independent relationship betweenthe level of economic development today and the European share of the population duringthe colonial era, we therefore control for the proportion of the population today that is ofEuropean descent.
In Tables 6 and 7, we find that all of the results on the positive relationship betweenCurrent income and Euro share hold even when controlling for the current proportion of thepopulation of European descent. Tables 6 and 7 are the same as Tables 3 and 4 except thatthe regressions also condition on the proportion of the population of European descent today.As shown, across the different regression specifications, samples, and control variables, theearlier results hold.
Figure 3 helps in understanding that the proportion of Europeans during the colonizationperiod is more strongly associated with current economic development than the proportion of
123

J Econ Growth (2016) 21:225–257 245
Table 7 Current income, colonial European settlement, and current European descendants, Euro share <
12.5 %
(1) (2) (3) (4) (5) (6) (7)
Current Income
Euro share 6.455** 6.087** −1.709 7.471** 2.329 8.702*** 8.649***
(0.02) (0.04) (0.51) (0.01) (0.46) (0.00) (0.01)
Euro 2000 P-W 1.026** 1.136** 0.287 0.621 0.757 0.701 0.350
(0.02) (0.03) (0.54) (0.43) (0.14) (0.13) (0.64)
British legal origin 0.102 0.162
(0.71) (0.51)
Education 0.0333***
(0.00)
Independence 0.386 0.443
(0.49) (0.38)
Government quality 0.408***
(0.00)
Ethnicity −1.094*** −1.085***
(0.00) (0.00)
Observations 104 104 102 94 104 94 89
R-squared 0.070 0.072 0.599 0.089 0.356 0.251 0.267
This table presents regression results assessing the relationship between Current income and Euro share whilecontrolling for the current proportion of the population that is of European descent. The sample is non-Europeancountries withEuro share values of less than 0.125. The dependent variable isCurrent income, computed as theaverage of the log of real per capita income from1995 to 2005.Euro 2000 P-W is the proportion of Europeans inthe 2000 population (using Putterman andWeil’s (2010) migration database). British legal origin takes a valueof one if the country’s laws are based on the United Kingdom’s legal system, and zero otherwise. Educationequals the average rate of secondary school enrollment from 1995 to 2005.Independence equals the fractionof years since 1776 that a country has been independent. Government quality is an index of the current levelof government accountability and effectiveness. Ethnicity measures each country’s degree of ethnic diversity.All specifications are estimated using OLS with heteroskedasticity-consistent standard errors. P values arereported in parentheses. *,**, and *** indicate significance at the 10, 5, and 1 % levels, respectively. Moredetailed variable definitions and sources are provided in Table 12 in Appendix and the Online Data Appendix
the population today that is of European descent. Examining the scatter plot in Fig. 3, considerthree groups of countries: (1) countries in which Euro share was high both in colonial timesand today (e.g., North America), (2) countries in which Euro share was low both in colonialtimes and today (e.g., South Africa), and (3) countries in which Euro share today is muchhigher than it was in colonial times (e.g., some Central and South American countries). Ifcolonial Euro share did not have an independent link with incomes today, then we wouldexpect group (3)’s income to be more like group (1)’s income. But, this is not what we find. Incontrast, if colonial Euro share does matter independently for income today, then we wouldexpect group (3)’s income to have lower income than group (1) and to have similar incometo group (2). This is what we observe. The proportion of Europeans during the colonizationperiod is independently associated with economic development today.
In Table 8, we add the same conditioning variables to the Tables 6 and 7 regressionsthat were used in Table 5. That is, in Table 8, we not only control for the proportion of thepopulation of European descent in 2000, we also include the continent fixed effects as well
123
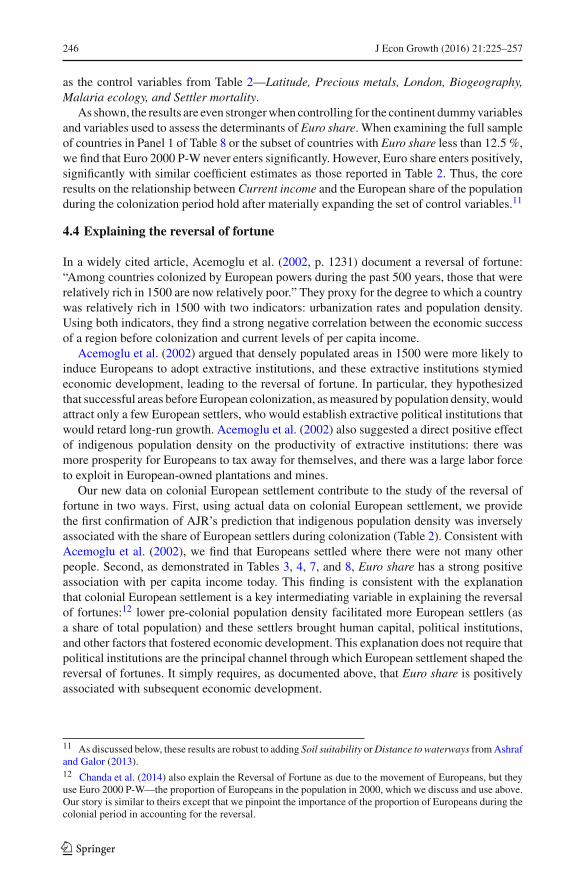
246 J Econ Growth (2016) 21:225–257
as the control variables from Table 2—Latitude, Precious metals, London, Biogeography,Malaria ecology, and Settler mortality.
As shown, the results are even strongerwhen controlling for the continent dummyvariablesand variables used to assess the determinants of Euro share. When examining the full sampleof countries in Panel 1 of Table 8 or the subset of countries with Euro share less than 12.5 %,we find that Euro 2000 P-W never enters significantly. However, Euro share enters positively,significantly with similar coefficient estimates as those reported in Table 2. Thus, the coreresults on the relationship between Current income and the European share of the populationduring the colonization period hold after materially expanding the set of control variables.11
4.4 Explaining the reversal of fortune
In a widely cited article, Acemoglu et al. (2002, p. 1231) document a reversal of fortune:“Among countries colonized by European powers during the past 500 years, those that wererelatively rich in 1500 are now relatively poor.” They proxy for the degree to which a countrywas relatively rich in 1500 with two indicators: urbanization rates and population density.Using both indicators, they find a strong negative correlation between the economic successof a region before colonization and current levels of per capita income.
Acemoglu et al. (2002) argued that densely populated areas in 1500 were more likely toinduce Europeans to adopt extractive institutions, and these extractive institutions stymiedeconomic development, leading to the reversal of fortune. In particular, they hypothesizedthat successful areas before European colonization, asmeasured by population density, wouldattract only a few European settlers, who would establish extractive political institutions thatwould retard long-run growth. Acemoglu et al. (2002) also suggested a direct positive effectof indigenous population density on the productivity of extractive institutions: there wasmore prosperity for Europeans to tax away for themselves, and there was a large labor forceto exploit in European-owned plantations and mines.
Our new data on colonial European settlement contribute to the study of the reversal offortune in two ways. First, using actual data on colonial European settlement, we providethe first confirmation of AJR’s prediction that indigenous population density was inverselyassociated with the share of European settlers during colonization (Table 2). Consistent withAcemoglu et al. (2002), we find that Europeans settled where there were not many otherpeople. Second, as demonstrated in Tables 3, 4, 7, and 8, Euro share has a strong positiveassociation with per capita income today. This finding is consistent with the explanationthat colonial European settlement is a key intermediating variable in explaining the reversalof fortunes:12 lower pre-colonial population density facilitated more European settlers (asa share of total population) and these settlers brought human capital, political institutions,and other factors that fostered economic development. This explanation does not require thatpolitical institutions are the principal channel through which European settlement shaped thereversal of fortunes. It simply requires, as documented above, that Euro share is positivelyassociated with subsequent economic development.
11 As discussed below, these results are robust to adding Soil suitability orDistance to waterways fromAshrafand Galor (2013).12 Chanda et al. (2014) also explain the Reversal of Fortune as due to the movement of Europeans, but theyuse Euro 2000 P-W—the proportion of Europeans in the population in 2000, which we discuss and use above.Our story is similar to theirs except that we pinpoint the importance of the proportion of Europeans during thecolonial period in accounting for the reversal.
123
J Econ Growth (2016) 21:225–257 247
Table8
Current
income,colonialEuropeansettlem
ent,andcurrentE
uropeandescendants,sensitivity
analyses
(1)
(2)
(3)
(4)
(5)
(6)
(7)
Dependent
variable
Cur
rent
inco
me
Add
ition
alcontrols
Leg
alor
igin
Edu
cati
onIn
depe
nden
ceG
over
nmen
tqua
lity
Eth
nici
tyL
egal
orig
in,i
ndep
ende
nce,
ethn
icit
y
Panel1
:Sam
pleof
non-Europ
eancoun
tries
Eur
oSh
are
2.12
4***
2.11
7***
1.48
3***
2.03
2***
0.93
52.16
0***
2.19
5***
(0.00)
(0.01)
(0.01)
(0.00)
(0.15)
(0.00)
(0.00)
Eur
o20
00P
-W0.79
60.79
9−0
.055
20.82
90.20
30.64
10.60
9
(0.14)
(0.15)
(0.90)
(0.11)
(0.63)
(0.30)
(0.30)
Observatio
ns63
6361
6263
6362
R-squ
ared
0.77
70.77
70.86
90.78
80.84
90.78
30.79
6
Panel2
:Sam
pleof
non-Europ
eancoun
trieswith
Euroshare
<0.12
5
Eur
oSh
are
11.56*
**11
.64*
**3.05
110
.34*
*8.60
3***
12.11*
**11
.00*
**
(0.00)
(0.01)
(0.37)
(0.01)
(0.00)
(0.00)
(0.01)
Eur
o20
00P
-W0.57
0.56
20.14
70.51
30.04
860.47
20.39
(0.48)
(0.50)
(0.81)
(0.51)
(0.93)
(0.55)
(0.62)
Observatio
ns55
5553
5455
5554
R-squ
ared
0.72
40.72
40.81
80.73
50.80
90.73
00.74
1
The
depend
entvariable
isC
urre
ntin
com
e,compu
tedas
theaverageof
thelogof
real
percapita
incomefrom
1995
to20
05.E
uro
shar
eistheprop
ortio
nof
Europ
eans
inthe
colonial
popu
latio
n.E
uro
2000
P-W
istheprop
ortio
nof
Europ
eans
inthe20
00po
pulatio
n.L
egal
orig
intakesavalueof
oneifthecountry’slawsarebasedon
theUnited
Kingdom
’slegalsystem,and
zero
otherw
ise.
Edu
cati
onequalstheaveragerateof
second
aryscho
olenrollm
entfrom19
95to20
05.I
ndep
ende
nceequalsthefractio
nof
yearssince
1776
thatacoun
tryhasbeen
independ
ent.
Gov
ernm
entq
uali
tyisan
indexof
thecurrentlevelof
governmentaccountability
andeffectiveness.
Eth
nici
tymeasureseach
coun
try’s
degree
ofethn
icdiversity.A
llof
theregression
scontrolfor
Indi
geno
usm
orta
lity
,Lat
itud
e,P
reci
ous
met
als,
Lon
don,
Bio
geog
raph
y,M
alar
iaec
olog
y,Se
ttle
rm
orta
lity,and
the
continentdum
myvariables.The
textandTable12
inAppendixdefin
ethevariables.Allspecificatio
nsareestim
ated
usingOLSwith
heteroskedasticity
-consistentstandarderrors.
Pvalues
arereported
inparentheses.*,**,and
***indicatesignificanceatthe10,5,and
1%
levels,respectively.Moredetailedvariabledefin
itionsandsourcesareprovided
inTable12
inApp
endixandtheOnlineDataApp
endix
123

248 J Econ Growth (2016) 21:225–257
4.5 Additional robustness tests
These results are robust to several sensitivity analyses. First, there might be concerns aboutthe dating of Euro share. As discussed above, we attempt to use a date in each country’shistory that is at least a century after initial European contact, but at least 50 years beforeindependence. This is both a bit arbitrary and often infeasible due to data availability. Thus,were-do all of the analyses using three alternative ways of computing Euro share. We computethe average value of the share or European settlement in our data over three uniform periods:(1) 1500–1800, (2) 1801–1900, and (3) 1500–1900.13 Table 9 provide the regression resultsusing these alternative methods for dating the share of colonial European settlement. Asshown, all of the earlier results hold.
Second, there might also be concerns that (1) we assign a value of zero to Euro share ifwe find no historical sources documenting European settlement in a particular colony and(2) countries in which Euro share equals zero are special cases. Thus, we conducted twosensitivity tests. We simply re-did the analyses while eliminating all countries with Euroshare equal to zero. All of the results hold (Table 10).
Furthermore, we re-did the analyses while including a dummy variable called Dummy foreuro share equal to zero that equals one if Euro share equals zero and zero otherwise. Theseresults are reported in Table 11.As shown, all of the results onEuro share holdwhen includingthis dummy variable. The finding that Dummy for euro share equal to zero generally enterswith a positive and significant coefficient in the Tables 4 and 7 specifications that restrictthe sample to Euro Share <.125) provides some suggestive evidence for the view that smallEuropean settlements had harmful effects on long-run economic development compared tono European settlement. The estimates, however, indicate that the positive effect of Euroshare on Current income quickly surpasses the positive effect of the Dummy for euro shareequal to zero on Current income. For instance, the estimates from column (1) of Table 11,Panel 2 indicate that a Euro share of greater than 0.048 is better for Current income than aEuro share of zero.
Third, we also assess whether other geographic endowments account for the findings onthe relation between Euro share and Current income. In particular, we use variables fromAshraf and Galor (2013), the impact of soil quality and access to navigable waterways. Forsoil quality, they gauge the suitability of the soil for agriculture though measures of soilcarbon density and soil pH. For navigable waterways, they use the average distance fromgrid cells throughout a country to the nearest ice-free coastline or sea-navigable river. Whenwe include these measures of geographic endowments in our analyses, all of the results hold.
Fourth, theremight be concerns thatwe do notmeasure the effect of European colonizationcompared to no colonization, and hence might not sufficiently distinguish European colo-nization from European settlement. This is a valid issue but difficult to study empirically,since few non-European countries completely escaped colonization or some intermediateform of European control, and there is ambiguity and disagreement as to which ones theyare. For example, AJR identify the following countries as not former colonies: China, Iran,Japan, Korea, Liberia, Mongolia, Thailand, Turkey, and Uzbekistan. There are, however, dis-agreements because, for example, China had semi-colonial enclaves, Iran was a “sphere ofinterest” for Russia and Britain, Uzbekistan partially belonged to the Russian empire, Koreawas a Japanese colony, and descendants of American slaves governed Liberia. In the other
13 Note that the sample will include only observations with positive Euro Share for these periods. A “dogdid not bark” method might be acceptable for the entire historical period to equate lack of mention of colonialsettlement with zero colonial settlement. But this method is more problematic with finer breakdowns ofhistorical sub-periods.
123
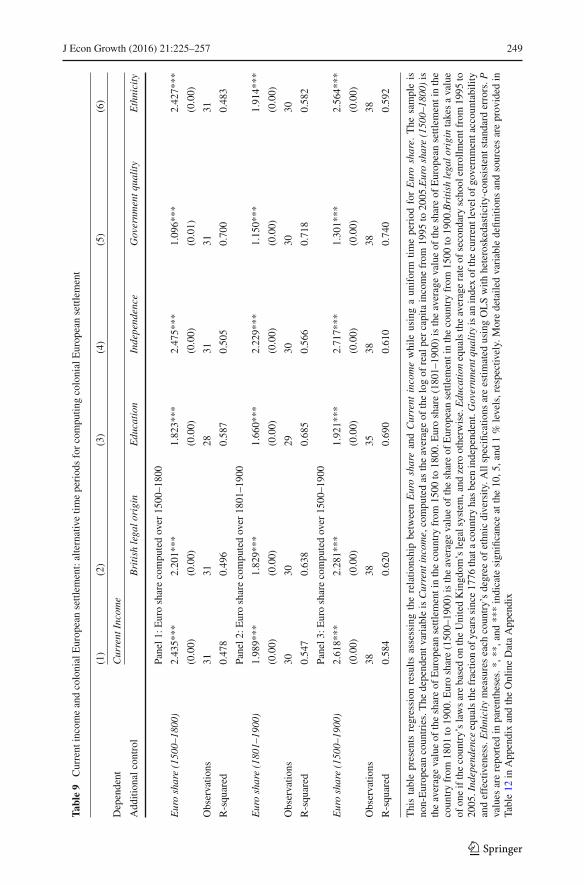
J Econ Growth (2016) 21:225–257 249
Table9
Current
incomeandcolonialEurop
eansettlem
ent:alternativetim
eperiod
sforcompu
tingcolonialEurop
eansettlem
ent
(1)
(2)
(3)
(4)
(5)
(6)
Dependent
Cur
rent
Inco
me
Add
ition
alcontrol
Bri
tish
lega
lori
gin
Edu
cati
onIn
depe
nden
ceG
over
nmen
tqua
lity
Eth
nici
ty
Panel1
:Eurosharecompu
tedover
1500
–180
0
Eur
osh
are
(150
0–18
00)
2.43
5***
2.20
1***
1.82
3***
2.47
5***
1.09
6***
2.42
7***
(0.00)
(0.00)
(0.00)
(0.00)
(0.01)
(0.00)
Observatio
ns31
3128
3131
31
R-squ
ared
0.47
80.49
60.58
70.50
50.70
00.48
3
Panel2
:Eurosharecompu
tedover
1801
–190
0
Eur
osh
are
(180
1–19
00)
1.98
9***
1.82
9***
1.66
0***
2.22
9***
1.15
0***
1.91
4***
(0.00)
(0.00)
(0.00)
(0.00)
(0.00)
(0.00)
Observatio
ns30
3029
3030
30
R-squ
ared
0.54
70.63
80.68
50.56
60.71
80.58
2
Panel3
:Eurosharecompu
tedover
1500
–190
0
Eur
osh
are
(150
0–19
00)
2.61
8***
2.28
1***
1.92
1***
2.71
7***
1.30
1***
2.56
4***
(0.00)
(0.00)
(0.00)
(0.00)
(0.00)
(0.00)
Observatio
ns38
3835
3838
38
R-squ
ared
0.58
40.62
00.69
00.61
00.74
00.59
2
Thistablepresents
regression
results
assessingtherelatio
nshipbetween
Eur
osh
areand
Cur
rent
inco
mewhile
usingaun
iform
timeperiod
for
Eur
osh
are.
The
sampleis
non-Europ
eancoun
tries.The
depend
entv
ariableis
Cur
rent
inco
me,compu
tedas
theaverageof
thelogof
realpercapitaincomefrom
1995
to20
05.E
uro
shar
e(1
500–
1800
)is
theaveragevalueof
theshareof
Europ
eansettlem
entinthecoun
tryfrom
1500
to18
00.E
uroshare(180
1–19
00)istheaveragevalueof
theshareof
Europ
eansettlem
entinthe
coun
tryfrom
1801
to19
00.E
uroshare(150
0–19
00)istheaveragevalueof
theshareof
Europ
eansettlem
entinthecoun
tryfrom
1500
to19
00.B
riti
shle
galo
rigi
ntakesavalue
ofoneifthecountry’slawsarebasedon
theUnitedKingdom
’slegalsystem,and
zero
otherw
ise.
Edu
cati
onequalstheaveragerateof
second
aryscho
olenrollm
entfrom
1995
to20
05.I
ndep
ende
nceequalsthefractio
nof
yearssince17
76thatacoun
tryhasbeen
independ
ent.
Gov
ernm
entq
uali
tyisan
indexof
thecurrentlevelof
governmentaccou
ntability
andeffectiveness.
Eth
nici
tymeasureseach
country’sdegree
ofethnicdiversity.A
llspecificatio
nsareestim
ated
usingOLSwith
heteroskedasticity
-consistentstandarderrors.P
values
arereported
inparentheses.*,
**,and
***indicatesignificanceatthe10,5
,and
1%
levels,respectively.Moredetailedvariabledefin
itionsandsourcesareprovided
inTable12
inApp
endixandtheOnlineDataApp
endix
123

250 J Econ Growth (2016) 21:225–257
Table10
Current
incomeandcolonialEurop
eansettlem
ent:elim
inatingcoun
trieswith
Euroshare=0
(1)
(2)
(3)
(4)
(5)
(6)
(7)
Dependent
Cur
rent
inco
me
Add
ition
alcontrol
Bri
tish
lega
lori
gin
Edu
cati
onIn
depe
nden
ceG
over
nmen
tqua
lity
Eth
nici
tyA
ll
Panel1
:Sam
pleisno
n-Europ
eancoun
trieswith
Euroshare
>0
Eur
osh
are
3.92
9***
4.05
4***
1.38
2***
3.62
5***
1.30
9**
3.63
3***
3.23
9***
(0.00)
(0.00)
(0.00)
(0.00)
(0.04)
(0.00)
(0.00)
Observatio
ns64
6461
6464
6464
R-squ
ared
0.38
90.39
30.69
20.42
20.55
30.43
20.45
1
Panel2
:Sam
pleisno
n-Europ
eancoun
trieswith
0.12
5>
Euroshare
>0
Eur
osh
are
17.24*
**17
.44*
**5.15
4*15
.89*
**13
.23*
**16
.41*
**15
.64*
**
(0.00)
(0.00)
(0.06)
(0.00)
(0.00)
(0.00)
(0.00)
Observatio
ns51
5150
5151
5151
R-squ
ared
0.34
30.35
70.60
50.39
30.49
50.35
70.39
5
Thistablepresentsregression
results
assessingtherelatio
nshipbetween
Eur
osh
areand
Cur
rent
inco
mewhenelim
inatingcountriesinwhich
Eur
osh
areequalszero.T
hesample
isno
n-Europ
eancoun
tries.The
depend
entvariableis
Cur
rent
inco
me,compu
tedas
theaverageof
thelogof
realpercapita
incomefrom
1995
to20
05.E
uro
shar
eistheprop
ortio
nof
Europ
eans
inthecolonial
popu
latio
n.B
riti
shle
gal
orig
intakesavalueof
oneifthecountry’slawsarebasedon
theUnitedKingdom
’slegalsystem
,andzero
otherw
ise.
Edu
cati
onequalstheaveragerateof
second
aryscho
olenrollm
entfrom
1995
to20
05.I
ndep
ende
nceequalsthefractio
nof
yearssince17
76thatacoun
tryhasbeen
independ
ent.
Gov
ernm
ent
qual
ityisan
indexof
thecurrentlevelof
governmentaccountabilityandeffectiveness.
Eth
nici
tymeasureseach
country’sdegree
ofethnic
diversity.A
llsignifies
thatallo
fthecontrolv
ariables
(Bri
tish
lega
lori
gin,
Edu
cati
on,G
over
nmen
tqua
lity,and
Eth
nici
ty)areincluded
simultaneously.The
regressionsareestim
ated
usingOLSwith
heteroskedasticity
-consistentstandarderrors.P
values
arereported
inparentheses.*,
**,and
***indicatesignificanceatthe10,5
,and
1%
levels,respectively.Moredetailed
variabledefin
ition
sandsourcesareprovided
inTable12
inApp
endixandtheOnlineDataApp
endix
123
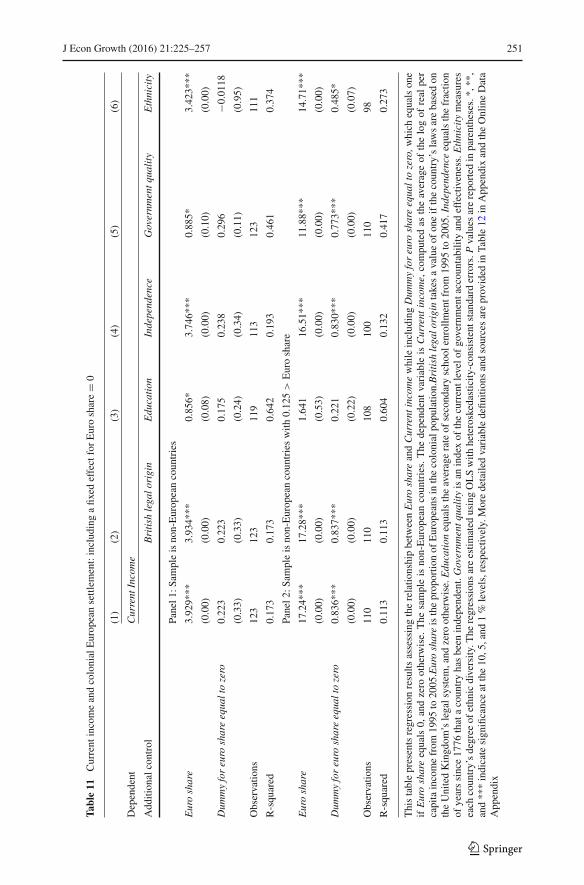
J Econ Growth (2016) 21:225–257 251
Table11
Current
incomeandcolonialEurop
eansettlem
ent:includ
ingafix
edeffectforEuroshare
=0
(1)
(2)
(3)
(4)
(5)
(6)
Dependent
Cur
rent
Inco
me
Add
ition
alcontrol
Bri
tish
lega
lori
gin
Edu
cati
onIn
depe
nden
ceG
over
nmen
tqua
lity
Eth
nici
ty
Panel1
:Sam
pleisno
n-Europ
eancoun
tries
Eur
osh
are
3.92
9***
3.93
4***
0.85
6*3.74
6***
0.88
5*3.42
3***
(0.00)
(0.00)
(0.08)
(0.00)
(0.10)
(0.00)
Dum
my
for
euro
shar
eeq
ualt
oze
ro0.22
30.22
30.17
50.23
80.29
6−0
.011
8
(0.33)
(0.33)
(0.24)
(0.34)
(0.11)
(0.95)
Observatio
ns12
312
311
911
312
311
1
R-squ
ared
0.17
30.17
30.64
20.19
30.46
10.37
4
Panel2
:Sam
pleisno
n-Europ
eancoun
trieswith
0.12
5>
Euroshare
Eur
osh
are
17.24*
**17
.28*
**1.64
116
.51*
**11
.88*
**14
.71*
**
(0.00)
(0.00)
(0.53)
(0.00)
(0.00)
(0.00)
Dum
my
for
euro
shar
eeq
ualt
oze
ro0.83
6***
0.83
7***
0.22
10.83
0***
0.77
3***
0.48
5*
(0.00)
(0.00)
(0.22)
(0.00)
(0.00)
(0.07)
Observatio
ns11
011
010
810
011
098
R-squ
ared
0.11
30.11
30.60
40.13
20.41
70.27
3
Thistablepresentsregression
results
assessingtherelatio
nshipbetween
Eur
osh
areand
Cur
rent
inco
mewhileinclud
ing
Dum
my
for
euro
shar
eeq
ualt
oze
ro,w
hich
equalson
eif
Eur
osh
areequals0,
andzero
otherw
ise.The
sampleisno
n-Europ
eancoun
tries.The
depend
entvariable
isC
urre
ntin
com
e,compu
tedas
theaverageof
thelogof
real
per
capitaincomefrom
1995
to20
05.E
uro
shar
eistheprop
ortio
nof
Europ
eans
inthecolonialpo
pulatio
n.B
riti
shle
galo
rigi
ntakesavalueof
oneifthecountry’slawsarebasedon
theUnitedKingdom
’slegalsystem,and
zero
otherw
ise.
Edu
cati
onequalstheaveragerateof
second
aryscho
olenrollm
entfrom
1995
to20
05.I
ndep
ende
nceequalsthefractio
nof
yearssince17
76thatacoun
tryhasbeen
independ
ent.
Gov
ernm
entq
uali
tyisan
indexof
thecurrentlevelof
governmentaccountability
andeffectiveness.
Eth
nici
tymeasures
each
country’sdegree
ofethnicdiversity.T
heregressionsareestim
ated
usingOLSwith
heteroskedasticity
-consistentstandarderrors.P
values
arereported
inparentheses.*,**,
and***indicatesignificanceatthe10,5,and
1%
levels,respectively.Moredetailedvariabledefin
itionsandsourcesareprovided
inTable12
inApp
endixandtheOnlineData
App
endix
123
252 J Econ Growth (2016) 21:225–257
direction, Ethiopia is often considered a non-colony but is classified as a colony by AJR.Nevertheless, when including a dummy variable that equals one if the country is a formercolony as classified by AJR and zero otherwise, all of the paper’s results hold.
5 How much development is attributable to Europeans?
In this section, we conduct a simple global development accounting exercise to assess howmuch of development today might be associated with European settlers during colonization.This is purely illustrative and the results should be treated as such. This exercise uses theestimated equation for Euro share with no controls
ln (Current I ncomei ) = α + βEurosharei + εi (2)
Next, define the counterfactual CurrentIncomeC F for every country outside of Europe byremoving the European effect:
CurrentIncomeC Fi = CurrentIncomei .e
−βEuroSharei (3)
Of course,CurrentIncomei = CurrentIncomeC Fi for any country i whereEurosharei = 0.
The counterfactual population-weighted global mean is then simply the weighted meanacross all non-European countries of Current I ncomeC F
i ,where Pi is population in countryi , and P is total global population:
yC F =∑
i
(Pi
P
)CurrentIncomeC F
i . (4)
The global population-weighted per capita income y is
y =∑
i
(Pi
P
)CurrentIncomei . (5)
The share of development attributed to European settlement is then se =(
y−yC F
y
).
As an illustrative exercise, we use the sample and the coefficient from regression (1) ofTable 3, which is the simplest regression for the full sample of all countries outside of Europe.The coefficient estimate is β = 3.623.
Using the 2000 population weights, the data and estimated coefficients indicate that 40 %of the development outside of Europe is associated with the share of European settlers during
colonization(
y−yC F
y
). We repeat our frequent caveat that global per capita income is not a
welfaremeasure, especially in light of the history of European exploitation of non-Europeans.As an illustrative exercise in positive analysis, however, it is striking how much of global
development today could be associated with the migration and settlement of Europeansduring the colonial era (not even considering the development of Europe itself). It is evenmore striking that this large average income outcome in a non-European world today of overfive billion is associated with the migration of only six million European settlers in colonialtimes.
6 Conclusions
The previous literature was correct to focus on colonial settlement by Europeans as one ofthe pivotal events in the history of economic development. In this paper, we provide the first
123
J Econ Growth (2016) 21:225–257 253
direct evidence that the proportion of Europeans during colonization is strongly and positivelyassociated with the level of economic development today. These findings are robust to usingdifferent subsamples of countries, controlling for an array of country characteristics, andconditioning on the current proportion of the population of European descent.
These results relate to theories of the origins of the divergent paths of economic devel-opment followed since Europeans colonization. ES and AJR stress that when endowmentslead to the formation of settler colonies, this produced more egalitarian, enduring politicalinstitutions that fostered long-run economic development. And, ES and GLLS emphasizethat Europeans brought human capital that slowly disseminated to the population at largeand boosted economic development. The results presented in this paper are consistent withboth of these effects: former colonies with larger colonial European settlements have muchhigher levels of economic development today than former colonies that had a smaller pro-portion of Europeans during the colonial period. Our results also paint a positive picture ofminority colonial European settlements about which the previous literature was ambiguous.Specifically, the estimates indicate that once European settlement is above 4.8 %, the smallcolonial European settlements have a positive effect on development today compared to nocolonial European settlement. This is suggestive that any adverse effects arising from theextractive institutions created by small colonial European settlements were more than offsetby other things that Europeans brought during colonization, such as human capital, technol-ogy, familiarity with global markets, and institutions, which had lasting, positive effects oneconomic development.
7 Appendix
123
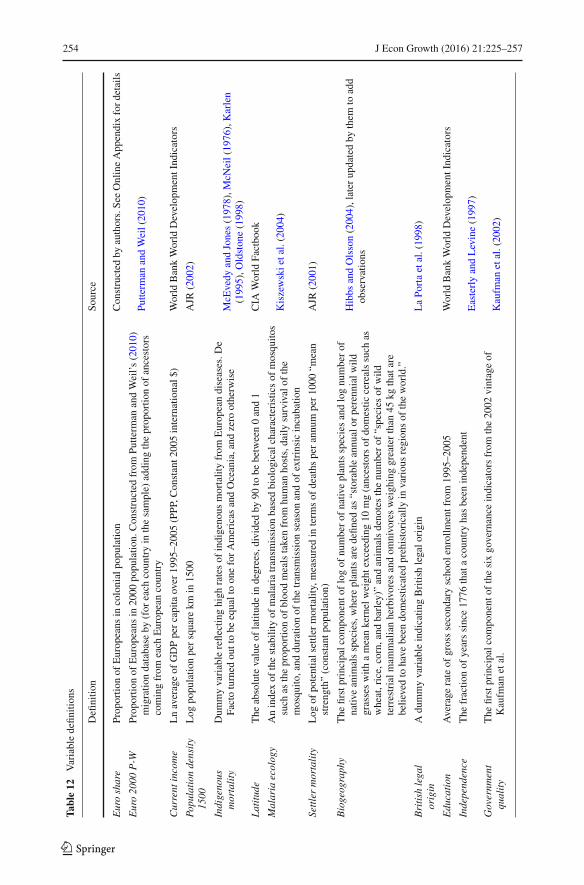
254 J Econ Growth (2016) 21:225–257
Table12
Variabledefin
ition
s
Definitio
nSo
urce
Eur
osh
are
Prop
ortio
nof
Europ
eans
incolonialpo
pulatio
nCon
structed
byauthors.Se
eOnlineApp
endixfordetails
Eur
o20
00P
-WProp
ortio
nof
Europ
eans
in20
00po
pulatio
n.Con
structed
from
Putte
rman
andWeil’s
(201
0)migratio
ndatabase
by(for
each
coun
tryin
thesample)
adding
theprop
ortio
nof
ancestors
comingfrom
each
Europ
eancoun
try
Putterm
anandWeil(20
10)
Cur
rent
inco
me
Lnaverageof
GDPpercapitaover
1995
–200
5(PPP
,Con
stant2
005international$
)World
BankWorld
Develop
mentInd
icators
Popu
lati
onde
nsit
y15
00Log
popu
latio
npersquare
kmin
1500
AJR
(200
2)
Indi
geno
usm
orta
lity
Dum
myvariablereflectinghigh
ratesof
indigenous
mortalityfrom
Europeandiseases.D
eFactoturned
outtobe
equaltooneforAmericas
andOceania,and
zero
otherw
ise
McE
vedy
andJones(197
8),M
cNeil(19
76),Karlen
(199
5),O
ldstone(199
8)
Lat
itud
eThe
absolutevalueof
latitud
ein
degrees,dividedby
90to
bebetw
een0and1
CIA
World
Factbo
ok
Mal
aria
ecol
ogy
Anindexof
thestability
ofmalariatransm
ission
basedbiologicalcharacteristicsof
mosquito
ssuch
astheproportio
nof
bloodmealstakenfrom
human
hosts,daily
survivalof
the
mosquito
,and
duratio
nof
thetransm
ission
season
andof
extrinsicincubatio
n
Kiszewskietal.(200
4)
Sett
ler
mor
tali
tyLog
ofpotentialsettlermortality,measuredin
term
sof
deaths
perannum
per1000
“mean
streng
th”(con
stantp
opulation)
AJR
(200
1)
Bio
geog
raph
yThe
firstprincipalcom
ponent
oflogof
numberof
nativ
eplantsspeciesandlognu
mberof
nativ
eanim
alsspecies,where
plantsaredefin
edas
“storableannualor
perennialw
ildgrasseswith
ameankernelweightexceeding
10mg(ancestorsof
domestic
cerealssuch
aswheat,rice,corn,and
barley)”
andanim
alsdenotesthenumberof
“species
ofwild
terrestrialm
ammalianherbivores
andom
nivoresweighinggreaterthan
45kg
thatare
believedto
have
been
domesticated
prehistorically
invariousregionsof
theworld.”
Hibbs
andOlsson(200
4),later
updatedby
them
toadd
observations
Bri
tish
lega
lor
igin
Adummyvariableindicatin
gBritishlegalo
rigin
LaPo
rtaetal.(19
98)
Edu
cati
onAverage
rateof
grosssecond
aryscho
olenrollm
entfrom
1995
–200
5World
BankWorld
Develop
mentInd
icators
Inde
pend
ence
The
fractio
nof
yearssince17
76thatacoun
tryhasbeen
independ
ent
EasterlyandLevine(199
7)
Gov
ernm
ent
qual
ity
The
firstprincipalcom
ponent
ofthesixgovernance
indicatorsfrom
the20
02vintageof
Kaufm
anetal.
Kaufm
anetal.(20
02)
123
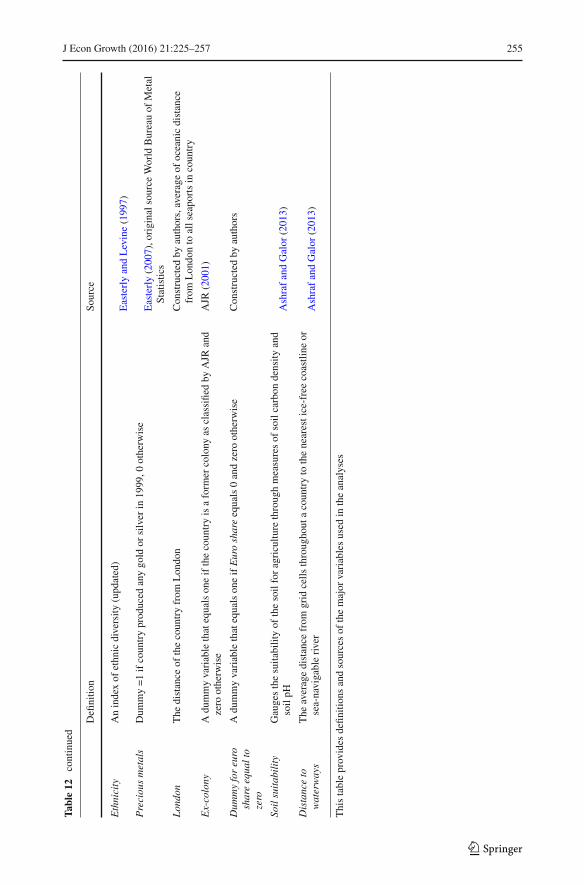
J Econ Growth (2016) 21:225–257 255
Table12
continued
Definitio
nSo
urce
Eth
nici
tyAnindexof
ethnicdiversity
(updated)
EasterlyandLevine(199
7)
Pre
ciou
sm
etal
sDum
my=1ifcountryproduced
anygold
orsilver
in1999,0
otherw
ise
Easterly(200
7),originalsou
rceWorld
Bureauof
Metal
Statistics
Lon
don
The
distance
ofthecoun
tryfrom
Lon
don
Con
structed
byauthors,averageof
oceanicdistance
from
Lon
donto
allseapo
rtsin
coun
try
Ex-
colo
nyAdummyvariablethatequalsoneifthecountryisaform
ercolony
asclassifiedby
AJR
and
zero
otherw
ise
AJR
(200
1)
Dum
my
for
euro
shar
eeq
ualt
oze
ro
Adu
mmyvariablethatequalson
eif
Eur
osh
areequals0andzero
otherw
ise
Con
structed
byauthors
Soil
suit
abil
ity
Gaugesthesuita
bilityof
thesoilforagricultu
rethroug
hmeasuresof
soilcarbon
density
and
soilpH
AshrafandGalor
(201
3)
Dis
tanc
eto
wat
erw
ays
The
averagedistance
from
grid
cells
throug
hout
acoun
tryto
thenearestice-freecoastline
orsea-navigableriver
AshrafandGalor
(201
3)
Thistableprovides
defin
itionsandsourcesof
themajor
variablesused
intheanalyses
123

256 J Econ Growth (2016) 21:225–257
References
Acemoglu, D., Johnson, S., & Robinson, J. (2001). The colonial origins of comparative development: Anempirical investigation. American Economic Review, 91(5), 1369–1401.
Acemoglu, D., Johnson, S., & Robinson, J. (2002). Reversal of fortune: Geography and institutions in themaking of the modern world income distribution. Quarterly Journal of Economics, 117(4), 1231–1294.
Acemoglu, D., & Robinson, J. (2012). Why nations fail: The origins of power, prosperity, and poverty. NewYork: Crown Publishers.
Ashraf, Q., & Galor, O. (2011). Dynamics and stagnation in the Malthusian Epoch. American EconomicReview, 101(5), 2003–2041.
Ashraf, Q., & Galor, O. (2013). The ‘Out of Africa’ hypotheses, human genetic diversity, and comparativeeconomic development. American Economic Review, 103(1), 1–46.
Beck, T., Demirguc-Kunt, A., & Levine, R. (2003). Law, endowments, and finance. Journal of FinancialEconomics, 70, 137–181.
Bisin, A., & Verdier, T. (2000). Beyond the melting pot: Cultural transmission, marriage, and the evolution ofethnic and religious traits. Quarterly Journal of Economics, 115(3), 955–988.
Chanda, Areendam, Justin Cook, C., & Putterman, Louis. (2014). Persistence of fortune: Accounting forpopulation movements, there was no post-Columbian reversal. American Economic Journal, 6(3), 1–28.
Comin, D., Easterly, W., & Gong, E. (2010). Was the wealth of nations determined in 1000 B.C.? AmericanEconomic Journal: Macroeconomics, 2(3), 65–97.
Easterly, W., & Levine, R. (1997). Africa’s growth tragedy: Policies and ethnic divisions. Quarterly Journalof Economics, 112(4), 1203–1250.
Easterly, W., & Levine, R. (2003). Tropics, germs, and crops: The role of endowments in economic develop-ment. Journal of Monetary Economics, 50(1), 3–40.
Easterly, W. (2007). Inequality does cause underdevelopment. Journal of Development Economics, 84(2),755–776.
Engerman, S., & Sokoloff, K. (1997). Factor endowments, institutions, and differential paths of growth amongnew world economies: A view from economic historians of the United States. In Haber (Ed.), How LatinAmerica fell behind (pp. 260–304). Stanford: Stanford University Press.
Fernandez, R., & Fogli, A. (2009). Culture: An empirical investigation of beliefs, work, and fertility. AmericanEconomic Journal: Macroeconomics, 1(1), 146–177.
Galor, O. (2011). Unified growth theory. Princeton: Princeton University Press.Glaeser, E., La Porta, R., Lopez-de-Silanes, F., & Shleifer, A. (2004). Do institutions cause growth? Journal
of Economic Growth, 9(3), 271–303.Haber, S. (2014). Where does democracy thrive? Climate, technology, and the evolution of economic and
political institutions Stanford University mimeo.Hibbs, D. A, Jr., & Olsson, O. (2004). Geography, biogeography, and why some countries are rich and others
are poor. Proceedings of the National Academy of Sciences, 101(10), 3715–372.Karlen, A. (1995). Man and microbes: Disease and plagues in history and modern times. New York: Simon
& Schuster.Kaufman, D., Kraay, A., Zoido-Lobaton, P. (2002). “Governance Matters II: Updated Indicators for 2000–
2001”, World Bank Policy Research Working Paper 2772.Kiszewski, A., Mellinger, A., Spielman, A., Malaney, P., Sachs, S. E., & Sachs, J. (2004). A global index
representing the stability of malaria transmission. American Journal of Tropical Medicine and Hygiene,70(5), 486–498.
La Porta, R., Lopez-de-Silanes, F., Shleifer, A., & Vishny, R. W. (1998). Law and Finance. Journal of PoliticalEconomy, 106(6), 1113–1155.
McNeil, W. (1976). Plagues and peoples. New York: Anchor Press.McEvedy, C., & Jones, R. (1978). Atlas of world population history. New York: Facts on File.Michalopoulos, S., & Papaioannou, E. (2013). Pre-colonial ethnic institutions and contemporary African
development. Econometrica, 81(1), 113–152.Michalopoulos, S., & Papaioannou, E. (2014). National institutions and subnational development in Africa.
The Quarterly Journal of Economics, 129(1), 151–213.North, D. (1990). Institutions, institutional change, and economic performance. UK: Cambridge University
Press.Oldstone, M. (1998). Viruses, plagues, and history. USA: Oxford University Press.Persson, T., & Tabellini, G. (2010). Democratic capital: The nexus of political and economic change.American
Economic Journal, 1(2), 88–126.Putterman, L., & Weil, D. (2010). Post-1500 population flows and the long run determinants of economic
growth and inequality. Quarterly Journal of Economics, 125(4), 1627–1682.
123
J Econ Growth (2016) 21:225–257 257
Spolaore, E., & Wacziarg, R. (2009). The diffusion of development. Quarterly Journal of Economics, 124(2),469–529.
Spolaore, E., &Wacziarg, R. (2013). How deep are the roots of economic development? Journal of EconomicLiterature, 51(2), 325–369.
Tabellini, G. (2010). Culture and institutions: Economic development in the regions of Europe. Journal of theEuropean Economic Association, 8(4), 677–716.
Tabellini, G. (2008). The scope of cooperation: Values and incentives. Quarterly Journal of Economics, 123,905–950.
123