the european coal curse - springer
TRANSCRIPT

Vol.:(0123456789)
Journal of Economic Growth (2021) 26:77–112https://doi.org/10.1007/s10887-021-09187-w
1 3
The European coal curse
Elena Esposito1 · Scott F. Abramson2
Accepted: 29 January 2021 / Published online: 4 March 2021 © The Author(s) 2021
AbstractIn this paper we examine the impact of natural resource wealth by focusing on historical coal-mining across European regions. As an exogenous source of variation in coal extrac-tion activities, we rely on the presence of coal-deposits located on the earth’s surface, which historically facilitated the discovery and extraction of coal. Our results show that former coal-mining regions are substantially poorer, with (at least) 10% smaller per-capita GDP than comparable regions in the same country that did not mine coal. We provide evi-dence that much of this lag is explained by lower levels of human capital accumulation and that this human-capital effect is concentrated in men. Finally, we provide suggestive evidence that the persistently lower levels of human capital in coal mining regions that we document result from the crystallization of negative attitudes towards education and lower future orientations in these regions.
Keywords Mines · Coal · Resources · Minerals · Resource curse · Universities · Human capital · Long-run development · Gender gap · Male achievement gap
JEL Classification O13 · Q35 · N13 · I25 · O10
1 Introduction
A substantial body of work finds that natural resource abundance can have adverse effects on growth and development. While scholars have extensively explored its short-run effects, typically with data from the post-war period, extant evidence on comparatively longer term consequences is limited. Indeed, although short-term negative effects can be assessed with little delay and, eventually, may be mitigated by dedicated policies, effects over broader spans of history are much more difficult to evaluate since, by construction, they take a time to materialize. Nevertheless, studying these effects and their drivers is crucial, especially if they can be difficult to undo when ameliorative policies are implemented only belatedly.
In this paper we investigate the effects of resource wealth by focusing on the impact of historical coal-mining across European regions, where coal was mined for centuries but its
* Elena Esposito [email protected]
1 University of Lausanne, Lausanne, Switzerland2 University of Rochester, Rochester, NY, USA

78 Journal of Economic Growth (2021) 26:77–112
1 3
extraction has been minimal for several decades. To this end, we collect data on coalfields discovered in Europe by the early twentieth century.1 In order to examine the effects of coal abundance, we exploit within-country variation to compare coal-mining regions to non-coal-mining regions in the same national context. Since more technologically advanced regions were also those most likely to search for and extract coal, we exploit differences in underlying geological surface conditions to obtain plausibly random variation in the loca-tion of mining activity. European coal seams occur most extensively in rock strata originat-ing in the Carboniferous period and thus, given the position of the latter in the geological time scale, tend to be located deep underground. However, in some places, erosion and tec-tonic movement brought Carboniferous strata to the surface, making easier the discovery and extraction of coal. As such, we exploit the location of coal-deposits within carbonifer-ous surface geology to obtain plausibly exogenous variation in the likelihood of coal hav-ing been discovered and extracted.
Our results show that regions that produced coal have an (at least) 10% smaller per cap-ita GDP than comparable regions in the same country that did not mine coal. Our results are robust to the inclusion of a large set of geographical and location-based controls and a set of alternative measures of historical coal extraction. They are also consistent in mag-nitude across regions of the continent—despite large heterogeneity in economic, institu-tional, and historical contexts.2
In order to exclude the possibility that Carboniferous surface geology might be associ-ated with a particularly disadvantaged geography, we examine the effect of having surface geological strata that strictly preceded and followed the Carboniferous Period, the Permian and Devonian Periods, respectively. Because of the temporal proximity of these eras on the geologic time scale, comparable earth movements and erosion should have brought them close to the surface and thus made such areas similar in terms of geographical character-istics. Regions with Carboniferous, Permian, and Devonian surface geology are therefore likely to share similar bio-geographic features while being, nevertheless, considerably dif-ferent with respect to coal richness. We employ these facts in a falsification exercise, which shows that coal geology affected present-day development through the historic presence of coal mines, and not due to features characterizing areas with similar geographies and geological histories.
Next, we show that the European “coal curse” we identify has been, to a large extent, a human capital curse, demonstrating that coal-mining had a large negative effect on human capital accumulation. We show that, today, regions that historically mined coal have a 20% lower share of people with a university education. Given that coal-mining has been an almost entirely male-dominated profession, we then explore whether the depressed human capital accumulation we observe disproportionately impacted men, and document a substantial male achievement gap in coal-mining regions. Based on coefficient estimates, the European male achievement gap in tertiary education would nearly disappear in the absence of a Carboniferous geography.
In the last part of our analysis we shed light on the drivers of this human capital curse. We present evidence consistent with two possibly complementary mechanisms. First, we
1 We follow Fernihough and O’Rourke (2014) and use data on historical coalfields as measured in the early twentieth century in Pol et al.’s (1931) Atlas. While Fernihough and O’Rourke (2014) exploit the proximity of cities to coalfields to proxy for city availability of coal, we are instead primarily interested in measuring where coal mines were located.2 In particular, the same picture emerges in Northern, Southern, and Eastern Europe.

79Journal of Economic Growth (2021) 26:77–112
1 3
find evidence suggesting that when coal-mining employed a large share of the labor force of coal-mining regions, the continued demand for low-skilled labor depressed investment in human capital accumulation. Here, we focus on public investment in higher education and construct a dataset that maps European universities over time and space. From the mid-nineteenth century on (but not before), considerably fewer universities were established in regions with a history of coal mining. While coal-mining regions partially caught up, a gap in human capital accumulation nevertheless persists. We provide suggestive evidence that this is because of the preferences devaluing/stigmatizing education that the history of coal engendered. Second, we find evidence suggesting that differences in health and life expectancy were potentially important and complementary drivers of lower human capital in European mining regions. Unhealthy and unsafe working conditions in the mines, as well as a greater degree of environmental degradation, may have resulted in worse health and substantially lower life expectancies through the present. In turn, we show that this may explain a lower propensity to invest for the future, possibly depressing incentives for the accumulation of human capital.
We evaluate and find no support for several other conjectured potential mechanisms linking resource abundance to diminished human capital accumulation and lower incomes. We find that neither institutional dysfunction nor weak or corrupt governments play a role in explaining our findings. Similarly, we show that selective migration of foreigners with low preferences for human capital does not drive our results.
Last, we assess the degree to which our findings are specific to coal or generalize to other natural resources with a shorter history of extraction, such as oil, or resources with a much lower spatial concentration of workers, like gold. We do not find evidence that these resources are associated with lower incomes or educational attainment, historical public under-investment in university education, or gender disparities in tertiary educa-tion. Besides its longer extractive history, coal-mining differs from present-day petroleum extraction in its history of a driver of early industrialization in Europe. Because they are currently in decline, industries that exploited coal as an energy input during the initial phases of industrialization, steel and iron production, for example, are concentrated in for-mer coal-mining regions. As such, we explore whether the effects of coal abundance can also be attributed to the declining fate of the industries that it fostered.3 To accomplish this we present new data on historical iron, steel, steam, and textile production sites across European regions and show that the presence of these industries was, indeed, associated with coal and Carboniferous geography. However, our results indicate that these historical areas of production were not associated with lower public investment in university educa-tion or with gender-heterogeneous educational achievement, patterns that are, instead, spe-cific to former coal-mining regions.
1.1 Related literature
In the substantial body of empirical work exploring the effects of natural resource wealth, short-term consequences have (mostly) monopolized scholars’ attention.4 This litera-ture has focused mostly on oil, exploiting price variation or oil discoveries in the period
3 A negative effect of early industrialization on income and human capital has been similarly documented by Franck and Galor (2019). See below for a discussion of the relevant literature.4 Following Sachs and Warner (2001), a wide range of empirical studies have investigated the causes and consequences of this “resource curse.” For comprehensive reviews of the literature see, among others, Tor-vik (2009), Van der Ploeg (2011), Ross (2015), and Venables (2016).

80 Journal of Economic Growth (2021) 26:77–112
1 3
following the Second World War to detect effects that materialize over, at-most, a half-cen-tury. Within this body of scholarship, our empirical strategy most closely matches the set of papers that exploit within-country and sub-national variation. Most studies have focused upon sub-national variation in oil (or gas) discoveries and prices, exploiting county and other low-level data in the United States (Michaels 2011; Jacobsen and Parker 2016; All-cott and Keniston 2017) and abroad (Caselli and Michaels 2013; Cavalcanti et al. 2019). Most of these studies suggest positive effects on employment and income per capita, with the exception of Jacobsen and Parker (2016) that find a negative long-term effect on these outcomes.
Still, while petroleum is certainly a central energy input in all modern economies, it has only been intensively extracted since the mid-twentieth century. By contrast, European coal has been mined in large quantities since the early nineteenth century and in Europe it lost occupational relevance around 1960s. This allows us to document comparatively longer-run effects and to trace the impact of resource wealth on norms and preferences that are comparatively inert over the short run. In this vein, we contribute to a small literature tak-ing a longer-term view on the resource curse, which has mostly focused on violence and crime as outcomes (Couttenier et al. 2017; Buonanno et al. 2015; Uribe-Castro 2018).5 Our results suggest that much of the negative impact of coal has, in the long-run, been a conse-quence of depressed investment in human capital.
Our paper also contributes to the empirical scholarship on the effect of natural resource wealth on human capital. Cross-country analyses based on late twentieth century data find that public expenditure on education and school enrollment tend to be inversely related with resource wealth (Gylfason 2001; Papyrakis and Gerlagh 2004). Examining the impact of major oil discoveries on income and years of schooling in a panel of countries, Smith (2015), by contrasts, finds positive effects on income and years of schooling. More closely related to our approach are a series of papers that carry out empirical case studies exploit-ing within-country variation. Black et al. (2002, 2003, 2005), for example, examine cycles of coal booms and busts in Appalachia and show that during boom years, the levels of schooling (in addition to welfare expenditure and participation in disability programs) for low-skilled men are significantly lower.6
With respect to this literature, our comparatively longer-run perspective allows us to shed light on the important roles played by preferences for education and future orientation, showing how these may result in long-term underinvestment in human capital. Moreover, given the well-established centrality of human capital for economic growth, our results are salient for studies exploring the deep geographical determinants of human capital forma-tion (Galor et al. 2009; Galor and Özak 2016).7
In particular, we contribute to the recent line of research exploring the long-run (de)skilling effect of early industrialization initiated by Franck and Galor (2019). Our findings
5 Couttenier et al. (2017) provide evidence of a “homicide curse” in US counties that discovered minerals before formal institutions were established. In the same spirit, Buonanno et al. (2015) document the impact of sulfur mining on the emergence of organized crime in Sicily after the collapse of the Bourbon regime. Uribe-Castro (2018) shows that counties more suitable for growing coffee had a smaller share of the popu-lation employed in manifacturing in 1945.6 See also the recent study by Ahlerup et al. (2016), who focus on gold mines in Africa and demonstrate that individuals whose adolescence was spent in mining districts tend to have lower levels of schooling.7 Galor et al. (2009), for example, document the role of land inequality as a driver of human-capital pro-moting institutions and long-term growth. Similarly, Galor and Özak (2016) show that agro-climatic char-acteristics conducive to higher returns increased individuals’ long-term orientation and, as a consequence, investment in human capital.

81Journal of Economic Growth (2021) 26:77–112
1 3
on coal, a fundamental energy input for early industrialization, coincide with their results on income and education, extending the evidence to 31 countries and confirming their hypothesis in institutionally and culturally variegated settings as different as Northern, Southern, and Eastern Europe.8 Finally, insofar as coal-mining represented a large sec-tor during the industrialization of Europe, the new findings documented in this paper are also relevant to this literature. First, we show that coal mining reduced historical public investment in education, with up to 2 missing universities per coal-mining region. Second, former coal-mining regions display a gender-heterogeneous stigmatization of education, helping to explain the male achievement gap affecting coal-mining regions today. Third, as findings from Franck and Galor (2017, 2019) indicate, short-term and longer-term effect might well differ. Looking at the historical effects of coal availability, Fernihough and O’Rourke (2014), in fact, document that in the short-run proximity to coal increased city population size from 1800 onward.
To the best of our knowledge, our study is also the first to document a male achievement gap related to historical mineral abundance. In this way, we uncover a primary geographi-cal driver of well-documented gender differences in educational attainment and labor mar-ket advancement (see, among others, Autor and Wasserman 2013; Bertrand and Pan 2013; and Chetty et al. 2016).9 In parallel, we contribute to a small but growing literature on the gendered effects of mining.10 While most papers in this vein have focused on the welfare of women, documenting effects on female labor supply and economic opportunity (Ross 2008; Khattar and Grosjean 2013; Kotsadam and Tolonen 2016; Aragón et al. 2018), the main novelty here is our finding that, in the long run, is it male welfare that may be more at risk.
The remainder of this paper is organized as follows. In Sect. 2, we summarize the key elements of historical coal extraction in Europe. We then discuss the original data collected for this project and our empirical strategy in Sect. 3. Section 4 presents long-term results on income, while Sect. 5 explores the effect on human capital accumulation. Section 7 assesses other potential reinforcing drivers of the coal curse. The final section concludes.
8 To the degree that coal mining in Europe is an example of a declining industry, we also contribute to the literature on industrial decline (see David et al. 2013; David and Dorn 2013).9 In the United States, women have already surpassed men in terms of high school and college graduation rates by the cohort born in the 1950s (Autor and Wasserman 2013). Bertrand and Pan (2013) highlight the role of family influence on the gender gap and boys’ disruptive behavior. Chetty et al. (2016) document that this gap is relevant for poorer families and varies substantially across counties and commuting zones. Fortin et al. (2015) show the existence of an underlying GPA gap. Autor et al. (2019) emphasize the negative wel-fare consequences of industrial decline for young adult males in affected regions.10 Our results also broadly relate to the paper of Alesina et al. (2013), which highlights how different tech-nologies of production can lead to long-lasting and persistent differences in gender attitudes and norms.

82 Journal of Economic Growth (2021) 26:77–112
1 3
2 Background
2.1 Coal‑mining in Europe
While it has been mined in small amounts since ancient times, coal was only an occasional source of heat up until the 18th century.11 Over the course of the subsequent century it slowly began to be used in England as fuel in industrial processes. The mining of coal then spread to Belgium, in the Valenciennes area, and subsequently to the famous Western coal basin between 1842 and 1914. In the second half of the 18th century, the first small-scale mines appeared in Germany, when mining of exposed coal seams in the Ruhr, Inde, and Wurm river valleys began. As Fig. 1 shows, by the mid-19th century coal use as a source of energy had spread to the most advanced European countries. Indeed, from the onset of the industrial revolution up until the mid-twentieth century coal was the dominant source of energy in Europe. Coal consumption (and production) then began to rapidily decline in the second half of the 20th century, as it was largely substituted by oil.12 While some of the last European coal mines closed only in the mid-1980s, in terms of labor force participation the coal-sector entered decline decades earlier.13
2.1.1 Labor intensity and spatial concentration
Coal-mining was, and to an extent still is, a labor-intensive industry. Even when compared with oil and other manufacturing sectors. Coal-mining employed huge numbers of workers and its costs were largely composed of wages.14 Further, it was mechanized relatively late: in 1913 in the UK less than 10% of coal was cut by machine. In 1923—at the peak of coal employment in the UK—1.2 million people were employed in coal mining.
What is more, European coal-mining was a heavily concentrated industry. As Supple (1992) puts it: “... given the size of the industry, towns and whole counties were dominated by coal-mining and its labor force.” About one in three inhabitants in the County of Dur-ham, were, for example, employed in the mining sector.15 Similar figures are found in other European countries. In the Belgian mining region of Borinage, at the peak of coal produc-tion, one-fifth of the inhabitants of the area were miners (Lambert and Boulanger 2001). In
11 In the late 17th century England, coal began to supplant timber for home-heating, as the latter had become exhausted as a source of fuel.12 Appendix Figure 8 tracks the evolution of world coal production, showing how its decline took place in conjunction with the increase in oil production.13 With regard to labor force participation, the UK represents a fairly standard example. In 1923, 1.2 mil-lion people were employed in coal mining, out of a total population of about 38 million people. After nationalization, in 1945, the number dropped to 702,000 but remained stable until 1960. By the 1980s, however, when the last of the British coal mines were about to be closed, only two hundred thousand people remained employed in coal-mining.14 Supple (1992) estimates that wages for the British coal industry between the wars accounted for two-thirds to three-quarters of the total production costs. Coal-mining remains today among the more labor-intensive extractive industries. For contemporary estimates of the labor/capital ratio comparing coal-mining with other mining sectors and industries and its evolution over time, see, for instance: “A Detailed Analysis of the Mining Industry: Preferences and Interpretation,” September 2009, Centre for the Study of Living Standard; “Productivity in the Mining Industry: Preferences and Interpretation,” December 2008, Austral-ian Government Productivity Commission.15 Source: A vision of Britain through time and the NETSFIELD project.

83Journal of Economic Growth (2021) 26:77–112
1 3
the German Ruhr valley, as late as 1957, more than 10% of the population was employed in the mining sector.
The concentration of coal production and its workforce in specific areas, where fami-lies of miners passed their occupation from one generation to the next, fostered inward communities with deep ties. Such towns were “... relatively homogeneous, self-contained... these places owed their existence to coal and the coal-mining occupations.”16 The stabil-ity, homogeneity, and separation of these communities favored the emergence of a specific coal-mining identity, resulting in strong local norms and shared preferences (Stanley et al. 2008).
Finally, coal-mining has traditionally been a male-dominated industry.17 Historical accounts for various countries confirm that European coal miners were mostly men, and that women typically did not work in underground mining or coal washing. Gender norms and conceptions of appropriate behavior for men and women, together with images and stereotypes of the male breadwinner prevailed in coal-mining communities, and have been documented by a large qualitative literature.18
2.1.2 Coal‑mining and education
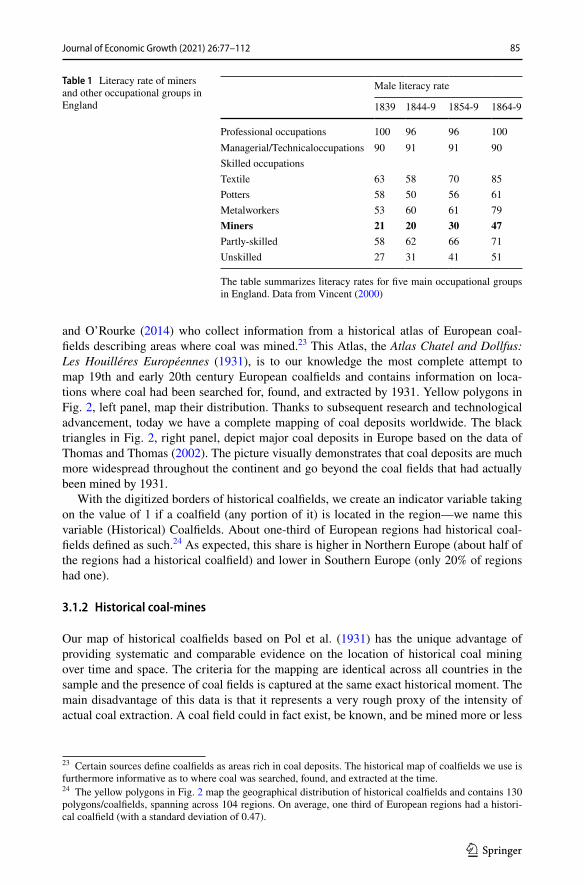
Despite requiring substantial on-the-job training, coal-mining required relatively few skills and little to no formal education. Anecdotal evidence and historical narratives detail the stunningly low level of literacy and schooling that characterized mining regions. Table 1 reports average literacy rates for several occupational groups in 19th century England. In the first half of the century, only one in five miners was literate. This figure stands out as particularly striking in comparison to the average literacy rate of metalworkers, potters, and textile workers, all of which were between two and three times higher. Even workers classified as “unskilled” had a higher average literacy rate than miners. A similar picture emerges for other European countries; in 1866 in the Belgian mining area of Borinage, the average literacy rate was two-thirds that of the national average (Lambert and Boulanger 2001). These low levels of schooling were partly a consequence of, among others things, the reliance on child labor in the mines (Nardinelli 1980; Humphries 2003).19
While the rate of schooling in coal-mining regions has increased since the 19th cen-tury, evidence still points to an underlying gap. To this regard, a broad literature in soci-ology and educational studies has documented that a disaffection with schooling, fear of academic success, and negative expectations for the future remain prevalent in the former coal-mining regions of Europe and the United States.20 The strong community ties charac-terizing coal-mining areas made these norms prevalent also among those that did not have
17 Aragón et al. (2018) document that in 1984 in England and Wales, 84% of workers in primary sectors (thus including mining, but also agriculture, energy, and water supply) were men.18 While far from an exhaustive list, relevant accounts of gender norms in mining communities are dis-cussed in Hall (2001) and Parry (2005) for Great Britain before and after the closure of mines; Beckwith (2001) for Pennsylvania; and Brown (2006) for Nigeria.19 Since coal-mining required a relatively long period of on-the-job training, children and young adults were hired more frequently than in other occupations (Mitch 1999). Moreover, the physically small con-strained spaces in which miners were required to work often made child-labor particularly valuable.20 See, for instance, Rasheed Ali and Saunders (2009), Gore et al. (2011) and Bright (2011).
16 See the report “Coalfields regeneration: dealing with the consequences of industrial decline,” Bennett, Beynon and Hudson, Bristol: Policy Press, March 2000.

84 Journal of Economic Growth (2021) 26:77–112
1 3
relatives employed in the industry, and persistent even after coal-mining was no longer a possible career trajectory.
3 Data and empirical strategy
Our empirical analysis focuses on European regions, with all data measured at the Euro-pean region level (NUTS2). We construct and combine data from a number of different sources.21 Overall, our analysis covers regions across 31 European countries for which information on historical coal-mining could be assembled.22 In this section, we describe our measures of historical coal-mining. Next, we discuss our empirical strategy, which relies on geological characteristics as exogenous source of variation in coal extraction. Last, we present our main outcome variables of interest. Full details on data sources, description of controls, and additional variables employed in the analysis are reported in Appendix, Section A.
3.1 Historical Coal‑mining in Europe
3.1.1 Historical coalfields
There is not, to our knowledge, any systematic mapping of historical coal mining across European regions. To proxy for the historical presence of coal mines, we follow Fernihough
Fig. 1 Share of total energy consumption from coal. Coal Consumption in England & Wales, France, and Germany data from Kander et al. (2014)
21 NUTS2 stands for Nomenclature of Territorial Units for Statistics, which are geographic subdivisions of countries constructed for statistical purposes by the European Union.22 The final sample includes the EU-27 countries, as well as Croatia, Norway, and Turkey. In our sample, NUTS2 regions have an average size of about 18 thousand square kilometers.
85Journal of Economic Growth (2021) 26:77–112
1 3
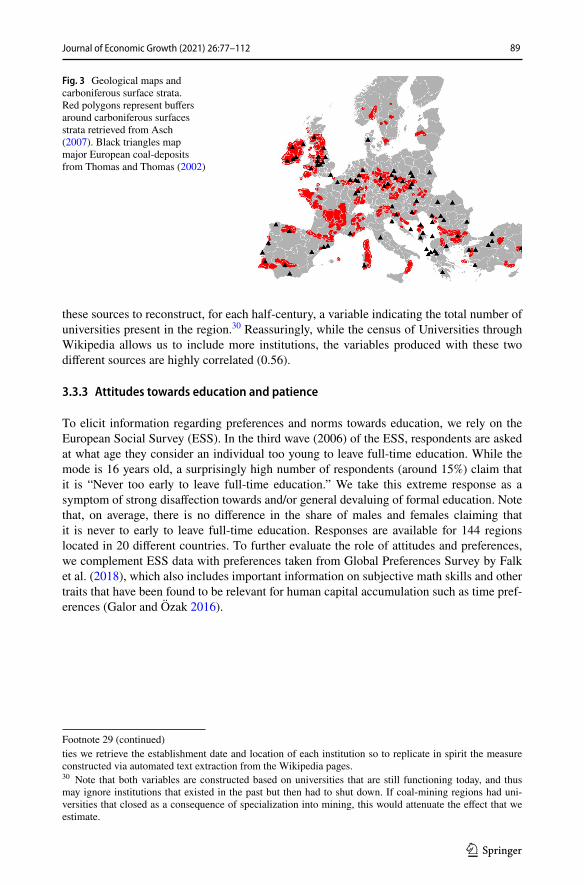
and O’Rourke (2014) who collect information from a historical atlas of European coal-fields describing areas where coal was mined.23 This Atlas, the Atlas Chatel and Dollfus: Les Houilléres Européennes (1931), is to our knowledge the most complete attempt to map 19th and early 20th century European coalfields and contains information on loca-tions where coal had been searched for, found, and extracted by 1931. Yellow polygons in Fig. 2, left panel, map their distribution. Thanks to subsequent research and technological advancement, today we have a complete mapping of coal deposits worldwide. The black triangles in Fig. 2, right panel, depict major coal deposits in Europe based on the data of Thomas and Thomas (2002). The picture visually demonstrates that coal deposits are much more widespread throughout the continent and go beyond the coal fields that had actually been mined by 1931.
With the digitized borders of historical coalfields, we create an indicator variable taking on the value of 1 if a coalfield (any portion of it) is located in the region—we name this variable (Historical) Coalfields. About one-third of European regions had historical coal-fields defined as such.24 As expected, this share is higher in Northern Europe (about half of the regions had a historical coalfield) and lower in Southern Europe (only 20% of regions had one).
3.1.2 Historical coal‑mines
Our map of historical coalfields based on Pol et al. (1931) has the unique advantage of providing systematic and comparable evidence on the location of historical coal mining over time and space. The criteria for the mapping are identical across all countries in the sample and the presence of coal fields is captured at the same exact historical moment. The main disadvantage of this data is that it represents a very rough proxy of the intensity of actual coal extraction. A coal field could in fact exist, be known, and be mined more or less
Table 1 Literacy rate of miners and other occupational groups in England
The table summarizes literacy rates for five main occupational groups in England. Data from Vincent (2000)
Male literacy rate
1839 1844-9 1854-9 1864-9
Professional occupations 100 96 96 100Managerial/Technicaloccupations 90 91 91 90Skilled occupationsTextile 63 58 70 85Potters 58 50 56 61Metalworkers 53 60 61 79Miners 21 20 30 47Partly-skilled 58 62 66 71Unskilled 27 31 41 51
23 Certain sources define coalfields as areas rich in coal deposits. The historical map of coalfields we use is furthermore informative as to where coal was searched, found, and extracted at the time.24 The yellow polygons in Fig. 2 map the geographical distribution of historical coalfields and contains 130 polygons/coalfields, spanning across 104 regions. On average, one third of European regions had a histori-cal coalfield (with a standard deviation of 0.47).

86 Journal of Economic Growth (2021) 26:77–112
1 3
intensively. In other terms, this source of data is not informative of the actual number of collieries and miners associated to the mapped coalfields.
As an alternative measure, we rely on information from the European Route of Indus-trial Heritage (ERIH) database. The project censuses historical industrial heritage sites across 44 countries in Western Europe, Eastern Europe, and the Balkans.25 Based on this source, we create this measure of historical coal mining by counting the number of coal mines listed among these heritage sites. The right panel of Fig. 2 shows that the pres-ence of historical coalfields and historical coal mines tend to coincide.
We use the Pol et al. (1931) measure as our primary explanatory variable and replicate the full anaylsis with the ERIH data.
3.2 Empirical strategy: the geology of coal
The nature of our question suggests a comparison between regions that had coal-mines and regions that did not. Yet relying on cross-sectional variation in historical coal-mining poses several threats to identification. First off, the choice to mine is non-random. As we expect actors located in regions with initial technological and economic advantages to have selected into coal-mining, estimates based upon a simple comparison of outcomes across coal-mining and non-mining regions are likely biased. Moreover, non-classical measure-ment error in our proxy for historical coal-mining might further bias such a naive compari-son. To obtain an exogenous source of variation in the presence of coal-mines, we exploit the underlying geological features that facilitate the extraction of coal to predict where coal extraction was more likely to occur.
3.2.1 Instrumental variable #1: carboniferous surface
Coal is a sedimentary rock (deposited over 300 million years ago) found in layers called seams. In Europe, coal seams occur most extensively in rock strata originating in the Car-boniferous Period, a geologic era that spans from the end of the Devonian Period (about 350 million years ago) to the beginning of the Permian Period (about 270 million years ago), see Speight (2012) among many others.26 Because of their age, these seams are often found deep underground, but earth movements or erosion may bring them close to the sur-face. Historically, the proximity of coal to the surface facilitated the discovery and extrac-tion of coal.27
Given that coal is very often found in carboniferous strata, and that having carbonifer-ous strata closer to the surface simplified the discovery and extraction of coal, we exploit
25 Information on these sites covers 236 regions of the 31 countries in our analysis, related to sectors such as textiles, iron and steel, transport, etc.26 In common classifications, the Carboniferous Period is usually broken down into the Mississippian (between 305 and 350 million years ago) and Pennsylvanian Subperiods (between 270 and 305 million years ago). While there is some variation across across continents, European coal has almost exclusively been found in rock sediments from the Carboniferous Period. As Speight (1994) points out, “Commercially important strata are not usually found in strata older than the ... [Carboniferous]... age, although Devonian coals have been mined in Europe.”27 “Early miners first extracted coal exposed on the surface of the land...” (UK National Coal-Mining Museum). The techonological development of the mining industry (with the use of the bell/pit technology, the horse and gin etc...) allowed over time to reach always deeper seams, as well summarzed by Appendix Figure 3.

87Journal of Economic Growth (2021) 26:77–112
1 3
the presence of carboniferous surface geology in a region to predict the historical presence of coal-mines. Geological maps summarize the composition and age of surface geologi-cal materials (rock and sediment) in an area. From the geological map of Asch (2003), we retrieve information on the distribution of surface geological strata in each region in the form of polygons (see Appendix Section A.2 for further details). Following these insights, we expect to find historical coal mines predominantly in regions with Carboniferous geo-logical strata located on the surface, therefore, we instrument our measures of historical coal-mines with a variable taking on value 1 if carboniferous surfaces are present in the region.
3.2.2 Instrumental variable #2: coal‑deposits on carboniferous surfaces
Areas with carboniferous surfaces might also share a similar geography, having potentially been exposed to similar tectonic movements and erosion. Such shared features could thus represent omitted characteristics of these areas, biasing our results. As such, we adopt a second instrumental variable strategy that attempts to compare, to the extent possible, areas with similar geographical and geological profiles.
As mentioned, coal seams are often found in areas with carboniferous surface strata. Many coal deposits, however, are not located in areas where carboniferous strata lie on the surface. In many areas, for instance, coal-seams are buried deeper down, complicating the process of extraction. We hypothesize that where coal deposits are located within a car-boniferous surface strata, their discovery and extraction is cheaper and thus more probable.
We therefore use the presence of coal deposits within carboniferous surface geology as a predictor of historical coal mines. In doing so, we can also condition on the total share of carboniferous surface geology in a region and on the presence of major coal deposits in a region. In this way, we hold constant the carboniferous geology and coal richness of the region.
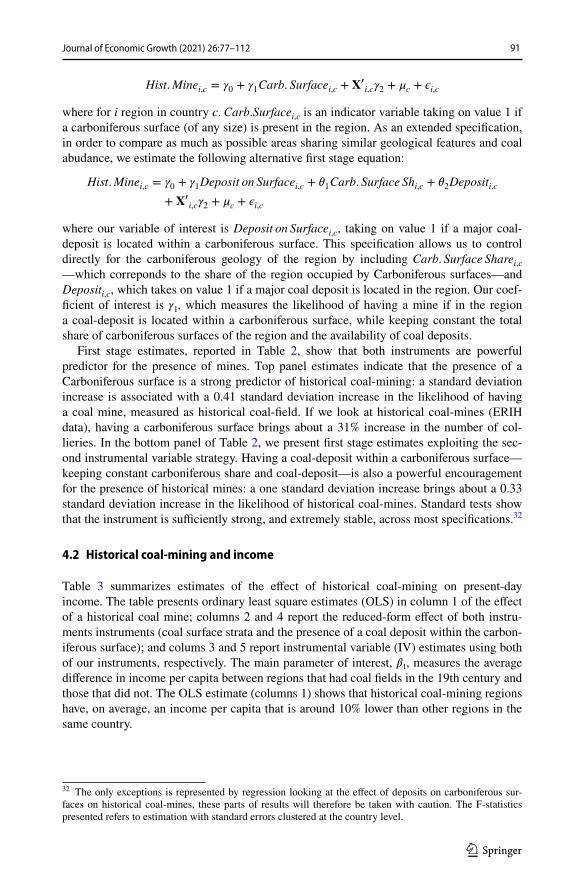
Figure 3 shows how we operationalize this strategy. Given that the polygons of carbon-iferous surface strata are often very tiny and may have been digitized with error, we draw buffers of 40 km around each polygon (as a robustness check, we replicate with buffers of
Fig. 2 Geological maps and carboniferous surfaces. Left Figure: Historical Coalfields, in yellow, are digi-tized from The Atlas Les Houilléres Européennes, by Pol et al. (1931). Different shades of blue indicate the number of historical coal-mines as documented by the ERIH Project. Right Figure: Red polygons map car-boniferous surfaces from the geological map of Asch (2007). Black triangles represent major coal-deposits in Europe, based on data from Thomas and Thomas (2002)

88 Journal of Economic Growth (2021) 26:77–112
1 3
30 and 50 km). In addition, we digitized locations of major European coal deposits using a map by Thomas and Thomas (2002) (see Appendix Figure 4). Again, since that the digi-tization of coal deposits might slightly misplace their actual location, we draw a 40 km buffer around the digitized points. We consider a coal deposit to have been located within a carboniferous surface strata whenever this buffer intersects the polygon describing the carboniferous surface geology.
Among the regions with a major coal deposit (27% of our sample), 56% of such deposits are located within carboniferous surface strata. Note, however, that out of the regions with carboniferous surface strata (51% of the sample), 62% do not have a coal deposit, as shown using the Thomas (2013) data. All in all, 21% of our regions have a coal deposit located within a carboniferous surface strata. While this second strategy allows us to directly con-trol for the actual presence of a coal deposit and for the size of carboniferous surface strata, it is also much more demanding in terms of residual variation used for estimation. We therefore implement the latter only for outcomes for which the sample is sufficiently large.
3.3 Main outcome variables
3.3.1 Per capita income and tertiary education
Our primary outcomes are taken from Eurostat (2017) regional variables. The natural loga-rithm of GDP per capita measures the regional purchasing power adjusted level of income per capita in 2010. The share of people with tertiary education measures the contemporary share of people (age 25 to 64) with a tertiary degree. As the same information is avail-able for the population of males and females, we construct a measure of the male tertiary education gap subtracting the share of women with a tertiary education from the share of men with a tertiary education. In our sample, 23.4% of females (age 25 to 64) and 22.6% of males have a tertiary degree. This implies that, on average, the male achievement gap in tertiary education is close to zero (− 0.81 as average, with a standard deviation of 5.65). From Eurostat, we also retrieve information on secondary education, and life expectancy of males and females.
3.3.2 Prevalence of universities
To measure historical public investment in tertiary education, we conduct a historical cen-sus of European universities, collecting information on the establishment date, name, and location of universities and other recognized institutions of higher education. In doing so, we adopt two strategies. As baseline, we rely on the extensive coverage of universities pro-vided by Wikipedia and extract the relevant information (name, location, and establish-ment date) through a web-based automated text extraction exercise.28 To verify that our results do not depend on non-random selection of universities included in the Wikipedia country lists, we collect similar information exploiting university rankings.29 We then use
28 We restrict our sample to 26 countries that share similar layouts for the provided information, thus ensur-ing the data is comparable across countries. Appendix Figure B13 maps the location of universities scraped from the Wikipedia pages, while Appendix Section A.4 provides further details on the automated text extraction exercise.29 Given that available rankings do not report the founding date of the institution (which must be retrievied manually), we focus on the top 500 European universities according to the “Webometrics Ranking of World Universities,” a composite index measuring the quality of universities around the world. For these universi-
89Journal of Economic Growth (2021) 26:77–112
1 3
these sources to reconstruct, for each half-century, a variable indicating the total number of universities present in the region.30 Reassuringly, while the census of Universities through Wikipedia allows us to include more institutions, the variables produced with these two different sources are highly correlated (0.56).
3.3.3 Attitudes towards education and patience
To elicit information regarding preferences and norms towards education, we rely on the European Social Survey (ESS). In the third wave (2006) of the ESS, respondents are asked at what age they consider an individual too young to leave full-time education. While the mode is 16 years old, a surprisingly high number of respondents (around 15%) claim that it is “Never too early to leave full-time education.” We take this extreme response as a symptom of strong disaffection towards and/or general devaluing of formal education. Note that, on average, there is no difference in the share of males and females claiming that it is never to early to leave full-time education. Responses are available for 144 regions located in 20 different countries. To further evaluate the role of attitudes and preferences, we complement ESS data with preferences taken from Global Preferences Survey by Falk et al. (2018), which also includes important information on subjective math skills and other traits that have been found to be relevant for human capital accumulation such as time pref-erences (Galor and Özak 2016).
Fig. 3 Geological maps and carboniferous surface strata. Red polygons represent buffers around carboniferous surfaces strata retrieved from Asch (2007). Black triangles map major European coal-deposits from Thomas and Thomas (2002)
ties we retrieve the establishment date and location of each institution so to replicate in spirit the measure constructed via automated text extraction from the Wikipedia pages.
Footnote 29 (continued)
30 Note that both variables are constructed based on universities that are still functioning today, and thus may ignore institutions that existed in the past but then had to shut down. If coal-mining regions had uni-versities that closed as a consequence of specialization into mining, this would attenuate the effect that we estimate.

90 Journal of Economic Growth (2021) 26:77–112
1 3
4 Historical coal‑mining and income: a long‑term curse
4.1 Estimating equations
4.1.1 Baseline specification
In order to explore the local effects of resource extraction, throughout the analysis we exploit within-country variation in historical mines. More formally, we estimate variations of the following equation:
where i stands for region and c for country. Our baseline specification includes the full set of country fixed effects �c , netting out the role of possible confounders that operate at the country level. In this way our empirical approach allows us to focus on the sub-set of politi-cal and economic channels most closely linked to the local/regional impact of coal-mining, abstracting from mechanisms that operate at the national level such as currency apprecia-tion or elites’ extractive behaviors. We thus explore local variation in resource abundance following the rich literature of within county studies already discussed in Sect. 1. At the same time, we retain the advantage of a multi-country setting by focusing on 31 countries. In this way, our approach is similar to that of Berman et al. (2015), facilitating the plausible identification of causal effects while preserving a degree of external validity.
We control for a number of exogenous covariates, �i,c . First, to exclude the possibil-ity that a peculiar geography associated with coal-mining areas may confound our results, we collect information on the geography and climate of each region, recording measures of average ruggedness, elevation, soil suitability, average and standard deviation of tem-perature and precipitation.31 Additionally, we record for each region a full set of distance measures (from each centroid to the coast, to the country border, to rivers, from country capitals) and a dummy variable for the presence of ports. Last, we include location con-trols (latitude, longitude, and the interaction of latitude and longitude). Maps in Figure B3 provide a visual representation of the residual variation of the variables Carboniferous Sur-faces and Deposits on Surfaces after accounting for country fixed effects and baseline geo-climatic and location controls.
We account for spatial correlation in the errors in two ways. First, we compute Conley (1999) standard errors adjusted for two-dimensional spatial dependence. To be as conserv-ative as possible, following Colella et al. (2019), we select the cutoff values providing the largest confidence intervals for our baseline specification. The selected cutoffs correspond to 100 km, as documented by Appendix Figure B1. Moreover, we verify our results also reporting standard errors clustered at country level.
4.1.2 Instrumental variable strategies
The first instrumental variable strategy we propose exploits the presence of carboniferous surfaces to predict historical coal-mining. We therefore estimate the following first stage equation:
LnGDPpci,c = �0 + �1HistoricalMinei,c + ��
i,c�2 + �c + �i,c
31 We take averages and averages of standard deviation of monthly climate with data from 1900 to 1960.
91Journal of Economic Growth (2021) 26:77–112
1 3
where for i region in country c. Carb.Surfacei,c is an indicator variable taking on value 1 if a carboniferous surface (of any size) is present in the region. As an extended specification, in order to compare as much as possible areas sharing similar geological features and coal abudance, we estimate the following alternative first stage equation:
where our variable of interest is Deposit on Surfacei,c , taking on value 1 if a major coal-deposit is located within a carboniferous surface. This specification allows us to control directly for the carboniferous geology of the region by including Carb. Surface Sharei,c—which correponds to the share of the region occupied by Carboniferous surfaces—and Depositi,c , which takes on value 1 if a major coal deposit is located in the region. Our coef-ficient of interest is �1 , which measures the likelihood of having a mine if in the region a coal-deposit is located within a carboniferous surface, while keeping constant the total share of carboniferous surfaces of the region and the availability of coal deposits.
First stage estimates, reported in Table 2, show that both instruments are powerful predictor for the presence of mines. Top panel estimates indicate that the presence of a Carboniferous surface is a strong predictor of historical coal-mining: a standard deviation increase is associated with a 0.41 standard deviation increase in the likelihood of having a coal mine, measured as historical coal-field. If we look at historical coal-mines (ERIH data), having a carboniferous surface brings about a 31% increase in the number of col-lieries. In the bottom panel of Table 2, we present first stage estimates exploiting the sec-ond instrumental variable strategy. Having a coal-deposit within a carboniferous surface—keeping constant carboniferous share and coal-deposit—is also a powerful encouragement for the presence of historical mines: a one standard deviation increase brings about a 0.33 standard deviation increase in the likelihood of historical coal-mines. Standard tests show that the instrument is sufficiently strong, and extremely stable, across most specifications.32
4.2 Historical coal‑mining and income
Table 3 summarizes estimates of the effect of historical coal-mining on present-day income. The table presents ordinary least square estimates (OLS) in column 1 of the effect of a historical coal mine; columns 2 and 4 report the reduced-form effect of both instru-ments instruments (coal surface strata and the presence of a coal deposit within the carbon-iferous surface); and colums 3 and 5 report instrumental variable (IV) estimates using both of our instruments, respectively. The main parameter of interest, �1 , measures the average difference in income per capita between regions that had coal fields in the 19th century and those that did not. The OLS estimate (columns 1) shows that historical coal-mining regions have, on average, an income per capita that is around 10% lower than other regions in the same country.
Hist.Minei,c = �0 + �1Carb. Surfacei,c + ��
i,c�2 + �c + �i,c
Hist.Minei,c = �0 + �1Deposit on Surfacei,c + �1Carb. Surface Shi,c + �2Depositi,c
+ ��
i,c�2 + �c + �i,c
32 The only exceptions is represented by regression looking at the effect of deposits on carboniferous sur-faces on historical coal-mines, these parts of results will therefore be taken with caution. The F-statistics presented refers to estimation with standard errors clustered at the country level.
92 Journal of Economic Growth (2021) 26:77–112
1 3
Instrumental variable estimates (Columns 3 and 5) confirm the negative effect of his-torical coal extraction on present-day income. In absolute values, our instrumental vari-able estimates tend to be two to three times larger than those estimated via OLS. This is expected. First, regions that were more likely to benefit from cheap energy due to early industrialization were more likely to seek to mine coal, if there is some persistence in development, comparing coal-mining and non-coal-mining regions will underestimate the true effect of coal extraction.33 Second, since our setting features a dichotmous dependent variable and a dichotomous instrument, measurement errors of non-classical form can also concur to the difference between OLS and IV estimates.34 To be as conservative as pos-sible, we can use OLS and IV estimates as lower and upper bound of the true coefficient. Focusing on estimates in column 1 and 5, we can take home a negative effect of histori-cal coal-mines on income ranging between 10% and 25%. Appenidx Table B1 replicates baseline estimates using historical coal-mines from the ERIH database. When looking at the number of coal-mines, in terms of magnitude, a one standard deviation increase in the log-number of mines would bring about a decrease in income of 0.29 standard deviations (column 5).
4.2.1 Permian and devonian geography: a falsification exercise
Carboniferous surface strata might share peculiar geo-climatic features that, in turn, might impact present-day incomes.35 As such, baseline specifications control for a rich set of cli-matic, geographic, and location characteristics.36 Relatedly, if Carboniferous surfaces were associated with poorer or less urbanized areas before coal extraction took off, we should observe lower overall urbanization even before coal started to be intensively mined. Appen-dix Figure B5 shows that areas with a carboniferous surface strata were no different from other regions in terms of average population, city population and average number of cities with more than 12 thousand people before the peak decades of coal extraction. If anything, carboniferous regions tended to have a slightly higher population than other regions in the same country.37
33 It is also possible that, since our measure of historical coalfields maps coalfields active in the 19th century and early decades of the 20th century, our measure may not capture additional negative effect of coalfields that had yet to be discovered and exploited, including in the “control” group of regions units that were, in reality, treated. Further, the compliers are mostly located in regions in Northern and Eastern Europe, as only 3 southern European countries had historical coal-mines.34 In these cases, a specific type of misclassification of the endogenous variable might imply a downward bias of the OLS coefficient and an upward bias in the IV coefficient. This bias is a function of the difference in the share of mining units erroneously classified as non-mining and the share of non-mining units errone-ously classified as mining. In all these circumstances, OLS and IV estimates could still be used to bound the true coefficient. Notice also that the analysis conducted using Ln(Coal-Mines) does not suffer of this type of bias and provide results that are very much in line with the ones discussed above.35 Strata from the Carboniferous period emerged roughly when the supercontinent Pangea started to form, between 354 and 290 million years ago. Originally located in the Southern hemisphere, Pangea underwent a long series of decompositions, shifts, and radical climatic changes before giving origin to today’s conti-nents. Still, the random decomposition of Pangea might have accidentally lead to the concentration of Car-boniferous rocks in areas with a peculiar climate or geography.36 Figure B4 in the Appendix plots the cross-region relationship between several geographical features and share of Carboniferous strata. Regions high in Carboniferous tend to be slightly more rugged and to have a lower average temperature.37 As a robustness analysis, we borrow the methodology of Conley et al. (2012) to assess the robustness of our instrumental variable strategy to potential violation of the exogeneity of the instrument.

93Journal of Economic Growth (2021) 26:77–112
1 3
Furthermore, given the proximity in geological time of Permian, Carboniferous and Devonian strata, we should expect areas where earth movements and erosion brought them close to the surface to share many observable and unobservable geographical fea-tures. Despite these potential geographical similarities, we expect relatively few coal mines to be located in regions with Devonian surface geology and little or no mines in areas with Permian. Simple correlations are in line with our predictions: the variable
Table 2 Historical coal-mining and carboniferous surfaces
OLS estimates. The unit of observation is the NUTS2 European region. The dependent variable, in columns 1–3, is the variable Historical Coalfields, an indicator variable taking on value of 1 if a historical coal-field is located in the region; in columns 4–6, the dependent variable is Historical Coal-Mines, the natural loga-rithm of the number of coal-mines in the region. Carboniferous Surface is an indicator variable taking on value of 1 if a carboniferous surface is present in the region. Deposit on Surface is a dummy variable taking on value of 1 if a coal-deposit localized on top of a carboniferous surface is present in the region. Carbon-iferous Geography measures the share of a region area that is occupied by a Carboniferous surface. Coal Deposit is an indicator variable taking on value of 1 if a coal-deposit is located in the region. Robust stand-ard errors clustered at the country level in round brackets, Conley standard errors (100 km degrees cut-off) in square brackets, standardized beta coefficient in curly brackets. ***, **, * indicate significance at 1-, 5-, and 10-% level, respectively, relative to robust standard errors clustered at the country level
Coal fields Ln (Coal mines)
(1) (2) (3) (4) (5) (6)
Carboniferous surface 0.410*** 0.391*** 0.385*** 0.302*** 0.310*** 0.311***(0.105) (0.114) (0.115) (0.078) (0.080) (0.082)[0.055] [0.055] [0.055] [0.056] [0.059] [0.062]{0.433} {0.413} {0.406} {0.323} {0.333} {0.334}
ControlsGeographic Y Y Y YLocation & distances Y YCountry FE Y Y Y Y Y YR-squared 0.46 0.48 0.49 0.26 0.26 0.271st stage F-stat 15.14 11.73 11.11 14.86 14.88 14.37Deposit on surface 0.345*** 0.364*** 0.379*** 0.346*** 0.351*** 0.357***
(0.084) (0.085) (0.101) (0.113) (0.114) (0.119)[0.083] [0.083] [0.083] [0.113] [0.113] [0.115]{0.300} {0.316} {0.329} {0.305} {0.310} {0.315}
ControlsGeographic Y Y Y YLocation & distances Y YCarb. geography Y Y Y Y Y YCoal deposits Y Y Y Y Y YCountry FE Y Y Y Y Y YR-dquared 0.45 0.48 0.50 0.36 0.37 0.371st stage F-stat 16.85 18.28 14.21 9.37 9.47 9.05Observations 306 306 306 306 306 306Number of clusters 31 31 31 31 31 31Average dep. var. 0.34 0.34 0.34 0.23 0.23 0.23

94 Journal of Economic Growth (2021) 26:77–112
1 3
Historical Coal Fields has a correlation of 0.69 with the variable share of Carboniferous strata, 0.14 with the variable share of Devonian strata, and 0.04 with Permian strata.
Figure 4 shows that our intuition is correct, and that Carboniferous, Devonian, and Per-mian strata are very often contiguous and similarly distributed.38
However, the results, summarized in Table 4, show that Permian and a Devonian surface geology are not associated with lower income once we control for the presence of Carbon-iferous surface strata.
Table 3 Historical coal-mining and income per capita in 2010
OLS, Reduced-form and IV estimates. The unit of observation is the NUTS2 European region. The depend-ent variable is the natural logarithm of GDP per capita in 2010 (purchasing power-adjusted). Coalfields is an indicator variable taking on value of 1 if a historical coal-field is located in the region. The instrument is Carboniferous Surface in columns 2 and 3, Deposit on surface in columns 5 and 6, where Carboniferous Surface is an indicator variable taking on value of 1 if a carboniferous surface is present in the region; while Deposit on surface is a dummy variable taking on value of 1 if a coal-deposit localized within a carbonifer-ous surface is present in the region. Robust standard errors clustered at the country level in round brackets, Conley standard errors (100 km degrees cut-off) in square brackets. ***, **, * indicate significance at 1-, 5-, and 10-% level, respectively, relative to robust standard errors clustered at the country level
Ln (Income Per Capita)
OLS Carboniferous surface Deposit on surface
Red. form IV Red. form IV
Coal fields − 0.101*** − 0.348*** − 0.254**(0.029) (0.114) (0.099)[0.038] [0.086] [0.123]
Instrument − 0.134*** − 0.096**(0.037) (0.035)[0.031] [0.042]
ControlsCarb. geography Y YCoal deposits Y YGeographic Y Y Y Y YLocation & distances Y Y Y Y YCountry FE Y Y Y Y YBeta coef. − 0.108 − 0.152 − 0.375 − 0.090 − 0.273Average dep. var. 9.93 9.93 9.93 9.93 9.93Number of clusters 31 31 31 31 31Observations 306 306 306 306 306R-squared 0.77 0.78 0.771st stage F-stat 11.11 14.21
38 The correlation between Carboniferous Strata and Permian Strata is 0.37, between Carboniferous Strata and Devonian Strata is 0.46.

95Journal of Economic Growth (2021) 26:77–112
1 3
4.2.2 Robustness and additional results
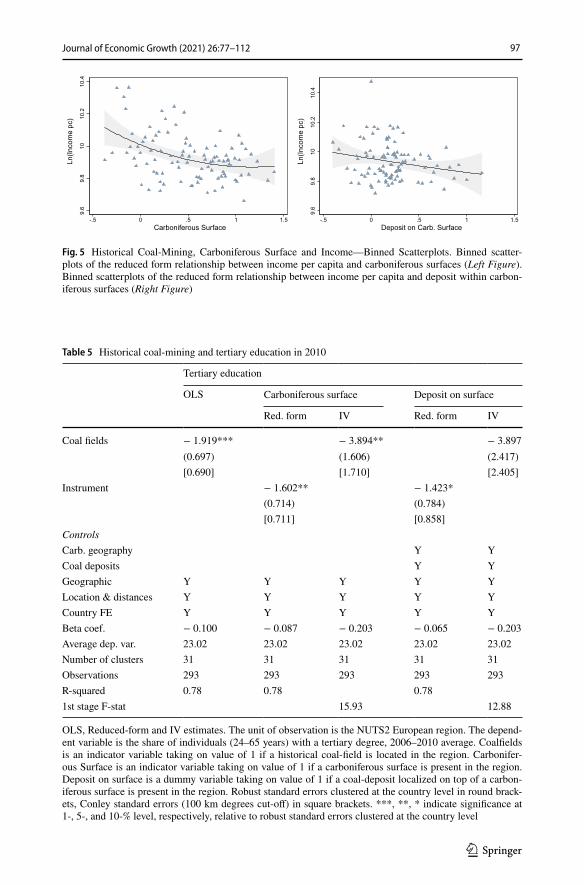
Figure 5 presents scatter plots and indicates that our findings are not driven by outliers. Appendix Figure B8 replicates our baseline results, splitting the sample into 3 differ-ent groups of countries: Northern, Eastern and Southern Europe. Across all the regions, the negative effect of carboniferous surface geology is confirmed. Further, results do not depend on the unit of observation used in the baseline analysis. In Appendix Table B9, we zoom-in and explore within-country variation in England, taking English Local Author-ity Districts as our units of observation. Our results are very similar in size to our base-line effects. Furthermore, the richness of the micro-data allows us to examine the negative effect on income across income deciles. We show that all income groups are negatively affected by historical coal-mining (Figure B9). As a further alternative to the regional-level analysis in our baseline, we replicate the analysis at grid-cell level of 0.5 × 0.5 degrees of size. To measure income per capita at this disaggregate level, we use the global grid-ded Gross Domestic Product (GDP) of Nordhaus and Chen (2016). Table B6 shows that, despite being less precisely estimated (probably because of the measurement error in the gridded GDP data), the negative effect on income established in our baseline analysis is confirmed. In Appendix Table B2 and Table B3 we present results including distance to carboniferous surface strata and the standard deviation of elevation as controls. In table B4 we consider possible heterogeneities in the effect related to distance from rivers and coasts. All in all, our results point to a substantial negative effect of a history of coal extraction on income providing evidence of a very sizable “European coal curse.”
5 Historical coal‑mining and human capital
Beyond uncovering a direct negative impact of historical coal-mining on present-day incomes, our next empirical findings indicate that former coal-mining regions are also characterized by signifincantly lower levels of human capital.
5.1 Coal‑mining and tertiary education
To start, we provide evidence of a large negative effect of historical coal mining on the share of people with a tertiary education. In Table 5 we show that having had a histori-cal mine decreases the share of individuals (age 25 to 64) with a tertiary degree by 2–4% points relative to other non-mining regions in the same country, which implies a 10–20% reduction compared to the regional average. The IV estimates are about two times larger than those derived from OLS, again suggesting that a selection into historical coal-mining obscures the effect that emerges from a naive comparison between coal-rich regions and other, non-mining, regions. While the IV coefficient using the Deposit on Carboniferous surface strata instrument (column 6) is not precisely estimated, it is virtually identical to our IV estimate using Carboniferous surface strata as our instrument (column 3).
Regression results treating historical coal-mines as the explanatory variable (Appendix Table B7) and in binned scatter plots (Appendix Figure B10) confirm the results presented here. Similarly, in Table B8 we present a falsification exercise looking at Permian and Devonian strata. In Appendix Table B9 we show that there is no sizable negative effect of historical coal mines on the share of people (age 25 to 64) with a secondary degree. These

96 Journal of Economic Growth (2021) 26:77–112
1 3
Fig. 4 Carboniferous, Permian and Devonian Surfaces. The polygons map the geological surfaces from the Carboniferous (red), Devonian (purple) and Per-mian (orange) periods. From the geological map by Asch (2007), digitized by the authors
Table 4 Falsification exercise—permian and devonian surfaces
OLS estimates. The unit of observation is the NUTS2 European region. The dependent variable is the natu-ral logarithm of GDP per capita in 2010 (purchasing power-adjusted). Permain (Devonian) Surface strata is an indicator variable taking on value of 1 if a Permian (Devonian) surface strata is present in the region. Robust standard errors clustered at the country level in round brackets, Conley standard errors (100 km degrees cut-off) in square brackets, standardized beta coefficient in curly brackets. ***, **, * indicate sig-nificance at 1-, 5-, and 10-% level, respectively, relative to the Conley Standard Errors
Ln(Income per Capita)
(1) (2) (3) (4) (5) (6)
Permian surface − 0.085** − 0.045 − 0.070 − 0.043(0.040) (0.044) (0.044) (0.048)[0.031] [0.030] [0.032] [0.031]{− 0.094} {− 0.050} {− 0.077} {− 0.047}
Devonian surface − 0.070** − 0.020 − 0.051 − 0.012(0.029) (0.027) (0.032) (0.032)[0.030] [0.028] [0.030] [0.029]{− 0.075} {− 0.022} {− 0.055} {− 0.013}
Carboniferous surface − 0.122*** − 0.127*** − 0.118***(0.039) (0.040) (0.041)[0.031] [0.032] [0.032]{− 0.139} {− 0.144} {− 0.134}
ControlsGeographic Y Y Y Y Y YLocation & distances Y Y Y Y Y YCountry FE Y Y Y Y Y YR-squared 0.76 0.78 0.76 0.78 0.77 0.78Observations 306 306 306 306 306 306Number of clusters 31 31 31 31 31 31Average dep. var. 9.93 9.93 9.93 9.93 9.93 9.93
97Journal of Economic Growth (2021) 26:77–112
1 3
9.6
9.8
1010
.210
.4
Ln(In
com
e pc
)
-.5 0 .5 1 1.5Carboniferous Surface
9.6
9.8
1010
.210
.4
Ln(In
com
e pc
)
-.5 0 .5 1 1.5Deposit on Carb. Surface
Fig. 5 Historical Coal-Mining, Carboniferous Surface and Income—Binned Scatterplots. Binned scatter-plots of the reduced form relationship between income per capita and carboniferous surfaces (Left Figure). Binned scatterplots of the reduced form relationship between income per capita and deposit within carbon-iferous surfaces (Right Figure)
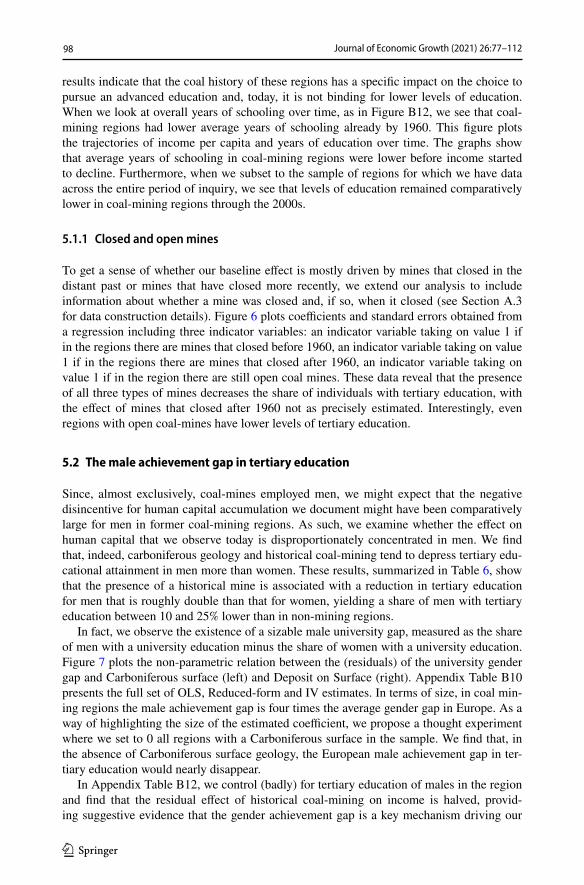
Table 5 Historical coal-mining and tertiary education in 2010
OLS, Reduced-form and IV estimates. The unit of observation is the NUTS2 European region. The depend-ent variable is the share of individuals (24–65 years) with a tertiary degree, 2006–2010 average. Coalfields is an indicator variable taking on value of 1 if a historical coal-field is located in the region. Carbonifer-ous Surface is an indicator variable taking on value of 1 if a carboniferous surface is present in the region. Deposit on surface is a dummy variable taking on value of 1 if a coal-deposit localized on top of a carbon-iferous surface is present in the region. Robust standard errors clustered at the country level in round brack-ets, Conley standard errors (100 km degrees cut-off) in square brackets. ***, **, * indicate significance at 1-, 5-, and 10-% level, respectively, relative to robust standard errors clustered at the country level
Tertiary education
OLS Carboniferous surface Deposit on surface
Red. form IV Red. form IV
Coal fields − 1.919*** − 3.894** − 3.897(0.697) (1.606) (2.417)[0.690] [1.710] [2.405]
Instrument − 1.602** − 1.423*(0.714) (0.784)[0.711] [0.858]
ControlsCarb. geography Y YCoal deposits Y YGeographic Y Y Y Y YLocation & distances Y Y Y Y YCountry FE Y Y Y Y YBeta coef. − 0.100 − 0.087 − 0.203 − 0.065 − 0.203Average dep. var. 23.02 23.02 23.02 23.02 23.02Number of clusters 31 31 31 31 31Observations 293 293 293 293 293R-squared 0.78 0.78 0.781st stage F-stat 15.93 12.88
98 Journal of Economic Growth (2021) 26:77–112
1 3
results indicate that the coal history of these regions has a specific impact on the choice to pursue an advanced education and, today, it is not binding for lower levels of education. When we look at overall years of schooling over time, as in Figure B12, we see that coal-mining regions had lower average years of schooling already by 1960. This figure plots the trajectories of income per capita and years of education over time. The graphs show that average years of schooling in coal-mining regions were lower before income started to decline. Furthermore, when we subset to the sample of regions for which we have data across the entire period of inquiry, we see that levels of education remained comparatively lower in coal-mining regions through the 2000s.
5.1.1 Closed and open mines
To get a sense of whether our baseline effect is mostly driven by mines that closed in the distant past or mines that have closed more recently, we extend our analysis to include information about whether a mine was closed and, if so, when it closed (see Section A.3 for data construction details). Figure 6 plots coefficients and standard errors obtained from a regression including three indicator variables: an indicator variable taking on value 1 if in the regions there are mines that closed before 1960, an indicator variable taking on value 1 if in the regions there are mines that closed after 1960, an indicator variable taking on value 1 if in the region there are still open coal mines. These data reveal that the presence of all three types of mines decreases the share of individuals with tertiary education, with the effect of mines that closed after 1960 not as precisely estimated. Interestingly, even regions with open coal-mines have lower levels of tertiary education.
5.2 The male achievement gap in tertiary education
Since, almost exclusively, coal-mines employed men, we might expect that the negative disincentive for human capital accumulation we document might have been comparatively large for men in former coal-mining regions. As such, we examine whether the effect on human capital that we observe today is disproportionately concentrated in men. We find that, indeed, carboniferous geology and historical coal-mining tend to depress tertiary edu-cational attainment in men more than women. These results, summarized in Table 6, show that the presence of a historical mine is associated with a reduction in tertiary education for men that is roughly double than that for women, yielding a share of men with tertiary education between 10 and 25% lower than in non-mining regions.
In fact, we observe the existence of a sizable male university gap, measured as the share of men with a university education minus the share of women with a university education. Figure 7 plots the non-parametric relation between the (residuals) of the university gender gap and Carboniferous surface (left) and Deposit on Surface (right). Appendix Table B10 presents the full set of OLS, Reduced-form and IV estimates. In terms of size, in coal min-ing regions the male achievement gap is four times the average gender gap in Europe. As a way of highlighting the size of the estimated coefficient, we propose a thought experiment where we set to 0 all regions with a Carboniferous surface in the sample. We find that, in the absence of Carboniferous surface geology, the European male achievement gap in ter-tiary education would nearly disappear.
In Appendix Table B12, we control (badly) for tertiary education of males in the region and find that the residual effect of historical coal-mining on income is halved, provid-ing suggestive evidence that the gender achievement gap is a key mechanism driving our

99Journal of Economic Growth (2021) 26:77–112
1 3
baseline results that link a history of coal mining to lower incomes today. In, Table B13, we analogously control (badly) for the tertiary education of women. Its inclusion brings about a markedly smaller—but still relevant—decrease in the negative effect of historical coal-mining.39
6 Drivers of lower human capital
Next, we find evidence consistent with two, possibly complementary, drivers of lower human capital in mining regions. First, we show that regions that historically mined coal invested less in education and provide evidence consistent with the fact that this histori-cal public under-investment left a persistent legacy in terms of educational achievement. Second, we show that individuals in coal-mining regions have lower life expectancies—especially men—and possibly as a consequence, a significantly lower future orientation, potentially driving the lower levels of human capital we observe today.
6.1 Historical public investment in education: the founding of universities
We first provide evidence that coal-mining is at the root of historical public under-invest-ment in university education. In the absence of historical regional data on public invest-ment in education, we rely on a raw but indicative proxy, the presence of universities.40 With these data we reconstruct the evolution of universities over time and show that coal abundance is not associated with a differential history before the intensification of coal-mining in the 19th century. Only after coal became central to the European economy does the effect we identify materialize.
In Fig. 8 we plot the total number of universities over time, comparing coal-mining regions with non-coal-mining regions located in the same country. Here, we look at the time-varying effect of Carboniferous surfaces strata (left figure) and deposit on surface (right figure). In Appendix Figure B14 and B15 replicate the same graphs as above using universities per capita and our alternative, rankings based, measure of universities as the outcome, respectively. Appendix Tables B15, B16, B17 give an extensive set of specifica-tions (OLS, Reduced-form and IV) for the years 1950 and 2000, treating universities and universities per capita as the outcome.
Figure 8 shows that areas with a greater underlying propensity to mine coal had the same number of universities as other regions in the same country through the beginning of the 19th century. After this, the number of universities declined in these coal-rich regions in comparison to other regions. Across empirical strategies and data, coal-mining regions differed markedly in terms of universities founded by 1950. These results are precisely esti-mated and consistent in magnitude across empirical specifications and different outcome variables. Coefficients suggest that coal-mining regions had between 0.5-2 universities less than other regions in the same country. The coefficients in 1950 and 2000 tend to be similar
39 In a Mincerian spirit, Appendix Table B14, presents estimates using Carboniferous surface strata as an instrument of Tertiary Education of males.40 Note that public under-investment in universities could be the consequences of both a lower supply and a lower demand of universities in a region. We are interpreting the presence of a university as local public investment in education because, de facto, regions without a university receive fewer resources for tertiary education than regions with a university.

100 Journal of Economic Growth (2021) 26:77–112
1 3
in size but estimates for 2000 are more noisily estimated, suggesting a partial catch-up of former coal-mining regions.
In Appendix Table B19 we replicate results using 0.5 x 0.5 grid cells as units of obser-vation. These results allows us to rule out that the choice of the region, as unit of observa-tion, is driving our findings. In Appendix Table B18 we present a falsification exercise looking at the effect of Devonian and Permian surfaces.
Historical human capital shocks persist over time (Caicedo 2018; Waldinger 2016; Chen et al. 2017). While coal-mining regions may have, partially, caught up in terms of public investment in education, we provide suggestive evidence, consistent with existing findings on the legacies of human capital shocks, that the historical under-investment in education drives present-day lower levels of human capital accumulation. In Appendix Tables B20 and B21 we show that once historical under-investment in education—measured as total number of universities in 1950—is accounted for, the direct effect of historical coal-mining on tertiary education and income—today—shrinks substantially.
6.1.1 Channels of persistence: attitudes toward education
We find support for a related mechanism through which a history of coal-mining impacts present-day levels of education. We show that a history of mining engendered deep-seated attitudes and social norms, resulting in a general devaluation of higher learning. Using data from the European Social Survey, we examine individuals’ opinions on school-leaving, where our dependent variable takes on the value of one if the individual considers it to be never too early to stop formal education. We take this response as evidence of a strong dis-affection towards education. In order to avoid responses that simply reflect the educational level or the occupational status of the respondent, in the even columns we include dummies for educational level and occupation, effectively comparing the responses of individuals with the same level of education and with the same occupation across historical mining and other regions.
These results are summarized in Table 7 and show that individuals living in coal-min-ing regions are more likely to have negative views of formal education. Using OLS and IV estimates to bound the effect, having an historical coal mine brings about an increase in the share of people that devalue formal education between 0.4 and 5.7% (columns 2 and 6). Appendix Table B22 replicates these results using the alternative measure of his-torical coal-mines. Table B23 and B24 presents result for people younger and older than
Fig. 6 Old Mines, Closed Mines and Open Mines. The graph plots OLS estimates of a regression using as outcome variable the share of individuals with a tertiary education and including three indicator variable. Mines Closed Before 1960 is an indicator variable taking on value 1 if in the regions there are mines that closed before 1960. Mines Closed After 1960 is an indicator variable taking on value 1 if in the regions there are mines that closed after 1960. Open Mines is an indicator variable taking on value 1 if in the region there are still open coal mines

101Journal of Economic Growth (2021) 26:77–112
1 3
40, respectively, and show that coefficients, although not always precisely estimated, are extremely similar.
Given that our results on tertiary education reported in Sect. 5 suggest a stronger effect on men, it is natural to expect heteorgeneity across genders in attitudes towards formal edu-cation. As before, we treat the share of individuals who view it as never too early to leave
Table 6 Historical coal-mining, tertiary education and gender in 2010
OLS, Reduced-form and IV estimates. The unit of observation is the NUTS2 European region. The depend-ent variable is the share of males and females (24–65 years) with a tertiary degree (2006–2010 average). Coalfields is an indicator variable taking on value of 1 if a historical coal-field is located in the region. Car-boniferous Surface is an indicator variable taking on value of 1 if a carboniferous surface is present in the region. Deposit on surface is a dummy variable taking on value of 1 if a coal-deposit localized on top of a carboniferous surface is present in the region. Robust standard errors clustered at the country level in round brackets, Conley standard errors (100 km degrees cut-off) in square brackets. ***, **, * indicate signifi-cance at 1-, 5-, and 10-% level, respectively, relative to robust standard errors clustered at the country level
OLS Carboniferous Surface Deposit on Surface
Red. Form IV Red. Form IV
Tertiary education and gender maleCoal fields − 2.094*** − 5.273*** − 5.749**
(0.698) (1.483) (2.287)[0.719] [1.751] [2.372]
Instrument − 2.169*** − 2.099***(0.736) (0.748)[0.729] [0.760]
Beta coef. − 0.112 − 0.121 − 0.283 − 0.098 − 0.308Average dep. var. 22.62 22.62 22.62 22.62 22.62R-squared 0.76 0.76 0.77Tertiary education and gender femaleCoal fields − 1.769** − 2.488 − 2.044
(0.806) (1.898) (2.754)[0.742] [1.851] [2.956]
Instrument − 1.023 − 0.746(0.820) (0.995)[0.766] [1.090]
Beta coef. − 0.083 − 0.050 − 0.116 − 0.031 − 0.096Average dep. var. 23.43 23.43 23.43 23.43 23.43R-squared 0.80 0.79 0.80Number of clusters 31 31 31 31 31Observations 293 293 293 293 2931st stage F-stat 15.93 12.88ControlsCarb. geography Y YCoal deposits Y YGeographic Y Y Y Y YLocation & distances Y Y Y Y YCountry FE Y Y Y Y Y

102 Journal of Economic Growth (2021) 26:77–112
1 3
formal education as our dependent variable. Here, we examine separately preferences for education of men and women and find that our previous result on education, which aggre-gates across genders, masks substantial heterogeneity across male and female respondents. Table B25 (columns 1–3 for males, columns 4–7 for females) shows that the coefficient for men is almost 2 times larger in absolute terms than that for women, and is also statisti-cally indistinguishable from zero. It is important to note, however, that standard errors on these estimates are large and we can only take these differences as suggestive evidence of heterogeneity. Interestingly, and somewhat surprisingly, the same gender heterogene-ity in attitudes towards higher education does not emerge when looking at respondents older than 40 (see Appendix Table B26). Overall, older cohorts also show higher disaf-fection towards formal education, but older men do not devalue formal education more than older women respondents. These age differences might reflect gender-specific vari-ations in attitudes toward education over the course of the life cycle. Or, alternatively, it could reflect that comparatively higher (lower) disaffection for formal education of young males (females) might have emerged only recently amongs younger generations. Given that responses to this question are only available for a single survey year (2016), we cannot dis-tinguish between these explanations.
Fig. 7 Carboniferous Surface and the University Gender Gap in 2010—Local Polynomial Smooth. Local polynomial smooth of the university gender gap in 2010 on carboniferous surfaces (Left Figure) and deposit within carboniferous surfaces (Right Figure), after controlling for country, geographic, location and dis-tance controls
Fig. 8 Carboniferous Surface and Prevalence of Universities over Time. The graph plots estimates of the coefficient Carboniferous surface (Left Figure) and Deposit within Carboniferous surface (Right Figure) on the number of universities in the region over time

103Journal of Economic Growth (2021) 26:77–112
1 3
In addition, we explore whether part of the underlying gap in tertiary educational attain-ment might be related to broader attitudes towards gender in former coal-mining regions. To gain a sense of this we examine two additional questions from the European Social Survey that ask: i) whether men have more of a right to jobs than women, and ii) whether women should focus on family and cut down on paid work. Results, reported in Appendix Table B28, show that indeed former coal-mining regions tend to have more traditional atti-tudes towards gender on the role of men in the labor market and in society. However, coef-ficients are fairly small and not precisely estimated.
6.2 Life expectancy, time preferences and human capital
6.2.1 Health
Coal mining, especially during the 19th century, resulted in extreme levels of pollution, with severe consequences for mortality and health (Bailey et al. 2016; Beach and Hanlon 2018). It is possible that historical pollution and environmental degradation has negatively affected the general health status of individuals in former coal-mining regions and reduced
Table 7 Historical coal-mining and attitudes towards school
OLS, Reduced-form and IV estimates. The unit of observation is the European Social Survey respondent (2016, 3.6 Edition). The dependent variable is a dummy variable taking on value 1 if the respondent con-sider that it is never too early to leave full-time education, 0 otherwise. Coalfields is an indicator variable taking on value of 1 if a historical coal-field is located in the region. Carboniferous Surface is an indicator variable taking on value of 1 if a carboniferous surface is present in the region. Robust standard errors clus-tered at the country level in square brackets, Robust standard errors clustered at the NUTS2 level in round brackets, Conley standard errors (100 km degrees cut-off) in square brackets. ***, **, * indicate signifi-cance at 1-, 5-, and 10-% level, respectively, relative to robust standard errors clustered at the country level
Never too young to leave full-time education
OLS Reduced form IV
Coal fields 0.005 0.008 0.065* 0.057*(0.012) (0.011) (0.034) (0.033)[0.012] [0.011] [0.038] [0.036]
Carboniferous surface 0.024** 0.021*(0.012) (0.012)[0.013] [0.012]
ControlsGeographic Y Y Y Y Y YLocation & distances Y Y Y Y Y YCountry FE Y Y Y Y Y YIndividual Y Y Y Y Y YEducation/occupation FE Y Y YBeta coef. 0.007 0.009 0.033 0.029 0.080 0.071Average dep. var. 0.15 0.15 0.15 0.15 0.15 0.15Number of clusters 144 144 144 144 144 144Observations 36378 36378 36378 36378 36378 36378R-Squared 0.10 0.11 0.10 0.111st Stage F-Stat 19.24 19.62
104 Journal of Economic Growth (2021) 26:77–112
1 3
average life-expectancy for adults through the present. In Appendix Table B29, we look at the self-reported health status of ESS survey respondents and find, indeed, even today respondents in coal mining regions report lower average health. Importantly, this is not true for respondents younger than 40 (Appendix Table B30), possibly indicating that older indi-viduals, including those that were still alive while the last coal-mines were active, are those reporting worse health statuses.
To further assess the role of health in human capital accumulation, we focus on present-day life expectancy: Table 8 shows that individuals in former coal-mining regions have notably lower life expectancy at birth, between 0.55 and 1.75 years shorter. All coefficients are very precisely estimated and consistent across empirical strategies. Results from a fal-sification exercise looking at Permian and Devonian strata, Appendix Table B32, provides further evidence in support of our identification assumptions.
In line with the Ben-Porath hypothesis, historically lower life expectancy could have contributed to lower investments in human capital. Indirect evidence of the complementary relationship between life expectancy and human capital is presented in Table B34. Once we account for life expectancy, the effect of historical coal mining on tertiary education disappears. In line with our results on the gendered impact of coal-mining, the life expec-tancy of males is more negatively affected (Appendix Table B33) than that of women.
6.2.2 The role of time preferences
Historical lower life expectancies might have depressed incentives to accumulate human capital by lowering future orientation in mining regions. We evaluate this possibility by exploring data from the Global Preferences Survey by Falk et al. (2018), which includes measures of survey respondents’ future orientation. According to our estimates, one stand-ard deviation increase in the likelihood of having mines brings about a 0.14 standard devia-tion reduction in patience. We do not observe a significant difference in this effect between men and women.
Further tests of this hypothesis would require historical data on life-expectancy. How-ever, there are not, to our knowledge, such data available for our sample. Data constraints, therefore, prevent us from further assessing the role of historical life expectancy. Available evidence, however, suggests that the role of historical life expectancy might have been rel-evant in shaping the rate of time-preferences, which has been demonstrated a pivotal factor for human capital formation (Galor and Özak 2016). In the case of coal-mining, lower life expectancy might have impacted on the prevalence of long-term orientation and thus on human capital investment. At the same time, it is important to note that time-preferences could themselves be shaped by decades of under-investment in human capital. Still, given the stickiness of these traits, their coincidence may explain why the negative impact of coal-mining has on human capital that we document is so difficult to ameliorate.
7 The specificity of coal
In this section we investigate whether other extractive industries, oil and gold, are similarly associated with such negative developmental outcomes. In addition, we explore whether the observed patterns in educational investment—and its gendered dimension—are also explained by patterns of industrialization engendered by coal-mining. Finally, we exam-ine the role that other potential reinforcing mechanisms—institutional quality, migration,

105Journal of Economic Growth (2021) 26:77–112
1 3
conflict, present-day pollution and environmental degradation—play in explaining our findings. We find no supporting evidence for any of these outcomes.
7.1 Oil, gold, and early industrialization
7.1.1 Oil and gold extraction
As discussed in Sect. 1, most scholarly literature has focused on the consequences of oil extraction. European oil extraction has a much more recent history and, as discussed in Sect. 2, differs from historical coal mining in its spatial concentration. Gold extraction has, by contrast, a much longer and spatially dispersed history but differs from coal extraction as it traditionally employed many fewer workers. We explore whether areas with petrol fields and gold deposits in Europe experienced similar trajectories as coal mining regions. Our results show no sign, however, that oil or gold impart a “curse” like coal. Regions with petrol fields or gold deposits, respectively, do not have lower average incomes or lower lev-els of tertiary education. Furthermore, they do not exhibit a gender gap in university educa-tion and have, on average the same number of universities as other regions (see Appendix Table B39 & Figure B16).
Table 8 Historical coal-mining and life expectancy
OLS, Reduced-form and IV estimates. The dependent variable is life expectancy at birth (Eurostat) in 2010. Robust standard errors clustered at the country level in round brackets, Conley standard errors (100 km degrees cut-off) in square brackets. ***, **, * indicate significance at 1-, 5-, and 10-% level, respectively, relative to robust standard errors clustered at the country level
Life expectancy, 2010
OLS Carboniferous surface Deposit on surface
RF IV RF IV
Coal fields − 0.550*** − 1.283*** − 1.750***(0.149) (0.432) (0.427)[0.123] [0.345] [0.385]
Instrument − 0.473*** − 0.637***(0.162) (0.088)[0.133] [0.094]
Controls:Carb. geography Y YCoal deposits Y YGeographic Y Y Y Y YLocation & distances Y Y Y Y YCountry FE Y Y Y Y YBeta coef. − 0.098 − 0.090 − 0.229 − 0.098 − 0.313Average dep. var. 79.63 79.63 79.63 79.63 79.63Number of clusters 31 31 31 31 31Observations 300 300 300 300 300R-squared 0.91 0.91 0.921st stage F-stat 10.80 13.92

106 Journal of Economic Growth (2021) 26:77–112
1 3
7.1.2 Early industrialization and manufacturing
The impact of coal may further differ from that of other resources by virtue of its unique role in the early industrialization of Europe and, more generally, the potential spill-overs it had on the location of manufacturing and other tradeable sectors. The large literature on the resource curse has put forward two possible mechanisms linking access to resources and manufacturing. On the one hand, resource abundance might have had strong agglom-eration effects by stimulating investment in complementary sectors (Duranton and Puga 2004; Glaeser and Gottlieb 2009). In the case of coal, we expect very strong agglomera-tion effects, especially for industrial sectors that developed during a period when the trans-portation costs of coal were high.41 Furthermore, given the important role of coal in the Industrial Revolution, easy access to it may have coincided with the early industrializa-tion of certain areas.42 On the other hand, classical “Dutch disease” effects suggest that the resource sector might crowd out non-extractive sectors that produce tradable goods, for instance manufacturing. If the former effect prevailed in European coal-mining areas—in the medium and long run—it may explain the empirical patterns we observe.
To evaluate this potential channel, we focus on the following sectors: iron, steel, steam, and textiles. We employ data on the distribution of these industries as derived from the European Industrial Heritage Project. Our results (Appendix Tables B42 and B43) show that coal is in fact highly correlated with historical iron, steel, steam but less so with textile production. However, none of these industries are associated with income or tertiary edu-cation. Furthermore, we do not observe the same historical underinvestment in universities in regions with these industries (see Appendix Figure B17). Finally, while we observe a negative effect on the university gender gap, the coefficient is not precisely estimated and, in standardized terms, it is orders of magnitude smaller than the coefficient obtained from historical coal mining.43
7.2 Alternative drivers of the European coal curse
A host of additional channels might have contributed to or reinforced the negative effects of historical coal. In what follows, we briefly address each, summarizing results provided in much greater detail in Appendix Section C.2.3.
41 The paper of Fernihough and O’Rourke (2014), indeed, finds evidence that cities that were proximate to coal grew faster in terms of population during the 19th century.42 The decline of European industrial regions has been sizable, as documented empirically by Franck and Galor (2019). In line with anecdotal accounts describing the demise of formerly prosperous industrial cent-ers like the Ruhr valley in Germany or the English Midlands, Franck and Galor (2019) exploit variation in the introduction of the steam engine across French provinces and find that regions that adopted industrial technology earlier have lower standards of living when compared to otherwise similar regions in the pre-sent.43 Note, however, that these results should be viewed with some caution, as these variables are measured with error and we do not have an exogenous source of variation to obtain our estimated effects of historical industrialization.

107Journal of Economic Growth (2021) 26:77–112
1 3
7.2.1 Institutional quality
A substantial body of scholarship has found that resource wealth can lead to underdevelop-ment through its impact on various types of institutional dysfunction.44 Rent-seeking poli-ticians and extractive or corrupt institutions may impede farsighted investment in human capital as well as depress incomes, leading to the results we document. To evalute this we compare present-day measures of institutional quality using rich information from the European Quality of Government Index (EQI) (Charron et al. 2014), allowing us to look at corruption, impartiality in public good provision, and average quality of the public sector. All in all, we find no evidence of a resource curse associated with historical coal mining that operates through institutional quality.
7.2.2 Conflict
Similarly, we verify whether coal-mining regions were more exposed to conflict. We exam-ine the number of interstate disputes per region (using data from Militarized Interstate Disputes, 1816-2010) and the intensity of aerial bombing during the Second World War. We find that former coal-mining regions were not more involved in military disputes nor were they exposed to more allied bombings during the Second World War (see Appendix Tables B56 and B57).
7.2.3 Selective migration
Anecdotal evidence suggests that mining regions may have experienced historically large migration inflows (to fill labor demand in the coalfields). The observed patterns of uni-versity education and related preferences could thus be due to substantial in-migration of foreign workers with very low levels of formal education. In Tables B50, B51, and B52, we explore differences in the share of individuals born in the country, with their father born in the country, and older individuals with their father born in the country. These results indi-cate that former coal-mining regions had, and still have, a lower share of foreigners than other regions in the same country. Still, foreign migrants with lower preferences for human capital may have selected into former coal-mining areas, with (larger flows) of migrants with high preferences for human capital opting for other locations in the same country. In Appendix Table B27 we explore attitudes towards formal education among ESS respond-ents with a father born abroad. Although our results should be viewed with caution as we are left with a relatively small sample (141 regions are covered in this restricted sample), the coefficients are very close to zero. All in all, our results do not support the view that the migration of foreigners with low human capital has driven our results.
The evolution of population over time, summarized in Figure B5, suggests, however, that former coal-mining regions have experienced a comparative reduction in population over the second half of the 20th century. To gain a more complete picture, we focus on pre-sent-day migratory balances, measuring the difference between the number of individuals who entered and left each region. Appendix Table B53 indicates that former coal-mining
44 See Mehlum et al. (2006), Robinson et al. (2006), Besley and Persson (2008), Vicente (2010), Brollo et al. (2013), Jensen and Wantchekon (2004), Berman et al. (2015), Caselli et al. (2015), Monteiro and Fer-raz (2012), Couttenier et al. (2017), Buonanno et al. (2015).

108 Journal of Economic Growth (2021) 26:77–112
1 3
regions have a more negative total migratory balance, in principle due to higher out-migra-tion and, potentially, lower in-migration (compared to other regions in the same country). In Tables B54 and B55 we then differentiate between external and internal migratory bal-ances. While the coefficients are not precisely estimated, the largest effect of historical coal mining, if anything, is on the external migratory balance, compatible with the hypothesis that the relatively lower population is related to the lower influx of foreign workers both in the present and past.
7.2.4 Fertility transition
Because of the continued demand for low-skilled labor that mines fostered, coal-mining areas may have maintained comparatively high fertility levels at the turn of the twentieth century, when a broad demographic transition towards lower fertility occurred across the continent. As a consequence, compared to other regions in the same country, coal-mining areas may have experienced a delay in the demographic transition towards lower fertil-ity levels and higher investment in human capital. This delay could lie behind the long-term within-country divergence in educational and income levels documented in this paper. Appendix Tables B66, B67, and B68 summarize the effect of historical coal-mining on total fertility in 1870, 1900, and 1930 respectively. Results, indeed, indicate higher fertility levels for coal-mining regions, especially in 1930. Coefficients are, however, never pre-cisely estimated.
7.2.5 Air and water pollution
If places that mined coal in the past are also those using more coal today, the long-term effects we identify may operate through pollution and related health consequences. In Tables B58 to B63, we explore whether historical coal mining is associated with higher levels of present-day air pollution, measured as number of days with SO2 above thresh-old levels, and in microgram per cubic meter of PM25 , PM10 , O3 , NO2 and BAP: former coal-mining regions do not differ from other regions in any of these dimensions. Appendix Table B64 shows that former coal-mining regions do not exhibit higher levels of water pol-lution measured through the Ecological Quality Ratio. We also find no difference in the waste treatment practices of former coal-mining regions, measured using data from Euro-stat in Appendix Table B65.
8 Conclusion
The extant literature on the resource curse, by virtue of its emphasis on the impact of petro-leum wealth in the post-war period, has documented short-run effects of natural resource wealth. Since it was the dominant source of energy in the European economy for much of the nineteenth and early twentieth centuries, the history of coal allows us to trace a com-paratively longer-run impact of natural resource wealth. To provide credible inference, we exploit the relative location of coal deposits as a plausible source of exogenous variation in presence of historical coal mines. Our baseline results indicate that former mining regions are, at a minimum, 10% poorer than otherwise comparable regions within the same coun-try. Besides providing results that quantify coal’s persistent effect on incomes, we have presented evidence that indicates that much of this effect operates through the impact of

109Journal of Economic Growth (2021) 26:77–112
1 3
coal extraction on human capital, specifically in tertiary education. Coal mining regions both have fewer universities and a lower proportion of individuals with university educa-tion. What is more, individuals in these regions hold attitudes that are much more negative towards formal education and are less future oriented. In sum, our results suggest that natu-ral resources without the associated human capital investments do not produce long-run prosperity, at least when it comes to coal in Europe.
Additional empirical work is necessary to shed further light on the “curse” we identify. First, historical data mapping the evolution of incomes, education, health, and life expec-tancy over time would provide greater insight with respect to the temporal dynamics of our results. Second, more complete information on historical industrialization might help to further understand the degree to which the effects we uncover are related to coal mining or to the industries that coal-abundance fostered. Finally, while foreign migration does not explain our results, it is possible that past internal migration contributed to the distributions of preferences for human capital that we observe today. Dedicated data collection effort on within-country migration patterns might help shed light on this potentially important dimension.
Supplementary informationSupplementary Information The online version contains supplementary mate-rial available at https ://doi.org/10.1007/s1088 7-021-09187 -w.
Acknowledgements The authors thank Carles Boix, Marius Brulhart, Federica Braccioli, Davide Cantoni, Matteo Cervellati, Fabrizio Colella, Ruben Enikolopov, Torfinn Harding, Rafael Lalive, Linda Nostbakken, Erin Mansur, Rick van der Ploeg, Didac Queralt, Camille Reverdy, Barbara Rossi, Alessandro Saia, Seyhun Orcan Sakalli, Battista Severgnini, Mathias Thoenig, Gerhard Toews, Anthony Venables, Samuel Wills, Yu Zheng, Ekaterina Zhuravskaya, as well as participants in the Economics of Resource Wealth Workshop, UiS Business School/Oxcarre/NHH, and at the European University Institute. We thank Daniel Rosenlechner for being a research assistant of unparalleled brightness and proficiency. The authors gratefully acknowl-edge the Max Weber Fellowship granted by the European University Institute. Esposito gratefully acknowl-edges the support of the Monique de Meuron programme for Academic Promotion.The authors thank Car-les Boix, Marius Brulhart, Federica Braccioli, Davide Cantoni, Matteo Cervellati, Fabrizio Colella, Ruben Enikolopov, Torfinn Harding, Rafael Lalive, Linda Nostbakken, Erin Mansur, Rick van der Ploeg, Didac Queralt, Camille Reverdy, Barbara Rossi, Alessandro Saia, Seyhun Orcan Sakalli, Battista Severgnini, Mathias Thoenig, Gerhard Toews, Anthony Venables, Samuel Wills, Yu Zheng, Ekaterina Zhuravskaya, as well as participants in the Economics of Resource Wealth Workshop, UiS Business School/Oxcarre/NHH, and at the European University Institute. We thank Daniel Rosenlechner for being a research assistant of unparalleled brightness and proficiency. The authors gratefully acknowledge the Max Weber Fellowship granted by the European University Institute. Esposito gratefully acknowledges the support of the Monique de Meuron programme for Academic Promotion.
Funding Open Access funding provided by Université de Lausanne.
Open Access This article is licensed under a Creative Commons Attribution 4.0 International License, which permits use, sharing, adaptation, distribution and reproduction in any medium or format, as long as you give appropriate credit to the original author(s) and the source, provide a link to the Creative Com-mons licence, and indicate if changes were made. The images or other third party material in this article are included in the article’s Creative Commons licence, unless indicated otherwise in a credit line to the material. If material is not included in the article’s Creative Commons licence and your intended use is not permitted by statutory regulation or exceeds the permitted use, you will need to obtain permission directly from the copyright holder. To view a copy of this licence, visit http://creat iveco mmons .org/licen ses/by/4.0/.
110 Journal of Economic Growth (2021) 26:77–112
1 3
References
Ahlerup, P., Baskaran, T., & Bigsten, A. (2016). Gold mining and education: a long-run resource curse in Africa?, Working Papers - University of Gothenburg.
Alesina, A., Giuliano, P., & Nunn, N. (2013). On the origins of gender roles: Women and the plough. The Quarterly Journal of Economics, 128(2), 469–530.
Allcott, H., & Keniston, D. (2017). Dutch disease or agglomeration? The local economic effects of natural resource booms in modern America. The Review of Economic Studies, 85(2), 695–731.
Aragón, F. M., Rud, J. P., & Toews, G. (2018). Resource shocks, employment, and gender: Evidence from the collapse of the UK coal industry. Labour Economics, 52, 54–67.
Asch, K. (2003). The 1 : 5 Million International Geological Map of Europe and Adjacent Areas: Devel-opment and Implementation of a GIS-enabled Concept. Geologisches Jahrbuch, SA 3, Stuttgart: E. Schweizerbart’sche Verlagsbuchhandlung.
Autor, D., Dorn, D., & Hanson, G. (2019). When work disappears: Manufacturing decline and the falling marriage market value of young men. American Economic Review: Insights, 1(2), 161–178.
Autor, D., & Wasserman, M. (2013). Wayward sons: The emerging gender gap in education and labor mar-kets. Washington, DC: Third Way.
Bailey, R. E., Hatton, T. J., & Inwood, K. (2016). Atmospheric pollution and child health in late nineteenth century Britain. London: Centre for Economic Policy Research.
Beach, B., & Hanlon, W. W. (2018). Coal smoke and mortality in an early industrial economy. The Eco-nomic Journal, 128(615), 2652–2675.
Beckwith, K. (2001). Gender frames and collective action: Configurations of masculinity in the Pittston Coal Strike. Politics & Society, 29(2), 297–330.
Berman, N., Couttenier, M., Rohner, D., & Thoenig, M. (2015). This mine is mine! How minerals fuel con-flicts in Africa, American Economic Review.
Bertrand, M., & Pan, J. (2013). The trouble with boys: Social influences and the gender gap in disruptive behavior. American Economic Journal: Applied Economics, 5(1), 32–64.
Besley, T. J., & Persson, T. (2008). The incidence of civil war: Theory and evidence. National Bureau of Economic Research: Discussion paper.
Black, D., Daniel, K., & Sanders, S. (2002). The impact of economic conditions on participation in disabil-ity programs: Evidence from the coal boom and bust. The American Economic Review, 92(1), 27–50.
Black, D. A., McKinnish, T. G., & Sanders, S. G. (2003). Does the availability of high-wage jobs for low-skilled men affect welfare expenditures? Evidence from shocks to the steel and coal industries. Journal of Public Economics, 87(9), 1921–1942.
Black, D. A., McKinnish, T. G., & Sanders, S. G. (2005). Tight labor markets and the demand for education: Evidence from the coal boom and bust. ILR Review, 59(1), 3–16.
Bright, N. G. (2011). Off The Model’: Resistant spaces, school disaffection and ‘aspiration’ in a former coal-mining community. Children’s geographies, 9(1), 63–78.
Brollo, F., Nannicini, T., Perotti, R., & Tabellini, G. (2013). The political resource curse. The American Economic Review, 103(5), 1759–1796.
Brown, C. (2006). Race and the construction of working-class masculinity in the Nigerian coal industry: The initial phase, 1914–1930. International Labor and Working-Class History, 69(1), 35–56.
Buonanno, P., Durante, R., Prarolo, G., & Vanin, P. (2015). Poor institutions, rich mines: Resource curse in the origins of the Sicilian mafia. The Economic Journal, 125(586), F175–F202.
Caselli, F., & Michaels, G. (2013). Do oil windfalls improve living standards? Evidence from Brazil. Ameri-can Economic Journal: Applied Economics, 5(1), 208–38.
Caselli, F., Morelli, M., & Rohner, D. (2015). The geography of interstate resource wars. The Quarterly Journal of Economics, 130(1), 267–315.
Cavalcanti, T., Da Mata, D., & Toscani, F. (2019). Winning the oil lottery: The impact of natural resource extraction on growth. Journal of Economic Growth, 24(1), 79–115.
Charron, N., Dijkstra, L., & Lapuente, V. (2014). Regional governance matters: Quality of government within European Union member states. Regional Studies, 48(1), 68–90.
Chen, T., Kung, J. K.-S., & Ma, C. (2017). Long Live Keju! The Persistent Effects of China’s Impe-rial Examination System. Available at SSRN: https ://ssrn.com/abstr act=27937 90 or https ://doi.org/10.2139/ssrn.27937 90.
Chetty, R., Hendren, N., Lin, F., Majerovitz, J., & Scuderi, B. (2016). Childhood environment and gender gaps in adulthood. American Economic Review, 106(5), 282–88.
Colella, F., Lalive, R., Sakalli, S. O., & Thoenig, M. (2019). Inference with Arbitrary Clustering. IZA Dis-cussion Paper No. 12584. Available at SSRN: https ://ssrn.com/abstr act=34495 78.

111Journal of Economic Growth (2021) 26:77–112
1 3
Conley, T. G., Hansen, C. B., & Rossi, P. E. (2012). Plausibly exogenous. Review of Economics and Statis-tics, 94(1), 260–272.
Couttenier, M., Grosjean, P., & Sangnier, M. (2017). The Wild West is Wild: The Homicide Resource Curse. Journal of the European Economic Association, 15(3), 558–585.
David, H., & Dorn, D. (2013). The growth of low-skill service jobs and the polarization of the US labor market. American Economic Review, 103(5), 1553–97.
David, H., Dorn, D., & Hanson, G. H. (2013). The geography of trade and technology shocks in the United States. American Economic Review, 103(3), 220–25.
de la carte géologique du monde. Sous-commission pour l’Europe, C., K. Asch, and B. für Geowissen-schaften und Rohstoffe (Allemagne). (2007): The 1: 5 Million International Geological Map of Europe and Adjacent Areas-IGME 5000: Special Edition Reduced to Scale 1: 10 000 000. Bundesanstalt für Geowissenschaften und Rohstoffe.
Duranton, G., & Puga, D. (2004). Micro-foundations of urban agglomeration economies. In Handbook of regional and urban economics, vol. 4, pp. 2063–2117.
Falk, A., Becker, A., Dohmen, T., Enke, B., Huffman, D., & Sunde, U. (2018). Global evidence on eco-nomic preferences. The Quarterly Journal of Economics, 133(4), 1645–1692.
Fernihough, A., & O’Rourke, K. H. (2014). Coal and the European industrial revolution (No. w19802). Discussion Paper, National Bureau of Economic Research.
Fortin, N. M., Oreopoulos, P., & Phipps, S. (2015). Leaving boys behind gender disparities in high academic achievement. Journal of Human Resources, 50(3), 549–579.
Franck, R., & Galor, O. (2017). Technology-skill complementarity in early phases of industrialization. National Bureau of Economic Research: Discussion paper.
Franck, R., & Galor, O. (2019). Flowers of evil? Industrialization and long run development. Journal of Monetary Economics.
Galor, O., Moav, O., & Vollrath, D. (2009). Inequality in landownership, the emergence of human-capital promoting institutions, and the great divergence. The Review of economic studies, 76(1), 143–179.
Galor, O., & Özak, Ö. (2016). The agricultural origins of time preference. American Economic Review, 106(10), 3064–3103.
Glaeser, E. L., & Gottlieb, J. D. (2009). The wealth of cities: Agglomeration economies and spatial equilib-rium in the United States. Journal of Economic Literature, 47(4), 983–1028.
Gore, J. S., Wilburn, K. R., Treadway, J., & Plaut, V. (2011). Regional collectivism in Appalachia and aca-demic attitudes. Cross-Cultural Research, 45(4), 376–398.
Gylfason, T. (2001). Natural resources, education, and economic development. European Economic Review, 45(4), 847–859.
Hall, V. G. (2001). Contrasting female identities: Women in coal mining communities in Northumberland, England, 1900–1939. Journal of Women’s History, 13(2), 107–131.
Humphries, J. (2003). Child labor: Lessons from the historical experience of today’s industrial economies. The World Bank Economic Review, 17(2), 175–196.
Jacobsen, G. D., & Parker, D. P. (2016). The economic aftermath of resource booms: Evidence from boom-towns in the American West. The Economic Journal, 126(593), 1092–1128.
Jensen, N., & Wantchekon, L. (2004). Resource wealth and political regimes in Africa. Comparative politi-cal studies, 37(7), 816–841.
Kander, A., Malanima, P., & Warde, P. (2014). Power to the people: Energy in Europe over the last five cen-turies. Princeton: Princeton University Press.
Khattar, R., & Grosjean, P. (2013). The persistence of cultural attitudes: Australia and gender imbalances. Mimeo.
Kotsadam, A., & Tolonen, A. (2016). African mining, gender, and local employment. World Development, 83, 325–339.
Lambert, A., & Boulanger, P.-M. (2001). La dynamique d’un développement non durable: le Borinage de 1750 à 1990. Espace, populations, sociétés, 19(3), 311–324.
Mehlum, H., Moene, K., & Torvik, R. (2006). Institutions and the resource curse. The Economic Journal, 116(508), 1–20.
Michaels, G. (2011). The long term consequences of resource-based specialisation. The Economic Journal, 121(551), 31–57.
Mitch, D. (1999). The role of education and skill in the British industrial revolution. The British Industrial Revolution: An Economic Perspective, 2, 241–279.
Monteiro, J., & Ferraz, C. (2012). “Does oil make leaders unaccountable? Discussion paper: Evidence from Brazil’s offshore oil boom”.
Nardinelli, C. (1980). Child labor and the factory acts. The Journal of Economic History, 40(04), 739–755.

112 Journal of Economic Growth (2021) 26:77–112
1 3
Nordhaus, W., & Chen, X. (2016). “Global gridded geographically based economic data (G-econ), version 4,” NASA Socioeconomic Data and Applications Center (SEDAC).
Papyrakis, E., & Gerlagh, R. (2004). The resource curse hypothesis and its transmission channels. Journal of Comparative Economics, 32(1), 181–193.
Parry, J. (2005): “Care in the Community? Gender and the reconfiguration of community work in a post-mining neighbourhood,” The Sociological Review, 53(2\_suppl), 149–166.
Pol, A., Chatel et Dollfus, firm, Paris and Société de Documentation Industrielle. (1931). Les Houillères européennes: atlas Châtel et Dollfus. Paris: Société de Documentation Industrielle.
Rasheed Ali, S., & Saunders, J. L. (2009). The career aspirations of rural Appalachian high school students. Journal of Career Assessment, 17(2), 172–188.
Robinson, J. A., Torvik, R., & Verdier, T. (2006). Political foundations of the resource curse. Journal of Development Economics, 79(2), 447–468.
Ross, M. L. (2008). Oil, Islam, and women. American Political Science Review, 102(1), 107–123.Ross, M. L. (2015). What have we learned about the resource curse? Annual Review of Political Science, 18,
239–259.Sachs, J. D., & Warner, A. M. (2001). The curse of natural resources. European Economic Review, 45(4),
827–838.Smith, B. (2015). The resource curse exorcised: Evidence from a panel of countries. Journal of Develop-
ment Economics, 116, 57–73.Speight, J. G. (1994). The Chemistry and Technology of coal. CRC Press.Speight, J. G. (2012). The chemistry and technology of coal. Boca Raton: CRC Press.Stanley, M., Strongman, J., Perks, R., Nguyen, H., Cunningham, W., Schmillen, A., & Mccormick, M.
(2008). “Winning the oil lottery: The impact of natural resource extraction on growth,” Washington, D.C. : World Bank Group, 1(Report Number: 130659).
Supple, B. (1992). “The British Coal Industry between the Wars,” In: New Directions in Economic and Social History, pp. 177–189. Springer.
Thomas, L. (2013). Coal geology. John Wiley & Sons.Thomas, L. J., & Thomas, L. P. (2002). Coal geology. Hoboken: Wiley.Torvik, R. (2009). Why do some resource-abundant countries succeed while others do not? Oxford Review
of Economic Policy, 25(2), 241–256.Uribe-Castro, M. (2018). Commodity export booms and regional specialization during early development
stages. Mimeo.Valencia Caicedo, F. (2018). The Mission: Human capital transmission, economic persistence, and culture
in South America. The Quarterly Journal of Economics, 134(1), 507–556.Van der Ploeg, F. (2011). Natural resources: Curse or blessing? Journal of Economic Literature, 49(2),
366–420.Venables, A. J. (2016). Using natural resources for development: Why has it proven so difficult? Journal of
Economic Perspectives, 30(1), 161–84.Vicente, P. C. (2010). Does oil corrupt? Evidence from a natural experiment in West Africa. Journal of
development Economics, 92(1), 28–38.Vincent, D. (2000). The rise of mass literacy: Reading and writing in modern Europe. Hoboken: Blackwell
Publishing.Waldinger, F. (2016). Bombs, brains, and science: The role of human and physical capital for the creation of
scientific knowledge. Review of Economics and Statistics, 98(5), 811–831.
Publisher’s Note Springer Nature remains neutral with regard to jurisdictional claims in published maps and institutional affiliations.