the eu-acp economic partnership agreements (epa) for...
TRANSCRIPT

THE EU-ACP ECONOMIC PARTNERSHIP AGREEMENTS (EPA) FOR MALAWI: TRADE EFFECTS AND FISCAL IMPACTS FOR ALTERNATIVE POLICY OPTIONS
By
INNOCENT LWAFYO THINDWA
A THESIS PRESENTED TO THE GRADUATE SCHOOL OF THE UNIVERSITY OF FLORIDA IN PARTIAL FULFILLMENT
OF THE REQUIREMENTS FOR THE DEGREE OF MASTER OF SCIENCE
UNIVERSITY OF FLORIDA
2010
1

© 2010 Innocent L. Thindwa
2

To my late mother, I dedicate this piece of work with great humility as I reflect on her untiring efforts to see me educated even in the face of glaring challenges within an apparently harsh environment as she ploughed on to see me through the journey that not even herself knew the destination. How much I long to have had her alive this day to witness the fruits of her diligence and commitment to a cause noble enough as I bare testimony today. May Her Soul Rest In Eternal Peace!!
3

ACKNOWLEDGEMENTS
I benefited from the contributions of many people in the course of my studies at the
University of Florida and throughout this thesis project. Foremost among these is my major
professor and academic advisor, Dr. John J. VanSickle, who from the very start of my studies
provided me with invaluable moral and academic support to the level I never envisaged. Dr.
VanSickle was particularly instrumental in providing me with the required momentum to finish
the research project when I was back in Malawi and fraught with several family responsibilities
that might otherwise have compromised my completion of the project. He physically visited me
in March, 2010 to fulfill this noble cause, affording me constructive advisory comments on the
written drafts and handy techniques of handling the project data. I do really appreciate his
contribution, without which this thesis would not have been possible.
I also wish to commend Dr. Rick Weldon, who demonstrated to be a very useful
committee member of my project. I am also grateful to Dr. James Sterns, who without much ado
spared time to sit in my defense far in Malawi.
Dr. Walter Bowen dedicated himself as a very compassionate and helpful administrator
of the USAID program that provided financial support for my studies at the University of
Florida. Throughout my studies, Walter remained ready and committed to listen and offer
solutions to any challenges that those of us supported by the program could bring to his attention.
The financial support provided by the USAID is, to say the least, greatly appreciated.
I am also indebted to my Malawian colleagues; Fiskani, Lucy, Pearson, Bonnet, Jonathan
and Davie who we shared part of our stay together at the University of Florida. The moral and
academic support I got from Fiskani, Lucy, Pearson and Bonnet during the course work is
greatly appreciated.
4

I also thank GOD for his continual guidance and for having maintained my incredibly
loving fiancée Alice Mbisa with patience and the spirit of continued moral support to me
throughout my studies.
5
TABLE OF CONTENTS page
ACKNOWLEDGEMENTS.............................................................................................................4
LIST OF TABLES...........................................................................................................................8
LIST OF ABBREVIATIONS..........................................................................................................9
ABSTRACT...................................................................................................................................12
CHAPTER
1 INTRODUCTION ..................................................................................................................14
Problematic Situation..............................................................................................................16 Problem Statement..................................................................................................................18 Research Objectives................................................................................................................20
2 LITERATURE REVIEW .......................................................................................................21
Liberalization versus Protectionism and Economic Performance ..........................................22 Development and Growth of the Theory of Preferential Trade Agreements .........................27 Methodologies for the Empirical Analysis of the Impacts of Preferential Trade
Agreements .........................................................................................................................32 Gravity Models................................................................................................................32 Empirical Application of the Gravity Model...................................................................35 Computable General Equilibrium Models (CGE)...........................................................37 Application of CGE Models in Empirical Work.............................................................39 Partial Equilibrium Model (PE).......................................................................................41 Overview of the Verdoorn Model ...................................................................................42 Empirical Application of PE Models ..............................................................................44
Analysis of Fiscal Impacts......................................................................................................45
3 MODEL DEVELOPMENT....................................................................................................48
4 DATA REQUIREMENTS, SOURCES AND TREATMENT ..............................................54
5 EMPIRICAL RESULTS ........................................................................................................59
Trade Effects...........................................................................................................................60 Commodities Most Affected by the Contemplated Changes in Trade Policy........................66 Three Earmarked Agricultural Products .................................................................................67
6

6 SUMMARY AND CONCLUSIONS.....................................................................................70
Summary.................................................................................................................................70 Conclusions.............................................................................................................................72 Study Weaknesses and Suggestions for Further Research .....................................................75
APPENDIX: MOST AFFECTED PRODUCTS BY TRADE AND TARIFF REVENUE IMPACTS...............................................................................................................................77
LIST OF REREFENCES...............................................................................................................81
BIOGRAPHICAL SKETCH .........................................................................................................85
7

LIST OF TABLES
Table page 4- 1 Assumed Values of Elasticities..........................................................................................58
5- 1 Trade Effects from Tariff Elimination by Malawi on EU Imports Only...........................62
5- 2 Trade Effects from Tariff Elimination by Malawi on Imports from EU and SADC Member States ...................................................................................................................63
5- 3 Baseline Levels of Import Duties and Impact on Government Revenue...........................65
5- 4 Summary of Static Fiscal Impacts .....................................................................................66
5- 5 Impacts under the EU liberalization on three key agricultural commodities.....................68
5- 6 Impacts under the EU & SADC liberalization on three key agricultural commodities.....68
A- 1 List of commodities with the highest Trade Effects as a result of Tariff Elimination on EU Imports....................................................................................................................77
A- 2 List and levels of commodities with highest Tariff Revenue Changes as a Result of Tariff Elimination on EU Imports......................................................................................78
A- 3 List of commodities with the highest Trade Effects as a Result of Tariff Elimination on imports from EU & SADC countires............................................................................79
A- 4 List and levels of commodities with highest Tariff Revenue Changes as a Result of Tariff Elimination on Imports from EU & SADC countries .............................................80
8

LIST OF ABBREVIATIONS
ACP African, Pacific and Caribbean
APEC Asia-Pacific Economic Cooperation
ASEAN Association of Southeast Asian Nations
CACM Central American Common Market
CARICOM Caribbean Community and Common Market
CER Closer Economic Relations
CGE Computable General Equilibrium (models)
CIF Cost, Insurance and Freight
DPRU Development and Policy Research Unit
EBA Everything But Arms
EC European Commission
ECOWAS Economic Community of West African States
EFTA European Free Trade Association
EPA Economic Partnership Agreement
ERP Effective Rates of Protection
ESA Eastern and Southern Africa
EU European Union
FTA Free Trade Area
FTAA Free Trade Area of the Americas
GATT General Agreement for Tariffs and Trade
GCC Gulf Cooperation Council
GDP Gross Domestic Product
9

GNP Gross National Product
GTAP Global Trade Analysis Project
GSP Generalized System of Preferences
HS Harmonized System
IADB Inter-American Development Bank
ISI Import Substitution Industrialization
LAFTA Latin America Free Trade Area
LAIA Latin America Integration Association
LDC Least Developed Countries
MERCOSUR Mercado Común del Sur, Mercado Comúm do Sul (Southern Common Market (of America)
MK Malawi Kwacha
NAFTA North American Free Trade Area
NBER National Bureau of Economic Research
NSO National Statistical Office
OECS Organization of Eastern Caribbean States
PE Partial Equilibrium
PTA Preferential Trade Area
RTA Regional Trade Area
SADC Southern Africa Development Cooperation
SPARTECA South Pacific Regional Trade and Economic Cooperation Agreement
TC Trade Creation
TD Trade Diversion
UEMOA West African Economic and Monetary Union
10

USAID United States Aid for International Development
US$ United States Dollar
WTO World Trade Organization
11

Abstract of Thesis Presented to the Graduate School of the University of Florida in Partial Fulfillment of the
Requirements for the Degree of Mater of Science
THE EU-ACP ECONOMIC PARTNERSHIP AGREEMENTS (EPA) FOR MALAWI: TRADE EFFECTS AND FISCAL IMPACTS FOR ALTERNATIVE POLICY OPTIONS
By
Innocent Lwafyo Thindwa
August 2010
Chair: John J. VanSickle Major: Food and Resources Economics
Malawi has, since 1975, been enjoying non-reciprocal trade preferences from the EU bloc
along with all other ACP countries pursuant to the successive Lomé Convention Agreements.
This framework was not consistent with the existing World Trade Organization (WTO) rules and
regulations. As such, the EU and ACP were pressured to come up with new World Trade
Organization (WTO) compatible trading arrangements. To this effect, the Cotonou Agreement
was conceived by the two parties and signed in June, 2000. Under the Cotonou Agreement, the
non-reciprocal preferential market access for ACP economies was scheduled to be replaced by a
string of Economic Partnership Agreements (EPAs) meant to progressively liberalize trade in a
reciprocal way, leading to the establishment of free trade areas (FTAs) between the EU & ACP
regional groups in accordance with the relevant WTO rules. The glaring reality for the ACP
countries in general, and Malawi in particular, of opening their markets to EU imports has
created debate on the anticipated implications.
This research employed the partial equilibrium model to quantify the trade effects and
fiscal impacts for Malawi of an EPA with the EU, compared to those obtainable in a
contemplated broader liberalization scenario that included implementation of the EPA with the
12

EU concurrently with the formation of the regional Free Trade Area (FTA) among the Southern
Africa Development Cooperation (SADC) group of countries.
Results from the study demonstrate that Malawi stands to benefit more from a broader
liberalization framework than one restricted to the EU. The results also provide useful insight
into the types of product categories that would be most hit by the policy change. In particular,
trade and fiscal effects to the three key agricultural products of tea, sugar and tobacco were
found to be insignificant.
13

CHAPTER 1 INTRODUCTION
The post World War II period saw the rejuvenation of efforts aimed at promoting
multilateral trade liberalization among countries. The climax of this effort was in 1947, when the
General Agreement on Tariffs and Trade (GATT) was established with a view to promoting free
trade through elimination and/or reduction of trade barriers among countries. Following the
classical arguments of Adam Smith and David Ricardo, free trade is considered to be welfare
improving as each country tends to allocate their productive resources in areas that they have the
most comparative advantage. As such, trade liberalization is considered a desirable vehicle
towards the attainment of sustainable economic growth and development, leading to
improvement in living standards for the populace.
Parallel to the movement towards multilateral trade liberalization, was the emergence and
proliferation of the concept of regional trading arrangements. These were (and still are)
configured through various forms and names depending on the varying degree and/or stage of
economic integration, such as free trade area, customs union, common market, economic union,
and complete economic integration. This feature of the global economy stimulated a lot of debate
and theorization among economists during the entire second half of the twentieth century on the
desirability and relationship of regionalism vis-à-vis multilateralism as an approach to free trade.
One of the offshoots from this debate has been the development of the theory of second best,
referring to regional trade arrangements as opposed to the superior case of multilateral trade
liberalization. It is worth noting though that the proliferation of the regional free trade
arrangements is not without legal basis in the international trade rules and regulations as Article
XXIV of the GATT sanctions their formation.
14

At the heart of these multilateral and regional trade arrangements has been the feature of
preferential treatment, usually sought by the developing countries, which calls for special
considerations and exemptions from reciprocal trade liberalization measures. This fair treatment
plea falls within the larger body of arguments by some against equal treatment of developed and
developing countries in the pursuit of open trade policies on account of the notion that smallness
of the economies for the later makes them more vulnerable to external shocks. The proponents of
this paradigm have advanced the argument that openness and liberalization do have significant
negative effects on poverty, unemployment and a host of other issues (Weisbrot and Baker 2002;
Grunbaum 2007). Free trade proponents dispute this and argue that these small and low income
countries need not be treated differently if they are to realize significant positive economic
impacts from trade.
These arguments and counter-arguments for open trade are reflective of the generally
observed fact that trade liberalization does not only create challenges to the country undertaking
such policy but also offers them opportunities to attain superior levels of growth and prosperity
through improved competitiveness and enhanced efficiencies (Grunbaum 2007). This is exactly
the situation in which the African, Caribbean and Pacific (ACP) group of countries find
themselves now as they face the glaring reality of opening their borders to imports from the
European Union countries under the 2000 Cotonou Agreement between the EU on the one side
and ACP countries on the other. Malawi is an integral member of this group of countries, itself
being within the African countries sub-group. With an estimated annual gross domestic product
(GDP) level of about US$ 4,268 million in 2008, the country is categorized as one of the least
developed countries (LDC). As an LDC, Malawi benefits significantly from the EU trade
preferences under the previous trading arrangement as well as the on-going EU unilaterally
15
determined Everything But Arms (EBA) arrangement. The country’s major export commodity
under the EBA arrangement is sugar, which is sold at an EU predetermined high price in pursuit
of subsidizing sugar production within the EU farming realm.
Problematic Situation
The ACP countries have benefited from preferential treatment from the EU since 1975,
when the Lomé I Convention was signed in Lomé, Togo. Under this agreement, the ACP
countries were accorded non-reciprocal preferential market access to the European Union
countries. The period that ensued saw successive renewal of the initial Lomé I Convention,
through Lomé II in 1979; Lomé III in 1984; and Lomé IV in 1989 that remained in force for the
entire decade until 1999. All trade preferences, articles of trade and development aid schemes
under these renewals were characterized by the same non-reciprocal principle. At the dawn of
the twenty-first century, the wave of globalization and the associated efforts to strengthen the
multilateral approach to trade and economic processes warranted the need for adapting the EU-
ACP trade arrangements to ensure their compatibility with contemporary WTO rules and
regulations. Besides, the section of developing countries that falls outside the ACP group had not
been supportive of the discriminatory EU-ACP preferential trade agreements under the Lomé
Conventions. As such, the WTO accorded a final waiver to the EU and ACP countries running
only up to December 2007, after which the requisite trade cooperation was required to be made
WTO compatible. To this end, the two parties commenced negotiations in September 1998 that
culminated into the new ACP-EU Partnership Agreement, signed in Cotonou, Benin on 23rd June
2000.
One of the major innovations of the new ACP-EU Partnership Agreement, commonly
known as the Cotonou Agreement, was the introduction of new fundamental principles with
respect to trade between the European Union and the ACP countries relative to the Lomé
16

Convention. In particular, the non-reciprocal preferential market access for ACP economies was
scheduled to be replaced by a string of Economic Partnership Agreements (EPAs) meant to
progressively liberalize trade in a reciprocal manner. In fact, Article 36.1 of the Cotonou
Agreement empowers parties to the Agreement “to conclude new World Trade Organization
(WTO) compatible trading arrangements, removing progressively barriers to trade between them
and enhancing cooperation in all areas of trade” (The Cotonou Agreement 2000, Article 36.1). It
was envisaged that the progressive removal of barriers to trade would result in the establishment
of Free Trade Agreements (FTAs) between the EU and ACP regional groups in accordance with
the relevant WTO rules and help to enhance the existing regional integration efforts among the
ACP. The EPAs were to be negotiated from September 2002 to 31st December 2007 to enable
the new trading arrangements to enter into force by 1st January 2008 (The Cotonou Agreement
2000, Article 37.1). However, this deadline was not met and to date, only the Caribbean sub-
group and a couple of African countries have managed to sign a fully complete EPA. Since the
substantive issues under this process were discussed within seven configured regional groupings,
Malawi together with fifteen other countries formed the Eastern and Southern Africa (ESA)1
configuration and launched the EPA negotiations with the EC on 7th February, 2004. The ESA
group identified six clusters of issues to negotiate an EPA with the EC, which includes the
following; Development Issues, Agriculture, Market Access, Fisheries, Trade in Services, and
Trade-Related Issues.
The formation of EPAs and elimination of EU’s long cherished trade preferences for
ACP will obviously have far reaching implications on development strategies followed by these
countries. In essence, these ACP countries have for a long time tailored their productive efforts
1 Other group members are: Burundi, Comoros, DR Congo, Djibouti, Eritrea, Ethiopia, Kenya, Madagascar, Mauritius, Seychelles, Rwanda, Sudan, Uganda, Zambia and Zimbabwe
17

towards sectors favored by the preferences, thereby creating a potential for distortions in
resource allocation. It is clear that the anticipated change in the trade framework, which would
invariably result in a Free Trade Area (FTA) will necessitate some appropriate restructuring of
the development strategies for the ACP so that concentration is placed on areas for which each
one of these countries has the most competitive advantage. This restructuring process, otherwise
known as a rationalization process, involves costs that the ACP countries need to be prepared to
incur. The process will practically mean transferring resources, including laying off workers,
from sectors deemed inefficient to those for which the country has comparative advantages. It is
generally feared that these changes may bring about increased unemployment, provoke
heightened economic insecurity and political instability (Keck and Piermartini 2005). There is
also a very clear sense of despair among ACP countries with respect to the level of competition
that domestic producers will be subjected to after the FTA. While competition is lauded as a
positive phenomenon in that it promotes efficiency in allocation of productive resources,
commentators in ACP countries have expressed concerns over the level of EU production
subsidies in the agricultural sector and argue that such competition will invariably be unfair.
Problem Statement
The delay by ACP countries in finalizing the EPA regional frameworks and the
consequential formation of the FTAs between the EU and ACP countries is clear testimony of
the significant concerns among ACP countries with the proposed reciprocal trading arrangement.
While the nature of concerns is similar for most of the ACP countries, it is undeniable that the
extent of the envisaged impacts, both positive and negative, will vary from country to country. In
this regard, country-specific analyses of the potential impacts of the proposed FTA with the EU
are of colossal importance because outcomes from such work are bound to help the concerned
country to chart the best way forward as regards its national development strategies vis-à-vis
18
trade policy. This is precisely the type of research that this thesis was formulated to carry out for
Malawi.
The fact has already been alluded to above that trade policy is usually analyzed on the
basis of the link it has to economic growth and development for the country. A large body of
literature on the analysis of economic integration and its shallower forms such as the proposed
Free Trade Area (FTA) suggest that their formation tends to breed various economic effects,
particularly relating to the direction of trade which is largely influenced by the underlying
advantages for countries involved. “An expansion in trade can be had when less efficient
domestic production is substituted by imports from a more efficient member of the agreement”
(Grunbaum 2007, p.19). A further expansion in trade flows can be expected as the domestic
country imports more products from member countries at preferential terms at the expense of
excluding imports, which in fact can be less costly, from non-member countries (Viner 1950;
Pomfret 1988; Grunbaum 2007).
The trade liberalization argument can not be complete without consideration of the fiscal
impacts associated with the immediate loss of tariff revenue. This loss directly affects the ability
of the liberalizing government to deliver public services to its citizenry and negate on-going
efforts towards economic growth, development and poverty alleviation. The situation tends to be
more serious for countries where the proportion of revenue from import tariffs is higher than
where it is lower. The situation for ACP countries is such that in most countries, revenue derived
from import tariffs constitutes a substantial portion of government revenue. In fact for Malawi,
the Development Policy Research Unit of the University of Cape Town (DPRU) estimates the
contribution of tariff to total government revenue as standing at about 22 percent (DPRU Policy
Brief No. 01/P8, 2001). The situation currently ruling presents us a rare opportunity to carry out
19

20
research that will enable us to get quantitative estimates of the potential trade effects and
associated fiscal impacts of the proposed EU-EPA for Malawi. For Malawi, trade in three key
agricultural products is of paramount importance. Exports of tobacco, tea and sugar together
account for over 70 percent of the country’s total annual exports. As such, it will be interesting in
this study to move a step further and isolate the potential impacts that the EPA with EU will have
on sectors involved in the production and processing of these three key products.
Research Objectives
The move towards EPA and FTA poses a huge challenge for ACP countries such as
Malawi. The consideration of potential benefits of improved and more secure access to EU
markets by Malawian exports is blurred with the recognition of expected loss in revenue from
customs duty and increased competition for the domestic industries. As debate on the likely
effects continues and time for implementing the EPAs is already surpassed, very few country-
specific quantitative analyses of the situation have been undertaken, ex ante. This study is
precisely aimed at addressing this apparent gap for one particular country, Malawi. As such, the
overall objective of this research is to evaluate the potential trade effects and fiscal impacts of an
EPA trade arrangement regime for Malawi.
Specifically, the proposed research is aimed at attaining the following objectives;
Conduct a quantitative analysis of the potential trade and fiscal effects for Malawi of the proposed EPA and/or FTA with the EU. Trade creation, trade diversion and fiscal impacts will all be estimated.
Identify commodity categories that show highest trade effects, particularly investigating the trade effects to imports in the three key agricultural products of tobacco, tea, and sugar.
Based on outcomes from above analyses, provide alternative policy options for the government and stakeholders on what course of action should be pursued in respect of the upcoming EPA/FTA.

CHAPTER 2 LITERATURE REVIEW
The essence of the argument for international trade is with respect to its presumed link to
economic growth and development. Classical trade theory suggests a positive relationship
between increased open trade and superior economic performance and that protectionism is
inversely related to economic growth and development. Freer trade regimes result in more rapid
economic growth through direct effects of trade that operate via dynamic advantages of
increased capacity utilization and more efficient investment projects as well as indirect effects
through accelerated export growth (Edwards 1993). On the other hand, there are some
researchers who object to this proposition and argue that empirical evidence does not strongly
support the classical view. They also question the validity of the direction of the casual
relationship between export growth and economic development as insinuated in the classical
argument.
As stated in the first chapter, the formation and proliferation of preferential trade
agreements and/or regional trade agreements has become an important feature of the global
economy. This feature has been considered by some as a catalyst for attainment of the more
desired multilateral free trade regime, yet others see it as an obstacle to the same. This chapter
starts by providing a review of the theoretical and empirical literature on the link between trade
and economic performance. We further endeavor to provide the foundations of the development
and growth of the theory of preferential trade agreements before reviewing its empirical
literature. We end the chapter with a presentation of the major analytical methodologies that
have been used in the empirical analysis of preferential trade agreements, including citation of
the empirical studies on which those methodologies have been applied.
21

Liberalization versus Protectionism and Economic Performance1
The notion that freer international trade stimulates growth and development dates back to
the days of Adam Smith. A host of later economists worked to augment and popularize the free
trade notion in the two centuries that followed. Nonetheless, the post World War II decades of
1950s, 1960s, and 1970s saw increased emphasis on the pursuit of protectionist development
strategies, especially among developing countries. A major impetus for such an orientation in the
developing world was the policy of Import Substitution Industrialization (ISI), embraced by
many of these countries in Latin America, Africa and East Asia. The urge to develop and sustain
their manufacturing sectors provided for the pursuit of the ISI strategy which promoted
protectionism in line with the infant industry argument for industrialization. It was believed that
successful economic development would be attained through rapid development of the local
industry to ensure self-sufficiency and insulate the domestic economy from external
vulnerability. One of the major consequences of the ISI euphoria was the preoccupation by most
of the development economists of the time with the design of planning models based on ISI. In
spite of the apparent dominance of the protectionist paradigm, “a small group of academics
embarked, independently, on major empirical investigations aimed at assessing the consequences
of alternative trade regimes” (Edwards 1993, p.1359). The pioneer work to this effect was
undertaken by Little, Scitovsky, and Scott (1970) and Balassa (1971), who calculated effective
rates of protection (ERP) in a score of developing countries and linked these to the countries’
overall economic structure and performance2.
1 This section draws heavily on the work of Edwards (1993) who provides an excellent synthesis of the studies undertaken earlier by various authors on empirical analysis of the link between outward looking and inward looking trade policies with economic performance
2 An excellent review of these studies is provided by Edwards (1993) and summarized and cited by Grunbaum (1997)
22

The pursuit of ISI by the developing countries was criticized for its disregard of
fundamental economic principles such as that of comparative advantage in determining what to
produce. As a consequence of this disregard, some fundamental distortions in resource allocation
were argued to have been identified by some authors. For instance, the Little, Scitovsky, and
Scott (1970) study concludes “that the policies followed in most of the developing world after
World War II had excessively encouraged industrialization at the cost of reducing the incentives
for expanding agriculture and exports” (Edwards 1993, p. 1362). As a consequence of these
inward looking policies, those developing countries experienced a ray of economic problems
including “a worsening income distribution, a reduction in savings, an increase in the rate of
unemployment and a very low rate of capacity utilization” (Edwards 1993, p.1362).
African countries were a major segment of the LDCs that pursued inward looking trade
policies in the hope of achieving positive economic growth and self-reliance. However, instead
of attaining these positive socio-economic benefits, implementation of these protectionists
policies only resulted in severe crises for most of the African countries as “market incentives
were seriously distorted, food production plummeted, GNP per capita fell by almost one percent
per year during the 1970s, corruption became rampant, and shortages were generalized”
(Edwards 1993, p. 1370). This appears to suggest that adoption of liberalized trade policies
would have helped these countries to improve their economic performance. As such, in its 1981
report, the World Bank recommended that these countries undertake the implementation of
reforms to their economic systems to make them more liberal and more open to international
trade.
Notwithstanding their novel pioneering work on the empirical link between trade policy
orientation and economic performance, the policy recommendation for more open trade in the
23
developing countries by Little, Scitovsky, and Scott (1970) and Balassa (1971) was heavily
criticized by Paul Streeten (1971) for lack of additivity and inconsistency in their arguments for
freer trade. Edwards (1993) also pointed out that the authors only used single-period snapshots of
the protection levels in the specific countries to derive their conclusions other than attempting to
estimate evolving protection levels which could have permitted them to analyze liberalization
episodes over time and the link between alternative protection levels and growth in those
particular historical settings. Edwards (1993) further identifies a computational weakness in the
two studies, that while using the same technique, the Little, Scitovsky, and Scott (1970) study
calculated a 49 percent effective rate of protection to the manufacturing sector for the Philippines
in 1965 while the Balassa (1971) study arrived at a rate of 61 percent for the same sector in the
same country during the same year.
In a manner that served to address the second weakness in the above studies, one of the
classic works was undertaken by Anne Krueger (1978) and Jagdish Bhagwati (1978). In the
NBER study that they co-directed, Krueger (1978) and Bhagwati (1978) formally derived a trade
liberalization index based on the degree of bias against exports. With the help of this index,
countries could be determined to be at varying stages of liberalization, starting from a scale of I
as the most protected to V as the most liberalized. Assigning dummy variables for these stages,
and using country-specific pooled data for traditional and non-traditional exports, Krueger
(1978) undertook a formal econometric analysis of the link between trade liberalization and
economic growth. She estimated two equations, one for exports and the other for real GNP for
each one of the ten countries in the sample. The first was dependent on the real effective
exchange rate, dummy variables for the trade liberalization regime, and time trend variable while
the later was dependent on the exports index, trade liberalization regime dummy and a time trend
24

variable. The results showed significant positive effects on export growth for the coefficient on
the dummy variable for phases four and five of the liberalization ladder, while no direct
significant effects were discerned from the same phases of liberalization on GNP growth. The
model did produce a significant positive effect on GNP growth for the export coefficient. This
suggests existence of an indirect as opposed to the theoretically surmised direct positive link
between trade liberalization and economic growth.
Krueger’s finding of lack of direct effect of trade liberalization on economic performance
did not go without challenge from other researchers. Balassa (1982) in his study concluded that
countries with intense trade liberalization policies displayed high rates of economic performance.
In the Balassa (1982) study, both quantitative restrictions to trade and tariff barriers were
incorporated into the methodology used to categorize the country’s trade regime. This was done
to address what Balassa (1982) pointed out as one of the shortfalls of the Krueger (1978) study
i.e. that use of quantitative restrictions alone in her study to determine trade regimes was in fact
leaving out a major component of bias against exports inflicted by high tariff rates. Balassa
(1982) used export growth rates as a proxy for trade regime, which turned out to be one of the
sources of criticisms leveled against his study. As Edwards (1993) puts it, “it is not clear whether
it is exports growth that causes output expansion” (p.1373), or that output expansion spurs
exports growth.
In the years that followed, in the 1990s, a number of influential studies were undertaken
to establish the link between trade openness and economic performance. The approach for these
later studies had been different and quite flexible in searching for alternative ways of
liberalization and establishing their impact of economic performance. As Grunbaum (2007)
observes that “while early empirical studies related to the role of exports and growth, more
25

recent studies on trade policy and economic performance have searched for alternative measures
of openness and their relationship to economic outcomes” (Grunbaum 2007, p. 61). Grunbaum
cites the works of such authors as Dollar (1992); Sachs and Warner (1995); Harrison (1996);
Edwards (1998); Frankel and Romer (1999) as some of the most influential in undertaking cross-
country econometric studies on the subject. In most of these studies, the results have tended to
suggest the existence of a positive link between more open trade and higher rates of economic
growth.
Notwithstanding the foregoing, the view that trade liberalization is directly linked to
higher levels of economic growth has also been criticized by a number of authors who refute it
and argue that there is no firm empirical evidence establishing such a direct link.
The work of Jeffrey Sachs (1978), and Deepak Lal and Sarath Rajapatirana (1987) stand out in
literature as some of the leading representatives of this criticism. Most recently, Rodriguez and
Rodrik (2001) carried out a critical review of some of the works of earlier authors which
supported the positive link between open trade and economic performance. By using original
data sets, Rodriguez and Rodrik (2001) were able to “replicate and analyze the measures of
openness used, disaggregated these into tariff and non-tariff components to test statistical
significance, extended and modified the empirical models to obtain additional results”
(Grunbaum 2007, p. 61). Their findings suggest that those results in the original studies had
been greatly over-stated and that the purported link was in fact very weak.
Authors have acknowledged existence of a couple of challenges associated with these
cross-country econometric studies, which make generalization of results tricky. These include
“poor data, inappropriate methodology and a weak theoretical framework lacking the ability to
establish clear relationships between variables” (Grunbaum 2007, p.61).
26

Notwithstanding the quandary portrayed in the literature reviewed above about the
significance of the link between trade liberalization and economic performance, it is important to
recognize that a more open trade regime brings with it elements that promote economic growth
and development. Whether that happens directly or indirectly is beside the point. “Trade imposes
rigorous competition on domestic producers thereby enhancing competitiveness, fosters foreign
direct investment, alters the political economy by reducing rent seeking behavior, constrains
government’s ability to manipulate macroeconomic policies and subjects and binds economic
actors to the discipline of international markets and the international environment” (Grunbaum
2007, p.62). In addition, trade liberalization allows for feedback mechanisms to evaluate the
performance and effects of policies (Berg and Krueger 2003; Grunbaum 2007).
Development and Growth of the Theory of Preferential Trade Agreements
After the Second World War, the international community agreed on a set of rules and
principles aimed at promoting multilateral trade under what was known as the new international
economic order, under the regulation of the GATT. However, it soon became apparent that
attaining free trade at that level was slow and difficult. As such, a number of countries started
forming smaller groups, configured on the basis of either geographical vicinity or political and/or
historical perspectives to pursue regional economic integration in a preferential manner. This
feature of global economy has come to be known as regionalism, with its peak at development
experienced in the 1950s and the 1990s. As such, Bhagwati and Panagariya (1996) have termed
the two stages as the old regionalism of the fifties and the new regionalism of the nineties. The
proliferation of these regional trade agreements and/or customs unions in the period after the
1950s spurred a lot of interest and debate on their desirability and relationship to the multilateral
trade agenda. Some free trade proponents argued that regionalism was a necessary stepping stone
27
to attainment of the most desirable multilateral trade agreement while others abhorred the feature
for its tight grip at restrictions to trade against non-members to the agreement. At the same time,
some protectionists liked the regional trade agreements for increasing the degree of preference
for favored countries and maintaining restrictions against non-member countries while others
disliked them for dismantling protection accorded to domestic producers against suppliers from
favored countries.
The work of Jacob Viner (1950) stands out as the earliest and most influential on this
topic, laying out the primary theoretical basis for the analysis of regional and/or preferential
trade arrangements. The most significant contribution of Viner’s work was his observation that
welfare effects from any form of regional economic integration are not unambiguous a priori. As
such, no general conclusion is possible on whether such economic integration arrangements are
welfare enhancing or damaging. Central to the development of his theoretical framework was the
formulation of the concepts of trade creation and trade diversion. Viner’s original definitions for
these two concepts have been refined over time by various subsequent researchers. Thus, we
define trade creation as the substitution of domestic production with cheaper imports from a
member country while trade diversion is the substitution of cheaper imports from non-member
countries with more costly goods from a member country (El-Agraa 1997; Gordon 2007). As
such, “trade creation reflects a shift from an inefficient to an efficient source of supply while
trade diversion is movement from an efficient supplier to an inefficient one” (Gordon 2007,
p.34). In his refinement of the definition, Robson (1980) distinguished between two components
of trade creation. The first one of these is “a production effect reflecting savings from the
reduction of domestically produced goods and second, a consumption effect reflecting the gains
in consumer surplus as high cost consumption goods were substituted for lower cost goods”
28
(Grunbaum 2007, p.65). Similarly, Grunbaum (2007) summarizes that trade diversion reflects to
a shift in the source of imports from a non-union low cost producer to a more costly union
member.
The theoretical framework3 developed by Jacob Viner and all refinements made
thereafter provided a fertile basis for the empirical analysis of regional economic integration.
With this tool in hand, one would proceed to estimate the trade effects and welfare outcomes of a
preferential trade agreement simply by estimating the extent and comparing the size of trade
creation and trade diversion. The agreement is regarded as welfare enhancing and therefore
advantageous in the event that trade creation exceeds trade diversion (Grunbaum 2007). Since
only a sub-set of the country’s trading partners is included in the preferential trade agreement, a
three country construct, involving the first country, member countries in the agreement and non-
member countries in the same becomes necessary. It is in this setting that the analysis proceeds
to simulate and/or evaluate the trade flows and production and consumption effects. The
economic integration agreement so being evaluated would have predictable impacts on resource
allocation, economies of scale, terms of trade, factor productivity, economic growth and stability,
and the distribution of income (Robson 1980; Grunbaum 2007). Nonetheless, this analysis is
based on a number of restrictive assumptions that include the following4; perfectly elastic supply
for imports; perfect competition for factor and product markets; factor mobility within countries
but not among countries; zero transportation costs; tariffs as the only available policy tool; prices
accurately reflecting requisite opportunity costs; balanced trade; and full employment of
resources.
3 This section draws heavily from the work of Grunbaum (2007), who provides an excellent synthesis of the Vinerian theoretical framework and assumptions thereof, as refined by Robson (1980).
4 This list of the Vinerian assumptions was summarized by Robson (1980) and cited by Grunbaum (2007).
29
Apart from the later work of Robson (1980) cited above, previous authors such as R.G.
Lipsey (1960); Harry G. Johnson (1960); and C.A. Cooper and B.F. Massell (1965) also helped
to advance the Vinerian framework with their respective refinements to his original ideas. In his
influential survey article that aimed at further refining Viner’s trade creation and trade diversion
concepts, Lipsey (1960) observed that Viner assigned a positive value to trade creation and a
negative value to trade diversion. As such, Lipsey (1960) maintains that the suggested inclusion
of the consumption effects in their definitions would invalidate such a motive by Viner.
Viner’s influential insights uncovered what came to be known in literature as the theory
of second best, literally referring to partially liberalized regimes characterizing preferential trade
arrangements. At the same time, the Vinerian theory and all literature from subsequent authors in
the 1960s seemed to have failed to explain the motive behind these regional and/or preferential
trade agreements. As Pomfret (2003) observes literature of the 1960s “failed to explain why
countries would form a customs union, when they could realize all the trade creation benefits and
avoid any trade diversion costs by reducing tariffs in a non-preferential manner”. Johnson
(1960); and Cooper-Massell (1965) separately provided a formal treatment of this question and
suggested that formation of the preferential trading arrangements is largely motivated by political
other than economic reasons since their regimes can not breed superior economic effects to
unilateral trade liberalization. They cited the pursuit of ISI in Latin America and Africa, and
maintenance of peace and harmony between France and Germany in the EU case as two
examples of such political reasons for PTAs formation. Technically, Johnson (1960) “advocated
that the measurement of trade creation and trade diversion should include production and
consumption effects as changes in import demands were a consequence of the formation of a
customs union and the tariff reduction or elimination” (Grunbaum 2007, p. 67). Cooper-Massell
30

(1965) on the other hand observed that measurement of the welfare effects from a customs union
has to include the impacts of a tariff reduction which results in consumer surplus gains and not
just those of the pure trade diversion. This means that if the former effect is larger than the later,
then the regime is beneficial to the country. Notwithstanding this inclusion, Cooper-Massell
(1965) maintained that a negative welfare effect would be had from these preferential trade
arrangements.
Meade (1965); Mundell (1964) and Corden (1972) also provided influential
augmentations to the Vinerian framework5. The initial theoretical framework developed by
Jacob Viner had a number of gaps that he himself knew would come up later and be addressed
by other researchers. As Grunbaum (2007) observes “Although Viner was aware that economies
of scale, imperfect competition, and terms of trade issues would arise, he left them unattended”
(p. 66). Indeed Meade (1965) led the task by providing a critique of Viner’s model and extending
the same in a general equilibrium framework. He assumed existence of infinite supply elasticities
and demand elasticities of zero, providing an allowance for multi-product production in all
countries. “Meade’s work provided a general static framework of analysis for integration
agreements that admitted substitution of goods both in demand and supply and allowed for
simultaneous adjustments in related factor and goods markets in trading countries” (Grunbaum
2007, p.67). Using a three country model, Mundell (1964) addressed the dynamics that arise in
measuring welfare effects by accounting for changes in the terms of trade that come with the
formation of preferential trade arrangements through changes in tariffs and relative prices.
Investigating the relevance of the notions of trade creation and trade diversion in the face of scale
economies, Corden (1972) did maintain their relevance. However, he suggested that such
5 Grunbaum (2007) excellently synthesizes the contributions from these authors and this brief discussion draws from his work.
31
analyses should incorporate cost reduction and trade suppression effects that do emerge from
scale economies resulting from the regime.
Methodologies for the Empirical Analysis of the Impacts of Preferential Trade Agreements
Literature cites three major quantitative analytical techniques that researchers use to
empirically evaluate the effects of entering some form of an economic integration by countries.
These include the gravity models, computable general equilibrium (CGE) models and the partial
equilibrium (PE) models. Naturally, each one of these methods has its respective merits and
demerits such that choice of the appropriate methodology has to be informed by consideration of
the costs and benefits to the researcher based on the specific situation at hand, including data
requirements considerations. This tends to help in balancing the inherent trade offs. It is also
clear though that gravity models are employed to carry out ex-post analyses of the economic
integration agreements while CGE and PE models are used to conduct ex-ante analyses that
simulate “how today’s economy will look in future as a consequence of a specified set of policy
changes” (Piermartini and Teh 2005, p.1). The one general thing is that in all cases, the analysis
undertakes to quantify the sizes of trade creation and trade diversion as a result of the policy
changes thus implemented, such as formation of a PTA.
Gravity Models
The gravity models in trade policy derive their name from the 1687 Newtonian Law of
Universal Gravitation6 which held that the attractive force between two objects is positively
related to their mass and inversely related to the distance between them. Economists have used
the same concept to develop an analogous functional relationship of the gravity trade model. As
such, bilateral flows are considered to be positively related to the size of the countries’
6 This section draws on the work of Keith Head (2003), Piermartini and Teh (2005) and an excellent synthesis of the model evolution and structure by Grunbaum (2007).
32

economies and inversely related to the distance between them (Head 2003; Grunbaum 2007).
This formulation was first proposed by Tinbergen (1962). As Piermartini and Teh (2005) observe
that “the first empirical study of trade using the gravity model was probably Tinbergen's7 (1962),
although there was no explanation for the use of the model nor for showing how it was related to
theoretical explanations of international trade” (p.38). Thus, Grunbaum (2007) summarizes the
basic Tinbergen gravity model as follows;
Tij = Miβ1 Mj
β2Dijβ3εij (2-1)
where
Tij = bilateral trade flow between country i and country j,
Mi = economic mass interpreted as GDP of country i,
Mj = economic mass of country j,
Dij = distance between countries i and j,
εij = the standard error term.
The above formulation is usually transformed into its requisite logarithmic form to
estimate the following;
InTij = β0 + β1InMi + β2InMj – β3Dij + εij (2-2)
Literature suggests that GDP, GDP per capita or population size can all be used to
capture economic mass measured by Mi and Mj in this model while Head (2003) observes that
distance is almost always measured using the “great circle” formula, which approximates the
shape of the earth as a sphere and calculates the minimum distance along the surface. Thus using
this formula, the distance between the capitals or commercial cities of the two economies is
7 Other authors such as Head (2003) and Grunbaum (2007) makes a similar observation. However, Grunbaum cites the work of Sandberg (2003), who observes that Poyhonen (1963) was simultaneously working on a similar type of the model.
33

calculated and used in the Dij variable in the model. Grunbaum (2007) explains that economic
size determines the ability of the country to engage in trade as trade flows between countries is
largely a function of supply conditions in the country of origin and demand conditions in the
country of destination. Head (2003) gives a number of reasons to justify use of distance in the
model. These include the fact that distance serves well as a proxy for transport costs that include
freight and marine insurance; it indicates the time required for shipment which is crucial,
especially for perishable goods; it is a proxy for communication costs which involves personal
contacts between managers and customers to exchange information on the exchange to be made.
Distance also captures synchronization costs involving time of delivery of inputs into the
production process; it may also be a good proxy for the transactions cost of doing business; and
the fact that more distant areas are likely to be more culturally different suggests that trade
between such areas may be lower compared to geographically close areas/countries.
As noted above, the original gravity model was criticized for its lack of touch with the
standard theoretical bases for international trade as posited in the famous Ricardian and
Heckscher-Ohlin models. The former emphasized differences in comparative advantages among
countries to explain trade flows and pattern while the later dwelt on the variations in factor
endowment among countries. This criticism became one of the major bases for further
refinements of the standard gravity model as proposed by Tinbergen. Piermartini and Teh (2005)
observe that Anderson (1979) was probably the first author to establish the theoretical basis for
the gravity models. They observe that Anderson (1979) did this by constructing a model “where
goods were differentiated by country of origin and where consumers have preferences defined
over all the differentiated products” (Piermartini and Teh 2005, p. 38).
34

While the standard gravity model has been lauded to have performed significantly well in
explaining trade, Head (2003) notes that “there is a huge amount of variation in trade” (p.9) that
these models cannot explain. As such, researchers have chosen to include a number of extra
variables that have been observed to be relevant in explaining trade flows. Some of these
variables include; dummies to capture the effects of country adjacency, whether a country is
landlocked or not, whether two countries speak the same language or share some colonial
history, whether the country is a member of some PTA or RTA, customs union, whether they
share the same currency and so on. As Head (2003) observes, authors include these variables,
albeit there is weak theoretical justification for doing so. The fact that the two major variables in
the standard gravity model, GDP and distance tends to fit the data well, increases the temptation
to include any of these seemingly relevant variables. It is important though that choice of which
variables to include in the model must be guided by the specific issue at hand. As Piermartini and
Teh (2005) observe that one needs to proceed carefully in analyzing the theoretical questions at
hand which should guide the choice of appropriate regressors to be used in the empirical
estimation method.
Empirical Application of the Gravity Model
As alluded to above, gravity models have been extensively used to evaluate the effects of
preferential trading arrangements (PTA), simply by adding an intra-bloc and an extra-bloc8
dummy variable to capture such effects in the standard model. The analysis proceeds on the
presumption that the “normal trade volume” between countries is explained by two variables,
economic size of the trading partners and distance between them, such that any significant
effects from the PTA will manifest in either increased (trade creation) or reduced (trade
8 This nomenclature, intra-bloc and extra-bloc, draws from Piermartini el at (2005) usage
35
diversion) volumes between these partners as compared to the “normal volume”. Thus, trade
creation is captured by a significant positive coefficient for the intra-bloc dummy while trade
diversion is captured by a significant negative extra-bloc dummy variable coefficient.
Frankel (1997) applied the traditional log-linear gravity model on levels of variables to
study the trade effects of a number of RTAs, including EC, NAFTA, EFTA, Adean, ASEAN,
and MERCOSUR. Using total trade as the dependent variable, the model was augmented by two
dummies for intra-bloc and extra-bloc trade. The study established the existence of net trade
creation effects for EC, MERCOSUR and Adean, and significant trade diversion for NAFTA and
EFTA. Furthermore, the intra-bloc dummies were found to have no significant effects for Adean,
NAFTA and EFTA. A similar model was used by Soloaga and Winters (2001) - but with two
extra-bloc dummies, one for imports and the other for exports - to study the trade effects of EC,
NAFTA, EFTA, Adean, ASEAN, CACM, MERCOSUR and other blocs. The results of the
model on levels showed existence of negative intra-bloc dummies for the EU, EFTA and
ASEAN; and positive intra-bloc trade impacts for CACM, ANDEAN and MERCOSUR. The
intra-bloc dummy for NAFTA was not statistically significant. The estimates on the first
differences of the variables showed that EU and EFTA were net trade diverting, while
MERCOSUR and CACM were net trade creating. Dee and Gali (2003) used the model with the
augmentation similar to the one by Soloaga and Winters (2001) to study the impacts of Andean,
APEC, EFTA, EC, GCC, LAFTA/LAIA, MERCOSUR, SPARTECA, CER, AFTA and a set of
bilateral agreements. However, Dee and Gali (2003) constructed what they called a Member
Liberalization index (an index of the coverage of the RTA), such that the three dummies would
take the value of this index whenever the RTA was in force. Results from their analysis found
36

that nearly all RTAs studied were found to have net trade diverting effects, while net trade
creating results were found only for Andean, LAFTA/LAIA, US-Israel and SPARTECA9.
Nilsson’s (2002) study on the effects of the preferences accorded by the EU to ACP
countries under the Lomé Convention compared to the EU GSP arrangements provides a good
example of how the gravity model can be augmented to captured a ray of other variables than
those in the standard model. Dummies were included to capture the effects of cultural and
historical ties and the significance of colonial linkage between former colonies and their
European colonizers. The study found that exports for developing countries were significant and
larger under the Lomé Convention as compared to the EU GSP arrangement and that historic ties
significantly explain trade linkages for selected European countries and their former colonies.
Computable General Equilibrium Models (CGE)10
CGE trade models exploit the computer capability to construct a rigorous analytical
framework that takes into account all market linkages, retains optimization assumptions thereby
preserving its consistency with the hallmarks of the general equilibrium theory of the economy
(Grunbaum 2007). Apart from their theoretical consistency, the ability of the CGE models in
arriving at precise numerical estimates has also been cited in literature as one of the model
strengths. This is easily attained by CGE models since “the workings of an economy and the
changes that would follow specific policy implementation can be simulated, as CGE models act
to emulate the functions of laboratory experiments” (Piermartini et al (2005).
It is the ability of CGE models to capture the overall picture of the changes that emanate
from requisite policy changes that elevates their importance in ex-ante analyses of trade policies
9 Piermartini et al (2005) provide a summary of these and more such studies in their work
10 This section draws from the work of Busse et al (2005); Piermartini and Teh (2005) and Grunbaum (2007)
37
such as enforcement of RTAs and PTAs. As Grunbaum (2007) observes, “overall aggregate
trade, terms of trade effects, factor prices, trade creation and trade diversion within an economy-
wide model can be estimated; as can be obtained estimates of inter-sectoral linkages, prices,
wages, and exchange rates that lead to equilibrium in product and factor markets, as well as
balance of trade figures” (p. 79). As such, alternative scenarios of the specific policy change can
be conjectured and their requisite potential parametric outcomes simulated.
While CGE models may be more suitable to analyze the overall trade and welfare effects
of changes in trade policy, their data requirements are significant and can be a major hurdle for
studies involving developing countries. These models require what is known as the “social
accounting matrix”, which involves input and output data for the entire economy and their
requisite inter-sectoral linkages plus their associated contributions to output; government fiscal
and/or budget accounts, disaggregated into consumption, investment, government expenditures,
balance of payments; as well as data on the volumes and values of imports and exports
disaggregated by their requisite composition, origin and destination (Grunbaum 2007). Besides,
these data matrices must be appropriately arranged into revenues and expenditures, balanced and
standardized (Piermartini and Teh 2005; Grunbaum 2007). Apart from the social accounting
matrix construct, CGE models require exogenous variables that capture the behavior and
response of producers and consumers to any changes in incomes and relative prices resulting
from the policy changes thus effected. The parameters most often needed are: elasticities of
substitution related to the responsiveness of producers to changes in relative prices of factors of
production; consumer demand and income elasticities; and Armington elasticities, which
determine the substitutability between domestic and imported products. Usually such elasticities
are borrowed from previous econometric studies and may be adapted into the current model
38

(Grunbaum 2007). This considerable amount of good quality data can be rarely obtainable in
developing countries, let alone the availability of prior econometric studies in those countries
from which the stated elasticities could be borrowed. Otherwise, the persistence to applying the
model in studies involving those countries may result in use of dubious quality data.
As indicated above, the nature of the data employed by the CGE model is significantly
aggregated. This level of aggregation has been criticized as a potential source of loss of detail in
fundamental relationships that may be obtained. Indeed as Grunbaum argues, “complex
simulation models where large amounts of data inputs produce precise outputs can be deceiving
as precise sources of certain results are not clearly identifiable” (Grunbaum 2007, p 81). Pundits
further attack users of the model for their tendency to choose values of the requisite elasticities
arbitrarily and the Armington elasticities from outdated studies. In view of these concerns, some
have suggested that systematic validation of CGE simulations through ex-post evaluation is
necessary to enhance the confidence and the predictive potential of the analytical results derived
from the initial studies (Piermartini and Teh 2005).
Application of CGE Models in Empirical Work
In spite of the limitations cited above, CGE models have been used quite extensively to
analyze the trade effects of not only RTAs but also multilateral trade agreements, such as the
Uruguay and Doha rounds of trade agreements under the WTO. In fact, CGE models have the
ability to isolate the trade creation and trade diversion effects from such policy changes by sector
which allows computation of sectoral welfare effects other than aggregate.
Grunbaum (2007) cites the work of Kerkala, Niemi, and Vaittinen (2000) who used a
multiregional general equilibrium model to examine the consequences for African ACP countries
of a post-Lomé world. Their work simulates the effects of entering into force of WTO
compatible trading arrangements under the proposed EPA as compared to the ones obtainable
39
under the EU GSP system. The authors employed the Global Trade Analysis Project (GTAP)
model to simulate the potential outcomes which suggested negative welfare effects for requisite
African countries. Results also showed increased trade volumes under the EPA and declining
volumes under the EU GSP system. Grunbaum summarizes that “in both cases world welfare
increased, however, positive effects were limited to the EU while they were absent in ACP
countries” (Grunbaum 2007).
Another study on the potential effects of reciprocal trade liberalization under the Cotonou
Agreement for the West African Economic and Monetary Union (UEMOA) against the EU was
conducted by Wolf (2002). Wolf (2002) employed the CGE tool to quantify the gains from this
policy change and compare them to the losses in tariff revenue that would likely follow to these
UEMOA countries. The results from this study showed that liberalization under the Cotonou
Agreement would have significant negative effects on tariff revenue generated by the UEMOA
countries.
Keck and Piermartini (2005) used an applied general equilibrium model covering 15
regions and 9 sectors to simulate the impact of signing EPAs with the EU for the Southern
African Development Community (SADC) countries. The standard GTAP model was extended
to include the elimination of textile quotas, EU enlargement to 25 members as well as tax
revenue sharing and a common external tariff among SADC countries. Simulation of outcomes
for various liberalization scenarios was undertaken. The issue of tariff revenue loss was also
tackled in their study, including calculation of requisite tax replacement values. The results
demonstrated that EPAs with the EU are welfare-enhancing for SADC overall, leading also to
substantive increases in real GDP. They also found that, for most countries, further gains could
arise from intra-SADC liberalization. While the possibility of the EU entering an FTA with
40

other countries, such as MERCOSUR, was found to reduce estimated gains, these gains still
remained positive. In terms of sectoral level effects, the largest expansions in SADC economies
was found in the animal agriculture and processed food sectors, with less attractive levels in the
manufacturing following EU-SADC liberalization.
Piermartini and Teh (2005) summarize a number of studies that used CGE models to
simulate the potential benefits from trade liberalization under the Uruguay and Doha Trade
Agreements, noting their numeric benefits in dollars to world welfare11.
Partial Equilibrium Model (PE)12
By their nature, PE models focus on a detailed analysis of only one particular market or
sector, holding all other factors that can affect the same constant. In trade policy analysis, PE
models have been used extensively to evaluate the effects of discriminatory tariff modification
such as that which would occur under the EU-ACP EPA arrangement. In his quest to quantify
trade effects of the then newly established European Community, Petrus J. Verdoorn (1960)
developed a partial equilibrium model based on the Vinerian theoretical framework that remains
significantly influential even today. Verdoorn’s original model has been modified by a number
of researchers. Grunbaum (2007) observes that two basic types of PE models have so far been
used in the analysis of preferential trade liberalization arrangements. Of these, the first one
assumes trade in a homogenous commodity while the second assumes trade in a differentiated
product and existence of infinite supply elasticities. Grunbaum (2007) explains that under the
first scenario, a reduction in tariff tends to spur expansion of trade flows, only to be limited by
the corresponding supply elasticities. This implies that some significant growth in trade flows
11 These studies are not covered here since our focus is on regional trade arrangements.
12 This section draws heavily on the work of Grunbaum (2007); Piermartini (2005) and Busse et al (2004). However, we only provide a brief overview of the Verdoorn model in this section, leaving a detailed derivation in the next chapter
41

can be observed if the supply elasticity of a beneficiary country such as the EU bloc in our case
is high. Under the second scenario, it is the degree of substitutability among goods that limit
trade flows expansion. As such, “a high elasticity of substitution leads to a substantial increase
in trade flows and likewise a low elasticity of substitution leads to a small increase in trade
flows” (Grunbaum 2007, p. 84).
Overview of the Verdoorn Model
The Verdoorn model follows the second of the two types of PE models stated above such
that product differentiation between supplying countries is assumed and that these products are
imperfect substitutes in use. Busse, et al (2004) argues that “this assumption seems reasonable
for African countries, since the majority of African imports consist of manufactured goods” (p.
17). The model further inherits the usual partial equilibrium analysis assumptions including the
following: no repercussions on exchange rates or incomes as a result of changes in trade flows,
iso-elastic import-demand functions, and existence of infinite supply elasticities (Busse, et al
2004). Besides these assumptions, “the model requires knowledge of import demand elasticities
and the elasticities of substitution between preferred and non-preferred imports” (Grunbaum
2007, p.84). As such, trade creation13 is captured as follows;
TC = MP ε [Δt/(1+t)] (2-3)
where
TC = Trade Creation
MP =Imports from preferences beneficiary
ε = Import demand elasticity
t = tariff
13 This follows Grunbaum (2007) specification of the same
42

In this formulation, it is further assumed that “the substitutability between imports from
preferred sources and domestic production is equal to the substitutability of all imports and
domestic production” (Grunbaum 2007, p.85). On the other hand, trade diversion is formulated
as follows;
TD = MP α2 (σ- ε)[Δt/(1+t)] (2-4)
where
TD = Trade Diversion
MP =Imports from preferences beneficiary
α2 =Share of imports from non-preference beneficiary
σ =Elasticity of substitution
ε = Import demand elasticity
t = tariff
One of the major variants to the original Verdoorn (1960) model is that developed by
Baldwin and Murray (1977)14, which utilizes data for domestic production on top of data on
imports from non-preferred suppliers. Thus, while the trade creation formulation is similar to the
Verdoorn model, the Baldwin and Murray model does have a different trade diversion
framework, which is captured as follows;
TD = MP ε[Δt / (1+t)] [MN / MD] (2-5)
where
TD= Trade Diversion
MP=Imports from Preferences Beneficiary
MN=Imports form Non-Preferred country
MD=Domestic Production
ε = Import Demand Elasticity
14 This section is a synthesis of Grunbaum’s (2007) work, which identifies the Baldwin and Murray (1977) model as the major variant of the original Verdoorn model
43
t= Tariff
In this formulation, the authors assumed that the substitutability between imports from a
preference beneficiary source and those from a non-beneficiary source was equal to the
substitutability between imports from a preference beneficiary source and domestic production
(Sawyer and Sprinkle 1989; Grunbaum 2007).
Despite their detail, PE models have been criticized for a number of reasons. One such
matter at issue relates to the choice of elasticities used in the model. As Grunbaum (2007)
observes, “the values for the elasticities used are chosen arbitrarily on the basis of estimates often
considered unreliable” (Grunbaum 2007, p.87). Secondly, any change in trade flows is bound to
result in repercussions in all other sectors of the economy. As such, the ceteris paribus
assumption used in PE models tends to be considerably unrealistic. Pundits criticize PE models
for failure to take into account these resultant inter-sectoral linkages and factor markets
dynamics. As alluded to before, PE models have the advantage at being detailed in their
analyses. These models permit researchers to conduct analyses at highly disaggregated levels,
thus allowing for detailed analysis even by tariff line (Grunbaum 2007). This level of detail
allows analysts to be able to pin-point those specific products and trading partners that may show
significant effects of the alternative policy simulations. As such, PE models have been used
extensively in empirical analyses of discriminatory trading arrangements.
Empirical Application of PE Models
Busse et al (2004) applied the Verdoorn model to estimate the trade and budget effects of
the EPA on ECOWAS countries and Mauritania. Their study was aimed at addressing the fears
among African countries of entering the proposed EPAs without clear understanding of the
associated costs and benefits from the same. The results showed that imports from the EU in the
ECOWAS countries were expected to increase in the range running from 5.2 percent for Guinea-
44
Bissau to 20.8 percent for Nigeria. Importantly, Busse et al (2004) further reports that “Trade
creation exceeds trade diversion (in absolute levels) in all scenarios and for all West African
countries” (p.26). However, the budgetary effects were found to be very severe for some of the
West African countries. Cape Verde and Gambia were cited as the two countries to be severely
impacted by the impending tariff revenue decline. The authors went a step further to identify
those product categories that were found to have highest budgetary effects as well as trade
creation and trade diversion effects for each of the West African countries covered. This, they
sorted out by both absolute and relative changes.
Max Grunbaum (2007) used the Verdoorn version of the PE model to project the effects
of trade liberalization in the Organization of Eastern Caribbean States (OECS) countries along
the EU-ACP proposed EPAs which are essentially geared to create an FTA between these two
trading blocs. He undertook to quantify trade creation, trade diversion and fiscal impacts for
three alternative liberalization scenarios. The alternative scenarios were contemplated dependent
on scope of discrimination to other trading partners as EPAs come into force. The results
demonstrated that trade liberalization results in small to modest positive trade and negative fiscal
impacts. The other importantly indication from the results was that they “provided empirical
support to theoretical arguments and policy suggestions that, for small countries such as the
OECS, broader trade liberalization is superior to limited regional trade agreements” (Grunbaum
2007, p.12).
Analysis of Fiscal Impacts
As we pointed out in the first chapter, the issue of tariff revenue loss stands out as one of
the major fears related to trade liberalization, especially among the developing countries. It is
more of an issue among these countries since tariff revenue accounts for a significant proportion
of total government revenue. The concern is that loss of such a significant proportion of revenue
45

may suffocate the government’s ability to deliver services to the citizenry and increase
impediments towards economic development. This fear is exacerbated by consideration of a
myriad of other short-term adjustment costs associated with liberalization such as “increased
unemployment, reduction in national output, elimination of certain domestic industries and
possible macroeconomic instability” (Grunbaum 2007, p.91. It is such fears as these that have
inspired interest among researchers on carrying out empirical studies on the anticipated levels of
tariff revenue loss resulting from liberalization and derive comparisons with the anticipated
levels of benefits from the same to establish an overall net position.
A survey of literature on this subject reveals two distinguished themes along which
discussion and research has dealt with this issue in the past. While the first of these has focused
on the measurement and evaluation of the relative importance of tariff revenues as a proportion
of aggregate government revenue, the second theme has aimed at exploring alternative tax
systems and/or fiscal reforms that could help compensate for tariff revenue losses (Grunbaum
2007). To understand the fiscal effects of tariff reduction in pursuit of trade liberalization, one
has to understand the ways through which such a policy change impacts tariff revenue.
Grunbaum (2007) reviewed the 2004 Report of the Inter-American Development Bank (IADB)
and summarizes five ways through which tariff reduction affects tariff revenue. These include;
direct effects or losses due to the reduction of a given tariff line; indirect effects or revenue
decline from taxes imposed on CIF plus tariffs that are forgone due to the tariff rate decline;
elasticity effects which affect the revenues depending on whether they cause an increase or
decrease in the volume of trade of certain products; substitution effects which result in trade
diversion from the displacement of imports from partners not facing tariffs; and induced effects
that are changes in total tax revenues resultant from consumption and production patterns borne
46

47
of economic structures post liberalization (Grunbaum 2007). Appreciation of these five channels
demonstrates how complex the resultant net outcome from trade policy change can be. As
literature shows, trade liberalization can in fact result in increased tariff revenue generated by the
government depending on a given situation. A host of factors do affect the net impact from trade
policy change for a country. Some of these factors include the initial conditions such as tariff
structures and general restrictiveness to trade, domestic tax including reforms to quantitative
restrictions, reduction in the number of tariff levels, and exchange rates and exchange rate
regimes. In general, the more restrictive the initial conditions, the more the losses in tariff
revenue, and the tighter the government is on the exchange rate regime the higher the costs from
liberalization.
The level of development for the country is found to be more important in determining
the country’s ability to offset loss of tariff revenue due to liberalization. The work of Khattry and
Rao (2002) was central at establishing this perplexing phenomenon. They argued that structural
limitations characterizing low-income countries make the gradual substitution of trade taxes by
domestic sources of revenue very difficult (Grunbaum 2007, p.93). The low levels of
development among these countries tend to impact negatively on the breadth and levels of
domestic tax revenue collections. As such, the potential for these governments to offset lost
revenue from tariff with domestic collections is very minimal.

CHAPTER 3 MODEL DEVELOPMENT
This study intends to utilize the partial equilibrium (PE) model to simulate the trade
effects and fiscal impacts of trade liberalization for Malawi under the EPA arrangement with the
EU. The Verdoorn (1960) version of the PE model, initially introduced in chapter two above will
be used to undertake this empirical work. The choice of this model has been dictated by data
considerations and the ex-ante nature of the analysis. As insinuated in the previous chapter, ex-
ante analyses can be conducted by either using the computable general equilibrium (CGE) or PE
models. However, the enormous data requirements for the CGE models - aspects of some of
these data do not seem readily available for Malawi - has left us with the appropriate PE model.
Notwithstanding their simplicity as compared to CGE models, PE models have been extensively
used for analyses of this type, from which progressive policy recommendations have emanated.
Specification of the Empirical Model1: The Verdoorn model is based on a couple of
restrictive assumptions. First, the model applies the Armington assumption of product
differentiation such that imported products from different countries are assumed to be imperfect
substitutes in use. For Malawi, we find this assumption to be reasonable as the majority of the
country’s imports are manufactured goods. The Verdoorn model is based on the partial
equilibrium analysis and therefore makes the following other assumptions; trade flows changes
do not have any repercussions on the incomes and exchange rates; iso-elastic import demand
elasticities; and infinite supply elasticities. The last assumption seems particularly appropriate in
the case of Malawi vis-à-vis the EU as the latter’s exports to the former must account for a
significantly small proportion of its total exports. On the other hand, exports from other smaller
1 The empirical model in this section is developed based on the one specified by Busse et al (2004) and Grunbaum (2007).
48

Southern African Development Corporation (SADC) countries to Malawi may not support this
assumption. However, we are captivated to maintain the assumption on the understanding that
exports to Malawi from these small SADC countries do not constitute significant proportions of
their total production. Nonetheless, we do recognize that those elasticities are less than infinite.
To conduct an ex-ante analysis of trade effects, one would consider a particular category
of commodities, say M, and proceed to model the consumer’s behavior in the importing country.
Following this reasoning; the utility function the consumer is assumed to maximize can be
specified as follows;
U = f [fp(MP, MN), MD] (3-1)
where
fp = denotes a separable homogenous branch of the aggregate utility function
MP = Imports of commodity M from preference beneficiary sources
MN = Imports of commodity M from non-preference beneficiary sources
MD = Domestic production of commodity M
The assumption of homogeneity in the specification is quite consequential in that it
implies that total imports of M, given by [MP+MN] are substituted equally for domestic
production. The formal implication of this separability of the utility function is that the Verdoorn
model differentiates between the sources of imports, those from preference beneficiaries and
those from non-beneficiaries, labeled herein as MP and MN (Grunbaum 2007).
There are two other crucial assumptions based on which the Verdoorn model is
developed. First, that the demand function for the preference donor, Malawi in our case, for a
single category of products such as M, is given by the following specification;
MP + MN = (3-2)
49
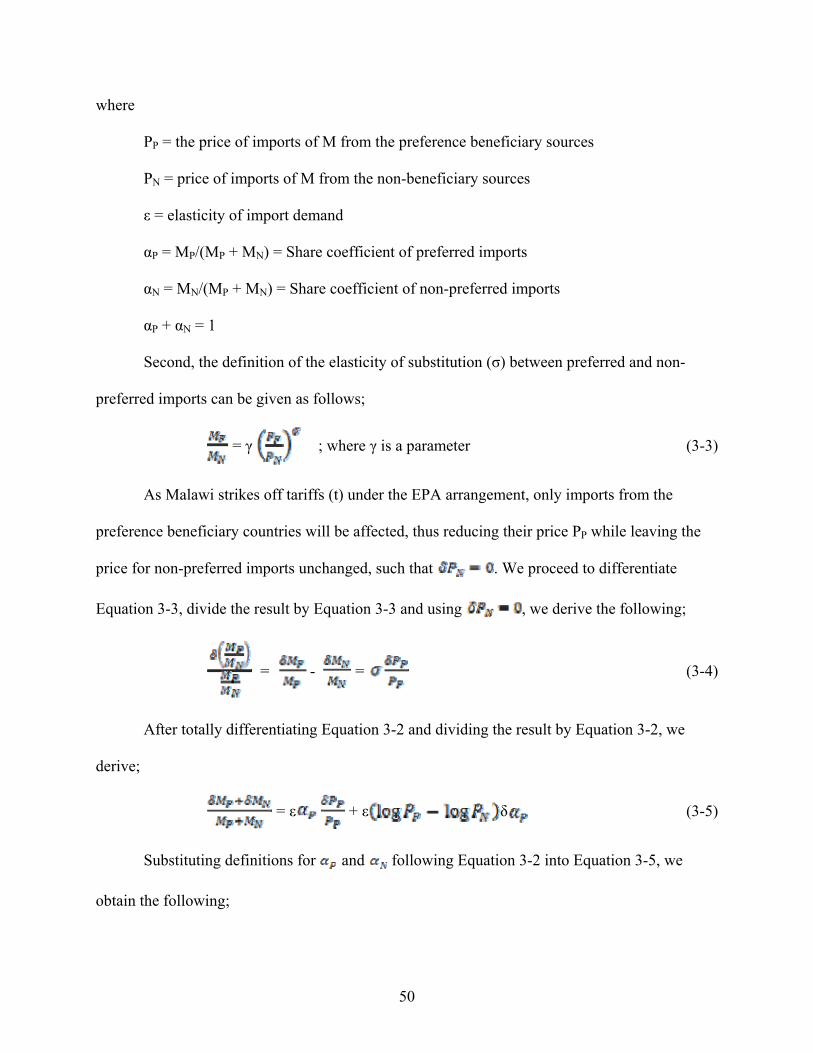
where
PP = the price of imports of M from the preference beneficiary sources
PN = price of imports of M from the non-beneficiary sources
ε = elasticity of import demand
αP = MP/(MP + MN) = Share coefficient of preferred imports
αN = MN/(MP + MN) = Share coefficient of non-preferred imports
αP + αN = 1
Second, the definition of the elasticity of substitution (σ) between preferred and non-
preferred imports can be given as follows;
= γ ; where γ is a parameter (3-3)
As Malawi strikes off tariffs (t) under the EPA arrangement, only imports from the
preference beneficiary countries will be affected, thus reducing their price PP while leaving the
price for non-preferred imports unchanged, such that . We proceed to differentiate
Equation 3-3, divide the result by Equation 3-3 and using , we derive the following;
= - = (3-4)
After totally differentiating Equation 3-2 and dividing the result by Equation 3-2, we
derive;
= ε + ε δ (3-5)
Substituting definitions for and following Equation 3-2 into Equation 3-5, we
obtain the following;
50

+ = ε + εlogPδ (3-6)
By using Equation 3-4, we proceed to rearrange Equation 3-6 to obtain the expression for
the derivative of as follows;
δ = σ (3-7)
We next eliminate from Equation 3-4 by multiplying with and rearranging
the equation to obtain the following;
- = σ (3-8)
= (3-9)
Next, we insert Equation 3-9 into Equation 3-6 and use Equation 3-7 to substitute the
δ and obtain,
= (3-10)
Since log P is close to zero, if , then Equation 3-10 can be expressed as
follows;
= (3-11)
Now, the price for preferred imports can also be expressed in terms of export prices as
follows;
= (3-12)
Where is the export price exclusive of the tariff (t). The total derivative of Equation
3-12 gives the following;
51
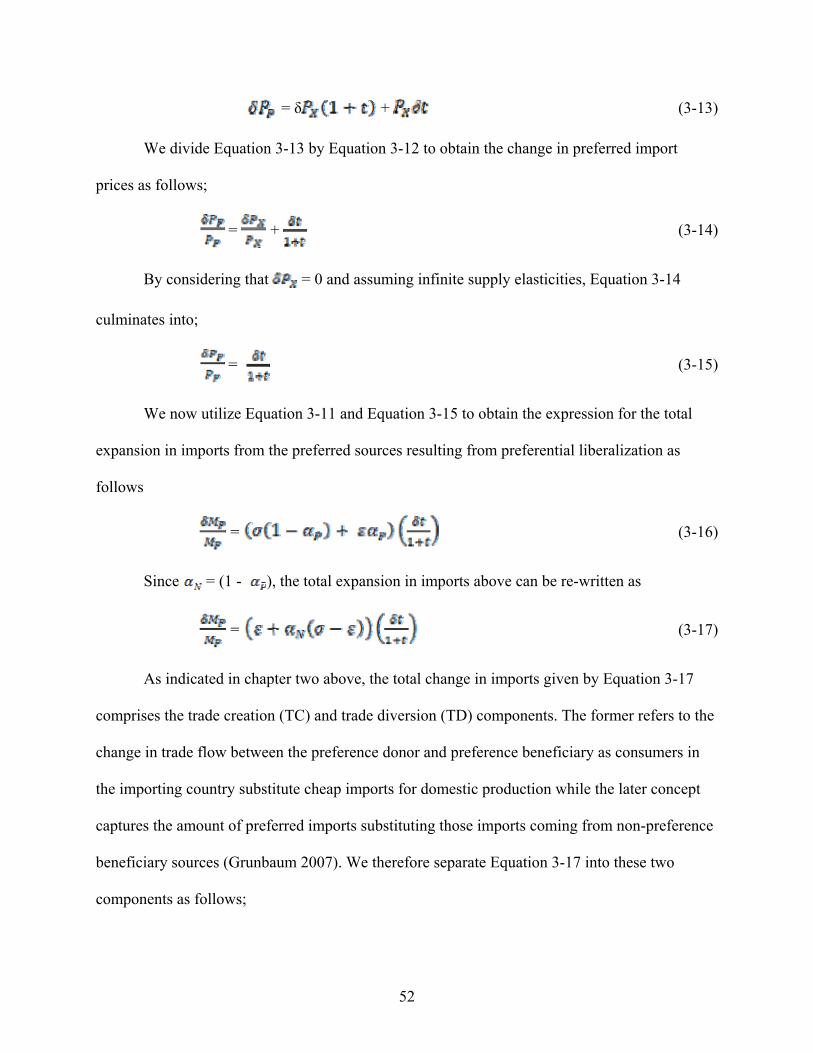
= δ + (3-13)
We divide Equation 3-13 by Equation 3-12 to obtain the change in preferred import
prices as follows;
= + (3-14)
By considering that = 0 and assuming infinite supply elasticities, Equation 3-14
culminates into;
= (3-15)
We now utilize Equation 3-11 and Equation 3-15 to obtain the expression for the total
expansion in imports from the preferred sources resulting from preferential liberalization as
follows
= (3-16)
Since = (1 - ), the total expansion in imports above can be re-written as
= (3-17)
As indicated in chapter two above, the total change in imports given by Equation 3-17
comprises the trade creation (TC) and trade diversion (TD) components. The former refers to the
change in trade flow between the preference donor and preference beneficiary as consumers in
the importing country substitute cheap imports for domestic production while the later concept
captures the amount of preferred imports substituting those imports coming from non-preference
beneficiary sources (Grunbaum 2007). We therefore separate Equation 3-17 into these two
components as follows;
52
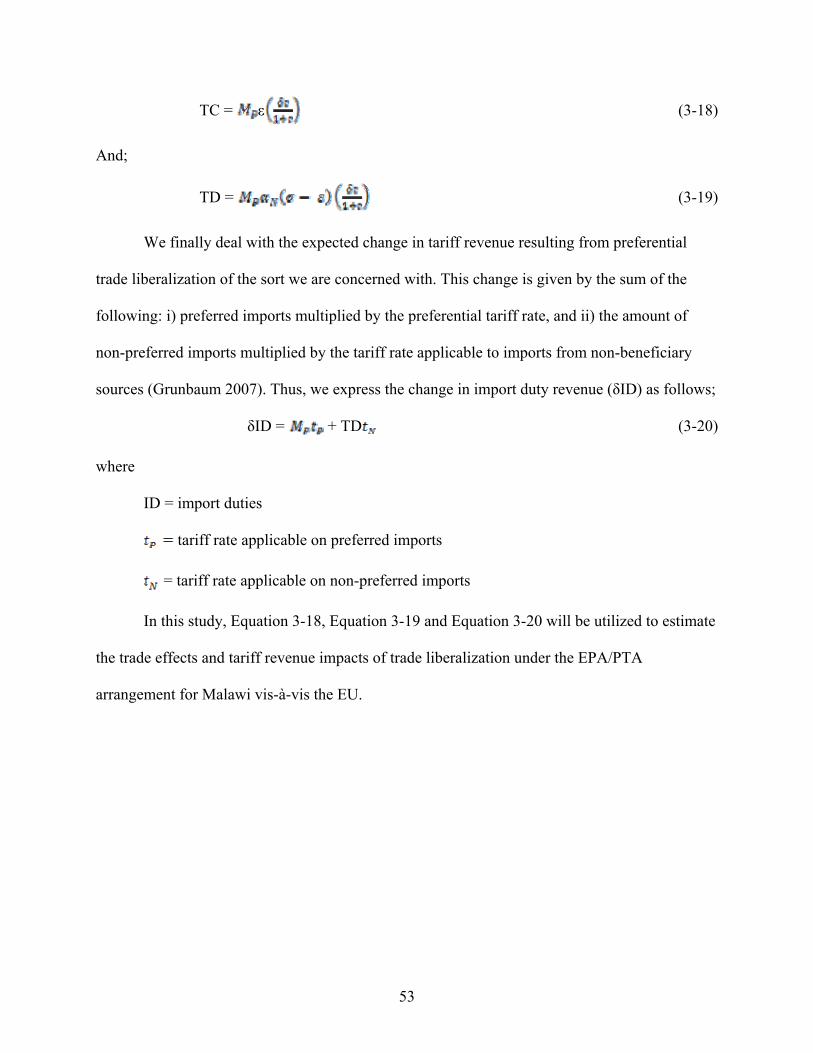
TC = ε (3-18)
And;
TD = (3-19)
We finally deal with the expected change in tariff revenue resulting from preferential
trade liberalization of the sort we are concerned with. This change is given by the sum of the
following: i) preferred imports multiplied by the preferential tariff rate, and ii) the amount of
non-preferred imports multiplied by the tariff rate applicable to imports from non-beneficiary
sources (Grunbaum 2007). Thus, we express the change in import duty revenue (δID) as follows;
δID = + TD (3-20)
where
ID = import duties
tariff rate applicable on preferred imports
= tariff rate applicable on non-preferred imports
In this study, Equation 3-18, Equation 3-19 and Equation 3-20 will be utilized to estimate
the trade effects and tariff revenue impacts of trade liberalization under the EPA/PTA
arrangement for Malawi vis-à-vis the EU.
53

CHAPTER 4 DATA REQUIREMENTS, SOURCES AND TREATMENT
The simulation and evaluation of the impacts of Malawi entering the EU-ACP Economic
Partnership Agreement will be carried out using the Verdoorn’s (1960) Partial Equilibrium
model. As indicated in the previous chapter, use of the import demand elasticities (ε) allows us to
employ import data without relying on domestic production data. These domestic production
data, if were to be used, have to be captured at a highly disaggregated level such as the eight-
digit level of aggregation (i.e.; HS-8) which is being used in this study. As is the case with most
other developing countries, such type of data were not readily available for Malawi so that use of
import data was particularly necessary in this study. At the eight-digit level of data aggregation,
the simulations permitted us to assess the effects of liberalization at product level and identify
those products most impacted by the contemplated trade policy changes. To this effect, we
managed to collect the national eight-digit HS tariff and trade schedules from the Malawi
National Statistical Office (NSO)1. These data were obtained for the baseline year of 20062.
The raw data obtained from the NSO indicated that in 2006, Malawi imported goods and
services from the 27 EU countries using 1,602 tariff lines compared to the total number of 3,956
lines utilized during the same year at the HS eight-digit level of aggregation.
Malawi has three major trade-related taxes, of which import duties are just one type. The
other two types include excise duties and import surtaxes. At every eight-digit tariff line utilized
1 These data are initially captured by the Malawi Revenue Authority, a Government Agency mandated to collect taxes. However, it is the National Statistical Office that has the legal right to process and disseminate all statistical information for the country. As such, the NSO obtains these data sets from the MRA on a monthly basis
2 The choice of this year was based on the planned deadline for EPA effectiveness which was initially scheduled to start in January, 2008. As such, the capture data were the most recent years for which the NSO had complete data sets as required by the study prior to the EPA signing deadline.
54

during the baseline year for which data was obtained, the requisite CIF3 import value was
captured along with its import duty, excise duty and the import surtax that were levied by the
Malawi Revenue Authority. These data sets were obtained in the local currency, the Malawi
Kwacha. As such, we converted all the Malawi Kwacha values into United States Dollars using
the official average annual exchange rate as reported by the NSO and the Reserve Bank of
Malawi. The rate reported and applied in this study was MK139.34 to US$ 1.00 for the baseline
year of 2006.
In line with the spirit of the study, two different scenarios of the scope of liberalization
were contemplated, with each scenario changing the definition of which (or how many) countries
constitute the “preferred source” of imports compared to the rest of the world. First, we assumed
a scenario whereby Malawi enters into an EPA arrangement with the EU without any ancillary
agreements with other trading partners outside the EU realm. For this scenario, the trade and
tariff data were organized in such a manner that at every tariff line, imports from all the 27 EU
countries were categorized as preferred imports as distinguished from those coming from
elsewhere. Secondly, we built on the first scenario by contemplating a situation whereby Malawi
correspondingly removes tariff barriers on imports from fifteen (15) other countries from the
Southern Africa Development Corporation (SADC) region4. This is not a far-fetched assumption
as negotiations for trade liberalization within this region have been on-going since the early
1990s. To capture this scenario, we added all imports from these fifteen (15) member states into
the basket of preferred imports from the EU. The significance of the second scenario can be well
appreciated if one considers the fact that a significantly higher proportion of Malawi’s trade is 3 Cost, Insurance and Freight aggregate value
4 The fifteen Member States of SADC include; Angola, Botswana, Democratic Republic of Congo, Lesotho, Madagascar, Malawi, Mauritius, Mozambique, Namibia, Seychelles, South Africa, Swaziland, Tanzania, Zambia and Zimbabwe.
55

conducted within the SADC region. In fact, during the baseline year, Malawi’s imports from
SADC accounted for about 58.2 percent of total imports.
The debate on whether Malawi must move forward and implement the EPA agreement
with EU is of little value at this point because such a decision was already made at an ACP level,
even though the country has not moved forward with the implementation of the agreement.
Meanwhile, Malawi’s trade with EU countries utilizes the Everything But Arms (EBA) trading
arrangement which is 100 percent unilateral such that the EU can decide to terminate it anytime
that they want to force Malawi along with other ACP least developed countries to migrate to the
EPA arrangement. In such an event, Malawi would be left with just two options, enforcing the
EPA or start utilizing the Generalized System of Preferences (GSP) framework. However, the
preferences under the EPA agreement are far more rewarding to Malawi than those offered under
GSP framework. To this extent, our interest in the current study was to explore alternative ways
through which Malawi could migrate to the EPA framework in the most rewarding manner. As
such, analysis of the import tariff removal along the two broad liberalization options explained
above was intended to provide us with vital information regarding the costs and benefits of a
more encompassing liberalization framework for the country as compared to a lean targeted
liberalization scenario. To this effect, trade creation, trade diversion and fiscal impacts for both
of the two contemplated liberalization scenarios were computed. It was envisaged that based on
such results, the study will derive and describe alternative trade policy options for the
government.
The last bit of data as per the applicable model in this study was with respect to two
crucial variables for the elasticity of import demand and the elasticity of substitution. Knowledge
of these elasticities is an important ingredient in ex-ante analyses of trade policy reforms.
56

Unfortunately, realistic figures for these two variables at the eight-digit level of data aggregation
are non-existent for most of the developing countries, let alone Malawi. As such, strong
assumptions about the levels of these elasticities were made. First, an extensive survey of the
empirical studies of import demand elasticities was made and one current such study was the one
conducted by Sebastian Vollmer, et al (2009)5. In their study, Vollmer and colleagues employed
empirical trade imports data to estimate the values of import demand elasticities for nine African
countries6. The same data was used to simulate the trade effects of an EPA for each one of the
nine countries. However, the calculations were neither done at each tariff line nor at each HS
chapter but rather blocked into two major product categories including Non-manufactured goods
(HS chapters 01 to 24) and manufactured goods (HS chapters 25 to 97). In this study, we
analyzed the socio-economic realities and trade structure of Malawi vis-à-vis each one of the said
countries. It was concluded that among the nine, Mozambique shares the most similarities with
Malawi. Uganda was found to be next to Mozambique in being similar to Malawi as compared to
the rest of the countries. As such, the import demand elasticities calculated by Vollmer and
friends for Mozambique were adapted for use in this study. The adaptation was largely with
respect to the assumed values of elasticities for the non-manufacturing category, which were
adjusted upwards by 39 percent to take into account the move from the HS-0 to HS-2 category of
the level of aggregation to the HS-3 to HS-8 category of the level of aggregation7. The basis for
the 39 percent adjustment follows the empirical work of Kee, Nicita, and Olarreaga (2004) who
estimated elasticities for different countries at the three and six digit level and found that on
5 Vollmer, et al (2009); EU-ACP Economic Partnership Agreements: Empirical Evidence for Sub-Saharan Africa
6 These Includes the following: Botswana, Cameroon, Cote d'Ivoire, Ghana, Kenya, Mozambique, Namibia, Tanzania, and Uganda.
7 Vollmer et all (2009) categorized the levels into these two and only calculated the elasticity of Import Demand for the Non-Manufacturing at the HS 0 to HS 2 levels.
57
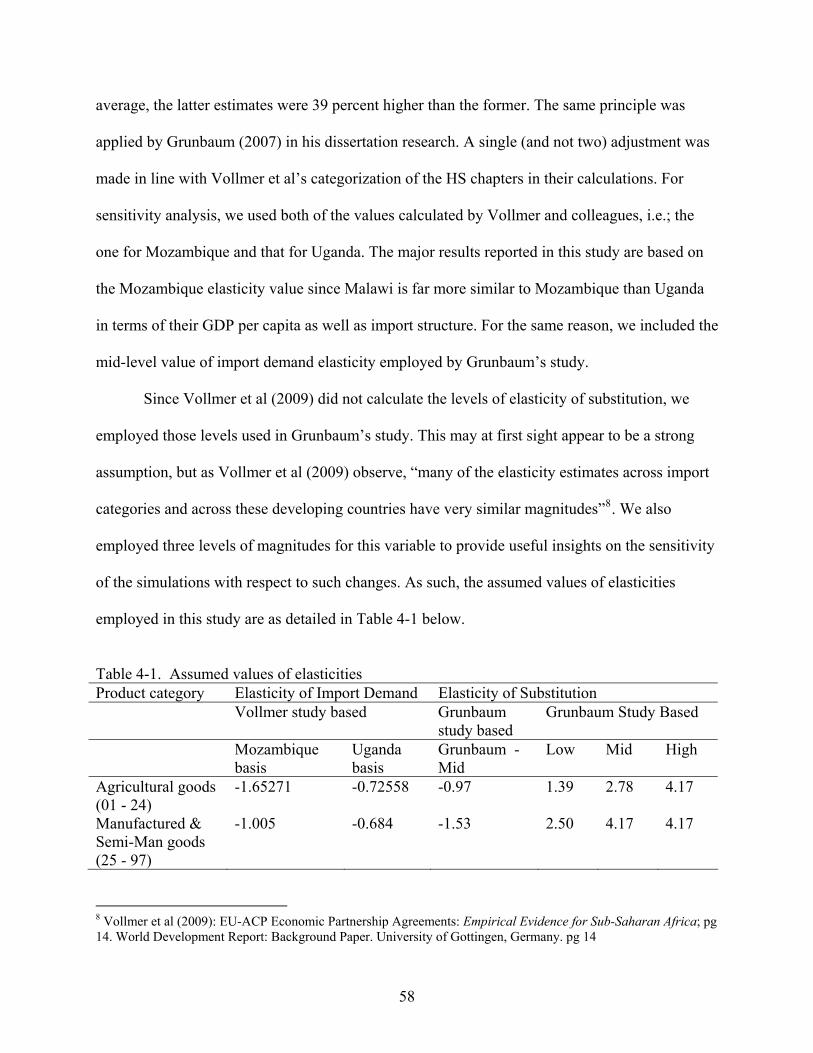
average, the latter estimates were 39 percent higher than the former. The same principle was
applied by Grunbaum (2007) in his dissertation research. A single (and not two) adjustment was
made in line with Vollmer et al’s categorization of the HS chapters in their calculations. For
sensitivity analysis, we used both of the values calculated by Vollmer and colleagues, i.e.; the
one for Mozambique and that for Uganda. The major results reported in this study are based on
the Mozambique elasticity value since Malawi is far more similar to Mozambique than Uganda
in terms of their GDP per capita as well as import structure. For the same reason, we included the
mid-level value of import demand elasticity employed by Grunbaum’s study.
Since Vollmer et al (2009) did not calculate the levels of elasticity of substitution, we
employed those levels used in Grunbaum’s study. This may at first sight appear to be a strong
assumption, but as Vollmer et al (2009) observe, “many of the elasticity estimates across import
categories and across these developing countries have very similar magnitudes”8. We also
employed three levels of magnitudes for this variable to provide useful insights on the sensitivity
of the simulations with respect to such changes. As such, the assumed values of elasticities
employed in this study are as detailed in Table 4-1 below.
Table 4-1. Assumed values of elasticities Product category Elasticity of Import Demand Elasticity of Substitution Vollmer study based Grunbaum
study based Grunbaum Study Based
Mozambique basis
Uganda basis
Grunbaum - Mid
Low Mid High
Agricultural goods (01 - 24)
-1.65271 -0.72558 -0.97 1.39 2.78 4.17
Manufactured & Semi-Man goods (25 - 97)
-1.005 -0.684 -1.53 2.50 4.17 4.17
8 Vollmer et al (2009): EU-ACP Economic Partnership Agreements: Empirical Evidence for Sub-Saharan Africa; pg 14. World Development Report: Background Paper. University of Gottingen, Germany. pg 14
58

CHAPTER 5 EMPIRICAL RESULTS
Utilizing the model developed in chapter three and the data described in the previous
chapter, we simulated trade effects and fiscal impacts under two broad liberalization scenarios.
The first of these reflects the outcome of Malawi’s possible EPA with the EU while the second
builds on the first by including an FTA with the rest of SADC member states. One major
assumption that has to be pointed out from the onset is with respect to interpretation of the
results vis-à-vis what would realistically be obtainable. Under normal circumstances, the actual
implementation of the proposed EPA between Malawi and the EU would be expected to be
phased out over some considerable time period such that parties to the agreement would be
reducing tariffs on imports on a gradual basis. It is not unusual for this period to take ten years or
more. Besides, even full implementation of such agreements does not necessarily result into 100
percent reduction of existing tariffs on all products as parties tend to retain some level of
protection for some strategic commodities. An examination conducted by the WTO’s Committee
on Regional Trade Agreements suggests that FTAs typically cover between 80 and 95 per cent of
the trade between FTA members (WTO 2002; Busse et al 2004). As such, trade effects and fiscal
impacts are also expected to be gradual in that the full impact is only felt after complete
elimination of tariff on imports is attained. The outcome of the simulations in this study assumes
full and immediate elimination of import tariffs by Malawi during the first year of
implementation. The results therefore capture an end-period and/or long term static effect of
complete tariff liberalization through the implementation of the EPA and/or SADC FTA by
Malawi.
59

Trade Effects
Simulation results indicating the trade effects for the two broad scenarios are presented in
Table 5-1 and Table 5-2 below. As discussed in the previous chapters, values for trade creation,
trade diversion and total trade effects were calculated within the realms of each one of the two
contemplated trade liberalization frameworks. In particular, Table 5-1 presents the trade effects
of an EPA with the EU while maintaining the status quo on all other trading partners. As
highlighted in Table 5-1, the simulated net trade creation values were negative, and significantly
so, for all assumed elasticity levels. This implies that an EPA with the EU alone would result in
significant levels of trade diversion for Malawi, shifting the structure of imports source away
from non-EU trading partners and towards EU member states. The simulations further illustrate
that implementation of the EPA would result in significant increases in EU imports into Malawi,
with the least projected increase of 16.5 percent for the lowest elasticity value and 26.9 percent
for the mid-range of the most favored elasticity value9 in this study. These huge increases are
largely reflective of the significantly high pre-simulation tariff rates on EU imports. As
compared to the baseline total imports value, the simulations demonstrated that ex-post imports
from the EU would increase by percentage levels in the range of 2.4 to 4.7 percent, with an
increase of about 4 percent based on the most favored elasticity value in this study.
Table 5-2 presents the trade effects of implementing a broader trade liberalization policy,
which includes SADC member states by way of implementing a SADC FTA concurrently with
the implementation of the EPA with the EU. As indicated in the table, the absolute values of
simulated trade effects were much higher in this case as compared to the first scenario. Most
9 As indicated in chapter 4, the elasticity values based on Mozambique figures as calculated in the Vollmer, et al study are recommended in this study. Other values provide useful insights into deducing the sensitivity of the simulations to changes in elasticity values.
60

61
importantly though is the fact that for all but two elasticity scenario sets, trade creation values
were significantly higher than trade diversion figures. As such, for all but those two scenarios,
trade effect simulations resulted in substantially higher positive net trade creation values that
ranged from about US$ 20 million for the low Ugandan based elasticity scenario case to US$ 85
million for the low-case of the Grunbaum elasticity scenario level. The total net trade creation
value for the mid-case of the most favored elasticity value in this study was US$ 27 million. In
terms of ex post trade flow effects, the simulations showed that imports from the EU and SADC
region would increase by about 20.2 percent from the baseline year value, based on the mid
scenario case of the study preferred elasticity value. Variation of the elasticity value along the
other scenarios demonstrated that imports would increase in the range of 12.7 to 25.7 percent as
compared to the baseline year import value. As the table further demonstrates, the increases in
imports ranged from about 9.4 percent to 18.9 percent vis-à-vis total imports obtainable during
the baseline year. It is worth noting that large increases in imports were simulated under this
trade liberalization scenario as compared to the case where only EU imports benefited from a
preferential tariff regime. This is largely because of the fact that about half of Malawi imports
come from within the SADC region such that inclusion of the same in tariff liberalization was
found to have significantly encouraged increased intra-region trade.
As insinuated in the previous chapters, economists view trade creation as welfare
improving since consumers in the importing country tend to substitute more costly domestically
produced goods with low cost imports from the beneficiary country. On the other hand, trade
diversion entails displacement of the low cost imports from non-beneficiary trading partners by
the expensive imports from beneficiary countries, which would be EU in our case. As such, and
on the basis of the simulation results describe above, it was noted that an EPA with the EU alone
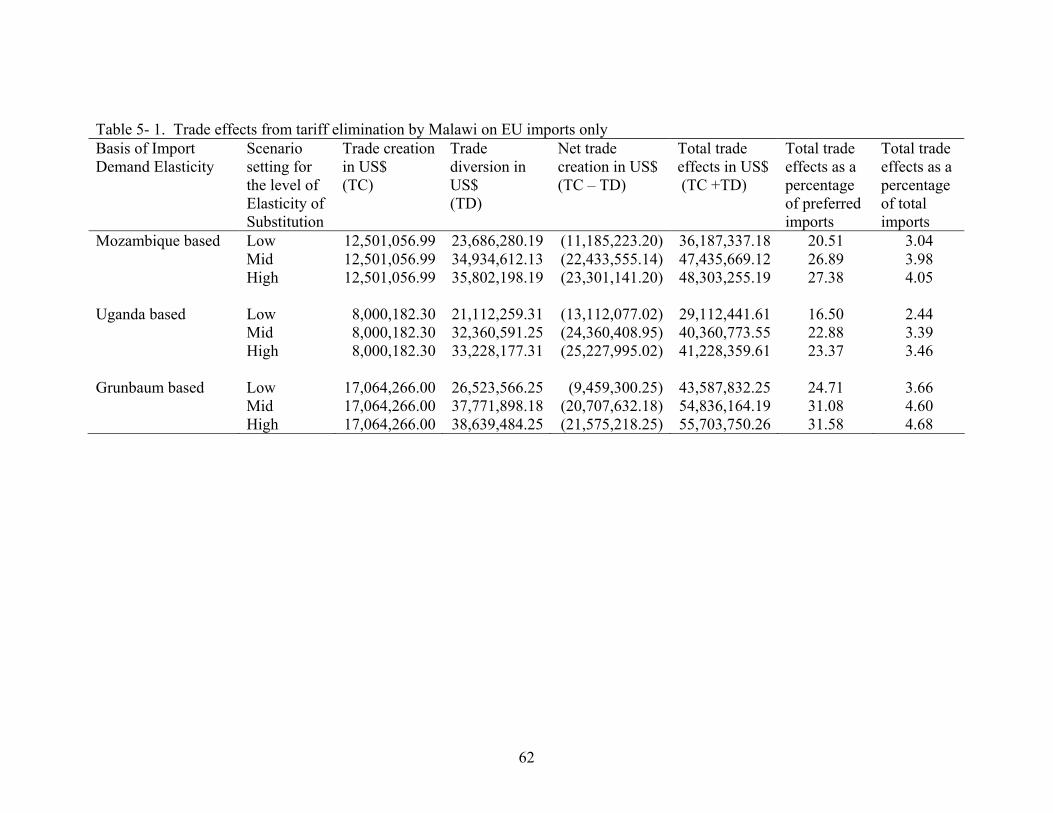
Table 5- 1. Trade effects from tariff elimination by Malawi on EU imports only Basis of Import Demand Elasticity
Scenario setting for the level of Elasticity of Substitution
Trade creation in US$ (TC)
Trade diversion in US$ (TD)
Net trade creation in US$ (TC – TD)
Total trade effects in US$ (TC +TD)
Total trade effects as a percentage of preferred imports
Total trade effects as a percentage of total imports
Mozambique based Low 12,501,056.99 23,686,280.19 (11,185,223.20) 36,187,337.18 20.51 3.04 Mid 12,501,056.99 34,934,612.13 (22,433,555.14) 47,435,669.12 26.89 3.98 High 12,501,056.99 35,802,198.19 (23,301,141.20) 48,303,255.19 27.38 4.05 Uganda based Low 8,000,182.30 21,112,259.31 (13,112,077.02) 29,112,441.61 16.50 2.44 Mid 8,000,182.30 32,360,591.25 (24,360,408.95) 40,360,773.55 22.88 3.39 High 8,000,182.30 33,228,177.31 (25,227,995.02) 41,228,359.61 23.37 3.46 Grunbaum based Low 17,064,266.00 26,523,566.25 (9,459,300.25) 43,587,832.25 24.71 3.66 Mid 17,064,266.00 37,771,898.18 (20,707,632.18) 54,836,164.19 31.08 4.60 High 17,064,266.00 38,639,484.25 (21,575,218.25) 55,703,750.26 31.58 4.68
62
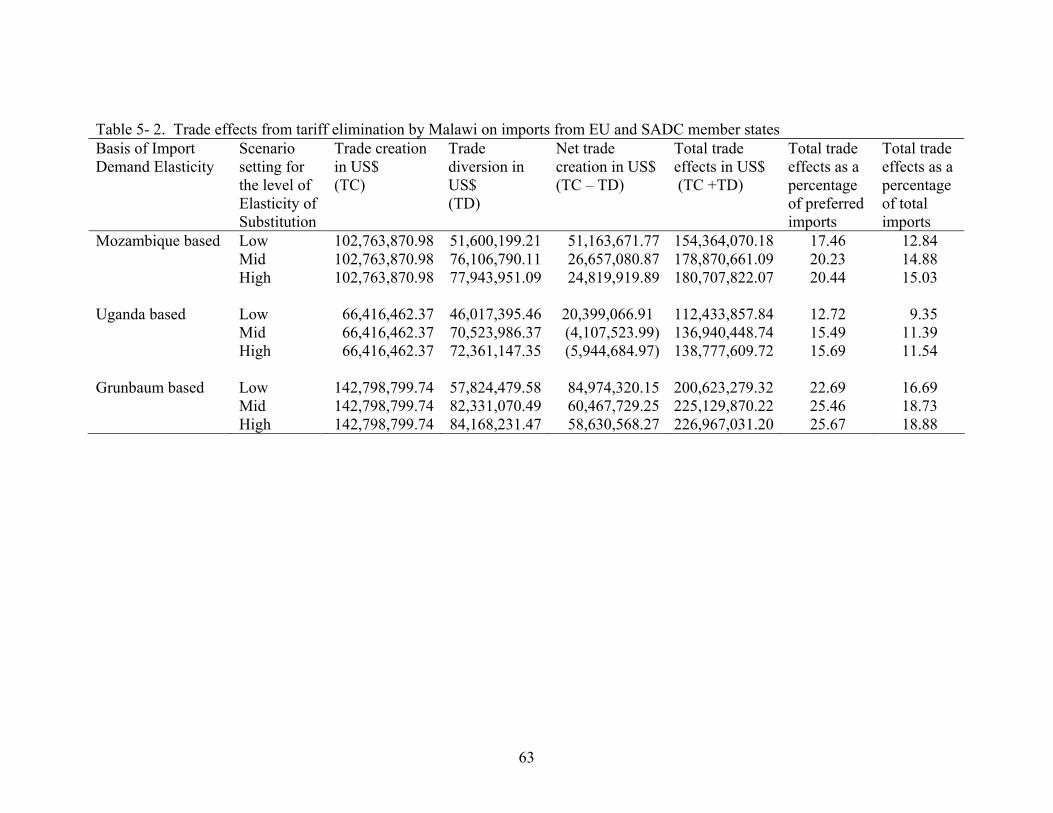
63
Table 5- 2. Trade effects from tariff elimination by Malawi on imports from EU and SADC member states Basis of Import Demand Elasticity
Scenario setting for the level of Elasticity of Substitution
Trade creation in US$ (TC)
Trade diversion in US$ (TD)
Net trade creation in US$ (TC – TD)
Total trade effects in US$ (TC +TD)
Total trade effects as a percentage of preferred imports
Total trade effects as a percentage of total imports
Mozambique based Low 102,763,870.98 51,600,199.21 51,163,671.77 154,364,070.18 17.46 12.84 Mid 102,763,870.98 76,106,790.11 26,657,080.87 178,870,661.09 20.23 14.88 High 102,763,870.98 77,943,951.09 24,819,919.89 180,707,822.07 20.44 15.03 Uganda based Low 66,416,462.37 46,017,395.46 20,399,066.91 112,433,857.84 12.72 9.35 Mid 66,416,462.37 70,523,986.37 (4,107,523.99) 136,940,448.74 15.49 11.39 High 66,416,462.37 72,361,147.35 (5,944,684.97) 138,777,609.72 15.69 11.54 Grunbaum based Low 142,798,799.74 57,824,479.58 84,974,320.15 200,623,279.32 22.69 16.69 Mid 142,798,799.74 82,331,070.49 60,467,729.25 225,129,870.22 25.46 18.73 High 142,798,799.74 84,168,231.47 58,630,568.27 226,967,031.20 25.67 18.88

would result in net welfare losses since trade diversion was greater in all scenarios than the
welfare improving trade creation values. Conversely, an EPA with the EU that is
implemented together with a FTA with the SADC region was seen to be welfare improving
in all but two cases of mid and high assumed elasticity values based on the Ugandan
figures as calculated by Vollmer and colleagues. The significant positive net trade creation
simulation results obtained under the second liberalization framework would lead to
increased overall welfare in Malawi.
Fiscal Impacts Table 5-3 below captures the contribution of trade taxes in general and import
duties in particular towards total government revenue in Malawi. As indicated, the
contribution of revenue from trade taxes towards total government revenue was about 36.6
percent, inclusive of grants and 40.2 percent excluding grants in the year 2006. During the
same year, import duties accounted for 11.2 percent and 12.5 percent of total government
revenue, including grants and excluding grants, respectively. As such, elimination of tariff
barriers on imports from the EU and/or EU and SADC at the same time is bound to have a
significant impact on government revenue.
Using equation 3-20 developed in chapter three above, fiscal impacts of the two
trade liberalization scenarios were calculated. It is important to point out that simulation
results in this study only quantified the direct and/or static levels of changes in ex-post
revenue as a result of lost revenues due to tariff elimination under the two scenarios. This
part of fiscal impact is clearly outlined as reported in Table 5-4 below. As indicated in
Table 5-4, loss of tariff revenue under the EPA arrangement with the EU alone is
significantly lower compared to the scenario that includes an FTA arrangement with
64

SADC. The revenue losses under the EU EPA were simulated to range from 11.2 percent to
12.1 percent of the baseline total tariff revenue. In terms of comparison to total government
revenue, the highest of these values was only 4.8 percent of total government revenue
excluding grants and 5.2 percent of total government revenue including grants for the
baseline year.
Table 5- 3. Baseline levels of import duties and impact on government revenue Total government revenue excluding grants (US$) 489,708,626.38Total government revenue including grants (US$) 537,861,346.35Total trade taxes levied 196,594,338.65Trade taxes as percentage of government revenue excluding grants 40.15Trade taxes as percentage of government revenue including grants 36.55Total import duties levied (US$) 61,299,189.69Import duties as percentage of government revenue excluding grants 12.52Import duties as percentage of government revenue including grants 11.19
The fiscal impact results tend to increase substantially when the SADC FTA
arrangement is included in the liberalization framework, with percentage reductions of up
to 30.5 percent of total revenue during the baseline year. The fact that imports from SADC
form about half of the total imports for the country helps to explain these drastic changes in
revenue.
It is important to point out that trade creation brings with it other revenue in form of
other trade taxes that are not affected by the tariff elimination policy. Considering the large
values of trade creation under the EU plus SADC FTA tier as described above, one would
expect to get extra revenue that would work towards offsetting the static figures reported
above. As such, the total changes in end-period levels of revenue would be significantly
lower than those reported in Table 5-4 above because of the extra revenue expected from
other trade taxes.
65

Table 5- 4. Summary of static fiscal impacts Elasticity scenario setting
Tariff elimination to EU imports only
Tariff elimination to EU and SADC imports
Change (US$) in tariff revenue
As a percent of baseline level
Change (US$) in tariff revenue
As a percent of baseline level
Mid Mozambique - 24,610,959.11 - 11.6 - 161,921,417.70 - 30.1 Mid Uganda - 23,748,488.89 - 11.2 - 159,549,735.08 - 29.7 Mid Grunbaum - 25,624,080.19 - 12.1 - 164,123,067.17 - 30.5
Commodities Most Affected by the Contemplated Changes in Trade Policy
One of the major advantages of the Partial Equilibrium Model for simulating the
likely trade effects and fiscal impacts of an EPA and/or an FTA using highly disaggregated
data such as the HS-eight digit utilized in this study is that it allows identification of
commodity categories most affected by the contemplated trade policy change. Knowledge
of such information would be crucial for those engaged in trade negotiations as it would
provide necessary guidance on which product categories are more sensitive to warrant
special treatment during implementation of the EPA framework. In this study, an effort was
made to capture the simulated trade and tariff effects at each individual tariff line along
with their associated HS-code and descriptions. The results column was thereafter sorted a
descending order to identify those product categories most affected by the contemplated
trade policy changes. This permitted us to isolated twenty commodity categories most
affected by the policy change under the two liberalization scenarios were identified. Tables
A-1 through A-4 in Appendix A present results of these commodity categories along with
their simulated values for trade effects and tariff revenue changes.
Table A-1 and Table A-2 present lists of the most sensitive commodities to an
impending EPA with the EU by Malawi in terms of the trade effects and fiscal impacts,
respectively. As indicated, simulation results demonstrated that some of the most sensitive
66

products include the following; clothing materials, four-wheel drive motor vehicles, solid
milk and cream products, various iron sheet materials, electrical appliances and telephony
and telegraphic apparatus. The tables further detail the associated values of estimated trade
effects (Table A-1) and those for the estimated changes in tariff revenue (Table A-2). It is
important to note that most of the commodities that were found to have high trade effects
levels were also identified to have high absolute tariff revenue changes.
The other two tables, Table A-3 and Table A-4 present the same information as the
one in Tables A-1 and Table A-2 but for the second liberalization scenario that includes a
FTA with the rest of the SADC member states. Under this second scenario, some of the
product categories with highest trade effects include; distillates and other fuels, four wheel
drive motor vehicles, rubber tires used on busses and lorries, worn clothing materials, flat-
rolled iron and steel products, crude soybean oil, cement clinkers and tobacco cigarettes.
Associated values of trade effects are detailed in the tables.
Three Earmarked Agricultural Products
One of the major objectives of this study was to look at the trade effects and fiscal
impacts of the EPA with EU on key agricultural commodities. The three agricultural
products of tobacco, tea and sugar were earmarked for such a close evaluation of the extent
to which trade policy change affects their ex-post trade flow levels and tariff revenues.
Table 5-5 presents the impact of an EPA with EU on tea, sugar and tobacco trade flows and
tariff revenue contributions. Table 5-6 presents the same information for a broader
liberalization scenario that includes the SADC FTA. For each liberalization scenario, all
the disaggregated trade and fiscal effects at every individual tariff line relating to each one
of the three targeted agricultural products were isolated and aggregated into a product total
effect as captured in Table 5-5 below. These simulations utilized the same elasticities that
67
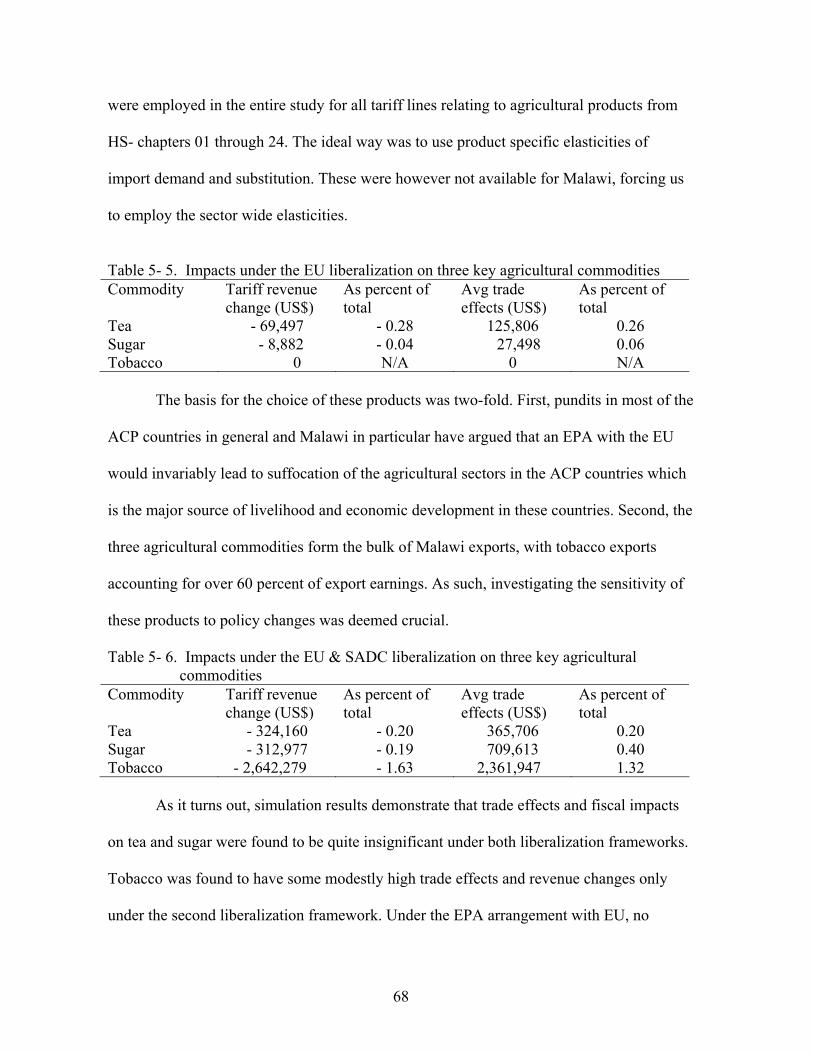
were employed in the entire study for all tariff lines relating to agricultural products from
HS- chapters 01 through 24. The ideal way was to use product specific elasticities of
import demand and substitution. These were however not available for Malawi, forcing us
to employ the sector wide elasticities.
Table 5- 5. Impacts under the EU liberalization on three key agricultural commodities Commodity Tariff revenue
change (US$) As percent of total
Avg trade effects (US$)
As percent of total
Tea - 69,497 - 0.28 125,806 0.26 Sugar - 8,882 - 0.04 27,498 0.06 Tobacco 0 N/A 0 N/A
The basis for the choice of these products was two-fold. First, pundits in most of the
ACP countries in general and Malawi in particular have argued that an EPA with the EU
would invariably lead to suffocation of the agricultural sectors in the ACP countries which
is the major source of livelihood and economic development in these countries. Second, the
three agricultural commodities form the bulk of Malawi exports, with tobacco exports
accounting for over 60 percent of export earnings. As such, investigating the sensitivity of
these products to policy changes was deemed crucial.
Table 5- 6. Impacts under the EU & SADC liberalization on three key agricultural commodities
Commodity Tariff revenue change (US$)
As percent of total
Avg trade effects (US$)
As percent of total
Tea - 324,160 - 0.20 365,706 0.20 Sugar - 312,977 - 0.19 709,613 0.40 Tobacco - 2,642,279 - 1.63 2,361,947 1.32
As it turns out, simulation results demonstrate that trade effects and fiscal impacts
on tea and sugar were found to be quite insignificant under both liberalization frameworks.
Tobacco was found to have some modestly high trade effects and revenue changes only
under the second liberalization framework. Under the EPA arrangement with EU, no
68

69
effects were found. Zero effects were estimated under the EPA arrangement because all of
the tobacco imports into Malawi come from non-EU countries of Mozambique, Zimbabwe,
Zambia, Kenya, Mauritius and the United Arab Emirates.
The empirical results presented above do not support the long-standing fear among
policy makers and trade specialists in ACP countries that an EPA with the EU is bound to
stifle the local agricultural sector with an influx of cheap EU competing agricultural
imports. In fact, of the twenty commodities identified to be most affected by the EU EPA,
only the two product categories of milk and cream in solid form (both HS 04021000 and
HS 04022100) were part of the list, being projected to increase in ex-post imports from the
EU by 2.7 and 2.3 percent, respectively, vis-à-vis baseline levels. Under the EPA plus
SADC FTA framework, crude soybean oil (HS-15071000), milk and cream in solid form
(HS 04022100), crude palm oil (HS-15111000) were the only agricultural products within
the list of most affected product categories in terms of projected increases in imports.
CHAPTER 6 SUMMARY AND CONCLUSIONS
Summary
Malawi has been party to the EU-ACP trade agreements since the first Lomé
Agreement in 1975. Meanwhile, these ACP countries are expected to implement the 2000
Cotonou Agreement that calls for migration away from the non-reciprocal trading
framework to a reciprocal trading arrangement between the two parties. As such, Malawi
along with other ACP group of countries is expected to liberalize their trade through
elimination of tariffs on EU imports. This has spurred concerns among ACP countries who
fear that such an arrangement will subject domestic producers to unfair competition from
the highly subsidized agricultural imports from the EU for instance. As such, it is generally
feared that these changes may bring about increased unemployment, provoke heightened
economic insecurity and political instability. In most cases, these fears have not been
substantiated with empirical evidence as very limited empirical country-specific studies
have so far been done to quantify the potential effects.
It is on the basis of the foregoing that the major objective of this research was to
conduct a quantitative analysis of the likely trade effects and fiscal impacts of an EPA trade
arrangement regime with Malawi. It was deemed crucial to quantify potential levels of
trade creation, trade diversion and fiscal impacts to the country emanating from an EPA
with the EU. Ancillary to this effort was the need to explore alternative trade policy
arrangements, particularly the broadening of the liberalization framework. We further
undertook to identify those commodities that would be most affected by the contemplated
policy changes in trade.
70
In order to enrich our basis for the empirical study, an extensive survey of the
requisite literature on the theoretical and empirical works related to the subject matter was
conducted. It was noted that classical trade theory argues for a positive correlation between
free trade policy and increased economic growth and development through direct dynamic
advantages of increased capacity utilization and more efficient investment projects as well
as indirect effects of accelerated export growth. It was observed however that other
researchers object to the classical perspective and argue that empirical evidence does not
strongly support such a view. These researchers also question the validity of the direction
of the casual relationship between export growth and economic development as purported
by the classical theorists. In spite of the arguments and counter-arguments among
researchers on the existence and/or strength of the direct link between open trade and
positive economic development, it was observed that open trade does bring with it elements
that spur competition among producers and imposes rationality in productive resource
allocation, thereby increasing economic growth and development. On the other hand
however, unambiguous evidence of poor economic performance in closed regimes was
observed and noted.
The evolution of the notion of preferential trading agreements was noted to have
emanated from the frustration during the 1990s by many countries to attain multilateral free
trade. As such, countries started configuring themselves into regional groupings to pursue
regional free trade policies. This influenced economists, led by Jacob Viner (1950) to start
studying and laying the earliest basis on the theory of regional free trade agreements. Viner
(1950) observed that welfare effects from any form of regional economic integration are
not unambiguous a priori. He further developed the concepts of trade creation and trade
71
diversion associated with the formation of free trade areas. In this study, these two concepts
were central to the analyses and conclusions to be made. Viner’s work spurred a lot of
theoretical as well as empirical work on the study of free trade areas.
Literature identifies three major quantitative analytical techniques that researchers
employ to conduct empirical analyses of the effects of entering some form of an economic
integration by countries. These include the gravity models, computable general equilibrium
(CGE) models and the partial equilibrium (PE) models. Strengths and weaknesses for each
one of these models were highlighted. This thesis utilized the Verdoorn (1960) version of
the PE model to quantify the trade effects and fiscal impacts of the EU EPA with Malawi.
Central to the fears among developing countries to enter into free trade regimes are
the fiscal implications of such policies. Most of these countries fear that through
elimination of import tariffs, the government would experience huge revenue losses and
compromise the delivery of vital services to the populace. Consideration of several short
term policy migration costs to the local economies such as increased unemployment,
reduction in national output, elimination of certain domestic industries and possible
macroeconomic instability was observed to have exacerbated these fears. Research into
this aspect has been centered on two themes, including the evaluation of the relative
importance of tariff revenue with respect to total government revenue and exploration of
the fiscal reforms and alternative tax schemes that could offset tariff revenue losses.
Conclusions
The Verdoorn (1960) version of the partial equilibrium models was employed to
estimate and evaluate the trade effects and fiscal impacts of an EU EPA on the Malawi
economy. This model is based on an array of rather restrictive assumptions such as the
Armington assumption of product differentiation, and those applicable to most partial
72
equilibrium analyses including; non-existence of repercussions on the incomes and
exchange rates from changes in trade flows; existence of iso-elastic import demand
elasticities; and infinite supply elasticities. Notwithstanding these restrictive assumptions, it
was noted that this model has been extensively applied in similar works by various
researchers and academicians alike. In this study, highly disaggregated trade data at HS-
eight digit were utilized to conduct the analyses.
The major conclusion that was drawn from this study is that Malawi stands to
benefit more from trade if a broader liberalization framework is adopted along with the
EPA enforcement. As reported above, trade liberalization of tariffs towards EU and SADC
result in significantly high positive net trade creation levels for all but two elasticity values.
On the other hand, liberalization that is restricted to EU imports results in negative net
trade creation values. This conclusion stands firm even when one considers the major
weakness of this study, namely; that the values of elasticities employed were quite
arbitrary. This is the case because even as we varied the magnitude of the elasticity values,
a broader liberalization framework resulted in higher positive levels of net trade creation
values as compared to the negative net trade creation values obtained under the
liberalization framework restricted to the EU EPA. The breadth of liberalization need not
necessarily be restricted to EU and SADC countries. There are increasingly high levels of
imports from the eastern countries of Japan, China and India. Inclusion of these countries
in the tariff liberalization framework is bound to result in increased values of trade creation.
While not supporting the conventional fears about trade liberalization in most of the
developing world, the results from this research do conform to the theoretical arguments
for broader liberalization even for small countries like Malawi.
73

Similar results were obtained by Grunbaum (2007) who found that when
liberalization by the Organization of Eastern Caribbean States (OECS) with the EU alone
was considered, trade diversion exceeded trade creation in all cases and overall trade
effects and fiscal impacts were very small. When the larger Caribbean, the North American
Free Trade Area (NAFTA), and the Free Trade Area of the Americas (FTAA) were all
included in the liberalization framework, net trade effects were positive and larger, as were
the fiscal impacts.
Our results also agree with those obtained by Keck and Piermartini (2005) who
used an applied general equilibrium model covering 15 regions and 9 sectors to simulate
the impact of signing EPAs with the EU for the SADC countries under various
liberalization scenarios. The results demonstrated that EPAs with the EU were welfare-
enhancing for SADC overall, and that for most countries, further gains could arise from
intra-SADC liberalization.
Greenway and Milner (2003) also found comparable results when they analyzed the
impact of EPA formation for CARICOM countries. Employing two-digit level of data
aggregation, Greenway and Milner (2003) contemplated three liberalization frameworks in
their study including the one restricted to the EU, the second combining the EU and the
United States and the last one being full multilateral liberalization. Their results concluded
that the EPA formation with the EU resulted into net welfare losses by the CARICOM
countries involved where as the one under the last two scenarios resulted in positive
welfare gains with the full multilateral liberalization resulting in the highest welfare gains.
The other major conclusion of this study is with respect to the effects of EPA
formation on the domestic agricultural sector, mostly the fear of an influx of cheap EU
74

imports. Against these conventional fears, results from this research demonstrate that very
minimal effects on agricultural imports from the EU would be felt, save for imports of milk
and cream in solid form. There were particularly no major effects on imports of tea, sugar
and tobacco, which are currently the major agricultural export commodities for Malawi.
The fiscal impacts from trade liberalization do seem be significant if considered in
isolation. However, the simulation results only capture static effects at 100 percent tariff
elimination scenario. With the high positive trade creation values obtained from the
simulation results, one would expect a significant offsetting effect if dynamic effects of
extra revenue from increased trade are included. Besides, policy makers may consider
exploring other tax systems that will help to broaden the country’s tax base. In fact this
subject has been at the centre of discussions within the country, considering the high levels
of dependence on trade taxes for government revenue under the current system.
This research has laid down a very useful foundation into research on trade effects
and fiscal impacts of trade liberalization at a country specific level that employs
disaggregated data at the level utilized herein. Until this work, we do not know of any
effort directed towards empirical quantification of such effects in the country. The results
from this thesis will provide useful guidance to the on-going debate with respect to the pros
and cons of the EU-EPA formation. The identification of products most affected by the
policy change will exonerate fears of unfair competition from EU agricultural imports
while alerting those engaged in the most affected products to explore remedial measures.
Study Weaknesses and Suggestions for Further Research
One of the major weaknesses of the Partial Equilibrium models and particularly the
one carried over into this thesis is with respect to the choice of elasticities of import
demand and substitution. These are very crucial variables in the Verdoorn (1960) model
75

and yet were strong assumptions were made in the process of determining their values
since they were not available at any disaggregated level. The values chosen were quite
reasonable considering that most of the previous researchers have not employed similarly
adapted values. Nonetheless, the ideal scenario is to use the study data to estimate elasticity
values at the same level of data aggregation, preferably every tariff line or HS chapter
applicable. Through this rigorous process one would get empirically deduced product
specific elasticity values to employ in the analysis of trade and fiscal effects of any form of
trade liberalization that might be contemplated. Notwithstanding its enormous financial and
technical demands, such research is highly recommended for Malawi as the results from
the same would help solidify the foundation laid in this research. In particular, the levels of
trade and fiscal effects simulated for each product category such as those relating to the
three agricultural products of tea, sugar and tobacco reported above would be much more
realistic if one employs such product specific elasticities. In terms of data availability, the
country’s National Statistical Office has made significant strides in building requisite
databases. It would also be important to build in these studies an aspect of dynamic effects
of liberalization by way of employing the computable general equilibrium models, which
would take into account economy-wide repercussions of the policy shift and adjust the
trade and fiscal effects accordingly.
76
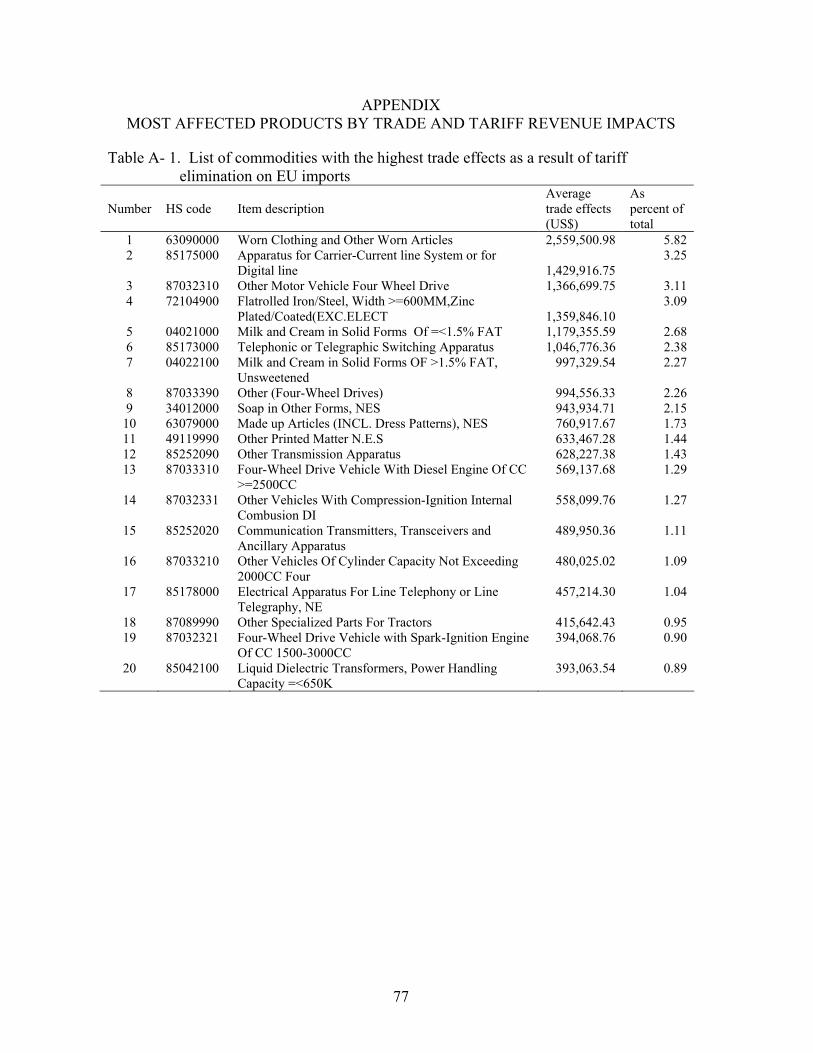
APPENDIX MOST AFFECTED PRODUCTS BY TRADE AND TARIFF REVENUE IMPACTS
Table A- 1. List of commodities with the highest trade effects as a result of tariff elimination on EU imports
Number
HS code
Item description
Average trade effects (US$)
As percent of total
1 63090000 Worn Clothing and Other Worn Articles 2,559,500.98 5.82 2 85175000 Apparatus for Carrier-Current line System or for
Digital line
1,429,916.75 3.25
3 87032310 Other Motor Vehicle Four Wheel Drive 1,366,699.75 3.11 4 72104900 Flatrolled Iron/Steel, Width >=600MM,Zinc
Plated/Coated(EXC.ELECT
1,359,846.10 3.09
5 04021000 Milk and Cream in Solid Forms Of =<1.5% FAT 1,179,355.59 2.68 6 85173000 Telephonic or Telegraphic Switching Apparatus 1,046,776.36 2.38 7 04022100 Milk and Cream in Solid Forms OF >1.5% FAT,
Unsweetened 997,329.54 2.27
8 87033390 Other (Four-Wheel Drives) 994,556.33 2.26 9 34012000 Soap in Other Forms, NES 943,934.71 2.15
10 63079000 Made up Articles (INCL. Dress Patterns), NES 760,917.67 1.73 11 49119990 Other Printed Matter N.E.S 633,467.28 1.44 12 85252090 Other Transmission Apparatus 628,227.38 1.43 13 87033310 Four-Wheel Drive Vehicle With Diesel Engine Of CC
>=2500CC 569,137.68 1.29
14 87032331 Other Vehicles With Compression-Ignition Internal Combusion DI
558,099.76 1.27
15 85252020 Communication Transmitters, Transceivers and Ancillary Apparatus
489,950.36 1.11
16 87033210 Other Vehicles Of Cylinder Capacity Not Exceeding 2000CC Four
480,025.02 1.09
17 85178000 Electrical Apparatus For Line Telephony or Line Telegraphy, NE
457,214.30 1.04
18 87089990 Other Specialized Parts For Tractors 415,642.43 0.95 19 87032321 Four-Wheel Drive Vehicle with Spark-Ignition Engine
Of CC 1500-3000CC 394,068.76 0.90
20 85042100 Liquid Dielectric Transformers, Power Handling Capacity =<650K
393,063.54 0.89
77
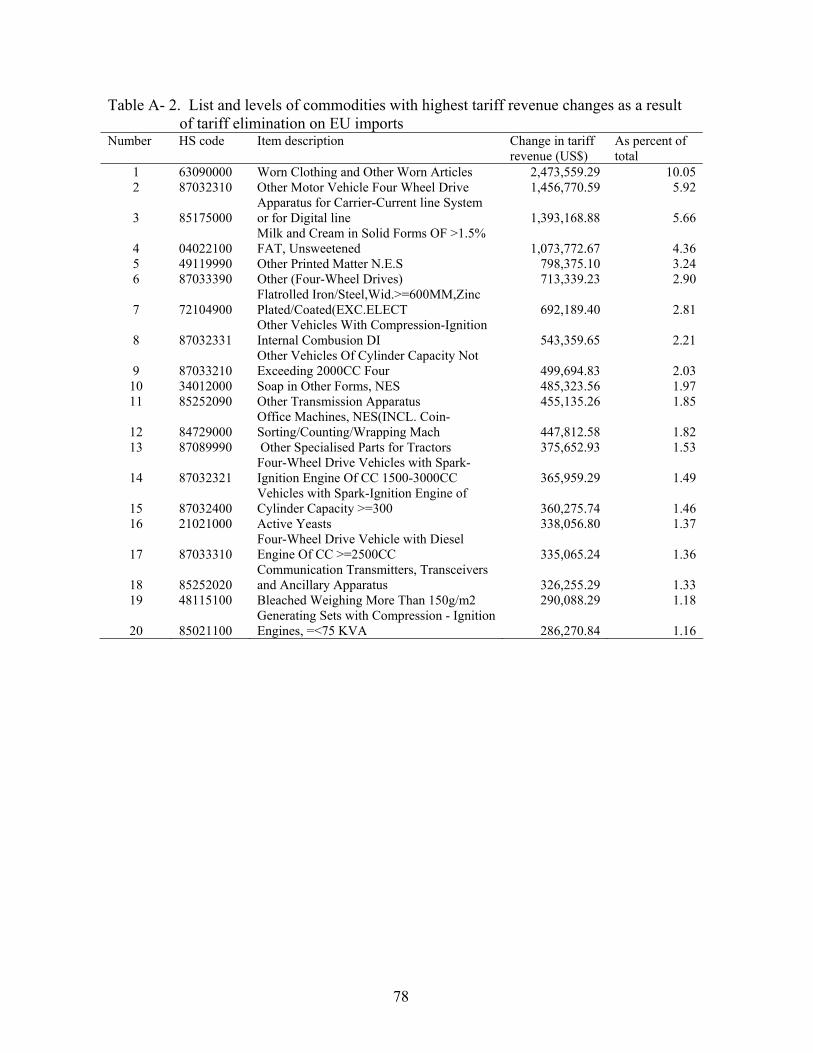
Table A- 2. List and levels of commodities with highest tariff revenue changes as a result of tariff elimination on EU imports
Number HS code Item description Change in tariff revenue (US$)
As percent of total
1 63090000 Worn Clothing and Other Worn Articles 2,473,559.29 10.05 2 87032310 Other Motor Vehicle Four Wheel Drive 1,456,770.59 5.92
3 85175000 Apparatus for Carrier-Current line System or for Digital line 1,393,168.88 5.66
4 04022100 Milk and Cream in Solid Forms OF >1.5% FAT, Unsweetened 1,073,772.67 4.36
5 49119990 Other Printed Matter N.E.S 798,375.10 3.24 6 87033390 Other (Four-Wheel Drives) 713,339.23 2.90
7 72104900 Flatrolled Iron/Steel,Wid.>=600MM,Zinc Plated/Coated(EXC.ELECT 692,189.40 2.81
8 87032331 Other Vehicles With Compression-Ignition Internal Combusion DI 543,359.65 2.21
9 87033210 Other Vehicles Of Cylinder Capacity Not Exceeding 2000CC Four 499,694.83 2.03
10 34012000 Soap in Other Forms, NES 485,323.56 1.97 11 85252090 Other Transmission Apparatus 455,135.26 1.85
12 84729000 Office Machines, NES(INCL. Coin-Sorting/Counting/Wrapping Mach 447,812.58 1.82
13 87089990 Other Specialised Parts for Tractors 375,652.93 1.53
14 87032321 Four-Wheel Drive Vehicles with Spark-Ignition Engine Of CC 1500-3000CC 365,959.29 1.49
15 87032400 Vehicles with Spark-Ignition Engine of Cylinder Capacity >=300 360,275.74 1.46
16 21021000 Active Yeasts 338,056.80 1.37
17 87033310 Four-Wheel Drive Vehicle with Diesel Engine Of CC >=2500CC 335,065.24 1.36
18 85252020 Communication Transmitters, Transceivers and Ancillary Apparatus 326,255.29 1.33
19 48115100 Bleached Weighing More Than 150g/m2 290,088.29 1.18
20 85021100 Generating Sets with Compression - Ignition Engines, =<75 KVA 286,270.84 1.16
78

Table A- 3. List of commodities with the highest trade effects as a result of tariff elimination on imports from EU & SADC countires
Number
HS code
Item description
Average trade effects (US$)
As percent of total
1 27101199 Distillates and other fuels nes(including diesel oils,gas oil
19,329,820.98 11.28
2 87033310 Four-Wheel Drive Vehicles with Diesel Engine Of CC >=2500CC
5,138,646.05 3.00
3 40112000 New Pneumatic Tyres, Of Rubber Of a Kind Used on Buses or Lorries
4,024,071.99 2.35
4 63090000 Worn Clothing and Other Worn Articles 3,654,699.51 2.13 5 72104900 Flatrolled Iron/Steel, WID.>=600MM,Zinc
Plated/Coated(EXC.ELECT 3,320,894.25 1.94
6 87032310 Other Motor Vehicles Four Wheel Drive 3,317,019.91 1.94 7 87033210 Other Vehicles Of Cylinder Capacity Not
Exceeding 2000CC FOUR 3,219,850.34 1.88
8 15071000 Crude Soya-Bean Oil 2,984,694.08 1.74 9 25231000 Cement Clinkers 2,274,888.34 1.33
10 87042110 GVW Not Exceeding 2.99 Tonnes 2,241,255.55 1.31 11 27101919 Gases and Lubricating Oils 2,126,549.46 1.24 12 39011000 Polyethylene Having a Specific Gravity
<0.94, In Primary Forms 2,066,537.93 1.21
13 24022000 Cigarettes Containing Tobacco 1,928,517.27 1.13 14 34012000 Soap In Other Forms, NES 1,728,086.55 1.01 15 04022100 Milk and Cream in Solid Forms Of >1.5%
FAT, Unsweetened 1,712,645.59 1.00
16 85252090 Other Transmission Apparatus 1,662,007.39 0.97 17 15111000 Crude Palm Oil 1,650,016.29 0.96 18 87029020 Other Motor Vehicles for the Transport of
Ten or More Persons 1,644,461.20 0.96
19 85175000 Apparatus for Carrier-Current Line Systems or For Digital Line
1,598,042.62 0.93
20 87033390 Other (Four-Wheel Drives) 1,426,783.77 0.83
79
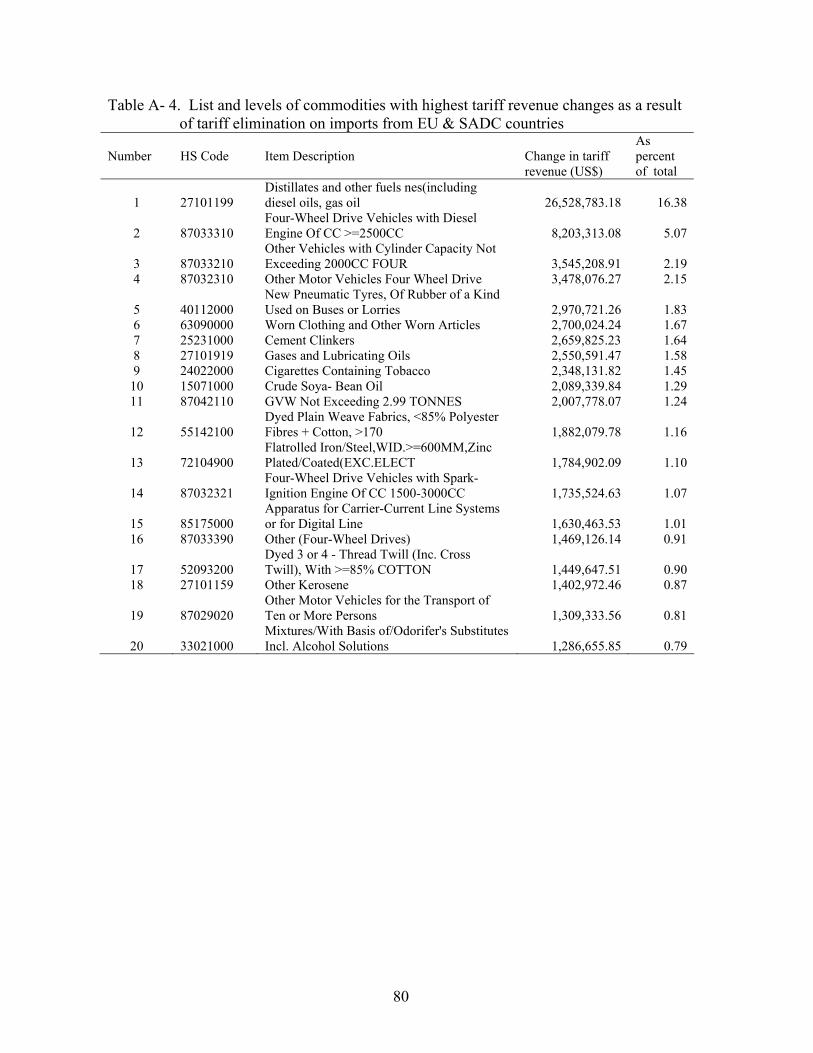
80
Table A- 4. List and levels of commodities with highest tariff revenue changes as a result of tariff elimination on imports from EU & SADC countries
Number
HS Code
Item Description Change in tariff
revenue (US$)
As percent of total
1 27101199 Distillates and other fuels nes(including diesel oils, gas oil 26,528,783.18 16.38
2 87033310 Four-Wheel Drive Vehicles with Diesel Engine Of CC >=2500CC 8,203,313.08 5.07
3 87033210 Other Vehicles with Cylinder Capacity Not Exceeding 2000CC FOUR 3,545,208.91 2.19
4 87032310 Other Motor Vehicles Four Wheel Drive 3,478,076.27 2.15
5 40112000 New Pneumatic Tyres, Of Rubber of a Kind Used on Buses or Lorries 2,970,721.26 1.83
6 63090000 Worn Clothing and Other Worn Articles 2,700,024.24 1.67 7 25231000 Cement Clinkers 2,659,825.23 1.64 8 27101919 Gases and Lubricating Oils 2,550,591.47 1.58 9 24022000 Cigarettes Containing Tobacco 2,348,131.82 1.45
10 15071000 Crude Soya- Bean Oil 2,089,339.84 1.29 11 87042110 GVW Not Exceeding 2.99 TONNES 2,007,778.07 1.24
12 55142100 Dyed Plain Weave Fabrics, <85% Polyester Fibres + Cotton, >170 1,882,079.78 1.16
13 72104900 Flatrolled Iron/Steel,WID.>=600MM,Zinc Plated/Coated(EXC.ELECT 1,784,902.09 1.10
14 87032321 Four-Wheel Drive Vehicles with Spark-Ignition Engine Of CC 1500-3000CC 1,735,524.63 1.07
15 85175000 Apparatus for Carrier-Current Line Systems or for Digital Line 1,630,463.53 1.01
16 87033390 Other (Four-Wheel Drives) 1,469,126.14 0.91
17 52093200 Dyed 3 or 4 - Thread Twill (Inc. Cross Twill), With >=85% COTTON 1,449,647.51 0.90
18 27101159 Other Kerosene 1,402,972.46 0.87
19 87029020 Other Motor Vehicles for the Transport of Ten or More Persons 1,309,333.56 0.81
20 33021000 Mixtures/With Basis of/Odorifer's Substitutes Incl. Alcohol Solutions 1,286,655.85 0.79
LIST OF REREFENCES
Andriamananjala, S; P. Brenton; J.E. Von Uexküll and P. Walkenhorst. 2009. Assessing the Economic Impacts of an Economic Partnership Agreement on Nigeria. World Bank African Region Policy Research Working Paper, Washington, D.C.
Balassa, B. 1971. The structure of protection in developing countries. Baltimore, MD: Johns Hopkins University Press.
1982. Development strategies in semi-industrial economies. NY and London: Oxford University Press.
Baldwin, R.E. and T. Murray. 1977. "MFN Tariff Reductions and Developing Country Trade Benefits Under the GSP." The Economic Journal 87(345):30-46.
Berg, A. and A. Krueger. 2003. "Trade, Growth, and Poverty: A Selective Survey." IMF Working Paper no. 03/30, International Monetary Fund, Washington, D.C.
Bhagwati, J. 1978. Anatomy and consequences of exchange control regimes. Cambridge, MA: NBER.
Bhagwati, J. and A. Panagariya. 1996. “Preferential Trading Areas and Multilateralism-Strangers Friends, or Foes?” In J. Bhagwati and A. Panagariya,.eds. The Economics of Preferential Trade Agreements. Washington D.C: American Enterprise Institute, pp.1-78.
1999. “Preferential Trading Areas and Multilateralism-Strangers, Friends or Foes?” In J. N. Bhagwati, et al., eds. Trading Blocs: Alternative Approaches to Analyzing Preferential Trading Arrangements. Cambridge, Massachusetts, MIT Press.
Busse, M; A. Borrmann and H. Grossmann. 2004. The Impact of ACP/EU Economic Partnership Agreement on ECOWAS Countries: An Empirical Analysis of the Trade and Budget Effects. Study Final Report to the Hamburg Institute of International Economics; Hamburg, Germany.
Cooper, C.A. and B.F. Massell. 1965a. "A New Look at Customs Union Theory." Economic Journal 75(300):742-747.
. 1965b. "Toward a General Theory of Customs Unions for Developing Countries." Journal of Political Economy 73(5):461-476.
Corden, W.M. 1972. "Economies of Scale and Customs Unions Theory." Journal of Political Economy 80(3, Part 1):465-75.
Dee P. and J. Gali. 2003. “The Trade and Investment Effects of Preferential Trading Agreements” NBER Working Paper No. 10160.
81

Development Policy Research Unit of the University of Cape Town. 2001. What are the potential benefits and pitfalls of a free trade area in the Southern African region? DPRU Policy Brief No. 01/P8. Cape Town, South Africa
Dollar, D. 1992. "Outward-Oriented Developing Economies Really Do Grow More Rapidly: Evidence form 95 LDCs, 1976-1985." Economic Development and Cultural Change 40(3):523-544.
Edwards, S. 1993. "Openness, Trade Liberalization, and Growth in Developing Countries." Journal of Economic Literature 31(3):1358-1393. Web accessed: http://www.jstor.org/stable/2728244. June, 26th 2009.
El-Agraa, A.M. 1997. Economic integration worldwide. New York, St. Martin's Press.
Europe Website. 2001 Development and Relations with African, Caribbean and Pacific States; (Accessed in July, 2009) http://ec.europa.eu/development/geographical/cotonou/cotonou20001_en.cfm
Frankel, J.A. and D. Romer. 1999. "Does Trade Cause Growth?" The American Economic Review 89(3):379-399.
Frankel, J. A. 1997. Regional Trading Blocs, Washington, D. C.: Institute for International Economics.
Gordon, M.G. 2007. Impact of the CARICOM Economic Integration Arrangements on the Economic Gains of Selected CARICOM Countries. PhD dissertation Report
Greenway, D. and C. Milner. 2003. “A Grim REPA?” Research Paper No.2003/30, Leverhulme Centre on Globalization and Economic Policy, University of Nottingham.
Grunbaum, Max. 2007. “Evaluation of Trade and Tariff Revenue Effects for the Organization of Eastern Caribbean States under Alternative Trade Liberalization Scenarios”. PhD dissertation Report.
Harrison, A. 1996. "Openness and Growth: A Times-Series, Cross-Country Analysis for Developing Countries." Journal of Development Economics 48:419-447.
Head, K. 2003. “Gravity for Beginners.” Faculty of Commerce, University of British Columbia. http://www.econ.ubc.ca/nmalhotra/490/Articles/KHead20on%20gravity.pdf. July 6th, 2008.
Johnson, H.G. 1960. "The Economic Theory of Customs Union." Pakistan Economic Journal X(1):14-32.
Keck, A. and R. Piermartini. 2005. The Economic Impact of EPAs in SADC Countries. WTO, Economic Research and Statistics Division Working Paper, Geneva, Switzerland
82

Kerkala, L., J. Niemi, and R. Vaittinen. 2000. “Renegotiating the Lomé Convention-Trade Policy Schemes and Their Effects for African Regions.” Helsinski School of Economics and Business Administration.
Khattry, B. and J. M. Rao. 2002. "Fiscal Faux pas?: An Analysis of the Revenue Implications of Trade Liberalization." World Development 30(8):1431-1444.
Krueger, A.O. 1978. Foreign trade regimes and economic development: Liberalization attempts and consequences. Cambridge, MA: NBER.
Lal, D. and S. Rajapatirana. 1987. "Foreign Trade Regimes and Economic Growth in Developing Countries," World Bank Res. Observer, July 1987, 2(2), pp. 189-217.
Little, I., T. Scitovsky, and M. Scott. 1970. Industry and trade in some developing countries. London & NY. Oxford University Press for OECD.
Lipsey, R.G. 1960. "The Theory of Customs Unions: A General Survey. In R. Pomfret ed. Economic Analysis of Regional Trading Arrangements. Massachusetts: Edward Elgar Publishing Ltd.
Malawi Government. 2008. Annual Economic Report 2008: Government Printer, Lilongwe, Malawi
Meade, J.E. 1955. The Theory of Customs Unions. Amsterdam: North-Holland.
Michaely, M., D. Papageorgiou, and A. Choksi. 1991. “Liberalizing foreign trade: Lessons of experience in the developing world”. Vol. 7. Oxford and Cambridge, MA: Basil Blackwell.
Mundell, R.A. 1964. "Tariff Preferences and the Terms of Trade." Manchester School of Economic and Social Studies XXXII(1): 1-13.
Nilson, L. 2002. "Trading Relations: Is the Roadmap form Lome to Cotonou Correct?" AppliedEconomics 34(4):439-453.
Partnership Agreement Between the Members of the African, Caribbean and Pacific Group of States of the one Part, and the European Community and its Member States, of the Other Part, Signed in Cotonou, Benin on 23rd June, 2000. http://www.acpsec.org/en/conventions/cotonou/accord1.htm
Piermartini, R. and R. Teh 2005. Demystifying Modelling Methods for Trade Policy. Discussion Paper no. 10, World Trade Organization, Geneva.
Pomfret, R. 2003. Economic Analysis of Regional Trading Arrangements. Massachusetts: Edward Elgar Publishing Ltd.
Robson, P. 1980. The Economics of International Integration. London: George Allen & Unwin.
83

84
Rodriguez, F. and D. Rodrik 2000. “Trade Policy and Economic Growth: A Skeptic's Guide to Cross-National Evidence. In B. Bernanke and K. Rogoff. eds. Macroeconomics Annual 2000. Cambridge, MA, NBER. pp.261-325.
Sachs, J.D., A. Warner, A. Aslund and S. Fischer. 1995. "Economic Reform and the Process of Global Integration." Brookings Papers on Economic Activity 1995(1):1-118.
Sawyer, W.C. and R.L. Sprinkle 1989. "Alternative Empirical Estimates of Trade Creation and Trade Diversion: A Comparison of the Baldwin-Murray and Verdoorn Models." Weltwirtschaftliches Archiv 126:61-73.
Soloaga, I. and L.A. Winters. 2001. “Regionalism in the Nineties: What Effect on Trade?” North American Journal of Economics and Finance 12, 1: 1-29.
Streeten, P. "Review of Little, et al.," Econ. J., Mar. 1971, 81(1), pp. 144-48.
Tinbergen, J. 1962. Shaping the World Economy: Suggestions for an International Economic Policy. New York: The Twentieth Century Fund.
Verdoorn, P.J. 1960. The Intra-Block Trade of Benelux. In E. A. G. Robinson ed. Economic Consequences of the Size of Nations. London: Macmillan & Co.
Viner, J. 1950. The Customs Union Issue, in R. Pomfret ed. Economic Analysis of Regional Trading Arrangements. Massachusetts: Edward Elgar Publishing Ltd.
Vollmer, S.; I. Martinez-Zarzoso; F.D. Nowak-Lehmann; and N.H. Klann. 2009. EU-ACP Economic Partnership Agreements: Empirical Evidence for Sub-Saharan Africa. World Development Report 2009 Background Paper, University of Gottingen, Gottingen, Germany.
Weisbrot, M. and D. Baker. 2002. The Relative Impact of Trade Liberalization on Developing Countries. Center for Economic Policy Research Briefing Paper, Washington, D.C.
Wolf, S. 2002. “From Preferences to Reciprocity General Equilibrium Effects of a Free Trade Area Between The EU and the UEMOA.” Third Annual Conference on Global Economic Analysis, Bonn, Germany.
WTO (2002), Committee on Regional Trade Agreements, Coverage, Liberalization Process and Transitional Provisions in Regional Trade Agreements, WTO Document. WT/REG/W/46, June 2004, Internet Posting: (Accessed in May, 2009)
http://www.wto.org/english/tratop_e/region_e/regcom_e.htm.
BIOGRAPHICAL SKETCH
Innocent Lwafyo Thindwa was born in Karonga, Malawi on 4th August, 1977. He
received a Bachelor of Social Science, majoring in economics, from the University of Malawi,
Chancellor College in 2003. In that same year, Innocent joined the Malawi Government’s
Economic Common Service, working as an Economist. In March 2007, he was promoted to the
position of Senior Economist before a further promotion to the position of Principal Economist
in June, 2007.
In August 2008, he joined the Food and Resources Economics Department of the
University of Florida to pursue a Master of Science degree program under the sponsorship of the
United States Agency for International Development (USAID). He completed his degree in
August 2010.
85