the ethnicity pay gap - home page | equality and human ... · figure 5.3 impact of characteristics...
TRANSCRIPT

The ethnicity pay gap
Equality and Human Rights Commission Research report 108 | Pay gaps research
Simonetta Longhi and Malcolm Brynin
Institute for Social and Economic Research, University of Essex

© 2017 Equality and Human Rights Commission
Published August 2017
ISBN 978-1-84206-687-4
Equality and Human Rights Commission Research Report Series
The Equality and Human Rights Commission Research Report Series publishes
research carried out for the Commission by commissioned researchers.
The views expressed in this report are those of the authors and do not necessarily
represent the views of the Commission. The Commission is publishing the report as
a contribution to discussion and debate.
Please contact the Research Team for further information about other Commission
research reports, or visit our website.
Post: Research Team
Equality and Human Rights Commission
Arndale House
The Arndale Centre
Manchester M4 3AQ
Email: [email protected]
Telephone: 0161 829 8100
Website: www.equalityhumanrights.com
You can download a copy of this report in Microsoft Word and PDF formats from
www.equalityhumanrights.com.
If you require this publication in an alternative format, please contact the
Communications Team to discuss your needs at:
The ethnicity pay gap Contents
Equality and Human Rights Commission - www.equalityhumanrights.com
Published: August 2017 1
Contents
List of tables and figures 3
List of abbreviations and acronyms 5
Acknowledgements 6
Executive summary 7
Introduction 7
Key findings 7
Background 10
Methodology 10
1 | Introduction 12
2 | Methodology 14
2.1 Data 14
2.2 Definitions 15
2.3 Analysis 15
3 | The ethnic pay gap: what we already know 18
3.1 Immigration 18
3.2 Discrimination 19
3.3 Determinants of ethnic pay gaps 20
3.4 Ethnic minorities: measuring the pay gap 22
4 | Research findings: the employment rates and pay gaps of ethnic minorities 24
4.1 Trends in employment 24
4.2 Trends in median pay 28
4.3 The pay gaps of different ethnic minorities 30
4.4 The living wage 36
4.5 Summary 39
5 | Research findings: the drivers of ethnic pay gaps 40
5.1 Differences in characteristics 40
The ethnicity pay gap Contents
Equality and Human Rights Commission - www.equalityhumanrights.com
Published: August 2017 2
5.2 The impact of characteristics on the pay gaps of ethnic minority men 41
5.3 The role of characteristics on pay gaps for ethnic minority women 53
5.4 Summary 57
6 | How do ethnic minority women and men compare? 58
6.1 Ethnic pay gaps relative to White British men 58
6.2 The gender pay gap within ethnic minorities 60
7 | Conclusions 68
8 | Bibliography 71
Appendix 74
Contacts 122
The ethnicity pay gap List of tables and figures
Equality and Human Rights Commission - www.equalityhumanrights.com
Published: August 2017 3
List of tables and figures
Figures
Figure 4.1 Percentage of men with a paid job (employee) by ethnicity over time
Figure 4.2 Percentage of women with a paid job (employee) by ethnicity over time
Figure 4.3 Median pay for men by ethnicity
Figure 4.4 Median pay for women by ethnicity
Figure 4.5 The general pay gap (men)
Figure 4.6 The occupational pay gap (men)
Figure 4.7 The general pay gap (women)
Figure 4.8 The occupational pay gap (women)
Figure 4.9 Proportion of men paid below the Living Wage by ethnicity
Figure 4.10 Proportion of women paid below the Living Wage by ethnicity
Figure 5.1 Pay gaps of ethnic minority men
Figure 5.2 Impact of characteristics on pay gaps for Pakistani men born abroad
Figure 5.3 Impact of characteristics on pay gaps for Pakistani men born in the UK
Figure 5.4 Impact of characteristics on pay gaps for Bangladeshi men born
abroad
Figure 5.5 Impact of characteristics on pay gaps for Bangladeshi men born in the
UK
Figure 5.6 Impact of characteristics on pay gaps for Black African men born
abroad
Figure 5.7 Impact of characteristics on pay gaps for Black Caribbean men born
abroad
Figure 5.8 Impact of characteristics on pay gaps for Black Caribbean men born in
the UK
Figure 5.9 Pay gaps of ethnic minority women

The ethnicity pay gap List of tables and figures
Equality and Human Rights Commission - www.equalityhumanrights.com
Published: August 2017 4
Figure 5.10 Impact of characteristics on pay gaps for Pakistani women born abroad
Figure 5.11 Impact of characteristics on pay gaps for Bangladeshi women born
abroad
Figure 6.1 Summary of pay gaps of ethnic minority men and women
Figure 6.2 The general and occupational gender pay gaps (Black Caribbean
people)
Figure 6.3 The general and occupational gender pay gaps (Black African people)
Figure 6.4 The general and occupational gender pay gaps (Indian people)
Figure 6.5 The general and occupational gender pay gaps (Pakistani people)
Figure 6.6 The general and occupational gender pay gaps (Bangladeshi people)
Figure 6.7 The general and occupational gender pay gaps (Chinese)
Tables
Table 4.1 Mean pay gaps of ethnic minority men relative to White British men (£
per hour)
Table 4.2 Mean pay gaps of ethnic minority women relative to White British
women (£ per hour)
Table A1 Differences in characteristics of ethnic minority men
Table A2 Differences in characteristics of ethnic minority women
Table A3 Impact of characteristics on pay gaps of ethnic minority men and
women
Table A4 Contribution of characteristics to pay gaps of ethnic minority men
Table A5 Contribution of characteristics to pay gaps of ethnic minority women
Table A6 Pay gaps of ethnic minority men and women

The ethnicity pay gap List of tabbreviations and acronyms
Equality and Human Rights Commission - www.equalityhumanrights.com
Published: August 2017 5
List of abbreviations and acronyms
ASHE
LFS
Annual Survey of Household Earnings
Labour Force Survey
ONS Office for National Statistics
UKHLS UK Household Panel Survey

The ethnicity pay gap Acknowledgements
Equality and Human Rights Commission - www.equalityhumanrights.com
Published: August 2017 6
Acknowledgements
The authors would like to thank the following staff at the Equality and Human Rights
Commission: David Coulter, Anne Madden, Karen Hurrell and Gregory Crouch.
We are also grateful to the Office for National Statistics for providing access to the
Labour Force Survey via the UK Data Service. However, none of the original data
creators, depositors or copyright holders, the funders of the data collections, nor the
UK Data Service bear any responsibility for the analysis or the interpretation of the
results. Crown copyright material is reproduced with the permission of the Controller
of HMSO and the Queen's Printer for Scotland.

The ethnicity pay gap Executive summary
Equality and Human Rights Commission - www.equalityhumanrights.com
Published: August 2017 7
Executive summary
Introduction
This research report explores the ethnicity pay gap, which is defined as the
difference between the average hourly pay of ethnic minorities and White British
people. It is usually expressed as a percentage difference, with White British
people’s earnings representing 100%. As well as looking at differences in pay and
trends over time, the research identifies the characteristics that explain those
differences such as age, occupation and level of education. The research is intended
to further debate and highlight areas where intervention may be needed.
Key findings
The ethnicity pay gap is a longstanding phenomenon. Previous research has
shown that people from ethnic minorities tend to earn less, overall, than White
people. This is often associated with social disadvantage and is arguably also
caused by discrimination. New arrivals to the country may have a poor command
of English, possess qualifications which are not generally recognised by
employers and be unfamiliar with the UK's culture; these factors affect pay.
Immigrants to Britain often work in low-paid occupations and are overqualified for
the job they do.
Before exploring pay gaps, it is important to consider that employment rates – the
percentage of a group with a paid job, excluding the self-employed – vary
between ethnic groups, and by gender. Among both men and women, White
British people have tended to have the highest employment rates in the period
2002-2014, at around 70%, although Indian people have also had noticeably high
employment rates. The employment rates of Pakistani and Bangladeshi women
have been consistently low – below 30%.
According to analysis of Labour Force Survey (LFS) data in the period 2002-
2014, the mean hourly pay of different ethnic groups varied considerably. Gaps
also varied depending on whether people in ethnic minorities were born in the UK

The ethnicity pay gap Executive summary
Equality and Human Rights Commission - www.equalityhumanrights.com
Published: August 2017 8
or abroad. Among men, the overall picture was fairly clear. The White British
group tended to outperform ethnic minorities in terms of pay – but with a few
exceptions. All Indian and Chinese men (that is, both foreign-born and British)
and British-born Black African men had similar earnings to White British men.
However, all other groups earned noticeably less. Pakistani and Bangladeshi
males had particularly severe pay gaps, especially those born outside the UK.
The pay landscape for women in the same period was more complex. Ethnic
minority women generally earned more than White British women, with all Indian,
all Chinese, British-born Black Caribbean and British-born Black African women
experiencing notable pay advantages. Only two groups had a clear pay
disadvantage: these were Pakistani and Bangladeshi immigrant women.
However, British-born Pakistani and Bangladeshi women experienced no such
disadvantage. Along with female immigrants in the Black African and Black
Caribbean group, their pay was found to be fairly similar to White British
women’s.
There are different ways to analyse and quantify pay gaps. In this report the
analysis is largely based on a statistical predictive model which collated pay data
in the period 2002-2014 and is presented in section five. As with the above, this
model found that pay gaps are much larger for ethnic minority men born abroad
than for those born in the UK. Male Bangladeshi immigrants experienced the
largest pay gap of 48%, meaning they earned around half what White British men
earned. British-born Bangladeshi men have a 26% pay gap. Pakistani immigrant
men experienced a 31% pay gap, while British-born Pakistani men experienced a
pay gap of 19%. For immigrant and British-born Black Caribbean men the pay
gaps were 17% and 7% respectively. Black African immigrant men had a pay gap
of 19% while British-born Black African men earned roughly the same as White
British men. Indian and Chinese men's earnings were similar to those of White
British men, whether they were born abroad or in this country.
Based on the same model, pay gaps for ethnic minority women were much
smaller than those for ethnic minority men, and some groups had a pay
advantage. Female Bangladeshi immigrants and Pakistani immigrants both
experienced around a 12% pay gap compared with White British women. All
other groups either experienced no pay gap or a pay advantage. Black African
British women had a particularly large pay advantage, earning 21% more than
White British women.
This research also analysed change in mean hourly ethnic pay gaps over time in
pounds and pence (putting aside country of birth as a factor). Broadly speaking,
in the period 1993 – 2014 there has been very little narrowing of ethnic pay gaps
The ethnicity pay gap Executive summary
Equality and Human Rights Commission - www.equalityhumanrights.com
Published: August 2017 9
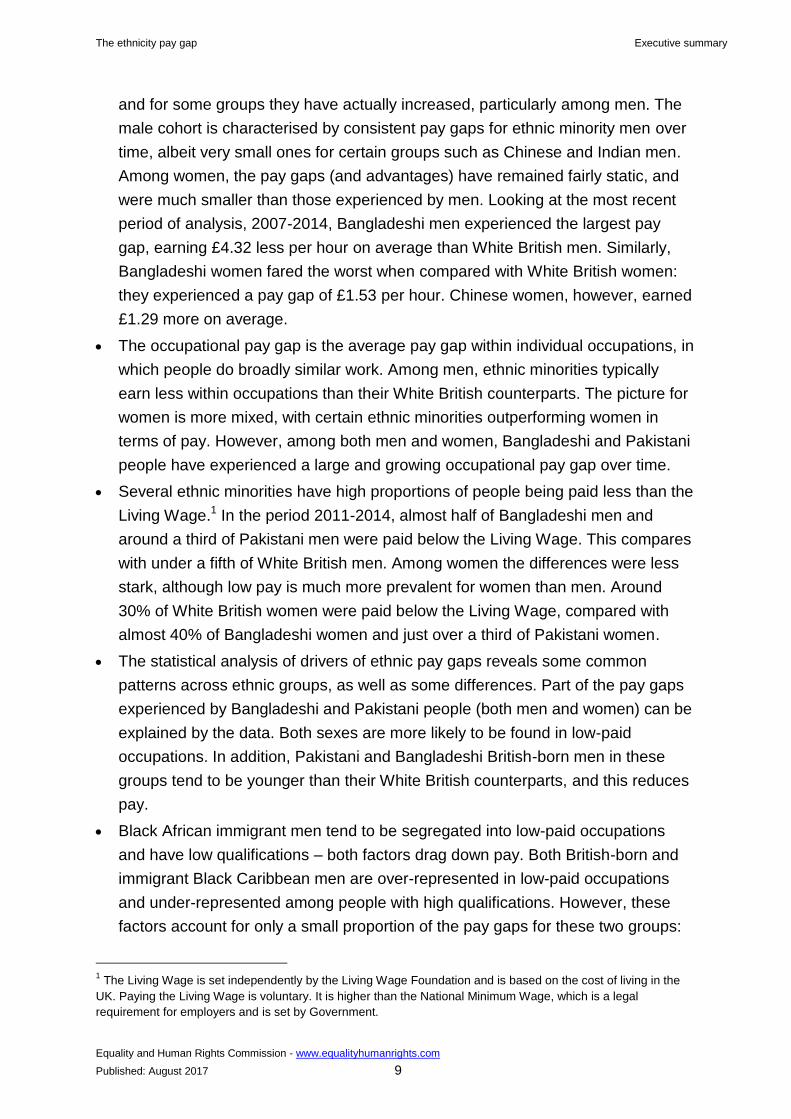
and for some groups they have actually increased, particularly among men. The
male cohort is characterised by consistent pay gaps for ethnic minority men over
time, albeit very small ones for certain groups such as Chinese and Indian men.
Among women, the pay gaps (and advantages) have remained fairly static, and
were much smaller than those experienced by men. Looking at the most recent
period of analysis, 2007-2014, Bangladeshi men experienced the largest pay
gap, earning £4.32 less per hour on average than White British men. Similarly,
Bangladeshi women fared the worst when compared with White British women:
they experienced a pay gap of £1.53 per hour. Chinese women, however, earned
£1.29 more on average.
The occupational pay gap is the average pay gap within individual occupations, in
which people do broadly similar work. Among men, ethnic minorities typically
earn less within occupations than their White British counterparts. The picture for
women is more mixed, with certain ethnic minorities outperforming women in
terms of pay. However, among both men and women, Bangladeshi and Pakistani
people have experienced a large and growing occupational pay gap over time.
Several ethnic minorities have high proportions of people being paid less than the
Living Wage.1 In the period 2011-2014, almost half of Bangladeshi men and
around a third of Pakistani men were paid below the Living Wage. This compares
with under a fifth of White British men. Among women the differences were less
stark, although low pay is much more prevalent for women than men. Around
30% of White British women were paid below the Living Wage, compared with
almost 40% of Bangladeshi women and just over a third of Pakistani women.
The statistical analysis of drivers of ethnic pay gaps reveals some common
patterns across ethnic groups, as well as some differences. Part of the pay gaps
experienced by Bangladeshi and Pakistani people (both men and women) can be
explained by the data. Both sexes are more likely to be found in low-paid
occupations. In addition, Pakistani and Bangladeshi British-born men in these
groups tend to be younger than their White British counterparts, and this reduces
pay.
Black African immigrant men tend to be segregated into low-paid occupations
and have low qualifications – both factors drag down pay. Both British-born and
immigrant Black Caribbean men are over-represented in low-paid occupations
and under-represented among people with high qualifications. However, these
factors account for only a small proportion of the pay gaps for these two groups:
1 The Living Wage is set independently by the Living Wage Foundation and is based on the cost of living in the
UK. Paying the Living Wage is voluntary. It is higher than the National Minimum Wage, which is a legal
requirement for employers and is set by Government.

The ethnicity pay gap Executive summary
Equality and Human Rights Commission - www.equalityhumanrights.com
Published: August 2017 10
the rest is unexplained. This means there are other factors at play, one of which
may be discrimination, although it was not possible in this research to quantify the
effect this may have had.
There are factors which mitigate ethnic pay gaps. London has the highest
numbers of people from ethnic minorities; as salaries in London are generally
higher than elsewhere, this narrows the national pay gap but masks pay
differences within regions. Some ethnic minorities also have higher qualifications
than White British people and receive better pay on average. Some work fewer
hours overall; this helps to lift their actual hourly pay, even if they still face a pay
gap overall.
Background
In 2015 the Equality and Human Rights Commission (‘the Commission’)
commissioned research into the causes of, and potential solutions to, the gender,
ethnicity and disability pay gaps. A suite of reports has been produced including a
summary report of findings from the entire project. These are available on the
Commission’s website: www.equalityhumanrights.com.
The Commission holds the view that pay gaps reflect broader inequalities in society
and tackling them is an important way to achieve a fairer society. The analysis in this
report builds on our previous research on pay gaps and complements our extensive
online guidance on fair and equal pay.
Methodology
Firstly a brief literature review was conducted to establish what is already known
about ethnicity pay gaps. The statistical analysis then followed, which is based on
historical data from the LFS covering the period 1993-2014. The LFS is a quarterly
household survey of the employment circumstances of the UK population and is
administered by the Office for National Statistics (ONS).
This is used to measure pay gaps for the largest ethnic groups: Indian, Pakistani,
Bangladeshi, Black African, Black Caribbean and Chinese people compared with
White British people.
The LFS data was used not only to establish the relative pay of different groups but
also to identify the personal characteristics that are associated with differences in

The ethnicity pay gap Executive summary
Equality and Human Rights Commission - www.equalityhumanrights.com
Published: August 2017 11
pay, such as level of education. These variables are referred to in the report as
'drivers' of pay gaps, although it is only possible to say that these are explanatory
factors rather than the cause of the pay gaps. This analysis identifies, based on the
data available, how much of the pay gap can be explained and how much is left
unexplained. For a full account of the methodology see Chapter two.

The ethnicity pay gap Introduction
Equality and Human Rights Commission - www.equalityhumanrights.com
Published: August 2017 12
1 |Introduction
In 2015 the Equality and Human Rights Commission (‘the Commission’)
commissioned research into pay gaps. Its purpose was to explore the extent of
disparities of pay between certain groups, to elucidate their causes and to identify
ways to mitigate them. The research focused on pay gaps by gender, ethnicity and
disability. As well as statistical analysis of pay data, the project involved a literature
review of the causes of pay gaps as well as government and employer interventions
that have attempted to address them. Workshop discussions about practical
solutions were also held with key stakeholders such as employers and government
bodies.
The main aims of the project were to:
review the evidence base and identify the causes of pay gaps
establish the size of pay gaps for women, ethnic minorities and disabled people
analyse the relative impact of different variables on gender, ethnicity and disability
pay gaps
review and discuss with stakeholders the effectiveness of certain interventions by
governments, employers and other organisations to reduce pay gaps.
A suite of reports has been produced: three separate reports for disability, ethnicity
and gender respectively covering literature reviews of the evidence base and
statistical analysis; a report on interventions covering a literature review and
stakeholder consultation; plus a summary report of findings from the entire project.
These are available on the Commission website: www.equalityhumanrights.com.
This report focuses specifically on the ethnicity pay gap, which is defined as the
difference between the average hourly pay of ethnic minorities and White British
people. There is firstly a brief summary of the evidence from the existing body of
literature. This is followed by statistical analysis of data from the Labour Force
Survey (LFS) which looks at differences in pay and how they have changed over
time. Comparisons are drawn between the largest ethnic groups: Indian, Pakistani,
Bangladeshi, Black African, Black Caribbean and Chinese and White British people.

The ethnicity pay gap Introduction
Equality and Human Rights Commission - www.equalityhumanrights.com
Published: August 2017 13
The analysis also explores the association of certain variables with pay levels such
as education, hours worked, occupation, age and so on.
The Commission holds the view that pay gaps reflect broader inequalities in society
and tackling them is an important way to achieve a fairer society. The analysis in this
report builds on previous research on pay gaps and complements our extensive
online guidance on fair and equal pay. It is intended to inform debate and highlight
areas where action may be needed.

The ethnicity pay gap Methodology
Equality and Human Rights Commission - www.equalityhumanrights.com
Published: August 2017 14
2 |Methodology
2.1 Data
To analyse ethnicity pay gaps we use data from the Labour Force Survey (LFS) over
the period 1993-2014. The LFS is a household survey carried out quarterly by the
Office for National Statistics (ONS) which contains a wide range of information on
people’s demographic characteristics, labour market status, and job characteristics.
This is the only dataset that provides information on both pay and ethnicity and that
has a sample size large enough to allow us to analyse pay gaps of both immigrants
and British-born people who belong to an ethnic minority. The data are sufficient to
focus on the largest ethnic minorities in the UK: Indian, Pakistani, Bangladeshi, Black
African, Black Caribbean and Chinese people.
Data limitations mean the analysis excludes people from smaller ethnic minorities.
This is necessary in order to achieve sufficiently large sample sizes. White
immigrants are also excluded from the analysis, due to the extreme heterogeneity of
this group.
Much of the analysis covers the period 1993-2014, but is restricted to 2002-2014 for
the analysis of the drivers of pay gaps. This is because the literature has shown the
importance of religious affiliation in the explanation of pay gaps (Longhi et al., 2013).
Questions on ethnicity, country of birth and year of arrival to the UK have been
asked since 1993, while questions on religious affiliation have only been asked since
2002.
Because large sample sizes are required for this latter analysis, we need to pool all
years of available data to be able to analyse the determinants of ethnic pay gaps. By
pooling all years we are also able to add an additional layer to the analysis and
divide each minority group into two sub-groups: those who are born abroad, and
those who are born in the UK.
In order to obtain large enough samples, we use data as follows:
For the change over time graphs in Chapter four, we include Waves 1 and 5 and
estimate proportions by calendar year.

The ethnicity pay gap Methodology
Equality and Human Rights Commission - www.equalityhumanrights.com
Published: August 2017 15
For the graphs of percentages earning below the Living Wage in Chapter four, we
include Waves 1 and 5, estimate proportions by calendar year and then average
for the whole period.
For the analysis in Chapters 5 and 6, we include data for Wave 1 only.
The resulting dataset is then analysed as described at Section 2.3 below.
In this report we exclude students who have a job, since these people are likely to be
doing 'marginal' jobs in the sense that their job is not their main activity or source of
income. We also exclude women on maternity leave, who generally receive only a
proportion of their usual pay.
2.2 Definitions
In this report the pay gap is defined as the difference between the average hourly
pay of ethnic minorities and White British people. When ethnic minorities are paid
less, overall, than White British people they experience a pay gap. When they are
paid more they experience a pay advantage. The pay gap is often expressed as a
percentage difference between the pay of people from ethnic minorities and the pay
of White British people, with the latter representing 100%. It is at other times
expressed as the mean difference in hourly rates, in pounds and pence.
We use hourly pay in a person’s main job as a measure of how people’s time is
valued in the labour market, with hours including paid and unpaid overtime. Second
jobs are not considered.
The discussion on pay gaps focuses only on people with a paid job, therefore
excluding the self-employed. Self-employment is more likely among some ethnic
minorities than others, and it is important to bear in mind that in some cases this may
not be a choice. Self-employment may arise if people are unable to find salaried
employment (Clark, 2015).
2.3 Analysis
In this report we analyse the pay gaps of ethnic minority men and women. However,
in contrast with earlier reports such as Longhi and Platt (2008), which compared the
pay of ethnic minority women to the pay of White British men, we mainly compare
ethnic minority men with White British men, and ethnic minority women with White
The ethnicity pay gap Methodology
Equality and Human Rights Commission - www.equalityhumanrights.com
Published: August 2017 16
British women (Chapter six looks at the gender pay gap within ethnic groups). This
type of comparison excludes the effect of the gender pay gap and can give us a
better picture of how ethnicity influences women's pay differently from men's. This is
an important distinction since we find that the pay gaps between female ethnic
groups are very different from those between male ethnic groups.
Chapter four shows trends in employment and pay. These are based on estimates
from the LFS, analysed by calendar year, and the results in the pay graphs have
been smoothed using locally weighted regression (Cleveland, 1979). This shows the
overall trends while hiding year-on-year variation, which is mostly due to sampling.
Employment rate estimates have been calculated using data weighted to the
population, while median pay has been calculated using unweighted data.
The analysis also measures the pay gap within occupations as well as across the
economy as a whole. The occupational pay gap measures the differences between
what different groups earn when working in the same field. This is calculated by
averaging the pay gaps across around 80 occupational groups.
Percentages earning below the Living Wage have been calculated using data from
2011 to 2014 and averaging the percentages across the four years. The UK Living
Wage rates for outside of London, as set by the Living Wage Foundation (2016), are:
£7.20 per hour in 2011, £7.45 in 2012, £7.65 in 2013 and £7.85 in 2014. Pay rates
are unadjusted for inflation and compared directly with the rates for each year.
Chapter five shows the impact that personal and job characteristics have on pay
gaps. We compare two measures: ‘raw’ pay gaps and ‘adjusted’ pay gaps. Raw pay
gaps measure the unadjusted difference in pay between ethnic minority and White
British people, that is, without taking into account that they have different
characteristics. Adjusted pay gaps measure the difference in pay when these
characteristics are taken into account. Hence, this gives an indication of what
proportion of the pay gap is due to the characteristics we measure.
We use an extensive list of characteristics, for example age as a proxy for labour
market experience, highest qualification obtained as a measure of skills, whether
married or cohabiting, and whether there are dependent children in the household.
We include characteristics of the job such as the type of occupation (such as
managers, professionals), years of job tenure measured from time with current
employer, whether working part-time (less than 30 hours per week), whether the job
is temporary and whether it is in the public sector. We also include details of whether
the job is located in London (where pay is comparatively higher), Wales or Scotland,
where we use England (outside London) as the reference group. Since our analyses

The ethnicity pay gap Methodology
Equality and Human Rights Commission - www.equalityhumanrights.com
Published: August 2017 17
focus on hourly pay, computed including both paid and unpaid overtime, we also
include details of the usual number of hours worked (excluding overtime), the
number of hours of paid overtime, and the number of hours of unpaid overtime. The
full list of characteristics can be found in Table A3.
This analysis of percentage pay gaps uses linear modelling of pay2 to provide the
unadjusted pay gaps between each group of people, as well as pay gaps adjusted
using a range of characteristics which provides the basis for a decomposition
analysis. This shows which factors in the model explain the pay gap and in which
direction. However, we do not attempt to estimate levels of discrimination through
this analysis.
It is often common to think about labour market discrimination when different groups
of workers are paid differently on average. However, there is labour market
discrimination only when groups of workers ‘with equal productivity’ receive different
pay on average (Baldwin and Johnson, 2006). To be able to say that a group of
workers is discriminated against, we need to compare their pay after taking into
account the full range of characteristics that are valued in the labour market (such as
education or work experience) and would justify differences in pay. Only a difference
in pay that cannot be explained by characteristics could be called discrimination. In
practice, however, no study can take into account all characteristics that are valued
in the labour market, and measuring the existence or amount of discrimination in pay
cannot be reliably achieved.
2 The models are applied to the natural logarithm of pay.

The ethnicity pay gap The ethnic pay gap: what we already know
Equality and Human Rights Commission - www.equalityhumanrights.com
Published: August 2017 18
3 |The ethnic pay gap: what we already
know
3.1 Immigration
There are various reasons why we may expect ethnic minorities to be paid less on
average than White people; part of the explanation is related to a significant
proportion of people from ethnic minorities being immigrants. The literature suggests
that newly arrived immigrants may face difficulties in the labour market of the host
country. For example, they may have problems with the language and customs, and
they may lack the connections that could help them find a suitable job (Blackaby et
al., 2002; Lindley, 2002). When immigrants’ qualifications are not recognised in the
labour market of the host country such immigrants will experience ‘occupational
downgrading’ and most likely be overqualified for the job they do, with a consequent
impact on their pay (Lindley, 2009). As is widely acknowledged, as immigrants spend
more time in the host country, they gain the necessary knowledge, skills and
connections to move into their preferred occupation and earn higher salaries.
When the focus is on the ethnic pay gap rather than the ‘immigrant pay gap’ the
situation becomes more complex and diverse. It is not easy to make comparisons
between different countries because of their different immigration histories (see, for
example Dustmann and Frattini, 2011). In countries such as the UK, ethnic minorities
include a large proportion of people from an ethnic minority background but born in
the UK (about half of the people identifying with the six ethnic minorities analysed in
this report were born in the UK). Problems of language, knowledge of the institutions
or recognition of qualifications should not apply to established ethnic minorities, or at
least should be far less significant. Most of the literature, as expected, finds smaller
employment and pay gaps for ethnic minorities born in the UK compared with
immigrants (see, for example Algan et al., 2009; Longhi et al., 2013).

The ethnicity pay gap The ethnic pay gap: what we already know
Equality and Human Rights Commission - www.equalityhumanrights.com
Published: August 2017 19
3.2 Discrimination
Various studies have focused on discrimination as a source of pay gaps (see Lang
and Lehmann, 2012; Guryan and Charles, 2013). Ethnic minorities may be
discriminated against because of negative social attitudes towards them. Likewise,
employers may deduce the quality of a job applicant from an ethnic minority
background based on the perceived average quality of people with the same ethnic
background (often called statistical discrimination). This might be the result of
stereotypes – for example, a widespread belief that people from a certain
background work less hard than others. If employers believe the stereotype they will
be more likely not to offer a job to applicants from that ethnic background, or to only
offer them lower-paid jobs. Even if within the same job people from different ethnic
minorities were paid the same, we would still observe pay gaps if ethnic minorities
were less likely to obtain higher-paid jobs.
Brynin and Güveli (2012) distinguish between the general pay gap and the
occupational pay gap. The latter is a measure of the average pay gap within
occupations (rather than simply looking at average pay across the whole economy).
These two measures tell different stories. While the general pay gap is in favour of
White British people, the occupational pay gap is generally less so. This implies that
when ethnic minorities do broadly similar work to White British people then pay
inequality is lower, as we would expect. Therefore much of the general pay gap
derives from the concentration of minorities into relatively poorly paid occupations.
This issue is examined in further detail later in the report.
There is substantial evidence in the literature that people from ethnic minorities
experience discrimination in employment and recruitment. A common type of study
involves sending fictitious CVs to real job vacancies. The CVs are equivalent in
terms of the ability of the applicant to perform the job but the race or ethnicity of the
candidate is apparently revealed by her name. The literature consistently finds that
job applicants with supposedly foreign or ethnic names are less likely to be called
back for an interview than job applicants with native-sounding names. For example,
Wood et al. (2009) sent applications to various job vacancies for nine types of
occupations (including IT, accountancy, care, sales, office assistance) in seven
British cities. They found that job applicants with ethnic or foreign names were less
likely to be called back for an interview than job applicants with British-sounding
names. It is not clear, however, to what extent the results can be generalised to
other types of jobs and to other settings. In addition, although these types of studies
give us an indication of the different treatment of CVs of British and ethnic minority
job applicants, this methodology cannot provide any evidence about the actual hiring

The ethnicity pay gap The ethnic pay gap: what we already know
Equality and Human Rights Commission - www.equalityhumanrights.com
Published: August 2017 20
process (since nobody is sent to the interview) or about the determinants of pay
gaps.
Another strand of literature trying to measure discrimination in pay uses regression
and decomposition methods. These methods are based on the observation that
White British and ethnic minority workers have different characteristics that are
valued in the labour market, such as age and levels of qualification. As we discuss in
Section 3.3 below, this method can give valuable information on the determinants of
pay gaps.
3.3 Determinants of ethnic pay gaps
An important reason why ethnic minorities may receive lower pay than White British
people is that they might be different in terms of personal characteristics. As already
mentioned, those new to the UK might have qualifications or work experience
obtained abroad but not recognised by employers in the UK. The literature finds that
ethnic pay gaps tend to reduce when we take characteristics into account (Metcalf,
2009). Decomposition methods are often used to separate the pay gaps into two
components: one of which is due to differences in characteristics (called the
‘explained’ part), and one which is due to differences in ‘returns’ or outcomes based
on these characteristics (called the ‘unexplained’ part). In most cases the aim of
these studies is to identify how much the pay gap reduces when we account for
characteristics, and what proportion of the gap remains unexplained. It also ought to
be borne in mind that differences in personal characteristics may themselves be the
result of ingrained social inequality, such as in education for example.
The part of the pay gap that remains unexplained is a measure of what we don’t
know about the causes of the pay gaps and should not necessarily be interpreted as
the effect of discrimination. For example, the unexplained part of the pay gap may
include the effect of self-employment or unemployment spells for which we rarely
have information in the data. A period spent in self-employment may have a negative
or positive impact on pay, but is not itself a measure of discrimination. In addition, as
we find in this report, not all characteristics decrease pay (thus widening the pay
gap). Some characteristics may increase pay (and reduce the pay gap); with the
result that various types of characteristics may balance each other out and leave us
with no pay gaps on average or with a very large ‘unexplained’ part. This, however,
does not necessarily mean that there is an absence of discrimination, or that most of
the gap is due to discrimination. A closer look at the positive and negative
characteristics driving pay may give us some indication of whether pay gaps may

The ethnicity pay gap The ethnic pay gap: what we already know
Equality and Human Rights Commission - www.equalityhumanrights.com
Published: August 2017 21
reduce or increase in future. To gain a better understanding of the determinants of
ethnic pay gaps in this report we concentrate on the characteristics that explain pay
gaps and how they differ across ethnic groups.
A major factor in ethnic pay gaps is the extent and impact of occupational
segregation. For instance, 41% of Black Caribbean and 47% of Black African
immigrants work in the health sector (very generally defined), compared with 20% of
British-born White people (Dustmann and Fabbri, 2005). On the other hand, some
groups are over-represented in professional and relatively well-paid occupations
such as teaching and health-related occupations (Elliot and Lindley, 2008; Heath and
Cheung, 2006; Brynin and Güveli, 2012).
There is also evidence of ethnic pay gaps within occupations (Elliot and Lindley,
2008). Hatton and Leigh (2011) suggest that concentration in low-paid occupations
depends on the immigration history of the minority group. As the minority group
becomes more assimilated or integrated into the host society, new labour market
entrants from the same group are more likely to distribute across a wider range of
occupations than the previous generation. In addition, they suggest that low skill
immigrants should be more affected than high skill immigrants by the context of
reception, in the sense that the characteristics of the ethnic minority have a higher
impact on labour market success of low skill than high skill immigrants.
Entry into low-status or poorly paid jobs, which offer limited career progression, may
also be an important factor. Brynin and Longhi (2015) looked at the concentration of
ethnic minorities in specific occupations marked either by low pay or large pay gaps,
but also those where minorities do relatively well. Ethnic minorities are
overrepresented in low-paid occupations such as sales, catering, elementary
personal services, hairdressing, textiles and clothing manufacture. Other
occupations in which minorities receive significantly lower pay than the White British
population are elementary goods storage, assembly and process operation, and to a
lesser extent professional jobs in teaching and the health sector. The former group of
occupations is predominantly characterised by routine and low skilled work, the latter
by high skilled work.
Ethnic minorities are under-represented in occupations in which they actually have a
pay advantage – for example, jobs in clerical and secretarial work, cashiers, some
communications jobs, and buyers and brokers agents. These are generally semi-
routine, white-collar occupations. This ‘broad-brush’ picture is a useful starting point
for investigation of policy initiatives which might ameliorate the ethnic pay gap.

The ethnicity pay gap The ethnic pay gap: what we already know
Equality and Human Rights Commission - www.equalityhumanrights.com
Published: August 2017 22
Clearly, some characteristics that may ‘explain’ pay gaps, such as lack of
qualifications, concentration in low-paid occupations, or unemployment spells may
themselves be the result of discrimination or social disadvantage (Longhi et al.,
2012). It is also possible that pay gaps develop and increase over people’s careers.
In a recent report, Zwysen and Longhi (2016) focused on graduates and found that
six months after graduation ethnic minority British graduates were less likely to have
a job than White British graduates but, when in employment, they did not seem to
experience a pay gap. Three and a half years after graduation, however, a pay gap
emerges alongside a persistent employment gap. In this report we aim to identify
which characteristics have the largest impact on pay gaps but we are not able to
analyse whether these characteristics are themselves the result of discrimination or
how pay gaps change over people’s careers.
3.4 Ethnic minorities: measuring the pay gap
Empirical estimations of ethnic minority pay gaps in the UK have evolved as more
data have become available. The earlier literature grouped ethnic minorities very
broadly. For example, Blackaby et al. (1994) simply compared the pay of Black and
White people. A few years later Blackaby et al. (1998) added a level of detail by
analysing the pay of Black, Indian and Pakistani people with White British people.
Both studies recognised the importance of comparing ethnic minorities born abroad
to ethnic minorities born in the UK, but instead of estimating separate pay gaps for
people born abroad and people born in the UK, they only included country of birth as
a variable in the models. Hence, in these studies ethnic minorities born abroad and
in the UK may have different levels of pay, but the pay gap is the same for both
groups.
Blackaby et al. (2002) went one step further and compared Black, Indian and
Pakistani immigrants, but nevertheless aggregated all UK-born ethnic minorities into
one group. Since then, analysis of more well-defined groups has been conducted.
These studies found considerable variation between ethnic minorities, with some
persistently doing badly, relative to the White British majority (such as Pakistani and
Bangladeshi people), but others doing better than White British (such as Indian
people). Nevertheless, ethnic penalties remain even after controlling for individual
differences, for instance in respect of education (Berthoud, 2000; Platt, 2005; Heath
and Cheung, 2006a, b; Heath and Brinbaum, 2007; Heath et al., 2007; Platt, 2009).
Longhi et al. (2013) compared more refined groups, distinguishing people by their

The ethnicity pay gap The ethnic pay gap: what we already know
Equality and Human Rights Commission - www.equalityhumanrights.com
Published: August 2017 23
immigrant status and religious affiliation. They confirmed that pay gaps of UK-born
ethnic minorities are much smaller than pay gaps of ethnic minorities born abroad.
Even discounting differences between first and second (or later) generations and
religious distinctions, it is important to note that there are major differences in pay
between ethnic minorities but also between men and women within these. The
literature repeatedly shows that Bangladeshi and Pakistani men are the worst off and
that Indian, Chinese and Black Caribbean people are not very much, if at all, worse
off on average than the White British population. As we show below, time is also a
factor, changing the positions of specific minorities relative to the majority, and that
of women, within each group, relative to men. This was found to be important in the
US (Stainback and Tomaskovic-Devey, 2012).
As just indicated, many studies reveal a complex picture in which outcomes vary
between ethnic minorities, between recent immigrants and ethnic minorities born in
the UK, between different religions, and indeed between men and women within
ethnic minorities (see, for example Metcalf, 2009). This report explores some of
these complexities.
The ethnic pay gap Research findings: the employment rates and pay gaps of ethnic minorities
Equality and Human Rights Commission - www.equalityhumanrights.com
Published: August 2017 24
4 |Research findings: the employment
rates and pay gaps of ethnic minorities
This chapter discusses trends in employment and median pay, and also explores
pay gaps within and across occupations. Looking at the average pay gap within
occupations enables us to see whether ethnic minorities tend to receive lower pay
for doing broadly the same sort of work as White British people. If they do, this
implies either wage discrimination or some barrier to entry into better paid jobs within
occupations. If they do not, but a general wage gap exists, this implies that the
problem is one of occupational segregation – that is, ethnic minorities being more
likely to work in low-paid occupations. In the final section we provide a brief
discussion of the proportion of workers who are paid below the living wage, by
ethnicity.
4.1 Trends in employment
Figures 4.1 and 4.2 show how the proportion of male and female employees has
changed in recent years. The figures show the employment rates for those aged 16-
64. Note that self-employed people are excluded, as are other sections of the
population, such as immigrants from the European Union (EU) and those from other
parts of the world that are not captured by the categories used in this research.
These rates are not therefore directly comparable with official figures from the Office
for National Statistics (ONS).
Self-employment may constitute a valid alternative to a paid job, and ethnic
minorities have higher rates of self-employment than White British people. However,
in this analysis we focus on paid jobs only since this provides a more appropriate
background for the analysis of pay gaps, which only includes people with a paid job.
It is also worth keeping in mind that some of these figures are based on relatively
small numbers, and although here we discuss possible trends and differences
across groups, such differences may not always be statistically significant. These
figures are intended to give an idea of differences and trends; however, unless
The ethnic pay gap Research findings: the employment rates and pay gaps of ethnic minorities
Equality and Human Rights Commission - www.equalityhumanrights.com
Published: August 2017 25
differences across groups and trends are clear in the graphs, they should be
interpreted with caution. It is also important to bear in mind that trends in
employment for ethnic minorities may be related to changes in immigration laws and
especially the introduction of the Point Based System in the late 2000s. This means
that trends may be driven by the different characteristics of new entrants rather than
by people who have been in the UK for a while.
Figure 4.1 shows that the proportion of White British men in employment has
decreased slightly over time, although at around 70% it has still generally been
higher than every other ethnic group, apart from Indian men, whose employment rate
is now similar. The employment rate of Black Caribbean and Black African men has
been consistently lower than that of White British men, and Chinese and Pakistani
men have the lowest employment rates, although the low rate of the former is partly
related to the high proportion of Chinese students.
Figure 4.2 shows that, as with men, White British women have had the highest
employment rate at almost 70%, followed closely by Black Caribbean and Indian
women. The other ethnic minority groups have had lower employment rates,
particularly Pakistani and Bangladeshi women whose employment rate has been
consistently below 30%, although this has been increasing slightly over time.

The ethnic pay gap Research findings: the employment rates and pay gaps of ethnic minorities
Equality and Human Rights Commission - www.equalityhumanrights.com
Published: August 2017 26
Figure 4.1: Percentage of men with a paid job (employee) by ethnicity over time
40
50
60
70
80
2002 2003 2004 2005 2006 2007 2008 2009 2010 2011 2012 2013 2014
% m
ale
emp
loye
es
White British Indian Pakistani Bangladeshi Black African Black Caribbean Chinese

The ethnic pay gap Research findings: the employment rates and pay gaps of ethnic minorities
Equality and Human Rights Commission - www.equalityhumanrights.com
Published: August 2017 27
Figure 4.2: Percentage of women with a paid job (employee) by ethnicity over time
0
20
40
60
80
2002 2003 2004 2005 2006 2007 2008 2009 2010 2011 2012 2013 2014
% f
emal
e em
plo
yees
White British Indian Pakistani Bangladeshi Black African Black Caribbean Chinese

The ethnic pay gap Research findings: the employment rates and pay gaps of ethnic minorities
Equality and Human Rights Commission - www.equalityhumanrights.com
Published: August 2017 28
4.2 Trends in median pay
Figure 4.3 for men and Figure 4.4 for women show how median pay differs across
ethnic groups. The differences in median pay across groups at any point in time
represent the median pay gaps.3
These figures are deflated to remove the effect of inflation in prices. Any remaining
trend is therefore the rise in real pay: this simplifies interpretation. For the same
reason, the graphs are smoothed. In some cases the real data show considerable
fluctuation as a result of small sample sizes.
The purpose of the analysis is to compare trends in pay. The general trend for men,
affecting all groups if to different degrees, is of a rise until around 2005 followed by
decline, so that in nearly all instances the end position is similar to the starting
position, albeit slightly higher. In terms of comparisons there is essentially no pay
gap for Indian men, and Chinese and Black Caribbean men – who experienced long-
term improvement in pay – managed to reduce the gap over time so that by 2014
they were not far behind Indian men. Consistent with the previous literature reviewed
above, Pakistani and Bangladeshi men experienced the largest pay gaps. However,
the pay of Bangladeshi men has improved slightly, albeit from a very low base.
3 Here and in Section 4.3 we only use hourly pay without accounting for overtime and we exclude people working
less than 10 hours per week. Wages are deflated to 2014 prices. The pay data relates to all people aged 16 and
over.

The ethnic pay gap Research findings: the employment rates and pay gaps of ethnic minorities
Equality and Human Rights Commission - www.equalityhumanrights.com
Published: August 2017 29
Figure 4.3: Median pay for men by ethnicity
For women, Figure 4.4 shows a completely different picture. In general, in
comparison with men, there is a much steeper and longer rise followed by a gentler
fall, so that the final position is generally higher than the starting position. There is
evidence of a favourable pay gap for ethnic minority women – that is, on average
they received higher pay than White British women. In addition, there is no clear
evidence that the gaps are changing over time.
As mentioned above, when only few people belonging to a minority group have a
job, the advantageous characteristics (whether observed or unobserved) of those
with a job are likely to widen pay gaps. This may explain why Pakistani and
Bangladeshi women seem to fare relatively well compared with White British women
in terms of pay, although they still experience pay gaps. Pakistani and Bangladeshi
men seem to experience even larger penalties when compared with White British
men. We will analyse this in more detail in the next chapter.
810
12
14
med
ian p
ay (
per
ho
ur)
1995 2000 2005 2010 2015year
White British Black Caribbean
Black African Indian
Pakistani Bangladeshi
Chinese

The ethnic pay gap Research findings: the employment rates and pay gaps of ethnic minorities
Equality and Human Rights Commission - www.equalityhumanrights.com
Published: August 2017 30
Figure 4.4: Median pay for women by ethnicity
4.3 The pay gaps of different ethnic minorities
The previous graphs showed trends in pay and offered a rough estimation of ethnic
pay gaps. The following four graphs show the pay gap of the six ethnic minority
groups compared with White British. Two graphs show the general gap for men and
women separately, followed by two for the occupational gap, again for men and
women separately. All these are based on median wages.
Where the line is below zero this indicates that the ethnic minority in question earns
less per hour than the White British majority. The lines have again been smoothed
using moving averages and as a result do not show the considerable year-on-year
fluctuation that exists in some cases (mostly due to small sample sizes).
8
10
12
14
media
n p
ay (
£ p
er
hour)
1995 2000 2005 2010 2015 year
White British Black Caribbean
Black African Indian Pakistani Bangladeshi Chinese

The ethnic pay gap Research findings: the employment rates and pay gaps of ethnic minorities
Equality and Human Rights Commission - www.equalityhumanrights.com
Published: August 2017 31
Figure 4.5: The general pay gap (men)
Figure 4.5 shows the general pay gaps for men. It is clear that Indian men have
tracked the position of White British men fairly closely. Black Caribbean men have
slowly been catching up and Chinese men have even moved slightly ahead.
However, the situation for the other three groups has deteriorated. The largest drop
is in the case of Black African men. However, the pay of Pakistani and Bangladeshi
men has lagged behind the pay of other groups for the entire period. The overall
picture is one of considerable pay disadvantage for these two groups.
Figure 4.6 below shows the trend in the occupational pay gap for men. The
occupational pay gap is the average pay gap within occupations. For all groups the
occupational pay gap was generally quite close to zero until roughly 2008. Since
then, however, pay has tailed off badly for Black African, Pakistani and Bangladeshi
men. The increase in the occupational pay gap for Bangladeshi men is particularly
severe. Alongside the continuous worsening of Pakistani men's pay, relative to White
British men but not in absolute terms, the outcomes for both groups are very poor.
Bangladeshi and Pakistani men have therefore experienced an overall pay gap (as
per Figure 4.5), plus they have typically been paid less than White British men even
when working in the same occupation as them. Again, the overall picture is
unfavourable to ethnic minorities.
-6
-4
-2
0
2
£ p
er
hour
1995 2000 2005 2010 2015 year
Black Caribbean Black African Indian Pakistani Bangladeshi Chinese

The ethnic pay gap Research findings: the employment rates and pay gaps of ethnic minorities
Equality and Human Rights Commission - www.equalityhumanrights.com
Published: August 2017 32
Figure 4.6: The occupational pay gap (men)
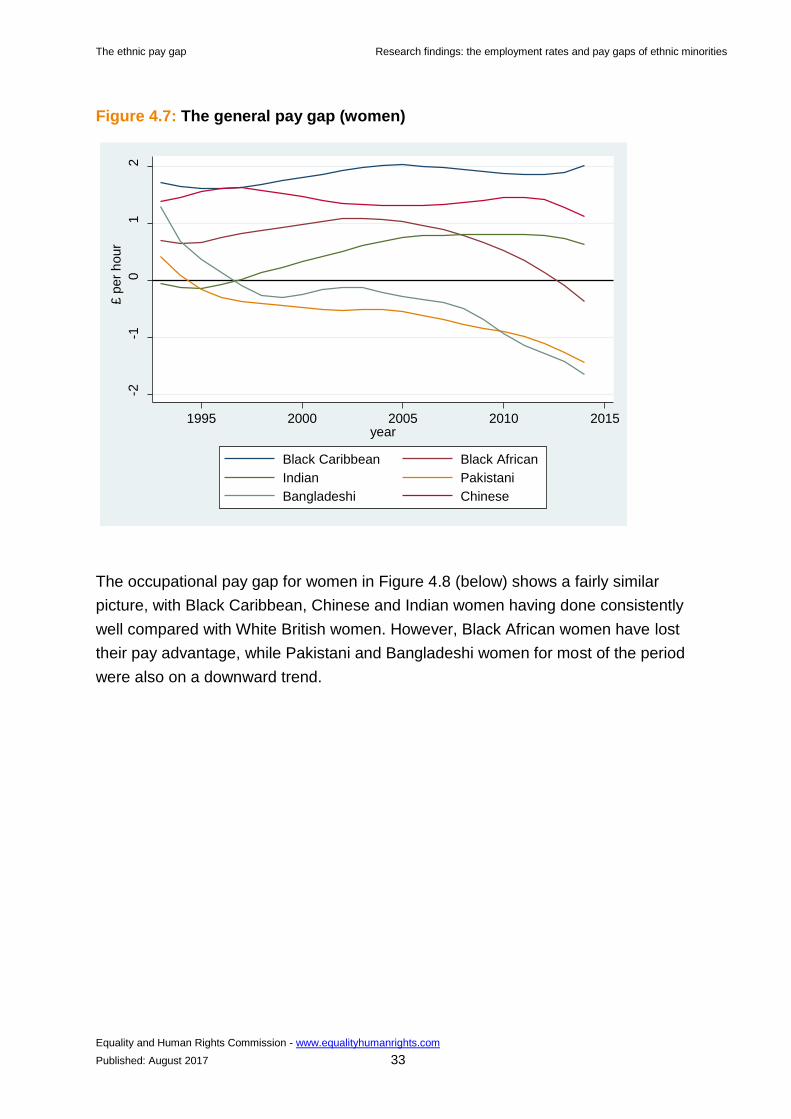
For ethnic minority women the situation is very different. In 1995, according to Figure
4.7, all ethnic minority women earned more than their White British counterparts
apart from Pakistani and Indian women. By the end of the period, however, the
picture has changed considerably. Black African, Pakistani and Bangladeshi women
have all experienced a considerable drop in their earnings relative to White British
women. In the case of Pakistani and Bangladeshi women, this decline has been
steady and continuous.
-6
-4
-2
0
2
£ p
er
hour
1995 2000 2005 2010 2015 year
Black Caribbean Black African Indian Pakistani
Bangladeshi Chinese
The ethnic pay gap Research findings: the employment rates and pay gaps of ethnic minorities
Equality and Human Rights Commission - www.equalityhumanrights.com
Published: August 2017 33
Figure 4.7: The general pay gap (women)
The occupational pay gap for women in Figure 4.8 (below) shows a fairly similar
picture, with Black Caribbean, Chinese and Indian women having done consistently
well compared with White British women. However, Black African women have lost
their pay advantage, while Pakistani and Bangladeshi women for most of the period
were also on a downward trend.
-2
-1
0
1
2
£ p
er
hour
1995 2000 2005 2010 2015 year
Black Caribbean Black African Indian Pakistani Bangladeshi Chinese

The ethnic pay gap Research findings: the employment rates and pay gaps of ethnic minorities
Equality and Human Rights Commission - www.equalityhumanrights.com
Published: August 2017 34
Figure 4.8: The occupational pay gap (women)
In summary, ethnic minorities have experienced distinctly different trajectories in
terms of pay gaps since the early 1990s. Relative to the situation of the White British
majority, men from all ethnic minorities earned less than White British men with the
exception of Chinese men who achieved a pay advantage only very recently. While
the gap is small for some groups, for Pakistani and Bangladeshi men it has been
consistently large.
The occupational gap is smaller for men and sometimes in favour of ethnic
minorities. This implies that pay inequality within occupations is less extreme and
suggests that much pay inequality derives from concentration into poorly paid
occupations. However, in recent years even the occupational pay gap has worsened,
particularly for Pakistani and Bangladeshi men, leading to a pay disadvantage not
just across the whole economy but also within occupations.
The situation for ethnic minority women has been more favourable, with the
difference between the general and occupational gaps having been far less marked
than for men. Ethnic minority women tend to have been paid more than White British
women in the same occupation and this is perhaps the source of their general pay
advantage. Again, though, and on both counts, Pakistani and Bangladeshi women
have fared badly.
-2
-1
0
1
2
£ p
er
hour
1995 2000 2005 2010 2015 year
Black Caribbean Black African Indian Pakistani Bangladeshi Chinese

The ethnic pay gap Research findings: the employment rates and pay gaps of ethnic minorities
Equality and Human Rights Commission - www.equalityhumanrights.com
Published: August 2017 35
The above graphs show trends in the pay gap for each ethnic minority group relative
to White British people but without any indication as to whether the differences are
statistically significant. Some of the samples are very small (for example, for
Bangladeshi working women) and this would reduce the likelihood of the gaps being
statistically significant, though they are apparently large. Furthermore, calculations
based on the mean often produce different results from the median. In Tables 4.1
and 4.2, therefore, we show results separately for each gender based on the mean,
again for the entire period but for ease of presentation split into three groups of
seven years (eight years in the final group). All results are highly significant
statistically (p <.001) unless otherwise stated.
Table 4.1: Mean pay gaps of ethnic minority men relative to White British men
(£ per hour)
1993-1999 2000-2006 2007-2014
Black Caribbean -1.09 -0.57 -0.66
Black African -1.21 -1.11 -1.69
Indian -0.45** 0.03NS -0.69
Pakistani -2.73 -3.17 -3.30
Bangladeshi -5.28 -4.78 -4.32
Chinese -0.75(*) -0.12NS -0.68*
Note: Figures statistically significant at p < .001 except: ** p <.01; * p <.05; (*) p < .1; NS=not
statistically significant.
In the case of men, all ethnic minority groups in all three periods earned less than
White British men, with the exception of Indian men in the middle period (where the
difference was not statistically significant) and Chinese men (where the difference
was negative but still not significant). As above, Bangladeshi and Pakistani men
experienced the largest pay gaps. Indian men have experienced the smallest
difference in pay, followed by Chinese men.
Across the three time periods there was a clear improvement in pay for just one
group: Bangladeshi men. For all other groups except Pakistani men, who have
experienced continuous decline, the trend is one first of improvement but then
followed by deterioration. Relative to White British men, Black African, Indian and

The ethnic pay gap Research findings: the employment rates and pay gaps of ethnic minorities
Equality and Human Rights Commission - www.equalityhumanrights.com
Published: August 2017 36
Pakistani men were all worse off at the end of the period than they were at the
beginning.
Table 4.2 shows the situation for women, which is very different from men. Black
Caribbean, African and Chinese women have had hourly wages above those of
White British women (though in the third period this advantage had disappeared for
Black African women). Indian women also gained a pay advantage in the two later
time periods. Bangladeshi women experienced a pay gap but this was not
statistically significant for the first two time periods – almost certainly because too
few were in employment. However, by the third period the negative gap had become
both larger and statistically significant. Pakistani women, like Pakistani men, have
been worse off throughout the three time periods, though their position has been
relatively stable.
Table 4.2: Mean pay gaps of ethnic minority women relative to White British
women (£ per hour)
1993-1999 2000-2006 2007-2014
Black Caribbean 1.03 1.41 1.14
Black African 0.45* 0.50** 0.01NS
Indian -0.20NS 0.68 0.59
Pakistani -1.12 -0.49(*) -1.08
Bangladeshi -0.53NS -0.58NS -1.53
Chinese 1.87 0.87** 1.29
Note: Figures statistically significant at p < .001 except: ** p <.01; * p <.05; (*) p < .1; NS=not
statistically significant.
4.4 The living wage
As well as relative differences in pay between ethnic minorities and White British
people, it is also important to explore the proportion of those that receive low pay.
This offers an insight into those groups experiencing the most acute social and
economic disadvantage.

The ethnic pay gap Research findings: the employment rates and pay gaps of ethnic minorities
Equality and Human Rights Commission - www.equalityhumanrights.com
Published: August 2017 37
According to the Living Wage Foundation, the Living Wage is a level of salary which
is high enough to maintain a normal standard of living and is generally higher than
the National Minimum Wage. The figures produced by the Living Wage Foundation
estimated the Living Wage to be £7.20 per hour in 2011, rising to £7.45 in 2012,
£7.65 in 2013 and £7.85 in 2014. For London, the Living Wage was £8.30 per hour
in 2011, £8.55 in 2012, £8.80 in 2013 and £9.15 in 2014.4 In this report the Living
Wage is used purely as a benchmark against which to measure the relative pay of
different ethnic groups.
In Figures 4.9 and 4.10 below we show the proportion of men and women from each
ethnic group that are paid below the Living Wage. What we present here are
percentages averaged across the four years (2011-2014) taking into account an
individual's place of work (whether in London or outside). Pay here does not account
for inflation since we compare pay in each year with the Living Wage that was
deemed appropriate for that year.
4 Note that this is higher than the National Living Wage introduced in 2016. Since 1 April 2016, all employees
aged over 25 are entitled to be paid a minimum of £7.20 per hour. This is now called the National Living Wage.
Those under 25 receive the National Minimum Wage, which is, in 2016, £6.70 per hour for 21-25 year olds, £5.30
for 18-20 year olds, £3.87 for under-18s and £3.30 for most apprentices.

The ethnic pay gap Research findings: the employment rates and pay gaps of ethnic minorities
Equality and Human Rights Commission - www.equalityhumanrights.com
Published: August 2017 38
Figure 4.9: Proportion of men paid below the Living Wage by ethnicity
Figure 4.10: Proportion of women paid below the Living Wage by ethnicity
In line with the figures showing median pay, Figure 4.9 shows that the proportion of
employed men paid less than the Living Wage is lowest for White British, Black
Caribbean and Indian men (on or below 20%). About 28% of Black African and
0 10 20 30 40 50
Chinese
Black Caribbean
Black African
Bangladeshi
Pakistani
Indian
White British
% men paid below the Living Wage
0 10 20 30 40 50
Chinese
Black Caribbean
Black African
Bangladeshi
Pakistani
Indian
White British
% women paid below Living Wage

The ethnic pay gap Research findings: the employment rates and pay gaps of ethnic minorities
Equality and Human Rights Commission - www.equalityhumanrights.com
Published: August 2017 39
Chinese men are paid below the Living Wage, while the percentage increases to
about 35% for Pakistani men and 45% for Bangladeshi men.
A larger proportion of women than men are paid below the Living Wage, and
differences across ethnic minority groups seem slightly less pronounced than among
men (see Figure 4.10). About 20-25% of Chinese, Black Caribbean and Indian
women are paid below the Living Wage, compared with around 30% of White British
and Black African women. It is again Pakistani and Bangladeshi workers who are
more likely to be paid below the Living Wage (35-39%).
4.5 Summary
Employment rates among men vary, with some ethnic minorities, such as Indian
and Black African men not showing any important difference compared with
White British men. Employment rates among women are fairly similar, with the
exception of Pakistani and Bangladeshi women, who are much less likely than
White British women to have a paid job.
There are clear pay gaps for Pakistani and Bangladeshi men compared with
White British men while most ethnic minority women are paid similarly or more
than White British women.
There is a difference between the average pay gap between ethnic minorities and
the White British majority when this is measured within occupations rather than
across the whole economy. In some cases the occupational gap is less than the
general gap. This implies that the group in question tends to receive roughly
equal pay for equal work even when they work in low paid occupations. However,
both Bangladeshi and Pakistani men and women have seen a widening of the
occupational pay gap in recent years.

The ethnic pay gap Research findings: the drivers of ethnic pay gaps
Equality and Human Rights Commission - www.equalityhumanrights.com
Published: August 2017 40
5 |Research findings: the drivers of ethnic
pay gaps
5.1 Differences in characteristics
Before exploring what is driving differences in pay between ethnic groups, this
section of the report analyses the differences in characteristics among men and
women of different ethnicities. These are covered in detail Tables A1 and A2 in the
Appendix. There is a clear difference in age across groups: all ethnic minorities, with
the exception of Black Caribbean immigrants and Chinese immigrants, are on
average younger than White British people. This difference is even larger for British
ethnic minorities. Since pay tends to increase with age, we would therefore expect
most people from ethnic minorities to be paid less on average because of their
younger age.
Another important factor which determines pay is level of education. Consistent with
recent studies (for instance, Brynin and Longhi, 2015), most ethnic minorities have
higher qualifications than White British people; the only exceptions are Pakistani
immigrants, Bangladeshi immigrants and Black Caribbean people (both British-born
and immigrants). The qualification level of British ethnic minorities tends to be higher
than that of ethnic minority immigrants. Among women, none of the ethnic minorities
have lower qualifications than White British employees. In general, both male and
female immigrants have a higher proportion of ‘other’ qualifications. Some of these
are likely to be qualifications obtained abroad that do not correspond directly with the
British system. It is also possible that some of these qualifications are not recognised
in the British labour market.
In terms of pay, male Indian and Chinese immigrants are paid on average more than
White British people. As we have seen earlier in the report, Table A1 confirms that
Pakistani and Bangladeshi men have the highest pay gaps compared with White
British men. Among women, Pakistani, Bangladeshi and Black African immigrants
receive lower average pay than White British women, but the pay gaps are not as
large as those among men (see Table A2).

The ethnic pay gap Research findings: the drivers of ethnic pay gaps
Equality and Human Rights Commission - www.equalityhumanrights.com
Published: August 2017 41
Part-time and temporary jobs tend to pay on average lower wages, while wages tend
to increase with years of job tenure. In most cases ethnic minority men are more
likely to work part-time (with the exception of Indian men), to have a temporary job
and shorter job tenure than White British men. With the exception of some groups,
ethnic minorities are also less likely to work in the public sector. Among women,
most ethnic minorities seem less likely to work part-time than White British women,
with the exception of female Pakistani and Bangladeshi immigrants. However, ethnic
minority women are generally more likely to have a temporary job and tend to have
shorter job tenure. With the exception of Indian and Chinese women, ethnic minority
women are more likely to work in the public sector than White British women.
5.2 The impact of characteristics on the pay gaps of ethnic
minority men
To analyse the impact that employee and job characteristics have on pay gaps we
compare the ‘raw’ pay gaps and the ‘adjusted’ pay gaps.
Raw pay gaps measure those experienced on average by ethnic minorities and do
not take into account that ethnic minorities have different characteristics from White
British people. In contrast to the raw pay gaps, the adjusted pay gaps take these
characteristics into account. The analysis factors in a range of characteristics: age
(to measure labour market experience), highest qualification obtained as a measure
of skills, whether married or cohabiting, and whether there are dependent children in
the household. We also include details of whether the respondent has a long-term
illness.
The analysis also includes characteristics of the job such as the following:
Type of occupation (managerial, professional, administrative, and so on)
Years of job tenure
Full or part-time (part-time meaning less than 30 hours per week)
The usual number of hours worked (excluding overtime), the number of hours of
paid overtime, and the number of hours of unpaid overtime
Temporary or permanent job status
Whether based in the public sector or not
Geographical location including London (where pay is comparatively higher),
Wales or Scotland.

The ethnic pay gap Research findings: the drivers of ethnic pay gaps
Equality and Human Rights Commission - www.equalityhumanrights.com
Published: August 2017 42
The full list of characteristics and the raw and adjusted pay gaps are in Tables A3-A5
(Appendix).
It is important to bear in mind that other characteristics, which we cannot measure in
our data, may affect pay and pay gaps. For example, a proportion of ethnic minority
workers who were born abroad will have gained their qualifications outside the UK.
Qualifications that are not recognised by employers in the UK may lead to lower pay.
However, in our data we do not know whether the qualification was obtained abroad,
and therefore whether or not it was recognised by the employer. For this reason, our
aim here is not to explain the pay gaps but to analyse, among the characteristics
which we can measure, which ones have the most relevant impact on the pay gaps.
The raw pay gaps for men belonging to ethnic minorities are shown in Figure 5.1. In
this figure the vertical axis lists the ethnic groups while the horizontal axis measures
the pay gaps. The average pay gap for each ethnic minority group compared with
White British men is shown by the dots, while the horizontal lines either side of the
dots show the minimum and maximum value of the pay gap at a confidence level of
95%. This means that with a 95% probability the pay gap ranges between the
minimum and maximum value. When the line crosses the vertical line at zero it
means that the gap may be either positive or negative, or zero. In this situation we
cannot confidently say that there is a pay gap. The larger the confidence interval (the
longer the horizontal line through the dot), the greater the uncertainty about the size
of the pay difference. Pay gaps are shown with positive values – these are the dots
to the right hand side of the vertical line. Negative values, those to the left of the
vertical line, indicate pay advantages.

The ethnic pay gap Research findings: the drivers of ethnic pay gaps
Equality and Human Rights Commission - www.equalityhumanrights.com
Published: August 2017 43
Figure 5.1: Pay gaps of ethnic minority men
Figure 5.1 shows that there are no pay gaps for Indian British, Black African British,
or Chinese men (whether British or Chinese-born), while Indian immigrant men seem
to be paid on average about 2.9% more than White British men. The largest pay
gaps are for Bangladeshi immigrants (about 47.8%), Pakistani immigrants (30.9%)
and Bangladeshi British men (25.7%). Pay gaps are 19.4% for Black African
immigrants, 18.7% for Pakistani British, 17.4% for Black Caribbean immigrants and
6.9% for Black Caribbean British. In all cases, the pay gaps of ethnic minority British
people are smaller than the pay gaps of immigrants from the same ethnic group.
Which characteristics contribute most to pay gaps? In the following figures we show
the raw pay gap (first bar) and how much of this raw pay gap is explained by the fact
that ethnic minority people have different characteristics than White British people
(second bar). The ‘explained’ bar tells us by how much the pay gap would be
reduced if people from ethnic minorities had the same characteristics as White
British people.
The 'adjusted' pay gap, which is the remaining pay gap once we take characteristics
into account, can be calculated by subtracting the 'explained' value from the raw pay

The ethnic pay gap Research findings: the drivers of ethnic pay gaps
Equality and Human Rights Commission - www.equalityhumanrights.com
Published: August 2017 44
gap. The graphs also show the four main characteristics that contribute to the gaps
and the four main characteristics that mitigate the gaps. The bars that go in the same
direction of the pay gap (upwards, above zero) contribute to the gap, while the bars
that go in the opposite direction (downwards, below zero) reduce it.
The explained bar is the sum of all characteristics that contribute to and reduce the
pay gap and therefore gives us an indication of how much of the pay gap is
explained by the combination of the characteristics we analyse. It is possible that the
sum of the positive and negative contributions is zero; in this case the explained bar
would be zero, but we can still see what characteristics reduce or increase the pay
gap. In some cases the explained bar may even be taller than the pay gap itself. This
may occur if more characteristics reduce than explain the pay gap and indicates that
if the minority group had the same characteristics as White British people their pay
gap would be even larger than it actually is.
For example, we know that pay in London is higher than pay in the rest of the UK
and ethnic minority people are more likely to work in London than White British
people. If the proportion of ethnic minority people working outside London was the
same as that of White British people, on average the pay of ethnic minority workers
would be lower and pay gaps would be larger.
The figures below only show the main determinants, and only for those ethnic
minorities where there are clear pay gaps, as shown in Figure 5.1. The full set of
results is reported in Table A4 in the Appendix.

The ethnic pay gap Research findings: the drivers of ethnic pay gaps
Equality and Human Rights Commission - www.equalityhumanrights.com
Published: August 2017 45
5.2.1 Pakistani men
Figure 5.2: Impact of characteristics on pay gaps for Pakistani men born
abroad
Figure 5.2 shows that male Pakistani immigrants experience a 30.9% pay gap, of
which about half can be explained by taking characteristics into account, while the
rest is unexplained by the data. Figure 5.2 shows that a large proportion of the pay
gap is associated with being a Muslim. It ought to be borne in mind that a very high
proportion of Pakistani immigrants are Muslim, therefore this association may not be
particularly meaningful. The numbers of non-Muslim Pakistani immigrants, with
which to draw a comparison, are likely to be both very small and they may possess
other characteristics which have a bearing on pay, aside from religion. Much deeper
investigation would be needed to determine the extent and nature of the impact of
religion on pay gaps, if indeed there is one.
The other most important drivers of the pay gaps of male Pakistani immigrants are
occupation and working part-time hours. Pakistani immigrant men are more likely
than White British men to work in part-time jobs and in Elementary and Machine
operative occupations. On the other hand, their under-representation in Skilled
occupations mitigates the pay gap very slightly. First of all, despite their label, Skilled
occupations are not among the highest paid ones: these jobs are mostly in the
‘agricultural and related trades’, ‘metal, electrical and electronic trades’, ‘construction
and building trades’, and ‘textiles and printing’ industries. Although they require skills
that are often acquired with job training, they do not often require high levels of
31%
17%
11%
6%
3% 3%
-2% -2% -2% -3%
-10%
-5%
0%
5%
10%
15%
20%
25%
30%
35%

The ethnic pay gap Research findings: the drivers of ethnic pay gaps
Equality and Human Rights Commission - www.equalityhumanrights.com
Published: August 2017 46
educational qualifications. In addition, although Skilled occupations, in general, are
not among the lowest paid occupations for White British people, they are, however,
for ethnic minority workers. Because of the nature of such jobs, ethnic minority
people working in Skilled occupations are paid similarly to people from ethnic
minorities working in Elementary or in Machine operative occupations.
Figure 5.2 also shows that being more likely to work in London, where for all workers
pay is on average higher than in the rest of the country, partly reduces the pay gap
of male Pakistani immigrants. This highlights the problems of previous studies
focusing only on the proportion of the pay gap which is explained (see the discussion
in Chapter three). Those studies which do not include information on the place of
work are likely to find that a much larger proportion of the pay gap is explained,
simply because some important factors counteracting the pay gaps have been left
out of the analysis.
Pakistani men that have come to live in the UK are also more likely than White
British men to be married and this has a positive impact on their pay. This does not
mean that marriage increases pay, but men who are married may have other
unmeasured characteristics that are associated with high pay. Perhaps surprisingly,
we also find that hours worked decrease the pay gap. This is because, when working
full-time, Pakistani migrant men work on average about half an hour less than White
British men. Since most people are paid per week or month, working fewer hours for
the same weekly or monthly pay translates into higher pay per hour. By contrast,
part-time Pakistani immigrant men work more than one hour longer than White
British men and this contributes to the negative impact of part-time work.
The pay gap for British-born Pakistani men is 18.7%. This is smaller than the pay
gap for Pakistani immigrants and is completely explained by their characteristics
(see Figure 5.3). As we explained earlier, the reason that the ‘explained’ bar is
bigger than the pay gap itself is because more characteristics reduce rather than
explain the pay gap: British-born Pakistani men have more positive than negative
characteristics compared with White British men when it comes to drivers of pay. In
this case, if the distribution of characteristics of British-born Pakistani men was the
same as White British men, the pay gap would be even bigger than it actually is.

The ethnic pay gap Research findings: the drivers of ethnic pay gaps
Equality and Human Rights Commission - www.equalityhumanrights.com
Published: August 2017 47
Figure 5.3: Impact of characteristics on pay gaps for Pakistani men born in the
UK
Similarly to male Pakistani immigrants, the main determinant of the pay gap for
British Pakistani men is their Muslim religion, although the caveat provided above
must again be borne in mind (a clear majority of Pakistani men are Muslim). British
Pakistani men also tend to be concentrated in low paid occupations, such as Sales
and Elementary occupations; however, they are underrepresented in Machine
operatives and Skilled occupations, which partly reduces the pay gap (due to the low
pay of these occupations).
Thus, although occupational segregation is an important determinant of pay gaps for
both groups of Pakistani men, those who are born abroad are often found in the
lowest paid occupations, while those who are born in the UK tend to go into slightly
better paid occupations, albeit ones that also pay relatively poorly.
The accumulation of work experience and career progression means that for most
people pay increases with age. British Pakistani men are on average much younger
than White British men, and this partly contributes to their pay gap. It could be that
their pay gap will decrease in the future as British Pakistani men get older and
accumulate work experience.
We also find that British Pakistani men are more likely than White British men to
have NVQ 4 qualifications and above (higher education qualifications such as a
degree, diploma or HND, for example) and this partly reduces the pay gap. British
19% 19%
10% 8%
6%
2%
-2% -2% -3% -4%
-10%
-5%
0%
5%
10%
15%
20%
25%

The ethnic pay gap Research findings: the drivers of ethnic pay gaps
Equality and Human Rights Commission - www.equalityhumanrights.com
Published: August 2017 48
Pakistani men are therefore concentrated in low-paid occupations despite the high
proportion of highly qualified workers. Finally, similarly to the case of immigrants, we
find that British Pakistani men tend to work fewer hours than White British men and
this partly reduces their pay gap.
5.2.2 Bangladeshi men
Bangladeshi men that have settled in the UK experience a large pay gap of 47.8%,
which decreases to 30.7% once we take characteristics into account. About a third of
the pay gap is explained by characteristics, suggesting that we do not have a clear
explanation for the gap.
Figure 5.4: Impact of characteristics on pay gaps for Bangladeshi men born
abroad
The main positive and negative determinants of pay gaps for male Bangladeshi
immigrants are remarkably similar to the determinants of pay gaps for Pakistani
immigrants. The most important is their Muslim religion, followed by
overrepresentation in part-time jobs and in low-paid occupations such as Elementary
and Skilled occupations. Similarly to male Pakistani immigrants, male Bangladeshi
immigrants are more likely than White British men to work in London, to be married,
and to work fewer hours. All these factors, together with their under-representation in
Machine operative occupations, mitigate the pay gap, although only partially.
48%
17% 12%
8% 8% 4%
-2% -2%
-9% -9%
-20%
-10%
0%
10%
20%
30%
40%
50%
60%

The ethnic pay gap Research findings: the drivers of ethnic pay gaps
Equality and Human Rights Commission - www.equalityhumanrights.com
Published: August 2017 49
In terms of pay gaps, the experience of British Bangladeshi men is similar to the
experience of British Pakistani men (see Figure 5.5 below).
Figure 5.5: Impact of characteristics on pay gaps for Bangladeshi men born in
the UK
British Bangladeshi men experience a pay gap of 25.7%, roughly two-thirds of which
is explained by their characteristics (see Figure 5.5). Similarly to British Pakistani
men, age and religion are the main determinants of pay gaps for British Bangladeshi
men, although in this case age is a larger contributory factor than religion. British
Bangladeshi men are also overrepresented in Administrative and Sales occupations,
and this partly contributes to their pay gaps. However, similarly to Bangladeshi
immigrants, the pay gap of British Bangladeshi men is partly reduced by their
concentration in London and under-representation in Skilled occupations. Their
shorter working hours also contribute to reduce the pay gaps.
26%
18%
12%
9%
4% 4%
-4% -4%
-10% -15%
-10%
-5%
0%
5%
10%
15%
20%
25%
30%

The ethnic pay gap Research findings: the drivers of ethnic pay gaps
Equality and Human Rights Commission - www.equalityhumanrights.com
Published: August 2017 50
5.2.3 Black African immigrant men
Black African men that have moved to the UK experience a raw pay gap of 19.4%
which remains largely unchanged when we control for characteristics. Figure 5.6
shows that the positive and negative drivers of pay tend to balance each other out,
so that the raw pay gap is essentially the same as the adjusted pay gap (in other
words, taking all positive and negative characteristics into account, the pay gap
cannot be explained by the data). This highlights the importance of analysing the
factors that improve pay as well reduce it.
Figure 5.6: Impact of characteristics on pay gaps for Black African men born
abroad
A drag on the pay of male Black African immigrants is their overrepresentation in
Elementary and in Caring and leisure occupations. In contrast to other ethnic groups,
Black African immigrant men are underrepresented among people with NVQ level 3
qualifications and tend to have shorter job tenure; both factors reduce pay.
On the other hand, and similarly to most ethnic minorities, Black African immigrant
men are over-represented in London, a characteristic which improves their pay. This
group is also over-represented among people with high qualifications (NVQ 4 or
above), and underrepresented in Skilled occupations, and this also improves pay.
19%
8%
5% 3%
2%
-2% -3%
-6%
-10%
-15%
-10%
-5%
0%
5%
10%
15%
20%
25%
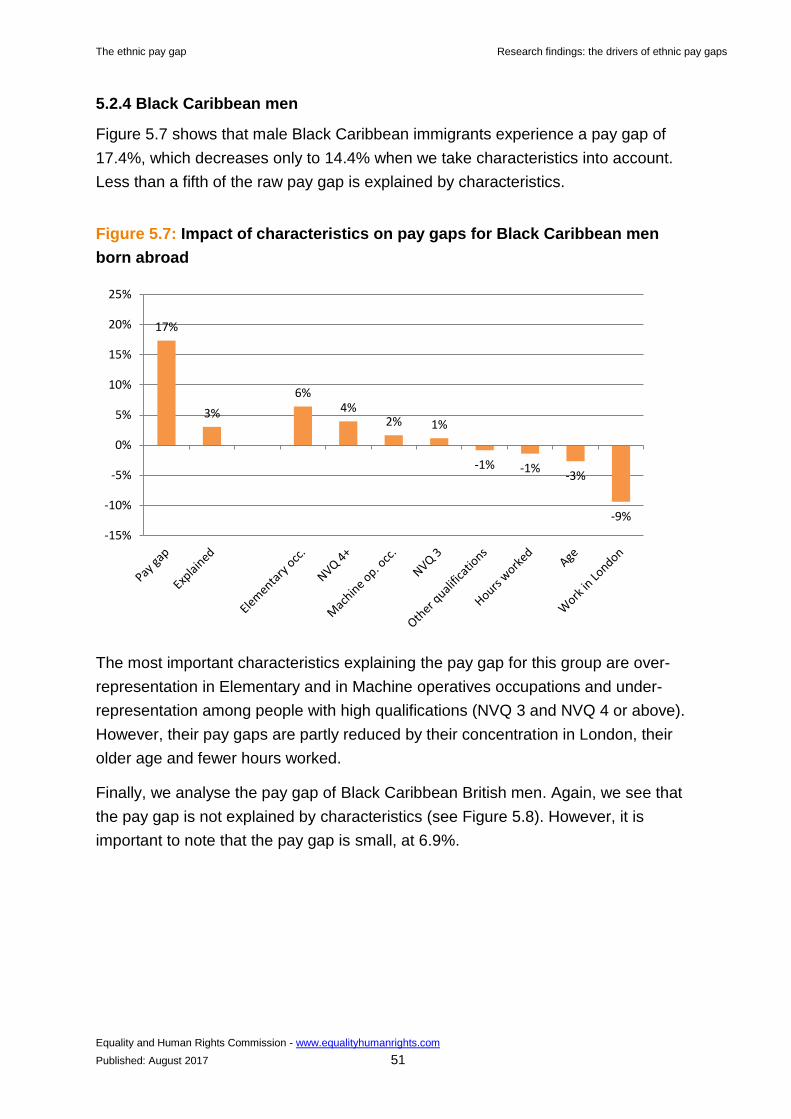
The ethnic pay gap Research findings: the drivers of ethnic pay gaps
Equality and Human Rights Commission - www.equalityhumanrights.com
Published: August 2017 51
5.2.4 Black Caribbean men
Figure 5.7 shows that male Black Caribbean immigrants experience a pay gap of
17.4%, which decreases only to 14.4% when we take characteristics into account.
Less than a fifth of the raw pay gap is explained by characteristics.
Figure 5.7: Impact of characteristics on pay gaps for Black Caribbean men
born abroad
The most important characteristics explaining the pay gap for this group are over-
representation in Elementary and in Machine operatives occupations and under-
representation among people with high qualifications (NVQ 3 and NVQ 4 or above).
However, their pay gaps are partly reduced by their concentration in London, their
older age and fewer hours worked.
Finally, we analyse the pay gap of Black Caribbean British men. Again, we see that
the pay gap is not explained by characteristics (see Figure 5.8). However, it is
important to note that the pay gap is small, at 6.9%.
17%
3%
6% 4%
2% 1%
-1% -1% -3%
-9%
-15%
-10%
-5%
0%
5%
10%
15%
20%
25%

The ethnic pay gap Research findings: the drivers of ethnic pay gaps
Equality and Human Rights Commission - www.equalityhumanrights.com
Published: August 2017 52
Figure 5.8: Impact of characteristics on pay gaps for Black Caribbean men
born in the UK
The most important determinant of pay for Black Caribbean British men is their
concentration in London, which contributes to an increase in pay on average.
However, in spite of the supposed advantage this brings, this group still experiences
a pay gap overall, albeit a fairly small one. In essence, for all ethnic minorities, and
especially for Black Caribbean men, pay gaps are reduced by the fact that they work
in London, where jobs tend to have higher pay.
For Black Caribbean British men, underrepresentation among people with high levels
of qualifications (NVQ 4 or above), among married people, and short job tenure,
together with their overrepresentation in Sales occupations, contribute to the
explanation of the pay gap. Black Caribbean British men are on average slightly
younger than White British men, but older than other British ethnic minority groups.
In this case, age, together with hours worked, partly reduces the pay gap.
In summary, occupations and qualifications are important determinants of pay gaps
for all groups of men, although different ethnic minorities are concentrated in
different, albeit generally low paid occupations and have varying levels of
qualification.
An interesting finding is that the concentration of ethnic minorities in London, where
pay is comparatively higher for all jobs, tends to mitigate pay gaps for all ethnic
minorities. This ‘London effect’ is consistent for all ethnic minorities, even those for
7%
2% 1% 1% 1%
-1% -2%
-9%
-12%
-10%
-8%
-6%
-4%
-2%
0%
2%
4%
6%
8%
10%

The ethnic pay gap Research findings: the drivers of ethnic pay gaps
Equality and Human Rights Commission - www.equalityhumanrights.com
Published: August 2017 53
whom we do not observe a pay gap. However, this suggests that for all ethnic
minorities we find a much larger pay gap when we take into account their
concentration in London.
Being Muslim has a negative impact on pay for Pakistani and Bangladeshi men (and
for Indian immigrant men, even though they do not have a pay gap). Being Muslim
cannot be considered an explanation for pay gaps; however, the data suggest that
inequalities exist for some religious groups – bearing in mind the fact that there is a
strong link between ethnicity and religion. For example, the vast majority of Pakistani
and Bangladeshi men are Muslim, therefore those that are not are likely to be both
small in number and may have other unique characteristics which affect their pay.
Of the six major ethnic minorities, when it comes to British-born men, three of these
groups experience pay gaps: these are Pakistani, Bangladeshi and Black Caribbean
men. Chinese, Black African and Indian British-born men do not experience a pay
gap. Where pay gaps occur they are partly explained by the younger average age,
and therefore shorter work experience, of this group.
5.3 The role of characteristics on pay gaps for ethnic minority
women
The pay gaps experienced by ethnic minority women compared with White British
women are shown in Figure 5.9. The worker and job characteristics that have the
largest impact on female pay gaps, for the two groups that do experience a gap, are
shown in Figures 5.10 (Pakistani immigrants) and 5.11 (Bangladeshi immigrants),
while Table A5 in the Appendix shows the full set of results.

The ethnic pay gap Research findings: the drivers of ethnic pay gaps
Equality and Human Rights Commission - www.equalityhumanrights.com
Published: August 2017 54
Figure 5.9: Pay gaps of ethnic minority women
Figure 5.9 shows that among women there are no pay gaps for any ethnic minority
with the exception of Pakistani and Bangladeshi immigrants. The pay gaps for
Pakistani and Bangladeshi immigrant women, however, are much lower than those
experienced by Pakistani and Bangladeshi immigrant men: Pakistani immigrant
women are paid 11.5% less than White British women, while Pakistani immigrant
men are paid 30.9% less than White British men. The pay gaps are 11.8% for
Bangladeshi immigrant women compared with White British women and 47.8% for
Bangladeshi immigrant men compared with White British men.
Indian, British Black African, British Black Caribbean and Chinese women all seem
to have higher pay, on average, than White British women. Here, however, we
cannot draw any conclusion about how the pay of ethnic minority women compares
with the pay of ethnic minority men. For this analysis see Chapter six.

The ethnic pay gap Research findings: the drivers of ethnic pay gaps
Equality and Human Rights Commission - www.equalityhumanrights.com
Published: August 2017 55
5.3.1 Pakistani immigrant women
Figure 5.10: Impact of characteristics on pay gaps for Pakistani women born
abroad
Pakistani immigrant women experience a pay gap of 11.5% and most of it is
explained by characteristics, particularly their concentration in Elementary and in
Machine operatives occupations, and by their short job tenure. Perhaps
unsurprisingly at this point, pay gaps of Pakistani immigrant women are partly
reduced by their concentration in London, under-representation in Administrative
occupations and under-representation among Christians since, for both men and
women people who do not affiliate to any religion have on average higher pay than
people who do.
11%
10%
6%
3% 1% 1%
-1% -1%
-3% -4%
-6%
-4%
-2%
0%
2%
4%
6%
8%
10%
12%
14%

The ethnic pay gap Research findings: the drivers of ethnic pay gaps
Equality and Human Rights Commission - www.equalityhumanrights.com
Published: August 2017 56
5.3.2 Bangladeshi immigrant women
Figure 5.11: Impact of characteristics on pay gaps for Bangladeshi women
born abroad
For Bangladeshi immigrant women we observe a pay gap of 11.8%, which
decreases only to 8% when characteristics are taken into account. Hence, only
about a third of the pay gap is explained by their characteristics. Similarly to
Bangladeshi men, a large proportion of their pay gap is explained by their
overrepresentation among Muslims, followed by their concentration in Caring and
leisure occupations. Their short job tenure also plays a part. Similarly to all other
ethnic minority groups, their concentration in London partly mitigates the pay gap,
together with their underrepresentation in Administrative occupations and among
Christians.
As is the case for men, women’s qualifications and occupation play an important role
in pay gaps and advantages although, again, the concentration of ethnic minority
women in London either drives a pay advantage or mitigates a pay disadvantage.
Religion also plays a role, although this seems to be less of a driver for women than
it is for men. In contrast with men, most ethnic minority women experience a pay
advantage compared with White British women, particularly in the case of British-
born ethnic minorities where the advantage is often substantial. This is in spite of
ethnic minorities’ younger average age – and therefore shorter labour market
experience – which acts as a drag on pay.
12%
4%
8%
6%
2% 1%
-1% -2%
-4%
-13% -15%
-10%
-5%
0%
5%
10%
15%

The ethnic pay gap Research findings: the drivers of ethnic pay gaps
Equality and Human Rights Commission - www.equalityhumanrights.com
Published: August 2017 57
5.4 Summary
We observe pay gaps for most ethnic minority men that are immigrants and also
those born in the UK, but the pay gaps are much smaller for the latter. Pay gaps
are very large for Pakistani and Bangladeshi men. Among women, only those that
have immigrated to the UK from Pakistan or Bangladesh experience pay gaps,
while all other groups experience either no pay gap or a pay advantage.
Pay gaps among women are substantially lower than among men.
Pay gaps are almost completely explained for women and for British-born ethnic
minority men. Pay gaps for Black male immigrant groups remain unexplained.
Certain characteristics seem relevant to the pay gaps for all ethnic minorities and
for both genders, particularly occupation and level of qualifications. In some
cases these factors ameliorate pay, but more often than not they contribute to a
pay disadvantage. In addition, most ethnic minorities are concentrated in London,
where pay is comparatively higher for all jobs; this tends to mitigate pay gaps for
men and explain pay advantages for women.
Muslims are paid on average less than people who do not affiliate to any religion.
This is a problem especially for Pakistani and Bangladeshi people, and
particularly for men. As explained above, being Muslim cannot be considered a
standalone explanation of pay gaps. The strong association between religion and
ethnicity for certain groups means this finding must be treated with caution.
Furthermore, there may be other differences in characteristics or behaviour which
are not included in our analysis.
Although certain British-born ethnic minorities do not experience pay gaps, the
results indicate that their young age and short job tenure drag down pay.

The ethnic pay gap How do ethnic minority women and men compare?
Equality and Human Rights Commission - www.equalityhumanrights.com
Published: August 2017 58
6 |How do ethnic minority women and
men compare?
6.1 Ethnic pay gaps relative to White British men
In the previous chapters we have focused on how the pay of ethnic minority men
compares with the pay of White British men, and how the pay of ethnic minority
women compares with that of White British women. In this chapter we show how the
pay of ethnic minority women compares with the pay of men from the same ethnic
minority group and to the pay of White British men. Such pay gaps are shown in
Figure 6.1 and in Table A6 in the Appendix.

The ethnic pay gap How do ethnic minority women and men compare?
Equality and Human Rights Commission - www.equalityhumanrights.com
Published: August 2017 59
Figure 6.1: Summary of pay gaps of ethnic minority men and women

The ethnic pay gap How do ethnic minority women and men compare?
Equality and Human Rights Commission - www.equalityhumanrights.com
Published: August 2017 60
Over the period 2002-2014 White British women experienced a pay gap of about
23.6% relative to White British men. Indian women (both immigrant and British-born)
earned more than White British women, but still less than White British men and
Indian men. The pay gap for Indian immigrant women is 19.6% compared with White
British men, while the pay gap for British Indian women is only 7%. As already
shown in the previous chapter, there are no pay gaps for Indian men. Among
Chinese people, only female immigrants experience a pay gap (17.2%).
The pay gaps of Pakistani immigrant men and women are 30.9% and 35%
respectively, relative to White British men. Although the difference between Pakistani
immigrant men and women is not large, both experience pay gaps that are larger
than the pay gap of White British women. British-born Pakistani men and women
experience pay gaps similar to the pay gaps of White British women (18.7% and
26.9%). Among Bangladeshi people, women seem to have smaller pay gaps than
men: immigrant men are those with the largest pay gaps (47.8%) followed by
immigrant women (35.4%). Pay gaps for British Bangladeshi men are 25.7% and for
British Bangladeshi women 20.9%. In both cases these are statistically similar to the
pay gap of White British women (the confidence intervals in Figure 6.1 overlap).
Among Black African people, male and female immigrants experience pay gaps that
are similar to those of White British women (19.4% and 25.6% respectively) while
Black African British men and women do not have a pay gap compared with White
British men and are therefore paid more than White British women. Among Black
Caribbean people, we do not see much difference between men and women: pay
gaps of Black Caribbean immigrant men and women are 17.4% and 20.3%
respectively while British Black Caribbean men and women experience respective
pay gaps of 6.9% and 7.2% compared with White British men.
6.2 The gender pay gap within ethnic minorities
This section of the report considers the gender pay gap for each of the ethnic
minorities and looks at change over time. The purpose is to explore gender
differences within different ethnic groups in order to provide some insight into the
intersection of gender and ethnicity. In the following graphs the vertical axis shows
pounds per hour; if this figure is negative, that is, the curve is below the zero line, it
means women earn less than men. All these graphs are based on median wages. As
the focus here is on the gender, much of the analysis and narrative focuses on
women’s position in relation to men. Women have tended to earn less than men
overall, although some of the graphs below run counter to this trend.

The ethnic pay gap How do ethnic minority women and men compare?
Equality and Human Rights Commission - www.equalityhumanrights.com
Published: August 2017 61
Figure 6.2: The general and occupational gender pay gaps (Black Caribbean
people)
The results in Figure 6.2 for Black Caribbean people show that the pay gaps were in
the past mostly in favour of women, while the occupational gap was larger than the
general gap. However, in recent years women have begun to experience a slight pay
disadvantage compared with men, both generally and within occupations.
-.5
0
.5
1
1.5
£ p
er
hour
1995 2000 2005 2010 2015 year
general occupational

The ethnic pay gap How do ethnic minority women and men compare?
Equality and Human Rights Commission - www.equalityhumanrights.com
Published: August 2017 62
Figure 6.3: The general and occupational gender pay gaps (Black African
people)
Black African women have also tended to have a pay advantage over men, albeit a
fluctuating one. The occupational and general gaps have converged, though in the
last few years they have changed position. As with Black Caribbean people, there is
a pattern of female advantage within ethnic minorities which then declines later in the
period.
0
.5
1
1.5
£ p
er
hour
1995 2000 2005 2010 2015 year
general occupational

The ethnic pay gap How do ethnic minority women and men compare?
Equality and Human Rights Commission - www.equalityhumanrights.com
Published: August 2017 63
Figure 6.4: The general and occupational gender pay gaps (Indian people)
According to Figure 6.4 Indian women have been doing better than Indian men,
although the advantage has been in continuous decline over much of the period. The
general gap has tended to be bigger than the occupational one, although both are
now similarly small.
0
1
2
3
£ p
er
hour
1995 2000 2005 2010 2015 year
general occupational

The ethnic pay gap How do ethnic minority women and men compare?
Equality and Human Rights Commission - www.equalityhumanrights.com
Published: August 2017 64
Figure 6.5: The general and occupational gender pay gaps (Pakistani people)
This is again similar to the preceding patterns in that women's pay advantage has
declined over time. The occupational gap has been higher than the general gap,
although the latest data suggest both gaps are close to zero.
-1
0
1
2
3
£ p
er
hour
1995 2000 2005 2010 2015 year
general occupational

The ethnic pay gap How do ethnic minority women and men compare?
Equality and Human Rights Commission - www.equalityhumanrights.com
Published: August 2017 65
Figure 6.6: The general and occupational gender pay gaps (Bangladeshi
people)
The Bangladeshi pay gap is unexpected but is due to the small sample size for
Bangladeshi women. The smoothed lines mask a great deal of actual fluctuation.
Overall, though, it seems clear that the general gap has been consistently in favour
of Bangladeshi men. However, the occupational pay gap has tended to favour
women but, even in this case, men now have the advantage. This pattern is
therefore unlike the previous patterns.
-1.5
-1
-.
5
0
.5
1
£ p
er
hour
1995 2000 2005 2010 2015 year
general occupational

The ethnic pay gap How do ethnic minority women and men compare?
Equality and Human Rights Commission - www.equalityhumanrights.com
Published: August 2017 66
Figure 6.7: The general and occupational gender pay gaps (Chinese)
There is also considerable fluctuation for Chinese people, again because of a small
sample size, this time for both men and women. Again, the smoothed lines mask the
fluctuation. The picture is not very clear but suggests a rising occupational gap in
favour of Chinese women and until recently a declining general gap in their favour.
This is again a distinctive pattern.
Summarising these results for ethnicity, it is of note that the general trend in the
whole sample is towards a reduced gender pay gap from a starting position of
female advantage. This pattern is clear, though we do not know directly from this if
the position of men has improved or that the position of women has deteriorated.
These results imply that gender and ethnicity, when combined, have not created a
'double disadvantage' for women in ethnic minorities. As we have seen, many ethnic
minority women are paid more than both White British women and men of the same
ethnicity. That is not to say, of course, that these groups do not face barriers and
discrimination.
There is some difference between the women of different ethnic minority groups but
mostly in respect of the relative positions of the general and occupational pay gaps.
In some cases the general pay gap has been bigger than the occupational gap (for
Black African, Indian and Chinese women). This implies that women in these groups
-.5
0
.5
1
1.5
£ p
er
hour
1995 2000 2005 2010 2015 year
general occupational

The ethnic pay gap How do ethnic minority women and men compare?
Equality and Human Rights Commission - www.equalityhumanrights.com
Published: August 2017 67
have been able to enter relatively high-paying occupations rather than receiving
substantial pay benefits from, for example, being in better jobs within these
occupations.
For Black Caribbean and Pakistani women the gaps have been mostly in women's
favour and the occupational gap has been higher. In this case where they have been
doing broadly the same work as the equivalent men they have generally earned
more. For Bangladeshi people the general gap has been uniformly unfavourable to
women but the occupational gap has mostly been favourable. This implies that
Bangladeshi women do well relative to Bangladeshi men where they share
occupations. The concentration of Bangladeshi women in low-paying occupations is
therefore the likely driver of the general pay gap.
The ethnic pay gap Conclusions
Equality and Human Rights Commission - www.equalityhumanrights.com
Published: August 2017 68
7 |Conclusions
In this report we have measured pay gaps for the main ethnic minorities compared
with White British people in Great Britain in order to identify which factors most
contribute to differences in pay. To have a better picture of how pay gaps vary by
groups we have compared Indian, Pakistani, Bangladeshi, Black African, Black
Caribbean and Chinese people, and within each group we have compared those
born abroad with those born in the UK.
In addition, to analyse whether ethnicity has a different impact on men and women
we have estimated pay gaps for ethnic minority men compared with White British
men, and for ethnic minority women compared with White British women. Finally, we
have explored gender pay disparities within ethnic groups.
Whether a person is foreign or British-born is an important factor in determining pay.
While most ethnic minority men born abroad experience pay gaps, Black African,
Chinese and Indian men born in the UK are paid similarly to White British men.
British-born Pakistani, Bangladeshi and Black Caribbean men do experience a pay
gap, however. Among women, only Pakistani and Bangladeshi immigrants
experience pay gaps, while all other ethnic groups are paid the same as, or more
than, White British women. Evidently, people who are born and brought up in the UK
are much less likely to face the types of language and cultural barriers confronted by
immigrants, and this has an effect on pay.
The research has shown that in the period 2011-2014 almost half of Bangladeshi
men and around a third of Pakistani men were paid below the Living Wage,
compared with under a fifth of White British men. Around 30% of White British
women were paid below the Living Wage, compared with almost 40% of
Bangladeshi women and just over a third of Pakistani women. This highlights the
strong prevalence of ethnic minorities in low-paid work.
Chapter five analysed the characteristics of different ethnic groups, such as age,
occupation and educational attainment, to quantify the extent to which these were
driving differences in pay. Some common patterns emerged, with young age, over-
representation in low-paid occupations and lower educational qualifications tending
to drag down the pay of ethnic minorities. Being a Muslim is associated with low pay,

The ethnic pay gap Conclusions
Equality and Human Rights Commission - www.equalityhumanrights.com
Published: August 2017 69
although this is likely to be because of the close link between Islam and ethnicity in
Britain. The concentration of ethnic minorities in high-paying London, on the other
hand, tends to mitigate pay gaps.
Pay gaps for Black immigrant men (both African and Caribbean) remain largely
unexplained by the data, and the pay gaps for several other ethnic groups are only
partially explained by their personal characteristics. This highlights the limitations of
this kind of analysis and suggests other factors may have an influence. Just because
a pay gap cannot currently be fully explained by this analysis, however, does not
necessarily mean there is discrimination at play. Nevertheless, it begs the question
why such groups are apparently underperforming; as shown in Chapter three,
previous research has found evidence of racial discrimination by employers.
Similarly, as mentioned, occupations and qualifications are relevant to pay gaps for
all ethnic minorities analysed in this report. However, we also find that the picture is
quite varied as different ethnic minorities are concentrated in different occupations.
Most people from ethnic minorities born in the UK, with the exception of British Black
Caribbean men, have higher than average levels of qualifications, which reduces pay
gaps.
Despite this, higher proportions of ethnic minority people are found in low-paid
occupations and almost all groups are over-represented in the lowest-paid
Elementary occupations. This suggests that people from ethnic minorities are facing
difficulties accessing higher-paid occupations. Again, this does not necessarily mean
discrimination is occurring, although that could be a factor. Just as likely is the
difficulty that some ethnic minorities face in penetrating established social and
professional networks and accessing the opportunities they afford. Ethnic groups
may also have different attitudes and career aspirations, an issue which is often
linked to social disadvantage generally.
The findings from this report highlight several areas where targeted action and
further research could help to address ethnic pay gaps. It would be helpful to:
identify and remove barriers to the entry of people from ethnic minorities into
higher-paying occupations
raise educational attainment among those groups that are under-performing
conduct further research into the ethnic minority pay gaps which are unexplained
or only partially explained
investigate career development and pathways for ethnic minorities, particularly
those that are starting out on their careers, and

The ethnic pay gap Conclusions
Equality and Human Rights Commission - www.equalityhumanrights.com
Published: August 2017 70
conduct more in-depth research into the links between geography and ethnic
minority pay gaps to take better account of the 'London effect' which lifts the
overall pay of ethnic minorities but hides regional variations.

The ethnic pay gap Bibliography
Equality and Human Rights Commission - www.equalityhumanrights.com
Published: August 2017 71
8 |Bibliography
Algan, Y., Dustmann, C., Glitz, A. and Manning, A. (2009), 'The Economic Situation
of First and Second-Generation Immigrants in France, Germany and the United
Kingdom', The Economic Journal vol. 120, no. 1, pp. F4-F30.
Baldwin, M. L. and Johnson W. G. (2006), 'A critical review of studies of
discrimination against workers with disabilities' in Rodgers, W. M. (ed.) Handbook on
the Economics of Discrimination. Northampton, MA: Edgar Elgar Publishing, pp. 119-
60.
Berthoud, R. (2000), 'Ethnic Employment Penalties in Britain', Journal of Ethnic and
Migration Studies, vol. 26, no. 3, pp. 389-416.
Blackaby, D., Clark, K., Leslie, D. and Murphy, P. (1994), 'Black-White Male
Earnings and Employment Prospects in the 1970s and 1980s: Evidence for Britain',
Economics Letters, vol. 46, no. 3 pp. 273-79.
Blackaby, D., Leslie, D., Murphy, P. and O'Leary, N.C. (1998), 'The Ethnic Wage
Gap and Employment Differentials in the 1990s: Evidence for Britain', Economics
Letters, vol. 58, no. 1 pp. 97-103.
Blackaby, D.., Leslie, D., Murphy, P. and O'Leary, N.C. (2002), 'White/Ethnic Minority
Earnings and Employment Differentials in Britain: Evidence from the LFS', Oxford
Economic Papers, vol. 54, no. 2 pp. 270-97.
Brynin, M. and Güveli, A. (2012), 'Understanding the Ethnic Pay Gap in Britain',
Work, Employment and Society, vol. 26, no. 4, pp. 574-87.
Brynin, M. and Longhi, S. (2015) 'The effect of occupation on poverty among ethnic
minority groups'. Joseph Rowntree Foundation. Available at:
https://www.jrf.org.uk/report/effect-occupation-poverty-among-ethnic-minority-groups
[Accessed: 13 September 2016]
Clark, K. (2015), 'Ethnic Minority Self-Employment'. IZA World of Labor.
Cleveland, W. S. (1979), 'Robust Locally Weighted Regression and Smoothing
Scatterplots', Journal of the American Statistical Association, vol. 74, no. 368, pp.
829-836.

The ethnic pay gap Bibliography
Equality and Human Rights Commission - www.equalityhumanrights.com
Published: August 2017 72
Dustmann, C. and Fabbri, F. (2005), 'Gender and Ethnicity – Married Immigrants in
Britain', Oxford Review of Economic Policy, vol. 21, no. 3, pp. 462-84.
Dustmann, C. and Frattini, T. (2011), 'Immigration: The European Experience'. IZA
Discussion Paper No. 6261.
Elliot, R.J. and Lindley, J. K. (2008), 'Immigrant Wage Differentials, Ethnicity and
Occupational Segregation', Journal of the Royal Statistical Society – Series A, vol.
171, no. 3, pp. 645-71.
Guryan, J. and Charles, K. K. (2013), 'Taste-Based or Statistical Discrimination: The
Economics of Discrimination Returns to Its Roots', The Economic Journal, vol. 123,
no. 572 pp. F417-F432.
Hatton, T. J. and Leigh, A. (2011), 'Immigrants Assimilate as Communities, Not Just
as Individuals', Journal of Population Economics, vol. 24, no. 2, pp. 389-419.
Heath, A. F. and Brinbaum, Y. (2007), 'Explaining Ethnic Inequalities in Educational
Attainment', Ethnicities, vol. 7, no. 3, pp. 291-305.
Heath, A. F. and Cheung, S. Y. (2006), 'Ethnic Penalties in the Labour Market:
Employers and Discrimination'. Department for Work and Pensions.
Heath, A. F., Cheung, S. Y. and Smith, S. N. (2007), Unequal Chances: Ethnic
Minorities in Western Labour Markets. Oxford: Oxford University Press/The British
Academy.
Lang, K. and Lehmann, J.-Y. K. (2012), 'Racial Discrimination in the Labor Market:
Theory and Empirics', Journal of Economic Literature, vol. 50, no. 4, pp. 959-1006.
Lindley, J. (2002), 'The English Language Fluency and Earnings of Ethnic Minorities
in Britain', Scottish Journal of Political Economy, vol. 49, no. 4, pp. 467-87.
Lindley, J. (2009), The Over-education of UK Immigrants and Minority Ethnic
Groups: Evidence from the Labour Force Survey', Economics of Education Review,
vol. 28, no. 1, pp. 80-9.
Longhi, S. and Platt, L. (2008), 'Pay Gaps Across Equalities Areas'. Equality and
Human Rights Commission. Available at:
https://www.equalityhumanrights.com/en/publication-download/research-report-9-
pay-gaps-across-equalities-areas [accessed: 5 September 2016].
Longhi, S., Nicoletti, C. and Platt, L. (2012), 'Occupation and Pay Across the
Generations: The Labour Market Experience of Four Ethno-Religious Groups in
Britain' in Lambert, P. S., Connelly, R., Blackburn, B. and Gayle, V. (eds.) Social
Stratification: Trends and Processes. Farnham: Ashgate, pp. 151-65.

The ethnic pay gap Bibliography
Equality and Human Rights Commission - www.equalityhumanrights.com
Published: August 2017 73
Longhi, S., Nicoletti, C. and Platt, L. (2013), 'Explained and Unexplained Wage Gaps
Across the Main Ethno-Religious Groups in Great Britain', Oxford Economic Papers,
vol. 65, no. 2, pp. 471-93.
Metcalf, H. (2009), 'Pay Gaps across the Equality Strands: A Review'. Equality and
Human Rights Commission. Available at:
https://www.equalityhumanrights.com/en/publication-download/research-report-14-
pay-gaps-across-equality-strands-review [accessed: 5 September 2016].
Platt, L. (2005), 'The Intergenerational Social Mobility of Minority Ethnic Groups',
Sociology, vol. 39, no. 3, pp. 445-61.
Platt, L. (2009), 'Unequal Chances: Ethnic Minorities in Western Labour Markets',
European Sociological Review, vol. 25, no. 2, pp. 265-7.
Stainback, K. and Tomaskovic-Devey, D. (2012), Documenting Desegregation:
Racial and Gender Segregation in Private-Sector Employment Since the Civil Rights
Act. New York: Russell Sage Foundation.
Wood, M., Hales, J., Purdon, S., Sejersen, T. and Hayllar, O. (2009), 'A Test for
Racial Discrimination in Recruitment Practice in British Cities'. Department for Work
and Pensions.
Zwysen, W. and Longhi, S. (2016), 'Labour Market Disadvantage of Ethnic Minority
British Graduates: University Choice, Parental Background or Neighbourhood?'.
ISER Working Paper 2016-02.
The ethnic pay gap Appendix
Equality and Human Rights Commission - www.equalityhumanrights.com
Published: August 2017 74
Appendix: Tables of descriptive statistics
and regression results

The ethnic pay gap Appendix
Equality and Human Rights Commission - www.equalityhumanrights.com
Published: August 2017 75
Table A1: Differences in characteristics of ethnic minority men (Continues on next three pages)
White
British
Indian
Migrant
Indian
British
Pakistani
Migrant
Pakistani
British
Bangladeshi
Migrant
Bangladeshi
British
Age 42 41 33 38 30 36 28
Married/Cohabiting 0.577 0.840 0.574 0.881 0.625 0.853 0.379
Dependent children 0.406 0.562 0.484 0.733 0.630 0.818 0.544
Qualification Level 4+ 0.344 0.497 0.583 0.365 0.468 0.276 0.437
Level 3 0.169 0.058 0.128 0.060 0.133 0.078 0.184
Level 2+ Apprenticeship 0.220 0.079 0.125 0.069 0.150 0.102 0.117
Less than 2 0.124 0.035 0.087 0.069 0.133 0.072 0.146
Other 0.060 0.229 0.031 0.251 0.037 0.247 0.010
None 0.082 0.103 0.046 0.186 0.077 0.225 0.107
Average pay (prices 2014q4) 16.28 17.06 16.34 11.96 13.45 9.79 12.62
Part-time 0.064 0.064 0.043 0.163 0.117 0.349 0.146
Hours worked no overtime 39 39 39 37 37 30 35
Hours paid overtime 2 1 1 1 1 1 1
Hours unpaid overtime 2 2 2 1 1 1 1
Job tenure 9 7 6 6 5 5 4
Job temporary 0.035 0.067 0.061 0.045 0.056 0.046 0.087
Public sector 0.203 0.212 0.184 0.135 0.169 0.088 0.155

The ethnic pay gap Appendix
Equality and Human Rights Commission - www.equalityhumanrights.com
Published: August 2017 76
Occupation 1 Managers 0.190 0.140 0.178 0.082 0.122 0.113 0.155
2 Professional Occupations 0.162 0.313 0.244 0.165 0.178 0.075 0.107
3 Associate Professional 0.150 0.085 0.187 0.083 0.164 0.067 0.165
4 Administrative and Secretarial 0.052 0.055 0.081 0.051 0.091 0.048 0.165
5 Skilled Occupations 0.154 0.077 0.066 0.100 0.068 0.260 0.039
6 Caring, Leisure and Other Service 0.026 0.038 0.020 0.022 0.019 0.029 0.010
7 Sales and Customer Service 0.038 0.046 0.086 0.075 0.157 0.080 0.117
8 Process, Plant, Machine Op. 0.124 0.120 0.065 0.199 0.063 0.075 0.078
9 Elementary Occupations 0.104 0.126 0.072 0.223 0.138 0.252 0.165
Health condition 0.198 0.164 0.134 0.119 0.063 0.113 0.068
No religion 0.278 0.021 0.066 0.006 0.037 0.016 0.029
Christian 0.710 0.139 0.041 0.013 0.005 0.000 0.010
Muslim 0.001 0.113 0.147 0.962 0.946 0.968 0.942
Other religion 0.012 0.726 0.746 0.020 0.012 0.016 0.019
Observations 120720 2223 897 866 427 373 103

The ethnic pay gap Appendix
Equality and Human Rights Commission - www.equalityhumanrights.com
Published: August 2017 77
White
British
Black African
Migrant
Black African
British
Black Caribbean
Migrant
Black Caribbean
British
Chinese
Migrant
Chinese
British
Age 42 39 36 48 38 41 31
Married/Cohabiting 0.577 0.637 0.427 0.585 0.371 0.716 0.280
Dependent children 0.406 0.577 0.455 0.391 0.466 0.504 0.299
Qualification Level 4+ 0.344 0.527 0.618 0.221 0.275 0.620 0.645
Level 3 0.169 0.069 0.101 0.109 0.173 0.032 0.196
Level 2+ Apprenticeship 0.220 0.089 0.140 0.209 0.245 0.032 0.093
Less than 2 0.124 0.039 0.067 0.079 0.180 0.049 0.028
Other 0.060 0.214 0.051 0.197 0.051 0.148 0.009
None 0.082 0.062 0.022 0.185 0.075 0.119 0.028
Average pay (prices 2014q4) 16.28 12.78 16.20 12.95 15.56 16.74 15.12
Part-time 0.064 0.100 0.090 0.082 0.074 0.119 0.093
Hours worked no overtime 39 38 37 38 38 38 37
Hours paid overtime 2 2 1 2 2 1 1
Hours unpaid overtime 2 1 2 1 2 2 2
Job tenure 9 4 5 9 7 6 5
Job temporary 0.035 0.096 0.062 0.055 0.054 0.093 0.047
Public sector 0.203 0.253 0.326 0.233 0.250 0.232 0.206

The ethnic pay gap Appendix
Equality and Human Rights Commission - www.equalityhumanrights.com
Published: August 2017 78
Occupation 1 Managers 0.190 0.070 0.112 0.073 0.123 0.148 0.121
2 Professional Occupations 0.162 0.183 0.298 0.112 0.147 0.400 0.280
3 Associate Professional 0.150 0.134 0.157 0.115 0.179 0.090 0.187
4 Administrative and Secretarial 0.052 0.061 0.079 0.036 0.070 0.043 0.121
5 Skilled Occupations 0.154 0.046 0.022 0.185 0.158 0.162 0.084
6 Caring, Leisure and Other Service 0.026 0.113 0.073 0.048 0.042 0.003 0.037
7 Sales and Customer Service 0.038 0.048 0.067 0.033 0.058 0.032 0.103
8 Process, Plant, Machine Op. 0.124 0.082 0.017 0.167 0.109 0.043 0.000
9 Elementary Occupations 0.104 0.264 0.174 0.230 0.116 0.078 0.065
Health condition 0.198 0.113 0.129 0.224 0.166 0.101 0.121
No religion 0.278 0.030 0.146 0.115 0.198 0.591 0.682
Christian 0.710 0.796 0.798 0.827 0.771 0.220 0.234
Muslim 0.001 0.160 0.045 0.009 0.007 0.000 0.000
Other religion 0.012 0.014 0.011 0.048 0.025 0.188 0.084
Observations 120720 1204 178 330 571 345 107

The ethnic pay gap Appendix
Equality and Human Rights Commission - www.equalityhumanrights.com
Published: August 2017 79
Table A2: Differences in characteristics of ethnic minority women (Continues on next three pages)
White
British
Indian
Migrant
Indian
British
Pakistani
Migrant
Pakistani
British
Bangladeshi
Migrant
Bangladeshi
British
Age 42 41 33 38 30 34 28
Married/Cohabiting 0.546 0.820 0.540 0.751 0.529 0.702 0.426
Dependent children 0.434 0.556 0.532 0.677 0.575 0.693 0.593
Qualification Level 4+ 0.352 0.423 0.611 0.374 0.493 0.351 0.500
Level 3 0.143 0.066 0.151 0.086 0.200 0.184 0.185
Level 2+ Apprenticeship 0.209 0.094 0.127 0.112 0.176 0.149 0.176
Less than 2 0.158 0.079 0.081 0.093 0.080 0.149 0.111
Other 0.042 0.226 0.013 0.195 0.010 0.105 0.000
None 0.097 0.112 0.017 0.141 0.041 0.061 0.028
Average pay (prices 2014q4) 12.47 13.14 14.33 11.48 12.00 10.93 12.36
Part-time 0.413 0.336 0.255 0.508 0.374 0.482 0.361
Hours worked no overtime 30 32 33 27 29 27 30
Hours paid overtime 1 1 0 0 1 0 0
Hours unpaid overtime 2 1 1 1 1 1 1
Job tenure 8 7 5 5 5 6 4
Job temporary 0.044 0.072 0.058 0.077 0.087 0.018 0.074
Public sector 0.393 0.382 0.342 0.422 0.432 0.447 0.454

The ethnic pay gap Appendix
Equality and Human Rights Commission - www.equalityhumanrights.com
Published: August 2017 80
Occupation 1 Managers 0.101 0.059 0.093 0.042 0.060 0.070 0.046
2 Professional Occupations 0.146 0.197 0.236 0.169 0.198 0.132 0.222
3 Associate Professional 0.145 0.157 0.181 0.102 0.145 0.105 0.130
4 Administrative and Secretarial 0.220 0.160 0.219 0.118 0.220 0.088 0.287
5 Skilled Occupations 0.016 0.015 0.003 0.013 0.002 0.000 0.000
6 Caring, Leisure and Other Service 0.149 0.110 0.091 0.192 0.167 0.263 0.130
7 Sales and Customer Service 0.104 0.100 0.129 0.112 0.140 0.167 0.120
8 Process, Plant, Machine Op. 0.018 0.060 0.008 0.051 0.014 0.009 0.000
9 Elementary Occupations 0.101 0.141 0.038 0.201 0.053 0.167 0.065
Health condition 0.194 0.129 0.117 0.192 0.121 0.114 0.083
No religion 0.213 0.019 0.062 0.010 0.010 0.018 0.028
Christian 0.775 0.182 0.052 0.042 0.007 0.026 0.019
Muslim 0.001 0.066 0.097 0.933 0.971 0.912 0.926
Other religion 0.012 0.733 0.790 0.016 0.012 0.044 0.028
Observations 128809 1811 889 313 414 114 108

The ethnic pay gap Appendix
Equality and Human Rights Commission - www.equalityhumanrights.com
Published: August 2017 81
White
British
Black African
Migrant
Black African
British
Black Caribbean
Migrant
Black Caribbean
British
Chinese
Migrant
Chinese
British
Age 42 39 36 48 39 40 33
Married/Cohabiting 0.546 0.475 0.364 0.413 0.255 0.638 0.381
Dependent children 0.434 0.644 0.653 0.438 0.614 0.407 0.320
Qualification Level 4+ 0.352 0.510 0.688 0.367 0.430 0.560 0.742
Level 3 0.143 0.085 0.131 0.087 0.152 0.051 0.031
Level 2+ Apprenticeship 0.209 0.112 0.085 0.163 0.174 0.067 0.103
Less than 2 0.158 0.045 0.034 0.135 0.172 0.056 0.062
Other 0.042 0.176 0.034 0.091 0.028 0.173 0.021
None 0.097 0.073 0.028 0.157 0.044 0.093 0.041
Average pay (prices 2014q4) 12.47 11.71 14.89 12.26 14.34 13.84 15.77
Part-time 0.413 0.291 0.239 0.236 0.268 0.320 0.206
Hours worked no overtime 30 32 33 33 32 32 34
Hours paid overtime 1 1 1 1 1 1 1
Hours unpaid overtime 2 1 2 1 2 1 2
Job tenure 8 5 5 10 7 6 6
Job temporary 0.044 0.084 0.085 0.032 0.034 0.107 0.052
Public sector 0.393 0.411 0.455 0.524 0.466 0.293 0.227

The ethnic pay gap Appendix
Equality and Human Rights Commission - www.equalityhumanrights.com
Published: August 2017 82
Occupation 1 Managers 0.101 0.045 0.068 0.062 0.097 0.098 0.134
2 Professional Occupations 0.146 0.171 0.244 0.129 0.158 0.211 0.268
3 Associate Professional 0.145 0.190 0.227 0.181 0.169 0.169 0.227
4 Administrative and Secretarial 0.220 0.078 0.233 0.165 0.249 0.149 0.165
5 Skilled Occupations 0.016 0.013 0.006 0.024 0.011 0.027 0.031
6 Caring, Leisure and Other Service 0.149 0.281 0.108 0.234 0.146 0.078 0.031
7 Sales and Customer Service 0.104 0.060 0.080 0.062 0.096 0.113 0.072
8 Process, Plant, Machine Op. 0.018 0.011 0.006 0.014 0.013 0.013 0.000
9 Elementary Occupations 0.101 0.151 0.028 0.131 0.060 0.142 0.072
Health condition 0.194 0.124 0.142 0.266 0.166 0.104 0.082
No religion 0.213 0.023 0.085 0.054 0.141 0.536 0.567
Christian 0.775 0.869 0.875 0.909 0.842 0.269 0.289
Muslim 0.001 0.096 0.040 0.006 0.001 0.002 0.000
Other religion 0.012 0.011 0.000 0.032 0.016 0.193 0.144
Observations 128809 1254 176 504 827 450 97
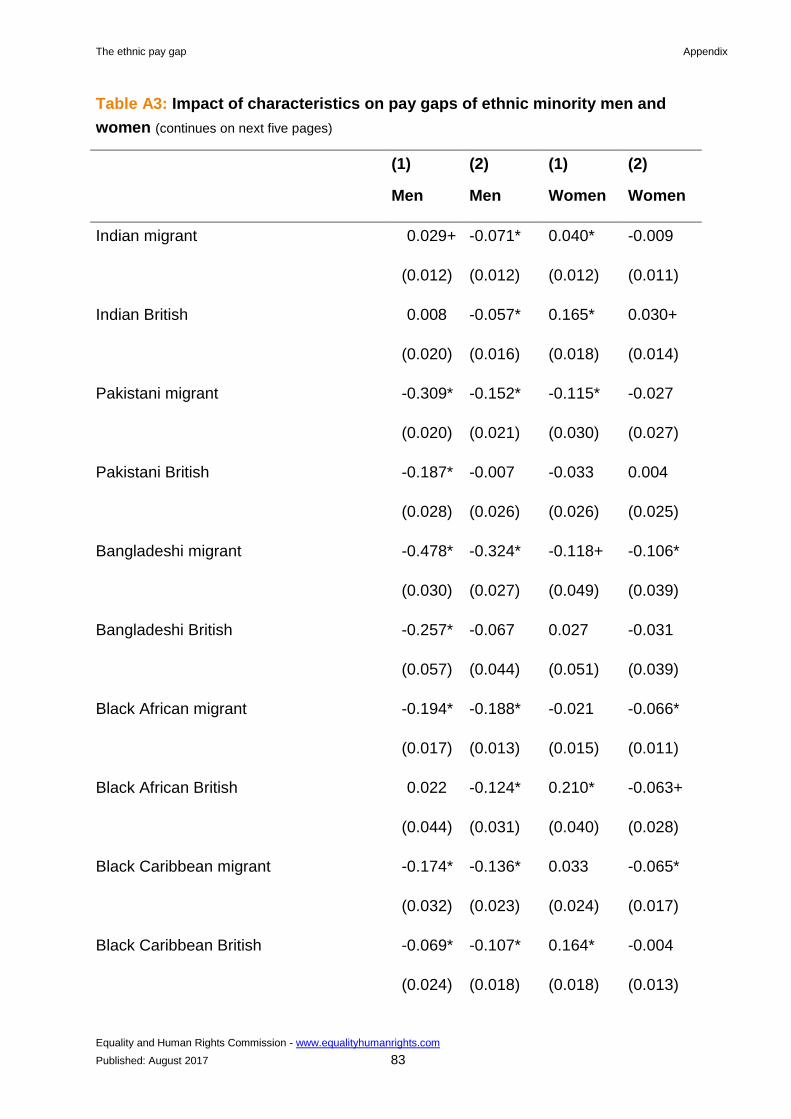
The ethnic pay gap Appendix
Equality and Human Rights Commission - www.equalityhumanrights.com
Published: August 2017 83
Table A3: Impact of characteristics on pay gaps of ethnic minority men and
women (continues on next five pages)
(1)
Men
(2)
Men
(1)
Women
(2)
Women
Indian migrant 0.029+ -0.071* 0.040* -0.009
(0.012) (0.012) (0.012) (0.011)
Indian British 0.008 -0.057* 0.165* 0.030+
(0.020) (0.016) (0.018) (0.014)
Pakistani migrant -0.309* -0.152* -0.115* -0.027
(0.020) (0.021) (0.030) (0.027)
Pakistani British -0.187* -0.007 -0.033 0.004
(0.028) (0.026) (0.026) (0.025)
Bangladeshi migrant -0.478* -0.324* -0.118+ -0.106*
(0.030) (0.027) (0.049) (0.039)
Bangladeshi British -0.257* -0.067 0.027 -0.031
(0.057) (0.044) (0.051) (0.039)
Black African migrant -0.194* -0.188* -0.021 -0.066*
(0.017) (0.013) (0.015) (0.011)
Black African British 0.022 -0.124* 0.210* -0.063+
(0.044) (0.031) (0.040) (0.028)
Black Caribbean migrant -0.174* -0.136* 0.033 -0.065*
(0.032) (0.023) (0.024) (0.017)
Black Caribbean British -0.069* -0.107* 0.164* -0.004
(0.024) (0.018) (0.018) (0.013)

The ethnic pay gap Appendix
Equality and Human Rights Commission - www.equalityhumanrights.com
Published: August 2017 84
Chinese migrant -0.006 -0.166* 0.064+ -0.035
(0.031) (0.023) (0.025) (0.018)
Chinese British -0.074 -0.115* 0.186* -0.029
(0.056) (0.040) (0.054) (0.038)
Paid hourly rate -0.059* -0.022+
(0.016) (0.011)
Hours worked no overtime -0.010* -0.004*
(0.000) (0.000)
Hours paid overtime -0.007* -0.017*
(0.000) (0.000)
Hours unpaid overtime 0.016* 0.016*
(0.000) (0.000)
Part-time -0.279* -0.110*
(0.007) (0.004)
Christian -0.008* -0.021*
(0.003) (0.003)
Muslim -0.096* -0.046*
(0.017) (0.018)
Other religion -0.015 -0.035*
(0.010) (0.008)
Years job tenure 0.006* 0.009*
(0.000) (0.000)
Job temporary -0.060* -0.057*

The ethnic pay gap Appendix
Equality and Human Rights Commission - www.equalityhumanrights.com
Published: August 2017 85
(0.006) (0.005)
Public sector -0.032* 0.012*
(0.003) (0.002)
Working in London 0.257* 0.251*
(0.004) (0.004)
Wales -0.061* -0.027*
(0.006) (0.005)
Scotland -0.011+ 0.002
(0.005) (0.004)
Age 0.054* 0.034*
(0.001) (0.001)
Age square -0.001* -0.000*
(0.000) (0.000)
Qualification Level 4+ 0.323* 0.294*
(0.005) (0.004)
Qualification Level 3 0.193* 0.142*
(0.005) (0.005)
Qualification Level 2+ Apprentice 0.124* 0.099*
(0.005) (0.004)
Qualification Level 2- 0.083* 0.057*
(0.005) (0.004)
Qualification Others 0.066* 0.062*
(0.006) (0.006)

The ethnic pay gap Appendix
Equality and Human Rights Commission - www.equalityhumanrights.com
Published: August 2017 86
Married/Cohabiting 0.070* 0.016*
(0.003) (0.002)
Dependent children 0.035* -0.018*
(0.003) (0.002)
Has health problem -0.021* -0.019*
(0.003) (0.003)
2 Professional Occupations -0.004 0.030*
(0.004) (0.004)
3 Associate Professional -0.132* -0.103*
(0.004) (0.004)
4 Administrative and Secretarial -0.359* -0.286*
(0.006) (0.004)
5 Skilled Occupations -0.327* -0.492*
(0.004) (0.009)
6 Caring, Leisure and Other Service -0.524* -0.481*
(0.008) (0.004)
7 Sales and Customer Service -0.472* -0.483*
(0.007) (0.005)
8 Process, Plant, Machine Op. -0.385* -0.436*
(0.005) (0.008)
9 Elementary Occupations -0.508* -0.562*
(0.005) (0.005)
Year 2003 0.007 0.012+

The ethnic pay gap Appendix
Equality and Human Rights Commission - www.equalityhumanrights.com
Published: August 2017 87
(0.007) (0.005)
Year 2004 0.022* 0.038*
(0.007) (0.005)
Year 2005 0.049* 0.066*
(0.007) (0.006)
Year 2006 0.051* 0.064*
(0.007) (0.005)
Year 2007 0.066* 0.081*
(0.007) (0.005)
Year 2008 0.061* 0.072*
(0.007) (0.005)
Year 2009 0.045* 0.073*
(0.007) (0.006)
Year 2010 0.015+ 0.052*
(0.007) (0.006)
Year 2011 -0.003 0.025*
(0.007) (0.006)
Year 2012 -0.017+ 0.006
(0.007) (0.006)
Year 2013 -0.037* -0.011
(0.007) (0.006)
Year 2014 -0.033* -0.017*
(0.007) (0.006)
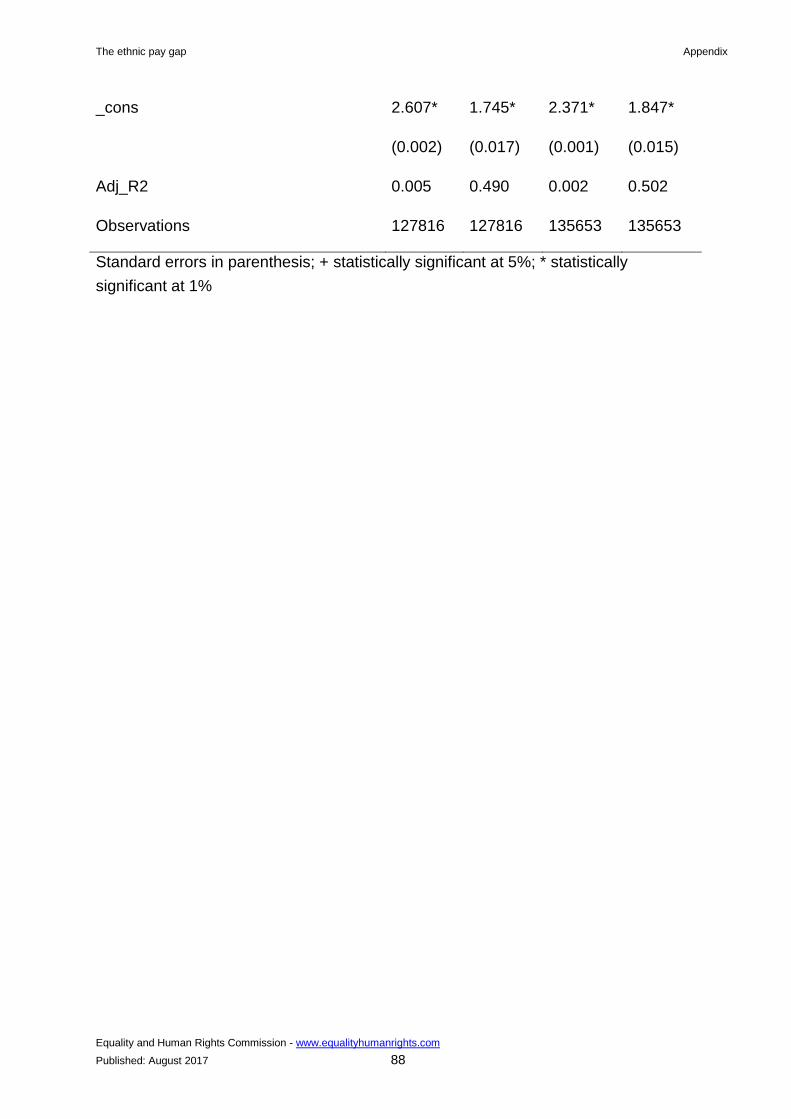
The ethnic pay gap Appendix
Equality and Human Rights Commission - www.equalityhumanrights.com
Published: August 2017 88
_cons 2.607* 1.745* 2.371* 1.847*
(0.002) (0.017) (0.001) (0.015)
Adj_R2 0.005 0.490 0.002 0.502
Observations 127816 127816 135653 135653
Standard errors in parenthesis; + statistically significant at 5%; * statistically
significant at 1%
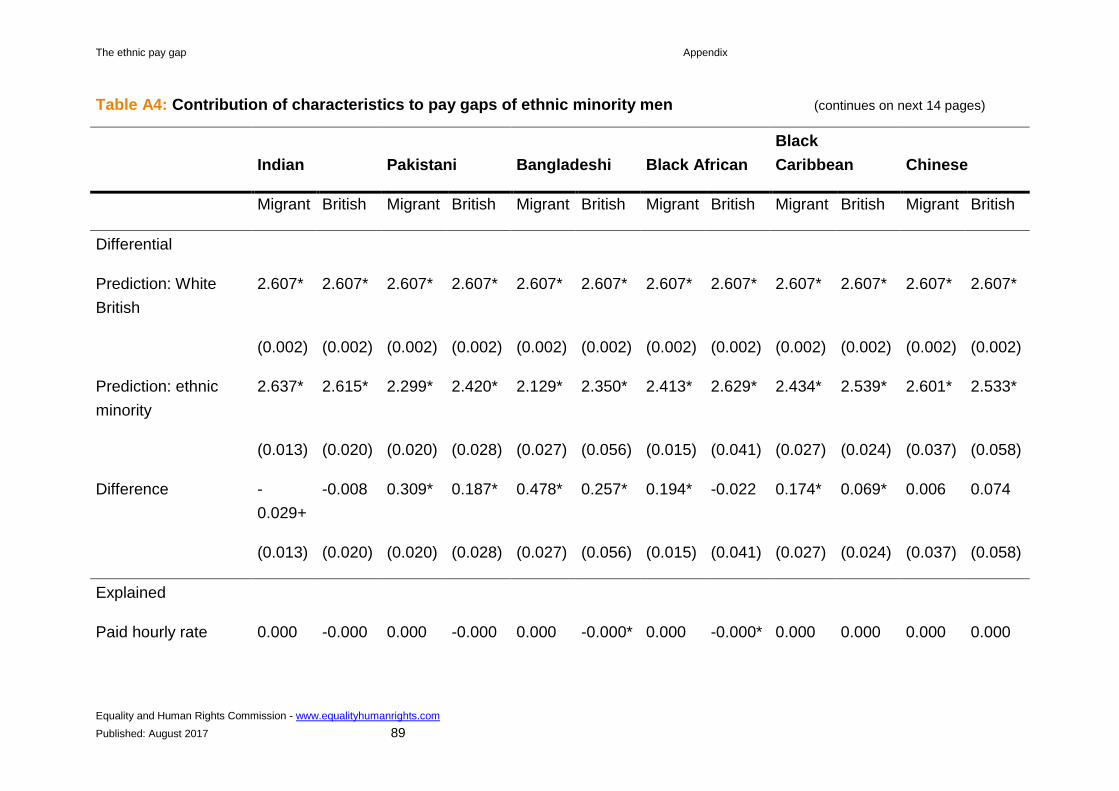
The ethnic pay gap Appendix
Equality and Human Rights Commission - www.equalityhumanrights.com
Published: August 2017 89
Table A4: Contribution of characteristics to pay gaps of ethnic minority men (continues on next 14 pages)
Indian Pakistani Bangladeshi Black African
Black
Caribbean Chinese
Migrant British Migrant British Migrant British Migrant British Migrant British Migrant British
Differential
Prediction: White
British
2.607* 2.607* 2.607* 2.607* 2.607* 2.607* 2.607* 2.607* 2.607* 2.607* 2.607* 2.607*
(0.002) (0.002) (0.002) (0.002) (0.002) (0.002) (0.002) (0.002) (0.002) (0.002) (0.002) (0.002)
Prediction: ethnic
minority
2.637* 2.615* 2.299* 2.420* 2.129* 2.350* 2.413* 2.629* 2.434* 2.539* 2.601* 2.533*
(0.013) (0.020) (0.020) (0.028) (0.027) (0.056) (0.015) (0.041) (0.027) (0.024) (0.037) (0.058)
Difference -
0.029+
-0.008 0.309* 0.187* 0.478* 0.257* 0.194* -0.022 0.174* 0.069* 0.006 0.074
(0.013) (0.020) (0.020) (0.028) (0.027) (0.056) (0.015) (0.041) (0.027) (0.024) (0.037) (0.058)
Explained
Paid hourly rate 0.000 -0.000 0.000 -0.000 0.000 -0.000* 0.000 -0.000* 0.000 0.000 0.000 0.000
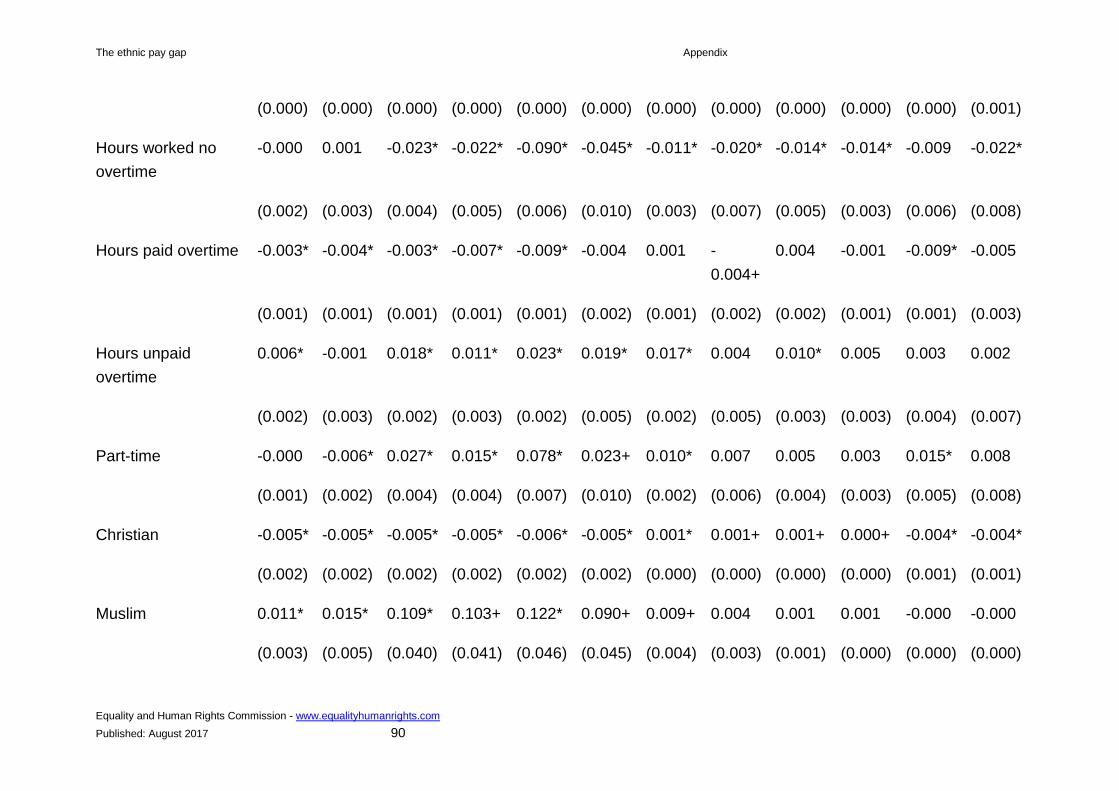
The ethnic pay gap Appendix
Equality and Human Rights Commission - www.equalityhumanrights.com
Published: August 2017 90
(0.000) (0.000) (0.000) (0.000) (0.000) (0.000) (0.000) (0.000) (0.000) (0.000) (0.000) (0.001)
Hours worked no
overtime
-0.000 0.001 -0.023* -0.022* -0.090* -0.045* -0.011* -0.020* -0.014* -0.014* -0.009 -0.022*
(0.002) (0.003) (0.004) (0.005) (0.006) (0.010) (0.003) (0.007) (0.005) (0.003) (0.006) (0.008)
Hours paid overtime -0.003* -0.004* -0.003* -0.007* -0.009* -0.004 0.001 -
0.004+
0.004 -0.001 -0.009* -0.005
(0.001) (0.001) (0.001) (0.001) (0.001) (0.002) (0.001) (0.002) (0.002) (0.001) (0.001) (0.003)
Hours unpaid
overtime
0.006* -0.001 0.018* 0.011* 0.023* 0.019* 0.017* 0.004 0.010* 0.005 0.003 0.002
(0.002) (0.003) (0.002) (0.003) (0.002) (0.005) (0.002) (0.005) (0.003) (0.003) (0.004) (0.007)
Part-time -0.000 -0.006* 0.027* 0.015* 0.078* 0.023+ 0.010* 0.007 0.005 0.003 0.015* 0.008
(0.001) (0.002) (0.004) (0.004) (0.007) (0.010) (0.002) (0.006) (0.004) (0.003) (0.005) (0.008)
Christian -0.005* -0.005* -0.005* -0.005* -0.006* -0.005* 0.001* 0.001+ 0.001+ 0.000+ -0.004* -0.004*
(0.002) (0.002) (0.002) (0.002) (0.002) (0.002) (0.000) (0.000) (0.000) (0.000) (0.001) (0.001)
Muslim 0.011* 0.015* 0.109* 0.103+ 0.122* 0.090+ 0.009+ 0.004 0.001 0.001 -0.000 -0.000
(0.003) (0.005) (0.040) (0.041) (0.046) (0.045) (0.004) (0.003) (0.001) (0.000) (0.000) (0.000)
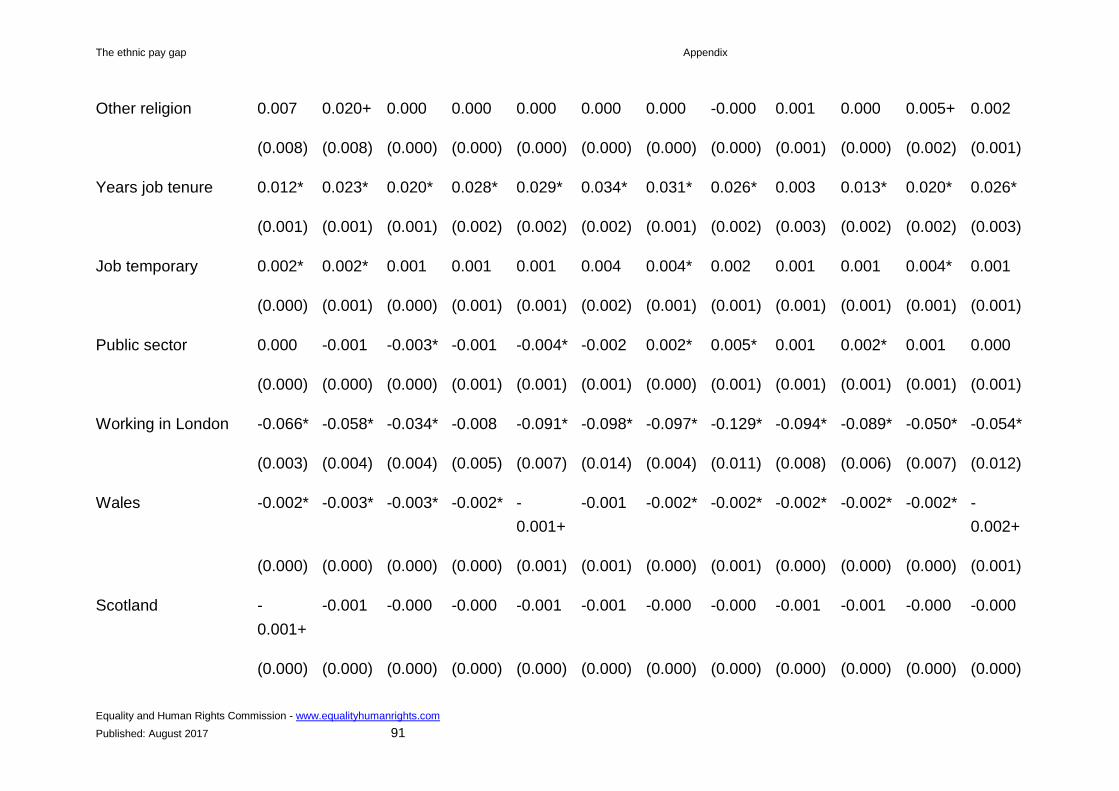
The ethnic pay gap Appendix
Equality and Human Rights Commission - www.equalityhumanrights.com
Published: August 2017 91
Other religion 0.007 0.020+ 0.000 0.000 0.000 0.000 0.000 -0.000 0.001 0.000 0.005+ 0.002
(0.008) (0.008) (0.000) (0.000) (0.000) (0.000) (0.000) (0.000) (0.001) (0.000) (0.002) (0.001)
Years job tenure 0.012* 0.023* 0.020* 0.028* 0.029* 0.034* 0.031* 0.026* 0.003 0.013* 0.020* 0.026*
(0.001) (0.001) (0.001) (0.002) (0.002) (0.002) (0.001) (0.002) (0.003) (0.002) (0.002) (0.003)
Job temporary 0.002* 0.002* 0.001 0.001 0.001 0.004 0.004* 0.002 0.001 0.001 0.004* 0.001
(0.000) (0.001) (0.000) (0.001) (0.001) (0.002) (0.001) (0.001) (0.001) (0.001) (0.001) (0.001)
Public sector 0.000 -0.001 -0.003* -0.001 -0.004* -0.002 0.002* 0.005* 0.001 0.002* 0.001 0.000
(0.000) (0.000) (0.000) (0.001) (0.001) (0.001) (0.000) (0.001) (0.001) (0.001) (0.001) (0.001)
Working in London -0.066* -0.058* -0.034* -0.008 -0.091* -0.098* -0.097* -0.129* -0.094* -0.089* -0.050* -0.054*
(0.003) (0.004) (0.004) (0.005) (0.007) (0.014) (0.004) (0.011) (0.008) (0.006) (0.007) (0.012)
Wales -0.002* -0.003* -0.003* -0.002* -
0.001+
-0.001 -0.002* -0.002* -0.002* -0.002* -0.002* -
0.002+
(0.000) (0.000) (0.000) (0.000) (0.001) (0.001) (0.000) (0.001) (0.000) (0.000) (0.000) (0.001)
Scotland -
0.001+
-0.001 -0.000 -0.000 -0.001 -0.001 -0.000 -0.000 -0.001 -0.001 -0.000 -0.000
(0.000) (0.000) (0.000) (0.000) (0.000) (0.000) (0.000) (0.000) (0.000) (0.000) (0.000) (0.000)
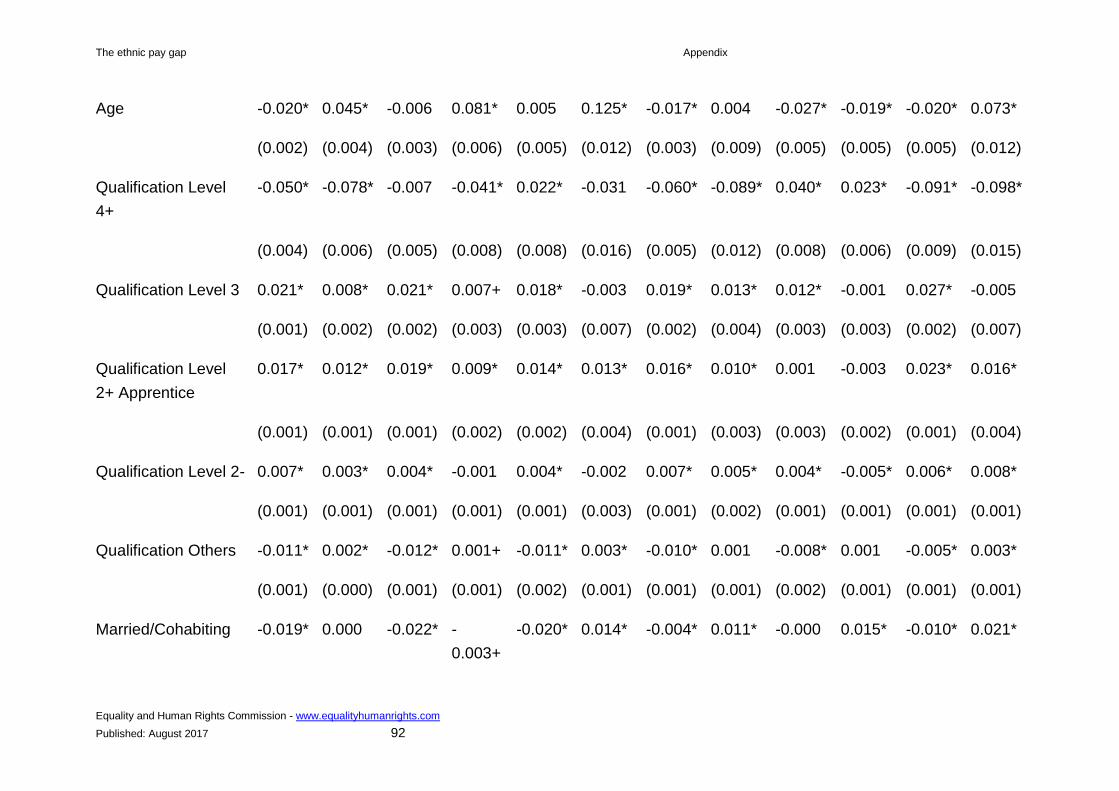
The ethnic pay gap Appendix
Equality and Human Rights Commission - www.equalityhumanrights.com
Published: August 2017 92
Age -0.020* 0.045* -0.006 0.081* 0.005 0.125* -0.017* 0.004 -0.027* -0.019* -0.020* 0.073*
(0.002) (0.004) (0.003) (0.006) (0.005) (0.012) (0.003) (0.009) (0.005) (0.005) (0.005) (0.012)
Qualification Level
4+
-0.050* -0.078* -0.007 -0.041* 0.022* -0.031 -0.060* -0.089* 0.040* 0.023* -0.091* -0.098*
(0.004) (0.006) (0.005) (0.008) (0.008) (0.016) (0.005) (0.012) (0.008) (0.006) (0.009) (0.015)
Qualification Level 3 0.021* 0.008* 0.021* 0.007+ 0.018* -0.003 0.019* 0.013* 0.012* -0.001 0.027* -0.005
(0.001) (0.002) (0.002) (0.003) (0.003) (0.007) (0.002) (0.004) (0.003) (0.003) (0.002) (0.007)
Qualification Level
2+ Apprentice
0.017* 0.012* 0.019* 0.009* 0.014* 0.013* 0.016* 0.010* 0.001 -0.003 0.023* 0.016*
(0.001) (0.001) (0.001) (0.002) (0.002) (0.004) (0.001) (0.003) (0.003) (0.002) (0.001) (0.004)
Qualification Level 2- 0.007* 0.003* 0.004* -0.001 0.004* -0.002 0.007* 0.005* 0.004* -0.005* 0.006* 0.008*
(0.001) (0.001) (0.001) (0.001) (0.001) (0.003) (0.001) (0.002) (0.001) (0.001) (0.001) (0.001)
Qualification Others -0.011* 0.002* -0.012* 0.001+ -0.011* 0.003* -0.010* 0.001 -0.008* 0.001 -0.005* 0.003*
(0.001) (0.000) (0.001) (0.001) (0.002) (0.001) (0.001) (0.001) (0.002) (0.001) (0.001) (0.001)
Married/Cohabiting -0.019* 0.000 -0.022* -
0.003+
-0.020* 0.014* -0.004* 0.011* -0.000 0.015* -0.010* 0.021*

The ethnic pay gap Appendix
Equality and Human Rights Commission - www.equalityhumanrights.com
Published: August 2017 93
(0.001) (0.001) (0.001) (0.002) (0.002) (0.003) (0.001) (0.003) (0.002) (0.002) (0.002) (0.003)
Dependent children -0.006* -0.003* -0.012* -0.009* -0.015* -0.005* -0.006* -0.002 0.001 -0.002* -0.004* 0.004+
(0.001) (0.001) (0.001) (0.001) (0.001) (0.002) (0.001) (0.001) (0.001) (0.001) (0.001) (0.002)
Has health problem -0.001* -0.001* -0.002* -0.003* -0.002* -0.003* -0.002* -
0.001+
0.001 -0.001 -0.002* -
0.002+
(0.000) (0.000) (0.000) (0.000) (0.000) (0.001) (0.000) (0.001) (0.000) (0.000) (0.000) (0.001)
2 Professional
Occupations
0.002+ 0.002* 0.000 0.000 -0.002* -0.001 0.000 0.003* -
0.001+
-0.000 0.004* 0.002+
(0.001) (0.000) (0.000) (0.000) (0.000) (0.001) (0.000) (0.001) (0.000) (0.000) (0.001) (0.001)
3 Associate
Professional
-0.009* 0.005* -0.009* 0.002 -0.011* 0.002 -0.002 0.001 -
0.005+
0.004 -0.008* 0.005
(0.001) (0.002) (0.001) (0.002) (0.002) (0.005) (0.001) (0.004) (0.002) (0.002) (0.002) (0.005)
4 Administrative,
Secretarial
0.001 0.010* -0.000 0.014* -0.002 0.041* 0.003 0.010 -0.005 0.007 -0.003 0.025+
(0.002) (0.003) (0.003) (0.005) (0.004) (0.013) (0.002) (0.007) (0.004) (0.004) (0.004) (0.011)
5 Skilled
Occupations
-0.025* -0.028* -0.017* -0.028* 0.035* -0.037* -0.035* -0.043* 0.010 0.001 0.003 -
0.023+

The ethnic pay gap Appendix
Equality and Human Rights Commission - www.equalityhumanrights.com
Published: August 2017 94
(0.002) (0.003) (0.003) (0.004) (0.007) (0.006) (0.002) (0.004) (0.007) (0.005) (0.006) (0.009)
6 Caring, Leisure,
etc.
0.006* -0.003 -0.002 -0.004 0.001 -0.008 0.046* 0.025+ 0.012 0.009 -0.012* 0.006
(0.002) (0.002) (0.003) (0.003) (0.004) (0.005) (0.005) (0.010) (0.006) (0.004) (0.002) (0.010)
7 Sales and
Customer Service
0.004 0.023* 0.017* 0.056* 0.020* 0.037+ 0.005 0.014 -0.002 0.009+ -0.003 0.030+
(0.002) (0.004) (0.004) (0.008) (0.007) (0.015) (0.003) (0.009) (0.005) (0.005) (0.004) (0.014)
8 Process, Plant,
Machine Op.
-0.002 -0.023* 0.029* -0.023* -0.019* -0.018 -0.016* -0.041* 0.017+ -0.006 -0.031* -0.048*
(0.003) (0.003) (0.005) (0.005) (0.005) (0.010) (0.003) (0.004) (0.008) (0.005) (0.004) (0.001)
9 Elementary
Occupations
0.011* -0.016* 0.060* 0.017+ 0.075* 0.031 0.081* 0.035+ 0.064* 0.006 -0.013 -0.020
(0.004) (0.004) (0.007) (0.008) (0.011) (0.019) (0.007) (0.014) (0.012) (0.007) (0.007) (0.012)
Year 2003 0.000 0.000 0.000 0.000 0.000 0.000 0.000 0.000 -0.000 0.000 0.000 -0.000
(0.000) (0.000) (0.000) (0.000) (0.000) (0.000) (0.000) (0.000) (0.000) (0.000) (0.000) (0.000)
Year 2004 0.001* 0.000 0.000+ 0.001+ 0.001+ 0.001 0.001* 0.001 0.000 0.000 0.000 0.001+

The ethnic pay gap Appendix
Equality and Human Rights Commission - www.equalityhumanrights.com
Published: August 2017 95
(0.000) (0.000) (0.000) (0.000) (0.000) (0.001) (0.000) (0.000) (0.000) (0.000) (0.000) (0.001)
Year 2005 0.000 0.000 -0.000 0.001+ 0.001 0.001 0.001+ -0.000 0.001 0.001 0.000 0.002+
(0.000) (0.000) (0.000) (0.000) (0.001) (0.001) (0.000) (0.001) (0.001) (0.000) (0.001) (0.001)
Year 2006 0.000 0.001 0.001+ 0.000 0.001 0.002 0.001 -0.001 -0.000 -0.001 0.001 0.002
(0.000) (0.000) (0.000) (0.001) (0.001) (0.001) (0.000) (0.001) (0.001) (0.001) (0.001) (0.001)
Year 2007 -0.000 0.001 -0.001 0.001 0.001 0.001 0.000 -0.001 0.001 -0.000 -0.001 0.001
(0.000) (0.001) (0.001) (0.001) (0.001) (0.002) (0.001) (0.002) (0.001) (0.001) (0.001) (0.002)
Year 2008 -0.000 0.001 0.001 -0.000 0.001 0.001 -0.000 -0.001 0.002 -0.001 0.001 -0.002
(0.000) (0.001) (0.001) (0.001) (0.001) (0.002) (0.001) (0.001) (0.001) (0.001) (0.001) (0.002)
Year 2009 0.000 -0.000 -0.000 -0.000 0.000 0.001 -0.000 0.001 0.000 -0.000 0.001 -0.000
(0.000) (0.000) (0.000) (0.001) (0.001) (0.001) (0.000) (0.001) (0.001) (0.001) (0.001) (0.001)
Year 2010 -0.000 -0.000 0.000 -0.000 -0.000 -0.000 -0.000 0.000 -0.000 0.000 -0.000 0.000
(0.000) (0.000) (0.000) (0.000) (0.000) (0.000) (0.000) (0.000) (0.000) (0.000) (0.000) (0.000)
Year 2011 0.000 0.000 0.000 0.000 0.000 0.000 0.000 0.000 0.000 0.000 0.000 0.000
(0.000) (0.000) (0.000) (0.000) (0.000) (0.000) (0.000) (0.000) (0.000) (0.000) (0.000) (0.000)

The ethnic pay gap Appendix
Equality and Human Rights Commission - www.equalityhumanrights.com
Published: August 2017 96
Year 2012 0.000 0.000 0.000 0.000 0.000 0.001 0.000 0.000 -0.000 -0.000 0.000 0.000
(0.000) (0.000) (0.000) (0.000) (0.000) (0.001) (0.000) (0.000) (0.000) (0.000) (0.000) (0.000)
Year 2013 0.001* 0.001+ 0.001* 0.000 0.000 0.002 0.001+ 0.001 0.000 0.000 0.001 0.001
(0.000) (0.000) (0.000) (0.000) (0.000) (0.001) (0.000) (0.001) (0.000) (0.000) (0.000) (0.001)
Year 2014 0.001* 0.000 0.000 0.001+ 0.002* 0.001 0.001+ 0.000 0.000 0.000 0.001 0.002
(0.000) (0.000) (0.000) (0.000) (0.001) (0.001) (0.000) (0.001) (0.000) (0.000) (0.001) (0.001)
Total -0.108* -0.056* 0.170* 0.192* 0.171* 0.182* -0.006 -0.154* 0.030 -0.045* -0.160* -0.042
(0.012) (0.017) (0.043) (0.046) (0.050) (0.061) (0.013) (0.032) (0.022) (0.017) (0.021) (0.041)
Unexplained
Paid hourly rate 0.000 -0.000 0.000 -0.000 0.000 0.000 -0.000 -0.000 0.002 0.001 -0.004 0.000
(0.000) (0.000) (0.001) (0.000) (0.001) (0.000) (0.001) (0.000) (0.001) (0.001) (0.003) (0.002)
Hours worked no
overtime
-0.168 -0.032 -0.066 -0.112 -0.321* 0.213 -0.018 -0.048 0.076 0.051 -0.032 0.052
(0.086) (0.115) (0.100) (0.139) (0.091) (0.248) (0.081) (0.127) (0.138) (0.189) (0.151) (0.229)

The ethnic pay gap Appendix
Equality and Human Rights Commission - www.equalityhumanrights.com
Published: August 2017 97
Hours paid overtime 0.000 0.006 -0.006 0.009 -
0.014+
0.015 0.011+ 0.013 0.013+ -0.002 0.008 -0.008
(0.003) (0.003) (0.006) (0.007) (0.005) (0.015) (0.005) (0.009) (0.007) (0.007) (0.005) (0.008)
Hours unpaid
overtime
-0.008 -
0.014+
-0.006 -0.009 -0.017* -0.025 0.001 -
0.031+
0.003 0.011 0.004 0.040+
(0.005) (0.007) (0.004) (0.008) (0.006) (0.015) (0.004) (0.014) (0.009) (0.009) (0.009) (0.016)
Part-time -0.002 0.004 -0.005 0.009 -0.041 0.011 0.002 0.013 -0.008 -0.005 -0.007 -0.018
(0.004) (0.004) (0.010) (0.012) (0.023) (0.029) (0.006) (0.012) (0.008) (0.008) (0.016) (0.014)
Christian 0.031* 0.003 0.005 -0.001 0.000 -0.006 0.014 0.017 -0.002 -0.066 -0.002 -0.036
(0.009) (0.003) (0.002) (0.001) (0.000) (0.007) (0.048) (0.056) (0.052) (0.034) (0.015) (0.023)
Muslim 0.016+ 0.016 0.027 0.124 0.498* -0.348 0.000 0.004 -0.002 0.001 -0.000 -0.000
(0.007) (0.009) (0.119) (0.104) (0.180) (0.302) (0.010) (0.006) (0.001) (0.001) (0.000) (0.000)
Other religion 0.102+ 0.098* -0.002 0.002 0.012+ 0.004 0.003 -0.001 -0.003 -0.003 -0.006 -0.004
(0.044) (0.036) (0.003) (0.002) (0.006) (0.008) (0.004) (0.002) (0.005) (0.003) (0.012) (0.008)
Years job tenure -0.009 0.003 -0.016 -0.005 0.043+ 0.016 -0.021 0.053 -0.033 -0.013 -0.015 -
0.092+
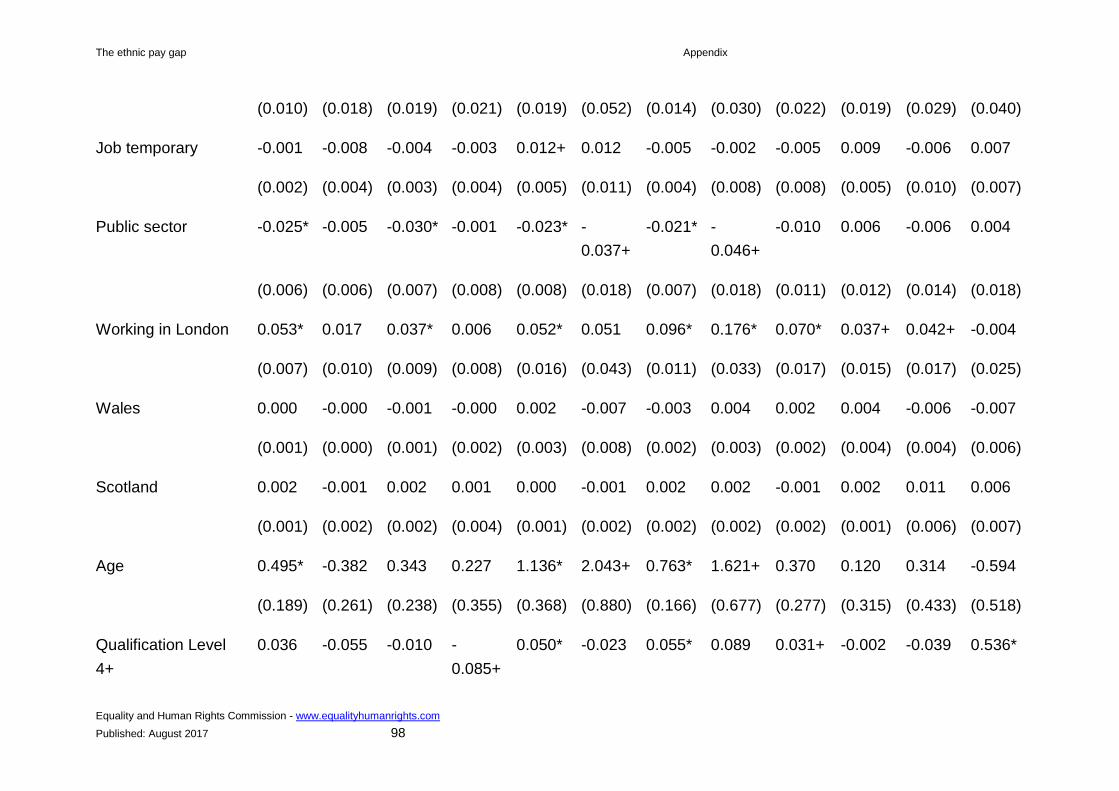
The ethnic pay gap Appendix
Equality and Human Rights Commission - www.equalityhumanrights.com
Published: August 2017 98
(0.010) (0.018) (0.019) (0.021) (0.019) (0.052) (0.014) (0.030) (0.022) (0.019) (0.029) (0.040)
Job temporary -0.001 -0.008 -0.004 -0.003 0.012+ 0.012 -0.005 -0.002 -0.005 0.009 -0.006 0.007
(0.002) (0.004) (0.003) (0.004) (0.005) (0.011) (0.004) (0.008) (0.008) (0.005) (0.010) (0.007)
Public sector -0.025* -0.005 -0.030* -0.001 -0.023* -
0.037+
-0.021* -
0.046+
-0.010 0.006 -0.006 0.004
(0.006) (0.006) (0.007) (0.008) (0.008) (0.018) (0.007) (0.018) (0.011) (0.012) (0.014) (0.018)
Working in London 0.053* 0.017 0.037* 0.006 0.052* 0.051 0.096* 0.176* 0.070* 0.037+ 0.042+ -0.004
(0.007) (0.010) (0.009) (0.008) (0.016) (0.043) (0.011) (0.033) (0.017) (0.015) (0.017) (0.025)
Wales 0.000 -0.000 -0.001 -0.000 0.002 -0.007 -0.003 0.004 0.002 0.004 -0.006 -0.007
(0.001) (0.000) (0.001) (0.002) (0.003) (0.008) (0.002) (0.003) (0.002) (0.004) (0.004) (0.006)
Scotland 0.002 -0.001 0.002 0.001 0.000 -0.001 0.002 0.002 -0.001 0.002 0.011 0.006
(0.001) (0.002) (0.002) (0.004) (0.001) (0.002) (0.002) (0.002) (0.002) (0.001) (0.006) (0.007)
Age 0.495* -0.382 0.343 0.227 1.136* 2.043+ 0.763* 1.621+ 0.370 0.120 0.314 -0.594
(0.189) (0.261) (0.238) (0.355) (0.368) (0.880) (0.166) (0.677) (0.277) (0.315) (0.433) (0.518)
Qualification Level
4+
0.036 -0.055 -0.010 -
0.085+
0.050* -0.023 0.055* 0.089 0.031+ -0.002 -0.039 0.536*
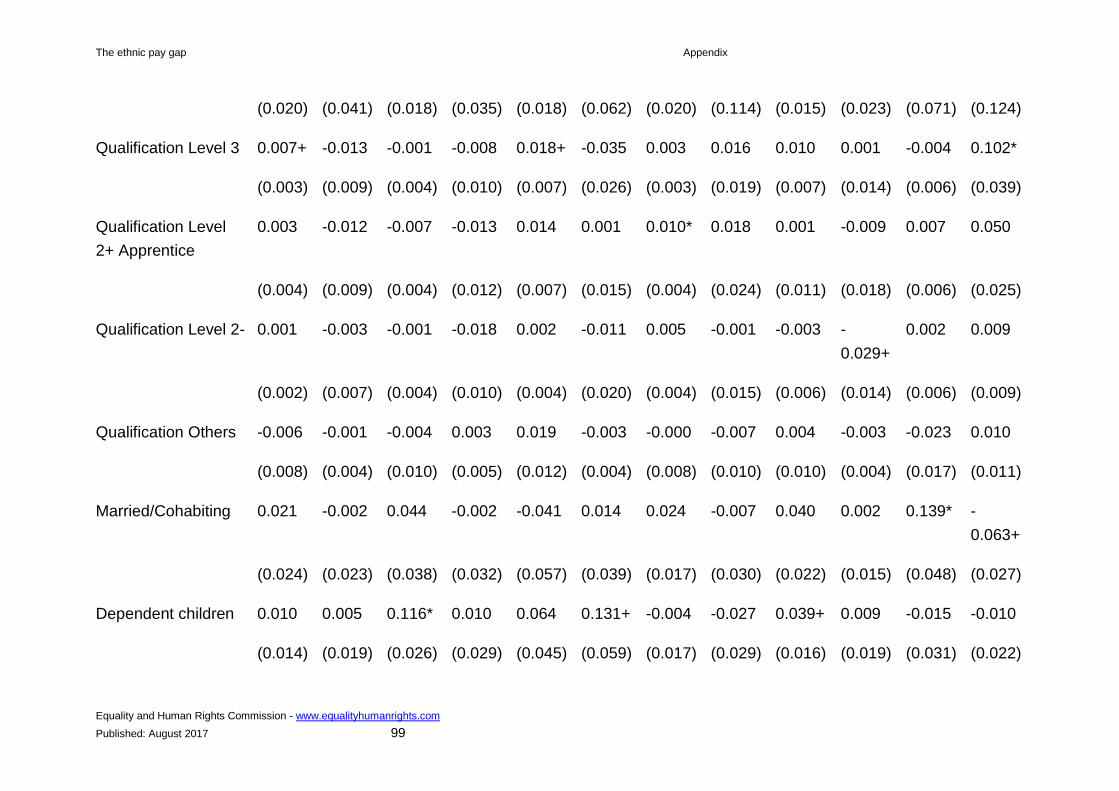
The ethnic pay gap Appendix
Equality and Human Rights Commission - www.equalityhumanrights.com
Published: August 2017 99
(0.020) (0.041) (0.018) (0.035) (0.018) (0.062) (0.020) (0.114) (0.015) (0.023) (0.071) (0.124)
Qualification Level 3 0.007+ -0.013 -0.001 -0.008 0.018+ -0.035 0.003 0.016 0.010 0.001 -0.004 0.102*
(0.003) (0.009) (0.004) (0.010) (0.007) (0.026) (0.003) (0.019) (0.007) (0.014) (0.006) (0.039)
Qualification Level
2+ Apprentice
0.003 -0.012 -0.007 -0.013 0.014 0.001 0.010* 0.018 0.001 -0.009 0.007 0.050
(0.004) (0.009) (0.004) (0.012) (0.007) (0.015) (0.004) (0.024) (0.011) (0.018) (0.006) (0.025)
Qualification Level 2- 0.001 -0.003 -0.001 -0.018 0.002 -0.011 0.005 -0.001 -0.003 -
0.029+
0.002 0.009
(0.002) (0.007) (0.004) (0.010) (0.004) (0.020) (0.004) (0.015) (0.006) (0.014) (0.006) (0.009)
Qualification Others -0.006 -0.001 -0.004 0.003 0.019 -0.003 -0.000 -0.007 0.004 -0.003 -0.023 0.010
(0.008) (0.004) (0.010) (0.005) (0.012) (0.004) (0.008) (0.010) (0.010) (0.004) (0.017) (0.011)
Married/Cohabiting 0.021 -0.002 0.044 -0.002 -0.041 0.014 0.024 -0.007 0.040 0.002 0.139* -
0.063+
(0.024) (0.023) (0.038) (0.032) (0.057) (0.039) (0.017) (0.030) (0.022) (0.015) (0.048) (0.027)
Dependent children 0.010 0.005 0.116* 0.010 0.064 0.131+ -0.004 -0.027 0.039+ 0.009 -0.015 -0.010
(0.014) (0.019) (0.026) (0.029) (0.045) (0.059) (0.017) (0.029) (0.016) (0.019) (0.031) (0.022)

The ethnic pay gap Appendix
Equality and Human Rights Commission - www.equalityhumanrights.com
Published: August 2017 100
Has health problem -0.001 0.009 -0.000 0.009 -0.004 0.002 0.004 -0.023 0.004 -0.010 -0.014 -
0.037+
(0.005) (0.006) (0.005) (0.006) (0.005) (0.010) (0.004) (0.015) (0.011) (0.008) (0.008) (0.015)
2 Professional
Occupations
-0.076* -
0.025+
-0.063* -
0.032+
-
0.022+
-0.038 -0.035* -0.030 -0.009 -0.006 -
0.107+
-0.076*
(0.013) (0.013) (0.015) (0.015) (0.010) (0.020) (0.012) (0.031) (0.012) (0.011) (0.047) (0.028)
3 Associate
Professional
-0.003 -0.013 -0.015 -0.037* -0.029* -0.041 -0.005 0.035 -0.018 0.003 -0.018 -0.003
(0.004) (0.010) (0.008) (0.014) (0.010) (0.025) (0.009) (0.020) (0.010) (0.014) (0.011) (0.024)
4 Administrative,
Secretarial
0.001 -0.008 -0.014* -
0.019+
-0.022* -0.045 -
0.009+
-0.023 0.000 0.005 0.001 -0.006
(0.003) (0.004) (0.005) (0.009) (0.008) (0.024) (0.004) (0.014) (0.005) (0.008) (0.008) (0.013)
5 Skilled
Occupations
0.004 -0.004 -0.017 -0.012 -0.026 0.019 -0.004 -0.003 -0.009 0.010 0.018 0.045+
(0.004) (0.004) (0.009) (0.007) (0.022) (0.016) (0.003) (0.004) (0.015) (0.011) (0.021) (0.018)
6 Caring, Leisure,
etc.
0.001 0.001 -0.008* -0.004 -0.009 -0.003 -
0.018+
-0.003 0.001 -0.004 -0.002 0.003

The ethnic pay gap Appendix
Equality and Human Rights Commission - www.equalityhumanrights.com
Published: August 2017 101
(0.002) (0.002) (0.003) (0.003) (0.004) (0.004) (0.007) (0.010) (0.004) (0.003) (0.002) (0.009)
7 Sales and
Customer Service
0.005 -0.008 -
0.013+
-0.046* -0.026* -
0.059+
-0.006 0.005 0.000 -0.007 -0.000 0.009
(0.003) (0.006) (0.006) (0.014) (0.009) (0.028) (0.004) (0.009) (0.004) (0.005) (0.005) (0.011)
8 Process, Plant,
Machine Op.
0.007 -0.008 -0.042* -0.018* -
0.015+
-
0.050+
-
0.013+
-0.008 -0.015 0.010 -0.008 0.000
(0.006) (0.004) (0.015) (0.007) (0.007) (0.021) (0.005) (0.005) (0.015) (0.008) (0.007) (0.000)
9 Elementary
Occupations
0.004 -0.014* -0.066* -0.058* -0.069* -0.053 -0.021 -0.018 -0.001 0.010 0.013 0.009
(0.006) (0.005) (0.017) (0.014) (0.021) (0.031) (0.015) (0.020) (0.019) (0.009) (0.010) (0.009)
Year 2003 0.004 0.009 0.002 -0.000 -0.003 0.019 -0.005 0.015 0.003 0.003 -0.017 -0.004
(0.003) (0.006) (0.005) (0.011) (0.005) (0.016) (0.003) (0.014) (0.012) (0.008) (0.010) (0.021)
Year 2004 -0.003 0.012 0.003 -0.006 -0.009 0.009 -0.000 0.023+ 0.008 -0.001 -
0.024+
-0.007
(0.004) (0.006) (0.004) (0.009) (0.006) (0.009) (0.004) (0.012) (0.010) (0.006) (0.012) (0.009)
Year 2005 0.003 0.005 -0.000 0.001 -0.003 0.004 -0.003 0.026 0.002 0.006 -0.017 0.012
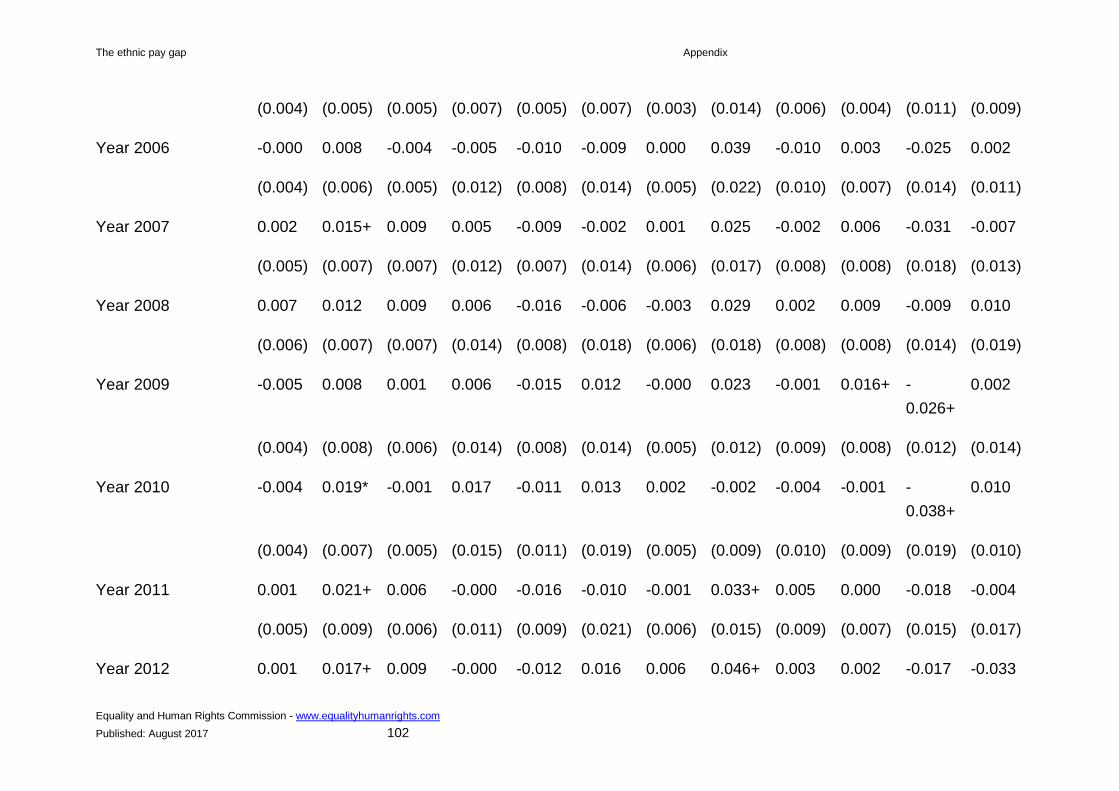
The ethnic pay gap Appendix
Equality and Human Rights Commission - www.equalityhumanrights.com
Published: August 2017 102
(0.004) (0.005) (0.005) (0.007) (0.005) (0.007) (0.003) (0.014) (0.006) (0.004) (0.011) (0.009)
Year 2006 -0.000 0.008 -0.004 -0.005 -0.010 -0.009 0.000 0.039 -0.010 0.003 -0.025 0.002
(0.004) (0.006) (0.005) (0.012) (0.008) (0.014) (0.005) (0.022) (0.010) (0.007) (0.014) (0.011)
Year 2007 0.002 0.015+ 0.009 0.005 -0.009 -0.002 0.001 0.025 -0.002 0.006 -0.031 -0.007
(0.005) (0.007) (0.007) (0.012) (0.007) (0.014) (0.006) (0.017) (0.008) (0.008) (0.018) (0.013)
Year 2008 0.007 0.012 0.009 0.006 -0.016 -0.006 -0.003 0.029 0.002 0.009 -0.009 0.010
(0.006) (0.007) (0.007) (0.014) (0.008) (0.018) (0.006) (0.018) (0.008) (0.008) (0.014) (0.019)
Year 2009 -0.005 0.008 0.001 0.006 -0.015 0.012 -0.000 0.023 -0.001 0.016+ -
0.026+
0.002
(0.004) (0.008) (0.006) (0.014) (0.008) (0.014) (0.005) (0.012) (0.009) (0.008) (0.012) (0.014)
Year 2010 -0.004 0.019* -0.001 0.017 -0.011 0.013 0.002 -0.002 -0.004 -0.001 -
0.038+
0.010
(0.004) (0.007) (0.005) (0.015) (0.011) (0.019) (0.005) (0.009) (0.010) (0.009) (0.019) (0.010)
Year 2011 0.001 0.021+ 0.006 -0.000 -0.016 -0.010 -0.001 0.033+ 0.005 0.000 -0.018 -0.004
(0.005) (0.009) (0.006) (0.011) (0.009) (0.021) (0.006) (0.015) (0.009) (0.007) (0.015) (0.017)
Year 2012 0.001 0.017+ 0.009 -0.000 -0.012 0.016 0.006 0.046+ 0.003 0.002 -0.017 -0.033

The ethnic pay gap Appendix
Equality and Human Rights Commission - www.equalityhumanrights.com
Published: August 2017 103
(0.004) (0.007) (0.006) (0.014) (0.009) (0.024) (0.006) (0.020) (0.006) (0.005) (0.013) (0.019)
Year 2013 0.006 0.022* 0.004 0.011 -0.004 0.047 0.007 0.025 0.000 0.017+ -0.031 -0.006
(0.004) (0.008) (0.007) (0.011) (0.007) (0.029) (0.006) (0.016) (0.008) (0.007) (0.016) (0.014)
Year 2014 0.007 0.020* 0.010 0.011 -0.016 0.025 -0.000 0.022 0.001 0.016 -0.034 0.017
(0.005) (0.008) (0.006) (0.015) (0.012) (0.022) (0.005) (0.015) (0.008) (0.009) (0.018) (0.020)
_cons -0.438 0.324 -0.088 0.034 -
0.814+
-1.787 -0.613* -1.957* -0.411 -0.097 0.207 0.198
(0.240) (0.301) (0.269) (0.413) (0.393) (1.138) (0.221) (0.727) (0.345) (0.391) (0.453) (0.543)
Total 0.078* 0.048* 0.139* -0.005 0.307* 0.075 0.200* 0.132* 0.144* 0.114* 0.166* 0.116*
(0.013) (0.018) (0.043) (0.045) (0.051) (0.062) (0.013) (0.030) (0.020) (0.019) (0.028) (0.040)
Observations 122431 121105 121076 120639 120583 120315 121411 120390 120541 120782 120556 120319
Minority 2,219 893 864 427 371 103 1,199 178 329 570 344 107
Standard errors in parenthesis; + Statistically significant at 5%; * Statistically significant at 1%

The ethnic pay gap Appendix
Equality and Human Rights Commission - www.equalityhumanrights.com
Published: August 2017 104
Table A5: Contribution of characteristics to pay gaps of ethnic minority women (continues on next 14 pages)
Indian Pakistani Bangladeshi Black African
Black
Caribbean Chinese
Migrant British Migrant British Migrant British Migrant British Migrant British Migrant British
Differential
Prediction: White
British
2.371* 2.371* 2.371* 2.371* 2.371* 2.371* 2.371* 2.371* 2.371* 2.371* 2.371* 2.371*
(0.001) (0.001) (0.001) (0.001) (0.001) (0.001) (0.001) (0.001) (0.001) (0.001) (0.001) (0.001)
Prediction: ethnic
minority
2.412* 2.537* 2.257* 2.339* 2.254* 2.399* 2.351* 2.581* 2.405* 2.535* 2.436* 2.557*
(0.013) (0.017) (0.033) (0.026) (0.047) (0.045) (0.013) (0.040) (0.020) (0.017) (0.029) (0.065)
Difference -0.040* -0.165* 0.115* 0.033 0.118+ -0.027 0.021 -0.210* -0.033 -0.164* -
0.064+
-0.186*
(0.013) (0.017) (0.033) (0.026) (0.047) (0.045) (0.013) (0.040) (0.020) (0.017) (0.029) (0.065)
Explained
Paid hourly rate
0.000 -0.000 -
0.000+
-0.000 -
0.000+
-
0.000+
0.000 0.000 0.000 -0.000 0.000 0.000

The ethnic pay gap Appendix
Equality and Human Rights Commission - www.equalityhumanrights.com
Published: August 2017 105
(0.000) (0.000) (0.000) (0.000) (0.000) (0.000) (0.000) (0.000) (0.000) (0.000) (0.000) (0.000)
Hours worked no
overtime
0.010* 0.015* -0.013* -0.002 -
0.011+
0.001 0.012* 0.014* 0.013* 0.012* 0.012* 0.020*
(0.001) (0.002) (0.003) (0.002) (0.005) (0.005) (0.001) (0.003) (0.002) (0.002) (0.003) (0.004)
Hours paid overtime 0.002 -0.005* -0.005* -0.002 -
0.005+
-0.012* 0.011* 0.004 0.003 -0.000 -0.003 -0.005
(0.001) (0.001) (0.002) (0.002) (0.003) (0.001) (0.002) (0.005) (0.002) (0.002) (0.002) (0.003)
Hours unpaid
overtime
0.012* 0.001 0.012* 0.008* 0.013* 0.009+ 0.013* -0.004 0.005 -
0.005+
0.005 -0.014
(0.001) (0.002) (0.003) (0.003) (0.005) (0.004) (0.001) (0.005) (0.003) (0.002) (0.003) (0.008)
Part-time -0.009* -0.018* 0.011* -0.004 0.008 -0.006 -0.014* -0.020* -0.020* -0.016* -0.010* -0.023*
(0.001) (0.002) (0.003) (0.003) (0.005) (0.005) (0.002) (0.004) (0.002) (0.002) (0.003) (0.005)
Christian -0.012* -0.015* -0.015* -0.016* -0.015* -0.015* 0.002* 0.002* 0.003* 0.001* -0.010* -0.010*
(0.002) (0.002) (0.002) (0.002) (0.002) (0.002) (0.000) (0.001) (0.000) (0.000) (0.001) (0.002)
Muslim 0.003 0.005 0.052 0.081+ 0.079+ 0.080+ 0.006+ 0.003 0.000 0.000 0.000 -
0.000+

The ethnic pay gap Appendix
Equality and Human Rights Commission - www.equalityhumanrights.com
Published: August 2017 106
(0.002) (0.003) (0.040) (0.037) (0.035) (0.035) (0.003) (0.002) (0.000) (0.000) (0.000) (0.000)
Other religion 0.027* 0.022* 0.000 0.000 0.001 0.000 -0.000 -
0.000+
0.001 0.000 0.005+ 0.004+
(0.007) (0.008) (0.000) (0.000) (0.001) (0.000) (0.000) (0.000) (0.000) (0.000) (0.002) (0.002)
Years job tenure 0.010* 0.025* 0.027* 0.033* 0.024* 0.039* 0.033* 0.029* -0.019* 0.011* 0.024* 0.024*
(0.002) (0.002) (0.003) (0.002) (0.005) (0.003) (0.001) (0.004) (0.004) (0.002) (0.003) (0.005)
Job temporary 0.002* 0.001 0.002+ 0.002* -
0.002+
0.002 0.002* 0.003 -0.001 -0.001 0.004* 0.001
(0.000) (0.001) (0.001) (0.001) (0.001) (0.002) (0.001) (0.001) (0.000) (0.000) (0.001) (0.001)
Public sector 0.000 0.001* -0.000 -0.000 -0.001 -0.001 -0.000 -0.001 -0.002* -0.001* 0.001* 0.002*
(0.000) (0.000) (0.000) (0.000) (0.001) (0.001) (0.000) (0.000) (0.000) (0.000) (0.000) (0.001)
Working in London -0.076* -0.069* -0.041* -0.022* -0.128* -0.121* -0.107* -0.162* -0.118* -0.121* -0.056* -0.053*
(0.003) (0.004) (0.006) (0.005) (0.013) (0.013) (0.004) (0.010) (0.006) (0.005) (0.006) (0.012)
Wales -0.001* -0.001* -0.001* -0.001* -0.001* -
0.001+
-0.001* -0.001* -0.001* -0.001* -
0.001+
-0.001*
(0.000) (0.000) (0.000) (0.000) (0.000) (0.000) (0.000) (0.000) (0.000) (0.000) (0.000) (0.000)

The ethnic pay gap Appendix
Equality and Human Rights Commission - www.equalityhumanrights.com
Published: August 2017 107
Scotland 0.000 0.000 0.000 0.000 0.000 0.000 0.000 0.000 0.000 0.000 0.000 0.000
(0.000) (0.000) (0.000) (0.000) (0.000) (0.000) (0.000) (0.000) (0.000) (0.000) (0.000) (0.000)
Age -0.014* 0.014* -0.005 0.039* 0.011 0.054* -0.013* -0.006 -0.011* -0.020* -0.013* 0.018+
(0.001) (0.002) (0.003) (0.004) (0.006) (0.006) (0.002) (0.005) (0.003) (0.002) (0.002) (0.007)
Qualification Level
4+
-0.021* -0.077* -0.007 -0.042* 0.000 -0.044* -0.046* -0.099* -0.005 -0.023* -0.061* -0.116*
(0.003) (0.005) (0.008) (0.007) (0.013) (0.014) (0.004) (0.011) (0.006) (0.005) (0.007) (0.013)
Qualification Level 3 0.011* -0.001 0.008* -0.008* -0.006 -0.006 0.008* 0.002 0.008* -0.001 0.013* 0.016*
(0.001) (0.002) (0.002) (0.003) (0.005) (0.005) (0.001) (0.004) (0.002) (0.002) (0.002) (0.003)
Qualification Level
2+ Apprentice
0.012* 0.008* 0.010* 0.003 0.006 0.003 0.010* 0.012* 0.005* 0.004* 0.014* 0.011*
(0.001) (0.001) (0.002) (0.002) (0.003) (0.004) (0.001) (0.002) (0.002) (0.001) (0.001) (0.003)
Qualification Level 2- 0.005* 0.004* 0.004* 0.005* 0.000 0.003 0.007* 0.007* 0.001 -0.001 0.006* 0.006*
(0.001) (0.001) (0.001) (0.001) (0.002) (0.002) (0.001) (0.001) (0.001) (0.001) (0.001) (0.002)
Qualification Others -0.011* 0.002* -0.008* 0.002* -
0.003+
0.002* -0.008* 0.000 -0.003* 0.001+ -0.007* 0.001

The ethnic pay gap Appendix
Equality and Human Rights Commission - www.equalityhumanrights.com
Published: August 2017 108
(0.001) (0.000) (0.002) (0.000) (0.002) (0.000) (0.001) (0.001) (0.001) (0.000) (0.001) (0.001)
Married/Cohabiting -0.004* 0.000 -0.003* 0.000 -0.002* 0.002+ 0.001* 0.003* 0.002* 0.005* -0.001* 0.003*
(0.001) (0.000) (0.001) (0.000) (0.001) (0.001) (0.000) (0.001) (0.000) (0.001) (0.000) (0.001)
Dependent children 0.002* 0.002* 0.005* 0.003* 0.005* 0.003* 0.004* 0.004* 0.000 0.003* -0.001 -
0.002+
(0.000) (0.000) (0.001) (0.001) (0.001) (0.001) (0.001) (0.001) (0.000) (0.001) (0.000) (0.001)
Has health problem -0.001* -0.002* -0.000 -0.001* -
0.002+
-0.002* -0.001* -
0.001+
0.001* -
0.001+
-0.002* -0.002*
(0.000) (0.000) (0.000) (0.000) (0.001) (0.001) (0.000) (0.001) (0.000) (0.000) (0.000) (0.001)
2 Professional
Occupations
-0.001* -0.002* -0.001 -
0.001+
0.000 -0.002 -0.001 -
0.002+
0.000 -0.000 -0.002* -
0.003+
(0.000) (0.001) (0.001) (0.001) (0.001) (0.001) (0.000) (0.001) (0.000) (0.000) (0.001) (0.001)
3 Associate
Professional
0.001 0.004* -
0.004+
-0.000 -0.004 -0.002 0.005* 0.009* 0.004+ 0.003 0.003 0.009
(0.001) (0.001) (0.002) (0.002) (0.003) (0.003) (0.001) (0.003) (0.002) (0.001) (0.002) (0.004)
4 Administrative,
Secretarial
-0.017* 0.000 -0.029* -0.000 -0.038* 0.019 -0.041* 0.004 -0.016* 0.008 -0.020* -0.016

The ethnic pay gap Appendix
Equality and Human Rights Commission - www.equalityhumanrights.com
Published: August 2017 109
(0.003) (0.004) (0.005) (0.006) (0.008) (0.013) (0.002) (0.009) (0.005) (0.004) (0.005) (0.011)
5 Skilled
Occupations
-0.000 -0.006* -0.002 -0.007* -0.008* -0.008* -0.002 -0.005 0.004 -0.003 0.005 0.007
(0.001) (0.001) (0.003) (0.001) (0.000) (0.000) (0.002) (0.003) (0.003) (0.002) (0.004) (0.009)
6 Caring, Leisure,
etc.
-0.019* -0.028* 0.021 0.009 0.055* -0.009 0.064* -0.019 0.041* -0.001 -0.034* -0.057*
(0.004) (0.005) (0.011) (0.009) (0.020) (0.016) (0.006) (0.011) (0.009) (0.006) (0.006) (0.009)
7 Sales and
Customer Service
-0.002 0.012+ 0.004 0.018+ 0.030 0.008 -0.022* -0.014 -0.021* -0.004 0.005 -0.015
(0.003) (0.005) (0.009) (0.008) (0.017) (0.015) (0.003) (0.010) (0.005) (0.005) (0.007) (0.013)
8 Process, Plant,
Machine Op.
0.018* -0.005* 0.014* -0.002 -0.004 -0.008* -
0.003+
-
0.005+
-0.002 -0.002 -0.002 -0.008*
(0.002) (0.001) (0.005) (0.003) (0.004) (0.000) (0.001) (0.002) (0.002) (0.002) (0.002) (0.000)
9 Elementary
Occupations
0.023* -0.035* 0.056* -0.027* 0.037 -0.021 0.028* -0.041* 0.017+ -0.023* 0.023+ -0.016
(0.005) (0.004) (0.013) (0.006) (0.020) (0.013) (0.006) (0.007) (0.008) (0.005) (0.009) (0.015)
Year 2003 0.000 0.000 0.000 0.000 0.000 0.001 0.001+ 0.000 0.000 0.000 0.001+ 0.000

The ethnic pay gap Appendix
Equality and Human Rights Commission - www.equalityhumanrights.com
Published: August 2017 110
(0.000) (0.000) (0.000) (0.000) (0.000) (0.000) (0.000) (0.000) (0.000) (0.000) (0.000) (0.000)
Year 2004 0.001* 0.001 0.001 0.002* 0.003* -0.000 0.001* 0.002* -0.000 0.000 0.001* -0.000
(0.000) (0.000) (0.001) (0.000) (0.001) (0.001) (0.000) (0.001) (0.001) (0.000) (0.000) (0.001)
Year 2005 -0.000 0.001* 0.002+ 0.001 0.001 0.000 0.001* 0.000 0.001 -0.000 0.000 -0.002
(0.000) (0.000) (0.001) (0.001) (0.001) (0.002) (0.000) (0.001) (0.001) (0.001) (0.001) (0.002)
Year 2006 0.000 0.001 0.002 0.001 0.001 0.000 -0.000 0.001 0.001 0.001 0.000 -0.000
(0.000) (0.001) (0.001) (0.001) (0.002) (0.002) (0.001) (0.001) (0.001) (0.001) (0.001) (0.002)
Year 2007 0.001 0.000 0.002 -0.000 -0.000 0.005* 0.001 -0.001 -0.001 -0.000 -0.001 0.003
(0.001) (0.001) (0.001) (0.001) (0.002) (0.002) (0.001) (0.002) (0.001) (0.001) (0.001) (0.002)
Year 2008 -0.001 -0.001 0.000 0.002+ -0.001 -0.003 0.000 0.002 0.001 -0.000 -0.000 -0.000
(0.001) (0.001) (0.001) (0.001) (0.002) (0.002) (0.001) (0.001) (0.001) (0.001) (0.001) (0.002)
Year 2009 -0.000 0.001 -0.001 -0.001 -0.000 -0.003 0.000 -0.000 -0.000 0.000 -0.001 -0.001
(0.001) (0.001) (0.001) (0.001) (0.002) (0.002) (0.001) (0.002) (0.001) (0.001) (0.001) (0.002)
Year 2010 -0.001 0.000 -0.002 0.000 0.001 0.000 0.000 -0.000 0.001 -0.001 0.000 0.002
(0.000) (0.000) (0.001) (0.001) (0.001) (0.001) (0.000) (0.001) (0.001) (0.001) (0.001) (0.001)

The ethnic pay gap Appendix
Equality and Human Rights Commission - www.equalityhumanrights.com
Published: August 2017 111
Year 2011 -0.000 -0.000 -0.000 0.000 -0.001 0.000 -
0.001+
-0.001 -0.000 -0.000 -0.001 0.001
(0.000) (0.000) (0.000) (0.000) (0.001) (0.001) (0.000) (0.001) (0.000) (0.000) (0.000) (0.001)
Year 2012 -0.000 -0.000 -0.000 -0.000 -0.000 -0.000 -0.000 -0.000 -0.000 -0.000 -0.000 -0.000
(0.000) (0.000) (0.000) (0.000) (0.000) (0.000) (0.000) (0.000) (0.000) (0.000) (0.000) (0.000)
Year 2013 0.000 0.000 0.000 0.000 0.000 0.000 0.000 0.000 0.000 -0.000 -0.000 -0.000
(0.000) (0.000) (0.000) (0.000) (0.000) (0.000) (0.000) (0.000) (0.000) (0.000) (0.000) (0.000)
Year 2014 0.000 0.001+ 0.001 0.001 0.000 0.001 0.000+ -0.000 0.000 0.000 0.001 0.001
(0.000) (0.000) (0.000) (0.000) (0.000) (0.001) (0.000) (0.000) (0.000) (0.000) (0.000) (0.001)
Total -0.050* -0.144* 0.095+ 0.072 0.038 -0.030 -0.049* -0.283* -0.107* -0.177* -0.103* -0.219*
(0.012) (0.015) (0.045) (0.042) (0.049) (0.050) (0.011) (0.026) (0.018) (0.013) (0.018) (0.039)
Unexplained
Paid hourly rate 0.000 0.000 -0.000 0.002 -0.000 0.000 0.000 -0.000 -0.000 -0.000 -0.001 -0.002
(0.001) (0.000) (0.000) (0.001) (0.000) (0.000) (0.001) (0.003) (0.001) (0.001) (0.002) (0.003)

The ethnic pay gap Appendix
Equality and Human Rights Commission - www.equalityhumanrights.com
Published: August 2017 112
Hours worked no
overtime
-0.060 -0.122 -0.196 -0.324* -0.092 -0.043 0.016 -0.016 0.125 -0.117 0.292* 0.005
(0.057) (0.091) (0.134) (0.106) (0.184) (0.214) (0.090) (0.180) (0.104) (0.102) (0.110) (0.318)
Hours paid overtime -0.004 0.001 0.002 0.006 -0.006 0.005 -0.009* 0.000 -0.005 0.000 -0.008 0.010
(0.003) (0.003) (0.004) (0.007) (0.006) (0.005) (0.003) (0.009) (0.003) (0.003) (0.007) (0.018)
Hours unpaid
overtime
-0.006 -0.007 -0.002 0.010 0.007 0.014 -0.000 0.018 -0.002 -0.007 0.003 -0.027
(0.003) (0.005) (0.007) (0.006) (0.007) (0.023) (0.003) (0.013) (0.005) (0.006) (0.010) (0.017)
Part-time -0.008 -0.012 -0.087 -0.087* 0.011 0.033 -0.006 -0.027 0.012 -0.010 0.048 -0.027
(0.013) (0.014) (0.050) (0.027) (0.071) (0.051) (0.014) (0.025) (0.013) (0.014) (0.027) (0.039)
Christian 0.043* -0.002 0.013 0.000 0.020 0.025 0.040 -0.032 -0.032 -0.005 -0.008 -0.036
(0.012) (0.004) (0.013) (0.002) (0.015) (0.019) (0.062) (0.082) (0.051) (0.037) (0.014) (0.027)
Muslim 0.012* -0.004 0.154 -0.087 0.398 0.259 0.002 -0.008 0.000 0.000 0.000 -0.000
(0.005) (0.006) (0.194) (0.304) (0.308) (0.145) (0.007) (0.006) (0.001) (0.000) (0.000) (0.000)
Other religion 0.148* -0.007 0.006 -0.003 0.014 0.003 0.001 -0.000 -0.003 -0.001 -0.002 -0.002
(0.047) (0.046) (0.006) (0.005) (0.016) (0.007) (0.001) (0.000) (0.003) (0.002) (0.010) (0.018)
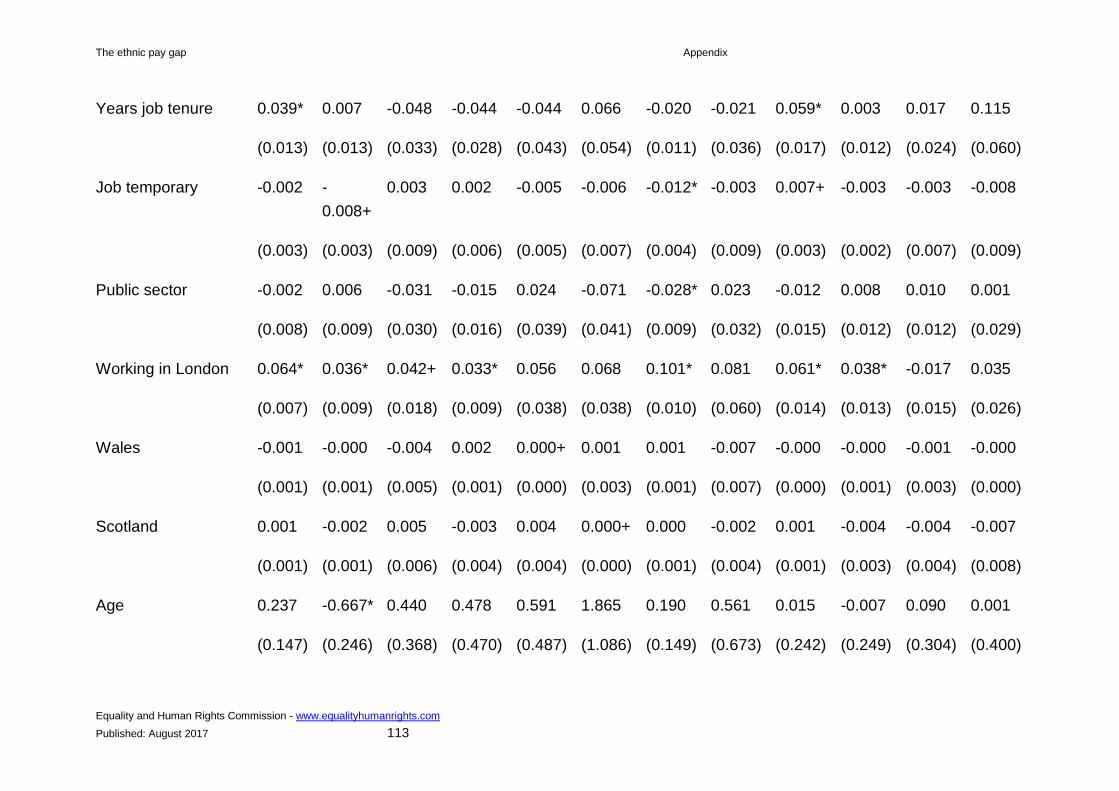
The ethnic pay gap Appendix
Equality and Human Rights Commission - www.equalityhumanrights.com
Published: August 2017 113
Years job tenure 0.039* 0.007 -0.048 -0.044 -0.044 0.066 -0.020 -0.021 0.059* 0.003 0.017 0.115
(0.013) (0.013) (0.033) (0.028) (0.043) (0.054) (0.011) (0.036) (0.017) (0.012) (0.024) (0.060)
Job temporary -0.002 -
0.008+
0.003 0.002 -0.005 -0.006 -0.012* -0.003 0.007+ -0.003 -0.003 -0.008
(0.003) (0.003) (0.009) (0.006) (0.005) (0.007) (0.004) (0.009) (0.003) (0.002) (0.007) (0.009)
Public sector -0.002 0.006 -0.031 -0.015 0.024 -0.071 -0.028* 0.023 -0.012 0.008 0.010 0.001
(0.008) (0.009) (0.030) (0.016) (0.039) (0.041) (0.009) (0.032) (0.015) (0.012) (0.012) (0.029)
Working in London 0.064* 0.036* 0.042+ 0.033* 0.056 0.068 0.101* 0.081 0.061* 0.038* -0.017 0.035
(0.007) (0.009) (0.018) (0.009) (0.038) (0.038) (0.010) (0.060) (0.014) (0.013) (0.015) (0.026)
Wales -0.001 -0.000 -0.004 0.002 0.000+ 0.001 0.001 -0.007 -0.000 -0.000 -0.001 -0.000
(0.001) (0.001) (0.005) (0.001) (0.000) (0.003) (0.001) (0.007) (0.000) (0.001) (0.003) (0.000)
Scotland 0.001 -0.002 0.005 -0.003 0.004 0.000+ 0.000 -0.002 0.001 -0.004 -0.004 -0.007
(0.001) (0.001) (0.006) (0.004) (0.004) (0.000) (0.001) (0.004) (0.001) (0.003) (0.004) (0.008)
Age 0.237 -0.667* 0.440 0.478 0.591 1.865 0.190 0.561 0.015 -0.007 0.090 0.001
(0.147) (0.246) (0.368) (0.470) (0.487) (1.086) (0.149) (0.673) (0.242) (0.249) (0.304) (0.400)

The ethnic pay gap Appendix
Equality and Human Rights Commission - www.equalityhumanrights.com
Published: August 2017 114
Qualification Level
4+
0.008 0.196* 0.001 0.001 -0.042 -0.029 0.050 -0.112 -0.010 -0.018 -0.016 0.289
(0.017) (0.070) (0.031) (0.059) (0.056) (0.114) (0.028) (0.139) (0.021) (0.024) (0.042) (0.214)
Qualification Level 3 0.004 0.041+ 0.008 0.007 -0.003 -0.003 0.004 -0.010 0.006 -0.009 -0.005 0.012
(0.003) (0.017) (0.010) (0.025) (0.027) (0.039) (0.005) (0.026) (0.006) (0.009) (0.005) (0.013)
Qualification Level
2+ Apprentice
-0.003 0.046* 0.010 0.013 -0.007 -0.008 0.007 -0.014 -0.001 -0.009 0.007 0.092+
(0.004) (0.015) (0.010) (0.023) (0.020) (0.036) (0.007) (0.020) (0.008) (0.009) (0.006) (0.044)
Qualification Level 2- 0.001 0.031* 0.002 0.021 -0.006 -0.008 0.003 -0.004 -
0.016+
-0.013 0.014 0.018
(0.003) (0.010) (0.009) (0.011) (0.022) (0.024) (0.003) (0.008) (0.007) (0.009) (0.007) (0.021)
Qualification Others -
0.018+
0.006+ -0.003 0.001 0.003 0.000 -0.005 -0.007 -0.003 -0.002 -0.009 0.009
(0.008) (0.003) (0.015) (0.002) (0.016) (0.000) (0.009) (0.008) (0.005) (0.002) (0.012) (0.010)
Married/Cohabiting 0.034 -0.013 -0.046 -0.006 -0.006 -0.053 -0.002 -0.081* -0.002 -0.006 0.021 -0.057
(0.021) (0.015) (0.044) (0.021) (0.045) (0.041) (0.009) (0.027) (0.011) (0.007) (0.028) (0.041)

The ethnic pay gap Appendix
Equality and Human Rights Commission - www.equalityhumanrights.com
Published: August 2017 115
Dependent children -0.037* 0.016 0.018 0.039 -0.001 -0.044 0.005 -0.014 -0.019 0.009 -0.033 -0.011
(0.012) (0.016) (0.042) (0.026) (0.052) (0.044) (0.015) (0.060) (0.014) (0.017) (0.020) (0.028)
Has health problem -0.003 0.004 -0.012 -0.001 0.011 -0.007 0.003 -
0.027+
-0.008 -0.001 -0.005 0.016
(0.004) (0.004) (0.013) (0.006) (0.011) (0.007) (0.004) (0.012) (0.008) (0.005) (0.006) (0.017)
2 Professional
Occupations
0.002 -0.023 0.015 -0.014 -0.022 0.017 -0.003 -0.023 -0.014 -0.010 -0.072* -0.153*
(0.011) (0.012) (0.029) (0.020) (0.027) (0.037) (0.011) (0.036) (0.013) (0.008) (0.023) (0.056)
3 Associate
Professional
0.019+ -
0.020+
0.025 0.013 0.018 0.011 0.003 -0.005 -
0.039+
-0.018 -0.026 -
0.104+
(0.009) (0.009) (0.019) (0.014) (0.023) (0.022) (0.012) (0.035) (0.018) (0.009) (0.018) (0.043)
4 Administrative,
Secretarial
0.017 -0.010 0.006 0.001 -0.007 -0.017 -0.006 -0.004 -0.049* -0.024 -0.022 -
0.092+
(0.009) (0.011) (0.019) (0.020) (0.014) (0.049) (0.005) (0.039) (0.018) (0.013) (0.015) (0.038)
5 Skilled
Occupations
0.003 -0.001 0.004 0.001 0.000 -0.000 -0.001 -0.001 -0.006 -0.003 0.002 -0.012
(0.002) (0.001) (0.004) (0.001) (0.000) (0.000) (0.001) (0.002) (0.003) (0.002) (0.005) (0.012)
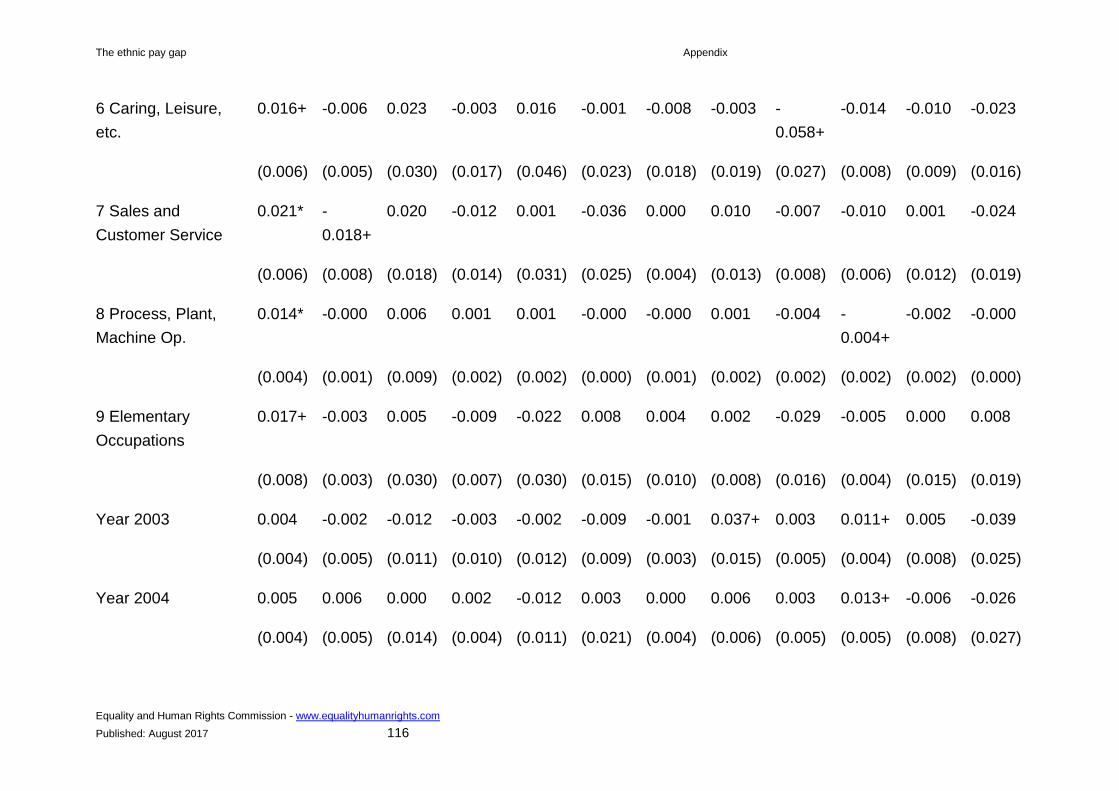
The ethnic pay gap Appendix
Equality and Human Rights Commission - www.equalityhumanrights.com
Published: August 2017 116
6 Caring, Leisure,
etc.
0.016+ -0.006 0.023 -0.003 0.016 -0.001 -0.008 -0.003 -
0.058+
-0.014 -0.010 -0.023
(0.006) (0.005) (0.030) (0.017) (0.046) (0.023) (0.018) (0.019) (0.027) (0.008) (0.009) (0.016)
7 Sales and
Customer Service
0.021* -
0.018+
0.020 -0.012 0.001 -0.036 0.000 0.010 -0.007 -0.010 0.001 -0.024
(0.006) (0.008) (0.018) (0.014) (0.031) (0.025) (0.004) (0.013) (0.008) (0.006) (0.012) (0.019)
8 Process, Plant,
Machine Op.
0.014* -0.000 0.006 0.001 0.001 -0.000 -0.000 0.001 -0.004 -
0.004+
-0.002 -0.000
(0.004) (0.001) (0.009) (0.002) (0.002) (0.000) (0.001) (0.002) (0.002) (0.002) (0.002) (0.000)
9 Elementary
Occupations
0.017+ -0.003 0.005 -0.009 -0.022 0.008 0.004 0.002 -0.029 -0.005 0.000 0.008
(0.008) (0.003) (0.030) (0.007) (0.030) (0.015) (0.010) (0.008) (0.016) (0.004) (0.015) (0.019)
Year 2003 0.004 -0.002 -0.012 -0.003 -0.002 -0.009 -0.001 0.037+ 0.003 0.011+ 0.005 -0.039
(0.004) (0.005) (0.011) (0.010) (0.012) (0.009) (0.003) (0.015) (0.005) (0.004) (0.008) (0.025)
Year 2004 0.005 0.006 0.000 0.002 -0.012 0.003 0.000 0.006 0.003 0.013+ -0.006 -0.026
(0.004) (0.005) (0.014) (0.004) (0.011) (0.021) (0.004) (0.006) (0.005) (0.005) (0.008) (0.027)

The ethnic pay gap Appendix
Equality and Human Rights Commission - www.equalityhumanrights.com
Published: August 2017 117
Year 2005 0.002 0.001 -0.005 0.006 -0.007 -0.020 -0.000 0.012 0.001 0.012* -0.003 -0.026
(0.003) (0.003) (0.006) (0.005) (0.009) (0.013) (0.003) (0.009) (0.003) (0.004) (0.007) (0.023)
Year 2006 -0.001 -0.001 -0.005 0.015 -0.005 -0.018 -0.002 0.016 0.005 0.004 0.013 -0.017
(0.004) (0.006) (0.010) (0.008) (0.011) (0.020) (0.005) (0.010) (0.005) (0.006) (0.012) (0.025)
Year 2007 0.004 0.002 -0.008 0.008 0.009 0.005 0.003 0.027 -0.002 0.021* 0.001 -0.026
(0.004) (0.007) (0.010) (0.009) (0.015) (0.008) (0.005) (0.014) (0.006) (0.007) (0.012) (0.021)
Year 2008 0.010+ 0.008 -0.011 0.007 0.002 0.003 -0.003 0.045 0.004 0.011+ -0.006 -0.038
(0.005) (0.007) (0.014) (0.006) (0.017) (0.028) (0.005) (0.024) (0.004) (0.005) (0.012) (0.028)
Year 2009 -0.005 0.001 -0.006 0.017 -0.020 -0.030 0.004 0.036* 0.003 0.009 0.005 -0.029
(0.004) (0.006) (0.015) (0.009) (0.016) (0.031) (0.005) (0.014) (0.005) (0.005) (0.012) (0.031)
Year 2010 0.002 0.008 0.002 0.012 -0.012 -0.007 0.004 0.027+ -0.005 0.013+ 0.010 -0.009
(0.005) (0.006) (0.019) (0.008) (0.012) (0.015) (0.005) (0.012) (0.004) (0.006) (0.010) (0.013)
Year 2011 -0.003 0.007 -0.011 0.014 -0.009 -0.005 -0.002 0.043* 0.009 0.018* 0.005 -0.020
(0.004) (0.007) (0.015) (0.007) (0.015) (0.012) (0.006) (0.016) (0.007) (0.006) (0.013) (0.017)
Year 2012 0.004 0.006 -0.008 0.005 0.003 -0.006 0.008 0.033+ -0.009 0.009+ -0.001 -0.016
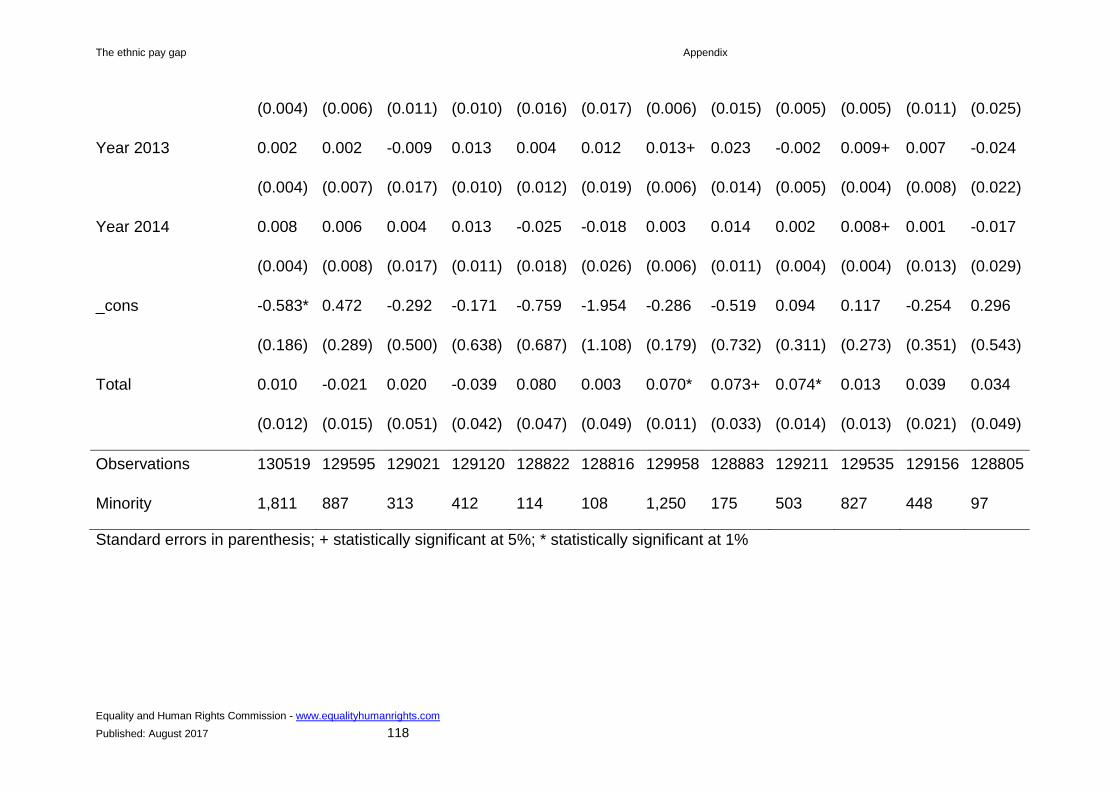
The ethnic pay gap Appendix
Equality and Human Rights Commission - www.equalityhumanrights.com
Published: August 2017 118
(0.004) (0.006) (0.011) (0.010) (0.016) (0.017) (0.006) (0.015) (0.005) (0.005) (0.011) (0.025)
Year 2013 0.002 0.002 -0.009 0.013 0.004 0.012 0.013+ 0.023 -0.002 0.009+ 0.007 -0.024
(0.004) (0.007) (0.017) (0.010) (0.012) (0.019) (0.006) (0.014) (0.005) (0.004) (0.008) (0.022)
Year 2014 0.008 0.006 0.004 0.013 -0.025 -0.018 0.003 0.014 0.002 0.008+ 0.001 -0.017
(0.004) (0.008) (0.017) (0.011) (0.018) (0.026) (0.006) (0.011) (0.004) (0.004) (0.013) (0.029)
_cons -0.583* 0.472 -0.292 -0.171 -0.759 -1.954 -0.286 -0.519 0.094 0.117 -0.254 0.296
(0.186) (0.289) (0.500) (0.638) (0.687) (1.108) (0.179) (0.732) (0.311) (0.273) (0.351) (0.543)
Total 0.010 -0.021 0.020 -0.039 0.080 0.003 0.070* 0.073+ 0.074* 0.013 0.039 0.034
(0.012) (0.015) (0.051) (0.042) (0.047) (0.049) (0.011) (0.033) (0.014) (0.013) (0.021) (0.049)
Observations 130519 129595 129021 129120 128822 128816 129958 128883 129211 129535 129156 128805
Minority 1,811 887 313 412 114 108 1,250 175 503 827 448 97
Standard errors in parenthesis; + statistically significant at 5%; * statistically significant at 1%

The ethnicity pay gap Appendix
Equality and Human Rights Commission - www.equalityhumanrights.com
Published: August 2017 119
Table A6: Pay gaps of ethnic minority men and women
(1)
White British women -0.236*
(0.002)
Indian migrant men 0.029+
(0.012)
British Indian men 0.008
(0.019)
Indian migrant women -0.196*
(0.013)
British Indian women -0.070*
(0.019)
Pakistani migrant men -0.309*
(0.019)
British Pakistani men -0.187*
(0.027)
Pakistani migrant women -0.350*
(0.031)
British Pakistani women -0.269*
(0.027)
Bangladeshi migrant men -0.478*
(0.029)
British Bangladeshi men -0.257*

The ethnicity pay gap Appendix
Equality and Human Rights Commission - www.equalityhumanrights.com
Published: August 2017 120
(0.055)
Bangladeshi migrant women -0.354*
(0.052)
British Bangladeshi women -0.209*
(0.053)
Black African migrant men -0.194*
(0.016)
British Black African men 0.022
(0.042)
Black African migrant women -0.256*
(0.016)
British Black African women -0.026
(0.042)
Black Caribbean migrant men -0.174*
(0.031)
British Black Caribbean men -0.069*
(0.023)
Black Caribbean migrant women -0.203*
(0.025)
British Black Caribbean women -0.072*
(0.019)
Chinese migrant men -0.006

The ethnicity pay gap Appendix
Equality and Human Rights Commission - www.equalityhumanrights.com
Published: August 2017 121
(0.030)
British Chinese men -0.074
(0.054)
Chinese migrant women -0.172*
(0.026)
British Chinese women -0.050
(0.056)
Intercept 2.607*
(0.002)
Adj_R2 0.043
Observations 263469
Standard errors in parenthesis; + statistically significant at 5%; * statistically
significant at 1%

The ethnicity pay gap Contacts
Equality and Human Rights Commission - www.equalityhumanrights.com
Published: August 2017 122
Contacts
This publication and related equality and human rights resources are available from
the Commission’s website: www.equalityhumanrights.com.
For advice, information or guidance on equality, discrimination or human rights
issues, please contact the Equality Advisory and Support Service, a free and
independent service.
Website www.equalityadvisoryservice.com
Telephone 0808 800 0082
Textphone 0808 800 0084
Hours 09:00 to 19:00 (Monday to Friday) 10:00 to 14:00 (Saturday)
Post FREEPOST Equality Advisory Support Service FPN4431
Questions and comments regarding this publication may be addressed to:
[email protected]. The Commission welcomes your
feedback.
Alternative formats
This publication is also available as a Microsoft Word file from
www.equalityhumanrights.com. For information on accessing a Commission
publication in an alternative format, please contact:
© 2017 Equality and Human Rights Commission
Published August 2017

www.equalityhumanrights.com
You can download this publication from
© 2017 Equality and Human Rights Commission
Published: August 2017