the epidemiology of meningococcal disease in new · pdf filethe epidemiology of meningococcal...
TRANSCRIPT

www.surv.esr.cri.nz
SURVEILLANCE REPORT
The epidemiology of meningococcal disease
in New Zealand
2011
Prepared as part of a Ministry of Health contract for scientific services by the Health Intelligence Team, Institute of Environmental Science and Research Limited
June 2012Client Report: FW12021


THE EPIDEMIOLOGY OF
MENINGOCOCCAL DISEASE
IN NEW ZEALAND IN 2011
Prepared as part of a Ministry of Health contract for scientific services
by
Liza Lopez, Senior Analyst Dr Kerry Sexton, Public Health Physician
Dr Phil Carter, Science Leader
June 2012

This report is available at www.surv.esr.cri.nz
First published: 22 June 2012
Revised: 25 January 2013
This edition has been revised to correct the errors in the data presented in Table 2 regarding the total number and
percentage of cases due to group C strains.
Suggested citation:
Lopez, L., K. Sexton, and P. Carter, The Epidemiology of Meningococcal Disease in New Zealand in 2011, 2012, Institute of Environmental Science and Research Ltd (ESR): Wellington, New Zealand
Client Report FW12021
Reproduction is authorised provided the source is acknowledged.

Institute of Environmental Science and Research Limited i
Acknowledgements
This report could not have been generated without the continuing support of staff in Public Health Services, diagnostic laboratories, medical practices and hospitals throughout New Zealand. All have a role in improving surveillance. The authors wish to thank Heather Davies and Julie Morgan for the strain identification of meningococcal samples referred to ESR. We also thank staff from the various medical laboratories for the referral of specimens to ESR for strain typing, ESR’s Antibiotic Reference Laboratory for surveillance of antimicrobial susceptibility, Esther Lim for data integration and peer checking, Don Bandaranayake, Joanna Mackichan, Tomasz Kiedrzynski, and Grant Storey for peer review.
Disclaimer
This report or document (“the Report”) is given by the Institute of Environmental Science and Research Limited (“ESR”) solely for the benefit of the Ministry of Health, Public Health Services Providers and other Third Party Beneficiaries as defined in the Contract between ESR and the Ministry of Health, and is strictly subject to the conditions laid out in that Contract.
Neither ESR nor any of its employees makes any warranty, express or implied, or assumes any legal liability or responsibility for use of the Report or its contents by any other person or organisation.

ii Institute of Environmental Science and Research Limited

Institute of Environmental Science and Research Limited iii
TABLE OF CONTENTS
List of tables ............................................................................................................................................. iv
List of figures ........................................................................................................................................... iv
Summary .................................................................................................................................................... 1
Introduction ............................................................................................................................................... 5
Methods ..................................................................................................................................................... 9
Data sources .................................................................................................................................................11
Case definition .................................................................................................................................11
EpiSurv, the national notifiable disease surveillance system ..........................................................11
Reference Laboratories at ESR ........................................................................................................11
Laboratory methods .....................................................................................................................................11
Strain characterisation ......................................................................................................................11
Antimicrobial resistance determination ...........................................................................................12
Analytical methods ......................................................................................................................................12
Results ..................................................................................................................................................... 13
Case characteristics ......................................................................................................................................15
Incidence and rates by year ..............................................................................................................15
Geographic variation ........................................................................................................................16
Incidence by age...............................................................................................................................16
Incidence by ethnic group ................................................................................................................17
Incidence by deprivation index for cases aged less than 20 years ...................................................19
Laboratory confirmation and typing ............................................................................................................19
Strain types among confirmed cases ................................................................................................19
Dominant circulating strain – Group B:P1.7-2,4 .............................................................................20
Dominant circulating strain – Group C:P1.5-1,10-8 ........................................................................22
Vaccine-targeted strains ...............................................................................................................................25 Antimicrobial susceptibility .........................................................................................................................26 Clinical outcomes .........................................................................................................................................27 Case management ........................................................................................................................................27
Discussion ............................................................................................................................................... 29
References ............................................................................................................................................... 33
Appendix .................................................................................................................................................. 37

iv Institute of Environmental Science and Research Limited
LIST OF TABLES
Table 1: Notified cases and rate of meningococcal disease, 2007–2011 .................................................... 15 Table 2. Distribution of strain types among meningococcal disease cases, 2011 ....................................... 19 Table 3. Number of group B:P1.7-2,4 strain cases by District Health Board, 2007–2011 ......................... 21 Table 4. Number of group B:P1.7-2,4 strain by year, 2007–2011 .............................................................. 22 Table 5. Number of group C:P1.5-1,10-8 strain cases by District Health Board, 2007–2011 .................... 23 Table 6. Number of group C:P1.5-1,10-8 strain by year, 2007–2011 ......................................................... 24 Table 7. Number of meningococcal disease cases caused by vaccine-targeted strains, 2007–2011 ........... 25 Table 8. Number of meningococcal disease cases caused by vaccine-targeted strains by age group, 2011 ............................................................................................................................................................. 25 Table 9. MIC range and MIC90 of isolates, 2011 ........................................................................................ 26 Table 10. Strain group distribution by year, 2007–2011 ............................................................................. 39 Table 11. Age distribution of meningococcal disease cases, 2007–2011 ................................................... 39 Table 12. Numbers and age-standardised incidence rates by ethnicity for cases of meningococcal disease in 2007–2011 .................................................................................................................................. 40 Table 13. Numbers and incidence rates for cases of meningococcal disease by age group and ethnic group, 2011 .................................................................................................................................................. 40 Table 14. Distribution of strain types among meningococcal disease cases and total cases by District Health Board, 2011 ...................................................................................................................................... 41 Table 15. Case-fatality rates for meningococcal disease cases by age, sex, ethnicity and strain group, 2007–2011 ................................................................................................................................................... 42
LIST OF FIGURES
Figure 1. Notified cases of meningococcal disease, 1975–2011 ................................................................. 15 Figure 2. Meningococcal disease rates by District Health Board, 2011 ..................................................... 16 Figure 3. Meningococcal disease rates by age group, 2007–2011 .............................................................. 17 Figure 4. Age-standardised meningococcal disease rates by ethnic group, 2007–2011 ............................. 18 Figure 5. Meningococcal disease rates by age group and ethnic group, 2011 ............................................ 18 Figure 6. Meningococcal disease rates by quintiles of NZDep06 for cases aged less than 20 years, 2007–2011 ................................................................................................................................................... 19 Figure 7. Groups and dominant subtypes among strain-typed meningococcal disease cases, 2007–2011 20 Figure 8. Rate per 100 000 population of group B:P1.7-2,4 strain disease by year, 2007–2011 ................ 21 Figure 9. Rate of group C:P1.5-1,10-8 strain disease by year, 2007–2011 ................................................. 23 Figure 10. Reduced penicillin susceptibility among N. meningitidis from invasive disease, 2007–2011 .. 26 Figure 11. Meningococcal disease case-fatality rates, 2007–2011 ............................................................. 27

SUMMARY


The Epidemiology of Meningococcal Disease in New Zealand 2011 Summary
Institute of Environmental Science and Research Limited 3
SUMMARY
The key findings from meningococcal disease surveillance in 2011 follow:
One hundred and nineteen cases of meningococcal disease were notified. This equates to a rate of 2.7 per 100 000 population. The number of confirmed cases was 108, giving a confirmation rate of 90.8%.
The highest District Health Board (DHB) rates of meningococcal disease were recorded in Northland (8.2 per 100 000 population, 13 cases) and Lakes (6.8 per 100 000 population, 7 cases) DHBs. The DHBs with the lowest rates of meningococcal disease were Auckland (1.5 per 100 000 population, 7 cases) and Waitemata (1.6 per 100 000 population, 9 cases).
The highest age-specific rates of meningococcal disease continued to occur in children younger than 5 years of age: 38.5 per 100 000 population for those aged less than 1 year old; 12.7 per 100 000 population for those aged 1–4 years. The rate of disease for children aged less than 1 year was lower in 2011 than in 2010 (42.4 per 100 000 population), while the rate of disease for children aged 1–4 years was higher in 2011 than in 2010 (9.3 per 100 000 population).
Although age-standardised rates decreased for all ethnic groups between 2007 and 2011, Māori and Pacific Peoples continued to experience higher rates of disease than the European or Other ethnic group in 2011. The highest disease rate was in the Pacific Peoples ethnic group (7.1 per 100 000 population, 19 cases), followed by Māori (6.3 per 100 000 population, 41 cases) and European or Other (1.8 per 100 000 population, 55 cases) ethnic groups.
The strain type was determined for 100 (92.6%) of the 108 confirmed meningococcal disease cases – 37.0% were due to group B:P1.7-2,4 and 27.0% were due to group C:P1.5-1,10-8.
Hospitalisation status was recorded for all notified cases for which 115 (96.7%) were hospitalised. Of the four cases that were not hospitalised, one died.
Thirteen fatalities occurred, giving a case-fatality rate of 10.9%. The case-fatality rate for group B:P1.7-2,4 strain was 5.4% (2 fatalities) compared with 33.3% (9 fatalities) for group C:P1.5-1,10-8 strain.
Of the 77 viable meningococcal isolates received by ESR from cases of invasive disease, 19.5% (15/77) had reduced susceptibility to penicillin, with minimum inhibitory concentrations (MICs) of 0.12–0.5 mg/L and 1.3% (1/77) were rifampicin resistant (MIC ≥32 mg/L). All isolates were susceptible to ceftriaxone and ciprofloxacin.


INTRODUCTION


The Epidemiology of Meningococcal Disease in New Zealand 2011 Introduction
Institute of Environmental Science and Research Limited 7
INTRODUCTION
Invasive meningococcal disease is a serious disease caused by infection with the bacterium Neisseria meningitidis which can rapidly progress from a mild flu-like illness to death [1].
A large epidemic of meningococcal disease due to a single group B strain, B:P1.7-2,4, occurred in New Zealand between 1991 and 2007 [2],[3]. This led to the development of a strain-specific vaccine, MeNZBTM [4], and a vaccination programme between 2004 and 2008. Smaller, localised outbreaks of meningococcal disease have also occurred in New Zealand including a group A disease outbreak in Auckland in 1985/86 [5] and various group C regional outbreaks, most recently in Northland in 2011 [6].
The epidemiology of meningococcal disease in New Zealand has been summarised annually as reports to the Ministry of Health since the mid-1990s. These are accessible on the internet for 2005 onwards on the websites http://www.health.govt.nz (for the years 2005 to 2007) and http://www.surv.esr.cri.nz (for 2008 onwards). This report summarises the epidemiology of meningococcal disease in 2011 and reviews the trends in disease patterns from 2007 onwards, purposefully focusing on the period following the B:P1.7-4 epidemic. Laboratory typing methodologies have also been stable in New Zealand since 2007. The report aims to provide historic and recent data against which the current rates of meningococcal disease in New Zealand can be assessed.


METHODS

The Epidemiology of Meningococcal Disease in New Zealand 2011 Methods
Institute of Environmental Science and Research Limited 11
METHODS
Data sources
Surveillance of meningococcal disease in New Zealand is based on a combination of notification and laboratory-based surveillance.
Case definition
The case definition for meningococcal disease (for the period covered in this report) was defined in the Ministry of Health’s Communicable Disease Control Manual (1998) [7] as: ‘Meningococcal disease presents as meningitis or meningococcal septicaemia. The disease presents as an acute fever, nausea, vomiting, and headache and may rapidly progress to shock and death. Petechial rash is seen in about 50 percent’. Cases with a clinically compatible illness are classified as probable or confirmed as follows:
Probable case a clinically compatible illness and isolation of Neisseria meningitidis from the throat or
a clinically compatible illness.
Confirmed case A clinically compatible illness with at least one of the following:
isolation of N. meningitidis from an otherwise sterile body site [cerebrospinal fluid (CSF), blood, aspirate or skin biopsy] or
a positive nucleic acid test using the polymerase chain reaction (PCR) on CSF, blood, serum or aspirate or
detection of Gram-negative intracellular diplococci in CSF, blood, aspirate or skin biopsy or
a positive meningococcal antigen test on CSF.
EpiSurv, the national notifiable disease surveillance system
Meningococcal disease is notifiable to medical officers of health under the Health Act 1956. Data on each case are entered by the respective public health unit (PHU) via a secure web-based portal onto EpiSurv, a computerised database. The real-time data are collated and analysed on behalf of the Ministry of Health by the Institute of Environmental Science and Research Ltd (ESR).
Notification data contained in this report are based on information recorded on EpiSurv as at 21 February 2012. Changes made to EpiSurv data by PHU staff after this date will not be reflected in this report. Consequently, future analyses of data may produce revised results. Notification data from 2007 to 2011 presented in this report have been updated to reflect those in EpiSurv as at 21 February 2012.
Reference Laboratories at ESR
Diagnostic laboratories routinely refer invasive samples from cases of meningococcal disease to the Invasive Pathogens Laboratory at ESR for characterisation to determine the strain type. Some laboratories are also requested to send isolates from non-invasive sites to help monitor strains circulating in the community.
Antimicrobial resistance data contained in this report are from the national surveillance of antimicrobial resistance among human pathogens conducted by the Antibiotic Reference Laboratory at ESR.
Laboratory methods
Strain characterisation
Strain characterisation is conducted by the Invasive Pathogens Laboratory at ESR. Routine characterisation includes determining the group, serotype (for isolates only, not DNA samples) and subtype (PorA type).

The Epidemiology of Meningococcal Disease in New Zealand 2011 Methods
12 Institute of Environmental Science and Research Limited
The group is identified either serologically or by PCR. Serology is used to determine the serotype, and DNA sequence analysis of the porA gene is used to determine the PorA type. Prior to 2007, the PorA type was largely determined phenotypically using monoclonal antibodies (MAbs). Only a limited subset of PorA types could be determined using this method, therefore, the analyses in this report focus on the period from 2007 onwards.
Using B:4:P1.7-2,4, as an example, ‘B’ is the group, ‘4’ is the serotype and ‘P1.7-2,4’ is the PorA type. In this report, the strain responsible for the New Zealand epidemic is defined as B:P1.7-2,4. A serotype is not specified as the serotype cannot be determined from DNA samples submitted to ESR for strain typing. For this same reason, serotypes are not included in the analyses of dominant circulating strains for this report.
As the MeNZBTM vaccine targeted the P1.7-2,4 PorA protein of the meningococcus, more specifically the region containing the P1.4 variable region [8], it was expected to be effective against all meningococci with this variable region. Therefore, in the analyses described in this report, all meningococci with the P1.4 variable region are described as being targeted by the MeNZBTM vaccine.
Antimicrobial resistance determination
Ceftriaxone, ciprofloxacin, penicillin and rifampicin minimum inhibitory concentrations (MICs) were determined by Etest on Mueller-Hinton agar + 5% sheep blood. MICs were interpreted according to the Clinical and Laboratory Standards Institute’s criteria [8].
Analytical methods
Denominator data used to determine all disease rates, except for those relating to ethnicity, were derived from the 2011 mid-year population estimates published by Statistics New Zealand. Denominator data used to determine disease rates for ethnic groups were based on the proportion of people in each ethnic group (accounting for differences in these proportions in age and sex groups) from the estimated resident 2006 Census population applied to the 2011 mid-year population estimates from Statistics New Zealand. Ethnicity is prioritised as follows: Māori, Pacific Peoples, Asian, Middle Eastern/Latin American/African (MELAA) and European or Other Ethnicity (including New Zealander).
Rates have not been calculated where there are fewer than five notified cases in any category. Calculating population rates from fewer than five cases produces unstable rates.
This report analyses the distribution of meningococcal disease by deprivation using the New Zealand Deprivation Index 2006 [9]. The index measuring relative socioeconomic deprivation is derived from a weighted combination of nine variables from the 2006 census, each reflecting a different aspect of material and social deprivation. The deprivation score, which ranges from 1 (least deprived) to 10 (most deprived), is calculated for each geographical meshblock in New Zealand. Approximately equal numbers of people reside in areas associated with each of the 10 deprivation levels [10].
The Pearson chi-square test or, where necessary, Fisher's Exact tests were used to determine statistical significance. P-values < 0.05 are considered to be significant at the 95% level of confidence.

RESULTS


The Epidemiology of Meningococcal Disease in New Zealand 2011 Results
Institute of Environmental Science and Research Limited 15
RESULTS
The analyses include all notified cases of meningococcal disease, both confirmed and probable, unless indicated.
Case characteristics
Incidence and rates by year
Figure 1 shows the number of notified cases of meningococcal disease between 1975 and 2011. Three peaks in notification counts are prominent over this period: 190 cases in 1986 (driven by the outbreak of group A disease in Auckland), and peaks of 609 and 648 cases in 1997 and 2001 respectively (driven by the epidemic of B:P1.7-2,4 disease).
Figure 1. Notified cases of meningococcal disease, 1975–2011
In 2011, a total of 119 cases of meningococcal disease were notified, which equates to a rate of 2.7 per 100 000 population (Table 1). From 2007 to 2010, case numbers ranged from 97 to 133 cases, with an annual average rate of 2.7 per 100 000 population. Of the 119 cases in 2011, 108 (90.8%) were confirmed, giving a rate of 2.5 per 100 000 population for confirmed disease.
Table 1: Notified cases and rate of meningococcal disease, 2007–2011
Year No. Rate1
2007 104 2.5
2008 122 2.9
2009 133 3.1
2010 97 2.2
2011 119 2.71 Rate per 100 000 population
0
100
200
300
400
500
600
700
1975
1977
1979
1981
1983
1985
1987
1989
1991
1993
1995
1997
1999
2001
2003
2005
2007
2009
2011
Nu
mb
er o
f ca
ses
Year
The Epidemiology of Meningococcal Disease in New Zealand 2011 Results
16 Institute of Environmental Science and Research Limited
Geographic variation
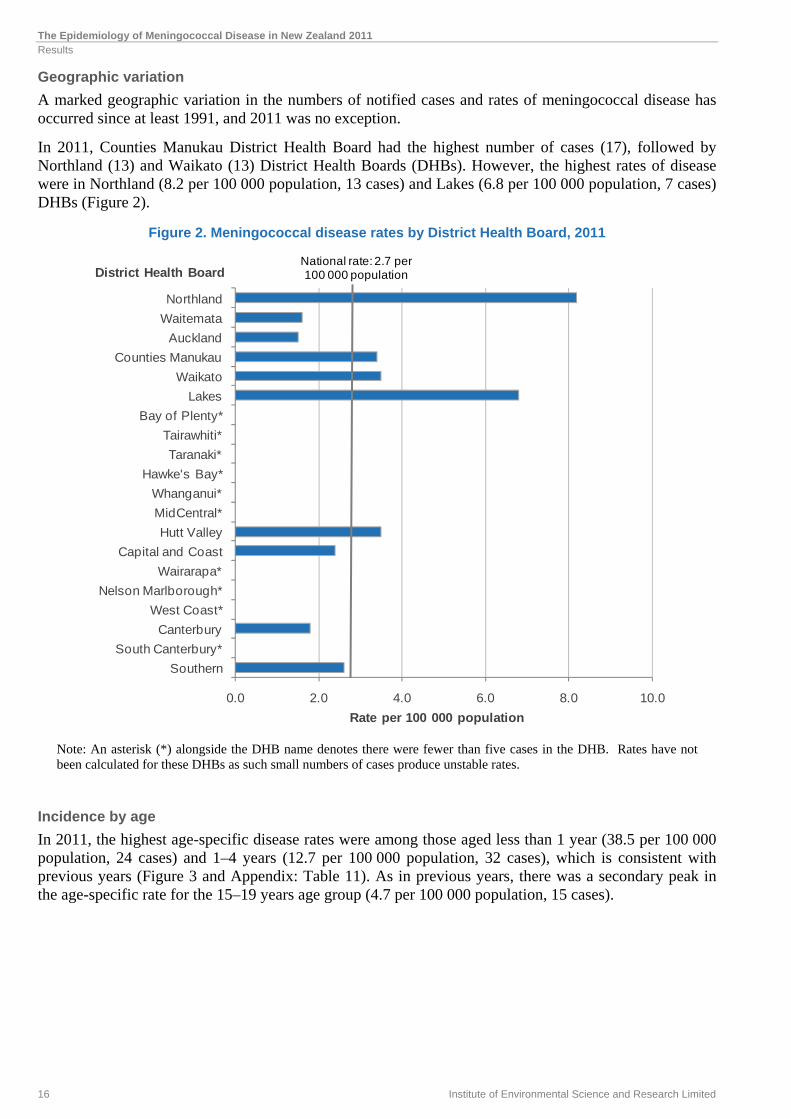
A marked geographic variation in the numbers of notified cases and rates of meningococcal disease has occurred since at least 1991, and 2011 was no exception.
In 2011, Counties Manukau District Health Board had the highest number of cases (17), followed by Northland (13) and Waikato (13) District Health Boards (DHBs). However, the highest rates of disease were in Northland (8.2 per 100 000 population, 13 cases) and Lakes (6.8 per 100 000 population, 7 cases) DHBs (Figure 2).
Figure 2. Meningococcal disease rates by District Health Board, 2011
Note: An asterisk (*) alongside the DHB name denotes there were fewer than five cases in the DHB. Rates have not been calculated for these DHBs as such small numbers of cases produce unstable rates.
Incidence by age
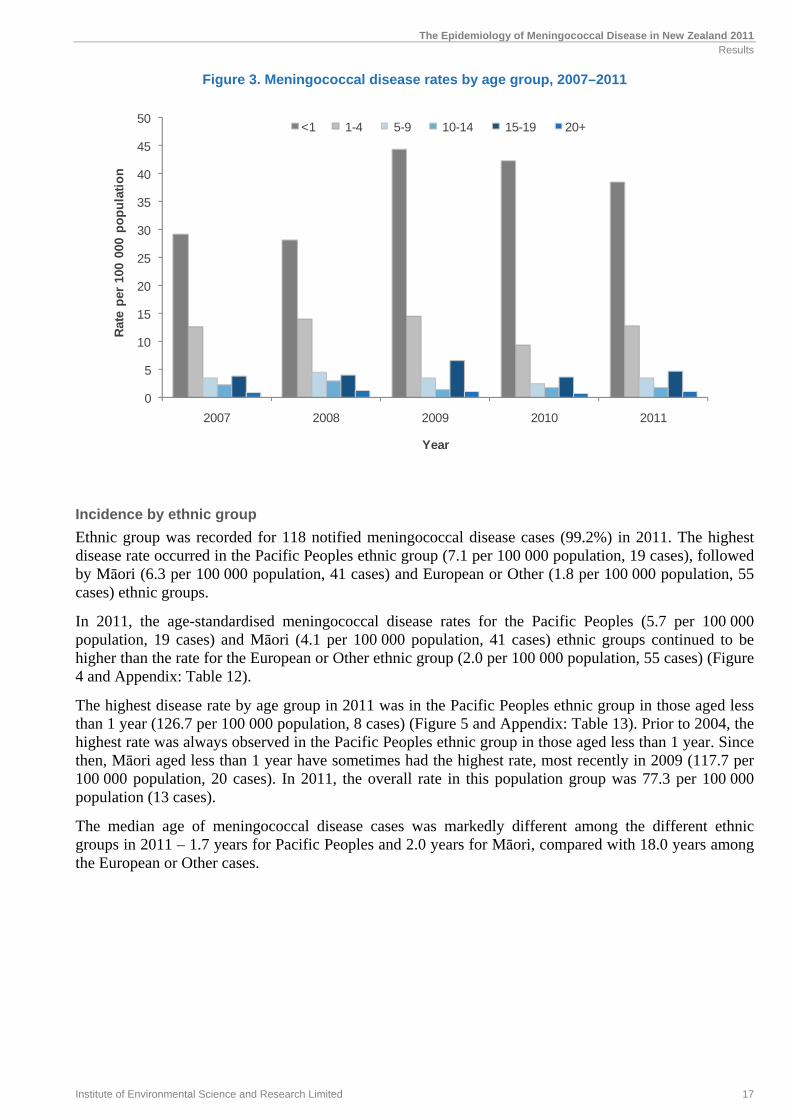
In 2011, the highest age-specific disease rates were among those aged less than 1 year (38.5 per 100 000 population, 24 cases) and 1–4 years (12.7 per 100 000 population, 32 cases), which is consistent with previous years (Figure 3 and Appendix: Table 11). As in previous years, there was a secondary peak in the age-specific rate for the 15–19 years age group (4.7 per 100 000 population, 15 cases).
0.0 2.0 4.0 6.0 8.0 10.0
Southern
South Canterbury*
Canterbury
West Coast*
Nelson Marlborough*
Wairarapa*
Capital and Coast
Hutt Valley
MidCentral*
Whanganui*
Hawke's Bay*
Taranaki*
Tairawhiti*
Bay of Plenty*
Lakes
Waikato
Counties Manukau
Auckland
Waitemata
Northland
Rate per 100 000 population
District Health BoardNational rate: 2.7 per 100 000 population
The Epidemiology of Meningococcal Disease in New Zealand 2011 Results
Institute of Environmental Science and Research Limited 17
Figure 3. Meningococcal disease rates by age group, 2007–2011
Incidence by ethnic group
Ethnic group was recorded for 118 notified meningococcal disease cases (99.2%) in 2011. The highest disease rate occurred in the Pacific Peoples ethnic group (7.1 per 100 000 population, 19 cases), followed by Māori (6.3 per 100 000 population, 41 cases) and European or Other (1.8 per 100 000 population, 55 cases) ethnic groups.
In 2011, the age-standardised meningococcal disease rates for the Pacific Peoples (5.7 per 100 000 population, 19 cases) and Māori (4.1 per 100 000 population, 41 cases) ethnic groups continued to be higher than the rate for the European or Other ethnic group (2.0 per 100 000 population, 55 cases) (Figure 4 and Appendix: Table 12).
The highest disease rate by age group in 2011 was in the Pacific Peoples ethnic group in those aged less than 1 year (126.7 per 100 000 population, 8 cases) (Figure 5 and Appendix: Table 13). Prior to 2004, the highest rate was always observed in the Pacific Peoples ethnic group in those aged less than 1 year. Since then, Māori aged less than 1 year have sometimes had the highest rate, most recently in 2009 (117.7 per 100 000 population, 20 cases). In 2011, the overall rate in this population group was 77.3 per 100 000 population (13 cases).
The median age of meningococcal disease cases was markedly different among the different ethnic groups in 2011 – 1.7 years for Pacific Peoples and 2.0 years for Māori, compared with 18.0 years among the European or Other cases.
0
5
10
15
20
25
30
35
40
45
50
2007 2008 2009 2010 2011
Rat
e p
er 1
00 0
00 p
op
ula
tio
n
Year
<1 1-4 5-9 10-14 15-19 20+

The Epidemiology of Meningococcal Disease in New Zealand 2011 Results
18 Institute of Environmental Science and Research Limited
Figure 4. Age-standardised meningococcal disease rates by ethnic group, 2007–2011
Note: Rates have not been calculated where there are fewer than five notified cases in any category.
Figure 5. Meningococcal disease rates by age group and ethnic group, 2011
Note: Rates have not been calculated where there are fewer than five notified cases in any category.
0
1
2
3
4
5
6
7
2007 2008 2009 2010 2011
Rat
e p
er 1
00 0
00 p
op
ula
tio
n
Year
European or Other Māori Pacif ic Peoples Asian
0
20
40
60
80
100
120
140
<1 1-4 5-9 10-14 15-19 20-29 30-39 40+
Rat
e p
er 1
00 0
00 p
op
ula
tio
n
Age group (years)
European or Other Māori Pacif ic Peoples

The Epidemiology of Meningococcal Disease in New Zealand 2011 Results
Institute of Environmental Science and Research Limited 19
Incidence by deprivation index for cases aged less than 20 years
A gradient in meningococcal disease rates by socio-economic status, where incidence rates rise with increasing levels of socio-economic deprivation (based on NZDep06) for cases aged less than 20 years, has been a consistent feature between 2007 and 2011 (Figure 6).
Figure 6. Meningococcal disease rates by quintiles of NZDep06 for cases aged less than 20 years, 2007–2011
Laboratory confirmation and typing In 2011, 108 (90.8%) meningococcal disease cases were laboratory confirmed by the isolation of N. meningitidis (78) or by detection of meningococcal DNA by PCR (30).
Strain types among confirmed cases
Table 2 shows the distribution of strain types in 2011 among meningococcal disease cases. In 2011, the strain type was determined for 100 (92.6%) of the 108 confirmed cases, with group B strains making up more than 60% of the cases and group C strains making up more than 30% of the cases. The most common strain in 2011 was group B:P1.7-2,4 (37 cases) followed by group C:P1.5-1,10-8 (27 cases).
Table 2. Distribution of strain types among meningococcal disease cases, 2011
Strain group Number of cases Percentage 1
Group B 62 62.0 P1.7-2,4 37 37.0 Other group Bs 25 25.0 Group C 32 32.0 P1.5-1,10-8 27 27.0 Other group Cs 5 5.0 Other 6 6.0 Group Y 3 3.0 Group W135 2 2.0 Non-groupable 1 1.0 Total 100 100.0
1 Percentage was calculated using the total number of laboratory-confirmed cases where strain group was determined
0
2
4
6
8
10
12
14
16
18
20
1 or 2 3 or 4 5 or 6 7 or 8 9 or 10
Rat
e pe
r 10
0 00
0 po
pula
tion
2006 NZ Deprivation Index
2007 2008 2009 2010 2011

The Epidemiology of Meningococcal Disease in New Zealand 2011 Results
20 Institute of Environmental Science and Research Limited
The groups and dominant subtypes among strain-typed meningococcal disease cases between 2007 and 2011 are shown in Figure 7 and Appendix: Table 10. Trends in the numbers of cases due to the two most common strains, group B:P1.7-2,4 and group C:P1.5-1,10-8, are described in the following sections. The numbers of cases due to other group B strains have varied from year to year, but were generally lower in 2010 and 2011 compared with numbers of cases from 2007 to 2009. Cases due to other group C strains, and to strain groups W135 and Y have been consistently uncommon.
Figure 7. Groups and dominant subtypes among strain-typed meningococcal disease cases, 2007–2011
Dominant circulating strain – Group B:P1.7-2,4
Between 2007 and 2010, the number of cases due to the group B:P1.7-2,4 strain fell from 46 to 23. In 2011, the group B:P1.7-2,4 rate increased to 0.8 per 100 000 population (37 cases) following a particularly low rate in 2010 (0.5 per 100 000 population, 23 cases) (Figure 8). The highest number of group B:P1.7-2,4 cases reported in 2011 was in Counties Manukau DHB (9 cases). Counties Manukau DHB also had the highest numbers of B:P1.7-2,4 cases reported in 2007 (10 cases) and 2010 (7 cases), while the highest numbers of cases reported in 2008 and 2009 were in Hawke’s Bay DHB (6 cases) and Capital and Coast DHB (6 cases), respectively (Table 3). Total numbers of cases reported between 2007 and 2011 were highest in Counties Manukau (33), Waikato (17), Northland (15) and Capital and Coast (15) DHBs (Table 3).
0
5
10
15
20
25
30
35
40
45
50
2007 2008 2009 2010 2011
Nu
mb
er o
f ca
ses
Year
Group B:P1.7-2,4 Other group Bs
Group C:P1.5-1,10-8 Other group Cs
W135 Y

The Epidemiology of Meningococcal Disease in New Zealand 2011 Results
Institute of Environmental Science and Research Limited 21
Figure 8. Rate per 100 000 population of group B:P1.7-2,4 strain disease by year, 2007–2011
Table 3. Number of group B:P1.7-2,4 strain cases by District Health Board, 2007–2011
District Health Board Year Total
2007 2008 2009 2010 2011
Northland 4 2 3 3 3 15
Waitemata 1 1 3 3 2 10
Auckland 4 2 4 1 2 13
Counties Manukau 10 4 3 7 9 33
Waikato 5 4 3 1 4 17
Lakes 0 0 4 1 3 8
Bay of Plenty 1 0 3 1 3 8
Tairawhiti 1 0 2 0 0 3
Taranaki 2 2 2 0 0 6
Hawke's Bay 1 6 3 1 1 12
Whanganui 0 3 0 0 2 5
MidCentral 1 1 1 0 1 4
Hutt Valley 3 1 0 3 2 9
Capital and Coast 3 3 6 1 2 15
Wairarapa 1 1 0 0 0 2
Nelson Marlborough 0 0 0 0 0 0
West Coast 1 1 0 0 0 2
Canterbury 3 2 1 1 2 9
South Canterbury 0 0 0 0 0 0
Southern 5 4 2 0 1 12
Total 46 37 40 23 37 183
0.0
0.2
0.4
0.6
0.8
1.0
1.2
2007 2008 2009 2010 2011
Rat
e p
er 1
00 0
00 p
op
ula
tio
n
Year

The Epidemiology of Meningococcal Disease in New Zealand 2011 Results
22 Institute of Environmental Science and Research Limited
Sex and age were recorded for all group B:P1.7-2,4 cases. Since 2007, the rate of meningococcal disease due to this strain has consistently been higher in males than in females (Table 4). The difference between male and female rates of meningococcal disease due to this strain in 2011 (0.9 and 0.8 per 100 000 population, respectively) was not statistically significant.
The rate of group B:P1.7-2,4 strain disease has also consistently been highest in those individuals aged less than 5 years, particularly among those aged less than 1 year (Table 4). For those individuals aged less than 1 year, the 2011 rate of 11.2 per 100 000 population (7 cases) was lower than the 2010 rate (23.5 per 100 000 population, 15 cases).
Table 4. Number of group B:P1.7-2,4 strain by year, 2007–2011
2007 2008 2009 2010 2011
No. Rate1 No. Rate1 No. Rate1 No. Rate1 No. Rate1
Age group (years)
<1 7 11.3 9 14.0 10 15.9 15 23.5 7 11.21–4 18 7.8 9 3.8 13 5.4 6 2.4 12 4.85–9 3 - 3 - 3 - 1 - 3 -10–14 2 - 3 - 2 - 0 - 1 -15–19 7 2.2 1 - 3 - 0 - 1 -20–29 4 - 3 - 2 - 0 - 1 -30–39 4 - 1 - 2 - - - 5 0.940+ 1 - 8 0.4 5 0.3 1 - 7 0.3
Sex
Male 27 1.3 20 1.0 21 1.0 13 0.6 20 0.9Female 19 0.9 17 0.8 19 0.9 10 0.4 17 0.8
Ethnic group
European or Other 15 0.5 13 0.4 13 0.4 2 - 15 0.5Māori 19 3.0 15 2.4 19 3.0 12 1.9 14 2.2Pacific Peoples 9 3.5 5 1.9 6 2.3 8 3.0 6 2.3Asian 2 - 1 - 1 - 1 - 1 -MELAA2 0 - 1 - 1 - 0 - 1 -Unknown 1 - 2 - 0 - 0 - 0 -
Total 46 1.1 37 0.9 40 0.9 23 0.5 37 0.81Rate per 100 000 population 2Middle Eastern/Latin American/African
From 2007 to 2011, rates of group B:P1.7-2,4 disease were consistently highest in the Pacific Peoples and Māori ethnic groups (Table 4). In 2011, the rates were similar for Pacific Peoples (2.3 per 100 000 population, 6 cases) and Māori (2.2 per 100 000 population, 14 cases) ethnic groups.
Hospitalisation status was recorded for all 37 cases of group B:P1.7-2,4 disease in 2011, of which 36 cases (97.3%) were hospitalised. Of these, 14 cases (38.9%) had been seen by a doctor prior to hospital admission, and three cases (21.4%) were given antibiotics.
A total of 13 fatalities (case-fatality rate of 7.1%) were reported as being due to group B:P1.7-2,4 disease from 2007 to 2011, including two fatalities reported in 2011 (Appendix: Table 15). Of the two fatalities, one case was seen by a doctor prior to hospital admission but not given antibiotics, while the other case was not seen by a doctor prior to hospital admission.
Dominant circulating strain – Group C:P1.5-1,10-8
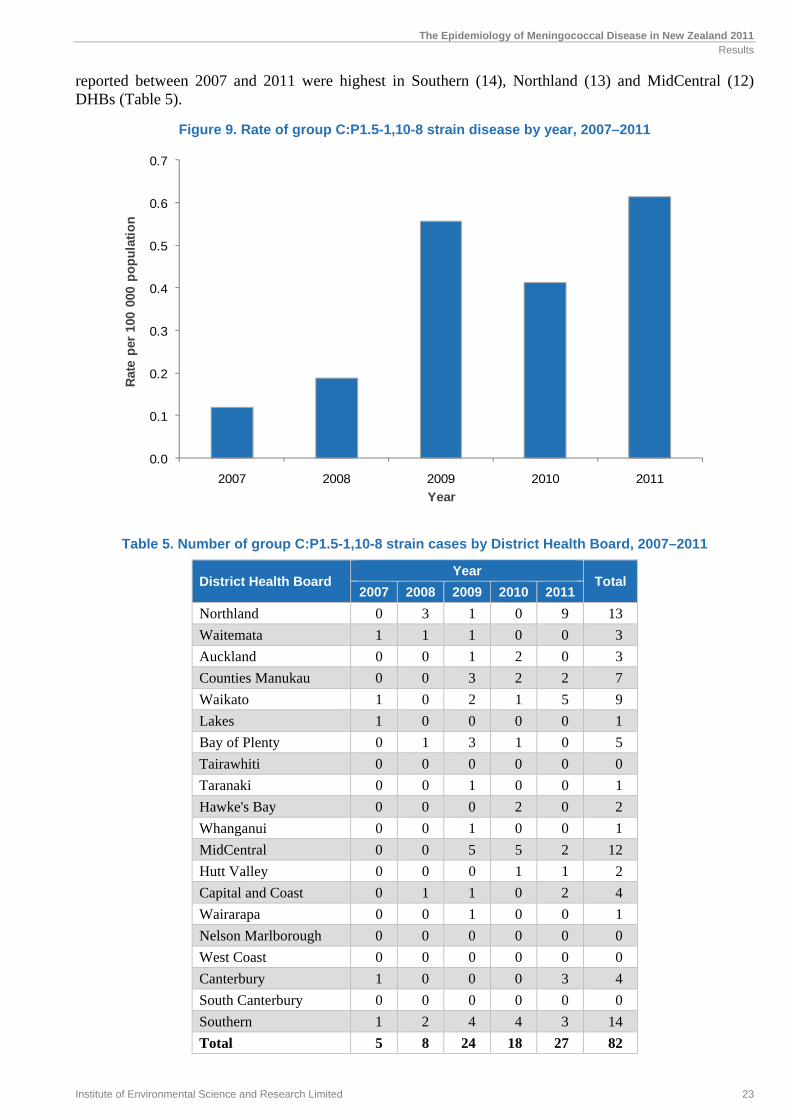
The number of cases due to the group C:P1.5-1,10-8 strain has increased from five cases in 2007 (0.1 per 100 000 population) to 27 cases (0.6 per 100 000 population) in 2011 (Figure 9). The highest numbers of cases reported in 2011 were in Northland (9 cases) and Waikato (5 cases) DHBs. Total numbers of cases
The Epidemiology of Meningococcal Disease in New Zealand 2011 Results
Institute of Environmental Science and Research Limited 23
reported between 2007 and 2011 were highest in Southern (14), Northland (13) and MidCentral (12) DHBs (Table 5).
Figure 9. Rate of group C:P1.5-1,10-8 strain disease by year, 2007–2011
Table 5. Number of group C:P1.5-1,10-8 strain cases by District Health Board, 2007–2011
District Health Board Year
Total 2007 2008 2009 2010 2011
Northland 0 3 1 0 9 13
Waitemata 1 1 1 0 0 3
Auckland 0 0 1 2 0 3
Counties Manukau 0 0 3 2 2 7
Waikato 1 0 2 1 5 9
Lakes 1 0 0 0 0 1
Bay of Plenty 0 1 3 1 0 5
Tairawhiti 0 0 0 0 0 0
Taranaki 0 0 1 0 0 1
Hawke's Bay 0 0 0 2 0 2
Whanganui 0 0 1 0 0 1
MidCentral 0 0 5 5 2 12
Hutt Valley 0 0 0 1 1 2
Capital and Coast 0 1 1 0 2 4
Wairarapa 0 0 1 0 0 1
Nelson Marlborough 0 0 0 0 0 0
West Coast 0 0 0 0 0 0
Canterbury 1 0 0 0 3 4
South Canterbury 0 0 0 0 0 0
Southern 1 2 4 4 3 14
Total 5 8 24 18 27 82
0.0
0.1
0.2
0.3
0.4
0.5
0.6
0.7
2007 2008 2009 2010 2011
Rat
e p
er 1
00 0
00 p
op
ula
tio
n
Year

The Epidemiology of Meningococcal Disease in New Zealand 2011 Results
24 Institute of Environmental Science and Research Limited
Rates of group C:P1.5-1,10-8 strain disease have consistently been highest among those aged 1–4 years and 15–19 years. In 2011, the highest rates were in the 1–4 years (2.4 per 100 000 population, 6 cases) age group, followed by the 15–19 years age group (1.9 per 100 000 population, 6 cases) (Table 6).
Table 6. Number of group C:P1.5-1,10-8 strain by year, 2007–2011
2007 2008 2009 2010 2011
No. Rate1 No. Rate1 No. Rate1 No. Rate1 No. Rate1
Age group (years)
<1 0 - 1 - 3 - 1 - 1 -
1–4 1 - 3 - 5 2.1 2 - 6 2.4
5–9 0 - 1 - 1 - 2 - 2 -
10–14 0 - 0 - 1 - 2 - 3 -
15–19 0 - 2 - 9 2.8 5 1.6 6 1.9
20–29 1 - 1 - 1 - 3 - 2 -
30–39 3 - 0 - 1 - 2 - 1 -
40+ 0 - 0 - 3 - 1 - 6 0.3
Sex
Male 3 - 6 0.3 9 0.4 8 0.4 11 0.5
Female 2 - 2 - 15 0.7 10 0.4 16 0.7
Ethnic group
European or Other 5 0.2 2 - 13 0.4 8 0.3 15 0.5
Māori 0 - 6 0.9 9 1.4 8 1.2 11 1.7
Pacific Peoples 0 - 0 - 1 - 2 - 1 -
Asian 0 - 0 - 0 - 0 - 0 -
MELAA2 0 - 0 - 1 - 1 - 0 -
Total 5 0.1 8 0.2 24 0.6 18 0.4 27 0.61Rate per 100 000 population 2Middle Eastern/Latin American/African
From 2007 to 2011, the rates of group C:P1.5-1,10-8 strain disease were consistently high in the Māori and European or Other ethnic groups (Table 6). In 2011, the rates of group C:P1.5-1,10-8 strain disease were highest in the Māori (1.7 per 100 000 population, 11 cases) and European or Other (0.5 per 100 000 population, 15 cases) ethnic groups.
Hospitalisation status was recorded for all 27 cases of group C:P1.5-1,10-8 strain disease reported in 2011, of which 24 cases (88.9%) were hospitalised. Of these, nine cases (37.5%) had been seen by a doctor prior to hospital admission and five cases (55.6%) were given antibiotics.
A total of 15 fatalities (case-fatality rate of 18.3%) were reported as being due to group C:P1.5-1,10-8 strain disease from 2007 to 2011, with nine reported in 2011 (Appendix: Table 15 ). Of the nine fatalities in 2011, three were seen by a doctor prior to hospital admission and one was given antibiotics.
The Epidemiology of Meningococcal Disease in New Zealand 2011 Results
Institute of Environmental Science and Research Limited 25
Vaccine-targeted strains
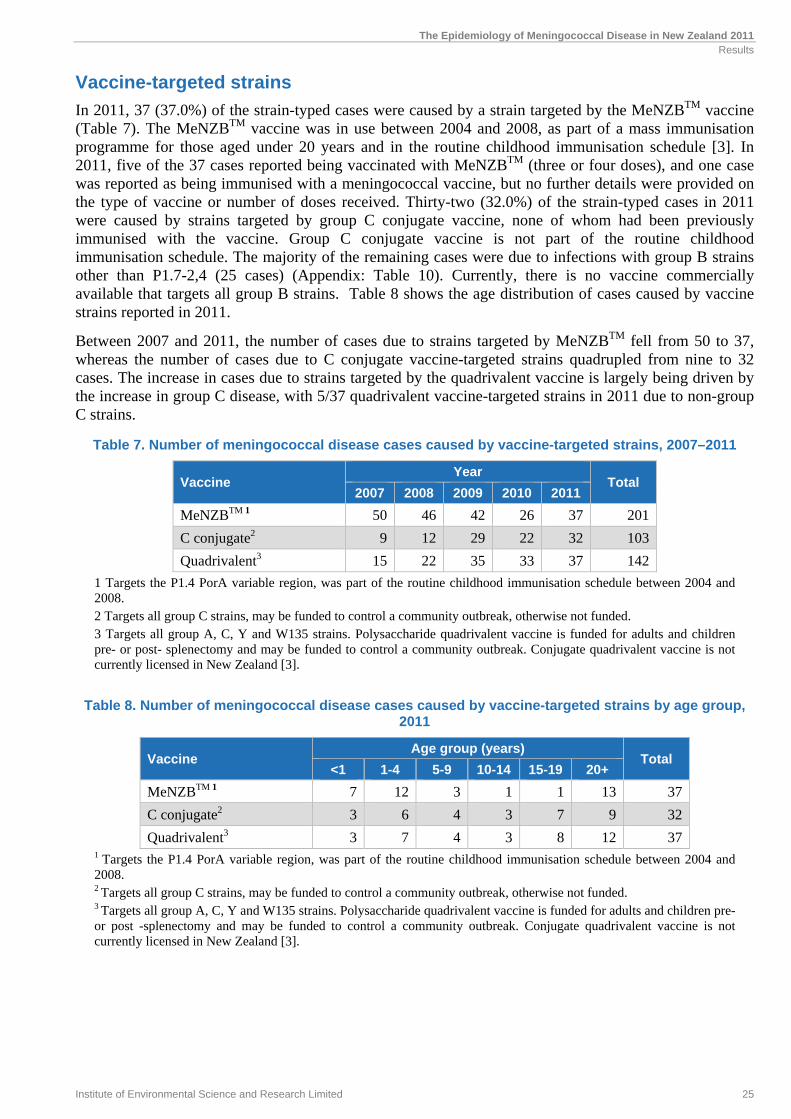
In 2011, 37 (37.0%) of the strain-typed cases were caused by a strain targeted by the MeNZBTM vaccine (Table 7). The MeNZBTM vaccine was in use between 2004 and 2008, as part of a mass immunisation programme for those aged under 20 years and in the routine childhood immunisation schedule [3]. In 2011, five of the 37 cases reported being vaccinated with MeNZBTM (three or four doses), and one case was reported as being immunised with a meningococcal vaccine, but no further details were provided on the type of vaccine or number of doses received. Thirty-two (32.0%) of the strain-typed cases in 2011 were caused by strains targeted by group C conjugate vaccine, none of whom had been previously immunised with the vaccine. Group C conjugate vaccine is not part of the routine childhood immunisation schedule. The majority of the remaining cases were due to infections with group B strains other than P1.7-2,4 (25 cases) (Appendix: Table 10). Currently, there is no vaccine commercially available that targets all group B strains. Table 8 shows the age distribution of cases caused by vaccine strains reported in 2011.
Between 2007 and 2011, the number of cases due to strains targeted by MeNZBTM fell from 50 to 37, whereas the number of cases due to C conjugate vaccine-targeted strains quadrupled from nine to 32 cases. The increase in cases due to strains targeted by the quadrivalent vaccine is largely being driven by the increase in group C disease, with 5/37 quadrivalent vaccine-targeted strains in 2011 due to non-group C strains.
Table 7. Number of meningococcal disease cases caused by vaccine-targeted strains, 2007–2011
Vaccine Year
Total 2007 2008 2009 2010 2011
MeNZBTM 1 50 46 42 26 37 201
C conjugate2 9 12 29 22 32 103
Quadrivalent3 15 22 35 33 37 142
1 Targets the P1.4 PorA variable region, was part of the routine childhood immunisation schedule between 2004 and 2008. 2 Targets all group C strains, may be funded to control a community outbreak, otherwise not funded. 3 Targets all group A, C, Y and W135 strains. Polysaccharide quadrivalent vaccine is funded for adults and children pre- or post- splenectomy and may be funded to control a community outbreak. Conjugate quadrivalent vaccine is not currently licensed in New Zealand [3].
Table 8. Number of meningococcal disease cases caused by vaccine-targeted strains by age group, 2011
Vaccine Age group (years)
Total <1 1-4 5-9 10-14 15-19 20+
MeNZBTM 1 7 12 3 1 1 13 37
C conjugate2 3 6 4 3 7 9 32
Quadrivalent3 3 7 4 3 8 12 371 Targets the P1.4 PorA variable region, was part of the routine childhood immunisation schedule between 2004 and 2008. 2 Targets all group C strains, may be funded to control a community outbreak, otherwise not funded. 3 Targets all group A, C, Y and W135 strains. Polysaccharide quadrivalent vaccine is funded for adults and children pre- or post -splenectomy and may be funded to control a community outbreak. Conjugate quadrivalent vaccine is not currently licensed in New Zealand [3].

The Epidemiology of Meningococcal Disease in New Zealand 2011 Results
26 Institute of Environmental Science and Research Limited
Antimicrobial susceptibility
The antimicrobial susceptibility of all 77 viable meningococcal isolates received by ESR from cases of invasive disease in 2011 was tested (Table 9).
All isolates were susceptible to ceftriaxone and ciprofloxacin. Reduced penicillin susceptibility (MIC 0.12 mg/L) was observed in 19.5% (15/77) of isolates: 100% (2/2) of group W135 isolates, 17.9% (5/28) of group C isolates, 17.8% (8/45) of other group B isolates and 3.5% of the isolates belonging to the B:P1.7-2,4 strain. One isolate, a group C meningococcus C:2a:P1.5-1,10-1, was rifampicin resistant (MIC ≥32 mg/L).
Since reduced penicillin susceptibility in meningococci emerged in the mid-1990s, there has been a general trend of an increasing proportion of isolates with reduced susceptibility, with a prevalence of ≥20% in recent years (Figure 10). However in 2011, the proportion of invasive meningococcal isolates with reduced penicillin susceptibility decreased from 29.0% in 2010 to 19.5%. Infections due to isolates with reduced susceptibility are still treatable with penicillin.
Rifampicin resistance is rare among meningococci from invasive disease in New Zealand. Prior to 2011, only six rifampicin-resistant isolates had been identified. Ciprofloxacin resistance is also rare, with just one ciprofloxacin-resistant isolate having been identified.
Table 9. MIC range and MIC90 of isolates, 2011
Antimicrobial MIC1 range (mg/L) MIC902 (mg/L)
Penicillin 0.03–0.5 0.12
Ceftriaxone 0.002–0.004 0.002
Rifampicin 0.002–32 0.12
Ciprofloxacin 0.002–0.008 0.008
1 Minimum inhibitory concentration 2 Concentration that inhibits at least 90% of the isolates
Figure 10. Reduced penicillin susceptibility among N. meningitidis from invasive disease, 2007–2011
0.0
5.0
10.0
15.0
20.0
25.0
30.0
35.0
2007 2008 2009 2010 2011
Per
cen
t
Year
MIC 0.5 mg/L MIC 0.25 mg/L MIC 0.12 mg/L

The Epidemiology of Meningococcal Disease in New Zealand 2011 Results
Institute of Environmental Science and Research Limited 27
Clinical outcomes
Thirteen fatalities due to meningococcal disease occurred in 2011, with a case-fatality rate of 10.9% (Figure 11).
All fatalities in 2011 were confirmed cases. Three fatalities were due to the group B strains, including two with group B:P1.7-2,4 strain and 10 fatalities were due to group C strains, including nine with group C:P1.5-1,10-8 strain. Between 2007 and 2011, the case-fatality rate for group for group B:P1.7-2,4 strain was 7.1% (13 fatalities) compared with 18.3% (15 fatalities) for group C:P1.5-1,10-8 strain (Appendix: Table 15 ).
The case-fatality rate over the last five years was highest for those in the less than 1 year age group (9.6%, 11 fatalities) and lowest for the 5–9 years age group (2.0%, 1 fatality). Between 2007 and 2011, the case-fatality rate was highest for the Asian ethnic group (18.8%, 3 fatalities), followed by the European or Other (7.6%, 19 fatalities), Māori (6.8%, 14 fatalities) and Pacific Peoples (3.4%, 3 fatalities) ethnic groups (Appendix: Table 15 ).
Figure 11. Meningococcal disease case-fatality rates, 2007–2011
Case management
Information on hospitalisation was recorded for all 119 cases of meningococcal disease reported in 2011, of which 115 cases (96.7%) were hospitalised. This is similar to the 2010 rate of 99.0%.
Pre-hospital management information was recorded for 114 cases (95.8%). Of these, 53 cases (46.5%) had been seen by a doctor and 16 cases (14.0%) were given intravenous or intramuscular antibiotics prior to hospital admission. In 2011, there was one fatality among cases seen by a doctor and given antibiotics prior to hospital admission.
0.0
2.0
4.0
6.0
8.0
10.0
12.0
2007 2008 2009 2010 2011
Cas
e-fa
tali
ty r
ate
(%)
Year
Average case-fatality rate


DISCUSSION


The Epidemiology of Meningococcal Disease in New Zealand 2011 Discussion
Institute of Environmental Science and Research Limited 31
DISCUSSION
The rate of meningococcal disease in New Zealand in 2011 was similar to the rates seen over the last four years and remains significantly higher than the pre-epidemic rate. As in previous years, the majority of cases occurred in the northern regions of the North Island, and those aged less than 1 year remain the most vulnerable age group. Analysis of the age-standardised rates of the disease by ethnicity continues to identify Māori and Pacific Peoples as having higher rates compared with the European or Other ethnic group. This is most marked in the less than 1 year age group. As seen previously, a secondary peak of disease occurred in the 15–19 year old age group which was most apparent in the European or Other ethnic group. Meningococcal disease rates continued to be higher in the most socioeconomically deprived group, decile 9–10, compared with less socioeconomically deprived groups.
Group B strains continued to be the most prevalent, causing over 60% of the cases. One particular group B strain, B:P1.7-2,4, was responsible for 37% of all meningococcal disease in 2011. This strain was responsible for the meningococcal disease epidemic from 1991 to 2007 in New Zealand and was the target for the MeNZBTM vaccine [3]. Monitoring of this strain is important given the withdrawal of the vaccine in 2008. The number of cases of meningococcal disease caused by group C strains has increased since 2007. This has been largely due to the increase in one particular strain, C:P1.5-1,10-8. The group C:P1.5-1,10-8 strain has been particularly prevalent in Northland in 2011 where one-third of all the cases caused by this strain occurred. Vaccination with the C conjugate vaccine covers for this particular strain and is used to control community outbreaks of meningococcal disease.
Almost half of the hospitalised cases were seen in primary care prior to hospital admission, but only one third of these were given antibiotics in primary care. Although, it is difficult to determine the impact of pre-hospital antibiotics on disease severity and death due to small numbers and confounding factors, it would be prudent to increase this practice. The case-fatality rate in 2011 was 10.9%, higher than that seen in the previous four years. Nine of the 13 fatalities were due to the group C:P1.5-1,10-8 strain. Further characterisation of the group C:P1.5-1,10-8 strains using multilocus sequence typing identified them as belonging to the ST-11 clonal complex, a complex previously associated with high fatality rates. However, C:P1.5-1,10-8 strains from previous years that have been sequenced have also belonged to this ST-11 complex.


REFERENCES

The Epidemiology of Meningococcal Disease in New Zealand 2011 References
Institute of Environmental Science and Research Limited 35
REFERENCES
1. Ministry of Health, Communicable Disease Control Manual. 2011, Ministry of Health: Wellington.
2. Martin D, et al, New Zealand epidemic of meningococcal disease identified by a strain with phenotype B:4:P1.4. J Infect Dis, 1998. 177: p. 497-500.
3. Ministry of Health, Immunisation Handbook 2011, Wellington, New Zealand: Ministry of Health.
4. O’Hallahan J, et al, From secondary prevention to primary prevention: a unique strategy that gives hope to a country ravaged by meningococcal disease. Vaccine, 2005. 23: p. 2197-2201.
5. Lennon D, et al, An outbreak of meningococcal disease in Auckland, New Zealand. Pediatric Infectious Disease Journal, 1989. 8(1): p. 11-15.
6. Mills C, Meningococcal C disease in Northland, 2011. NZPHSR, 2011. 9(4): p. 7-8.
7. Ministry of Health, Communicable Disease Control Manual. 1998, Ministry of Health: Wellington.
8. Clinical And Laboratory Standards Institute. Performance Standards For Antimicrobial Susceptibility Testing; Twentieth Informational Supplement. CLSI, 2011. M100-S21.
9. Salmond C, Crampton P, and Atkinson J, NZDep2006 Index of Deprivation. 2007, Department of Public Health, University of Otago: Wellington.
10. Crampton P and Davis P, Measuring deprivation and socioeconomic status: Why and how? NZPHR, 1998. 5: p. 81-84.


APPENDIX


The Epidemiology of Meningococcal Disease in New Zealand 2011 Appendix
Institute of Environmental Science and Research Limited 39
APPENDIX
Table 10. Strain group distribution by year, 2007–2011
Strain group Year
Total 2007 2008 2009 2010 2011
Group B
B:P1.7-2,4 46 37 40 23 37 183
Other group Bs 29 39 38 22 25 153
Group C
C:P1.5-1,10-8 5 8 24 18 27 82
Other group Cs 4 4 5 4 5 22
Other
Group W135 4 5 3 6 2 20
Group Y 2 5 3 5 3 18
Non-groupable 0 5 1 4 1 11
Other laboratory confirmed1 3 8 4 3 8 26
Probable 11 11 15 12 11 60
Total 104 122 133 97 119 575 1Includes DNA laboratory-confirmed by PCR where type was not determined, and laboratory-confirmed isolates not received by the Meningococcal Reference Laboratory
Table 11. Age distribution of meningococcal disease cases, 2007–2011
Age group (years)
2007 2008 2009 2010 2011
No. Rate1 No. Rate1 No. Rate1 No. Rate1 No. Rate1
<5 47 16.1 51 17.0 63 20.6 50 16.0 56 17.8
<1 18 29.1 18 28.1 28 44.4 27 42.4 24 38.5
1–4 29 12.6 33 14.0 35 14.4 23 9.3 32 12.7
5 57 1.4 71 1.8 70 1.7 47 1.2 63 1.5
5–9 10 3.4 13 4.5 10 3.5 7 2.4 10 3.5
10–14 7 2.3 9 3.0 4 - 5 1.7 5 1.7
15–19 12 3.8 13 4.0 21 6.5 12 3.7 15 4.7
20–29 9 1.6 7 1.2 8 1.4 8 1.3 5 0.8
30–39 6 1.0 4 - 4 - 3 - 7 1.2
40+ 13 0.7 25 1.3 23 1.2 12 0.6 21 1.0
Total 104 2.5 122 2.9 133 3.1 97 2.2 119 2.71Rate per 100 000 population

The Epidemiology of Meningococcal Disease in New Zealand 2011 Appendix
40 Institute of Environmental Science and Research Limited
Table 12. Numbers and age-standardised incidence rates by ethnicity for cases of meningococcal disease in 2007–2011
Ethnic group 2007 2008 2009 2010 2011
No. Rate1 No. Rate1 No. Rate1 No. Rate1 No. Rate1
European or Other 48 1.9 53 2.0 59 2.2 36 1.4 55 2.0
Māori 34 3.4 40 4.4 49 4.6 42 4.3 41 4.1
Pacific Peoples 15 4.2 21 6.6 17 5.2 17 4.7 19 5.7
Asian 6 1.8 4 - 4 - 2 - 2 -
MELAA2 0 - 2 - 2 - 0 - 1 -
Unknown 1 - 2 - 2 - 0 - 1 -
Total 104 2.5 122 2.9 133 3.1 97 2.2 119 2.71Rate per 100 000 population 2 Middle Eastern/Latin American/African
Table 13. Numbers and incidence rates for cases of meningococcal disease by age group and ethnic group, 2011
Age group (years)
European or Other
Māori Pacific
Peoples Asian MELAA1 Unknown Total
No. Rate2 No. Rate2 No. Rate2 No. Rate2 No. Rate2 No. No. Rate2
<1 3 - 13 77.3 8 126.7 0 - 0 - 0 24 38.5
1–4 12 8.6 14 22.1 5 20.2 0 - 1 - 0 32 12.7
5–9 2 - 7 10.0 0 - 1 - 0 - 0 10 3.5
10–14 2 - 2 - 1 - 0 - 0 - 0 5 1.7
15–19 12 6.5 2 - 1 - 0 - 0 - 0 15 4.7
20–29 3 - 1 - 0 - 0 - 0 - 1 5 0.8
30–39 5 1.3 0 - 1 - 1 - 0 - 0 7 1.2
40+ 16 1.0 2 - 3 - 0 - 0 - 0 21 1.0
Total 55 1.8 41 6.3 19 7.1 2 - 1 - 1 119 2.7
1Middle Eastern/Latin American/African 2Rate per 100 000 population

The Epidemiology of Meningococcal Disease in New Zealand 2011 Appendix
Institute of Environmental Science and Research Limited 41
Table 14. Distribution of strain types among meningococcal disease cases and total cases by District Health Board, 2011
District Health Board
Group B Group C Other
P1.7-2,4 All other
Bs Total % P1.5-1,10-8
All other Cs
Total % W135 Y NG* Total %
Northland 3 1 4 30.8 9 0 9 69.2 0 0 0 0 0.0
Waitemata 2 4 6 75.0 0 0 0 0.0 0 2 0 2 25.0
Auckland 2 4 6 100.0 0 0 0 0.0 0 0 0 0 0.0
Counties Manukau 9 4 13 86.7 2 0 2 13.3 0 0 0 0 0.0
Waikato 4 1 5 41.7 5 2 7 58.3 0 0 0 0 0.0
Lakes 3 0 3 75.0 0 0 0 0.0 0 0 1 1 25.0
Bay of Plenty 3 1 4 100.0 0 0 0 0.0 0 0 0 0 0.0
Tairawhiti 0 1 1 100.0 0 0 0 0.0 0 0 0 0 0.0
Taranaki 0 1 1 100.0 0 0 0 0.0 0 0 0 0 0.0
Hawke's Bay 1 1 2 66.7 0 1 1 33.3 0 0 0 0 0.0
Whanganui 2 0 2 66.7 0 0 0 0.0 1 0 0 1 33.3
MidCentral 1 0 1 33.3 2 0 2 66.7 0 0 0 0 0.0
Hutt Valley 2 1 3 75.0 1 0 1 25.0 0 0 0 0 0.0
Capital and Coast 2 1 3 50.0 2 1 3 50.0 0 0 0 0 0.0
Wairarapa 0 2 2 100.0 0 0 0 0.0 0 0 0 0 0.0
Nelson Marlborough 0 1 1 100.0 0 0 0 0.0 0 0 0 0 0.0
West Coast 0 0 0 - 0 0 0 - 0 0 0 0 -
Canterbury 2 1 3 37.5 3 1 4 50.0 0 1 0 1 12.5
South Canterbury 0 0 0 - 0 0 0 - 0 0 0 0 -
Southern 1 1 2 33.3 3 0 3 50.0 1 0 0 1 16.7
Total 37 25 62 62.0 27 5 32 32.0 2 3 1 6 6.0
*Non-groupable

The Epidemiology of Meningococcal Disease in New Zealand 2011 Appendix
42 Institute of Environmental Science and Research Limited
Table 15. Case-fatality rates for meningococcal disease cases by age, sex, ethnicity and strain group, 2007–2011
Features of case and infecting organism
Annual fatalities Total fatalities
2007–2011
Total cases 2007–2011
CFR1 2007–2011 (%)
2007 2008 2009 2010 2011
Age group (years)
<1 2 3 2 1 3 11 115 9.6
1–4 1 4 0 3 3 11 152 7.2
5–9 1 0 0 0 0 1 50 2.0
10–14 0 0 1 0 0 1 30 3.3
15–19 0 1 1 1 3 6 73 8.2
20–29 1 0 1 0 0 2 37 5.4
30–39 0 0 0 0 1 1 24 4.2
40+ 2 0 0 1 3 6 94 6.4
Sex
Male 4 6 4 0 7 21 299 7.0
Female 3 2 1 6 6 18 276 6.5
Ethnic group
European or Other 4 3 3 2 7 19 251 7.6
Māori 1 4 2 2 5 14 206 6.8
Pacific Peoples 1 0 0 1 1 3 89 3.4
Asian 1 1 0 1 0 3 16 18.8
MELAA2 0 0 0 0 0 0 7 0.0
Unknown 0 0 0 0 0 0 6 0.0
Strain group
B:P1.7-2,4 3 4 2 2 2 13 183 7.1
Other group Bs 0 2 0 0 1 3 153 2.0
C:P1.5-1,10-8 2 1 2 1 9 15 82 18.3
Other group Cs 0 0 1 0 1 2 22 9.1
Group W135 1 0 0 0 0 1 20 5.0
Group Y 0 0 0 0 0 0 18 0.0
Non-groupable 0 0 0 0 0 0 11 -
Other laboratory confirmed3 0 0 0 0 0 0 26 -
Probable 1 1 0 3 0 5 60 8.3
Total 7 8 5 6 13 39 575 6.8 1Case-fatality rate 2Middle Eastern/Latin American/African
3Includes DNA laboratory-confirmed by PCR where type was not determined, and laboratory-confirmed isolates not received by the Meningococcal Reference Laboratory