the environmental impact of pork production from a life cycle perspective
TRANSCRIPT

U N I V E R S I T Y O F A A R H U S Faculty of Agricultural Sciences
A A L B O R G U N I V E R S I T Y Faculty of Engineering, Science and Medicine
The environmental impact of pork production from a life cycle perspective
Ph.D. Thesis by
Randi Lundshøj Dalgaard


Ph.D. Thesis:
The environmental impact of pork production from a life cycle perspective
by
Randi Lundshøj Dalgaard
University of Aarhus Faculty of Agricultural Sciences
Department of Agroecology and Environment P.O. Box 50, DK-8830 Tjele
&
Aalborg University Department of Development and Planning
Fibigerstræde 13 DK-9220 Aalborg East


Preface and acknowledgements
This thesis intends to meet the requirements for obtaining a Ph.D. degree from Aalborg Uni-versity. The Ph.D. project was initiated in 2004 and carried out at Department of Agroecology and Environment at University of Aarhus and at Department of Planning and Development at Aalborg University. The PhD. project was part of the project ‘Evaluation of innovative agri-cultural production systems through a life cycle assessment methodology’ which was funded by The Directorate for Food, Fisheries and Agri Business. I would like to sincerely thank my two supervisors, Senior Scientist Niels Halberg (University of Aarhus) and Professor Per Christensen (Aalborg University) for their much appreciated guidance and advice. I am grateful to all the people who have supported me in different ways with this thesis. In particular I wish to thank: Lene Kirkegaard, Margit Schacht, Jytte Christensen and Birgit Sørensen for their tireless as-sistance with figures, language corrections and preparation of the manuscripts The two private farmers and their co-workers for their helpfulness and cooperation during the period of collecting data and slurry samples Orla Nielsen and Kristine Riis Hansen for their hard work in collecting data and slurry sam-ples from the private farms My colleagues from Department of Development and Planning at Aalborg University for making my one year stay at Aalborg University to an enjoyable and instructive experience My colleagues from Farming Systems Group and Department Administration at University of Aarhus for their support, especially during the last couple of months Laura, Anna and Bjarne for always being tremendous supporters and sources of happiness
Foulum, September 2007
Randi Lundshøj Dalgaard


CONTENTS Papers included .......................................................................................................................... 1 Summary .................................................................................................................................... 3 Summary (Danish) ..................................................................................................................... 5 1 Background and aim............................................................................................................... 7
1.1 Structural changes in the Danish pig sector .................................................................... 8 1.2 Pig production and the environment ............................................................................... 9 1.3 Environmental regulation.............................................................................................. 10 1.4 Environmental assessment tools.................................................................................... 13 1.5 Research questions and outline of the thesis ................................................................. 14
2 Environmental hotspots in the product chain of Danish pork.............................................. 15 2.1 A short introduction to LCA ......................................................................................... 15 2.2 Goal and scope definition.............................................................................................. 17 2.3 Life cycle inventory ...................................................................................................... 17 2.4 Life cycle impact assessment ........................................................................................ 22 2.5 Interpretation ................................................................................................................. 22
3 Options for improvements in the product chain of pork ...................................................... 26 3.1 Improving the digestibility of the feed.......................................................................... 26 3.2 Improving the slurry handling....................................................................................... 29
4 Considerations regarding LCA of agricultural products ...................................................... 30 4.1 LCA in comparison with other environmental indicators............................................. 30 4.2 Consequential LCA....................................................................................................... 32 4.3 Quantification of emissions........................................................................................... 36
5 Suggestions for improved environmental regulation of the pig sector ................................ 38 6 Conclusion............................................................................................................................ 41 7 References ............................................................................................................................ 42 Paper 1.
Modelling representative and coherent Danish farm types based on farm accountancy data for use in environmental assessments………..………..………
49
Paper 2. LCA of Soybean Meal………………………………………..………….………. 67 Paper 3. Environmental assessment of Danish pork……………………………....………. 85 Paper 4. Environmental assessment of digestibility improvement factors applied in ani-
mal production – a case study of Ronozyme WX CT xylanase applied in Danish grower pig production……………………………………………………………
111 Paper 5. Slurry technologies and their potential for environmental improvements………. 121


Papers included
The following five papers are included in the thesis: Paper 1.
Randi Dalgaard, Niels Halberg, Ib Sillebak Kristensen & Inger Larsen. 2006. Mod-elling representative and coherent Danish farm types based on farm accountancy data for use in environmental assessments. Agriculture, Ecosystems & Environment. 117(4), 223-237.
Paper 2. Randi Dalgaard, Jannick Schmidt, Niels Halberg, Per Christensen, Mikkel Thrane &
Walter A. Pengue. 2007. LCA of Soybean Meal. International Journal of Life Cycle Assessment. (In press).
Paper 3.
Randi Dalgaard, Jørgen Dejgaard Jensen, Bo Weidema, Niels Halberg and Claus Å.G. Sørensen. Environmental assessment of Danish pork. Submitted to Interna-tional Journal of Life Cycle Assessment.
Paper 4. Per H. Nielsen, Randi Dalgaard, Arne Korsbak & Dan Petterson. 2007. Environme-
ntal assessment of digestibility improvement factors applied in animal production – a case study of Ronozyme WX CT xylanase applied in Danish grower pig produc-tion. International Journal of Life Cycle Assessment. (In press).
Paper 5. Randi Dalgaard. Slurry technologies and their potential for environmental improve-
ments. (Manuscript in preparation).
1

2

Summary
The global pork production is forecast to increase significantly over the coming decades and this will obviously affect the environment. The overall aim of this thesis was to improve the under-standing of the environmental impact of Danish pork production in a global context and to suggest improvements at the most important environmental hotspots. Life cycle assessment (LCA) was used as an environmental assessment tool, and the consequen-tial modelling approach was applied. The pig farm was identified as being the most important en-vironmental hotspot in the product chain of pork in relation to both global warming, eutrophica-tion and acidification. The production of artificial fertiliser and pig feed outside the pig farm was also an important contributor to global warming, whereas the emissions from the slaughterhouse and transport from farmer to retailers were low. The largest contribution to global warming came from nitrous oxide, primarily emitted from fertiliser and from denitrification of nitrate. The largest contributions to eutrophication and acidification came from nitrate and ammonia respectively. All these substances contain nitrogen. Thus a more efficient use of nitrogen at the pig farms and in pig feed production will improve the environmental profile of pork. It was concluded that the global warming potential per kg pork could be reduced by approxi-mately 5% if the digestibility-improving enzyme xylanase was added to the pig feed, whereas the reduction in eutrophication potential per kg pork was limited. The reduction in greenhouse gases was primarily due to the saved pig feed. A farm model was developed in order to explore to what extent the environmental impact could be reduced if the slurry was separated into a liquid and fibrous fraction or if the slurry was an-aerobically digested and the biogas was used for heat and power production. It was concluded that if a pig farm was situated in a region with high livestock density and was obliged by legislation to export slurry to another farm, the amount of P applied to the fields at the pig farm and the amount of slurry transported could be reduced by 85 and 37% respectively, if the slurry was separated and the fibrous fraction exported from the pig farm. However these environmental improvements re-quired that the slurry separation plants were separating efficiently, and this was not the case at the two private farms where data were collected. Although slurry separation resulted in less transport and use of artificial P at the slurry-receiving farm, the reduction in greenhouse gas emissions was very limited compared to the greenhouse gas emissions from the remaining parts of the product chain of pork. In contrast to this, it was esti-mated that the global warming potential per kg pork could be reduced substantially if the slurry was anaerobically digested. On the other hand, anaerobic digestion of slurry did not have the same potential as slurry separation had for reducing the P application to fields of the pig farm. Finally, it was concluded that there is a need to develop the methodologies for quantification of nitrous oxide, phosphate and land-use change related CO2 emissions in order to further improve the quality of LCAs on agricultural products.
3

4

Summary (Danish)
Verdens svinekødsproduktion vil stige markant i løbet af de kommende årtier og dette vil påvirke miljøet. Formålet med denne afhandling var at øge indsigten i den danske svineproduktions mil-jøpåvirkning i en global sammenhæng, samt at foreslå forbedringer i de dele af produktionen, som er mest miljøbelastende. Livscyklusvurdering (LCA) blev anvendt som miljøvurderingsværktøj. Svinebedriften viste sig at være den mest miljøbelastende del af svinekødets produktkæde, set i forhold til både global op-varmning, eutrofiering og forsuring. Kunstgødnings- og foderproduktionen bidrog også betydeligt til den globale opvarmning, hvorimod bidrag fra slagteri og transport af svinekødet var lavt. Det største bidrag til global opvarmning kom fra lattergas, som primært blev udledt fra gødning og ved denitrifikation af nitrat. Det største bidrag til eutrofiering og forsuring kom fra henholdsvis ni-trat og ammoniak. Alle disse forbindelser indeholder kvælstof, og en oplagt måde at forbedre svi-nekødets miljøprofil på er derfor at effektivisere kvælstofforbruget på svinebedrifterne og i pro-duktionen af svinefoder. Det blev konkluderet, at det globale opvarmningspotentiale per kg svinekød kunne reduceres med ca. 5%, hvis det fordøjelighedsfremmende enzym xylanase blev tilsat svinefoderet, hvorimod xy-lanases effekt på eutrofieringspotentialet var begrænset. Reduktionen i drivhusgasudledning skyldtes primært det lavere foderforbrug. En gårdmodel blev udviklet for at analysere i hvor høj grad miljøpåvirkningen kunne reduceres, hvis svinegyllen blev separeret i en flydende fraktion og en fiberfraktion, eller forgasset i et bio-gasanlæg, hvor biogassen efterfølgende blev anvendt til varme og elektricitetsproduktion. Det blev konkluderet, at på en svinebedrift i et husdyrtæt område, som pga. lovgivning skal transpor-tere gylle til andre bedrifter, kunne mængden af P tilført markerne på svinebedriften og mængden af transporteret gylle reduceres med henholdsvis 85 og 37%, hvis gyllen blev separeret og fiber-fraktionen eksporteret ud af svinebedriften. Disse miljøforbedringer kræver dog at gylleseparati-onseffektiviteten er høj, og dette var ikke tilfældet på de to private bedrifter, hvorfra data var ind-samlet. Selvom gylleseparationen medførte mindre gylletransport og lavere forbrug af fosforkunstgødning på den modtagende bedrift, var reduktionen i drivhusgasudledningen meget begrænset set i for-hold til mængden af drivhusgasser udledt fra de øvrige led i svinekødets produktkæde. Biofor-gasning af gyllen med efterfølgende elektricitets- og varmproduktion viste sig derimod at kunne reducere drivhusgasudledningen per kg svin betragteligt. Til gengæld havde bioforgasning ikke det samme potentiale for at reducere P-tilførslen til markerne på svinebedriften, som gyllesepara-tion havde. Afslutningsvist blev det konkluderet, at der er brug for videreudvikling af metoder til at kvantifi-cere udledningerne af lattergas og fosfat, samt CO2 udledninger forårsaget af ændret arealanven-delse for yderligere at forbedre kvaliteten af fremtidige livscyklusvurderinger af landbrugsproduk-ter.
5

6

1 Background and aim
When a pork chop reaches the refrigerated counter in the supermarket it has accomplished a long journey. First sows are raised to produce piglets, feed for the pigs is grown, harvested and transported. Next the pigs are fed, slurry is excreted and then applied to the fields. The pigs are transported to the slaughterhouse, slaughtered, carved up and finally the pork chop is brought to the supermarket, from where it ends up in the shopping basket of a consumer and finally on a dinner plate. In each of these steps energy is used and pollutants are emitted. For example, artificial fertiliser is applied to the field where pig feed is grown and energy is used to produce this artificial fertiliser. In addition, different pollutants, e.g., nitrate and nitrous ox-ide, are emitted when the pig feed is grown or when slurry is excreted from the pig. Transport of fertiliser, pigs and feed results in emission of CO2 and other substances. All in all, many different kinds of pollutants in different amounts are emitted before the pork chop is ready for consumption. These pollutants contribute to climate change, eutrophication (nutrient enrich-ment), increasing acidity in the aquatic environment, changes in biodiversity or other unde-sired impacts on the environment. The world population is forecast to grow by 37% from 2006 to 2050 (United Nations, 2007), and this growth obviously requires an increase in food production. The production of meat is forecast to reach 465 million tonnes in 2050, which is more than double the amount of meat produced in 1999/01 (Steinfeld et al., 2006). The growth rate of the world’s population is lower compared to the growth rate of the livestock sector, and this reflects that the meat con-sumed per capita will increase. However, the production of monogastric animals (pigs, poul-try), which are mostly produced in industrial units is forecast to grow more rapidly than the production of ruminants (cattle, sheep, goats), which are often raised extensively (Steinfeld et al., 2006). At the global scale more pork is produced than poultry, and pork is also forecast to top the world’s meat production in 2015 (FAPRI, 2006). To meet the increased demand for pork, more pig feed will be produced, more deforestation will occur (Steinfeld et al., 2006), more slurry will be excreted and more pig meat will be transported. Consequently, a cascade of polluting activities will be stimulated by the increased demand for pork. Can the pig sector and the food industry meet this increased demand without increasing the environmental impact at an equal rate? The answer cannot be given with our current knowl-edge. But a step towards an answer is to identify the most polluting areas of the activities, the so-called environmental hotspots of the pork’s product chain and to estimate the potential of improvements within the product chain of pork.
7

1.1 Structural changes in the Danish pig sector Denmark has been the world’s largest exporter of pork since 1993 (FAO, 2007), and produces 25 million pigs yearly (Danish Meat Association, 2007). Denmark has one of the highest pig densities in the world (Steinfeld et al., 2006), and Danish farmers produced 598 pigs per km2 and 4.7 pigs per capita in 2006 (Statistics Denmark, 2007). The Danish pig sector has under-gone large structural changes over the last decades (Kristensen & Hermansen, 2002), as has been seen in many other countries (OECD, 2003). Figure 1 shows the development in the number and size of pig farms for the period 1996-2006. The number of pig farms has fallen by 40% (from 3980 to 2402), while the average farm size has more than doubled during the last ten years. In the same period the Danish pig herd has increased by 23% (Danish Meat As-sociation, 2007).
0
500
1000
1500
2000
2500
3000
3500
4000
4500
1995 2000 2005
Num
ber o
f pig
farm
s
0
20
40
60
80
100
120
Hec
tare
s pe
r pig
farm
Number of pig farms Area per pig farm
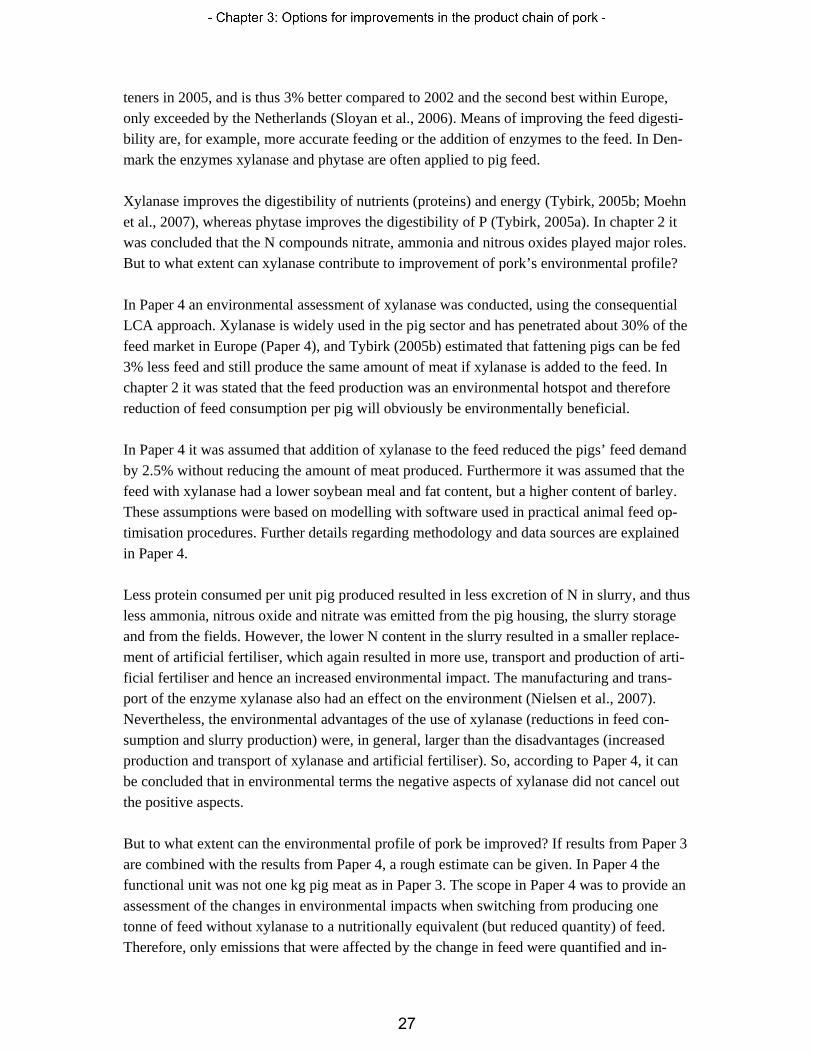
Figure 1. The development in number and size of pig farms in Denmark from 1996 to 2006. (Data is from Danish Statistics (2007)). The pig farms are also becoming more specialised. Twenty years ago the majority of the pig farms had both sows and fattening pigs, while now the majority has exclusively fattening pigs and no sows, and only a minority has a mix of sows and fattening pigs or only sows (Statistics Denmark, 2007). Moreover, the pig farms are increasingly concentrated in specific geo-graphical areas (Kristensen & Hermansen, 2002). Figure 2 shows how the pigs are concen-trated in specific regions of Denmark. In the eastern part of Denmark (the island Zealand) only very few areas have more than 0.8 pig livestock units per hectare, whereas in Jutland (large peninsula in the western part of Denmark), there are several large areas with more than 0.8 pig livestock units per hectare. Figure 3 shows the distribution of total livestock units per hectare (incl. poultry, cattle and mink) and again Jutland has a higher livestock density com-pared to the islands. This centralisation of the livestock in specific regions may put pressure on the local environment, because ammonia is evaporated from the slurry and the slurry is ap-plied as fertiliser to the fields.
8
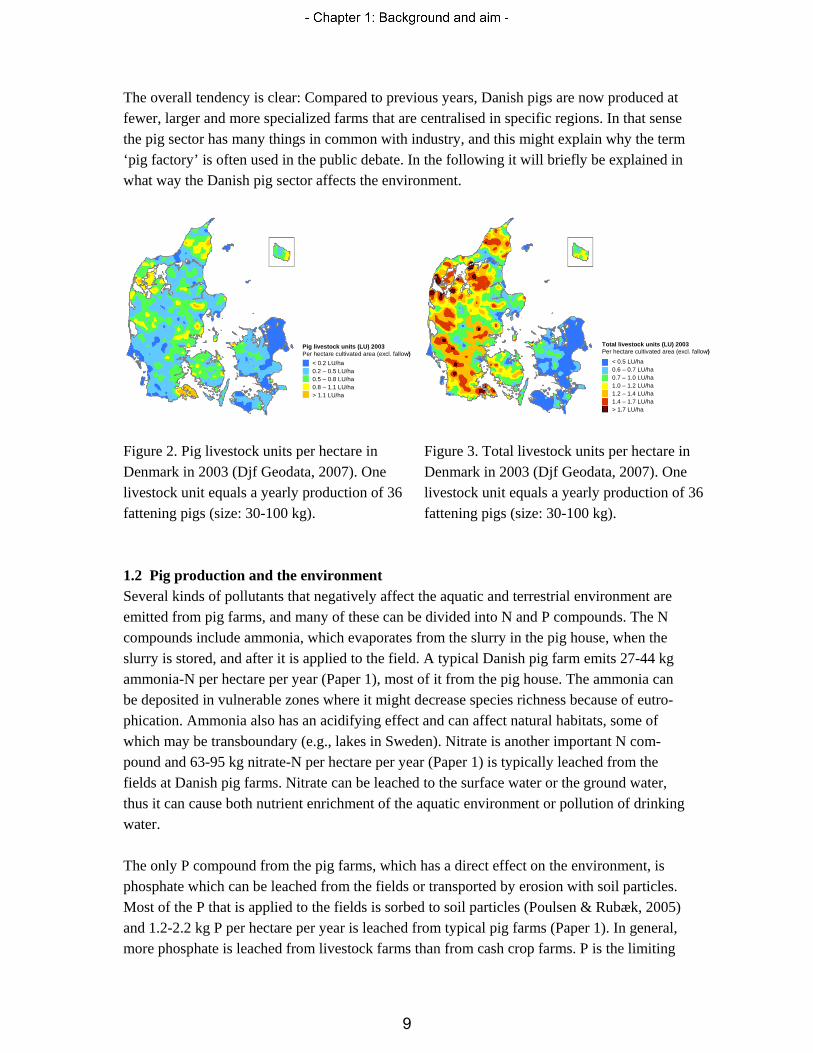
The overall tendency is clear: Compared to previous years, Danish pigs are now produced at fewer, larger and more specialized farms that are centralised in specific regions. In that sense the pig sector has many things in common with industry, and this might explain why the term ‘pig factory’ is often used in the public debate. In the following it will briefly be explained in what way the Danish pig sector affects the environment.
Figure 2. Pig livestock units per hectare in Denmark in 2003 (Djf Geodata, 2007). One livestock unit equals a yearly production of 36 fattening pigs (size: 30-100 kg).
Figure 3. Total livestock units per hectare in Denmark in 2003 (Djf Geodata, 2007). One livestock unit equals a yearly production of 36 fattening pigs (size: 30-100 kg).
1.2 Pig production and the environment Several kinds of pollutants that negatively affect the aquatic and terrestrial environment are emitted from pig farms, and many of these can be divided into N and P compounds. The N compounds include ammonia, which evaporates from the slurry in the pig house, when the slurry is stored, and after it is applied to the field. A typical Danish pig farm emits 27-44 kg ammonia-N per hectare per year (Paper 1), most of it from the pig house. The ammonia can be deposited in vulnerable zones where it might decrease species richness because of eutro-phication. Ammonia also has an acidifying effect and can affect natural habitats, some of which may be transboundary (e.g., lakes in Sweden). Nitrate is another important N com-pound and 63-95 kg nitrate-N per hectare per year (Paper 1) is typically leached from the fields at Danish pig farms. Nitrate can be leached to the surface water or the ground water, thus it can cause both nutrient enrichment of the aquatic environment or pollution of drinking water. The only P compound from the pig farms, which has a direct effect on the environment, is phosphate which can be leached from the fields or transported by erosion with soil particles. Most of the P that is applied to the fields is sorbed to soil particles (Poulsen & Rubæk, 2005) and 1.2-2.2 kg P per hectare per year is leached from typical pig farms (Paper 1). In general, more phosphate is leached from livestock farms than from cash crop farms. P is the limiting
Pig livestock units (LU) 2003Per hectare cultivated area (excl. fallow)
< 0.2 LU/ha0.2 – 0.5 LU/ha0.5 – 0.8 LU/ha0.8 – 1.1 LU/ha> 1.1 LU/ha
Pig livestock units (LU) 2003Per hectare cultivated area (excl. fallow)
< 0.2 LU/ha0.2 – 0.5 LU/ha0.5 – 0.8 LU/ha0.8 – 1.1 LU/ha> 1.1 LU/ha
< 0.5 LU/ha0.6 – 0.7 LU/ha0.7 – 1.0 LU/ha1.0 – 1.2 LU/ha1.2 – 1.4 LU/ha1.4 – 1.7 LU/ha> 1.7 LU/ha
Total livestock units (LU) 2003Per hectare cultivated area (excl. fallow)
< 0.5 LU/ha0.6 – 0.7 LU/ha0.7 – 1.0 LU/ha1.0 – 1.2 LU/ha1.2 – 1.4 LU/ha1.4 – 1.7 LU/ha> 1.7 LU/ha
Total livestock units (LU) 2003Per hectare cultivated area (excl. fallow)
9

factor for algal bloom in most of the Danish lakes (Kronvang et al. 2001), and is therefore unwanted in excess in the aquatic environment. Pesticides and their residues also affect the aquatic and terrestrial environment, but due to differences in their toxicity and degradability, some have a larger environmental impact than others. Similar to the aquatic and terrestrial environment described above, the atmospheric environ-ment is also affected by pollutants emitted from pig production. From agricultural production, nitrous oxide, methane and CO2 are the most important contributors to global warming (Ole-sen, 2005; Paper 1). Nitrous oxide is emitted from slurry handling and from fields. On an an-nual basis, 4.5-5.1 kg nitrous oxide-N per hectare is emitted from a typical Danish pig farm (Paper 1), and although this is a small amount compared to ammonia and nitrate emissions, the contribution to global warming is significant, because nitrous oxide is a very strong greenhouse gas. Methane is also emitted from slurry handling and storage, while fossil CO2 is emitted from the combustion of fossil fuels. Finally, CO2 can be emitted from the soil if more organic matter is degraded than applied to the soil. In addition to the above described environmental effects of pig production, there are also some indirect effects. For example, Danish pigs consume large amounts of soybean meal from soybeans cultivated in South America, resulting in deforestation, greenhouse gas emis-sions and loss of biodiversity (Paper 2; Tengnäs & Nilsson, 2003; Steinfeld et al., 2006), but these environmental impacts are not targeted by the environmental regulations in their present form. The so-called ‘Environmental Technologies’ have gained ground in the Danish pig sector dur-ing the last 10-15 years. Examples of these ‘Environmental Technologies’ are: i) slurry sepa-ration that facilitates the transport of slurry out of areas with a high livestock density (Paper 5); ii) anaerobic digestion of slurry which reduces the greenhouse gas losses from the slurry when it is applied to the fields (and also substitutes fossil energy (Paper 5)); iii) acidification of the slurry which decreases the ammonia loss; and iv) addition of digestibility-improving enzymes to reduce the feed consumption and slurry excretion (Paper 4; Nielsen & Wenzel, 2006). However, it is not always clear to what extent these ‘Environmental Technologies’ can reduce the pollution caused by pig production. The pig farms’ impact on the environment is often the subject of media attention, and so is the environmental regulations’ impact on the pig farmers. The most important aspects of the envi-ronmental regulation of the Danish pig sector will be described in the following. 1.3 Environmental regulation The concern about nutrient losses from the agricultural sector in Denmark increased in the 1970s and 1980s. This concern hit the political agenda and in 1986 the ‘NPO Action Plan’ was launched. It aimed at reducing N- and P-pollution and was followed by three Action
10

Plans for the Aquatic Environment (1987, 1998 and 2004), the ‘Action Plan for a Sustainable Agriculture’ (1991) and the ‘Ammonia Action Plan’ (2001) (Dalgaard et al., 2004). These action plans dictate several restrictions. For example, farmers are not allowed to apply slurry to the fields during winter and must therefore have large storage capacity (Anonymous, 2006). With the purpose of reducing the ammonia emissions, the regulations stipulated, among other things, that slurry tanks should be covered, that slurry must not be broadcast above ground and must be incorporated into the soil within 6 hours after application, etc. (Anonymous, 2006). The environmental regulations focused specifically on the handling and use of slurry, justified by the fact that more than 50% of the nutrients used for crops in the Danish agricultural sector are in the slurry (Petersen, 2007). Numerous other restrictions exist, but in the following only the ‘Nutrient farm account’ sys-tem and the requirements for the farmers to keep a balance between the number of animals on his/her farm and the size of the area under cultivation will be explained. The legislation (Anonymous, 2006) limits the amount of slurry that can be applied per hec-tare. On a pig farm an amount of slurry corresponding to 1.4 livestock units can be applied per hectare per year and for a cattle farm this is 1.7 livestock units per hectare. All farmers are obliged to forward a ‘Nutrient farm account’ to the authorities every year, with information on the quantity of slurry-N produced, exported and imported and amount of artificial fertil-iser-N imported to the farm. Other agricultural information such as land area, crop types, crop rotations must also be reported. The intention of the nutrient farm account system is to limit the use of nitrogen (N) applied to the crops and thereby reduce the N losses to the environ-ment. Therefore each farm has a fertiliser N-quota, which is based on an N norm for each crop type and adjusted by soil type. For example, in 2007/2008 a cash crop farmer on a sandy loam soil with no slurry production could import 151 kg N in artificial fertiliser per hectare of win-ter barley (Plantedirektoratet, 2007). Slurry-N also counts in the N-quota, hence a livestock farm must purchase less artificial fertiliser-N compared to a cash crop farm (papers 1 and 5). A pig farm with more than 1.4 livestock units per hectare (equals 47 fattening pigs from 30 to 100 kg produced per year) is obliged to export part of the slurry from the pig farm, and report the name of the receiver of the slurry to the authorities. The receiving farm also has an N-quota and must as a consequence of the slurry import buy commensurately less artificial fer-tiliser-N. This ensures that slurry-N application is limited, although the slurry is exported from the pig farm. As previously explained, the average size of Danish pig farms increases over time (figure 1). If a pig farmer with a high livestock density wishes to expand the pig herd, he/she is obliged to either buy more land or to arrange slurry agreements with farmers who can receive the ex-
11

tra slurry. However, this might be expensive, especially if the expanding farm is situated in an area with a high livestock density, where there is competition for land and slurry agreements with farmers that can receive the slurry. As shown in figure 3, large areas have livestock den-sities above 1.4 per hectare, and therefore the slurry has to be transported long distances. An increasing number of farmers are investing in slurry separation technologies (Birkmose, 2007), because it facilitates the export of slurry from the farm. When slurry is separated it is split into fractions with different nutrient contents. For example, some of the slurry separation plants can produce a fibrous fraction that contains 12 kg N per tonne (Birkmose, 2004), which is higher than the 5-6 kg N per tonne in raw slurry (Anonymous, 2007a). Thus, the amount of slurry transported can be halved if the farmer invests in a slurry separation plant. For a pig farmer who already has more than 1.4 livestock units per hectare, investment in a slurry sepa-ration plant can be an alternative to investment in more agricultural land. It should be emphasized that the ‘Nutrient farm account’ system, which controls the exchange of slurry between farms and aims at reducing the N losses from the agricultural sector, only focuses on N. Although slurry also contains P, and phosphate is a threat to the aquatic envi-ronment (Poulsen & Rubæk, 2005; Kronvang et al., 2001), there are no restrictions on the amount of P (slurry or artificial fertiliser) applied to the fields. However, in the Third Action Plan for the Aquatic Environment, there are some attempts to reduce phosphate leaching (e.g., tax on P mineral feed). Greenhouse gas emissions is a hot topic in the global debate, and although the contribution from agriculture to the Danish greenhouse gas emissions inventory has been estimated at 18% (Olesen, 2005) there is no national action plan that aims directly at mitigating greenhouse gas emissions from the agricultural sector. The environmental legislation and regulations in Den-mark also exclusively focus on farms, although it is well-documented that – for example – the yearly consumption of approximately 1,650,000 t soybean meal in Denmark (Danish Sta-tistics, 2007) contributes to global warming and loss of biodiversity (Steinfeld et al., 2006; Paper 3). At the international level the Kyoto Protocol was negotiated in 1997, and according to this more than 160 industrialized nations have committed to reducing their greenhouse gas emissions by 2012 (Anonymous, 2007b). Each year each country yearly estimates and sub-mits a National Greenhouse Gas Inventory to the UN Framework Convention on Climate Change (UNFCCC) and EU (e.g., Illerup et al., 2007; Anonymous, 2005). To assess to what extent an agricultural production affects the environment is not simple, and one of the first tasks is to choose a proper environmental assessment tool that can improve the knowledge on environmental impact of current production system and find solutions to reduce these impacts. Some of the most relevant tools will be described in the following section.
12

1.4 Environmental assessment tools Different types of assessment tools have been developed to establish environmental indica-tors, which can be used to determine the environmental impact of livestock production sys-tems or agricultural products. The environmental assessment tools can be divided into the area-based or product-based as argued by Halberg et al. (2005). Area-based indicators are for example ‘nitrate leached per hectare’ from a pig farm (e.g., Paper 1), and product-based indi-cators are for example ‘global warming potential per kg pork’ (e.g., Paper 3). As explained in Paper 1, the area-based indicators are useful for evaluating farm emissions of nutrients such as nitrate, ammonia and phosphate that all have an effect on the local environ-ment, and area-based indicators have – for example – been used to compare nutrient surpluses from different farm types (e.g., Kristensen et al., 2005; Watson et al., 2002). In a situation where a farm is situated in a nitrate vulnerable zone it is obviously useful to assess the amount of nitrate leached per hectare from the farm to clarify to what extent the farm impacts the lo-cal environment, and in that case the area-based indicators are useful. On the other hand, when considering the greenhouse gas emissions from the agricultural production the area-based environmental assessment tools must be used with caution, because global warming is a global and not a local effect. Greenhouse gases impact the climate, irrespective of whether they are emitted from a Danish farm or from a soybean field in Argentina. An exaggerated example could be the dairy farmer who wants to reduce the emissions of fossil CO2 from trac-tor driving, and therefore in the efforts to save diesel gets lower silage yields, and therefore has to import more fodder to the farm. If this imported fodder has a higher greenhouse gas emission per tonne produced than that produced on the dairy farm, the savings of diesel for the tractor is a bad solution. In this case, the area-based environmental indicator would not have revealed that the diesel savings could not reduce the greenhouse gas emissions, but the product-based environmental indicator would. Thus product-based indicators are useful for evaluating the impact of food productions on the global environment (e.g. climate change) and have the advantage that in addition to emissions from the farms, emissions related to the production of inputs (e.g. soybean, artificial fertiliser) and outputs (e.g. slurry exported to other farms) are also included. In that way it is easier to avoid ‘pollution swapping’, which means that the solving of one pollution problem creates a new. Life-Cycle thinking is the basic idea behind the product-based indicators. Life-Cycle thinking is one of five key principles in the European Union’s Integrated Product Policy (IPP) (Euro-pean Commission, 2003) and is also supported by the United Nations Environmental Pro-gramme (UNEP, 2004). In Life-Cycle thinking the cradle-to-grave approach for a product is adopted to reduce its cumulative environmental impacts (European Commission, 2003). The most developed tool for Life-Cycle thinking is Life Cycle Assessment (LCA), which is a method of evaluating a product’s resource use and environmental impact throughout its life-cycle. LCA has been used for environmental assessment of milk (Thomassen et al., 2007; Weidema et al., 2007; Thomassen & de Boer, 2005; Cederberg & Mattsson, 2000; Haas et al., 2000), pork (Weidema et al., 2007; Basset-Mens et al., 2006; Dalgaard & Halberg, in prep.;
13

Cederberg & Flysjö, 2004; Eriksson et al., 2005; Paper 3), beef (Ogino et al., 2007; Weidema et al., 2007), grains (Weidema et al., 1996) and other agricultural/horticultural products (Hal-berg et al., 2006). In LCA all relevant emissions and resources used through the life cycle of a product are ag-gregated and expressed per unit of the considered product. Commonly applied environmental impact categories within LCA of food products are global warming, eutrophication, acidifica-tion, photochemical smog and land use. For each of the environmental impact categories the emitted substances throughout the product chain that contribute to the environmental impact category are quantified. For example, when performing an LCA of a livestock product, it is revealed that nitrous oxide is emitted from the soybean production (Paper 3) and methane from the slurry handling (Paper 1). These emissions are standardized and expressed in CO2-equivalents, thus taking into account that nitrous oxide is a much stronger greenhouse gas than methane and CO2. Following the same procedure the emissions contributing to the other impact categories are standardized for each of the environmental impact categories. The LCA methodology is standardized according to the ISO-standards (14044), and will be explained in more detail in chapter 2. Also ‘Food miles’ and ‘Carbon footprint’ are product-based environmental indicators that build on life-cycle thinking, and have been used for assessing the environmental impact of food production (Smith et al., 2005; Wiedmann & Minx, 2007). However, these are exclu-sively focused on global warming and some of them only include fossil CO2 emissions and not even the two important greenhouse gases methane and nitrous oxide. Therefore, they are considered inadequate for the purpose of this study. However, their use within environmental assessment will be discussed in chapter 4. 1.5 Research questions and outline of the thesis The overall aim of this thesis is to improve the understanding of the environmental impact of Danish pork production in a global context and to suggest improvements at the most impor-tant environmental hotspots. More specifically, the aim is to answer the following questions:
1. Which parts of the product chain of Danish pork are the most polluting?
2. Which substances of those emitted from the product chain of Danish pork are the most polluting?
3. What is the potential of improving the environmental profile of pork by the addition of
the feed digestibility improvement factor xylanase to the pig feed or by improved slurry handling?
4. What is the need for methodological improvements within LCA of livestock products?
14

The outline of the thesis is the following: In chapter 2, I will identify the environmental hot-spots of Danish pork, and this is primarily based on results from papers 1, 2 and 3. In chapter 3 options for improvement in the product chain of pork are analysed on basis of the results obtained in papers 4 and 5. In chapter 4, I will discuss the most important methodological as-pects regarding LCA of agricultural products, based on my experiences obtained during the Ph.D. period. Then, in chapter 5, I will discuss to what extent the environmental regulation of the Danish pig sector results in environmental improvements at the global and local scale. In chapter 6 the conclusion is presented. 2 Environmental hotspots in the product chain of Danish pork
In this chapter the environmental hotspots in the product chain of pork will be identified by using the product-oriented environmental assessment tool LCA. In this context ‘environ-mental hotspots’ refers to the part of the product chain that impacts the environment the most. The presented results are primarily from Paper 3, and before the presentations of the data sources used and the identified environmental hotspots, a short introduction to the LCA meth-odology and consequential LCA modelling will be given. 2.1 A short introduction to LCA LCA is chosen as the tool to assess the environmental of pork production and to identify the environmental hotspots in the product chain. The LCA methodology has its own ISO Stan-dard (14044), and has been used for assessing the environmental impact of industrial products for decades (Thrane & Schmidt, 2005). In accordance with the ISO standard, an LCA consists of four interrelated phases, as presented in the subsequent. The first phase is ‘Goal and scope definition’, in which the goal of the study and the ‘func-tional unit’ are defined. The functional unit is the type and amount of product assessed, and could, for example, be ‘one kg pork chops from supermarket’. The second phase is the ‘Life cycle inventory’ which involves the compilation and quantifica-tion of inputs and outputs in all the involved processes. Outputs include both material outputs (e.g., one kg barley) and emissions (e.g., nitrate leached). In this phase it should also be de-cided how to handle processes producing more than one product. For instance: Shall the greenhouse gas emissions from the soybean cultivation be ascribed to the soybean meal or to the soy oil? Or should the system be expanded, to avoid this allocation between the two prod-ucts? The third phase is the ‘Life cycle impact assessment’, which is carried out on the basis of the life cycle inventory data. First the emissions in the life cycle inventory data are classified, which means they are assigned to categories according to their impact. For example, methane is a greenhouse gas and is hence assigned to the impact category ‘Global warming’. If a sub-
15

stance contributes to more than one impact category, it is assigned to all of them. Classifica-tion is followed by characterisation. Every substance is assigned a potential impact in the im-pact category under study. The potential impact of a substance is given relative to a dominant factor in the category , e.g. for the global warming potential this is typically 1 kg of CO2 emissions. These relative impacts (the characterisation factors of a substance) are then multi-plied with the amount of each emission and the resulting impact values are summed for the respective impact category (Anonymous, 2007c). The fourth phase is ‘Interpretation’, where the data from the second and third phases are ana-lysed and conclusions and recommendations are drawn. For example, the environmental hot-spots can be revealed in this phase. For further description on the LCA methodology, see e.g., ISO standard (14044), Thrane & Schmidt (2005), Frederiksen (2004) or Anonymous (2007c). Two essentially different approaches can be used in LCA modelling: the consequential ap-proach and the traditionally (attributional) approach. As explained in Paper 2, most of the ex-isting LCAs are based on the attributional approach, but the tendency is that the consequential approach is used in an increasing number of studies. In a newer study by Williams et al. (2006) the two approaches are mixed in LCAs of food products. In the present study the con-sequential approach is used, and will shortly be explained in the following. The consequential approach has two important main characteristics. The first characteristic is that it seeks to model the technology (or process) actually affected by a change in demand (the marginal technology). This is in contrast to the attributional approach where average (not marginal) technologies are used. An example with electricity is given in Paper 2: In conse-quential modelling the type of electricity affected by an increased demand is used (coal or gas-based), whereas in the attributional approach the electricity consumption is often mod-elled as an average of all electricity sources within the region. In consequential modelling the technology (or process) affected is identified by continuously asking: ‘what is affected by a change in demand?’. For example: What is affected by a change in demand of Danish pork? The second characteristic is that co-product allocation is ‘systematically’ avoided through system expansion (Paper 2). These characteristics are different from attributional LCA, where average technologies (not marginal) are used, and where co-product allocation is often han-dled by mass or value allocation (Weidema, 2003). An example of the avoidance of allocation is the way the co-production of soybean meal and soy oil is handled in Paper 2. The system expansion, in this case, implies that the inputs and outputs are entirely ascribed to the soybean meal, and the product system is subsequently expanded to include the avoided production of palm oil.
16

For further details on consequential (and attributional) modelling, see Paper 2, Weidema (2003) and Schmidt (2007). Consequential modelling of agricultural products, its strengths and weaknesses will be discussed in chapter 4. In the following sections the LCA of Danish pork will be presented. The description is divided into four sections in accordance with the four phases of LCA as described earlier. Parts of the description are extracts from Paper 3. See Paper 3 if more detailed explanations are needed. 2.2 Goal and scope definition The goal was to identify the processes in the product chain of pork with the largest environ-mental impacts, the so-called environmental hotspots, and thereby the goal was also to answer research questions 1 and 2 in section 1.5. The functional unit was ‘one kg Danish pork (car-cass weight) delivered to Harwich Harbour in Great Britain’. The one kg of pork must be con-sidered as ‘average’ pork, with no distinction between the different types of pork (e.g., chop, bacon, tenderloin). There were two reasons for choosing Great Britain as the target destina-tion: i) The transport included both lorry and ship and the study could thereby clarify whether these transport modes were environmental hotspots; ii) Great Britain was the second largest importer of Danish pork, only exceeded by Germany to which the pork only was transported by lorry (Danish Meat Association, 2007). The environmental impact categories considered were global warming, eutrophication, acidification and photochemical smog. 2.3 Life cycle inventory The life cycle inventory for Danish pork was for the most part established using data from pa-pers 1 and 2. Pig farm and feed grain data were from the National Agricultural Model estab-lished in Paper 1 and data on soybean meal were from Paper 2. The framework for life cycle assessment of Danish pork is presented in Figure 4. Only the most important flows of the product chain of pork are shown. For a more detailed figure and explanations see Paper 3. The most important inputs to the fattening farm were fertiliser (arti-ficial N, P and K), feed, energy (oil for heating and electricity) and weaners. The cash crops sold from the farm (e.g., bread wheat, rape seed and sugar beets) substituted similar products on the market, resulting in an ‘avoided production’ of agricultural production. Because pig meat was sold from the pig farm, there were co-products from the farm, and the saved emis-sions due to the avoided production were deducted from the main product (the pork). There were several other avoided products in the product chain of pork that not are shown in figure 4. E.g., the use of soybean meal (an ingredient in the feed) implied co-production of soybean oil, which substituted palm oil (Paper 2), and thus the production of soybean meal resulted in an avoided production of palm oil. The fattening pigs were slaughtered at the slaughterhouse, carved up and accordingly transported by lorry and ship to Harwich Harbour in Great Britain.
17

Figure 4. Framework for LCA of pork. The establishment of the LCA of Danish pork required data on the material flows (e.g., amount of feed, pigs, electricity) and calculation of the emissions from the different parts of the product chain. In the following the pig farm data and the feed data are described. For de-tails on the remaining data (e.g., transport, slaughterhouse) see Paper 3. Finally, the princi-ples used for modelling the emissions from the feed production and pig production are de-scribed. For a more detailed description, see papers 1, 2 and 3. Pig farm data The pig farm was an environmental hotspot in the product chain of pork (Paper 3), and high quality pig farm data were obviously crucial for the robustness of the LCA results. The LCI of the pig farm used for the environmental assessment of pork in this thesis was from the Na-tional Agricultural Model presented in Paper 1. The model was established in order to get data on resource use, production and environmentally important emissions for a set of representa-tive farm types. The 31 modelled farm types were based on farm accountancy data which were representative for the Danish agricultural sector in 1999. The National Agricultural Model contained 31 farm types (6 pig farm types, 8 dairy farm types, 1 sugar beet farm type, etc.), which combined represented the Danish agricultural sector. Identification of the pig farm type that responded the most to a change in demand for Danish pig was achieved using the econometric sector model ESMERALDA (Jensen et al., 2001), as explained in Paper 3. The pig farm used for the LCA of pork produced 1402 fattening pigs per year. The weaners arrived at the farm at 30 kg and were taken to the slaughterhouse when they obtained a weight of 100 kg. The farm also sold rape seed, bread wheat, sugar beets, straw, peas and grass seeds and had a farmed area of 71 hectares, of which 68% was devoted to grain production. The self-sufficiency in feed (measured in N) was 41%, meaning that 59% of the feed consumed by the fattening pigs was purchased. The feed produced on the farm was exclusively grain (bar-ley and wheat).
TransportHarwich Harbour
Slaughter-house
Fertiliser(N, P, K)
Feed
Energy,oil, electricity
Weaners
Fatteningpig farm
(produces fatteningpigs and cash crops)
Avoidedagriculturalproduction
TransportHarwich Harbour
Slaughter-house
Fertiliser(N, P, K)
Feed
Energy,oil, electricity
Weaners
Fatteningpig farm
(produces fatteningpigs and cash crops)
Avoidedagriculturalproduction
18

An important strength of deriving data from the National Agricultural Model was that the farm types were representative, partly because of the use of the representative data set of farm accounts and partly because of an adjustment to national level statistics. The farm types were based on realistic and documented levels of resource use per unit agricultural product and the emissions, therefore, reflected average production levels and efficiency within different farm types. The farm types were all consistent in terms of crop-livestock interactions, and together they formed the National Agricultural Model that documented the total resource use and emissions of the Danish agricultural sector in 1999, including the exchange of slurry and straw between farm types (Paper 1). There can be large differences in the environmental im-pact per kg pork produced at different farms as shown by Hvid et al. (2005) and therefore it was preferable to use representative farm data instead of case farm data. For further details on the establishment of the National Agricultural Model, see Paper 1. Feed data When more pigs are produced, more pig feed will be required on the world market. However, only the most competitive pig feed ingredients on the world market will be affected. The most competitive protein meal on the world market is soybean meal as argued in Paper 2, and the most competitive energy source is grain (Paper 3). Hence, when using the consequential mod-elling approach it was sufficient to have LCA-data on soybean meal and feed grain. For fur-ther explanations, see papers 2 and 3. LCA-data on soybean meal were from Paper 2. Soybeans contain protein (approx. 35%) which is used for livestock feed after crushing and extraction of the oil. The oil constitutes approx. 18% of the soybeans and is primarily used for consumption. Consequential modelling is applied for the LCA of soybean meal and because the soybean meal has the co-product soybean oil, the avoided production of the most competitive oil (palm oil) is included in the calculations. The soybeans from Paper 2 were cultivated and processed in Argentina, trans-ported by lorry to Rosario Harbour in Argentina, and finally shipped to Rotterdam Harbour in the Netherlands. For further details, see Paper 2. In the LCA of Danish pork (Paper 3) the soybean meal transport by lorry from Rotterdam Harbour to Denmark was added. LCA-data on feed grain were from the LCAfood-database (www.LCAfood.dk), and were based on the same farm account data (Paper 1) as the pig farm LCI described in the previous section. The feed grain was a mix of spring barley (25%), winter barley (25%) and wheat (50%) produced in Denmark. Schmidt (2007) argues that grain produced in Canada is the most competitive on the market, and thereby the marginal grain. But in this study I preferred to use high quality data from the wrong country (Denmark) instead of low quality data from the right country (Canada). Quantification of emissions from agricultural production The same principles of quantifying the emissions from the agricultural production (pigs, soy-bean meal and feed grain) were used in papers 1, 2 and 3. In all three papers the nutrient bal-
19

ance approach (Kristensen et al. 2005a: Halberg et al., 1995) was applied, following the framework presented in figure 5. The nutrient balance approach can be applied to agricultural systems at various levels: animal level, herd level, field level and farm level. Figure 1 is an example of how the nutrient balance approach had been applied to the pig farm type, which was established in Paper 1 and used for environmental assessment of pork in Paper 3. The methodology used for modelling the inputs (e.g., feed, fertiliser, diesel) to the farm and out-puts from the farm (e.g., pigs, rape seed) is described in Paper 1. The upper part of figure 1 shows the framework for modelling the N emissions from the pig farm. Firstly N inputs were calculated, based on knowledge of N content in the feed (Møller et al., 2003) and amount of artificial fertiliser-N used. Secondly, N in the outputs was calculated based on knowledge of N content in the cash crops sold from the farm (Møller et al., 2003) and N content in the pigs sold from the farm (Poulsen et al., 2001). The N surplus was then calculated by subtracting the N output from the N input. The N surplus was the N imported to the farm but not incorpo-rated in any of the products. The N surplus will be lost to the environment in different forms as shown on the right in figure 5, and the procedure used for dividing the N surplus into the different pathways of loss is described in the following. Ammonia is volatilized into the air, primarily from the slurry, but also from artificial fertiliser and growing crops. The amount of ammonia emitted from the pig farm was calculated based on the amount of slurry and artifi-cial fertiliser, crop types and ammonia emission factors. Ammonia contributes to both eutro-phication and acidification potential, and also impacts the biodiversity. Some of the N surplus is lost by denitrification, which includes all the microbiological processes that are converting N in the soil and slurry to N2 or nitrous oxide (N2O) (Vinther & Hansen, 2004). Also other N substances can be formed during denitrification, but N2 and N2O are the most important. N2 is harmless to the environment, and the N2 concentration in the atmosphere is 75.5 w-% (Helt & Rancke-Madsen, 1991). The N lost by denitrification was calculated according to Vinther & Hansen (2004), as described in Paper 1. Part of the N surplus is incorporated in the soil or the N is released from the soil, depending on the way the soil is cultivated. The nitrate leaching was then assumed to be equal to the N surplus minus ammonia losses, denitrification and N change in soil N status. Nitrate contributes to the eutrophication potential. Nitrous oxide emissions were calculated according to the IPCC methodology (IPCC, 2000), and therefore required data on amounts of N in slurry, fertiliser applied to the soil, ammonia losses, crop residues and nitrate leached. All these flows were quantified in order to calculate the N surplus, and were therefore available. Using these N flows also ensured consistency be-tween the estimated N losses (ammonia, denitrification, net change in N in soil, nitrate leach-ing shown in figure 5) and the estimated nitrous oxide emissions. This procedure was used in both Paper 1 and Paper 2. Methane emission from slurry handling and storage was calculated according to IPCC (2000), as explained in Paper 1.
20

Figure 5. Nutrient balance approach used in papers 1, 2 and 3 for calcula-tion of N and P emissions. Input - Output = Surplus. Emissions of phosphate to the aquatic environment were also calculated by use of the nutrient balance approach, as shown in the lower part of figure 5. However, the fate of P surplus in the environment is more simple compared to N. P surplus can be lost as phosphate to the aquatic environment or sorbed to the soil. The proportion of P surplus leached as phosphate depends highly on the soil characteristics, climate, topography of the field, etc. According to Poulsen & Rubæk (2005) 1000 t P was leached in Denmark in year 2000, and combining this value with the total P surplus (34,000 t P) from all the farm types in the National Agricultural Model (Paper 1), it was assessed that 2.9% of the P-surplus was leached as phosphate. Thus it was assumed that the P surplus was directly proportional to phosphate leaching. The same as-sumptions were used for the establishment of the life cycle inventory for soybean cultivation in Paper 2 (table 2). Some of the assumptions presented above might be controversial, and will therefore be discussed in chapter 4. An important strength of the nutrient balance approach is that all N and P is accounted for, hence securing consistency between the different types of N and P losses. All N and P enter-ing the farm (or animal, or field) will leave as products or emissions. A weakness is the level of uncertainty for nitrate leaching , because nitrate is calculated as N-surplus minus ammonia, denitrification and net change in soil N status (figure 5), and the uncertainties will therefore be summed in the estimate on nitrate leaching. However, the total amount of nitrate leached from The National Agricultural Model (Paper 1) was in good agreement with results on ni-trate leaching obtained in the ‘Evaluation of the Action Plan for the Aquatic Environment II’ (Paper 1). This emphasizes the robustness of the methodology used for calculating nitrate leaching in this study.
N input
Noutput
Nsurplus
Ammonia lossDenitrificationNet change in N in soilNitrate leaching
P input
Poutput
Psurplus Phosphate leachingP sorbed to soil
N input
Noutput
Nsurplus
N inputN input
NoutputNoutput
NsurplusNsurplus
Ammonia lossDenitrificationNet change in N in soilNitrate leaching
P input
Poutput
Psurplus Phosphate leachingP sorbed to soil
P inputP input
PoutputPoutput
Psurplus Phosphate leachingP sorbed to soil
21

2.4 Life cycle impact assessment Several methods are available for Life Cycle Impact Assessment (LCIA). The EDIP97 (Wenzel et al. 1997, updated version 2.3) was used in the LCA of soybean meal (Paper 2) and in the LCA of Danish pork (Paper 3), while Ecoindicator 95 was used in Paper 4. The Intergovernmental Panel on Climate Change (IPCC, 2001, Chapter 6) has launched new, but lower, characterization factors for nitrous oxides (296 g CO2/g) and methane (23 g CO2/g). A sensitivity analysis was performed and it was found that the substitution of the EDIP97 characterization factors with IPCC (2001) characterization factors reduced the global warming potential by 6.1% for pork and 3.7% for soybean meal. The changes were small and although some of the environmental hotspots in the product chain of pork became somewhat ‘hotter’, this was deemed unlikely to change the conclusions of this thesis, thus the EDIP97 was used for the LCIA. 2.5 Interpretation The characterized results per kg Danish pork delivered to Harwich Harbour were 3.77 kg CO2 eq. global warming potential, 319 g NO3 eq. eutrophication potential, 59 g SO2 eq. acidifica-tion potential, and 1.27 g ethene eq. photochemical smog potential, as presented in Paper 3 (table 3). These results were comparable to LCA results of pork produced in Sweden (Ceder-berg & Flysjö, 2004) and France (Basset-Mens & van der Werf, 2005). For further details on the comparisons, see Paper 3 (table 5). In a new study (Dalgaard & Halberg, in prep.) on LCA of Danish pork produced in 2005, the characterized results were lower (3.6 kg CO2 global warming potential, 232 g NO3 eq. eutrophication potential and 45 g SO2 eq. acidification po-tential) than the results in this study. There are two important reasons for this discrepancy. Firstly the feed efficiency for both fattening pigs and weaners has improved from 1999 to 2005 (Sloyan et al., 2006), hence less pig feed is used per kg pork produced. Secondly, the new characterization factors on global warming from IPCC (2001) and a new IPCC method-ology for estimating the greenhouse gas emissions from the agricultural sector (Eggleston et al. 2006) were used in the study of Dalgaard & Halberg (in prep.). According to Williams et al. (2006) the environmental impact per kg pig was much higher than the results of our study and the studies from Sweden and France (Cederberg & Flysjö, 2004; Basset-Mens & van der Werf, 2005). It would appear that the main difference between our results and the results of Williams et al. (2006) relates to the method for calculating ni-trous oxides. In addition, much more ammonia was emitted per kg pig and presumably the ni-trate leaching from the soybean used in the study of Williams et al. (2006) was higher com-pared to the soybean meal which we have used (Paper 2). The contribution from the different stages of the pork’s product chain to the respective envi-ronmental impact categories is presented in figure 6.
22

Figure 6. Contribution to global warming potential (GW), eutrophication potential (EU), acidifi-cation potential (AC) and photochemical smog potential (PS) from the eight stages of pork’s product chain. The y-axis shows the percentages of emissions arising from the different stages of the product chain, and the contribution in percentages (from each of the life cycle stages to the respective environmental impact categories) is shown below the name. The eight stages in the product chain presented in figure 6 correspond to the eight boxes shown in figure 4. ‘Fertiliser’, ‘feed’, ‘energy’ and weaners are solely the farm inputs pur-chased to the fattening pig farm. Similar farm inputs were used at the weaner farm, but the environmental impacts related to the farm inputs used in the weaner production were included in ‘weaners’. ‘Fertiliser’ includes artificial fertiliser (N, P and K). ‘Energy’ includes electric-ity, and processing and distribution of oil used for heating and diesel for traction. The emis-sions from ‘fattening pig farm’ include all emissions from the housing and the 71 hectares of agricultural land, although part of the agricultural land was cultivated with cash crops. The crops sold from the ‘fattening pig farm’ substituted other products on the market, which re-sulted in ‘saved’ emissions. These ‘saved’ emissions are represented by the negative values called ‘avoided agricultural production’. The y-axis shows the percentages of emissions that arise from the different stages of the product chain, and the contribution in percentages (from each of the life cycle stages to the respective environmental impact categories) is shown be-low the name. For example, 13% of the greenhouse gases emitted (measured in CO2-eq.) from
Fertiliser13, 1, 3, 2
Avoided agricultural production
-21, -22, -12, -14
Slaughterhouse4, 4, 3, 5 Transport to GB
1, 0, 1, 5
Fattening pig farm40, 71, 60, 22
Weaners23, 22, 26, 17
Feed14, 2, 6, 29
Energy5, 0, 1, 20
-40%
-20%
0%
20%
40%
60%
80%
GW EU AC PS
Inputs to fattening pig farm
Fertiliser13, 1, 3, 2
Avoided agricultural production
-21, -22, -12, -14
Slaughterhouse4, 4, 3, 5 Transport to GB
1, 0, 1, 5
Fattening pig farm40, 71, 60, 22
Weaners23, 22, 26, 17
Feed14, 2, 6, 29
Energy5, 0, 1, 20
-40%
-20%
0%
20%
40%
60%
80%
GW EU AC PS
Inputs to fattening pig farm
23

the product chain of pork came from the production and distribution of artificial fertiliser. If the other positive contributions (feed (14%), energy (5%), weaners (23%), fattening pig farm (40%), slaughterhouse (4%) and transport to Great Britain (1%)) are added they sum up to 100%. 21% of the greenhouse gas emissions were counterbalanced by ‘avoided agricultural production’. The fattening pig farm and the weaners were the two most important environmental hotspots for both global warming, eutrophication and acidification, whereas the feed imported to the fattening pig farm, the energy use and the fattening pig farm itself were the most important environmental hotspots seen in relation to photochemical smog. In the following the contribu-tion from each of the stages in the product chain of pork will be described in more detail. Global warming potential As described in Paper 3, the main contributors to the global warming potential were the fat-tening pig farm (40%) and the weaner farm (23%). Of the greenhouse gases emitted on the fattening pig farm 72% was nitrous oxide (figure 7), whereas fossil CO2 from the use of agri-cultural machinery only contributed 11%, and methane from slurry handling contributed 17%. The different sources of nitrous oxide emissions at the fattening pig farm are presented in fig-ure 8, and it shows that 43% of the nitrous oxide came from denitrification of nitrate leached from the field, and 44% originated from denitrification of N fertiliser (artificial fertiliser and slurry) applied to the fields.
Nitrous oxide72%
Methane17%
Carbon dioxide11%
Manure applied to
f ield16%
Fertilizer28%
Nitrate 43%
Crop residues
7%
Manure handling
4%Ammonia
2%
Figure 7. Types of greenhouse gases emitted from the fattening pig farm. Unit: CO2-eq
Figure 8. Sources of nitrous oxide emissions on the fattening pig farm.
Figure 6 shows that production and distribution of fertiliser imported to the fattening pig farm contributes 13% of the greenhouse gases emitted. Of this, 94% is related to the production of artificial fertiliser-N and only 6% to the production of P and K (not shown), because these fer-tiliser types were used in smaller amounts and less energy was used for their manufacturing. Of the emitted greenhouse gases, 14% was related to the production of feeds imported to the fattening pig farm, whereof 79% could be ascribed to production and distribution of soybean
24

meal. So besides the fattening farm and weaner production, production and distribution of soybean meal and artificial fertiliser-N can also be considered as being environmental hot-spots. The contribution from ‘slaughterhouse’ (which includes transport from farm to slaugh-terhouse) was only 4%, while the transport from the slaughterhouse to Harwich Harbour only contributed 1%. However, much of the exported Danish pork is transported far longer dis-tances than to Great Britain, and to explore the impact of the transport distance on the global warming potential per kg pork, two additional scenarios were established. One where the pork was transported to Munich in the south of Germany by lorry (distance: 1075 km) and one where it was transported to Tokyo Harbour in Japan by ship (distance: 21,153 km). The trans-port to Munich and Tokyo increased the global warming potential by 3% and 5%, respec-tively. This shows that the contribution from transport is limited, although the pork is trans-ported long distance. ‘Food miles’ is a measure of the distance food travels from the farm to the consumer (Smith et al., 2005) as explained in chapter 1, and the low contribution from the transport of pork in this study highlights that ‘Food miles’ is a concept that cannot stand alone as an indicator of environmental impact from food production. CO2 emitted from the transport of the pork is not an environmental hotspot, and even if the food miles of pork were dramati-cally reduced, it would hardly have any effect on the emissions of greenhouse gases. This will be discussed in more detail in chapter 4. Considering the product chain of pork, the substances with the highest contribution to global warming potential were nitrous oxide (53%), CO2 (37%) and methane (10%). If the lower characterization factors for nitrous oxide and methane (IPCC, 2001) (see section 2.4) are ap-plied, the contribution will only be slightly lower for nitrous oxide (51%) and slightly higher for CO2 (39%). Consequently, there is no reason to believe that the environmental hotspots regarding global warming potential would change if the new characterization factors from IPCC (2001) were used. Eutrophication potential According to Paper 3, the contribution to eutrophication was 71% from the fattening pig farm and 22% from the ‘weaners’. Out of this, 69%, 28% and 3% came from nitrate, ammonia and phosphate, respectively. Nitrate and phosphate were leached from the fields. Ammonia was primarily emitted from the animal house, during storage in slurry tanks and under and after application of the slurry to fields. Considering the whole product chain of pork, the two larg-est contributors were nitrate (63%) and ammonia (30%). The contribution from phosphate was only 3%, and this might lead to the conclusion that phosphate leaching from pig produc-tion is not an issue. However, this conclusion is at variance with the ‘Action Plan for the Aquatic Environment III’ (Anonymous, 2004) in which reduction of phosphate leaching from the agricultural sector is given high priority. So although phosphate had not been identified as an important contributor to eutrophication potential in the present LCA study, it cannot be ne-glected. This will be discussed further in the chapter 4.
25

Acidification potential The fattening pig farm and the production of weaners contributed 60% and 26%, respectively, of the emitted acidifying substances. Ammonia from the farms amounted to 83% of the acidi-fying substances emitted from the product chain of Danish pork. The ammonia emitted from the fattening pig farm came from slurry in the animal house (38%), storage of slurry in slurry tanks (12%), application of slurry (20%) and N fertiliser (11%) to the fields and from the crops (19%). ‘Feed’ accounted for 6% of the acidifying substances emitted, and fertiliser and ‘energy’ purchased by the fattening pig farm accounted for 3% and 1%, respectively. The contributions from ‘slaughterhouse’ and ‘transport to UK’ were 3% and 1%, respectively, primarily related to energy use (Paper 3). Ammonia contributed 84% of the emissions form the product chain and was thereby the largest contributor. Photochemical smog potential Substances contributing to photochemical smog primarily came from refining and combustion of fossil fuel. ‘Feed’ was the largest contributor (29%), with soybean meal being more impor-tant than feed grains. ‘Fattening pig farm’ contributed 22% of the photochemical smog poten-tial, and out of this 79% could be ascribed to ‘Non-Methane Volatile Organic Compounds’ (NMVOC) deriving from the fossil fuel. Methane emitted from the slurry also contributed to photochemical smog potential. Considering the entire product chain of pork, the major con-tributor was NMVOCs, which contributed 86%. 3 Options for improvements in the product chain of pork
As described in the previous chapter the N compounds (nitrate, ammonia and nitrous oxide) are important pollutants, and the emissions of these pollutants must be reduced if the goal is to improve the environmental profile of pork. There are several ways of reducing these emis-sions (Paper 3, Grant & Waagepetersen, 2003; Oenema et al., 2006; Taminga 2003). For ex-ample the addition of digestibility-improving enzymes to the feed can improve the absorption of e.g., energy and protein, hence decreasing the amount of feed required for producing an equal amount of meat, as explained in Paper 4. Another option is to change the slurry han-dling by for example anaerobic digestion or separation of the slurry, as shown in Paper 5. In the following two sections I will analyse how and to what extent the environmental profile of pork can be improved by addition of digestibility-improving enzymes to the feed and by using slurry technologies. Obviously, several other options for improving the environmental profile of pork exist, but these were outside the scope of the present study. 3.1 Improving the digestibility of the feed Feed and slurry production are important environmental hotspots in the product chain of pork, as stated in the previous chapter. The feed digestibility is a key parameter for achieving reduc-tions in both the feed consumption and slurry excretion per pig produced. The feed digestibil-ity, in terms of kg feed consumed per kg pig produced, was on average 2.67 for Danish fat-
26
teners in 2005, and is thus 3% better compared to 2002 and the second best within Europe, only exceeded by the Netherlands (Sloyan et al., 2006). Means of improving the feed digesti-bility are, for example, more accurate feeding or the addition of enzymes to the feed. In Den-mark the enzymes xylanase and phytase are often applied to pig feed. Xylanase improves the digestibility of nutrients (proteins) and energy (Tybirk, 2005b; Moehn et al., 2007), whereas phytase improves the digestibility of P (Tybirk, 2005a). In chapter 2 it was concluded that the N compounds nitrate, ammonia and nitrous oxides played major roles. But to what extent can xylanase contribute to improvement of pork’s environmental profile? In Paper 4 an environmental assessment of xylanase was conducted, using the consequential LCA approach. Xylanase is widely used in the pig sector and has penetrated about 30% of the feed market in Europe (Paper 4), and Tybirk (2005b) estimated that fattening pigs can be fed 3% less feed and still produce the same amount of meat if xylanase is added to the feed. In chapter 2 it was stated that the feed production was an environmental hotspot and therefore reduction of feed consumption per pig will obviously be environmentally beneficial. In Paper 4 it was assumed that addition of xylanase to the feed reduced the pigs’ feed demand by 2.5% without reducing the amount of meat produced. Furthermore it was assumed that the feed with xylanase had a lower soybean meal and fat content, but a higher content of barley. These assumptions were based on modelling with software used in practical animal feed op-timisation procedures. Further details regarding methodology and data sources are explained in Paper 4. Less protein consumed per unit pig produced resulted in less excretion of N in slurry, and thus less ammonia, nitrous oxide and nitrate was emitted from the pig housing, the slurry storage and from the fields. However, the lower N content in the slurry resulted in a smaller replace-ment of artificial fertiliser, which again resulted in more use, transport and production of arti-ficial fertiliser and hence an increased environmental impact. The manufacturing and trans-port of the enzyme xylanase also had an effect on the environment (Nielsen et al., 2007). Nevertheless, the environmental advantages of the use of xylanase (reductions in feed con-sumption and slurry production) were, in general, larger than the disadvantages (increased production and transport of xylanase and artificial fertiliser). So, according to Paper 4, it can be concluded that in environmental terms the negative aspects of xylanase did not cancel out the positive aspects. But to what extent can the environmental profile of pork be improved? If results from Paper 3 are combined with the results from Paper 4, a rough estimate can be given. In Paper 4 the functional unit was not one kg pig meat as in Paper 3. The scope in Paper 4 was to provide an assessment of the changes in environmental impacts when switching from producing one tonne of feed without xylanase to a nutritionally equivalent (but reduced quantity) of feed. Therefore, only emissions that were affected by the change in feed were quantified and in-
27

cluded in the calculations. For example, figure 3 (in Paper 4) showed that 77 kg CO2-eq. (78-0.6) could be saved if one tonne feed without xylanase was substituted with feed with xy-lanase. This corresponds approximately to 0.185 kg CO2-eqs. per kg meat. According to Pa-per 3, the global warming potential was 3.5 kg CO2-eq. per kg pork (carcass weight from farm gate (table 5 in Paper 3)). Consequently, combining the results from papers 3 and 4, it ap-peared that the global warming potential per kg pork could be reduced by approximately 5%, with an addition of xylanase to the pig feed. This reduction in global warming due to addition of xylanase was to a large extent driven by the reduced use of soybean meal (reduced emis-sions of nitrous oxide from soybean fields). However, the reduction in eutrophication poten-tial induced by application of xylanase is less than 1% and therefore very limited. It should be noted that EcoIndicator 95 (version 2.03) was used in the assessment of the di-gestibility-improvement factor xylanase in Paper 4. The characterization factors for the two important greenhouse gases (nitrous oxide and methane) are lower in EcoIndicator 95 com-pared to EDIP97. Nitrous oxide is 270 (EDIP97) versus 320 g CO2/g (EcoIndicator), while methane is 11 versus 25 g CO2/g. In order to secure consistent comparisons, the results form Paper 4 were characterized by using EDIP 97, before they were combined with the results form Paper 3. In a recently published study by Moehn et al. (2007) a tendency for increased methane pro-duction from xylanase-supplemented diets was observed. Methane is a greenhouse gas and therefore some of the reduction in greenhouse gas emissions due to the use of xylanase (Paper 4) might be partly counterbalanced. Another digestibility-improving enzyme is phytase. Phytase application to the pig feed im-proves the P digestibility (Tybirk, 2005a; Moehn et al., 2007), and therefore less mineral P can be added to the feed and less P will be excreted in the slurry. A study by Nielsen & Wenzel (2006), who used the consequential LCA approach, showed that if mineral feed was applied to the feed, the global warming, acidification and nutrient enrichment potentials would be respectively 17, 110 and 700 times higher compared to a situation where phytase was applied to the feed . The production of mineral P feed required considerably more energy than phytase did and this was the reason for the lower global warming potential when phytase was used. But according to Paper 3 the contribution to global warming potential from the pro-duction of mineral P for feed is only 0.44% and is therefore not even presented in Paper 3. So if the global warming potential per kg pork is to be reduced, the most obvious place to start is not with the use of phytase. However, the effect of phytase on reduced phosphate leaching cannot be ignored. These two examples with xylanase and phytase show how the addition of enzymes to the feed can improve the digestibility of the feed and how this to a larger or smaller extent can effect the environment. Improved digestibility can also be obtained without the use of enzymes, and
28

just with improved farm management. Another way of improving the environmental profile of pork is to optimize the handling of slurry, as it will be explained in the following. 3.2 Improving the slurry handling Slurry was identified as an environmental hotspot in the product chain of pork (Paper 3), and it contributed to both global warming (because of nitrous oxide), acidification (because of ammonia) and eutrophication (because of nitrate, ammonia and phosphate). Moreover, in Pa-per 4, it was shown how the environmental impacts of slurry could be reduced if xylanase was applied and thus reducing the N content in the slurry. So slurry is a major player in the pig sector’s impact on the environment. Different types of slurry technologies exist, and they are increasingly used on Danish pig farms (Birkmose, 2007). One of the technologies is slurry separation, and its potential for en-vironmental improvements was analysed in Paper 5. Slurry separation is a technology where the raw slurry is separated in a decanter centrifuge, which separates the solids from the liquid. The solid fraction (from now on designated the ‘fibrous fraction’) contains straw and fibre from pig dung and pig hairs, while the liquid fraction contains most of the water and pig urine. The liquid fraction has high N and low P contents compared to the fibrous fraction (Pa-per 5). In Paper 5 it was concluded that if slurry separation was used on pig farms with a high live-stock density and the fibrous fraction was exported from the pig farms, it had the potential of reducing the environmental impact. The amount of slurry transported could be reduced by 37% and the amount of P applied to the fields at the pig farm could be reduced by 82% com-pared to a situation where no slurry separation was performed. However, these environmental improvements required that the slurry separation plant separated efficiently, and this was not the case at the two private pig farms from where data were collected. The separation efficien-cies were low at these farms, resulting in an only 25% reduction in the amount of P applied per hectare at the pig farm. Slurry separation is a newer technology than anaerobic digestion and obviously there are en-vironmental problems that need to be solved. For instance, 22% of the fibrous fraction pro-duced from slurry separation in Denmark has no purchaser (Birkmose, 2007). Presumably many of the cash crop farms that could import the slurry find it easier and safer to purchase artificial fertiliser. Thus the environmental advantage of cash crop farmers using less artificial P fertiliser is lost. Companies producing artificial fertiliser (e.g., Kemira Grow How, DLG) have tried to convert the fibrous fraction to a product that resembles artificial fertiliser, with the intention of selling this product to farmers who normally purchase artificial fertiliser (Hinge, 2003). However, the cost of the processing is so high that it not is profitable for the companies to process the fibrous fraction (Hinge, 2003). The costs of processing the fibrous fraction could presumably be reduced if more of it was produced, but at the same time prob-lems with disposal of a large fibrous fraction may be a barrier for farmers who contemplate
29

investing in slurry separation plants. This is obviously a dilemma. Another problem regarding the fibrous fraction is that there might be substantial losses of N and carbon when heaped. Pe-tersen & Sørensen (submitted) quantified N and carbon losses from fibrous fraction heaps at the two private farms studied in Paper 5. They found that the losses of ammonium-N, total-N and carbon during storage of the fibrous fraction were in the range 30-90%, 10-55% and 35-70% of the initial amount, respectively. A significant proportion of the N losses was assumed to be ammonia, and part of it might have been nitrous oxide, whereas the C losses were in the form of CO2 or methane. This means that from the storage of the fibrous fractions at pig farms there is a risk of emission of pollutants that contribute both to global warming, acidification and eutrophication potentials. However, the level of these emissions is not known, and it is therefore difficult to assess how important these emissions are in relation to the other parts in the product chain of pork. In Paper 5 it was furthermore concluded that if biogas from anaerobically digested slurry was used for heat and power production and thus substituting fossil energy, considerable amounts of greenhouse gases could be saved. It was shown that if all the slurry from a pig was used for energy production (and accordingly as fertiliser) the greenhouse gas emission per kg pork (carcass weight) could be reduced by 16%. The potential for reducing the greenhouse gas emissions was many times higher if the slurry was anaerobically digested compared to a situa-tion where it was separated. So seen in relation to global warming, anaerobic digestion was not only better than slurry separation, but it also offered the opportunity to reduce the global warming potential per pig considerably. On the other hand, anaerobic digestion did not change the nutrient contents (and not the P/N ratio) in the slurry, so it did not have the same potential for reducing the P loads on the pig farm that slurry separation had (Paper 5) 4 Considerations regarding LCA of agricultural products
The purpose of this chapter is to discuss the strengths and weaknesses of LCA. First I will compare LCA to other environmental indicators, and then discuss some aspects on the use of consequential modelling. Finally, the weak points of quantification of pollutants in LCA will be highlighted. 4.1 LCA in comparison with other environmental indicators A distinction between the area-based and product-based environmental indicators was made in chapter 1, and the product-based environmental indicators ‘Food miles’ and ‘Carbon foot-print’ were mentioned. ‘Food miles’ is a term which refers to the distance food travels from the farm to the consumer (Smith et al., 2005) and is used as an environmental indicator for food products. It has gained much attention in the debate, especially in Great Britain (e.g., Smith et al., 2005). ‘Food miles’ is used not only as an indicator of environmental sustainabil-ity, but also of economic and social sustainability (Smith et al., 2005). But the question is to what extent reduction in food miles will increase the environmental sustainability. In this study it was shown that the contributions from transport of pork to the global warming poten-
30

tial were 1%, 3% and 5% if the pork was transported from Horsens Slaughterhouse in Den-mark to Harwich (Great Britain), Munich (Germany) and Tokyo (Japan), respectively. A similar conclusion was made for soybean meal in Paper 2. Although the soybean was trans-ported from Argentina to the Netherlands, the contribution to global warming potential was higher from the soybean cultivation (primarily because of nitrous oxide) than from the trans-port. Moreover, the contributions from lorry (transport of soybeans in Argentina (500 km)) and ship (shipping of soybean meal from Argentina to Rotterdam in the Netherlands (12,082 km)) were very similar, despite the large differences in distances. Thus the contribution from transport to global warming was low compared to the contribution form the pig farms and the fields mainly because nitrous oxide is a very strong greenhouse gas and emitted in consider-able amounts. Moreover, ‘Food miles’ can be misleading because the transport mode (ship, aircraft or lorry) is often not included in the calculations. For example, transport by lorry emits considerably more CO2 than transport by ship (EcoInvent Centre, 2004). So if ‘Food miles’ is to be used as an environmental indicator, it is crucial to divide it into mode of trans-port, for example, ‘ship food miles’ and ‘lorry food miles’. ‘Food miles’ is an inadequate en-vironmental indicator. If the attention is to reduce the greenhouse gas emissions, focus should not be set on reduction of food miles, but on the real environmental hotspots. ‘Carbon footprint’ is another environmental indicator, which is used in various forms (Wied-mann & Minx, 2007), and it must be used with care if applied to food products. If nitrous ox-ides and methane are not included in the calculation, the food product’s impact on global warming will be underestimated and comparison of products might give a misleading result. However, the environmental indicators ‘Food miles’ and ‘Carbon footprint’ have one large advantage: they are much easier to communicate to people who have no knowledge of envi-ronmental issues. The term ‘Food miles’ has associations of polluting aircrafts or ships and the term ‘Carbon footprint’ has associations of a footprint that harms the nature and therefore should be minimized. Both terms are easy to visualize for the consumers and have a ‘feel good factor’. In contrast, the term ‘Life Cycle Assessment’ is difficult to visualize and does not necessarily guide the thoughts to environmental issues. Understanding the LCA method-ology is not straightforward for people without environmental knowledge, primarily, because LCA operates with several environmental impact categories (e.g, acidification, toxicity, global warming) and units (e.g., SO2 equivalents, person equivalents) that are more difficult to understand. Moreover, an LCA-based comparison of two products will often conclude that product A in comparison with product B, is better in one impact category, but worse in an-other. Most people will presumably prefer a clearer judgement, and this can be provided by ‘Food miles’ and ‘Carbon footprint’, because they only operate with global warming. Nevertheless, an important quality in LCA is that it offers the opportunity of assessing several types of environmental impacts (acidification, global warming etc) for a product. It makes it easier to assess whether mitigation of one type of emission implies an increase in other types of emission. An example could be acidification of slurry which reduces ammonia emission
31

(Kai et al., 2007). If only one environmental indicator, e.g. ammonia loss per animal, is calcu-lated, the slurry acidification will be defined as ‘beneficial for the environment’. But maybe acidification of slurry would not be beneficial for the environment if the contribution to eu-trophication and global warming was also assessed. What is, for example, the environmental impact of producing the acid? Will more nitrate be leached from the fields because the slurry contains more N due to reduction of ammonia losses? Will more greenhouse gases be emitted, because the lime production is increased in order to raise pH in the soil? Agricultural systems are complicated and there is a large danger of pollution swapping if decisions are taken on too narrow a basis. Holistic environmental indicators, as those established by LCA, must be the basis in order to prevent undesired effects. In Paper 1 (table 6), several area-based environmental indicators (N-surplus per ha, P-surplus per ha, ammonia emissions per ha, etc.) were presented, and it should be emphasized that these environmental indicators are still usable and should not be substituted by LCA-based environmental indicators. For regions with intensive agricultural production or vulnerable natural habitats it is important to know the amounts of pollutants emitted in that specific area, and not very relevant whether the production results in e.g. phosphate leaching in other parts of the world. On the other hand, area-based indicators cannot stand alone if greenhouse gas emissions are to be reduced. Area-based and LCA-based indicators can supplement each other in identifying the environmental hotspots, both in a local and a global context. An obvious strength of LCA is that the methodology is well developed, it has been used for decades, much software with data bases and life cycle impact assessment methods is avail-able, and the methodology is ISO standardized. However, although LCA is well described, there are still two very distinct ways of modelling an LCA – the attributional and the conse-quential approach, as described in chapter 2. In this thesis I have applied the consequential approach and in the following section some of the aspects regarding the use of consequential LCA will be discussed. 4.2 Consequential LCA In chapter 2 (section 2.1) two important main characteristics of the consequential approach were described. The first was how the consequential approach seeks to model the technology (or process) actually affected by a change in demand, and the second was how system expan-sion is used to avoid allocation. In the following some examples of how these characteristics are applied in this study are presented. Furthermore, the advantages and disadvantages of con-sequential modelling will be discussed. Example 1: Incorporation of slurry exchange between farms in LCA In this example it will be described how the consequential approach has been used to avoid al-location and to include the negative and positive aspects of slurry production. To a large ex-tent the text is similar to a paper (Dalgaard & Halberg, 2007) I presented at the ‘5th Interna-tional Conference ‘LCA in foods’ in Sweden’.
32

Slurry affects the environment negatively because it causes emissions of ammonia, nitrous oxide, nitrate and phosphate, both during storage and when the slurry is applied as fertiliser to field-grown crops. On the other hand, slurry might also contribute positively to the environ-ment, if it substitutes artificial fertiliser or is used for energy production and thus substitutes fossil fuel (Paper 5). In an integrated farming system where slurry is recycled to feed crops only, it does not matter whether slurry emissions are allocated to the pigs or the feed crops, since the environmental burden will be allocated to the pigs in any case. But when slurry is used in cash crop production, whether on the pig farm itself or after export to another farm, then the question of allocation of emissions from handling slurry arises. In order to facilitate comparisons of LCAs on agricultural products it is important to have clear and transparent methods. Using the consequential modelling principles a framework for handling of slurry in LCA is presented. The objective is to establish a framework for handling livestock slurry in LCA, and thereby give answers to the following question: How to account for emissions from slurry in an LCA of livestock products? Shall the environmental impact from slurry be ascribed to the pig or the cash crops to which the slurry is applied? Following the consequential methodology the start-ing point is ‘What is affected by a change in demand? In this context it can be stated that an increased demand for pork results in an increased production of slurry. The emissions from this extra slurry are logically an environmental burden on the pork regardless of whether it is used on the farm itself or exported. Consequently, all the extra emissions arising from using the pig slurry in cash crop production should “burden” the environmental profile of the live-stock products. On the other hand, this environmental cost should be deducted any saved emissions arising in the cash crop production from replaced fertiliser. Thus, the principles of using systems expansion for handling co-products in LCA are followed (Weidema, 2003). Consequential LCA modelling was therefore performed, which included the slurry related emissions on the cash crop farm and the avoided production of artificial fertiliser. Calculation of the emissions from pig housing, storage and field was based on Paper 1. The amount of avoided artificial fertiliser is based on data from the Danish Environmental regulation. The Danish regulation stipulated that for each 100 kg of N applied in pig slurry to a crop the fertil-iser should be reduced by 60 kg N compared to the public norm for the particular crop on the particular soil type. The second methodological choice was that if the slurry was used for biogas production, the net benefit in terms of avoided CO2 emissions – and any other avoided emissions – were de-ducted from the environmental assessment of the pig products. The inventory and characterized results per kg slurry-N exported from a pig farm to a cash crop farm are presented in table 1. Each kg slurry-N exported from the farm results in an avoided production of 600 g artificial fertiliser-N, and extra emissions of N and fossil CO2. Using slurry on cash crops instead of fertiliser in cash crops creates more emissions of N
33

(ammonia, nitrous oxide and nitrate), contributing to several environmental impact categories. It does not seem satisfactory to leave this as an extra burden on the cash crops. Table 1. Inventory and characterized results of 1 kg slurry-N exported from a pig farm to a cash crop farm under Danish conditions. Inventory for ‘1 kg slurry-N from pig farm’ Artificial fertiliser, g N 600Ammonia emitted, g N 69Nitrous oxide emitted, g N 21Nitrate emitted, g N 310Sum, g N 1000Characterized results for ‘1 kg slurry-N from pig farm’ Global warming potential, g CO2-eq. 578Eutrophication potential, g NO3-eq. 1750Acidification potential, g SO2-eq. 133
The method presented predicates that these emissions should burden the livestock products, but only after a proper systems expansion model has been established. Above it was presented how this may be done relatively easily. Due to the detailed Danish requirements for a propor-tion of fertiliser N to be replaced by slurry N there was a transparent reference for calculating avoided CO2 and N emissions from saved fertiliser. In countries where this is not the case there is a need to develop an approach building on representative data regarding the degree of fertiliser replacement from slurry in the farming systems in question. The method is easy to apply and gives a coherent methodological alternative to simple (or no) allocation. Both the drawbacks (emissions from housing, storage, fields, transport) and the benefits (e.g. avoided production of artificial fertiliser and fossil energy) must be included. The pig is allocated the burden from the slurry-related emissions on the cash crop farm, but the pig also benefits from avoided production of artificial fertiliser and fossil energy. In the example described above, the system is expanded and the avoided production of artifi-cial fertiliser included, and thus the approach completely follows the principles of consequen-tial modelling. However, this system expansion, where the avoided productions are included, is not only used by LCA-researchers devoted to the use of consequential LCA (e.g., Weidema (2003); Schmidt (2007); Thrane (2006; 2005); Halberg et al. (submitted), but also by other LCA-researchers (Williams et al., 2006; Lopez-Ridaura et al., 2007), simply because it is ob-vious that slurry is a valuable fertiliser, which makes it possible for the farmer to save some artificial fertiliser. Thus slurry reduces the environmental impacts arising from production and distribution of artificial fertiliser.
34

Example 2: How data collection can be diminished due the consequential approach In chapter 2 I described how the consequential approach seeks to model the technology (or process) actually affected by a change in demand. An example with electricity was given, where only the electricity sources affected by a change in demand are included in the model-ling, whereas in the attributional approach the electricity consumption is often modelled as an average of all electricity sources within the region. In the example with electricity it is clear that the data collection for the consequential approach is easier because only the ‘marginal’ electricity source (for example coal-based electricity) is relevant. Similar to data collection for electricity, the data collection for feed mixtures is easier when using the consequential ap-proach, because only the ‘marginal’ feed ingredients are relevant. Although it is more compli-cated compared to the electricity example. In the electricity example one kWh is one kWh ir-respective of whether the primary energy source is coal or wind. A typical feed mixture for pigs, on the other hand, contains various ingredients (e.g., barley, soybean meal, rape seed meal, rape seed expeller, palm kernel expeller, soybean oil), and all these ingredients differ in their protein and energy content. In attributional modelling it would be necessary to provide LCA-data on each of these ingredients (e.g., Thomassen et al., 2007; Cederberg & Flysjö, 2004), while in the consequential modelling only LCA-data on the ingredients actually af-fected by a change in demand are relevant. The marginal protein source is soybean meal, meaning that an increased demand for pig feed (and thereby protein) will affect the soybean meal production and not, for example, the rape seed meal production, because soybean meal is the fastest expanding on the market (Paper 2). Demand for soybean meal has increased faster than total meat production, implying a net increase in the use of soybean meal per unit of meat produced (Steinfeld et al, 2006, p. 43). The examples show that data collection can in some cases (e.g., electricity and feed ingredi-ents) be reduced if consequential modelling is used instead of attributional modelling, al-though Curran et al. (2005) and Heijungs & Guinée (2007) state that the consequential model-ling requires more data. In some cases they are right. For example in the LCA of soybean meal (Paper 2), where the consequential approach required more data, because the increased demand for soybean meal resulted in avoided production of palm oil. Then suddenly LCA data on palm oil production was required to perform an LCA on soybean meal. So whether one approach requires more data than the other depends on the defined system in the respec-tive LCA, and no fixed rule can be established. Allocation is one of the most sensitive issues in LCA methodology (Guinée, 2002). In conse-quential LCA, allocation is ‘systematically’ avoided and this is obviously and advantage be-cause it increases the quality of an LCA. An example is the allocation of environmental im-pacts from the co-production of milk and beef. Should the allocation factor be related to the mass, the protein content, the energy content or the prices of the two products? I think the use of allocation factors is an arbitrary solution, which creates arbitrary results. In many cases the choice of allocation factor affects the result significantly. For example, in Paper 2 (table 5)
35

where allocations based on mass and economy were performed. The global warming potential per kg soybean meal increased by 24% when mass allocation was used instead of economy. An argument against the consequential approach is that the degree of uncertainty in identifica-tion of marginal products is too large (Heijungs & Guinée, 2007). To some extent it is right that identification of the marginal technology is not always straightforward. In Denmark there has, for example, been an on-going discussion on whether ‘marginal’ electricity is based on natural gas or coal. Is the marginal electricity technology the one that will be affected if a change in demand appears ‘tomorrow night’, or is it the one that will be affected if a change in demand appears for a number of years? A challenge for the researchers working with con-sequential modelling is obviously to make it more transparent how the marginal products (or technologies) can be identified, as this is often difficult for outsiders to understand. But it should be emphasized that although the identification of marginal products (or technologies) is uncertain, it is still much more preferable to using arbitrary allocation factors as is done in attributional LCA. The attributional and consequential approaches are fundamentally different, not only seen in relation to allocation and system expansion. In the attributional approach the aim is to quan-tify the environmental impacts from the average products (e.g., average pig, average electric-ity), and it seeks to partition the environmental burden between the products coming from the same process (e.g., beef and milk). In contrast, the consequential approach seeks to estimate the environmental impact of products produced in the future. For example, in this thesis it is concluded that an increase in Danish pig production will increase not only the emissions of pollutants, but will also affect the soybean and oil palm production. 4.3 Quantification of emissions In LCAs of agricultural products several pollutants are quantified and considerable quantities are emitted from biological systems (e.g., slurry, fields). The uncertainties in the quantifica-tion of some of the pollutants are high. This is especially the case for nitrous oxide, phosphate and CO2 emitted from land-use changes. Issues regarding the quantification of these three pol-lutants will be briefly discussed in the following. Nitrous oxide In this study the guidelines from the Intergovernmental Panel of Climate Change (IPCC, 2000) were used to quantify the nitrous oxide emissions from the slurry and fields. In the LCA of pork it was shown that 72% of the greenhouse gases (measured in CO2-eq.) emitted were nitrous oxides (figure 7), whereof most was emitted from the denitrification of leached nitrate or from artificial fertiliser-N applied to the fields. In the LCA of soybean meal (Paper 2) nitrous oxide was also the largest contributor to global warming potential. Consequently, nitrous oxide is important. Unfortunately, a closer look at the nitrous oxide emission factors in the guidelines from IPCC (2000), revealed that the emission factor (part of N lost as nitrous oxide) is 1.25% for both crop residues, artificial fertiliser-N applied to field, slurry-N applied
36

to field and N fixation by crops, and that the uncertainty ranges for the many emission factors are in the interval -50% to 100%. This indicates that the method for calculating nitrous oxide losses from agricultural systems is simplified and highly uncertain, and in future LCAs of ag-ricultural products it would be worthwhile to analyse if a more detailed (and site-specific) methodology exists on the quantification of nitrous oxide emissions from fields and slurry. Crutzen et al. (2007) argue that the emission factors from IPCC on nitrous oxide losses from artificial fertiliser-N, slurry-N and crop residues were significantly underestimated and should be more than twice the amounts stated. However, if these higher emission factors suggested by Crutzen et al. (2007) were applied to the LCA of soybean meal (Paper 2) and LCA of pork (Paper 3), the conclusions regarding environmental hotspots would not be changed but only strengthened, because nitrous oxide emissions had already been identified as environmental hotspots in relation to global warming potential. LCA is increasingly used in environmental assessment of agricultural production, and in order not to reach wrong conclusions, it is crucial that the methodology for quantifying nitrous ox-ide emissions from agricultural systems is developed and improved. Phosphate In this study the amount of phosphate leached was quantified calculating the P surplus and then assuming that phosphate leaching was directly proportional to the P surplus (figure 5). This means that farms with a high P surplus also had high phosphate leaching levels as shown in Paper 1 (tables 6 and 7). The assumption regarding direct proportionality between P surplus and P leaching is simple, because livestock farms, in general, have higher P surpluses (Paper 1) and therefore the P binding capacity of the soils will be used up on the livestock farms be-fore the arable farms. As shown in figure 3, the livestock is centralised in specific regions, which means that the high P surpluses are also centralised in specific regions. Additionally, the areas in Western Jutland are also sandier, and sandy soils, in general, have a lower P bind-ing capacity (Dalgaard & Rubæk, 2005). Therefore, there are reasons to believe that there is a higher risk of phosphate leaching from the livestock intensive areas, and especially those in Western Jutland. The soils in these areas have had P applied in excess for many years, thus leading to higher risk of phosphate leaching because the phosphate-binding capacity has been used up. Therefore it would be preferable if phosphate emissions could be quantified in a more site-specific context, which could take into account that P surpluses and phosphate leaching are not directly proportional. This would presumable lead to a higher eutrophication potential per kg pork. More phosphate would be leached on the pig farm, but maybe less would be leached from the fields where the feed grain is cultivated. Phosphate only contributed 3% to the eutrophication potential (section 2.5 and Paper 3) and not to any other of the environmental impact categories. This could wrongly lead to the con-clusion that phosphate leaching from the fields is not an environmental problem, and initia-tives to reduce the phosphate leaching from pig farms are unnecessary. But phosphate leach-
37

ing is an environmental problem in Denmark (Poulsen & Rubæk, 2005; Kronvang et al., 2001; Anonymous, 2004), and a reduction of phosphate leaching is needed. As described in chapter 1, P is the limiting factor for algal bloom in most Danish lakes (Kronvang et al., 2001). That phosphate emissions are overlooked in an LCA of pork is a consequence of the characterization, in which nitrate (and ammonia) becomes dominating. This highlights that LCA-based environmental indicators should not stand alone but be supplemented with area-based indicators, as for example P surplus or phosphate leached per hectare. Moreover, it would improve the quality of LCAs on agricultural products if site-specific characterization factors could be developed for phosphate. CO2 from land-use changes Paper 2 described how the soybean area in Argentina is rapidly expanding at the expense of natural habitats. When natural areas (e.g., forest, savannah) are converted to soybean fields, organic carbon from above ground (e.g., stems) or from the soil will be degraded and CO2 emitted. Logically, an increase in demand for Danish pork will therefore result in increased CO2 emission, because of land-use changes in Argentina. Nevertheless, the emissions from land changes are not included in the LCAs of soybean meal (Paper 2) or pork (Paper 3). But in Paper 2, it was roughly estimated that the global warming potential per kg soybean meal would increase dramatically from 0.7 to 5.7 kg CO2-eq. per kg soybean meal if the carbon re-leased due to land-use changes was included. This changes the picture of the environmental hotspots in the product chains of soybean meal and pork completely. On the other hand, in the product chain of pork there will presumably also be parts where more organic carbon is in-corporated into the soil. For example, if more pigs are produced, then more slurry is excreted, and if this slurry is used at cash crop farms instead of artificial fertiliser-N, there might be an increase in soil carbon status at the cash crop farm. So if CO2 emissions from soil should be included, it should be performed consistently, and not only in one single segment of the prod-uct chain. Other large methodological gaps still exist (discount period, driving forces of de-forestation, estimates of changes in above and below-ground carbon content as discussed in Paper 2) before it can sensibly be included in an LCA of livestock products. However, there is no doubt that land-use changes contribute significantly to global greenhouse gas emissions, and that they may be one of the largest problems of the world’s fast growing livestock sector. Steinfeld et al. (2006) estimated that livestock related land-use changes may emit 2.4 billion tonnes of CO2 per year. This value exceeds both the annual emission of nitrous oxides (2.2 billion tonnes CO2-eq.) and methane (2.2 billion tonnes CO2-eq.) from livestock activities. This indicates that CO2 emitted as a consequence of land-use changes is a large environmental hotspot, and that one of the next improvements in the methodology of LCA of agricultural products should be to include these aspects consistently. 5 Suggestions for improved environmental regulation of the pig sector
In chapter 1 it was explained how the ‘Nutrient farm account’ system limits the use of slurry-N and artificial fertiliser-N in the agricultural sector. The ‘Nutrient farm account’ system en-
38

courages the farmers to treat their slurry with care in order not to loose its fertiliser value. If – for example – a large part of the N from the slurry is vaporised (e.g. because of an uncovered slurry tank) before it is applied to the fields, there will be less N available for the plants and the yields will be lower. Accordingly, it is profitable for a farmer to minimize the N losses. This is how it is supposed to work, but as for all other managing directors, some farmers are better managers than others, also when it comes to nutrient management. In this thesis it was shown how N, in its different forms (nitrate, nitrous oxide and ammonia) is a major polluter in the product chain of pork. So even though the ‘Nutrient account system’ was launched with the intention of reducing eutrophication of the aquatic environment, it will hopefully lead to reduced acidification and global warming, because a more efficient use of N might also reduce the ammonia and nitrous oxide emissions. Unfortunately, a similar ‘Nutrient farm account’ system is not used for the regulation of P. If the farmers were only allowed to apply a certain amount of P per hectare, the phosphate leaching would probably be reduced. Another option would be to apply an upper limit on the farmers’ P-surplus per hectare. This would encourage farmers to use the P more efficiently and to limit the amount of P in feed imported to the farm. Obviously, the impact of P on the aquatic environment is problematic (Kronvang et al., 2001; Poulsen & Rubæk, 2005), and might be a big barrier when Denmark has to fulfil the Water Framework Directive’s requirements on the ecological quality in the aquatic environment. However, in the last year several research projects on phosphate pollution from the agricul-tural sector have been started. For example, the effect of farm management (e.g., soil prepara-tion, liming) on the amount of phosphate leached is analyzed. Hopefully, these projects will provide knowledge of the most important factors leading to phosphate leaching, and they will facilitate the identification of areas that are most at risk of phosphate leaching. In 2006 it was possible for farmers to get an up to 40% subsidy from rural development funds if they invested in a slurry separation plant (Frandsen, 2007), and many of the slurry separa-tion plants were built in 2006 (Birkmose, 2007). Why rural development means were used to subsidise the establishment of slurry separation plants is not clear. But as highlighted in chap-ter 3 and Paper 5, there are some environmental problems associated with slurry separation, e.g., low separation efficiencies, N losses from the fibrous fraction, and it can be debated to what extent it is rational that public funds are used for the establishment of technologies, that have unsolved environmental problems and the effect of which are unknown. A thorough en-vironmental evaluation ought to be performed both at farm level and at national level, to en-sure that the subsidies do not support activities that negatively impact the environment. More-over, it must be ensured that the farms separate efficiently, so sufficient P is exported from the farm. On a national level it must evaluated whether the establishment of slurry plants results in increasingly centralisation of the pigs in specific areas. If a pig farmer wishes to expand the pig herd and does not have sufficient farmland, the establishment of a slurry plant will permit
39

the enlargement of the pig herd. Accordingly, the slurry separation plant is used as lever to obtain more pigs in an already pig crowded area. But is that a problem if the fibrous fraction is exported from the pig intensive area to the cash crop farms? Yes, for two reasons: i) the P load per unit area will not necessarily be decreased, if the pig herd is expanding and the P separation efficiency in the slurry separation plant is low, and ii) the ammonia emissions form the housing and storage will be increased if the pig herd is expanded, and slurry separation does not solve this problem. In conclusion, if the use of slurry separation is not environmentally evaluated at farm level and at national level, there is a danger that the technology will be used as a means of expand-ing the pig herd in areas that already have a high livestock density, and thereby causing extra ammonia and phosphate loads in these areas. In the LCA of pork (figure 6) it was shown that greenhouse gases were emitted not only from the pig farm, but also from other parts of the production as for example production, process-ing and transport of feed and artificial fertiliser. In Paper 2 it was estimated that if the green-house gas emission from the production and transport of the soybean meal consumed yearly by Danish livestock was included in the National Greenhouse Gas Inventory, the ‘Danish’ greenhouse gas emissions would be 12% higher. If the CO2 emitted due to land-use changes caused by the soybean expansion in Argentina was also included, it would be much higher. In conclusion, the Danish pig production causes large emissions of greenhouse gases, which are not included in the National Greenhouse Gas Inventory. But should these greenhouse gas emissions from the southern hemisphere be ascribed to the Danish National Greenhouse Gas Inventory? The answer is no, because the difficulties in establishing the National Greenhouse Gas Inventories, which include the emissions from other countries, would be tremendous, and presumably not solve the global warming problem. However, it is crucial that all countries work for greenhouse gas reductions at a global level. A global problem such as greenhouse gas emissions must find a global solution, and this requires holistic approaches, exemplified by life cycle thinking. Take biofuel production: Before starting large scale biofuel production (based on, for example, maize or grain) in Europe with the aim of reducing fossil CO2 emis-sions, it must be analysed to what extent an increased European energy crop production will increase greenhouse gas emissions from other continents. Will energy crops be produced at the expense of feed crops, thus enhancing the import of feed crops from other continents, which again will intensify their agricultural production at the expense of natural habitats and finally resulting in increased greenhouse gas emissions? Action must be taken in order to pre-vent that type of pollution swapping. In the longer term it will be necessary to develop inter-national agreements or legislation that can prevent a country can decrease its greenhouse gas emissions by reducing production (of, for example, gasoline) but increasing import (of, for example, animal feed).
40

6 Conclusion
The most polluting parts of the Danish pork production chain were the farms where the wean-ers (size: 30 kg) and the fattening pigs (size: 100 kg) were produced. These were the two ma-jor contributors to both global warming, eutrophication and acidification potentials. However, the two major contributors to photochemical smog potential were the feed purchased to the farm and production and distribution of electricity and heating oil used on the farm. The con-tribution from transport, processing of the meat and buildings were very limited. The most contributing substances from the product chain of pork were nitrous oxide (53%) and methane (10%) for global warming potential, nitrate (63%) and ammonia (30%) for eu-trophication potential, ammonia (84%) for acidification potential and volatile organic carbons (86%) for photochemical smog potential. Because nitrate, nitrous oxide and ammonia all con-tain N, a more efficient use of N at the pig farms and in the feed production will obviously improve the environmental profile of pork. Addition of the feed digestibility-improving enzyme xylanase to the pig feed was shown to improve the environmental profile of pork. The global warming potential per kg pork could be reduced by approximately 5% if xylanase was added to the feed, whereas the reduction in eutrophication potential was limited. Slurry separation is a technology where slurry is separated into a liquid and a fibrous fraction. It was shown that if the fibrous fraction (which has a high P and low water content) was ex-ported out from the pig farm the amount of slurry transported and P applied at the fields on the pig farm could be reduced by respectively 37% and 82%, compared to a situation where un-separated slurry was exported. However, these environmental improvements required that the slurry separation plants were separating efficiently, and this was not the case at the two private pig farms where data were collected. Substantial reductions (approx. 16%) in green-house gas emissions per kg pork could be obtained if the slurry was anaerobically digested and the biogas was used for heat and power production. On the other hand the anaerobic di-gestion did not change the nutrient contents in the slurry, and had therefore not the same po-tential of reducing the P loads on the pig farms as slurry separation had. LCA is a valuable tool for environmental assessment of livestock products, especially when used in combination with area-based indicators. But there still is a need for developing the methodology used for quantification of nitrous oxide and phosphate emissions. Also quantifi-cation of CO2 emissions related to land-used changes is a great challenge.
41

7 References
Anonymous, 2004. Agreement on the Action Plan for the Aquatic Environment III 2005-2015 between the Danish Government, the Danish People's Party and the Christian Democ-rats. Available on-line at: www.vmp3.dk/Files/Filer/English%20version/engelsk_oversaettelse.pdf.
Anonymous, 2005. Denmark’s Fourth National Communication on Climate Change. Under the United Nations Framework Convention on Climate Change. Available on-line at: http://www2.mst.dk/common/Udgivramme/Frame.asp?pg=http://www2.mst.dk/udgiv/publications/2005/87-7614-890-4/html/kap03_eng.htm.
Anonymous, 2006. Bekendtgørelse om erhvervsmæssigt dyrehold, husdyrgødning, ensilage m.v. Available on-line at: http://147.29.40.91/_GETDOCM_/ACCN/B20060081405-REGL. (In Danish).
Anonymous, 2007a. Norm 2007. Available on-line at: www.agrsci.dk/var/agrsci/storage/original/application/fbf348120e2d6e77166435c9233e78d0. (In Danish).
Anonymous, 2007b. Kyoto Protocol. Environmental Literacy Control. Available on-line at: http://www.enviroliteracy.org/article.php/278.html.
Anonymous, 2007c. LCA tools, services and data. Life Cycle Impact assessment. Available on-line at http://lca.jrc.ec.europa.eu/lcainfohub/lciaPage.vm.
Basset-Mens C., van der Werf, H.M.G., 2005. Scenario-based environmental assessment of farming systems: the case of pig production in France. Agriculture Ecosystems & Envi-ronment 105 (1-2) 127-144.
Basset-Mens, C., van der Werf, H.M.G., Durand, P. & Leterme, P., 2006. Implications of Un-certainty and Variability in the Life Cycle Assessment of Pig Production Systems. Inter-national Journal of Life Cycle assessment 11 (5) 298-304.
Birkmose, T., 2004. Produktblad: Fiberfraktion fra dekantercentrifugering af svinegylle og afgasset gylle. Aktuelt 61-1. Available on-line at: http://www.lr.dk/planteavl/diverse/lpart_061_produktblade_b1.htm (In Danish).
Birkmose T., 2007. Status over anvendelse af gylleseparering i Danmark, februar 2007. Ak-tuelt 108. Available on-line at: http://www.lr.dk/planteavl/informationsserier/aktuelt/pl_aktuelt_07_108.htm. (In Dan-ish).
Cederberg, C. & Flysjö, A., 2004. Life Cycle Inventory of 23 Dairy Farms in South-Western Sweden. SIK report. Available on-line at: www.sik.se.
Cederberg, C. & Mattsson, B., 2000. Life cycle assessment of milk production - a comparison of conventional and organic farming. Journal of Cleaner Production 8, 49–60.
Crutzen, P.J., Mosier, A.R., Smith, K.A & Winiwarter, W., 2007. N2O release from agro-biofuel production negates global warming reduction by replacing fossil fuels. Atmos-pheric Chemistry and Physics Discussions 7, 11191-11205.
Curran, M.A., Mann, M. & Norris, G., 2005. The international workshop on electricity data for life cycle inventories. Journal of Cleaner Production 13, 853-862.
42

Dalgaard, R. & Halberg, N., 2007. How to account for emissions from slurry? Who bears the burden? Proceedings from the 5th International Conference ‘LCA in foods’, 25-26 April 2007, Gothenburg, Sweden.
Dalgaard, R., & Halberg, N., in prep. Environmental assessment of Danish pork. Dalgaard , T, Børgesen, C.D., Hansen, J.F., Hutchings, N.J., Jørgensen, U. & Kyllingsbæk, A.
2004. How to half N-losses, improve N-efficiencies and maintain yields? The Danish case. Contribution to The 3rd International Nitrogen Conference (N2004). Nanjing, China. 12-16 October 2004.
Dalgaard, T. & Rubæk, G.H., 2005. Fosfortilførsel, -ophobning og mætningsgrad i danske landbrugsjorde. In: Fosfor i dansk landbrug. Omsætning, tab og virkemidler mod tab. (Eds.: Poulsen, H.D., Rubæk, G.H.) DJF rapport Husdyrbrug 68, 93-95. (In Danish).
Danish Meat Association, 2007. Statistics 2006. Available on-line at: http://www.danishmeat.dk/smcms/DMA_Home/statistics/statistics_2004/Index.htm?ID=6671&tWebID=111&print=UK.
Danish Statistics, 2007. Statistikbanken. Available on-line at: www.statistikbanken.dk Djf Geodata. 2007. Available on-line at: http://www.djf-geodata.dk/datasaml/index.html. Eggleston, S., Buendia, L., Miwa, K., Ngara,T. & Tanabe, K., 2006. IPCC Guidelines for Na-
tional Greenhouse Gas Inventories. Volume 4. Agriculture, Forestry and Other Land Use. Intergovernmental Panel on Climate Change.
Eriksson, I.S., Elmquist, H., Stern, S. & Nybrant, T., 2005. Environmental systems analysis of pig production - the impact of feed choice. International Journal of LCA 10(2) 143-154.
European Commision, 2003. Communication from the commission to the council and the European parliament. Integrated Product Policy. Building on Environmental Life-Cycle Thinking. COM(2000) 302 final. Available on-line at: http://www.aeanet.org/forums/IPPfinalcommunication18June2003.pdf.
FAO, 2007. Key Statistics of food and agriculture external trade. Available on-line at: http://www.fao.org/es/ess/toptrade/trade.asp.
FAPRI, 2006. World Meat: FAPRI 2006 Agricultural Outlook. Available on-line at: http://www.fapri.org/outlook2006/text/15Livestock.pdf.
Frandsen, T.Q., 2007. Økonomien i gylleseparering og afbrænding. In Proceedings from ’Se-minar om gylleseparering og afbrænding af husdyrgødning. DLBR. Biogas og Gyllese-parering.’. (In Danish).
Frederiksen, R, 2004. Life Cycle Assessment. A general introduction. Available on-line at: www.lcafood.dk/LCA/LCA.htm.
Grant, R. & Waagepetersen, J., 2003. Vandmiljøplan 2. Slutevaluering. Available on-line at: www.vmp3.dk/Files/Filer/Slutrapporter/VMPII_Slutevaluering_web.pdf.
Guinée, J.B. 2002. Handbook on Life Cycle Assessment. Operational guide to the ISO stan-dards. Kluwer Academic Publishers. ISBN 1-4020-0228-9.
Halberg, N., Kristensen, E.S. & Kristensen, I.S., 1995. Nitrogen turnover on organic and con-ventional mixed farms. Journal of Agriculture Environmental Ethics 8 (1), 30–51.
43

Halberg, N., van der Werf, H.M.G., Basset-Mens, C., Dalgaard, R. & de Boer, I.J.M., 2005. Environmental assessment tools for the evaluation and improvement of European live-stock production systems. Livestock Production Science 96, 33-50.
Halberg, N., Dalgaard, R. & Rasmussen, M.D., 2006. Miljøvurdering af konventionel og øko-logisk avl af grøntsager: Livscyklusvurdering af produktion i væksthuse og på friland: Tomater, agurker, løg, gulerødder. Arbejdsrapport fra Miljøstyrelsen 5.
Halberg, N., Hermansen, J.E., Kristensen, I.S., Eriksen, J. & Tvedegaard, N., submitted. Comparative environmental assessment of three systems for organic pig production in Denmark.
Haas, G., Wetterich, F. & Geier, U., 2000. Life cycle assessment framework in agriculture on the farm level. International Journal of LCA 5, 345–348.
Heijungs, R. & Guinée, J.B., 2007. Allocation and ‘what-if’ scenarios in life cycle assessment of waste management systems. Waste Management 27 (8) 997-1005.
Helt, H.C. & Rancke-Madsen, E., 1991. Kemi. Gads Fagleksikon. 238 pp. Hinge, J., 2003. Resumé af workshop om afsætning af tørstof fra gylleseparering. Workshop
23. november 2004 hos Dansk Landbrugsrådgivning. Available on-line at www.lr.dk/bygningerogmaskiner/diverse/gs_041201_resume_workshop.htm.
Hvid, S.K., Nielsen, P.H., Halberg, N. & Dam, J., 2005. Miljøinformation i produktkæden: Et casestudie af produktkæde med svinekød. Miljøstyrelsen: Miljøprojekt 1027, 48 pp.
Illerup, J.B., Nielsen, O.K., Winther, M., Mikkelsen, M.H., Hoffmann, L., Nielsen, M., Gyl-denkærne, S., Fauser, P., Jensen, M.T. & Bruun, H.G., 2007. Annual Danish Emission Inventory Report to UNECE. NERI Report (In press): 811.
IPCC, 2000. Good practice Guidance and Uncertainty Management in National Greenhouse Gas Inventories. Chapter 4. Agriculture. 4.1-4.83. IPCC. Available on-line at http:// www.ipcc.ch/pub/guide.htm.
IPCC, 2001. Climate change. The Scientific basis. Available on-line at: http://www.grida.no/climate/ipcc_tar/wg1/index.htm
ISO standard (14044). Miljøledelse – Livscyklusvurdering – Krav og vejledning, Environ-mental Management – Life cycle assessment- Requirements and guidelines. Dansk Standard. 1. Udgave. No. EN ISO 14044:2006.
Jensen, J.D., Andersen, M., Kristensen, K., 2001. A Regional Econometric Sector Model for Danish Agriculture. A Documentation of the regionalized ESMERALDA model. Minis-try of Food, Agriculture and Fisheries. Institute of Food and Resource Economics. Dan-ish Institute of Agricultural Sciences.
Kai, P., Pedersen, P., Jensen, J.E., Hansen, M.N. & Sommer, S.G., 2007. A whole-farm as-sessment of the efficacy of slurry acidification in reducing ammonia emissions. Euro-pean Journal of Agronomy. Available on-line 8 August 2007 at doi:10.1016/j.eja.2007.06.004.
Kristensen, I.S., Halberg, N., Nielsen, A.H., Dalgaard, R., 2005. N-turnover on Danish mixed dairy farms. Part II. In: Nutrient management on farm scale. How to attain policy objec-tives in regions with intensive dairy farming (Eds: Bos, J., Pflimlin, A., Aarts, F., Ver-tés,F.), Report of the first workshop of the EGF Workshop. Available on-line at
44

http://www.nitrogenworkshop.org/PDF/Rapport_83_drukversie.pdf Plant Res. Int. 83, 91-109.
Kristensen, I.T. & Hermansen, J.E., 2002. Produktionens strukturmæssige og geografiske for-deling. In: Landbrugsstruktur og miljøforhold for svineproduktionen i Danmark (Ed: Hermansen, J.E.) DJF rapport Husdyrbrug 43. (In Danish).
Kronvang, B., Iversen, H.L., Jørgensen, J.O., Paulsen, I., Jensen, J.P., Conley, D., Ellermann, T., Laursen, K.D., Wiggers, L., Jørgensen, L.F. & Stockmarr, J., 2001. Fosfor i jord og vand - udvikling, status og perspektiver. Faglig rapport fra DMU 380. http://www2.dmu.dk/1_viden/2_Publikationer/3_fagrapporter/rapporter/FR380_samlet.pdf. (In Danish).
Lopez-Ridaura, S., Van der Werf, H. & Paillat, J. 2007. Environmental evaluation of excess pig slurry management. Proceedings from the 5th International Conference ‘LCA in foods’, 25-26 April 2007, Gothenburg, Sweden.
Moehn, S., Atakora, J.K.A., Sands, J. & Ball, R.O., 2007. Effect of phytase-xylanase supple-mentation to wheat-based diets on energy metabolism in growing–finishing pigs fed ad libitum. Livestock Science 109 (1-3) 271-274.
Nielsen, P.H., Oxenbøll, K.M. & Wenzel, H., 2007. Cradle-to-Gate Environmental Assess-ment of Enzyme Products Produced Industrially in Denmark by Novozymes A/S. Inter-national Journal of LCA 12(6) 432-438.
Nielsen, P.H., & Wenzel, H., 2007. Environmental assessment of Ronozyme® P5000 CT Phytase as an Alternative to Inorganic Phosphate Supplementation to Pig Feed Used in Intensive Pig Production. International Journal of Life Cycle Assessment. DOI: http://dx.doi.org/10.1065/lca2006.08.265.1.
OECD, 2003. Agriculture, Trade and the Environment: The Pig Sector. 15 pp. Available on-line at http://www.oecd.org/dataoecd/25/41/19430433.pdf.
Oenema, O., Oudendag, D. & Velthof, G., 2006. Nutrient losses from slurry management. In: 12th Ramiran International conference. Technology for Recycling of Slurry and Organic Residues in a Whole-Farm Perspective. Vol 1. (Eds: Petersen, S.O.). DIAS report 122, 25-30.
Ogino, A., Orito, H., Shimada, K. & Hirooka, H., 2007. Evaluating environmental impacts of the Japanese beef cow-calf system by the life cycle assessment method. Animal Science Journal 78 (4), 424–432.
Olesen, J.E., 2005. Drivhusgasser fra jordbruget – reduktionsmuligheder. DJF rapport Mark-brug 113, 161 pp. (In Danish).
Petersen, J., 2007. Vurdering af virkning på miljøet (VVM) ved udvidelse af husdyrbrug. Tidsskrift for Landbrugsret 2, 35-39.
Plantedirektoratet, 2007. Vejledning om gødsknings og harmoniregler. Planperioden 1. august 2007 til 31. juli 2008. Available on-line at http://www.pdir.dk/files/filer/topmenu/publikationer/vejledninger/goedningsregnskab0708/pdf/Vejledning_om_goedskning_og_harmoniregler_07_08.pdf. (In Danish).
Poulsen, H.D., Børsting, C.F., Rom, H.B. & Sommer, S.G., 2001. Kvælstof, fosfor og kalium i husdyrgødning - normtal 2000. DJF rapport Husdyrbrug 36. 154 pp. (In Danish).
45

Poulsen, H.D. & Rubæk, G.H., 2005. Fosfor i dansk landbrug. Omsætning, tab og virkemidler mod tab. (DJF Rapport Husdyrbrug 68, 214 pp. Available on-line at http://pure.agrsci.dk:8080/fbspretrieve/350920/DJF_rapport_husdyr_nr._68. (In Da-nish).
Schmidt, J., 2007. Life Cycle Assessment of rape seed oil and palm oil. Ph.D. Thesis. Aalborg University, Denmark.
Sloyan, M., Knowles, A., Lowe, R., Fowler, T., Matthews, K. & Hall, S., 2006. BPEX (Brit-ish Pig Executive) Yearbook 2006. www.bpex.org.
Smith, A., Watkiss, P., Tweddle, G., McKinnon, A., Browne, M., Hunt, A., Treleven, C., Nash, C. & Cross, S., 2005. The Validity of Food Miles as an Indicator of Sustainable Development. Food Miles Final Report Issue 7.
Statistics Denmark, 2007. Statistikbanken. Available on-line at: www.statistikbanken.dk. Steinfeld, H., Gerber, P., Wassenaar, T., Castel, V., Rosales, M. & de Haan, C., 2006. Live-
stock’s long shadow – environmental issues and options. FAO, pp. 390. Tamminga, S., 2003. Pollution due to nutrient losses and its control in European animal pro-
duction. Livestock Production Science 84, 101-111. Tengnäs, B. & Nilsson, B. 2003. Soybean: Where is it from and what are its uses? A report
for WWF Sweden. WWF Sweden. Thomassen, M.A. & de Boer, I.J.M., 2005. Evaluation of indicators to assess the environ-
mental impact of dairy production systems. Agriculture Ecosystems & Environment 111 (1–4), 185–199. On-line at: doi:10.1016/j.agsy.2007.06.001. (In press).
Thrane, M., 2005. Environmental Impacts from Danish Fish Products. Department of Devel-opment and Planning. Aalborg University. Ph.D. Thesis.
Thrane, M., 2006. LCA on Danish Fish Products - New methods and insights. International Journal of LCA 11, 66-74.
Thrane, M. & Schmidt, J., 2005. Life Cycle Assessment. In: Tools for a Sustainable Devel-opment (Eds: Kørnøv, L., Lund, H. & Remmen, A.) Preliminary edition.
Tybirk, P., 2005a. Fytase. INFO SVIN. 6 pp. Available on-line at: http://www.infosvin.dk/index.aspx?id=418006d0-e7d5-4589-ac64-fc22805f161b. (In Danish).
Tybirk, P., 2005b. Xylanase. INFO SVIN. 4 pp. Available on-line at http://www.infosvin.dk/index.aspx?id=dc835ee2-14fe-4070-8bd0-ee545e8d56e6. (In Danish).
UNEP, 2004. United Nations Environment Programme. Life Cycle Initiative. Available on-line at: www.uneptie.org/pc/sustain/lcinitiative.
United Nations, 2007. World Population will increase by 2.5 billion by 2050; People over 60 to increase by more than 1 billion. Department of Public Information. Press Release. POP/952. Available on-line at: http://www.un.org/News/Press/docs//2007/pop952.doc.htm.
Vinther, F.P. & Hansen, S., 2004. SimDen - en simpel model til kvantificering af N2O-emission og denitrifikation DJF rapport Markbrug 104. 49 pp. (In Danish).
46

Watson, C.A., Bengtsson, H., Ebbesvik, M., Løes, A.K., Myrbeck, A., Salomon, E., Schroder, J. & Stockdale, E.A., 2002. A review of farm-scale nutrient budgets for organic farms as a tool for management of soil fertility. Soil Use Manage. 18, 264–273.
Weidema, B., 2003. Market information in Life Cycle assessment. Environmental Project No. 863. Danish Ministry of the Environment. Environmental Protection Agency. Available on-line at http://www2.mst.dk/Udgiv/publications/2003/87-7972-991-6/pdf/87-7972-992-4.pdf (accessed 14 may 2007).
Weidema, B.P., Mortensen, B., Nielsen, P. & Hauschild, M., 1996. Elements of an Impact Assessment of Wheat Production. Institute for Product Development, Technical Univer-sity of Denmark, pp. 1–12.
Weidema, B.P., Wesnæs, M., Hermansen, J., Kristensen, T. & Halberg, N., 2007. Environ-mental improvement potentials of meat and dairy products. Joint Research Center.
Wiedmann, T. & Minx, J., 2007. A definition of ’Carbon Footprint’. ISAUK Research Report 07-01. 9pp. Available on-line at http://www.isa-research.co.uk/docs/ISA-UK_Report_07-01_carbon_footprint.pdf.
Williams, A., Audsley, E. & Sandars, D., 2006. Environmental Burdens of Agricultural and Horticultural Commodity Production - Defra-funded Projects IS0205 and IS0222. Available on-line at http://www.silsoe.cranfield.ac.uk/iwe/expertise/lca.htm.
47

48

Modelling representative and coherent Danish farm types based on farm accountancy data for use in environmental assessments RANDI DALGAARD1, 2, NIELS HALBERG1, IB S. KRISTENSEN1 AND INGER LARSEN3
1) University of Aarhus, Faculty of Agricultural Sciences, Department of Agroecology
and Environment, P.O. Box 50, DK-8830 Tjele
2) Aalborg University, Department of Development and Planning, Fibigerstræde 13,
DK-9220 Aalborg East
3) Food and Resource Economic Institute, Rolighedsvej 25, DK-1958 Frederiksberg C.
I
1
49

50

www.elsevier.com/locate/agee
Agriculture, Ecosystems and Environment 117 (2006) 223–237
Modelling representative and coherent Danish farm types based on
farm accountancy data for use in environmental assessments
Randi Dalgaard a,b,*, Niels Halberg a, Ib S. Kristensen a, Inger Larsen c
a Danish Institute of Agricultural Sciences, PO Boks 50, 8830 Tjele, Denmarkb Department of Development and Planning, Aalborg University, Fibigerstræde 13, 9220 Aalborg East, Denmark
c Food and Resource Economic Institute, Rolighedsvej 25, 1958 Frederiksberg C., Denmark
Received 9 November 2005; received in revised form 23 March 2006; accepted 3 April 2006
Available online 23 May 2006
Abstract
There is a need for valid and representative data on the production, resource use and emissions from different farm types in Denmark for
public regulation and assessment. The data should be usable for both area-based environmental assessment (e.g. nitrate leaching per ha) and
product-oriented environmental assessment (e.g. greenhouse gas emissions per kg pork). The objective of this study was to establish a national
agricultural model for estimating data on resource use, production and environmentally important emissions for a set of representative farm
types.
Every year a sample of farm accounts is established in order to report Danish agro-economical data to the ‘Farm Accountancy Data
Network’ (FADN), and to produce ‘The annual Danish account statistics for agriculture’. The farm accounts are selected and weighted to be
representative for the Danish agricultural sector, and similar samples of farm accounts are collected in most of the European countries. Based
on a sample of 2138 farm accounts from year 1999 a national agricultural model, consisting of 31 farm types, was constructed. The farm
accounts were grouped according to the major soil types, the number of working hours, the most important enterprise (dairy, pig, different cash
crops), livestock density, etc. For each group the farm account data on the average resource use, products sold, land use and herd structure were
used to establish a farm type with coherency between livestock production, feed use, land use, yields, imported feed, homegrown feed, manure
production, fertilizer use and crop production. The set of farm types was scaled up to national level thus representing the whole Danish
agricultural sector and the resulting production, resource use and land use was checked against the national statistics. Nutrient balance
methodology and state-of-the-art emission models and factors were used to establish the emissions of nitrate, phosphate, ammonia, nitrous
oxide, methane and fossil carbon dioxide from each farm type. In this paper data on resource uses and emissions from selected farm types are
presented and it is demonstrated that this approach can lead to an agro-environmental inventory, which is consistent with national level
estimates and still has the advantage of being disaggregated to specific farm types. Conventional dairy farm types in general emitted more
nitrate but less phosphate compared with pig farm types. The methane emission was higher from dairy farm types compared with all other
farm types. In general the conventional dairy farms emitted more nitrate, ammonia, and nitrous oxide, compared with organic dairy farms.
# 2006 Elsevier B.V. All rights reserved.
Keywords: Agriculture; Environmental assessment; Environmental impact; Emissions inventory; Nutrient balances
1. Introduction
Agricultural production has an impact on the environ-
ment on a local scale (e.g. nitrate leaching to fens) and on a
global scale (e.g. greenhouse gas emissions to the atmo-
* Corresponding author. Tel.: +45 8999 1254; fax: +45 8999 1200.
E-mail address: [email protected] (R. Dalgaard).
0167-8809/$ – see front matter # 2006 Elsevier B.V. All rights reserved.
doi:10.1016/j.agee.2006.04.002
51
sphere). In order to identify the most polluting sources of the
agricultural production it is crucial to use well-defined
environmental indicators and valid data to describe resource
use and emissions from different farm types.
Environmental indicators developed for agricultural
purposes have recently been reviewed by Halberg et al.
(2005) and Payraudeau and van der Werf (2005). Halberg
et al. (2005) distinguish between area-based indicators

R. Dalgaard et al. / Agriculture, Ecosystems and Environment 117 (2006) 223–237224
(e.g. nitrate leaching per ha) and product-based indicators
(e.g. greenhouse gas emissions per kg product) and
conclude that both types of indicators are needed in order
to comprehensively characterise environmental impacts
from food production.
Area-based indicators are useful for evaluating farms
emissions of nutrients such as nitrate, ammonia and phosphate
that all have an effect on the local environment. In several
studies (Jarvis and Aarts, 2000; Haas et al., 2001; Holbeck and
Hvid, 2004; Jarvis and Menzi, 2004; Kristensen et al., 2005a;
Nielsen and Kristensen, 2005) area-based indicators have
been used to compare nutrient surpluses from different farm
types. As data-collection from farms is time-consuming, these
studies are based on a limited number of farms and are not
statistically representative for the agricultural sector. The lack
of representative data for environmental indicators and
assessment may be misleading because results such as
comparison between farm types may be highly influenced by
individual farm performances.
Product-based indicators are useful for evaluating the
impact of food productions on the global environment (e.g.
climate change) and have the advantage that in addition to
emissions from the farms, emissions related to the
production of inputs (e.g. soybean, artificial fertilizer) and
outputs (e.g. manure exported to other farms) are also
included. Life-cycle thinking is the basic idea behind the
product-based indicators.
Life-cycle thinking is one of five key principles in the
European Union’s Integrated Product Policy (IPP) (Eur-
opean Commision, 2003) and is also supported by the United
Nations Environmental Programme (UNEP, 2004). In Life-
cycle thinking the cradle-to-grave approach for a product is
adopted to reduce its cumulative environmental impacts
(European Commision, 2003). The most developed tool for
life-cycle thinking is life cycle assessment (LCA), which is a
method of evaluating a product’s resource use and
environmental impact throughout its life-cycle. LCA has
been used for environmental assessment of milk (Cederberg
and Mattsson, 2000; Haas et al., 2000; Thomassen and de
Boer, 2005), pork (Cederberg and Flysjo, 2004; Eriksson
et al., 2004; Basset-Mens and van der Werf, 2005), grains
(Weidema et al., 1996) and other agricultural products, but
most of the existing LCAs are based on data from only one
or a few farms. However, there is considerable variation in
the resource use and emissions between farms of the same
main enterprise (Halberg, 1999; Haas et al., 2000; Weidema
et al., 2002; Thomassen and de Boer, 2005) and it is
therefore unsatisfactory to base evaluation and comparison
of agricultural products on case studies.
In order to produce representative area-based and
product-based environmental indicators, there is a need
for representative and valid farm data that describes resource
use and emissions from typical farms.
Poppe and Meeusen (2000) and Halberg et al. (2000)
proposed basing environmental assessments on representa-
tive farm accounts such as those collected for The Farm
52
Accountancy Data Network (FADN). The aim of FADN is to
gather accountancy data from farms for income determina-
tion and business analysis of agricultural holdings. The
annual sample of FADN covers approximately 80,000
holdings in Europe, that represent about 5,000,000 farms,
thus covering approximately 90% of the agricultural area
and more than 90% of the total agricultural production of the
European Union (FADN, 2006). For each farm sampled, the
data relates to variables such as livestock, agricultural area,
crop yields, etc. FADN is an instrument for evaluating the
income of agricultural holdings and the impacts of the
Common Agricultural Policy. We found that FADN could
also be used as the data source for performing area-based
and product-based environmental assessments.
The objective of this study was to establish a national
agricultural model to estimate resource use, production and
environmentally important emissions based on a set of
representative farm types.
The national agricultural model should be able to deliver
data for both area-based environmental assessments (e.g.
nitrate leaching per ha, methane emissions per ha) and
product-based environmental assessments (e.g. global
warming potential per kg pork). This paper gives results
in terms of representative farm types, their resource uses and
emissions per ha. Per hectare results are given in kg N and P
farm gate balances, nitrate–N, ammonia–N, nitrous oxide–
N, phosphate–P, methane and fossil carbon dioxide.
2. Methods
The Danish agricultural sector was divided into 31
representative farm types. For each farm type data
describing farm type characteristics (e.g. agricultural area,
crop yields) were averaged over a number of farm accounts
from private farms. Based on this, resource use (e.g. import
of soybean meal, diesel, artificial fertilizer) and products
sold (e.g. pork, cereals) from the farm types were modelled.
Emissions (e.g. methane, nitrate, ammonia) were also
calculated from the modelling of nutrient cycling and flows
of energy and materials. Point of departure for modelling of
the farm types was a set of representative farm accounts as
explained below.
2.1. Farm account statistics
Danish farmers are obliged to keep records of purchases
and sales for tax purposes and the annual accounts are made
with professional help. Every year a sample of these farm
accounts are collected by Food and Resource Economic
Institute in order to fulfil Denmark’s obligation to supply
FADN with farm data, and to produce ‘The annual Danish
account statistics for agriculture’ (Møllenberg, 2001;
Larsen, 2003).
In the year 1999 the sample contained 2138 farm
accounts with detailed data describing the farms’ agricul-

R.
Da
lga
ard
eta
l./Ag
ricultu
re,E
cosystem
sa
nd
Enviro
nm
ent
11
7(2
00
6)
22
3–
23
72
25
Table 1
Criteria used for partitioning of farm accounts among farm types (sandy loam soil)
Farm type 1 2 3 4 5 6 7 8 9 10 11 12 13 30
Name Part-time Sugar beets Grass seeds Milk Milk Milk Organic milk Pig Pig Pig Cash crops Residual Horticulture Organic plant
Type of criteria
Working hours per yeara <832 >832 >832 >832 >832 >832 >832 >832 >832 >832 >832 >832 >832 >832
Conventional (C)/organic (O) Cb Cb Cb Cb Cb Cb Oc Cb Cb Cb Cb Cb Cb Oc
Specialization Non Sugar
beetsd
Grass
seedse
Milkf Milkf Milkf Milkf Pigg Pigg Pigg Cash cropsh Nonh Horticulturei Organic
plantj
Livestock density (LU ha�1)k <1.4 <1.4 <1.4 1.4–2.3 >2.3 <1.4 1.4–1.7 >1.7 <0.5 >0.5
Distribution of farm accounts
Samplel 67 88 63 23 32 14 24 50 27 98 53 38 185 30
Populationm 5663 2009 1616 432 849 267 115 1322 424 1437 1983 1219 1133 289
Percent of total production in Denmark
Milk 0% 2% 0% 4% 7% 3% 1% 0% 0% 0% 0% 2% 0% 0%
Fattening pigs 0% 4% 3% 0% 0% 0% 0% 4% 4% 21% 0% 3% 0% 0%
a Part-time holdings: less than 832 working hours per year.b C: holdings that did not receive organic subsidies.c O: holdings that did receive organic subsidies.d Holdings where at least 10% of the area was cultivated with sugar beets.e Holdings where at least 10% of the area was cultivated with grass seeds.f Holdings with dairy cattle. Maximum 10% of gross margin came from pigs.g Holdings with pigs. Minimum 10% of gross margin came from pigs. Maximum 10% of gross margin came from cattle.h Residual holdings not applying to previous criteria.i Horticultural accounts were marked specific, and could therefore be selected for this farm type.j Residual holdings that did receive organic subsidies, but had no dairy cattle.k One LU equals to: 1 milking cow, 3 sows with piglets (to 25 kg) or 24 fattening pigs (30–110 kg).l Number of farm accounts that fulfilled the criteria of the respective farm type.
m Number of Danish farms that the farm type represented.
53

R. Dalgaard et al. / Agriculture, Ecosystems and Environment 117 (2006) 223–237226
tural area (e.g. number of hectares of spring barley and rape
seed), crop yields (e.g. kg cereals, rape seed, potatoes and
grass seeds per ha), livestock products sold (e.g. kg milk,
meat, live animals), livestock density, electricity use, etc.
The farm accounts were weighted and selected to be
representative for the entire population of 50,487 Danish
farms. Firstly, the farm accounts were divided into two
groups according to their main soil type. The sandy loam soil
group was composed of farm accounts where the majority of
the agricultural area had soil containing more than 10% clay,
whereas the sandy soil group contained the rest. The farm
accounts from farms in the sandy loam soil group were,
subsequently, divided into 14 groups using the criteria
presented in Table 1. For each farm type on sandy loam soil a
set of criteria regarding the number of working hours per
year, organic subsidies, specialization (e.g. sugar beets,
milk, pigs) and livestock density (livestock units ha�1) was
defined. The criteria regarding number of working hours and
specialization were used in order to separate small mixed
farms from large specialized farms. Thereby the modelling
was facilitated and the farm types were reflecting the
structure of the Danish agricultural sector, which is moving
towards larger and more specialized farms. The criterion of
livestock density was used to separate livestock farms from
cash crop farms, and to secure that the modelling of manure
exchange between farm types could be performed in
accordance with the public regulation of manure and
fertilizer use in Denmark, which partly is based on livestock
density (Plantedirektoratet, 1998). Organic farms and
conventional farm accounts were separated to secure that
artificial fertilizer was not purchased by organic farms.
Secondly, all farm accounts belonging to the sandy loam
soil group were tested against the criteria of farm type 1. The
number of working hours should be less than 832 year�1 and
the farm should not receive organic subsidies. The criteria
were fulfilled by 67 farm accounts, representing a population
of 5663 Danish part-time farms. The remaining farm
accounts were tested against the criteria of farm type 2, and
88 farm accounts matched the four criteria, namely more
than 832 working hours year�1, not receiving organic
subsidies, at least 10% of the area cultivated with sugar beets
and maximum 1.4 livestock units ha�1. This procedure was
followed to divide all the farm accounts for sandy loam soil
farms in a sequential procedure using the criteria under each
predefined type as shown from left to right in Table 1. The
same was done to farm accounts in the sandy soil group
(Table 2). For further details, see Larsen (2003).
Farm accounts with more than 10% of gross margin from
poultry were not divided according to soil type, but were
partitioned into farm types 27, 28 and 29 (not presented in
Tables 1 and 2).
After the partitioning of the farm accounts into the 31
farm types, the data in the farm accounts belonging to the
same farm type were averaged, and thus each farm type was
represented as one averaged farm account, containing data
describing the agricultural area, crop yields, livestock
54
production, purchased inputs, etc. The existing system of
sampling did unfortunately not permit calculation of
variance on data from the farm types. However, on a
European level, the Commission has since 1965 used the
farm account data to determine differences between farm
types in their productivity and economic competitiveness
(FADN, 2006), and therefore we also found it suitable for
comparison of environmental aspects.
For each farm type a detailed model was then developed,
based partly directly on the averaged farm accounts, and
partly on general knowledge as explained in the following.
2.2. Modelling coherent and representative farm types
The data in the farm accounts contained information on
the agricultural area, crop yields, livestock products sold,
livestock density, electricity use, etc. of each farm type. This
information was thus used to establish the general crop–
livestock interaction (e.g. how much homegrown barley was
used as feed on the farm, how much manure was used for
fertilization), and the level of production within each farm
type. Because the use of external inputs like purchased feed
and fertilizer was only available in the monetary units
Danish Kroner (DKK) in the accounts, the feed and fertilizer
use in kg nutrients was modelled using standards. The use of
electricity and chemicals in DKK and the production of
fattening pigs and milk were not modelled but were
averaged data from the farm accounts.
Due to the public regulation of manure and fertilizer use
in Denmark, representative average values for feed
efficiency in livestock production (e.g. feed use per kg live
weight pig) and the production of nitrogen (N) and
phosphorus (P) in manure by livestock types are readily
available. For example a fattening pig (30–100 kg) by
standard excretes 5.1 kg N and 0.72 kg P and has an N
efficiency of 0.38 (Poulsen et al. (2001), an update from
Poulsen and Kristensen (1998)). N efficiency is defined as
the N produced in the carcass divided by the N intake in feed,
and was lower for sows and piglets in comparison with
fattening pigs. The N demand and N excretion of a milking
cow were also calculated according to Poulsen et al. (2001),
an update from Poulsen and Kristensen (1998), but as they
depend on the milk yield per cow and on the percentage of
Jersey stock, they were calculated for each the farm type
using the farm accounts data. N demand and N excretion
were 150–176 and 114–133 kg N cow�1 year�1, respec-
tively. N-efficiency of 0.25 and 0.24 for Jersey and dual-
purpose breed cows, respectively, were used (Poulsen et al.
(2001), an update from Poulsen and Kristensen (1998)).
The amount of homegrown feed was estimated by
multiplying farm account data on area by yields per hectare
of feed crops, which were obtained from private pilot farms
(Kristensen et al., 2005a). Then the purchase of external
feeds was modelled as the difference between the livestock’s
protein and energy needs and the input from homegrown
(Halberg et al., 2000).

R.
Da
lga
ard
eta
l./Ag
ricultu
re,E
cosystem
sa
nd
Enviro
nm
ent
11
7(2
00
6)
22
3–
23
72
27
Table 2
Criteria used for partitioning of farm accounts among farm types (sandy soil)
Farm type 14 15 16 17 18 19 20 21 22 23 24 25 26 31
Name Part-time Potatoes Milk Milk Milk Organic milk Pig Pig Pig Suckler cows Cash crops Residual Horticulture Organic plant
Type of criteria
Working hours per yeara <832 >832 >832 >832 >832 >832 >832 >832 >832 >832 >832 >832 >832 >832
Conventional (C)/organic (O) Cb Cb Cb Cb Cb Oc Cb Cb Cb Cb Cb Cb Cb Oc
Specialization Nond Potatoese Milkf Milkf Milkf Milkf Pigsg Pigsg Pigsg Suckler cowsh Cash cropsi Noni Horticulturej Organic plantk
Livestock density (LU ha�1)l <1.4 <1.4 1.4–2.3 >2.3 <1.4 1.4–1.7 >1.7 <0.5 >0.5
Distribution of farm accounts
Samplem 59 62 83 182 16 125 99 38 164 103 52 91 100 107
Populationn 5043 1184 1912 4004 330 695 2319 600 2347 6309 2103 2229 644 1084
Percent of total production in Denmark
Milk 0% 2% 15% 43% 4% 9% 0% 0% 0% 0% 0% 7% 0% 0%
Fattening pigs 0% 2% 0% 0% 0% 0% 13% 4% 30% 2% 0% 6% 0% 0%
a Part-time holdings: less than 832 working hours per year.b C: holdings that did not receive organic subsidies.c O: holdings that did receive organic subsidies.d No suckler cows.e Holdings where at least 10% of the area was cultivated with potatoes.f Holdings with dairy cattle. Maximum 10% of gross margin came from pigs.g Holdings with pigs. Minimum 10% of gross margin came from pigs. Maximum 10% of gross margin came from cattle.h Holdings with suckler cows.i Residual holdings not applying to previous criteria.j Horticultural accounts were marked specific, and could therefore be selected for this farm type.k Residual holdings that did receive organic subsidies, but had no dairy cattle.l One LU equals to: 1 milking cow, 3 sows with piglets (to 25 kg) or 24 fattening pigs (30–110 kg).
m Number of farm accounts that fulfilled the criteria of the respective farm type.n Number of Danish farms that the farm type represented.
55

R. Dalgaard et al. / Agriculture, Ecosystems and Environment 117 (2006) 223–237228
Moreover, each farm has a fertilizer quota based on
official crop N norms multiplied by the area with different
crops. From this is deducted the plant-available N in the
either home-produced or imported farm manure. For
example, a cash crop farm on sandy loam soil with no
manure production could import 117 kg N in artificial
fertilizer ha�1 of spring barley if the field has carried a cereal
crop the previous year (Plantedirektoratet, 1998). Thus,
fertilizer use on the different farm types was calculated using
these norms. As part of Danish compliance with the EU
Nitrate Directive, the use of manure–N is limited, why some
farms are obliged to export manure to cash crop farms. This
was modelled as a transfer of manure from farm types with a
high livestock density to other farm types, which then
reduced the artificial fertilizer input accordingly. In 1999 the
use of manure on pig farms was limited to 170 kg N ha�1.
Dairy farm types with a straw shortage were supplied with
straw from farm types with a low livestock density. Because
the model accounts for the entire land use and agricultural
production on national level the consistency of exchange of
manure and straw between farms could be checked.
Livestock farms are primarily situated in the western part
of Denmark, where sandy soil predominates. This is
reflected in the national agricultural model, where 80% of
the milk and 57% of the fattening pigs were produced on
sandy soil farm types (Table 2). It was assumed that transfer
of manure and straw for bedding between the western and
eastern parts of Denmark, which are separated by two straits,
only occurred on a minor scale, and therefore the transfer of
manure and straw between farm types was modelled to only
occur between farm types belonging to the same soil group.
Consequently, farm types on sandy soil interchanged more
manure and straw than farm types on sandy loam soil.
In this way a coherent model of crop–livestock
interactions was established for each farm type with a
consistent relation between livestock production, use of
homegrown versus imported feed and export of cash crops.
There was also coherence between the farm types in terms of
manure and straw. Moreover the use of N in artificial
fertilizer and manure on all farm types was in harmony with
Danish legislation.
Energy use for traction was modelled following Dalgaard
et al. (2001), where each crop was assigned a number of field
operations multiplied by diesel use per ha. It was assumed
that the diesel consumption for passenger car driving was
5 l ha�1 year�1, while the average distance from farm to
field was 2 km. Electricity use was estimated directly from
the data in the farm accounts using a standard price per kW h
consumed, but corrected against national statistics.
2.3. Modelling farm nutrient balances and emissions
For each of the 31 farm types, N and P balances were
established at farm gate level, herd level and field level
following the procedures of Halberg et al. (1995) and
Kristensen et al. (2005a). The N input to the farm types
56
included: feed concentrates, straw, artificial fertilizer,
manure, deposition, biological N fixation (BNF) and living
animals. The BNF in pure legumes was calculated as a
proportion of the yield in grain legume multiplied by the
standard N content (Høgh-Jensen et al., 2004). In grass
clover BNF was set at the average value obtained for
approximately 100 private pilot farms during the period
1989–2003. BNF was estimated from the percentage of
clover in the season based on 300 visual clover estimations
per farm per year as described by Kristensen et al. (1995).
The estimated BNF in organic grass/clover was 150 kg
N ha�1 year�1 and in conventional grass/clover fertilized
with around 130 kg N ha�1 year�1 as artificial fertilizer the
estimated BNF was 100 kg N ha�1 year�1. The N output
from the farm types included: Meat, milk, crops and manure
sold to other farm types.
The amounts of nitrate, ammonia, phosphate and
greenhouse gasses (methane, nitrous oxide and fossil carbon
dioxide) emitted from the farm types were determined on the
basis of nutrients balances in combination with farm account
data on agricultural area, livestock and internal flows.
Nitrate leaching was assumed to be equal to the N farm
gate balance minus ammonia losses, denitrification (Kris-
tensen et al., 2005a) and net change in soil N status. The
ammonia emission from animal housing, manure storage
and handling was calculated using standard values from
Hutchings et al. (2001). These values are also presented by
Kristensen et al. (2005a, see appendix). Denitrification was
estimated using the method of Vinther and Hansen (2004),
and the net change in soil N status was modelled using the
dynamic soil model from Gyldenkærne et al. (2005),
implemented in C-TOOL (Petersen et al., 2002).
The nitrous oxide emissions were calculated according to
IPCC (2000), but using a country-specific accounting
method for some of the crop residue N content (Møller
et al., 2000).
According to ‘Evaluation of the Action Plan for the
Aquatic Environment II’ (Action Plan for the Aquatic
Environment, 2003) 1000 t of P leached in 2004, correspond-
ing to 0.4 kg P ha�1. In order to reach that level for the
national agricultural model and to obtain proportionality
between P farm gate balance and leaching it was assumed, that
2.9% of the P farm gate balance leached as phosphate.
The methane emission was calculated using standard IPCC
methodology (IPCC, 2000). The methane emission from the
cattle’s enteric fermentation was calculated using data on dry
matter intake from the farm models in combination with the
Tier 2 method (IPCC, 2000). A methane conversion rate of
0.06 and energy content of 18.45 MJ kg�1 dry matter in feed
was used. As the feed intake in the farm models varied with
the milk yield per cow, the methane emission per dairy cow
per year varied between farm types. The methane emission
from manure management was calculated using the Tier 2
method, except for the methane conversion factor where the
original standard of 0.10 (IPCC, 1997) was used instead of
0.39, as argued by Masse et al. (2003).

R. Dalgaard et al. / Agriculture, Ecosystems and Environment 117 (2006) 223–237 229
The emission of CO2 from combusted fossil fuel was
assumed to be 91 g CO2 MJ�1 diesel and 94 g CO2 MJ�1
heating oil (Nielsen et al., 2003).
Emissions and resource use relating to the construction
and maintenance of buildings and machinery used on the
farm were not included, and the use of medicine and
pesticides was not considered. Emissions and resource use
associated with the production of purchased resources (e.g.
soybean meal, fertilizer) were not included in this study.
Estimates of uncertainty on the N farm gate surplus
were calculated using a study by Kristensen (2005, a short
translation of the Danish report by Hvid et al. (2004)), who
found the uncertainties to be 8, 21, 13 and 18% (measured
as coefficients of variation (CV)), respectively, for the
farm types conventional and organic dairy, pig farms and
non-livestock farms. These uncertainties were calculated
on basis of standard deviations for each item in the N farm
gate balance. The lowest CVs were on artificial fertilizer
(5%) and milk (3%), whereas the highest were on BNF
(25%) and on cash crops (20%). Those CVs were used to
calculate the standard deviations for the actual items. Farm
types with a large area of clover grass (e.g. organic dairy
farm) and thus high N-input from BNF, also had high
uncertainty on the N farm gate surplus. For further details
on calculation of CVs and uncertainties, see Kristensen
(2005). The uncertainties on the N farm gate balances were
used in our study to indicate whether the differences in N
farm gate balances between farm types were important.
Due to the importance and variability analyses of the BNF
estimate we also performed sensitivity analyses of changes
in this parameter.
The emissions of N in the form of ammonia, nitrous
oxide and nitrate were estimated in a coherent way, so
that sum of the partial emissions and the net change in
soil N status equalled the N farm gate balance. It was
beyond the scope of this study to determine uncertainties
on these items. But as explained above we have used
international recognized methods for calculation of
greenhouse gas emissions and national recognized
methods for calculation ammonia emissions. In addition
we checked the total estimated emissions against a
separate national level inventory of emissions as
explained in the following.
2.4. Securing consistency with the national statistics
To secure a consistency of the farm types with the
national statistics, a three-step validity check was per-
formed.
Firstly, a validity check of farm type production data
against national statistics was performed. This was done
by multiplying production data (e.g. number of milking
cows, agricultural area, pigs produced) from each farm
type with the number of farms the farm type represented
(population in Tables 1 and 2), and then summarizing these
multiplied data across all farm types and comparing the
57
values with national statistics (Agricultural Statistics,
2000).
Secondly, the modelled resource use (e.g. soybean
meal, diesel, artificial fertilizer N) of the farm types was
compared with national statistics by similarly multiplying
the resource use of each farm type with the population of
the farm type, and then comparing these values with
national statistics. The total use of artificial fertilizer N
was underestimated. Therefore, figures for the farm types
were adjusted using an overall factor on the input to all
farm types. The model also underestimated the total use of
diesel and heating oil, and the farm types were therefore
adjusted accordingly.
Thirdly, the emissions of nitrous oxide and methane from
farm types were compared with national statistics for
emissions of greenhouse gasses (Gyldenkærne and Mikkel-
sen, 2004).
Area-based environmental indicators were calculated
on the basis of the modelled farm types and presented as N
and P farm gate balances and emissions of nitrate,
phosphate, ammonia, methane, nitrous oxide and fossil
CO2 per ha.
3. Results
The results from the modelling of farm types and
their consistency with national statistics are presented
followed by results from the farm types in terms of
emissions per ha.
3.1. Establishment of farm types and their consistency
with national statistics
To secure the consistency of the national agricultural
model based on representative farm types, production
data and resource use across all 31 representative farm
types were aggregated using the population of the
respective farm types (Tables 1 and 2). The production
data for pig and milk production and land use were in
good agreement with the Danish National Statistics
(Agricultural Statistics, 2000) as shown in Table 3. The
farm types did not, however, account satisfactorily for the
total use of artificial fertilizer N. The unexplained
difference was corrected using an overall factor of 10%
on the artificial fertilizer N input to all farm types. The
total use of diesel and heating oil was underestimated by
18%, and the farm types were therefore adjusted
accordingly. The underestimation of diesel use might
be due to underestimation of passenger car driving or the
distance from farm to field.
The aggregated emissions of nitrous oxide and methane
across all farm types were 22,000 t N2O and 160,000 t CH4,
and thereby the nitrous oxide emission was 9% higher and
the methane emission 10% lower than the Danish National
Statistics for emissions of greenhouse gasses (Andersen

R. Dalgaard et al. / Agriculture, Ecosystems and Environment 117 (2006) 223–237230
Table 4
Characteristics and resource use per year for selected farm types on sandy loam
Farm type 2 3 4
Name Sugar beets Grass seeds Milk
Livestock density (LU ha�1) 0.5 0.2 0
Population (number of farms) 2009 1616 432
Agricultural area (ha) 78 105 99
Grain (%) 60 57 48
Other cash crops (%) 30 35 6
Maize and whole crops (%) 1 0 17
Grass/clover in rotation (%) 1 0 14
Permanent grass, set aside (%) 8 8 15
Yields
Wheat (kg ha�1) 8630 8030 6700
Spring barley (kg ha�1) 6180 5940 4790
Winter barley (kg ha�1) 6470 6080 5390
Rape seed (kg ha�1) 3040 3170 3040
Self-sufficiency in feed (%) 72 75 83
Resource use
Grain for feed stock (kg ha�1) 0 0 0
Soybean meal (kg ha�1) 483 219 594
Manure (kg N ha�1) 6 7 6
N artificial fertilizer (kg N ha�1) 110 120 107
P artificial fertilizer (kg P ha�1) 10 12 10
K artificial fertilizer (kg K ha�1) 50 46 27
Electricity (kW h ha�1) 327 284 464
Heating oil (MJ ha�1) 440 229 5
Diesel (l ha�1) 140 120 147
Chemicals (DKK ha�1) 746 578 333
Table 3
Aggregated production data and resource use across 31 representative farm
types, scaled to national level and compared with the Danish National
Statistics
Farm types
scaled to
national level
Danish
National
Statisticsa
Deviation from
Danish National
Statistics (%)
Production data
Fattening pigs
producedb (1000)
20639 20801 �1
Sows (yearly basis)
(1000)
1083 1052 3
Milking cows
(1000)
633 661 �4
Milk production
(1000 t)
4624 4455 4
Agricultural area
(1000 ha)
2585 2644 �2
Area with cereals
(1000 ha)
1395 1448 �4
Area with roughage
(1000 ha)
567 570 �1
Resource use
Artificial fertilizer
N (1000 t N)
226 252 �10
Soybean meal
(1000 t N)
142 156 �9
Grain (1000 t) 6571 6728 �2
Diesel and
heating oil (PJ)
13.0 15.8 �18
a Agricultural Statistics (2000).b Live weight = 100 kg.
58
et al., 2001; Gyldenkærne and Mikkelsen, 2004). The
difference in nitrous oxide emission was expected since we
used more detailed information for crop residues than in the
national nitrous oxide budget.
3.2. Selected farm types’ characteristics and resource
use
After correcting for national level consistency in terms of
artificial fertilizer N, diesel and heating oil, the representative
and coherent farm types showed the relationship between
resource uses and emissions and specific volumes of livestock
and cash crop productions. Detailed results are presented as an
open database (Nielsen et al., 2003). Agricultural area, yields
and resource use for selected farm types on sandy loam soil
and sandy soil are presented in Tables 4 and 5, respectively. In
Tables 4 and 5 the following parameters are modelled: Self-
sufficiency in feed, grain for feed stock, soybean meal,
manure, artificial fertilizer, heating oil and diesel. The rest of
the parameters are farm account data.
On pig farms 71–79% of the area was cropped with grains
compared with 14–48% on dairy farms. Organic dairy farms
had the largest area (50–55%) with grass-clover, permanent
grass and set-aside. The self-sufficiency in terms of feed
(calculated on the basis of Scandinavian Feed Units)
decreased with increasing livestock density and was in
general higher for dairy farm types (64–85%) than for pig
farm types (30–67%).
soil
5 7 8 9 11
Milk Organic milk Pig Pig Cash crops
.9 1.7 1.2 0.7 1.6 0.1
849 115 1322 424 1983
50 88 58 77 68
32 24 77 79 74
3 3 14 11 15
29 23 0 1 0
24 33 1 1 2
12 17 7 8 9
6830 5850 6950 7260 7510
4970 3650 5370 5760 5360
5370 – 6160 6000 5600
2710 3000 3100 3170 2880
64 74 67 36 91
1294 1116 117 2214 0
1402 250 763 1532 13
0 22 7 0 16
89 0 116 95 136
11 0 9 5 15
17 0 41 29 53
598 446 456 951 177
19 2 1121 2334 334
166 124 140 148 178
299 4 572 526 538

R. Dalgaard et al. / Agriculture, Ecosystems and Environment 117 (2006) 223–237 231
Table 5
Characteristics and resource use per year for selected farm types on sandy soil
Farm type 15 16 17 19 20 21 23 24
Name Potatoes Milk Milk Organic milk Pig Pig Beef Cash crops
Livestock density (LU ha�1) 0.4 1.1 1.8 1.4 0.8 1.5 0.7 0.0
Population (number of farms) 1184 1912 4004 695 2319 600 6309 2103
Agricultural area (ha) 94 81 65 102 76 79 31 76
Grain (%) 51 41 19 14 71 76 49 70
Other cash crops (%) 31 5 1 1 17 11 5 16
Maize and whole crops (%) 4 20 37 30 1 0 4 1
Grass/clover in rotation (%) 3 18 26 41 1 1 16 0
Permanent grass, set aside (%) 10 16 17 14 11 11 26 12
Yields
Wheat (kg ha�1) 5930 6470 5490 4970 6620 6260 5620 6400
Spring barley (kg ha�1) 4600 4710 4550 3920 4920 4460 4290 4570
Winter barley (kg ha�1) 4790 5370 5580 2400 5430 5550 4420 5080
Rape seed (kg ha�1) 1960 2410 2200 1500 2640 2580 1840 1820
Self-sufficiency in feed (%) 79 85 66 71 57 30 95 97
Resource use
Grain for feed stock (kg ha�1) 0 0 1411 1415 482 2619 0 0
Soybean meal (kg ha�1) 316 604 1185 345 843 1548 125 3
Manure (kg N ha�1) 16 8 0 20 7 0 11 16
N artificial fertilizer (kg N ha�1) 110 108 101 0 92 72 8 111
P artificial fertilizer (kg P ha�1) 10 11 14 0 9 2 7 14
K artificial fertilizer (kg K ha�1) 54 35 39 0 39 21 32 50
Electricity (kW h ha�1) 445 429 648 541 486 813 262 189
Heating oil (MJ ha�1) 241 7 11 5 1056 2813 56 3
Diesel (l ha�1) 128 143 164 122 122 132 110 107
Chemicals (DKK ha�1) 749 343 281 3 466 407 206 493
The grain yields of wheat, spring barley and winter
barley, calculated as an area weighted average across all
farm types, were 29% higher on farm types on sandy loam
soil. This is presumably because of a higher soil fertility
(Halberg and Kristensen, 1997). Organic dairy farms had
the lowest yields of wheat and spring barley (Tables 4 and
5). Calculated as a weighted average the grain yields on
organic dairy farms and organic arable farms were 81 and
58%, respectively, of the conventional level (data not
shown).
The amount of N in manure and artificial fertilizer
imported to the farm types varied inversely with the
livestock units (LU ha�1). For example 107 kg artificial
fertilizer N ha�1 and 6 kg manure–N was imported to
farm type 4 (dairy farm type on sandy loam soil,
0.9 LU ha�1), and only 89 kg artificial fertilizer N ha�1
and no manure–N was imported to farm type 5 (dairy farm
type on sandy loam soil, 1.7 LU ha�1). These differences
are due to the strict Danish regulations on the use of
manure and limitations in the use of fertilizer (Hutchings
et al., 2005).
Generally the pig farm types imported less artificial
fertilizer P (2–9 kg P ha�1) compared with other farm types
(10–114 kg P ha�1), because pig manure has a high P
content. Pig farm types used more heating oil than any of the
other farm types due to the heating requirements for animal
houses. There was a tendency for higher diesel imports to
dairy farm types in comparison to other farm types. This was
59
caused by the high diesel requirements for the processing
and handling of roughage for feeding. The expenditure on
chemicals (per ha) was highest for the two farm types
producing sugar beets and potatoes. This was in agreement
with our expectations, since cultivation of sugar beets and
potatoes often includes high levels of pesticide use
(Christensen and Huusom, 2003). The data in the farm
accounts on chemicals purchased were not specified, but it
was assumed that most of these chemicals were pesticides,
although some may have been detergents for cleaning pig
housing and milking equipment. The use of chemicals was
lowest on the dairy farm types, probably because of low
pesticide use for grassland.
Product sales from the farm types are not shown in
Tables 4 and 5, but are presented at the open database
(Nielsen et al., 2003).
3.3. Nutrient balances and emissions from selected farm
types
The selected farm types together do not represent the
entire Danish agricultural sector and therefore the results are
solely valid for the farm types presented in Tables 4 and 5.
The N and P farm gate balances (surpluses) and the
emissions from selected farm types on sandy loam soil and
sandy soil are presented in Tables 6 and 7, respectively.
Tables 6 and 7 shows that dairy farm types have the highest
N and P surplus per ha followed by pig farm types and cash

R. Dalgaard et al. / Agriculture, Ecosystems and Environment 117 (2006) 223–237232
Table 6
Emissions per year from selected farm types on sandy loam soil
Farm type 2 3 4 5 7 8 9 11
Main product Sugar beets Grass seeds Milk Milk Organic milk Pig Pig Cash crops
Livestock density (LU ha�1) 0.5 0.2 0.9 1.7 1.2 0.7 1.6 0.1
N surplus (kg N ha�1) 70 � 13 75 � 13 137 � 11 204 � 16 80 � 17 114 � 15 142 � 18 80 � 14
P surplus (kg P ha�1) 3 4 7 15 1 12 21 5
Emissions
Nitrate (kg N ha�1) 23 34 68 90 6 70 63 48
Ammonia (kg N ha�1) 20 15 27 44 23 27 43 11
Nitrous oxide (kg N ha�1) 3.2 3.2 5.7 8.3 4.5 4.5 4.5 3.8
Phosphate (kg P ha�1) 0.3 0.4 0.7 1.5 1.2 1.2 2.1 0.5
Methane (kg CH4 ha�1) 21 8 101 181 17 17 34 3
CO2 fossil (t CO2 ha�1) 79 66 76 86 90 90 113 97
�, the standard deviation.
crops farm types. Using the estimated standard errors
organic dairy farm types have lower N surplus than
conventional, and conventional dairy farm types with high
livestock density had higher N surplus than the other
livestock farm types. There were probably no differences
between different cash crop farm types.
For more details on the N nutrient balances see
Kristensen et al. (2005a). Following our methodology,
Tables 6 and 7 show the same differences in the emissions
between farm types, with comparably high ammonia
emissions on high livestock density pig and dairy farm
types and low emissions on organic farm types.
The emission per ha of nutrients (nitrate, ammonia,
nitrous oxide and phosphate) was higher on the farm types
with the highest livestock density, as also shown in
Kristensen et al. (2005a). The cash crop farm types (e.g.
farm types 2, 3 and 11) in general emitted less nutrients than
livestock farms. This is because manure–N is utilised less
efficiently compared with N in artificial fertilizer and
because the storage and handling of manure result in losses
of ammonia and nitrous oxide. The emission of phosphate
was also higher from farm types with a high livestock
density.
The emissions of nitrate and phosphate were generally
lower from farm types on sandy loam soil than farm types on
sandy soil. This could be explained by the higher crop yields
Table 7
Emissions per year from selected farm types on sandy soil
Farm type 15 16 17
Main product Potatoes Milk Milk
Livestock density (LU ha�1) 0.4 1.1 1.8
N surplus (kg N ha�1) 103 � 19 150 � 12 209 � 17
P surplus (kg P ha�1) 8 9 18
Emissions
Nitrate (kg N ha�1) 84 85 108
Ammonia (kg N ha�1) 18 30 43
Nitrous oxide (kg N ha�1) 4.5 7.0 8.9
Phosphate (kg P ha�1) 0.8 0.9 1.7
Methane (kg CH4 ha�1) 26 113 189
CO2 fossil (t CO2 ha�1) 70 74 85
�, the standard deviation.
60
(shown in Tables 4 and 5) due to higher soil fertility and
more stable water supply on sandy loam soil. Moreover, the
precipitation surplus is generally higher in the western part
of Denmark where most sandy soils are situated resulting in
a higher risk of leaching during winter.
Conventional dairy farm types in general had higher
nitrate emissions (68–108 kg N ha�1) compared with pig
farm types (63–95 kg N ha�1). The higher nitrate emissions
were caused by a lower N efficiency in the milk/meat
production compared with pork production and the fact that
fewer cash crops are sold from dairy farms than pig farms.
The phosphate emissions from dairy farm types were lower
(0.4–1.7 kg P ha�1) compared with pig farm types (1.2–
2.2 kg P ha�1). In Danish legislation the use of N is limited
but not the use of P and this probably causes heavier P
fertilization on pig farms than on dairy farms, simply
because more P is applied per unit N. Pig manure has a
higher P/N ratio than cattle manure (Poulsen and Kristensen,
1998). There were no differences in the ammonia emissions
per ha between dairy farm types and pig farm types at
comparable livestock density. The methane emission per ha
was higher from dairy farm types (101–189 kg CH4 ha�1)
compared with all other farm types (3–63 kg CH4 ha�1), due
to the enteric fermentation of cattle.
In general the conventional dairy farms emitted more
nitrate (68–108 kg NO3–N ha�1), ammonia (27–44 kg
19 20 21 23 24
Organic milk Pig Pig Beef Grain
1.4 0.8 1.5 0.7 0.0
110 � 23 107 � 14 148 � 19 136 � 11 78 � 14
4 14 23 5 7
32 77 95 86 73
27 28 44 23 10
5.7 4.5 5.1 6.4 3.8
0.4 1.4 2.2 0.5 0.7
141 19 33 63 3
64 79 111 58 55

R. Dalgaard et al. / Agriculture, Ecosystems and Environment 117 (2006) 223–237 233
NH3–N ha�1), and nitrous oxide (5.7–8.9 kg N2O–N ha�1),
compared with organic dairy farms (6–32 kg NO3–N ha�1,
23–27 kg NH3–N ha�1 and 4.5–5.7 kg N2O–N ha�1). The
very low nitrate emission (6 kg NO3–N ha�1) from farm
type 7 (organic dairy farm on sandy loam soil) was a result of
low N surplus (80 kg N ha�1), high denitrification and high
accumulation of N in the soil. Further results regarding the N
surplus of different farm types are presented by Kristensen
et al. (2005a).
Emission of fossil CO2 was a function of combustion of
both heating oil and diesel. So even though the pig farm
types used less diesel per ha than dairy farm types, the
smaller amount of CO2 from the diesel combustion was
counterbalanced by a higher emission of CO2 from the
combustion of heating oil.
4. Discussion
4.1. Methodology: establishment of farm types
The results presented demonstrate how the resource use
and emissions from farm types can be modelled on the basis
of representative farm accounts and accepted norms for feed
conversion and fertilization.
An important strength of the method is that the farm
types are representative, partly because of the use of the
representative data set of farm accounts and partly because
of the adjustment to the national level statistics. The farm
types are based on realistic and documented levels of
resource use per unit agricultural product and the emissions,
therefore, reflect average production levels and efficiency
within different farm types. The farm types are all consistent
in terms of crop–livestock interactions, and together they
form the national agricultural model that documents the
total resource use and emissions of the Danish agricultural
sector, including the exchange of manure and straw between
farm types.
The method of establishing a set of representative farm
types including emissions may be used in many European
countries, because similar data sets are reported yearly to
Eurostats’ FADN. However, the exact modelling approach
must be adjusted according to local regulations and N and P
norms and the level of detail recorded. For some countries,
e.g. Netherlands, data on inputs required for agricultural
production are given in quantities instead of expenditures
(Poppe and Meeusen, 2000) and thereby the establishment
of farm types is facilitated.
The major drawback of the method from our point of
view is that the large variation that may exist between farms
within one farm type in e.g. feed or fertilizer use efficiency
due to differences in farm management skills and strategic
choices of crop rotation and feed planning is not reflected in
differences between the farm types. This was, however, a
necessary choice based on the primary purpose of establish-
ing representative and coherent farm types that could be
61
used for environmental assessment of farm types and
agricultural products.
According to Poppe and Meeusen (2000) and EEA
(2005), there are two important shortcomings of the FADN,
namely, that fertilizer purchases are only valued in monetary
units and that it is not disaggregated into the different units
such as N, P and K. In the development of the farm types a
lot of effort was devoted to estimating the N flows and we did
it on the basis of the Danish legislation on fertilizer use.
Even so we underestimated the N fertilizer use by 10%. This
could have been avoided if we had had the figures for the
different volumes of N, P and K fertilizers purchased for the
different farm types. So we can only support the request
from the EEA (2005) for the expansion of FADN to include
the volume of fertilizers.
The amounts of feed and fertilizer purchased could
have been modelled for individual farms based on the
monetary information using standard prices per unit. But
that might have introduced another bias because of
differences in the actual price paid per unit, for example
farms that get discount prices, would in reality have used
more feed or fertilizer than estimated from average prices.
Furthermore Halberg et al. (2000) found that calculation
of purchased fertilizer from prices is very sensible to unit
prices.
Another drawback is the relatively large number of small
co-enterprises in the Danish farm types resulting from
combining many different co-enterprises (for example two
dairy farms growing 5 ha with cash crops, one bread wheat,
the other sugar beets will result in a combined type growing
2.5 ha of each). This issue may not be a problem in regions
with more specialized farm types compared with the Danish
mixed dairy farms.
The national agricultural model did not initially account
for the total use of artificial fertilizer N, diesel and heating
oil in Danish agriculture, why correction factors were used.
While this secures consistency with national level statistics,
it is not a completely satisfactory solution because the error
may in fact be due to an underestimation in specific rather
than all farm types.
The statistical weighting method used to divide the farm
accounts into farm types ensures representativity of each
farm type. However, due to this method it was not possible to
test statistically the variation between farm types. Therefore,
the uncertainty of the N balances was estimated using the
variance of the individual inputs (e.g. fertilizer, feed) and
outputs (e.g. cash crops, milk) (see methods).
Using this method it was established that dairy farm types
had higher N surpluses and losses compared with pig and
cash crop farm types. There was higher N surplus on
conventional farm types compared to organic farm types,
and pig and dairy farm types with high livestock density had
higher N losses compared to farm types with lower livestock
density.
Using the coefficients of variation established for
individual farms on the model types, which are based on

R. Dalgaard et al. / Agriculture, Ecosystems and Environment 117 (2006) 223–237234
averages of a large number of farms, probably overestimates
the variation. Therefore, we find that these are conservative
estimates and it seems therefore reasonable to use these
estimates to assess differences in the emissions also. The
findings were in agreement with studies on Danish pilot
farms (Halberg et al., 1995; Halberg, 1999; Nielsen and
Kristensen, 2005).
In a parallel study by Knudsen et al. (in press) sensitivity
analyses were performed to test how the N farm gate
balances of the dairy farms were affected by changes in
amount of BNF, N efficiency in dairy herd, crop yields and N
in fodder produced on the farm. The sensitivity analyses
showed that the N farm gate balances on conventional farms
had a relatively low degree of sensitivity to changes in
assumptions (Knudsen et al., in press), due to small areas
grown with fixating crops. On organic farms the sensitivity
was higher. The N farm gate balances of the organic dairy
farms increased 17–19% if a 25% higher BNF was assumed.
The N farm gate balances of conventional dairy farms
decreased by 5–8% only with 10% increased N content in
home grown fodder. On this basis we conclude that the
overall pattern and level of nutrient balances and related
emissions on the farm types have a satisfactory degree of
precision. For further details see Knudsen et al. (in press).
In this study the national agricultural model was used to
demonstrate resource uses and emissions of different farm
types, but it can also be used on a sector level. For example
the eight dairy farm types and six pig farm types can be
aggregated (by using population values equal to those in
Tables 1 and 2) into two farm types representing the
specialized dairy sector and specialized pig sector,
respectively. The specialized dairy sector then accounts
for 86% of the milk produced in Denmark and the
specialized pig sector then accounts for 76% of the fattening
pigs produced in Denmark. The establishment of these
specialized sectors can give information on which sector is
main contributor of different emissions, and which sector
has the highest resource use.
4.2. Farm nutrient balances and emissions
Nielsen and Kristensen (2005) studied data from 56
Danish livestock farms collected from 1997 to 2003 and
found that N and P surplus increased significantly with
increasing livestock density. This is in good agreement with
our results showing the emissions of nutrifying substances in
general were higher from farms with high livestock density.
Holbeck and Hvid (2004), Hvid (2005a,b) and Kristensen
et al. (2004) analysed data from farms from 1999 to 2003,
and found that the N surplus was higher from dairy farms in
comparison with pig farms. This is also in accordance with
our results and the results of Nielsen and Kristensen (2005).
In another study based on the national agricultural model
the FADN data from 1999 was updated by FADN data from
2002 (Kristensen et al., 2005b). The study showed that the
nitrate leaching per hectare was 63 kg N. Exactly the same
62
result was obtained in the ‘Evaluation of the Action Plan for
the Aquatic Environment II’ (Action Plan for the Aquatic
Environment, 2003), where the nitrate leaching per hectare
for the year 2002 was estimated. Thus nitrate leaching
estimated by the national agricultural model is in good
agreement with the ‘Evaluation of the Action Plan for the
Aquatic Environment II’.
Watson et al. (2002) estimated the N and P surpluses on
eight Swedish dairy farms (livestock density higher than
0.8 LU ha�1) to 42–128 kg N ha�1 and 1–13 kg P ha�1,
respectively. Our results on N and P surpluses from organic
dairy farms were within these intervals. Verbruggen et al.
(2005) estimated the N surplus on conventional specialized
dairy farms in 2001 in Flanders to 238 kg N ha�1, which is
high compared to our dairy farm types (137–209 kg N ha�1).
But here it must be taken into considerations that the
livestock density in the study from Flanders was
2.98 LU ha�1, which also is high compared to our dairy
farm types. In a study by Haas et al. (2001) the average N
and P surplus on German conventional dairy farms
(2.0 LU ha�1) were 80 kg N ha�1 and 5 kg P ha�1,
respectively. These values are low compared to our study,
primarily because of lower import of fertilizer and feed to
the German farms, which have very high yields on non-
fertilized grass leys.
4.3. Environmental indicators
The FADN contains a lot of information, which until now
has mainly been used for economic purposes. However, as
our study demonstrates the FADN data could also be used to
develop more agri-environmental indicators, which give
insight into the environmental impact caused by the
agricultural sectors in European countries.
The European Environmental Agency (EEA, 2005)
recently developed and evaluated agri-environmental indi-
cators for monitoring the integration of environmental
concerns into the Common Agricultural Policy. EEA (2005)
characterises FADN as the only harmonised micro-
economic database that combines data on farm structure,
input use and economic variables and FADN is described as
a valuable data source for the establishment of agri-
environmental indicators to describe energy use, cropping/
livestock patterns and organic farm incomes. The FADN was
for example used to develop a farm typology to explain
general trends in intensification/extensification. However,
EEA (2005) does not mention FADN as a potential data
source for establishment of agri-environmental indicators
describing the emissions of methane, nitrous oxide and
ammonia.
Much of the information (e.g. agricultural area, crop
yields, livestock density) from the farm accounts which we
used for the national agricultural model is also included in
the FADN, and therefore it might be possible to use the
FADN directly to get an insight into the environmental
impact of the agricultural production. Brouwer et al. (1995)

R. Dalgaard et al. / Agriculture, Ecosystems and Environment 117 (2006) 223–237 235
used data from the FADN to assess the N surpluses at farm
level in the European Union and found that N surpluses
varied widely across groups of farms in the EU because of
the differences in farm structure and input use. Fais et al.
(2005) developed a methodology where FADN data were
combined with statistical, administrative and cartographic
information, and then by the use of geographic information
systems (GIS) technology it was possible to produce and
organise data at geographical level within a region in Italy.
Thereby data for environmental indicators (e.g. fertilizer
consumption, soil erosion risk) could be spatial referenced
and used for agri-environmental analysis in specific regions.
Other types of area-based environmental indicators can
also be obtained from the national agricultural model; for
example the use of non-renewable resources as heating
oil, diesel and artificial fertilizer P (Tables 4 and 5). The
purchase of chemicals (monetary units per ha) can also be
used as an area-based environmental indicator, but a major
disadvantage is that the chemicals are not specified and
therefore their toxicity and chemical/physical properties
are unknown. The percentage of agricultural area with
permanent grass and set-aside indicates the amount of
extensively used agricultural area, and can therefore also
be used as an environmental indicator. On the other hand
data from FADN cannot be directly used for estimating
agri-environmental indicators such as soil quality and
biodiversity.
The environmental indicators presented in this paper are
all area-based. There is an increasing interest in product-
based environmental assessments (LCA) because there is a
need to evaluate global emissions and impacts from the
whole production chain in relation to types and amounts of
products consumed (Haas et al., 2000; de Boer, 2003;
Halberg et al., 2005). Product-based environmental assess-
ments of agricultural products based on the data from the
national agricultural statistics have been published by
Nielsen et al. (2003) and Dalgaard and Halberg (2005).
5. Conclusion
On the basis of a representative sample of farm accounts
collected and processed for agricultural statistics and for
reporting to FADN, a national agricultural model has been
established that can provide data of resource use, production
and environmentally important emissions for a set of
representative farm types. Within each farm type there was a
consistent relation between resource use, production and
emissions, and all 31 farm types cover the entire Danish
agricultural sector.
Production data and resource use (e.g. soybean meal,
diesel, artificial fertilizer N) for all farm types were
aggregated and by comparison they were shown to be in
good agreement with Danish National Statistics, except for
artificial fertilizer N, diesel and heating oil where it was
necessary to use correction factors to reach the same level as
63
the Danish National Statistics. Thereafter the national
agricultural model could be used for delivering data from the
31 coherent and representative farm types for area-based and
product-based (LCA) environmental assessments.
Results (per ha) showed that pig farm types imported more
heating oil and less artificial fertilizer P compared to other
farms, and dairy farms had the highest consumption of diesel.
N in manure and artificial fertilizer imported to the selected
farm types varied inversely with the livestock density.
Results (per ha) on emissions from the selected farm
types showed that the emissions of nutrients (nitrate,
ammonia, nitrous oxide and phosphate) in general were
higher on the farm types with the highest livestock density.
Conventional dairy farm types in general had higher nitrate
emissions but lower phosphate emissions compared with pig
farm types. The methane emission was higher from dairy
farm types compared with all other farm types. In general the
conventional dairy farms emitted more nitrate, ammonia,
and nitrous oxide, compared with organic dairy farms.
It can be concluded that the resulting national agricultural
model successfully establishes a method of modelling
coherent and representative farm types based on generally
available data. This method will then facilitate the establish-
ment of representative agro-ecological models of typical
farms, which can be used for environmental assessments.
References
Action Plan for the Aquatic Environment, 2003. Rapport fra arbejdsgruppen
for udarbejdelse af en strategi for nedbringelse af landbrugets belastning
af vandmiljøet med fosfor. Del IV. Available on-line (March 1st 2006) at
http://www.vmp3.dk/Files/Filer/Slutrapporter/del-4-1012031-med-
logo.pdf.
Agricultural Statistics, 2000. Statistik om landbrug, gartneri og skovbrug.
Danmarks Statistik. ISBN 87-501-1195-7, 287 pp.
Andersen, J.M., Poulsen, H.D., Børsting, C.F., Rom, H.B., Sommer, S.G.,
Hutchings, N.J., 2001. Ammoniakemission fra landbruget siden midten
af 80’erne. Faglig rapport fra DMU 353, pp. 1–48.
Basset-Mens, C., van der Werf, H.M.G., 2005. Scenario-based environ-
mental assessment of farming systems: the case of pig production in
France. Agric. Ecosyst. Environ. 105, 127–144.
Brouwer, F.M., Godeschalk, F.E., Hellegers, P.J.G.J., Kelholt, H.J., 1995.
Mineral balances at farm level in the European Union. Onderzoekver-
slag Landbouw Economisch Instituut, pp. 137–141.
Cederberg, C., Flysjo, A., 2004. Environmental Assessment of Future Pig
Farming Systems. Quantifications of Three Scenarios from the FOOD
21 Synthesis Work. SIK-report 723, pp. 1–54.
Cederberg, C., Mattsson, B., 2000. Life cycle assessment of milk produc-
tion—a comparison of conventional and organic farming. J. Clean Prod.
8, 49–60.
Christensen, T., Huusom, H., 2003. Evaluering af informations—og rad-
givningsbaserede virkemidler i Pesticidhandlingsplan II. Arbejdsrap-
port fra Miljøstyrelsen 22, pp. 1–81.
Dalgaard, R., Halberg, N., 2005. Life cycle assessment (LCA) of Danish
pork. In: Proceedings from the International Workshop on Green Pork
Production, Paris, France, 25–27 May 2005, pp. 165–167.
Dalgaard, T., Halberg, N., Porter, J.R., 2001. A model for fossil energy use
in Danish agriculture used to compare organic and conventional farm-
ing. Agric. Ecosyst. Environ. 87 (1), 51–65.
de Boer, I.J.M., 2003. Environmental impact assessment of conventional
and organic milk production. Livest. Prod. Sci. 80, 69–77.

R. Dalgaard et al. / Agriculture, Ecosystems and Environment 117 (2006) 223–237236
EEA, 2005. Agriculture and environment in EU-15. An indicator report.
European Environmental Agency, Copenhagen. Available on-line
(March 1st 2006) at http://webpubs.eea.eu.int/content/irena/Latestpro-
ducts.htm.
Eriksson, I.S., Elmquist, H., Stern, S., Nybrant, T., 2004. Environmental
systems analysis of pig production—the impact of feed choice. Int. J.
LCA 1–12.
European Commision, 2003. Communication from the commission to the
council and the European Parliament. Integrated Product Policy. Build-
ing on Environmental Life-Cycle Thinking. COM (2000) 302 final.
Available on-line (March 1st 2006) at http://europa.eu.int/eur-lex/en/
com/cnc/2003/com2003_0302en01.pdf.
FADN, 2006. Farm Accountancy Data Network. Available on-line (March
1st 2006) at http://europa.eu.int/comm/agriculture/rica/index_en.cfm.
Fais, A., Nino, P., Giampaolo, A., 2005. Microeconomic and geo-
physical data integration for agri-environmental analysis, georefer-
encing FADN data: A case study in Italy. In: Paper prepared for
presentation at the XIth seminar of the EAAE (European Association
of Agricultural Economists), ’The Future of Rural Europe in the
Global Agri-Food System’, Copenhagen, Denmark, 24–27 August
2005.
Gyldenkærne, S., Mikkelsen, M.H., 2004. Projection of Greenhouse Gas
Emission from the Agricultural Sector. Until 2017. Research Notes from
National Environmental Research Institute. Report 194. Ministry of the
Environment, Denmark.
Gyldenkærne, S., Munier, B., Olesen, J.E., Olesen, S.E., Petersen, B.M.,
Christensen, B.T., 2005. Inventory of CO2 emissions from land use and
land use change. LULUCF (land use, land use change and forestry).
Method description and inventory for 1990–2003. Report no 213 from
the National Environmental Research Institute. 81 pp. Available on-line
(March 1st 2006) at http://www2.dmu.dk/1_viden/2_Publikationer/
3_arbrapporter/rapporter/AR213.pdf.
Haas, G., Wetterich, F., Geier, U., 2000. Life cycle assessment framework in
agriculture on the farm level. Int. J. LCA 5, 345–348.
Haas, G., Wetterich, F., Kopke, U., 2001. Comparing intensive, extensified
and organic grassland farming in Southern Germany by process life
cycle assessment. Agric. Ecosyst. Environ. 83, 43–53.
Halberg, N., 1999. Indicators of resource use and environmental impact for
use in a decision aid for Danish livestock farmers. Agric. Ecosyst.
Environ. 76, 17–30.
Halberg, N., Kristensen, I.S., 1997. Expected crop yield loss when con-
verting to organic dairy farming in Denmark. Biol. Agric. Hortic. 14 (1),
25–41.
Halberg, N., Kristensen, E.S., Kristensen, I.S., 1995. Nitrogen turnover on
organic and conventional mixed farms. J. Agric. Environ. Ethics 8 (1),
30–51.
Halberg, N., Kristensen, I.S., Dalgaard, T., 2000. Linking data sources and
models at the levels of processes, farm types, and regions. In: Weidema,
B., Meeusen, M.J.G. (Eds.), Agricultural Data for Life Cycle Assess-
ments, vol. 1. LEI, The Hague, pp. 16–30.
Halberg, N., van der Werf, H.M.G., Basset-Mens, C., Dalgaard, R., de Boer,
I.J.M., 2005. Environmental assessment tools for the evaluation and
improvement of European livestock production systems. Livest. Prod.
Sci. 96, 33–50.
Høgh-Jensen, H., Loges, R., Jørgensen, F.V., Vinther, F.P., Jensen, E.S.,
2004. An empirical model for quantification of symbiotic nitrogen
fixation in grass-clover mixtures. Agric. Syst. 82 (2), 181–194.
Holbeck, H.B., Hvid, K.S., 2004. Næringsstofoverskud pa kvæg-, svine- og
planteavlsbedrifter i demonstrationsprojekt med grønne regnskaber
1999–2001. Available on-line (March 1st 2006) at http://www.lr.dk/
planteavl/diverse/groent_regnskab.htm.
Hutchings, N., Sommer, S.G., Andersen, J.M., Asman, W.A.H., 2001. A
detailed ammonia emission inventory for Denmark. Atmos. Environ. 35,
1959–1968.
Hutchings, N., Nielsen, A.H., Grant, R., Gyldenkærne, S., Knudsen, L.,
2005. Regulations and environment. Denmark. Part I. In: Bos, J.,
Pflimlin, A., Aarts, F., Vertes, F. (Eds.), Nutrient management on farm
64
scale. How to attain policy objectives in regions with intensive dairy
farming. Report of the first workshop of the EGF Workshop. Available
on-line (March 1st 2006) at http://www.nitrogenworkshop.org/PDF/
Rapport_83_drukversie.pdf, Plant Res. Int. 83, 77–80.
Hvid, S.K., 2005a. Næringsstofregnskaber for kvægbrug 2003. Planteavl-
sorientering [07-539]. Landscentret. Dansk Landbrugsradgivning.
Available on-line (March 1st 2006) at http://www.lr.dk/planteavl/infor-
mationsserier/planteavlsorientering/pl07-539.htm.
Hvid, S.K., 2005b. Næringsstofregnskaber for svinebrug 2003. Planteavl-
sorientering [07-543]. Landscentret. Dansk Landbrugsradgivning.
Available on-line (March 1st 2006) at http://www.lr.dk/planteavl/infor-
mationsserier/planteavlsorientering/pl07-543.htm.
Hvid, S.K., Weidema, B., Kristensen, I.S., Dalgaard, R., Nielsen, A.H.,
Bech-Larsen, T., 2004. Miljøvurdering af landbrugsprodukter. Miljøs-
tyrelsen, Miljøprojekt, 954. Available on-line (March 1st 2006) at http://
www.mst.dk/udgiv/publikationer/2004/87-7614-395-3/html/kolo-
fon.htm.
IPCC, 1997. Greenhouse gas inventories. Revised 1996 IPCC Guidelines for
National Greenhouse Gas Inventories. Available on-line (March 1st
2006) at http://www.ipcc.ch/pub/guide.htm.
IPCC, 2000. Good practice Guidance and Uncertainty Management in
National Greenhouse Gas Inventories. Chapter 4. Agriculture. 4.1–
4.83. IPCC. Available on-line (March 1st 2006) at http://
www.ipcc.ch/pub/guide.htm.
Jarvis, S.C., Aarts, H.F.M., 2000. Nutrient management from a farming
systems perspective. In: Søegaard, K., Ohlsson, C., Sehested, J.,
Hutchings, N.J., Kristensen, T. (Eds.), Grassland Farming. Balancing
environmental and economic demands, vol. 5. Proceedings of the 18th
General Meeting of the European Grassland Federation, Aalborg, Den-
mark, 22–25 May 2000, pp. 363–374.
Jarvis, S.C., Menzi, H., 2004. Optimising best practice for N management in
livestock systems: meeting production and environmental targets. In:
Luscher, A., Jeangros, B., Kessler, W., Huguenin, O., Lobsiger, M.,
Millar, N., Suter, D. (Eds.), Land Use Systems in Grassland Dominated
Regions, vol. 9. Proceedings of the 20th General Meeting of the
European Grassland Federation, Luzern, Switzerland, 21–24 June
2004, pp. 361–372.
Knudsen, M.T., Kristensen, I.S., Berntsen, J., Petersen, B.M., Kristensen,
E.S., in press. Estimated N leaching losses for organic and conventional
farming in Denmark. J. Agric. Sci.
Kristensen, E.S., Høgh-Jensen, H., Kristensen, I.S., 1995. A simple model
for estimation of atmospherically-derived nitrogen in grass-clover
systems. Biol. Agric. Hortic. 12, 263–276.
Kristensen, I., 2005. Uncertainties on farm gate N-balances. Available on-
line (March 1st 2006) at http://www.agrsci.org/var/agrsci/storage/ori-
ginal/application/5a688dc9a578d95250a831cfaac06735.pdf.
Kristensen, I.S., Nielsen, A.H., Kristensen, T., Hvid, S.K., Kristensen, K.,
2004. Usikkerhed ved beregning af nøgletal for miljøpavirkninger. Kap
5. i MST-rapport: ‘‘Miljøvurdering af landbrugsprodukter’’. Miljørap-
port [954], pp. 39–46. Available on-line (March 1st 2006) at http://
www.mst.dk/udgiv/publikationer/2004/87-7614-395-3/html.
Kristensen, I.S., Halberg, N., Nielsen, A.H., Dalgaard, R., 2005a. N-turn-
over on Danish mixed dairy farms. Part II. In: Bos, J., Pflimlin, A., Aarts,
F., Vertes, F. (Eds.), Nutrient management on farm scale. How to attain
policy objectives in regions with intensive dairy farming. Report of the
first workshop of the EGF Workshop. Available on-line (March 1st
2006) at http://www.nitrogenworkshop.org/PDF/Rapport_83_drukver-
sie.pdf, Plant Res. Int. 83, 91–109.
Kristensen, I.S., Dalgaard, R., Halberg, N., Petersen, B.M., 2005b. Kvæl-
stofbalance og -tab fra forskellige bedriftstyper. Sammendrag af indlæg.
Plantekongres 2005. 11–12 januar, Herning Kongrescenter. ISBN 87-
984996-6-1. pp. 190–191. Available on-line (March 1st 2006) at http://
www.lr.dk/planteavl/diverse/plantekongres2005_tema_11.htm#ses-
sion11-1.
Larsen, I., 2003. LCA project. Method description. Available on-line
(March 1st 2006) at http://www.lcafood.dk. Go to ’Materials’ and
’Larsen et al., 2003’. Report, pp. 1–16.

R. Dalgaard et al. / Agriculture, Ecosystems and Environment 117 (2006) 223–237 237
Masse, D.I., Croteau, F., Patni, N.K., Masse, L., 2003. Methane emissions
from dairy cow and swine manure slurries stored at 10 and 15 8C. Can.
Biosyst. Eng. 45, 6.1–6.6.
Møllenberg, S., 2001. EU’s regnskabsstatistik for jordbrug. Metoder og
resultater vedrørende Danmark. Food and Resource Economic Institute.
Available on-line (March 1st 2006) at http://www.kvl.foi.dk/upload/foi/
docs/publikationer/working%20papers/2001/11.pdf.
Møller, J., Thøgersen, R., Kjeldsen, A.M., Weisbjerg, M.R., Søegaard, K.,
Hvelplund, T., Børsting, C.F., 2000. Fodermiddeltabel. Sammensætning
og foderværdi af fodermidler til kvæg. Rapport nr. 91. Landbrugets
Radgivningscenter.
Nielsen, A.H., Kristensen, I.S., 2005. Nitrogen and phosphorus surplus at
Danish dairy and pig farms in relation to farm characteristics. Livest.
Prod. Sci. 96, 95–107.
Nielsen, P.H., Nielsen, A.M., Weidema, B.P., Dalgaard, R., Halberg, N.,
2003. LCA food database. Available on-line (March 1st 2006) at http://
www.lcafood.dk.
Payraudeau, S., van der Werf, H.M.G., 2005. Environmental impact assess-
ment for a farming region: a review of methods. Agric. Ecosyst.
Environ. 107, 1–19.
Petersen, B.M., Olesen, J.E., Heidmann, T., 2002. A flexible tool for
simulation of soil carbon turnover. Ecol. Model. 151, 1–14.
Plantedirektoratet, 1998. Vejledning og skemaer. 1998/1999. Ministeriet for
fødevarer, Landbrug og Fiskeri.
Poppe, K.J., Meeusen, M.J.G., 2000. Using a Farm Accountancy Data
Network in data management for LCA. In: Weidema, B., Meeusen,
M.J.G. (Eds.), Agricultural Data for Life Cycle Assessments, vol. 1.
LEI, The Hague, pp. 115–127.
Poulsen, H.D., Kristensen, V.F., 1998. Standard values for farm manure. A
Revaluation of the Danish Standard Values Concerning the Nitrogen,
Phosphorus and Potassium Content of Manure. Danish Institute of
Agricultural Sciences report, pp. 1–160. Animal Husbandry.
65
Poulsen, H.D., Børsting, C.F., Rom, H.B., Sommer, S.G., 2001. Kvælstof,
fosfor og kalium i husdyrgødning - normtal 2000. DJF rapport Husdyr-
brug, nr. 36.
Thomassen, M.A., de Boer, I.J.M., 2005. Evaluation of indicators to assess
the environmental impact of dairy production systems. Agric. Ecosyst.
Environ. 111 (1–4), 185–199.
UNEP, 2004. United Nations Environment Programme. Life Cycle Initia-
tive. Available on-line (March 1st 2006) at http://www.uneptie.org/pc/
sustain/lcinitiative/.
Verbruggen, I., Nevens, F., Mulier, A., Meul, M., Reheul, D., Salomez, J.,
Hofman, G., Declercq, P., Bries, J., Herelixka, E., Ver Elst, P., Vogels,
N., 2005. Flanders. In: Bos, J., Pflimlin, A., Aarts, F., Vertes, F. (Eds.),
Nutrient management on farm scale. How to attain policy objectives in
regions with intensive dairy farming. Report of the first workshop of the
EGF workshop. Available on-line (March 1st 2006) at http://www.ni-
trogenworkshop.org/PDF/Rapport_83_drukversie.pdf, Plant Res. Int.
83, 165–184.
Vinther, F.P., Hansen, S., 2004. SimDen - en simpel model til kvantificering
af N2O-emission og denitrifikation. DJF rapport Markbrug, nr. 104.
Danish Institute of Agricultural Sciences.
Watson, C.A., Bengtsson, H., Ebbesvik, M., Løes, A.K., Myrbeck, A.,
Salomon, E., Schroder, J., Stockdale, E.A., 2002. A review of farm-scale
nutrient budgets for organic farms as a tool for management of soil
fertility. Soil Use Manage. 18, 264–273.
Weidema, B.P., Mortensen, B., Nielsen, P., Hauschild, M., 1996.
Elements of an Impact Assessment of Wheat Production. Institute
for Product Development, Technical University of Denmark, pp.
1–12.
Weidema, B.P., Thodberg, L., Nielsen, A.H., Kristensen, I.S., Herman-
sen, J.E., Hvid, S.K., 2002. Produktorienteret miljøindsats i
landbrugets primærproduktion. Arbejdsrapport fra Miljøstyrelsen
19, 5–73.

66

LCA of Soybean Meal RANDI DALGAARD1,2, JANNICK SCHMIDT2, NIELS HALBERG1, PER CHRISTENSEN2, MIKKEL THRANE2 AND WALTHER A. PENGUE3
1) University of Aarhus, Faculty of Agricultural Sciences, Department of Agroecology
and Environment, P.O. Box 50, DK-8830 Tjele
2) Aalborg University, Department of Development and Planning, Fibigerstræde 13,
DK-9220 Aalborg East
3) GEPAMA, Landscape Ecology Group, University of Buenos Aires, Pab.III.FADU,
1428, Buenos Aires, Argentina
I
2
67

68

LCA for Food Products Soybean Meal
1© 2007 ecomed publishers (Verlagsgruppe Hüthig Jehle Rehm GmbH), D-86899 Landsberg and Tokyo • Mumbai • Seoul • Melbourne • ParisInt J LCA 2007 (OnlineFirst): 15
LCA for Food Products (Subject Editor: Niels Jungbluth)
LCA Case Study
LCA of Soybean Meal
Randi Dalgaard1,2*, Jannick Schmidt2, Niels Halberg1, Per Christensen2, Mikkel Thrane2 and Walter A. Pengue3
1 University of Aarhus, Faculty of Agricultural Sciences, Department of Agroecology and Environment, 8830 Tjele, Denmark.2 Department of Development and Planning, Aalborg University, Fibigerstræde 13, 9220 Aalborg East, Denmark3 GEPAMA, Landscape Ecology Group, University of Buenos Aires, Pab.III.FADU, 1428, Buenos Aires, Argentina
*Corresponding author ([email protected])
DOI: http://dx.doi.org/10.1065/lca2007.06.342
Please cite this paper as: Dalgaard R, Schmidt J, Halberg N,Christensen P, Thrane M, Pengue WA (2007): LCA of SoybeanMeal. Int J LCA, DOI: http://dx.doi.org/10.1065/lca2007.06.342
Abstract
Background, Aim and Scope. Soybean meal is an important pro-tein input to the European livestock production, with Argen-tina being an important supplier. The area cultivated with soy-beans is still increasing globally, and so are the number of LCAswhere the production of soybean meal forms part of the prod-uct chain. In recent years there has been increasing focus onhow soybean production affects the environment. The purposeof the study was to estimate the environmental consequences ofsoybean meal consumption using a consequential LCA approach.The functional unit is 'one kg of soybean meal produced in Ar-gentina and delivered to Rotterdam Harbor'.
Materials and Methods. Soybean meal has the co-product soy-bean oil. In this study, the consequential LCA method was ap-plied, and co-product allocation was thereby avoided throughsystem expansion. In this context, system expansion implies thatthe inputs and outputs are entirely ascribed to soybean meal, andthe product system is subsequently expanded to include the avoidedproduction of palm oil. Presently, the marginal vegetable oil onthe world market is palm oil but, to be prepared for fluctuationsin market demands, an alternative product system with rapeseedoil as the marginal vegetable oil has been established. EDIP97(updated version 2.3) was used for LCIA and the following im-pact categories were included: Global warming, eutrophication,acidification, ozone depletion and photochemical smog.
Results. Two soybean loops were established to demonstratehow an increased demand for soybean meal affects the palm oiland rapeseed oil production, respectively. The characterized re-sults from LCA on soybean meal (with palm oil as marginal oil)were 721 g CO2 eq. for global warming potential, 0.3 mg CFC11eq. for ozone depletion potential, 3.1 g SO2 eq. for acidificationpotential, –2 g NO3 eq. for eutrophication potential and 0.4 gethene eq. for photochemical smog potential per kg soybean meal.The average area per kg soybean meal consumed was 3.6 m2year.Attributional results, calculated by economic and mass alloca-tion, are also presented. Normalised results show that the mostdominating impact categories were: global warming, eutrophica-tion and acidification. The 'hot spot' in relation to global warm-ing, was 'soybean cultivation', dominated by N2O emissions fromdegradation of crop residues (e.g., straw) and during biological
nitrogen fixation. In relation to eutrophication and acidifica-tion, the transport of soybeans by truck is important, and sensi-tivity analyses showed that the acidification potential is verysensitive to the increased transport distance by truck.
Discussion. The potential environmental impacts (except pho-tochemical smog) were lower when using rapeseed oil as themarginal vegetable oil, because the avoided production of rape-seed contributes more negatively compared with the avoidedproduction of palm oil. Identification of the marginal vegetableoil (palm oil or rapeseed oil) turned out to be important for theresult, and this shows how crucial it is in consequential LCA toidentify the right marginal product system (e.g., marginal veg-etable oil).
Conclusions. Consequential LCAs were successfully performedon soybean meal and LCA data on soybean meal are now avail-able for consequential (or attributional) LCAs on livestock prod-ucts. The study clearly shows that consequential LCAs are quiteeasy to handle, even though it has been necessary to includeproduction of palm oil, rapeseed and spring barley, as these pro-duction systems are affected by the soybean oil co-product.
Recommendations and Perspectives. We would appreciate it ifthe International Journal of Life Cycle Assessment had articleson the developments on, for example, marginal protein, mar-ginal vegetable oil, marginal electricity (related to relevant mar-kets), marginal heat, marginal cereals and, likewise, on metalsand other basic commodities. This will not only facilitate thework with consequential LCAs, but will also increase the qual-ity of LCAs.
Keywords: Agriculture; consequential LCA; soybean meal; sys-tem expansion
Introduction
Soybean meal is an important input to livestock and fishproduction globally and comes from the cake of soybeansafter crushing the beans and extracting the soybean oil. In2004, the consumption of soybean meal in the EU25 was 34million tonnes (Oil World 2005). The amount of soybeansand cake of soybeans traded globally increased from 48million tonnes in 1985 to 106 million tonnes in 2004. Soy-beans exported from USA were the fourth most importantagricultural commodity in dollar value traded globally in2004, with soybeans from Brazil ranking as no. 7 and cakeof soybeans from Argentina as no. 10 (FAOSTAT 2006a).
69

Soybean Meal LCA for Food Products
2 Int J LCA 2007 (OnlineFirst)
The 6,979 million US dollar worth of soybeans imported toChina in 2004 topped the FAO's list of agricultural com-modities traded globally and four European countries (Spain,Italy, the Netherlands and Denmark) with large pig produc-tions imported 46% of the soybean meal from Argentina,Spain, Italy, the Netherlands and Denmark. The global areacultivated with soybeans has expanded from 38 million hect-ares in 1975 to 91 million hectares in 2005 (FAOSTAT 2006b),with the major land increases taking place in Argentina andBrazil. In Argentina, the area with soybean increased from 6million hectares in 1996 to 14.2 million in 2004, of which thetransgenic varieties accounted for more than 90%, under no-tillage systems (Pengue 2006), where ploughing is not used.The environmental impacts from soybean production havebeen addressed in several reports, e.g., Dros (2004), Pengue(2005), Benbrook (2005) and Casson (2003). The combina-tion of no-tillage systems and transgenic Roundup Ready (RR)soybeans has made large-scale soybean cultivation a powerfulcompetitor to other types of land use and has caused both aconcentration of land tenure, the conversion of traditionalfarming systems with pastures and hay fields, cereals and othercrops, and deforestation. More than 40% of the increasedsoybean area in Argentina has come from virgin lands, in-cluding forests and savannahs, thus causing losses inbiodiversity (Pengue 2006). Likewise, in Brazil, the possibilityto obtain cheap credit for a fast-return export crop produc-tion has allowed soybean producers to expand in a complexinteraction with the increasing cattle production leading todeforestation (Dros 2004). The use of glyphosate in Argentinahas increased to more than 45 million kg in 2004, up from 20million in 2000 and less than 1 million in the beginning of the90s (Pengue 2006). While glyphosate as an active ingredientwas previously considered harmless to humans and warm-blooded animals (Anonymous 1996), new research indicatesthat some of the formulations used with this type of pesticidemay cause health problems for farm workers and negative en-vironmental effects on biodiversity and aquatic life, as discussedby Ho & Cummings (2005) and Ho & Ching (2003).
Soybean production is often part of the system when per-forming Life Cycle Assessments of different agricultural prod-ucts. Analyzing the environmental consequences of changesin food consumption (Gerbens-Leenes & Nonhebel 2002)or livestock production systems often involves changes inthe demand for soybean meal (Cederberg & Mattson 2000,Eriksson et al. 2004, de Boer 2003, Cederberg & Flysjö 2004,Basset-Mens & van der Werf 2005, van der Werf et al. 2005,Dalgaard & Halberg 2005). This is particularly the case whenthe LCA is based on the consequential approach where theanalysts are looking for the marginal product being used orsaved when expanding the delimitations of the investigatedsystem in order to avoid allocation (Nielsen et al. 2004).
Mass or economic allocation has been used to distribute theenvironmental burden between the soybean meal and thesoybean oil in most of the LCAs on livestock products wheresoybean meal is included. In this article, however, we are seek-ing to avoid an allocation. Instead, we aim at following theprinciples of system expansion according to ISO 14044 (2006).This means that the system boundaries of soybean produc-tion must be enlarged in order to include the productionsystem of the vegetable oil substituted by the soybean oil.
1 Goal and Scope Definition
More specifically, the objectives are• to establish a reliable representation of soybean meal
production for use in LCAs of European livestock pro-duction chains
• to identify the environmental hot spots in the productchain of soybean meal
In order to ensure the usability of the LCA presented forresearchers preferring to use allocation to handle co-prod-ucts, sufficient numbers and figures will be displayed to al-low for this.
The purpose of this study is to estimate the environmentalconsequences of soybean meal consumption, and to providedata on the LCA of soybean meal. This is partly becausethere is a lack of these data for LCAs on livestock products,and because soy protein could potentially have a significantenvironmental impact as a consequence of the increasingproduction of meat products worldwide.
Soybean meal is co-produced with soy oil, and a demand forsoybean meal obviously necessitates a production of soybeanoil. The production of oil might affect other agricultural prod-uct systems, but to what extent, and how can it be quantified?In this article; these issues will be analyzed further.
The functional unit is 'one kg of soybean meal produced inArgentina and delivered to Rotterdam Harbor in the Neth-erlands'. The Netherlands is the country within Europe thatimports the largest amount of oil meals (Oil World 2005).
The impact categories considered include: global warming,ozone depletion, acidification, eutrophication and photo-chemical smog. Impact categories concerning toxic aspectsare not included due to methodological limitations. Landuse, impacts on biodiversity and other impacts are not inte-grated in the present LCA, due to methodological limita-tions (as discussed by Milà i Canals et al. (2007)), althoughresults on land use (unit: m2year) are presented.
2 Methods
2.1 LCA approach
Identification and delimitation of the analyzed product sys-tem is increasingly seen as being important for the outcomeand quality of the LCA (Weidema 2003, Ekvall & Weidema2004, Schmidt 2004). Two fundamentally different ap-proaches can be used in this respect: the new (consequen-tial) approach and the traditional (attributional) approach.Most existing LCAs are based on the attributional approach,but the tendency is for studies to increasingly use the new(consequential) approach (Thrane 2006, Schmidt & Weidema2007, Ekvall & Andræ 2006, Cederberg & Stadig 2003, Kim& Dale 2002, Dalgaard & Halberg 2005, Weidema 1999). Inthe present study, it has been chosen to apply the consequen-tial approach, which has two main characteristics:
• It seeks to model the technology (or processes) actu-ally affected by a change in demand (the marginal tech-nology).
• Co-product allocation is 'systematically' avoided throughsystem expansion.
70

LCA for Food Products Soybean Meal
Int J LCA 2007 (OnlineFirst) 3
These characteristics are opposite to attributional LCA,where average technologies (not marginal) are used, andwhere co-product allocation is often handled by mass orvalue allocation (Weidema 2003).
In consequential LCA we basically use a 'market oriented'approach to identify the affected technology (or process),also called marginal. We continuously ask: what is affectedby a change in demand? For example, when impacts relatedto electricity input for a certain unit process are considered– the question is: what are the environmental consequencesrelated to a change (typically small) in the demand of elec-tricity in this market? Among the Nordic countries, this ismainly coal or gas-based technologies according to Weidema(2003). Hence, in this case the marginal technology is gas orcoal (or a mix). In traditional (attributional) LCA, electric-ity consumption is often modeled as an average of all elec-tricity sources within the region, but this would then in-clude electricity from, for example, windmills, which produceas a function of the wind speed – not the demand. The sameapplies to other renewable energy sources such as hydro-power, which should be left out of the product system, ac-cording to the consequential LCA. Thus, in consequentialLCA, only affected technologies (or processes) should beincluded, and socio-economical considerations should beapplied to identify these (Weidema 2003).
In this article, the term 'marginal technology (or process)'refers to the technology or process, which is actually affectedby a change in demand. The changes that are considered inthis article are small, which means that they do not affectthe determining parameters for the overall market situation,i.e., the direction of the trend in market volume and theconstraints on and production costs of the products and tech-nologies involved (Weidema et al. 2004).
Concerning the handling of co-product allocation, attri-butional LCAs have often based allocation on the relativevalue of the products and co-products, be it mass or otherparameters. In consequential LCA, however, this is entirelyavoided through system expansion (if technical subdivisionof the processes is impossible). System expansion means theinputs and outputs are entirely ascribed to the product ofinterest (often the main product). Subsequently, the productsystem is expanded to include the products avoided, i.e.,products that are avoided due to the co-products. Accord-ingly, when performing consequential LCA on soybean meal,the inputs and outputs relate entirely to the soybean meal,but the avoided production of vegetable oil, caused by theco-product soybean oil, is included in the calculations. Be-cause vegetable oil (e.g., palm oil, rapeseed oil) is nearlyalways co-produced with protein (e.g., palm kernel meal,rapeseed meal), this will introduce another need for systemexpansion, which again could include a co-production ofprotein, etc. This never-ending story is described by Weidema(1999) as the so-called soybean-rapeseed-loop. While Wei-dema at the time assumed rapeseed to be the marginal oilreplaced by soybean oil, in this article we will demonstrateand compare the use of this loop principle for LCAs of soy-bean meal using both palm oil and rapeseed oil as the mar-ginal products to be replaced. Palm oil is chosen becauseSchmidt & Weidema (2007) presently identified this as the
marginal oil. For further details regarding the consequentialLCA methodology, see Ekvall & Weidema (2004) andWeidema (2003).
2.2 Method applied for LCIA
Among the different methods available for Life Cycle Im-pact Assessment (LCIA), we have used the EDIP97 (Wenzelet al. 1997, updated version 2.3). The method has been imple-mented in the PC-tool SimaPro 6.0 (Pré 2004). The EDIP-methodology has recently been launched in a revisedEDIP2003 version (Hauschild & Potting 2005) but, as thisnew revised version has not yet been implemented in anyPC-tool, it was decided to stick to the well-documented andfamiliar EDIP97 methodology.
EDIP97 also includes human toxicity, eco-toxicity, waste andresource use, but we have chosen not to include these im-pact categories due to methodological limitations regardingpesticide emissions from agriculture.
2.3 System delimitation
The soybean plant (Glycine max.) is a legume, which growsto a height of 120–180 cm (Tengnäs & Nilsson 2003). Soy-beans contain approximately 35% protein and 18% oil(Møller et al. 2003, an update from Møller et al. 2000) andare the highest-yielding source of vegetable protein globally(Dros 2004, p. 7). The protein is primarily used for live-stock feed after crushing and extraction of the oil, which ismainly used for consumption.
Argentina has become the largest global exporter of soy-bean cake and is projected to have the highest increase inexport until 2014 (FAPRI 2006). Therefore, in this study,soybean meal produced in Argentina is used as the marginalsoybean meal. An increase in the demand for soybean mealimplies an increase in the production of soybean oil, whichwould then compete with other vegetable oils on the worldmarket. Following the methodology of consequential LCA,this 'avoided production' of vegetable oil must be includedin the LCA of soybean meal (protein).
As mentioned earlier, rapeseed oil was until recently regardedas the marginal oil that was affected when the demand forgeneral vegetable oils changed (Weidema 2003). Recent stud-ies, however, show that palm oil has increased its competi-tiveness compared to other major oils on the market - rape,soy and sunflower oils (Schmidt & Weidema 2007).
The fatty acid composition of rapeseed, soy, sun and palmoil is not the same. Thus, they are not completely substitut-able. However, according to Schmidt & Weidema (2007),the oils are substitutable within the most important applica-tions: frying oil/fat, margarine, shortening and possibly saladoils. One of the co-products from palm oil milling is palmkernels, which are processed into palm kernel oil and palmkernel meal. The applications of palm kernel oil, which is alauric oil, differ from the most important applications men-tioned above. The only other lauric oil on the market is co-conut oil. The use of this oil is constrained due to a 5–7 yearmaturing period before harvesting can begin making it lessresponsive to fluctuations in market demand (Schmidt &
71

Soybean Meal LCA for Food Products
4 Int J LCA 2007 (OnlineFirst)
Weidema 2007). Therefore, changes in the production ofpalm kernel oil are not considered likely to affect the pro-duction of coconut oil. Schmidt & Weidema (2007) arguethat palm oil and the co-product palm kernel oil jointly canbe considered as the marginal oil on the global market. Inthe following, 'palm oil' designates a mix of oil from meso-carp of fresh fruit bunches and oil from palm kernels.
As market situations often change from one year to another,we have decided to make two LCAs. One with palm oil asthe marginal oil (here called: Soybean meal (PO)), and onewith rapeseed oil as the marginal oil (here called: Soybeanmeal (RSO)).
Avoided production of palm oil and rapeseed oil impliesavoided production of palm kernel meal or rapeseed meal,respectively. This avoided production of meal will be com-pensated for by the production of marginal meal. Thus, ademand for soybean meal does not only result in produc-tion of the demanded amount, but also in the production ofan extra amount of soybean meal to compensate for the'missing meal' (palm kernel meal or rapeseed meal) that aremissing because of the avoided oil production. The extraamount of soybean meal produced will again cause anavoided production of meal, and this loop will continue.The mass of extra soybean meal produced is very dependenton the protein and energy contents of the ingredients in-volved, and is therefore not the same in the LCA of soybeanmeal (PO) as in the LCA of soybean meal (RSO). To dem-onstrate this difference and to facilitate the LCAs of soy-bean meal, two loops (based on the concept developed byWeidema (1999)) will be established for the two LCAs ofsoybean meal: A soybean/palm loop for the soybean meal(PO), and a soybean/rapeseed loop for the soybean meal(RSO). Data on dry matter, oil, protein and energy contentsof relevant items in the loops are based on data from Table 1.The yields of soybean meal and soybean oil from soybeansand the yields of rapeseed cake and rapeseed oil from rape-seeds are calculated on the basis of these data, taking intoconsideration that some of the oil from soybeans and rape-seeds form part of soybean meal and rapeseed cake, respec-tively. The yields of oil and kernels from fresh fruit bunches,and the yields of palm kernel oil and meal from the kernelsare based on Malaysian data for 2004 given in MPOB (2005).In the calculations, soybean oil substitutes marginal oil atthe ratio of 1 to 1 (by weight). The amount of marginalmeal substituted by palm kernel meal or rapeseed cake isestimated according to the protein and energy contents (en-ergy in feed is calculated in Scandinavian Feed Units (SFU),where 1 SFU approximately equals the amount of energy in
1 kg barley). For example, one kg of rapeseed cake (= 0.31 kgprotein and 1.1 SFU) substitutes 0.95 kg marginal meal,which is a mix of 0.66 kg soybean meal (= 0.28 kg proteinand 0.8 SFU) and 0.29 kg spring barley (=0.03 kg proteinand 0.3 SFU). Thus, the amount of protein and energy inthe rapeseed cake is equal to the total amount of proteinand energy in soybean meal and spring barley. In the calcu-lations, spring barley is assumed to be the marginal feedgrain, as proposed by Weidema (2003).
3 Inventory
In the following section, we present the data used to estab-lish the crop production and crop processing in the LCAs.As explained, due to the need for systems expansion, thesoybean product system includes the cultivation and pro-cessing of oil palms, rapeseed and spring barley. For ease ofcomparison, the crop data are all presented in Table 2, whileexplanations and references are given in separate sections.
3.1 Agricultural production
Soybeans. Yields of 2,630 kg ha–1, which was the averageyield in Argentina 2001/2002, were used, cf. Table 2(SAGPyA, 2006). At this time approx. 25% of the soybeanarea was cultivated in a system with two crops (typicallywheat and soybeans) per year (Begenisic 2003), giving anaverage land use of 0.88 ha year (=0.75 + (0.25/2)) for the2,630 kg beans. Fertilizer, diesel and pesticide use was takenfrom Begenisic (2003), according to whom approximately70% of the soybeans at that time were cultivated in a notillage cropping system (diesel consumption: 35 liters ha–1)using transgenic varieties (RR) and 30% were cultivated ina conventional cropping system (diesel consumption: 60 li-ters ha–1). The nutrient balance approach (Halberg et al.1995; Kristensen et al. 2005) was used for estimating ni-trate and phosphate leaching. No N-fertilizer was given, leav-ing the beans to depend on biological nitrogen fixation (cor-responding to 132 kg N ha–1, estimated from Peoples et al.(1995)), and available soil N for its N supply. N removedfrom the field was calculated on the basis of yields (seeTable 2) and protein content (see Table 1) of the soybeans,and equaled 152 kg N ha–1. Because more N was removedthan applied to the soybean fields, it was assumed that nitrateleaching related to soybeans was insignificant (see Table 2).This is in accordance with Austin et al. (2006), who also con-cluded that less N is applied than removed from the soybeanfields in the Pampas in Argentina. Phosphate adsorbs to soilparticles and it was assumed that only 2.9% of the P surpluswas leached as phosphate (Dalgaard et al. 2006). N2O emis-sions were calculated according to IPCC (2000).
Soybeans Soybean meal Palm kernel meal Rapeseed Rapeseed cake Spring barley
Dry matter (DM), % 87 87.5 92 92 89 85
Protein, % of DM 40.8 49.1 16.2 21.6 34.8 10.8
Oil, % of DM 20.8 3.2 10.9 48.0 11.2 3.1
Energy, SFU a per kg DM 1.44 1.37 0.86 1.86 1.19 1.12 a SFU: Scandinavian Feed Units
Table 1: Characteristics of items in the soybean/palm loop and soybean/rape loop (Møller et al. (2003), an update from Møller et al. (2000))
72

LCA for Food Products Soybean Meal
Int J LCA 2007 (OnlineFirst) 5
Average pesticide application over the RR and conventionalsystems was estimated from Begenisic (2003) and Benbrook(2005). In the no-tillage system, farmers use 5–6 liters ofglyphosate solution per ha and an average 0.35 liters of 80%2,4-D while, in the conventional cropping system, 2 liters ofglyphosate is supplemented with 1 liter of imazethapyr.Benbrook (2005) reports an increased used of imazethapyrin Argentina, even though the proportion of RR soybeanshas increased, which indicates that this herbicide may beused in combination with glyphosate, possibly to avoid prob-lems with glyphosate-resistant weeds. Imazethapyr is slightlyhazardous in WHO (World Health Organization) terminol-ogy (Agrocare 2002). The substance has been withdrawnfrom the European market (Anonymous 2002), but is usedin Brazil and Argentina. A number of insecticides are usedin soybean cultivation, mostly pyrethroids (0.1 liter per haof cypermethrin or deltamethrin) and chlorpyrifos (0.8 literper ha), which are all highly toxic to aquatic environments.The first Sorghum halepensis biotype resistant to glyphosatein the north of Argentina was reported in 2005 (Anony-mous 2006a). Because of lack of a reliable fate model to rep-resent the pesticide application techniques used and linkingthis with the geographical distribution of biodiversity and waterbodies, the pesticides were not included in the LCA as such.As discussed below, there is a risk of significant and large-scale impacts on biodiversity because of glyphosate's broad-spectrum effect on non-target plants and amphibians.
Fresh fruit bunches from oil palms. Yields of 18,800 kg ha–1
fresh fruit bunches are used, calculated as an average of theyields in 2003 and 2004 as reported by the Malaysian PalmOil Board (MPOB 2005). Remaining data are based onYusoff & Hansen (2005). Due to lack of data, MgO fertil-izer is not included in the calculations. Production of or-ganic fertilizer is not incorporated in the calculations, be-
cause it is assumed that these organic fertilizers are residuesthat are not produced as a consequence of palm oil cultiva-tion. In accordance with phosphate leaching from soybeans,rapeseed and spring barley, 2.9% of the P surplus is assumedto be leached as phosphate. Literature on nitrous oxide (N2O)emissions from palm oil cultivation was not available, thusit was assumed that the N2O emissions were equal to theemissions from soybean cultivation (4.7 kg N2O ha–1) plusN2O emissions from the 90 kg N fertilizer that was appliedyearly. N2O emissions from fertilizer were calculated in ac-cordance with IPCC (2000), and the total emission was there-fore calculated at 6.5 kg N2O ha–1. Available informationon pesticide use for oil palm cultivation is limited, but ac-cording to Wakker (2005), around 25 different pesticidesare used and the most commonly used weed killer in oilpalm plantations is paraquat dichloride ('paraquat').Paraquat is banned or restricted in Denmark, Austria, Fin-land, Sweden, Hungary and Slovenia because of its high tox-icity (Anonymous 2006b). Malaysia, the biggest producerof palm oil, has implemented a 2-year phase-out period, butis now reconsidering the phase-out. Glyphosate is also usedin oil palm plantations (DTE 2005).
Rapeseed and spring barley. Yields of 2,830 and 4,900 kgha–1, respectively, were used. All agricultural data are froma National Agricultural Model (Dalgaard et al. 2006), whichis representative for the Danish agricultural sector. Themodel consists of 31 farm types that are representative ofthe entire agricultural sector in Denmark. For each farmtype, resource use and emissions are established using rep-resentative farm accountancy data. The Economic modelESMERALDA (Jensen et al. 2001) was used to identify themarginal rapeseed and spring barley producers amongst the31 farm types, so that marginal Danish data and not aver-age data were used. In the National Agricultural Model,
Soybean Oil palms (fresh fruit bunches) a
Rapeseed Spring barley
Location Argentina Malaysia Denmark Denmark
Yields, tons/ha 2.63 18.80 2.83 4.90
Resource use
Fertilizer (N), kg 0 90 167 123
Fertilizer (P), kg 16 12 24 21
Fertilizer (K), kg 0 134 77 62
Diesel, L 42 64 125 114
Lubricant oil, L 4 0 13 11
Electricity (natural gas), kWh 0 7 23 29
Emissions to water
Nitrate, kg NO3 0 83 326 202
Phosphate, kg PO4 0 0.7 0.6 0.7
Emissions to air
Ammonia, kg 0 0 12.2 10.5
Nitrous oxide, kg 4.7 6.5 6.7 4.8
Nitrogen dioxide, kg 0 1.7 0 0
Sulfur dioxide, kg 0 0.8 0 0 a Data based on Yusoff & Hansen (2007)
Table 2: Inventories for cultivation of 1 hectare of soybean, oil palms, rapeseed and spring barley
73

Soybean Meal LCA for Food Products
6 Int J LCA 2007 (OnlineFirst)
nitrate leaching was assumed to be equal to the farm-gate Nbalance minus ammonia losses and denitrification (Kristensenet al. 2005) and net change in soil N status. The farm-gateN balance was established according to the methods devel-oped by Halberg et al. (1995) and Kristensen et al. (2005).N2O emissions were calculated according to IPCC (2000),and the diesel use was modeled according to Dalgaard et al.(2001). The balance approach was also used for calculationof phosphate leaching, but assuming that only 2.9% of theP surplus was leached (Dalgaard et al. 2006). Pesticide usewas estimated from inventories established yearly by theDanish Environmental Protection Agency (Anonymous2005) based on total national sales and the distribution ofcrops. The most abundant herbicide in rapeseed wasclomazone (used on 43% of the rapeseed area in 2004, giv-ing on average 0.14 liter per ha) followed by propyzamide(1 liter per ha on 36% of the land, high aquatic toxicity)and clopyralid (0.2 liter per ha on 17% of land). Approxi-mately 60% of the cropped rapeseed land was treated withinsecticides, most often 0.2 liter per ha of cypermethrin,which is classified as moderately dangerous for humans andhighly toxic to aquatic organisms. A large variety of herbi-cides, fungicides and insecticides were used in cereal pro-duction and the average number of standard approved dos-ages used per ha was 1.4 herbicide treatments, 0.61 forfungicides, 0.27 for insecticides and 0.12 for growth regula-tor applications (Anonymous 2005). The most frequentlyused herbicide applied to 36% of the barley area was
tribenuron-methyl, which is classified as moderately dan-gerous for humans and highly toxic to aquatic organisms.
LCA data on material inputs. Within Europe a change indemand for artificial fertilizer affects the less competitivefertilizer producers, as the European market has experienceda decrease in the consumption of fertilizer due to environ-mental restrictions (Weidema 2003, p. 73). Data on artifi-cial fertilizers (nitrogen, phosphorous and potassium) arefrom Patyk & Reinhardt (1997), as these data are assumedto represent the less competitive technology. Due to lack ofdata, the same data are assumed to be valid for palm oil pro-duction in Malaysia. Data on the use of agricultural machin-ery are based on Borken et al. (1999), but moderated to aver-age load. These data are average, but are assumed not to differfrom marginal data. For further information on the above-mentioned data, go to www.lcafood.dk (Nielsen et al. 2003).Data on electricity (electricity from fuel gas power plant inthe Netherlands), pentane (used instead of hexane), trans-port by truck (28 t), heat (oil) and heat (gas) are all from theEcoinvent Centre (2004).
3.2 Milling plants
The inventories for processing of soybeans, rapeseeds, freshfruit bunches from oil palms and palm kernels are presentedin Table 3. Fossil energy related emissions are not shown.Based on data from Oil World (2005) it is assumed that thelosses from all milling processes are 2%.
Soybean mill Palm oil mill Palm kernel mill Rapeseed mill
Location Argentina Malaysia Malaysia Denmark
Products Soybean meal Soybean oil
Palm oil Palm kernels
Pulp
Palm kernel oil Palm kernel meal
Rapeseed meal Rapeseed oil
Transport
Transport to mill (28 t lorry) 500 km 0 km 150 km 150 km
Transport to mill (tractor) 22 MJ Diesel
Resources
Hexane 0.40 kg 0 1.99 kg 0
Diesel for machinery 32 MJ
Electricity (natural gas) 12 kWh 68 kWh 50 kWh
Heat (oil) 145 MJ – 335 MJ 340 MJ
Heat (gas) 282 MJ – –
Emissions to air
Methane 9,570 g
Hexane 0.20 kg – 1.99 kg
Carbon monoxide Energy related 50 g Energy related Energy related
Nitrogen oxides Energy related 120 g Energy related Energy related
NMVOC, volatile organic compounds Energy related 239 g Energy related Energy related
Sulfur dioxide Energy related 435 g Energy related Energy related
Particles Energy related 276 g Energy related Energy related
Emissions to water
BOD5, Biological Oxygen Demand 17 mg
COD, Chemical Oxygen Demand 61 mg
Nitrate 4 mg 182 g
Table 3: Inventories for millings plants. Functional unit: Processing of 1 ton soybeans, fresh fruit bunches, palm kernels and rapeseeds, respectively
74

LCA for Food Products Soybean Meal
Int J LCA 2007 (OnlineFirst) 7
1 g
1 g
0 g5 g
Marginal meal17 g
Soybean meal5 g
Spring barley12 g
Soybean meal production Avoided production of oil palms Marginal meal production
Soybean meal1000 g
Soybean oil191 g
Soybeans1210 g
Soybean cultivation4.5 m2
Soybean mill
Spring barley cultivation0.02 m2
Palm oil-191 g
Palm kerneloil
-20 g
Palm kernelmeal -23 g
Palm oil from mesocarp
-171 g
Palm kernels-20 g
Organic residues-630 g
Fresh fruitbunches-852 g
Palm kernel mill
Palm oil mill
Oil palm cultivation-0.5 m2
Soybean mill. Soybean meal consumed in the EU is prima-rily milled outside the EU (Oil World 2005). Consequently,it is assumed in this study that it is milled where it is pro-duced (Argentina). The amount of hexane used for oil ex-traction and emitted is based on Cederberg (1998), and en-ergy use and emissions to water are from Reusser (1994). Itis assumed that soybean meal is sailed 12,082 km from Ar-gentina (Rosario Harbor) to the Netherlands (RotterdamHarbor). According to Oil World (2005), the Netherlands isthe largest importer of soybean meal in Europe.
Palm oil mill. Processing data are based on palm oil millsowned by Unilever in 1990 (Unilever 2004). The fresh fruitbunches are transported by tractor as the oil mills are al-ways placed near the oil palm plantation in order to have arelatively short transport time to avoid decomposition offatty acids in the fresh fruit bunches. Energy in the palm oilmill is supplied by incineration of empty fruit bunches, me-socarp fibers and nut shells. All airborne emissions given inTable 3 are related to storage and burning of this organicmatter. The emissions to air and N to water are based onZah & Hischier (2003). Palm oil is extracted without theuse of organic solvents. Possible empty fruit bunches, meso-carp fibers and shells that are not used for energy produc-tion are not included.
Palm kernel oil mill. Similar to palm oil mill, processingdata for the palm kernel oil mill are based on Unilever (2004).The oil is extracted using hexane as a solvent.
Rapeseed mill. Materials and energy used for processing ofrapeseeds are from Scanola, a Danish mill that processesapproximately 220,000 tonnes of rapeseeds annually(Emmersen 2005). In contrast to the soybean and palm ker-nels mill, organic solvent is not used for the extraction.
4 Results
4.1 Soybean loops
The aim of this section is to demonstrate how an increaseddemand for soybean meal affects the agricultural produc-tion using the two soybean loops (PO and RSO).
Fig. 1 shows the soybean meal loop with palm oil as a mar-ginal oil. The loop is divided into three parts that are inter-related in a loop as illustrated by the large bold arrows. Toproduce 1,000 g soybean meal, 1,210 g soybean is needed.These soybeans contain sufficient oil to produce 191 g puresoybean oil leaving 29 g oil in the soybean meal (not shown).The soybean oil is sold on the market and assumed to sub-stitute palm oil, which is a mix of palm oil (from mesocarp)and palm kernel oil. When the fresh fruit bunches are milled,there is a large co-production of organic residues that areused to produce energy for the palm oil mill (see also Table 3).For each 1,000 g of soybean meal produced, there is anavoided production of 23 g palm kernel meal, which is sub-stituted by marginal meal. The marginal meal is soybeanmeal but, as the protein and energy content is higher in soy-bean meal (see Table 1) than in palm kernel meal, this iscompensated for by a mix of soybean meal and spring bar-ley (23 g of palm kernel meal contains the same amount ofprotein and energy as a mix of 5 g of soybean meal and 12 gspring barley). Consequently, after the first turn in the loop,which was caused by an increased demand for 1,000 g ofsoybean meal, the production has increased to 1,005 g. Bymaking this iteration for each turn, the extra amount of soy-bean meal produced is getting smaller. The iteration wascarried out in the LCA-tool SimaPro (Pré 2004), and theresult showed that an increased demand for 1,000 g of soy-bean meal caused a production of 1,005 g of soybean meal,–856 g of fresh fruit bunches and 12 g of spring barley.
Fig. 1: Soybean/palm loop for LCA of soybean meal (PO). First turn in the loop: An increased demand for 1,000 g of soybean meal results in productionof 1,005 (=1,000 + 5) g soybean meal, –852 g fresh fruit bunches and 12 g spring barley. Shadowed boxes show the beginning of second loop
75

Soybean Meal LCA for Food Products
8 Int J LCA 2007 (OnlineFirst)
Fig. 2 shows the soybean/rapeseed loop. Here the soybeanoil is assumed to substitute rapeseed oil on the market. Foreach 1,000 g of soybean meal produced, there is an avoidedproduction of 323 g rapeseed cake, which is considerablymore than the 23 g palm kernel meal in the soybean/palmloop (see Fig. 1). Rapeseed cake contains more protein com-pared with palm kernel meal, thus the soybean meal/springbarley ratio is lower in the soybean/palm loop (see Fig. 1)compared with the soybean/rapeseed loop (see Fig. 2). Byiteration, the amount of soybean meal produced can be cal-culated as for the soybean/palm loop. The increased demandfor 1,000 g of soybean meal causes a production of 1,271 gof soybean meal, –667 g rapeseed and 117 g spring barley.
Once the soybean loops are established, the effect of theincreased demand for soybean meal on the palm oil, rape-seeds and spring barley needed can be quantified and usedin the LCAs of soybean meal (RSO) and soybean meal (PO).Results from the LCAs are presented in the following.
4.2 Characterized results
Table 4 shows the characterized results of the two soybeanmeal LCAs from 'Rotterdam Harbor' together with the 'fromfarm gate products' used. Soybean meal (RSO) has a lowerenvironmental impact for all effect categories (except pho-tochemical smog) compared with soybean meal (PO), andthis can be ascribed to the fact that the avoided environ-mental impact from rapeseeds is much larger compared withthe avoided environmental impact from palm oil ('fresh fruitbunches from farm gate'). It is worth noting that exactly thesame process for soybean cultivation is used for the twosoybean meal productions.
In Table 5, the economic and mass-allocated, characterizedresults are presented. A comparison between soybean meal(PO) (see Table 4) and economically allocated soybean meal(69%) (see Table 5) shows that the characterized results forthe impact categories 'global warming', 'ozone depletion' and'acidification' are very similar. 'Eutrophication' from soybean
Marginal meal production
69 g41 g41 g213 g
Marginal meal305 g
Soybean meal213 g
Spring barley92 g
Soybean meal production Avoided production of rapeseeds
Soybean meal1000 g
Soybean oil191g
Soybeans1210 g
Soybean cultivation 4.5 m2
Soybean mill
Rapeseed oil-191 g
Rapeseeds-525 g
Rapeseed cake-323 g
Rapeseed mill
Rapeseed cultivation -1.2 m2
Spring barley cultivation 0.2 m2
Fig. 2: Soybean/rapeseed loop for LCA of soybean meal (RSO). First turn in the loop: An increased demand for 1,000 g of soybean meal results inproduction of 1,213 (=1,000 + 213) g soybean meal, –525 g rapeseeds and 92 g spring barley. Shadowed boxes show the beginning of second loop
Unit Soybean meal (PO)
Soybean meal (RSO)
Soybeans Fresh fruit bunches
Rapeseeds Spring barley
Delimitation from Rotterdam from farm gate
Global warming g CO2 eq. 721 344 642 177 1,550 671
Ozone depletion mg CFC11 eq. 0.27 0.20 0.08 0.02 0.23 0.12
Acidification g SO2 eq. 3.1 –1.2 0.8 1.6 11.8 5.8
Eutrophication g NO3 eq. –2 –81 1 8 139 53
Photochemical smog g ethane eq. 0.4 0.4 0.1 0.0 0.3 0.2
Table 4: Characterized results of soybean meal (PO), soybean meal (RSO) and crops involved in the life cycle of soybean meal. Functional unit: 1 kgof product
76

LCA for Food Products Soybean Meal
Int J LCA 2007 (OnlineFirst) 9
meal (69%) (see Table 5) is positive, in contrast to soybeanmeal (PO) (see Table 4), but still much lower than 'eutrophi-cation' from 'rapeseeds' and 'spring barley' in Table 4.
Normalization of the characterized results in Table 4 showedthat the most dominating impact categories were: Globalwarming, eutrophication, and acidification. In the follow-ing, environmental hot spots within these categories will bepresented.
4.3 Environmental hot spots
In Fig. 3, 4 and 5, environmental hot spots of the productchains of soybean meal (PO) and soybean meal (RSO) areshown. 'Energy' includes emissions (e.g., fossil CO2) relatedto cultivation of soybeans, rape seeds, oil palms and springbarley, but also energy used on the milling plants. 'Fertil-izer' includes processing (including energy) of artificial fer-tilizer used for the cultivation of soybeans, rape seeds, oilspalms and spring barley. All three figures are dominated bylarge negative emissions from 'Avoided agricultural cultiva-tion' which are saved emissions caused by 'avoided produc-tion of oil palms' (see Fig. 1) and 'avoided production ofrapeseeds' (see Fig. 2), respectively. The avoided productionof rapeseeds is largest, because the emissions per kg rape-seed are higher than the emissions from fresh fruit bunches(see Table 4). For all the figures, the positive contributionsare smaller for soybean meal (PO) than for soybean meal(RSO). This is also clearly demonstrated in soybean loops,
where an increased demand for soybean meal (PO) only re-sults in production of 1,005 g soybean meal (and 12 g springbarley), whereas an increased demand for soybean meal(RSO) results in the production of 1,271 g soybean meal(and 117 g spring barley).
The contributions to global warming potential from differ-ent parts in the product chains of soybean meal (PO) andsoybean meal (RSO) are shown in Fig. 3. The major con-tributor to global warming is the cultivation of soybean,where 8% of the greenhouse gases emitted during the soy-bean cultivation is fossil CO2, and the rest N2O. The N2Ocomes from degradation of crop residues (e.g., straw) andbiological nitrogen fixation. Contributions from 'freighteroceanic' and 'truck' are almost equal (the latter also includesavoided transportation of rapeseeds/palm kernels). For soy-bean meal (RSO), there is a considerable amount of avoidedemission from fertilizer production. The demand for soy-bean meal (RSO) results in a shift from rapeseed cultivation(N fertilizer use = 167 kg N ha–1) to soybean cultivation (Nfertilizer use = 0 kg N ha–1), thus saving fertilizer. The pro-duction of N fertilizer emits considerable more greenhousegases, CO2 and N2O in particular, than P and K fertilizers.The contributions from 'truck' (transport of soybeans inArgentina (500 km)) and 'freighter oceanic' (shipping ofsoybean meal from Rosario in Argentina to Rotterdam inthe Netherlands (12,082 km)) are very similar, despite thelarge difference in distance. This indicates that shipping ismuch more environmentally friendly than transport by truck.
Unit Economic allocation a Mass allocation
Soybean meal (69%)
Soybean oil (31%)
Soybean meal (84%)
Soybean oil (16%)
Global warming g CO2 eq. 726 1,819 901 901
Ozone depletion mg CFC11 eq. 0.20 0.49 0.24 0.24
Acidification g SO2 eq. 3.3 8.3 4.1 4.1
Eutrophication g NO3 eq. 3.1 7.8 3.8 3.8
Photochemical smog g ethane eq. 0.3 0.8 0.4 0.4 a Prices from Argentina year 2002: Cake of soya beans 158 US$, oil of soya beans 396 US$ (FAOSTAT 2006)
Table 5: Characterized results of soybean meal. Calculated by the use of economic and mass allocation. Functional unit: 1 kg of soybean meal (PO)delivered to Rotterdam Harbor
Fig. 3: Contribution to global warming potential from different parts of the product chain of soybean meal
77

Soybean Meal LCA for Food Products
10 Int J LCA 2007 (OnlineFirst)
Even though transport from Rotterdam Harbor to feedstuffcompanies and to farm gate was not part of the LCA in thisstudy, we performed sensitivity analyses of this part of theproduct chain to see how much it could change the results.If the soybean meal (PO) was transported 650 km, this re-sulted in an increase of 20% in global warming potential.
Concerning eutrophication potential from soybean meal(RSO), it is clear that agricultural production avoided domi-nates the picture (see Fig. 4). This is because rapeseed con-tributes 139 g NO3-eq. kg–1 produced compared with only1 g NO3-eq. kg–1 for soybeans (see Table 4). The environ-mental hot spot for eutrophication is 'spring barley' for soy-bean meal (RSO). The contribution from 'soybean cultiva-tion' is smaller than the contribution from 'freighter oceanic'and 'truck'. Site-dependent impact assessment is not used inthis study, so that, in the interpretation of the results, it mustbe taken into consideration that nutrifying substances emit-ted at sea damage vulnerable ecosystems (e.g., lakes, bogs)much less than on-land emissions.
The environmental hot spot regarding acidification poten-tial (see Fig. 5) is 'freighter oceanic', but it must again betaken into consideration that acidifying substances emittedat sea are more harmless than if they were emitted on land.
The second largest contributor is 'truck'. As for global warm-ing, the production of N fertilizer avoided for rapeseed cul-tivation contributes negatively. When assuming 650 km oftransport of soybean meal (PO) from Rotterdam Harbor,the acidification potential was increased by 32%.
4.4 Land use
As part of the inventory, data on land use for the differentagricultural production systems were collected. The land usedfor the production of 1 kg of soybean meal (PO) and soy-bean meal (RSO) is 3.6 and 3.0 m2year respectively (Table 6).The use of land in Argentina is higher than the total landuse. The interpretation of this is of course that the use of'one kg soybean meal (RSO)' costs 5.1 m2year in Argentina,but saves 2.1 m2year in Europe. Thus, the pressure on thepristine ecosystems in Argentina becomes quite obvious:Growing demands for soybean meal thus aggravate the pres-sures on land in other countries. At the end of the day, thateventually leads to a loss of biodiversity. Unfortunately, wehave at present no method that reasonably translates thepressures on land into loss of biodiversity, although someefforts have been done to do so (Weidema & Lindeijer 2001,Lindeijer 2000, Mattson et al. 2000). These methodologies
Fig. 4: Contribution to eurtrophication potential from different parts of the product chain of soybean meal
Fig. 5: Contribution to acidification potential from different parts of the product chain of soybean meal
78

LCA for Food Products Soybean Meal
Int J LCA 2007 (OnlineFirst) 11
can be criticized for not addressing a suitable way of linkingknown pressures on agricultural land in terms of occupa-tion (m2year) with actual transformation between land usetypes. We argue that the most relevant aspect of land useimpact is the transformation of pristine ecosystems into ag-ricultural land. But we are only able to establish a link be-tween the functional unit (1 kg soybean meal (RSO)) andthe area occupied in Argentina (5.1 m2year) and Europe (–2.1 m2year). In addition to this, new research results linkinglandscape transformations and biodiversity using landscapeecology methodologies are being applied in Argentina to helpto solve these limitations (Matteucci et al. 2004).
It should be noted that pesticide use was not included in theLCA results, but should be considered separately. The ex-tensive use of broad-spectrum herbicides with glyphosate,fungicides and insecticides in the non-tillage RR soybeansystem may impact the health of farm workers and can havesevere effects on biodiversity and aquatic environments, suchas rivers and lakes, in the large areas where soybeans arevirtually the only crop (see references in Ho & Ching 2003,Ho & Cummings 2005, Benbrook 2005). In the case whererapeseed is replaced by increased soybean production, thiswould increase the use of pesticides, also with potentiallytoxic effects on waterborne organisms but in a totally dif-ferent location. The palm oil plantations also use glyphosate-containing herbicides. However, both the rapeseed and es-pecially the palm oil cropping systems use significantly loweramounts of pesticides compared with the soybeans.
5 Discussion
5.1 Methodology: the use of consequential LCA
The rapeseed production had a large influence on the LCAof soybean meal (RSO) (see 'avoided agricultural cultiva-tion' in Fig. 3, 4 and 5), and it even resulted in a negativeeutrophication potential for soybean meal (RSO). This mightappear irrational, but, according to the assumptions in thesesystems, when an extra amount of soybean meal is de-manded, the vegetable oil production will shift from rape-seed oil to soybean oil. Seen in relation to eutrophicationthe rapeseed production is more harmful compared with thesoybean production, because the nutrient surplus from thesoybean production is low. Therefore, as long as an increaseddemand for soybean meal implies production of more soy-bean, at the same time it also induces a shift to an oil pro-duction causing less eutrophication. In the present LCA, itis assumed that an 'additional' production of 1 kg soybeanoil results in a similar reduction in the production of rape-seed or palm oil (one-to-one substitution by kg oil). This isobviously a simplification because we assume (among otherthings) that prices remain unaffected and, thus, the model
does not include price elasticity. However, this assumptionis not only made in relation to system expansion, but in allthe steps of a typical LCA inventory, as explained in Weidema(2003, p. 37).
Another obvious challenge of consequential LCA is the iden-tification of affected processes, i.e., marginal processes/tech-nologies. The present study shows significantly different re-sults between the two soybean meal systems (PO vs. RSO),reflecting the use of palm oil or rapeseed oil as the marginaloil type. It cannot be established with certainty which of theoil types (palm or rapeseed oil) is the marginal oil – orwhether it is a mix – or whether other types are included inthis mix. The identification of the actual marginal is a greatchallenge, and an obvious source of uncertainty. However,it is not a better solution to assume that all plant oils areaffected proportionally to their present market volume,which in reality would be the assumption behind anattributional LCA using average data.
In the present LCA of soybean meal, the changes in CO2emission caused by land-use changes (e.g., transformationof forest to cropland) were not included, due to conceptualand methodological limitations. Conceptually, it is debat-able whether changes in above ground and soil carbon con-tent due to changed land use should be included in an LCAof a product, especially when the functional unit is not re-lated to carbon sequestration. If the impacts from 'land-usechanges' related to crop cultivation are included in an LCAof agricultural products, this must be performed conse-quently. If, for example, the LCA data on soybean meal isused in an LCA of milk, the inclusion of the CO2 emissionsfrom land-use changes in Argentina should be combined withsimilar calculations of possible changed CO2 sequestrationin the dairy system (for example, more or less grassland ver-sus maize in the crop rotation, which would influence soilorganic matter). This is not presently done in LCAs involv-ing agriculture for food nor bio-energy products (e.g.,Cederberg & Flysjö 2004, Basset-Mens & van der Werf2005, Heller et al. 2003, Kim & Dale 2005).
Methodological problems include the knowledge of land usebefore conversion, estimates of changes in above ground aswell as below ground carbon content, both immediately andafter initiation of cultivation and choice of depreciation time.
For example, the history of the area used is unknown, pre-viously it might have been covered with crops, savannah,forest or something else. As there is a large difference in theamount of carbon stocked in these types of land (e.g.,Fearnside 2000), it will influence the result strongly. Alsothe choice of depreciation time influences the result. Whetherthe emissions related to the land-use change should be as-cribed completely to the crops cultivated during the first year
Soybean meal (PO)
Soybean meal (RSO)
Soybeans Fresh fruit bunches Rapeseeds
Total 3.6 3.0 3.3 0.5 3.5
Of this in Argentina or Malaysia
4.0 5.1 3.3 0.5 0
Table 6: Land use per kg product (Unit: m2year). Data on soybean meals include both the soybean cultivation and the avoided productions of fresh fruitbunches and rape seeds
79

Soybean Meal LCA for Food Products
12 Int J LCA 2007 (OnlineFirst)
or divided over the next 20–100 years of cultivation is de-batable, and to determine the depreciation time demandsbetter knowledge of the driving forces behind land-usechanges. Despite the methodological limitations, we per-formed a sensitivity analysis, where it was assumed that theabove-ground biomass of the forest before clear-cutting was94 tons C ha–1 (area weighted mean for all tropical forests(Houghton 2005)), and the depreciation time was set at 20year. Below-ground biomass and avoided deforestation re-lated to palm oil production in Malaysia were not includedin the calculation. According to the sensitivity analysis, theglobal warming potential inclusion of changes in CO2 emis-sions caused by land-use changes increased the global warm-ing potential dramatically from 721 g to 5.7 kg CO2 eq. perkg soybean meal (PO).
In consequential LCAs, the use of marginal data is to bepreferred, because the consequential LCA seeks to reflectthe environmental consequences of an increasing demandfor a certain product. But when are data marginal and whenare they average? Argentina is the marginal soybean mealproducer as argued in the 'system delimitation' section and,therefore, we have used averaged data on soybean meal yieldsin Argentina. Preferably, we should have used yield data fromthe marginal soybean producers within Argentina. Marginaldata on yields of soybeans and fresh fruit bunches were notavailable and, as we did not find a reason to believe that themarginal yields would be very distinct from the averageyields, we used average data.
N2O emissions from cultivation of soybeans, rapeseeds,spring barley and oil palms appeared to have a large impacton the global warming potential per kg soybean meal. Thisis in good agreement with other studies, showing that N2Oplays a major role in the greenhouse gas emissions from ag-ricultural production (Olesen et al. 2006; Dalgaard et al.2006). N2O emissions from soybeans, rapeseeds and springbarley were calculated according to the IPCC guidelines.However, we had difficulties in finding literature or meth-ods for estimating N2O emissions from oil palms, and wetherefore used the same data as for soybeans, but addingN2O emitted from the N fertilizer applied to the oil palms.This was unsatisfactory as the N2O turned out to be impor-tant for the final result of the LCA of soybean meal (PO).
5.2 Comparison with previous studies
A majority of the previous LCA studies on livestock prod-ucts, where soybean meal was included, does not directlypresent LCA data on soybean meal. However, Eriksson etal. (2004), who based the soybean inventory on data fromCederberg & Darelius (2001), have published LCA data onsoybean meal. Ecoinvent Centre (2004) also provide datafor the LCA database on 'soybean scrap', based on soybeansproduced in Switzerland. Economic allocations were per-formed in both the above-mentioned studies. The environ-mental impacts of producing one kg of soybean meal, ac-cording to Eriksson et al. (2004) and Ecoinvent Centre(2004), are as follows: Global warming: 730 and 507 g CO2eq.; acidification 8 and 13 g SO2 eq.; eutrophication: 541and 198 g NO3 eq. (LCIA method applied for Ecoinventdata: EDIP97 (Wenzel et al. 1997, updated version 2.3)).
The results on global warming are in good agreement withours (soybean meal (PO) in Table 4 and soybean meal (69%)in Table 5), whereas our results on acidification and eutrophi-cation are considerably lower. These differences are not onlydue to the use of consequential versus attributional LCA,but to a larger extent due to the estimated emissions. Forexample, the soybean cultivation in Ecoinvent contributesnegatively to GWP, because biotic fixation of CO2 from theatmosphere is considered as a negative contribution to glo-bal warming potential. In our calculation, we consider thebiotic fixated CO2 as neutral, because it will be released tothe atmosphere after digestion by livestock. The similarityof the results on global warming potential must be ascribedto accidental occurrence. The environmental hot spots inEcoinvent Centre (2004) are, as in our study, transport byfreighter oceanic and truck. But, in our results, site-depen-dent aspects are not taken into consideration.
Cederberg & Flysjö (2004) estimated that nitrate leachedfrom soybean cultivation in Cerrado in Brazil equaled 36 kgN ha–1, whereas we estimated no nitrate leaching. In thestudy of Cederberg & Flysjö (2004), the input of N (fertil-izer and BNF) to the soybean cultivation was assumed to be230 kg N ha–1. We find this is a very high estimate becausethe average N application (fertilizer) to soybean fields in thePampas was only 2 kg N ha–1 in 2002 (FAO 2004). Accord-ing to Austin et al. (2006), nitrate was not leached from thesoybean fields in the Pampa region. In contrast, a substan-tial net loss of nitrogen at the regional scale was taking place,and the current agricultural practices in the Pampa regionare essentially 'mining', the nutrient capital of the region(Austin et al. 2006). Unfortunately, this export of nutrientsout of the region probably leading to nutrient deficiencies inthe soil, is not captured in our LCA of soybean meal. Thediscrepancy between the results of Cederberg & Flysjö (2004)and our results might be due to differences in cultivationpractices in Brazil and Argentina. For example, the fertilizeruse efficiency in Argentina is four times higher than in Bra-zil (Austin et al. 2006), and the fertilizer use is generallyconsiderably lower.
5.3 Relative impact of the Danish soybean consumption:Scaling up from FU to national level
The results demonstrate that the soybean meal consump-tion in Europe has an impact on the global environment(e.g., global warming) and on the local environment outsideEurope (e.g., acidification, land use). But what is the magni-tude of these environmental impacts from soybean meal pro-duction compared with the environmental impacts of thelivestock production itself? As an example, we comparedgreenhouse gas emissions: According to Gyldenkærne &Mikkelsen (2004), 10.5 million tonnes CO2 eq. were emit-ted from the entire Danish agricultural sector in 2002. In thesame year, 1.5 million tonnes of soybean meal were importedto Denmark (Statistikbanken 2006). If the transport fromRotterdam Harbor to a Danish feed company is set at 650km, the greenhouse gas emission is 869 g CO2 eq. per kg soy-bean meal (PO) (=721 * 1.20). This results in a 'soybean mealrelated greenhouse gas emission' of 1.3 million tonnes CO2eq., which is approximately equivalent to 12% of the green-
80

LCA for Food Products Soybean Meal
Int J LCA 2007 (OnlineFirst) 13
house gas emitted directly from the Danish agricultural sec-tor. So, in addition to the 10.5 million tonnes emitted fromthe agricultural sector, an extra amount of 1.3 million tonnesis emitted as a consequence of the soybean meal import toDenmark. Unfortunately, it was not possible to estimate theenvironmental impact from pesticide use and loss ofbiodiversity caused by pressure on pristine ecosystem.
6 Conclusions
Consequential LCA was successfully performed on soybeanmeal. An increased demand for soybean meal implies anincreased production of soybean oil as both commoditiesoriginate from the soybean. This soybean oil will substitutethe marginal vegetable oil on the market and, therefore, anincreased demand for soybean meal results in an avoidanceof the production of the crop producing the marginal oil.This avoided crop production (and other affected crops) wasincluded in the calculations. A recent study by Schmidt andWeidema (2007) has identified palm oil as the marginal oil.However, a shift to rapeseed oil might be possible, as thetwo vegetable oils are comparable in many aspects. To beprepared for such a shift and to analyze to what extent thechoice of marginal oil affects the result of the LCA, twoLCAs on soybean meal were performed: One with palm oilas the marginal oil (soybean meal (PO)) and one with rape-seed oil as the marginal oil (soybean meal (RSO)).
The functional unit was 'one kg soybean meal produced inArgentina and delivered to Rotterdam Harbor'. The char-acterized results from the LCA on soybean meal (PO) were721 g CO2 eq. for global warming potential, 0.3 mg CFC11eq. for ozone depletion potential, 3.1 g SO2 eq. for acidifi-cation potential, –2 g NO3 eq. for eutrophication potentialand 0.4 g ethene eq. for photochemical smog potential. Thepotential environmental impacts (except photochemicalsmog) were lower for soybean meal (RSO), because theavoided environmental impact was larger from rapeseedcompared with oil palms.
Normalized results showed that the most dominating im-pact categories were: global warming, eutrophication andacidification. The 'hot spot' in relation to global warmingwas 'soybean cultivation', dominated by N2O emissions fromdegradation of crop residues (e.g., straw) and during thebiological nitrogen fixation. Eutrophication is not a majorproblem in the soybean cultivation. In relation to acidifica-tion, the transport of soybeans by truck was important, andsensitivity analyses showed that the acidification potentialwas very sensitive to increased transport distance by truck.
7 Recommendations and Perspectives
This study clearly shows that consequential LCAs are quiteeasy to handle and that LCA data on soybean meal are nowavailable for consequential (or attributional) LCAs on live-stock products. But there are, of course, some limitations tothis analysis. First of all, it is important to know which ofthe related product systems, e.g., the vegetable oil system,are marginal. We would appreciate it if International theJournal of Life Cycle Assessment had articles on the devel-opments on, for example, marginal protein, marginal veg-
etable oil, marginal electricity (related to relevant markets),marginal heat, marginal cereals and, likewise, on metals andother basic commodities.
It is also recommended that more effort be put into de-scribing the impacts of land use. With a growing globalpopulation and increasing demands on meat instead of veg-etable products, the pressures on arable land and eventu-ally reclamation of natural habitats for farming puts tre-mendous pressures on the natural habitats in many placesaround the world. It is thus pivotal that we become able tomanage loss of biodiversity as a fundamental impact cat-egory in LCA studies.
Soybean expansion in Latin America represents a powerfulthreat to biodiversity in Brazil (Cerrados), Argentina (Chaco,Yungas and Monte Ecoregions), Paraguay and Bolivia. Inaddition to herbicide use and genetic pollution, the massiverequirement for infrastructure projects (highways, ports andrailways) are also threats to the high biodiversity that pres-ently exists in Latin America (Alteri and Pengue 2006).
References
Agrocare (2002): Agro-care Chemical Industry Group. Imazethapyr.(online). Available at: http://www.agrocare.com.cn/Products/Imazethapyr.htm (accessed 14 May 2007)
Altieri MA, Pengue WA (2006): La soja transgenica en America La-tina. Una maquinaria de hambre, deforestacion y devastacion so-cioecologica. Biodiversidad. 47, 14–19, Montevideo (in Spanish)
Anonymous (2006a): Salta: un biotipo de Sorgo de Alepo se 'quiereescapar'. Available at: http://www.todoagro.com.ar/todoagro2/nota.asp?id=359. (accessed 14 May 2007) (in Spanish)
Anonymous (2006b): Safety (MSDS) data for paraquat. Availableat: http://physchem.ox.ac.uk/MSDS/PA/paraquat.html (Accessed23 June 2006)
Anonymous (2005): Bekæmpelsesmiddelstatistik 2004. Orienteringfra Miljøstyrelsen Nr. 6. Danish Environmental Protection Agency.52 pp (online). Available at: http://www.mst.dk/Udgivelser/Publikationer/2005/09/87-7614-790-8.htm (accessed 14 May 2007)
Anonymous (2002): Status of active substances under EU review.DG Health and Consumer protection. Plant health. Excel sheet(online). Available at: http://ec.europa.eu/food/plant/protection/evaluation/index_en.htm (accessed 14 May 2007)
Anonymous (1996): Glyphosate fact sheet. Pesticide News 33, 28–29 (online). Available at: http://www.pan-uk.org/pestnews/actives/glyphosa.htm (accessed 14 May 2007)
Austin AT, Piñeiro G, Gonzalez-Polo M (2006): More is less: agri-cultural impacts on the N cycle in Argentina. Biogeochemistry79, 45–60
Basset-Mens C, van der Werf HMG (2005): Scenario-based envi-ronmental assessment of farming systems: The case of pig pro-duction in France. Agric Ecosyst Environ 105, 127–144
Begenisic F (2003): Information on soya production practices inArgentina, Pers. Comm., Inga. Agra. Flory Begenisic, Direccionde Agricultura – SAGPyA (online). Available at: http://www.sagpya.mecon.gov.ar (accessed 14 May 2007)
Benbrook CM (2005): Rust, resistance, run down soils, and risingcosts – Problems facing soybean producers in Argentina.Benbrook Consulting Service, Ag BioTech InfoNet, TechnicalPaper Number 8, January 2005 (online). Available at: http://www.greenpeace.org/raw/content/international/press/reports/rust-resistence-run-down-soi.pdf (accessed 14 May 2007)
Borken J, Patyk A, Rheinhart GA (1999): Basisdaten für ökologisheBilanzierungen. Friedr. Vieweg & Son Publisher, Germany
81

Soybean Meal LCA for Food Products
14 Int J LCA 2007 (OnlineFirst)
Casson A (2003): Oil Palm, Soybeans & Critical Habitatloss – AReview Prepared for the WWF Forest Conservation Initiative.Switzerland. Available at: http://assets.panda.org/downloads/oilpalmsoybeanscriticalhabitatloss25august03.pdf (accessed 14May 2007)
Cederberg C (1998): Life Cycle Assessment of Milk Production –Acomparison of Conventional and Organic Farming. SIK Report643. ISBN 91-7290-189-6
Cederberg C, Darelius K (2001): Livscykelanalys av griskött (Lifecycle assessment of pig meat). Naturresursforum, HallandCounty Council, Sweden (In Swedish). Available at: http://www.regionhalland.se/dynamaster/file_archive/041011/783f1b18fe599c66cafeb5ac66d3c7fc/Rapport%20griskott.pdf (accessed 14may 2007)
Cederberg C, Flysjö A (2004): Life Cycle Inventory of 23 DairyFarms in South-Western Sweden. SIK Report 728, 1–59
Cederberg C, Mattson B (2000): Life cycle assessment of milk pro-duction – A comparison of conventional and organic farming. JClean Prod 8, 49–60
Cederberg C, Stadig M (2003): System expansion and allocation inLife Cycle Assessment of milk and beef production. Int J LCA8, 350–356
Dalgaard R, Halberg N (2005): Life cycle assessment (LCA) ofDanish pork. In: Proceedings from the international workshopon green pork production, Paris, France, 25–27 May 2005, pp165–167
Dalgaard R, Halberg N, Kristensen IS, Larsen I (2006): Modellingrepresentative and coherent Danish farm types based on farmaccountancy data for use in environmental assessments. AgricEcosyst Environ 117 (4) 223–237
Dalgaard T, Halberg N, Porter JR (2001): A model for fossil en-ergy use in Danish agriculture used to compare organic and con-ventional farming. Agric Ecosyst Environ 87 (1) 51–65
Dros JM (2004): Managing the Soyboom: Two scenarios of soyproduction expansion in South America. Commissioned byWWF Forest Conversion Initiative. AIDE Environment. Am-sterdam. Available at: http://assets.panda.org/downloads/managingthesoyboomenglish_nbvt.pdf (accessed 14 May 2007)
de Boer IJM (2003): Environmental impact assessment of conven-tional and organic milk production – A review. Livest Prod Sci80, 69–77
DTE (2005): Pesticide use in oil palm plantations. Down to Earth66. Available at: http://dte.gn.apc.org/66pes.htm (accessed 14May 2007)
Ecoinvent Centre (2004): Ecoinvent data v1.1. Final reportsecoinvent 2000 (1–15). Swiss Centre for Life Cycle Inventories,Dübendorf 2004, CD-ROM
Ekvall T, Andræ ASG (2006): Attributional and consequential en-vironmental assessment of the shift to Lead free solders. Int JLCA 11 (5) 344–353
Ekvall T, Weidema BP (2004): System Boundaries and Input Datain Consequential Life Inventory Analysis. Int J LCA 9 (3) 161–171
Emmersen C (2005): Pers. Comm. Manager of Production at Pro-tein – og Oliefabrikken Scanola A/S. (http://www.scanola.dk)
Eriksson IS, Elmquist H, Stern S, Nybrant T (2004): Environmen-tal Systems Analysis of Pig Production – The Impact of FeedChoice. Int J LCA 10 (2) 143–154
FAOSTAT (2006a): FAOSTAT Agriculture Data, Food and Agri-culture Organisation of the United Nations, Key Statistics ofthe Food and Agricultural External Trade. Available at: http://www.fao.org/es/ess/toptrade/trade.asp (accessed 23 June 2006)
FAOSTAT (2006b): FAOSTAT Agriculture Data, Food and Agri-culture Organisation of the United Nations. Available at: http://faostat.fao.org/ (accessed 23 June 2006)
FAO (2004). Fertilizer use by crop in Argentina. Available at: www.fao.org/docrep/007/y5210e/y5210e00.htm#Contents (accessed2 January 2006)
FAPRI (2006): Food and agricultural policy research institute. Avail-able at: www.fapri.org (accessed 14 May 2007)
Fearnside PM (2000): Global Warming and Tropical Land-UseChange: Greenhouse Gas Emissions from Biomass Burning, De-composition and Soils in Forest Conversion, Shifting Cultiva-tion and Secondary Vegetation. Climatic Change 46, 115–158
Gerbens-Leenes PW, Nonhebel S (2002): Consumption patterns andtheir effects on land required for food. Ecol Econ 42, 185–199
Gyldenkærne S, Mikkelsen MH (2004): Projection of Greenhousegas emission from the agricultural sector. Research notes fromNERI 194. National Environmental Research Institute. Minis-try of the Environment, Denmark
Halberg N, Kristensen ES, Kristensen IS (1995): Nitrogen turnoveron organic and conventional mixed farms. J Agric Environ Eth-ics 8 (1) 30–51
Hauschild M, Potting J (2005): Spatial differentiation in Life Cycleimpact assessment. The EDIP 2003 Methodology. Environmen-tal News 80. Danish Ministry of the Environment. Environ-mental Protection Agency. Available at: http://www.mst.dk/udgiv/publikationer/2005/87-7614-577-8/pdf/87-7614-578-6.pdf (accessed 14 May 2007)
Heller MC, Keoleian GA, Volk TA (2003): Life cycle assessment ofwillow bioenergy cropping system. Biomass & Bioenergy 25,147–165
Ho MW, Ching LL (2003): The Case For A GM-Free SustainableWorld. Independent Science council. Institute of Science in So-ciety. London. 114 pp. Available at: http://www.indsp.org/A%20GM-Free%20Sustainable%20World.pdf (accessed 14May 207)
Ho MW, Cummings J (2005): Glyphosate toxic and Roundup worse.Institute of Science in Society. London. Available at: http://www.i-sis.org.uk/GTARW.php (accessed 14 May 2007)
Houghton RA (2005): Aboveground Forest Biomass and the Glo-bal Carbon Balance. Global Change Biology 11, 945–958
IPCC (2000): Good practice Guidance and Uncertainty Manage-ment in National Greenhouse Gas Inventories. Chapter 4. Agri-culture. 4.1-4.83. IPCC. Available at: www.ipcc.ch/pub/guide.htm (accessed 14 May 2007)
ISO 14044 (2006): Environmental Management – Life Cycle As-sessment – Requirements and guidelines
Jensen, JD, Andersen M, Kristensen K (2001): A Regional Econo-metric Sector Model for Danish Agriculture. A documentationof the regionalized ESMERALDA model. Ministry of Food, Ag-riculture and Fisheries. Report 129. Available at: http://www.foi.kvl.dk/upload/foi/docs/publikationer/rapporter/nummererede%20rapporter/120-129/129.pdf (accessed 8 December2006)
Kim S, Dale BE (2005): Life cycle assessment of various croppingsystems utilized for producing biofuels: Bioethanol and biodiesel.Biomass and Bioenergy 29, 426–439
Kim S, Dale BE (2002): Allocation procedure in ethanol produc-tion system from corn grain I. System expansion. Int J LCA 7(4) 237–243
Kristensen IS, Halberg N, Nielsen AH, Dalgaard R (2005): N-turn-over on Danish mixed dairy farms. Part II. In: Bos J, Pflimlin A,Aarts F, Vertés F (eds), Nutrient management on farm scale.How to attain policy objectives in regions with intensive dairyfarming. Report of the first workshop of the EGF Workshop.Plant Res Int 83, 91-109. Available at: http://www.nitrogenworkshop.org/PDF/Rapport_83_drukversie.pdf (accessed 14May 2007)
82

LCA for Food Products Soybean Meal
Int J LCA 2007 (OnlineFirst) 15
Lindeijer E (2000): Review of land use impact methodologies. JClean Prod 8, 273–281
Matteucci SD, Morillo J, Rodríguez A, Mendoza, N (2004): Elalto Parana encajonado argentino paraguayo. Mosaicos depaisaje y conservación regional. UNESCO, Ediciones FADU,Buenos Aires (in Spanish)
Mattson B, Cederberg C, Blix L (2000): Agricultural land use inlife cycle assessment (LCA): Case studies of three vegetable oilcrops. J Clean Prod 8, 283–292
Milà i Canals L, Bauer C, Depestele J, Dubreuil A, Knuchel RF,Gaillard G, Michelsen O, Müller-Wenk R, Rydgren B (2007):Key elements in a framework for land use impact assessmentwithin LCA. Int J LCA 12 (1) 5–15
Møller J, Thøgersen R, Kjeldsen AM, Weisbjerg MR, Søegaard K,Hvelplund T, Børsting CF (2000): Fodermiddeltabel. Sammen-sætning og foderværdier af fodermidler til kvæg. Rapport 91,Landbrugets Rådgivningscenter, Denmark (in Danish)
Møller J, Thøgersen R, Kjeldsen AM (2003): Ajourføring af Foder-middeltabel. Rapport 91. Available at: http://www.lr.dk/kvaeg/informationsserier/lk-meddelelser/1128.htm (accessed 14 May2007) (in Danish)
MPOB (2005): 2004 – Review of the Malaysian Oil Palm Industry.Economics and Industry Development Division, Malaysian PalmOil Board, Kelana Jaya
Nielsen PH, Nielsen AM, Weidema BP, Dalgaard R, Halberg N(2003): LCA food database. Available on-line ( 5 December2006). Data on fertilizer: http://www.lcafood.dk/processes/in-dustry/fertilizer.htm, data on agricultural machinery: http://www.lcafood.dk/processes/agriculture/traction.htm
Nielsen AM, Nielsen PH, Jensen JD, Andersen M, Weidema BP(2004): Identification of processes affected by a marginal changein demand for food products – Two examples on Danish pigsand cheese. In: Halberg N (ed), Life cycle assessment in the agri-food sector. Proceedings from the 4th International Conference,October 5–8, 2003, Bygholm, Denmark. Danish Institute of Ag-ricultural Sciences, DIAS report. Animal Husbandry 61, pp 127
Oil World (2005): Oil World Annual 2005, May 31. ISTA MielkeGmbH, Hamburg. Available at: http://www.oilworld.biz (ac-cessed 14 May 2007)
Olesen JE, Schelde K, Weiske A, Weisbjerg MR, Asman WAH,Djurhuus J (2006): Modelling greenhouse gas emissions fromEuropean conventional and organic dairy farms. Agric EcosystEnviron 112, 207–220
Patyk A, Reinhardt G (1997): Düngemittel – Energie- und Stoff-stromsbilanzen. Vieweg. Umweltvissenschaften. Friedr. Vieweg& Sohn Verlagsgesellschaft mbH, Braunschweig/Wiesbaden,Germany
Pengue W (2006): Increasing Roundup Ready soybean export fromArgentina. (Box 1.1 in chapter 1). In: Halberg N, Alrøe H,Knudsen MT, Kristensen ES (eds), Global Development of Or-ganic Agriculture: Challenges and Prospects. CABI Publishing.ISBN 1 84593 078 9 978 1 84593 078 3, p 20
Pengue WA (2005): Transgenic crops in Argentina: the ecologicaland social debt. Bulletin of Science, Technology and Society. 25(N4) 1–9, Sage Publications, August, Canada
Peoples MB, Gault RR, Lean B, Sykes JD, Brockwell J (1995): Ni-trogen fixation by soyabean in commercial irrigated crops ofcentral and southern New South Wales. Soil Biol Biochem 27(4/5) 553–561
Pré (2004): SIMAPRO 6.0 Pre Consultants B.V. Plotterweg 12, 3821BB Amersfort. The Netherlands. www.pre.nl
Reusser L (1994): Ököbilanz des Sojaöls. Erstellt als Diplomarbeitim Rahmen des Nachdiplomstudiums. 'Umweltingenieurwesen'1993/94 der ETH Lausanne
SAGPyA (2006): Secretaría de Agricultura, Granadería, Pesca yAlimentos. Estimaciones Agrícolas – Oleaginosas. Available at:www.sagpya.gov.ar/http-hsi/bases/oleagi.htm (accesed 14 May2007)
Schmidt JH (2004): The Importance of System Boundaries forLarge Material Flows of Vegetable Oils. Poster presented tothe Fourth World SETAC Congress, 14th to18th of November,2004, Portland, Oregon. Available at: http://www.plan.aau.dk/~jannick/Publications/Poster_SETAC_Portland.pdf (accessed 14May 2007)
Schmidt J, Weidema B (2007): Shift in marginal of vegetable oil.Int J LCA (submitted)
Statistikbanken (2006): Statistics Denmark Agriculture. Availableat: www.statistikbanken.dk (accessed 23 June 2006)
Tengnäs B, Nilsson B (2003): Soybean: Where is it from and whatare its uses? A report for WWF Sweden. WWF Sweden
Thrane M (2006): LCA of Danish fish products. Int J LCA 11 (1)66–74
Unilever (2004): LCI datasheets for palm oil, palm kernel oil andcoconut oil. The LCI data are collected by Unilever during 1990.Provided by and interpreted in collaboration with Peter Shon-field. LCA Team Leader, Chemistry & Environmental Protec-tion Department, Safety and Environmental Assurance Centre,Unilever
Van der Werf HMG, Petit J, Sanders J (2005): The environmentalimpacts of the production of concentrated feed: The case of pigfeed in Bretagne. Agric Sys 83, 153–177
Wakker E (2005): Greasy palms. The social and ecological impactsof large-scale oil palm plantation development in Southeast Asia.Friends of the Earth. Available at: http://www.foe.co.uk/resource/reports/greasy_palms_impacts.pdf (accessed 14 May 2007)
Weidema BP (2004): Geographical, technological and temporal de-limitation in LCA. UMIP Method. København, Miljøstyrelsen.Environmental News 74. Available at: http://www.mst.dk/Udgivelser/Publications/2004/12/87-7614-305-8.htm (accessed14 May 2007)
Weidema BP, Lindeijer E (2001): Physical impacts of land use inproduct life cycle assessment. Final report of the EURENVIRON-LCAGAPS sub-project on land use. Lyngby, Department ofManufacturing Engineering and Management, Technical Uni-versity of Denmark, (IPL-033-01), revised version dated2001.12.31
Weidema B (2003): Market information in Life Cycle assessment.Environmental Project No. 863. Danish Ministry of the Environ-ment. Environmental Protection Agency, available at: http://www2.mst.dk/Udgiv/publications/2003/87-7972-991-6/pdf/87-7972-992-4.pdf (accessed 14 may 2007)
Weidema BP (1999): System expansions to handle co-products ofrenewable materials. Presentation Summaries of the 7th LCACase Studies Symposium SETAC-Europe, pp 45–48
Wenzel H, Hauschild M, Alting L (1997): Environmental Assess-ments of products – Vol 1: Methodology, tools and case studiesin product development. Chapman & Hall, London
Yusoff S, Hansen SB (2007): Feasibility Study of Performing a LifeCycle Assessment on Crude Palm Oil Production in Malaysia.Int J LCA (1) 50–58
Zah R, Hischier R (2003): Life Cycle Inventories of Detergents –Data v1.01 (2003). Ecoinvent Report 12, Swiss Centre for LifeCycle Inventories, Dübendorf
Received: August 2nd, 2006Accepted: June 10th, 2007
OnlineFirst: June 11th, 2007
83

84

Environmental assessment of Danish pork RANDI DALGAARD1,2, JØRGEN DEJGAARD JENSEN3, BO WEIDEMA4, NIELS HAL-BERG1 AND CLAUS ÅGE GRØN SØRENSEN5
1) University of Aarhus, Faculty of Agricultural Sciences, Department of Agroecology
and Environment, P.O. Box 50, DK-8830 Tjele
2) Aalborg University, Department of Development and Planning, Fibigerstræde 13,
DK-9220 Aalborg East
3) Danish Research Institute of Food Economics, Rolighedsvej 25, DK-1958
Frederiksberg C
4) 2.-0 LCA consultants, Amagertorv 3, 2., DK-1160 København K.
5) University of Aarhus, Faculty of Agricultural Sciences, Department of Agricultural
Engineering, Schüttesvej 17, DK-8700 Horsens
I
3
85

86

Int J LCA - Submission date: 14th March 2007; Pages of text 8; No. of figs. 4; No. of tables 5
Environmental assessment of Danish pork Authors: Randi Dalgaard1,2*, Jørgen Dejgaard Jensen3, Bo Weidema4, Niels Halberg1 and Claus Å.G. Sørensen5
1 University of Aarhus, Faculty of Agricultural Sciences, Department of Agroecology and Environment, Denmark
2 Aalborg University, Department of Development and Planning, Fibigerstræde 13, 9220 Aalborg East, Denmark
3 Danish Research Institute of Food Economics, Rolighedsvej 25, DK-1958 Frederiksberg C, Denmark
4 2.-0 LCA consultants, Amagertorv 3, 2., 1160 København K., Denmark
5 University of Aarhus, Faculty of Agricultural Sciences, Department of Agricultural Engineering, Denmark
*Corresponding author ([email protected])
Abstract
Background, Aim and Scope. The pig production in Denmark and other European countries
affects the environment in several ways. The pork production chain is complex, and there still
is a need to identify the most polluting parts of the product chain. The objectives of the study
were therefore:
• To provide LCA data on Danish pork and demonstrate an application of consequential
LCA modelling within food production
• To develop the use of consequential LCA methodology for agricultural products using
representative farm account data and an economic assessment method
• To identify the processes in the product chain of pork with the largest environmental
impact (hot spots)
The functional unit was one kg of pork produced in Denmark and delivered to Harwich Har-
bour in Great Britain.
Materials and Methods. Consequential LCA modelling was used to show the consequences
of producing one additional kilogram of Danish pork and transporting it to Harwich Harbour.
Identification of the processes and products that would be affected by a change in demand for
pork was facilitated by already established data sources: Agricultural data used in the study
were primarily from a national agricultural model based on farm types that are representative
of the entire Danish agricultural sector. The econometric sector model ESMERALDA was
87

used to identify the farm types affected by a change in demand for pigs and crops. For the
Impact Assessment, EDIP 1997 (version 2.03) was used. The environmental impact catego-
ries considered were global warming, eutrophication, acidification and photochemical smog,
and in addition land use (unit: m2year) was calculated.
Results. The environmental impacts were 3.77 kg CO2 eq. global warming potential, 319 g
NO3 eq. eutrophication potential, 59 g SO2 eq. acidification potential, and 1.27 g ethene eq.
photochemical smog potential per kg Danish pork delivered to Harwich Harbour. The area
occupied per kg pork was 9.1 m2year. Farms for fattening pigs (size: 30-100 kg) and weaners
(size: 7-30 kg) were identified as being the environmental hot spots for both global warming,
eutrophication and acidification. Within the farms, nitrate, ammonia and nitrous oxide emis-
sions were the major contributors to eutrophication, acidification and global warming, respec-
tively. The transport of the pork by lorry and oceanic freighter to Harwich Harbour contrib-
uted less than 2% for all impact categories, except for photochemical smog where the
contribution was 5%.
Discussion. The results were, in general, in accordance with previously published studies, al-
though consequential modelling was not used in these. Sensitivity analyses showed that even
if the Danish pork was transported to Japan, which is the third largest importer of Danish
pork, the global warming potential per kg Danish pork (delivered to Tokyo Harbour) would
increase by only 5%.
Conclusions. It proved possible to generate LCA data using consequential modelling for an
agricultural product based on representative farm data and to identify affected farm types us-
ing the econometric sector model ESMERALDA. Main contributors to all impact categories,
except photochemical smog, were the farms producing fattening pigs and weaners. Particu-
larly, the nitrogen-containing compounds nitrate, nitrous oxide, and ammonia were responsi-
ble for much of the environmental impact. Efficient use of nitrogen on pig farms is therefore
an important issue if the environmental impact from pig production is to be reduced.
Perspectives. The distance food is transported (food miles) was revealed not to be very im-
portant for any of the impact categories. Instead we recommend that the nitrogen use effi-
ciency on pig farms is focused on in order to improve the environmental impact of Danish
88

pork. There are several sources of greenhouse gases in the product chain of pork and most of
these will be reduced if the nitrogen use efficiency is improved at farm level.
Keywords: Agriculture; consequential LCA; LCA; pork; pig; system expansion
1 Introduction
Livestock keeping is responsible for 18 percent of the greenhouse gas emissions and 64 per-
cent of the anthropogenic ammonia emissions in the world (Steinfeld et al. 2006). However,
future population growth and an increase in consumption will raise the demand for meat
(Elfering & Nonhebel 2006), and, specifically, an increase in pork production and trade is
forecasted for the next decade (FAPRI 2006). Therefore, more than ever, it is pertinent to get
precise information on the environmental load from different livestock products in order to
identify environmental hot spots and reduce emissions. In Europe, pork production is also ex-
pected to increase, but only slightly due to strict environmental regulations and animal wel-
fare requirements (FAPRI 2006). In 2002-2004, 65% of the European pigs produced came
from Germany, France, Spain and Denmark.
The debate on the impact of pork production on the environment has increased in Europe, not
only because the amount produced is continually increasing, but also because pork production
becomes increasingly concentrated in specific geographical areas. According to OECD
(2003), there is a general tendency within all OECD countries for pig production to become
more intensive, with an increase in the average number of animals per unit land area and per
pig farm. The concern is mostly directed towards the local environment (e.g. lakes, fens and
inlets), which may be affected by – for example - nitrate or phosphate leached from the fields
of adjacent pig farms or ammonia evaporated from their slurry tanks (European Environment
Agency 2005).
The increasing global character of the pork chain with much of the concentrates being im-
ported to Europe from South America (soybeans) and Asia (palm oil) necessitates an assess-
ment of the environmental impact on a global scale including concentrate production. It is
claimed that the soybean production escalates the use of genetically modified plants, the use
of the pesticide glyphosate (Pengue 2006; Benbrook 2005), greenhouse gas emissions (Dal-
gaard et al. submitted), and the loss of biodiversity and deforestation (Benbrook 2005; Stein-
feld et al. 2006).
89

Moreover, the increased transport arising from globalization of food chains impacts the envi-
ronment negatively. Thus the term ‘food mile’, which is a measure of the transport distance of
a food product from producer to consumer, has become part of the debate (Pretty et al. 2005;
Saunders et al. 2006)
The product chain of pork is complex, and so is the environmental assessment of pig and pork
products. The LCA methodology has previously been used for environmental assessment of
pig and pork (Eriksson et al., 2005; Cederberg & Flysjo 2004; Carlsson-Kanyama 1998; Bas-
set-Mens & van der Werf 2005; Halberg et al. submitted). In most of these studies the attribu-
tional LCA approach was applied. Only Halberg et al. (submitted) applied the consequential
LCA approach.
There has been an ongoing discussion whether to use consequential or attributional LCA
(Heijungs & Guinée, submitted; Tillman, 2000; Ekvall and Finnveden, 2001; Curran et al.,
2005; Ekvall and Andræ, 2005; Cederberg & Stadig, 2004). In attributional LCA, only mate-
rial and energy flows physically linked to the considered product are taken into account,
whereas in consequential LCA products outside the (‘physical’) life cycle are also included if
these products are affected by a change in demand. A fundamental question in consequential
LCA is who and what will be affected by a change in demand for the product in question. For
example, a change in demand for pork implies a change in demand for fattening pigs, wean-
ers, concentrates, electricity, heating oil, fertilizer, etc. A large challenge in consequential
LCA is to define who the suppliers of these items are and what technology or type of produc-
tion is used. Besides providing LCA data on pork and identifying environmental hot spots, the
aim of this article also is to show how affected suppliers can be identified and how this, in
some cases, can be facilitated by using already existing economic models and data.
2 Goal and scope definition
The objectives of the study were:
• To provide LCA data on Danish pork and demonstrate an application of consequential
LCA modelling within food production.
• To develop the use of consequential LCA methodology for agricultural products using
representative farm account data and an econometric sector model.
90

• To identify the processes in the product chain of pork with the largest environmental
impact (hot spots).
The functional unit is defined as 1 kg Danish pork (carcass weight) delivered to Harwich
Harbour in Great Britain.
Consequential LCA modelling was used. This implies that the processes and their technolo-
gies involved are those actually affected by the additional production of 1 kg pork, as op-
posed to the average kg produced. The affected processes are identified as those most sensi-
tive to a change in demand. In a market with increasing output over time, the producers that
can increase their output most efficiently (at the lowest costs) will react more strongly to an
increase in demand than less efficient producers or producers that are constrained with respect
to one or more of their production factors. In a market with decreasing output over time, the
least efficient producers with excess capacity will typically be most sensitive to a change in
demand. Processes affected by a change in demand for pigs are presented in figure 1. The
lowest lefthand corner of the figure shows ‘Danish pork delivered to Harwich Harbour’ . The
pork is transported by freighter oceanic and lorry from the slaughterhouse, and the pigs
slaughtered at the slaughterhouse are primarily fattening pigs produced at specialized fatten-
ing pig farms, but also culled sows from specialized weaner farms. The fattening pig farm
purchases weaners (30 kg) from the specialized weaner farm.
91

Subsystems Farm inputs Pig productionAvoided agri-
cultural products
Rape seed
Sugar beets
Grass seed
Peas
Spring barley
Winter barley
Potatoes
Bread wheat
Meat processing and distribution
Feedsubsystem 1Feed with lowprotein content
Feedsubsystem 2Feed with highprotein content
Fertilizersubsystem
Energysubsystem
Feed
Fertilizer(N, P, K)
Energy(diesel,
heating oil,electricity)
Weanerfarm
Weaner(30 kg)
Fatteningpig farm
Fattening pig(100 kg)
Sow
Pig
Slaughter-house
PorkTransport toHarwich Harbour
Danish pork delivered to
Harwich Harbour
Fig. 1. The product chain of Danish pork. Boxes with angular corners represent products and boxes
with rounded corners represent processes.
Figure 1 also illustrates the ‘farm inputs’, which are the commodities used directly on the
farm, and ‘subsystems’, which are the processes outside the product chain of pig that are af-
fected by the increased demand of the farm inputs. Inputs to the two farms are feed, fertilizer
and energy.
The two pig farms also produced cash crops (rape seed, sugar beets, etc.), as shown to the
right in figure 1 under the heading ‘avoided agricultural products’. According to the concept
of system expansion used in consequential LCA, each of these products will replace similar
products, or products with the same function, on the market (Weidema 2003). Therefore, the
environmental impact from the product chain of pig was only to be ascribed to pig, no alloca-
tion was needed. The environmental burdens due to replaced production of bread wheat, rape
92
seed, sugar beets etc. were subtracted from the environmental impact of pig. The EDIP 1997
(Wenzel et al. 1997, updated version 2.3) was used for the impact assessment, and the follow-
ing impact categories were included: global warming, eutrophication, acidification and photo-
chemical smog. Results for land use per kg pig in terms of land occupation (unit: m2year) are
also presented.
3 Inventory
3.1 Data on fattening pigs, weaners and cash crops
Data on the agricultural products shown in figure 1 (e.g. weaners, fattening pigs, rape seed,
sugar beets) derive from a national agricultural model established by Dalgaard et al. (2006) on
the basis of farm account data, which are representative for the Danish agricultural sector. The
national agricultural model contains data on resource use, production and emissions from 31
typical farm types. These 31 farm types are representative of the Danish Agricultural sector
(in the year 1999). Within each farm type there is coherency between resource use (e.g. feed,
fertilizer), production (e.g. pig, cash crops) and emissions. For a more comprehensive descrip-
tion of the 31 representative farm types, see Dalgaard et al. (2006).
The national agricultural model contains six specialized pig farm types that represent 76% of
the fattening pig production in 1999. The rest of the pigs are produced on different types of
farm, such as part-time farms, dairy farms or arable farms. The different kinds of cash crops
are not only produced on the arable farms, but also on pig and milk producing farms. But
which farm types are affected by a change in demand for fattening pig or wheat? An answer
to the question can be obtained using the econometric sector model ESMERALDA (Jensen et
al. 2001) as explained in the following. The identification of the affected fattening pig sup-
plier is used as an example, but the same procedure was followed to identify the affected crop
suppliers.
The observed structure of production across farm types is assumed to be an equilibrium situa-
tion in the sense that it is compatible with the economic framework conditions in the corre-
sponding period. Now assume a marginal shift in the demand for pork, see figure 2. Assuming
market equilibrium, this demand shift will affect prices, which in turn will affect pork supply
(and possibly the supply of other agricultural products) possibly on several of the farm types.
These supply responses were determined by means of the ESMERALDA model (Jensen et
al., 2001), which comprises econometrically estimated behavioural parameters for eight broad
93

farm categories: full-time pig, cattle and crop farms, as well as part-time farms, on clay and
sandy soil. Parameters were estimated from farm-level FADN data for the period 1973/74 to
1995/96. The eight broad farm categories can to a large extent be considered as an aggrega-
tion of the 31 farm types, and hence behavioural parameters (e.g. elasticity of product trans-
formation, elasticity of input substitution, parameters of marginal factor productivity) for one
farm category were assumed to represent all farm types within this category. For example,
behavioural parameters for the farm category of pig farms on sandy soil were assumed to rep-
resent all three pig farm types on sandy soil in the national agricultural model. Together with
structural information (e.g land allocation, livestock density, composition of livestock produc-
tion, capital intensity, cost structure) on each farm type, these behavioural parameters deter-
mine the marginal output response for each farm type. While all farm types react slightly to a
change in demand, we only used the farm type with the largest total marginal response to pork
supply. The marginal producers of cash crops and feed grain were identified by the same pro-
cedure.
Marginal shift in pork demand
Marginal shift in pork price
ESMERALDA- 8 broad farm categories
Behavioural parameters/supplyresponse in different farmcategories:• pig farms on sandy soil
• pig farms on clay soil
•6 other farm categories
National agricultural model- 31 farm types
• pig farms, sand, LD<1.4• pig farms, sand, LD>1.4• pig farms, sand, LD>1.7
• pig farms, clay, LD<1.4• pig farms, clay, LD>1.4• pig farms, clay, LD>1.7• 25 other farm types
Identification ofmarginal pig
producing farm type
Fig. 2. Procedure for identification of the marginal pork producing farm type amongst the 31
farm types from the national agricultural model
94

The marginal pork producer type was hence characterized as a specialized pig farm located on
sandy soil, with a livestock density (LD) below 1.4 livestock units per hectare (one livestock
unit equals 36 fattening pigs (30-100 kg)). This farm type represented 2310 pig farms and 11
% of the total pig production in the baseline situation, but around one third of the marginal in-
crease in pig production. That the marginal fattening pig is produced on a specialized pig farm
on sandy soil seems reasonable, because the number of specialized pig farms is increasing and
the pig farms are moving to the west of Denmark where sandy soil dominates (Dalgaard et al.
2006). The identified farm type represented both weaner farms and fattening pig farms, and in
order to establish a farm type producing exclusively fattening pigs, the farm accounts were
subdivided into three new farm types: one representing pig farms producing only fattening
pigs, one representing pig farms producing only weaners (and culled sows), and one group
producing both types of pigs. The farm type producing only fattening pigs was selected as
data source for the fattening pig farm and represented 1195 fattening pig farms in Denmark,
corresponding to 8.2% of the total fattening pig production in 1999. The farm type producing
only weaners was selected as data source for the weaner farm and represented 213 weaner
farms in Denmark, corresponding to 2.6% of the total weaner production in Denmark in 1999.
The characteristics of the two farm types are presented in table 1, and the inventory for the
two farm types is presented in table 2. Data in table 1 and 2 form part of the national agricul-
tural model established by Dalgaard et al. (2006). The majority of the agricultural area at the
two farm types is under cereal production, as shown in table 1. Cereal grown at the farms is
used as feed at the farms, except for 65% of the wheat, which is sold as wheat for bread-
baking (table 2). Less than 20% of the agricultural area on the two farms is used for growing
rape seed and other cash crops (sugar beets, peas, potatoes and seeds). Self-sufficiency in feed
supply (measured in N) is lowest for the weaner farm, because the feed demand per ha for the
weaner farm is higher, while the production of feed grain is almost the same on the two farms.
Table 2 shows that the amount of feed grain and soybean meal imported by the farms is high-
est for the weaner farm. On a yearly basis, the two farms produce 1402 fattening pigs (size
100 kg) and 2717 weaners (size: 30 kg), respectively. N excretion per animal (table 1) is from
Poulsen et al. (2001). The N and P surpluses are the annual imports of N and P to the farms
that are not exported in products. The N and P surpluses are calculated following the proce-
dures of Halberg et al. (1995) and Kristensen et al. (2005). For further details see Dalgaard et
al. (2006).
95

Table 1. Characteristics of fattening pig farm and weaner farm. Data source: Sub types of
farm type 20 in Dalgaard et al. (2006)
Characteristics Unit Fattening pig
farm Weaner farm
Agricultural area ha 71 73
Grain % 68 68
Rape seed % 10 8
Other cash crops % 8 11
Grass and set-aside % 14 13
Self sufficiency in feed
(measured in N) % 41 35
Livestock density LU ha-1 0.8 0.8
Fattening pigs produced Animals year-1 1402 0
Weaners produced Animals year-1 0 2820
N excretion
Weaners (7-30 kg) kg N animal-1 0.64
Fattening pigs (30-100 kg) kg N animal-1 3.15
N surplus kg N ha-1 year-1 95 107
P surplus kg P ha-1 year-1 13 16
96

Table 2. Inventories of the fattening pig farm type and the weaner farm type, showing farm
inputs, sold cash crops and emissions per year. Data source: Sub types of farm type 20 in
Dalgaard et al. (2006)
Farm inputs Unit Fattening pig
farm Weaner farm
Feed grain kg ha-1 268 668
Soybean meal kg ha-1 791 859
Mineral feed kg P ha-1 9 14
Weaners (size: 30 kg) kg ha-1 559 0
Fertilizer, N kg ha-1 92 90
Fertilizer, P kg ha-1 10 7
Fertilizer, K kg ha-1 41 36
Electricity kWh ha-1 385 559
Heating oil MJ ha-1 471 2366
Diesel MJ ha-1 3878 3912
Lubricant oil liter ha-1 11 11
Sold cash crops
Bread wheat kg ha-1 1141 1147
Rape seed kg ha-1 257 241
Sugar beets kg ha-1 689 867
Straw kg ha-1 384 437
Peas kg ha-1 84 131
Grass seeds kg ha-1 26 50
Emissions
Methane kg CH4 ha-1 19 16
Ammonia kg NH3 ha-1 30.4 35.7
Nitrous oxide kg N2O ha-1 6.3 7.0
CO2-fossil kg CO2 ha-1 337 340
Nitrate kg NO3 ha-1 307 325
Phosphate kg HPO4 ha-1 1.2 1.6
97

Annual purchased farm inputs by the two pig farms are shown in table 2. The weaner farm
purchased more feed grain, soybean meal and mineral feed compared with the fattening pig
farm, while the amounts of fertilizer imported are almost equal for the two farms. More elec-
tricity and heating oil are used on the weaner farm, as it uses a climate-controlled livestock
building for piglets. The tractor diesel consumption is the same for the two farms, as almost
the same crops are grown on the farms (see table 1). The methane and nitrous oxide emissions
presented in table 2 are calculated according to guidelines from the Intergovernmental Panel
on Climate Change (IPCC 1997; 2000), while ammonia emission from animal houses, manure
handlings and fields were calculated using standard values from Hutchings et al. (2001), and
nitrate and phosphate emissions were calculated using the values for N and P surpluses pre-
sented in table 1, but taking into account that not all N and P surpluses are lost as nitrate or
phosphate. For further detail, see Dalgaard et al. (2006).
3.2 Farm input data and identification of subsystems affected by a change in demand
Feed, fertilizer and energy inputs are imported by the two pig farms (figure 1). An increase in
consumption of these products does not automatically lead to the production of identical
products but might in many cases lead to a product substitution, where products outside the
‘physical’ product chain of the pig are affected by the increased demand for farm inputs.
These product substitutions will be explained in the following.
3.2.1 Feed
An increased production of fattening pigs implies an increased demand for feed. Typically the
purchased feed mixtures used on Danish pig farms contain several ingredients (e.g. rape seed
meal, soybean meal, wheat, barley, fish meal, sunflower meal), but using the consequential
approach it is sufficient to have LCA data on the crops, which are affected by an increased
demand for feed.
When a fattening pig farm purchases – for example - rape seed meal, there will be an in-
creased demand for rape seed meal on the market. But because the most competitive protein
meal on the world market is soybean meal, and not rape seed meal as argued by Dalgaard et
al. (submitted) and Weidema (2003), the increased demand for rape seed meal will result in an
increased production of soybean meal. Consequently, it is necessary to have LCA data on
soybean meal, but not on rape seed meal and other ‘not-affected crops’. Because soybean
meal has too high a protein content to meet both the protein and energy demand of pigs, also
98

grain production is affected by an increased demand for feed. So even though several feed in-
gredients are purchased by a pig farm, only LCA data on soybean meal and grain are needed.
The amounts of soybean meal and grain are calculated on the basis of energy and protein con-
tent of the feed ingredients needed to satisfy the protein and energy requirements of the pigs.
In the following, the data sources on soybean meal and grain will be explained.
LCA data on soybean meal produced in Argentina and delivered to the Netherlands are used
(Dalgaard et al. submitted), and LCA data on transport of the soybean meal to Denmark is
added. In the establishment of LCA data on soybean meal it is assumed that the co-product
soybean oil displaces palm oil cultivated in Asia (Dalgaard et al. submitted; Schmidt & Wei-
dema, submitted). Change in the demand for grain may affect the production of feed grain in
many locations including Denmark. In our calculations we have used a similar approach to
identify the affected producers in Denmark as described for the pig farm types. Consequently,
LCA data on feed grain are (similar to the fattening pig and weaner data) from the national
agricultural model. The feed grain is a mix of spring barley (25%), winter barley (25%) and
wheat (50%). See Dalgaard et al. (2006) for details on modelling of emissions and resource
use, and see www.LCAfood.dk.
3.2.2 Fertilizer
Nitrogen, phosphorus and potassium artificial fertilizers are used on the two pig farms and for
production of the feed purchased by the two pig farms. A change in demand for artificial fer-
tilizer affects the less competitive fertilizer producers, as the European market has experi-
enced a decrease in the consumption of fertilizer due to environmental restrictions (Weidema
2003, p. 73). LCA data on production of artificial fertilizer represent the least competitive fer-
tilizer producers and are from Patyk & Reinhardt (1997).
3.2.3 Energy, animal housing and equipment
Diesel purchased by the farms is used for the agricultural machinery, and these data are based
on Borken et al. (1999), but moderated to average load (for further information, go to
www.LCAfood.dk). Data on electricity (electricity from fuel gas power plant in the Nether-
lands), transport by lorry (16t), and heating oil used for animal housing are all from the
Ecoinvent Centre (2004). Data on the manufacturing and transport of materials used for ani-
mal housing and equipment (e.g. concrete, wood) are from Halberg et al. (submitted), who
used LCA data on the materials from the Ecoinvent Centre (2004).
99

3.2.4 Avoided products
No allocation between co-products has been performed. Co-product outputs displace other
products, which are thus included as avoided products by system expansion. Emissions from
the avoided products (see figure 1) are subtracted from the emissions from the farm. LCA
data for the avoided production have the same origin (Dalgaard et al. 2006) as LCA data on
feed grain. See the description in section 3.1.2.1.
3.2.5 Data on meat processing and transport
Fattening pigs and sows from the farms were assumed to be transported by lorry (size:16 ton-
nes) 50 km to the slaughterhouse. Data on the slaughtering process were based on Pontoppi-
dan & Hansen (2001) and represented more than 90% of the pig slaughtering in Denmark in
1997/1998. The resource use per 100 kg fattening pig or sow was 8.4 kWh electricity, 13.3
kWh heat and 200 litres of water. The assumed carcass weight was 76.3% of the living weight
(Poulsen et al. 2001), which is in good agreement with the results of Andersen et al. (1999).
Fifteen kilo waste in terms of bone, blood and meat meal was produced per 100 kg living
weight fattening pig or sow. This was either transported to an incineration plant where it was
used for energy production, used as feed or destructed. The possibly avoided production of
feed caused by reuse of bone, blood and meat meal was small and was therefore excluded
from the calculations. For further details see www.LCAfood.dk.
Transport by lorry (size 16 tonnes) from the slaughterhouse to the freighter oceanic was as-
sumed to be 126 km, which equals the distance from Horsens Slaugtherhouse (largest slaugh-
terhouse in Denmark), to Esbjerg Harbour (largest pork exporting harbour in Denmark). LCA
data on transport by freighter oceanic are from Ecoinvent Centre (2004). The distance from
Esbjerg Harbour to Harwich Harbour is 619 km.
4 Results
Characterization and normalization results are presented in this section. Afterwards environ-
mental hot spots and land occupation are described.
4.1 Characterized and normalised results
The characterized and normalised results for 1 kg pork delivered to Harwich Harbour are pre-
sented in table 3. The normalization showed that the pork production contributed more to
global warming, eutrophication, acidification than to the other impact categories.
100

Table 3. Impact potentials. Normalised and characterized results. Functional unit: 1 kg pork
delivered to Harwich Harbour
Impact category Characterization Normalization
Global warming 3.77 kg CO2 eq. 4.3E-04
Eutrophication 319 g NO3 eq. 1.1E-03
Acidification 59 g SO2 eq. 4.7E-04
Photochemical smog 1.27 g ethene eq. 6.3E-05
Table 4 shows the potential contributions from different parts of the product chain of fattening
pigs. The respective parts of the product chain of pork are defined according to inputs to the
fattening pig farm (‘fertilizer’, ‘feed’, ‘energy’ and ‘weaners’) and the ‘agricultural produc-
tions’ displaced by the outputs from the fattening pig farm. The avoided agricultural products
are: bread wheat, rape seeds, sugar beets, peas and grass seeds (see table 2). ‘Energy’ includes
oil for heat, diesel refining and distribution, lubricant oil used for machinery, and electricity
used on the fattening pig farm. Energy used for production of weaners, feed and fertilizer is
included in ‘weaner farm’, ‘feed’ and ‘fertilizer’ respectively. Production of the inputs to the
fattening pig farm also encompasses co-productions (e.g. rape seed from the weaner produc-
tion, soybean oil from soybean meal production). The avoided productions are included under
their respective inputs to the fattening pig farm, and cannot directly be seen from table 4.
‘Fertilizer’ includes artificially produced N, P and K fertilizer. ‘Feed’ includes solely the feed
purchased by the fattening pig farm. The contribution from animal housing and equipment is
less than one percent for all impact categories and thus omitted from table 4.
In the following, the environmental hot spots for each of the impact categories are presented.
All percentages refer to equivalents within the respective impact categories (see table 4).
101

Table 4. Environmental hot spots in the product chain of pork based on characterized results.
Values are percentages of the total emission from the considered part of the product chain.
Functional Unit: One kg Danish pork (slaughtered weight) delivered to Harwich Harbour in
Great Britain. Calculated according to EDIP method (Wenzel et al. 1997)
Part of product chain of
Danish pork
Global
warming Eutrophication
Acidifica-
tion
Photochemi-
cal smog
Inputs to fattening pig farm
Fertilizer 13 1 3 2
Feed 14 2 6 29
Energy 5 0 1 20
Weaners 23 22 26 17
Fattening pig farm 40 71 60 22
Avoided agricultural
production -21 -22 -12 -14
Slaughterhouse 4 4 3 5
Transport to UK 1 0 1 5
Global warming potential: Main contributors to the global warming potential are the fatten-
ing pig farm (40%) and the weaner farm (23%). Of the greenhouse gases emitted on the fat-
tening pig farm 72% is nitrous oxide (fig. 3), whereas fossil CO2 from the use of agricultural
machinery only contributes 11%, and methane from slurry handling contributes 17%. The dif-
ferent sources of nitrous oxide emissions at the fattening pig farm are presented in fig. 4, and
it shows that 43% of the nitrous oxide comes from denitrification of nitrate leached from the
field, and 44% originates from denitrification of N fertilizer (artificial fertilizer and slurry)
applied to the fields. Table 4 shows that production and distribution of fertilizer imported to
the fattening pig farm contributes 13% of the greenhouse gases emitted. Of this, 94% is re-
lated to the production of N fertilizer and only 6% to the production of P and K (not shown),
because these fertilizer types are used in smaller amounts and less energy is used for their
manufacture. Of the emitted greenhouse gases, 14% is are related to the production of feeds
imported to the fattening pig farm, and 79% of this can be ascribed to production and distribu-
102

tion of soybean meal. So despite the fattening farm and weaner production, production and
distribution of soybean meal and artificial N fertilizer can also be considered as being envi-
ronmental hot spots. The contribution from ‘Slaughterhouse’ (which includes transport from
farm to slaughterhouse) is only 4%, while the transport from the slaughterhouse to Harwich
Harbour only contributes 1%. The contribution from lorry (distance: 126 km) is seven times
as high as from ship (distance: 619 km).
Nitrous oxide72%
Methane17%
Carbon dioxide11%
Manure applied to
f ield16%
Fertilizer28%
Nitrate 43%
Crop residues
7%
Manure handling
4%Ammonia
2%
Fig 3. Types of greenhouse gases emitted from
the fattening pig farm. Unit: CO2 eq
Fig. 4. Sources of nitrous oxide emissions on the
fattening pig farm.
Eutrophication potential: The contribution to eutrophication is 71% from the fattening pig
farm and 22% from the ‘weaners’. Out of this. 69%, 28% and 3% comes from nitrate, ammo-
nia and phosphate, respectively. Nitrate and phosphate are leached from the fields. Ammonia
is primarily emitted from the animal house, during storage in slurry tanks and under and after
application of the slurry to fields.
Acidification potential: The fattening pig farm and the production of weaners contribute
60% and 26%, respectively, of the emitted acidifying substances. Ammonia from the farms
amounts to 83% of the acidifying substances emitted from the product chain of Danish pork.
The ammonia emitted from the fattening pig farm comes from slurry in the stable (38%), stor-
age of slurry in slurry tanks (12%), application of slurry (20%) and N fertilizer (11%) to the
103

fields and from the crops (19%). ‘Feed’ accounts for 6% of the acidifying substances emitted,
and fertilizer and ‘energy’ purchased by the fattening pig farm account for 3% and 1%, re-
spectively. The contribution from ‘slaughterhouse’ and ‘transport to UK’ are 3% and 1%, re-
spectively, primarily related to energy use.
Photochemical smog potential: Substances contributing to photochemical smog primarily
come from refining and combustion of fossil fuel. ‘Feed’ is the largest contributor (29%),
with soybean meal being more important than feed grains. ‘Fattening pig farm’ contributes
22% of the photochemical smog potential, and out of this 21% can be ascribed to methane
emission and the rest to volatile organic compounds emitted from diesel combustion.
4.2 Land use
The land used for production of 1 kg Danish pork equals 9.1 m2year. Of these, 3.4 m2year are
used for soybean cultivation in Argentina. So an increase in demand of 1 kg Danish fattening
pig implies the use of 3.4 m2 in Argentina and 5.7 in Denmark during one year.
5 Discussion
Focus on the environmental impact of food transport has increased (e.g. Pretty et al. 2005;
Saunders et al. 2006), but according to our results the food transport is of minor importance
for all impact categories. Considering global warming potential, only 1% of the greenhouse
gases emitted can be related to the transport from the slaughterhouse to Harwich Harbour.
The transport by lorry (126 km) emitted seven times as much greenhouse gas as the transport
by freighter oceanic (619 km). Thus, to use ‘food miles’ as an environmental indicator would
be misleading, if the type of transport was not specified. Much of the Danish pork is also sold
on the Japanese market, and a sensitivity test showed that if the pork was sailed to Tokyo
Harbour in Japan (distance: 21,693 km) instead of Harwich Harbour, the global warming po-
tential per kg pork would increase by 5% (from 3.77 to 3.96 kg CO2 eq.). So even though the
pork is transported a long distance, the most polluting part of the product chain is still the
farm and more environmental improvement could be achieved by increasing nutrient use effi-
ciency in the livestock production than by focusing on food miles. Special attention should be
given to the nitrogen-containing compounds nitrate, nitrous oxide and ammonia as these are
the main contributors to eutrophication, global warming and acidification, respectively. A mo-
re efficient use of nitrogen on the pig farms is an effective means of reducing the environ-
mental impact of pork production. There are several ways of increasing nitrogen efficiency.
104

For example, a manure management system where the manure is handled as slurry/liquid (as
opposed to solid manure) will decrease the nitrous oxide emissions (Oenema et al. 2006), and
ammonia evaporation can be reduced by covering the slurry tanks, which is already embedded
in the Danish legislation. Higher N efficiency in the field can – for example - be obtained by
timely application of slurry/manure and by injection of slurry into the soil. This might reduce
the nitrate leaching and thus also the nitrous oxide formed during denitrification of leached ni-
trate. Reduced nitrate leaching from the fields also improves the nitrogen availability for the
crops and thus reducing the requirement for artificial fertilizer, which accounts for 13% of the
greenhouse gases emitted (table 4) from the product chain of pork. More efficient nitrogen
(and phosphorus) use on the farms will, in addition to a reduction in on-farm emissions, also
facilitate the reduced consumption of farm inputs, which again will improve the environ-
mental profile of pork.
We compared our results with two relevant European studies from France (Basset-Mens &
van der Werf 2005) and Sweden (Cederberg & Flysjö 2004), see table 5. Basset-Mens & van
der Werf (2005) evaluated three pig production systems using the LCA methodology, and
their normalised results show that the pig production systems contributed more to eutrophica-
tion, acidification and land use than to the other impact categories. In our study global warm-
ing, eutrophication and acidification were the most important, but we did not normalize the
results on land use. The functional unit in the studies of Basset-Mens & van der Werf (2005)
and Cederberg & Flysjö (2004) were ‘1 kg of pig (live weight) from farm gate’ and ‘1 kg of
bone and fat free meat’ respectively. These functional units were transformed to the func-
tional unit of this study (1 kg pork (carcass weight))’, by assuming 1 kg of pig (live weight)
equalled 0.763 kg pork (carcass weight), which again equalled 0.443 kg bone and fat free
meat. The comparative results of Cederberg & Flysjö (2004) and Basset-Mens & van der
Werf (2005) and our study are presented in table 5. Meat processing and transport from the
slaughterhouse are only included in our study, but as these sections of the product chain only
contribute 4-5% of the emissions to the considered impact categories (table 4), they will not
change the overall conclusion of the comparison. Our results on global warming and eutro-
phication were 16% and 10% higher than the results of Basset-Mens & van der Werf (2005),
which again were higher than the results of Cederberg & Flysjö (2004). In our study nitrous
oxides emitted from the farms were the highest contributor to global warming potential, and
out of this 43% (fig. 4) derived from denitrification of leached nitrate. This source of nitrous
oxide emissions was not included in the calculations of Cederberg & Flysjö (2004) and is
105

probably the reason for the discrepancy in results on global warming. In our study nitrate
leached from the two farms was responsible for most of the eutrophication, with 69 and 73 kg
N ha-1year-1 leached from the fattening pig and weaner pig farms respectively. In comparison,
only 22-26 kg N ha-1year-1 was leached as nitrate in the study of Cederberg & Flysjö (2004),
and this might be the reason for the lower level of eutrophication. In both the Swedish and
French studies the pig houses and feed production were identified as environmental hotspots,
which is in good accord with our results.
Table 5. Comparison of characterized results. Functional Unit: One kg pig from farm gate
(carcass weight)
Global
warming Eutrophication Acidification Land use
Unit kg CO2-eq g NO3-eq g SO2 (m2 year)
Cederberg & Flysjö (2004) 2.6 170 37 7.2
Basset Mens & van der
Werf (2005) 3.0 274 57 7.1
This study 3.5 301 56 9.1
Some authors have argued that consequential LCA modelling requires more data (Curran et
al. 2005, Heijungs & Guinée submitted). However, it is the experience from this study, that
several situations would have required more data-gathering and would have been much more
time-consuming if attributional modelling had been used. An example is feed: Several types
of feed ingredients are imported to Danish pig farms. Special feed mixtures are produced for
different life stages of the pigs, because sows with piglets have different vitamin, nutrient and
energy requirements compared with – for example - fattening pigs. Each feed mixture con-
tains several ingredients. A simple screening of fodder imported to a pig farm producing both
fattening pigs and weaners showed over 20 different feed ingredients (e.g. barley, maize) . In
this study, we have focused only on the marginal concentrate, soybean meal (Dalgaard et al.
submitted; Schmidt & Weidema submitted), which reduced data needs considerably, even
though palm oil production forms parts of the LCA-data for soybean meal. From our point of
view it seems logical to use the consequential LCA modelling to answer the question: ‘What
106

happens if the demand for pork increases?’ The question is highly relevant because at a global
level pork production is increasing, and so is its pressure on the environment (Steinfeld et al.
2006). An increased production of pork implies an increased production of feed, electricity,
fertilizer, etc. and the main challenge in consequential LCA modelling is to determine the
marginal suppliers of these inputs consistently. As we have shown in this article, the identifi-
cation of marginal suppliers can be improved and facilitated by already existing economic
models such as ESMERALDA.
6 Conclusion and recommendations
It proved possible to obtain consequential LCA data for an agricultural product by using rep-
resentative farm data and to identify affected farms using the econometric sector model ES-
MERALDA.
The environmental impact from an increased demand of one kg Danish pork (carcass weight)
delivered to Harwich Harbour is 3.77 kg CO2-eq. for global warming potential, 319 gram
NO3-eq. for eutrophication potential, 59 gram SO2-eq. for acidification potential and 1.27
gram ethene-eq. for photochemical smog potential. The land use is 9.1 m2year per kg Danish
pork delivered to Harwich Harbour.
Main contributors to all impact categories were the pork farm and the weaner farm. The larg-
est contributor to global warming was nitrous oxide from farm fields . The contribution from
transport from farm via slaughterhouse to Harwich Harbour was only 1% of the greenhouse
gases emitted. Considering the farm inputs (e.g. feed, fertilizer), the highest contribution came
from feed. The largest contributor to eutrophication was nitrate emitted from the fields on the
pig farms, and largest contributor to acidification was ammonia evaporated during slurry han-
dling and storage. The nitrogen-containing compounds nitrate, nitrous oxide and ammonia
were responsible for a large part of the environmental impact. An increase in the nitrogen use
efficiency on the pig farms will obviously improve the environmental profile of Danish pork.
7 References
Andersen S, Pedersen B, Ogannisan M (1999): Slagtesvindets sammensætning. Faglig publi-
kation fra Dansk Svineproduktion. Meddelelse 429. Landsudvalget for svin. Danske
slagterier. www.dansksvineproduktion.dk (In Danish)
107

Basset-Mens C, van der Werf H M G (2005): Scenario-based environmental assessment of
farming systems: the case of pig production in France. Agric Ecosyst Environ 105 (1-2)
127-144
Benbrook C M (2005): Rust, resistance, run down soils, and rising costs - problems facing
soybean producers in Argentina. Benbrook Consulting Service, Ag BioTech InfoNet,
Technical Paper, January 2005. (online) Available at:
http://www.greenpeace.org/raw/content/international/press/reports/rust-resistence-run-
down-soi.pdf (Accessed 23 June 2006)
Borken J, Patyk A, Rheinhart GA (1999): Basisdaten für ökologishe Bilanzierungen. Friedr.
Vieweg & Son Publisher, Germany
Carlsson-Kanyama A (1998): Energy consumption and Emissions of Greenhouse Gases in the
Life-Cycle of Potatoes, Pork Meat, Rice and Yellow peas. Technical Report 26, 1-67
Cederberg C, Flysjö A (2004): Environmental Assessment of Future Pig Farming Systems -
Quantifications of Three Scenarios from the FOOD 21 Synthesis Work. SIK-rapport
723, 1-54
Cederberg C, Stadig M (2004): System Expansion and Allocation in Life Cycle Assessment
of Milk and beef production’
Curran M A, Mann M, Norris G (2005): The international workshop on electricity data for li-
fe cycle inventories. J Clean Prod 13, 853-862
Dalgaard R, Halberg N, Kristensen I S, Larsen I (2006): Modelling representative and cohe-
rent Danish farm types based on farm accountancy data for use in environmental asses-
sments. Agric Ecosyst Environ 117, 223-237
Dalgaard R, Schmidt J, Halberg N, Christensen P, Thrane M, Pengue W: LCA of soybean
meal. Submitted to Int J LCA
Ecoinvent Centre (2004): Ecoinvent data v1.1. Final reports ecoinvent 2000 (1-15). Swiss
Centre for Life Cycle Inventories, Dübendorf 2004, CD-ROM
Ekvall T, Finnveden G (2001): Allocation in ISO 14041 – a critical review. J Clean Prod 9,
197-208
Elferink E V, Nonhebel S (2006): Variations in land requirements for meat production. J
Clean Prod. In press 1-9
Eriksson I S, Elmquist H, Stern S, Nybrant T (2005): Environmental Systems Analysis of Pig
Production - The Impact of Feed Choice. Int J LCA 10 (2) 143-154
Ekvall T, Andræ A S G (2005): Attributional and Consequential Environmental Assessment
of the Shift to lead-Free Solders. Int J LCA 11 (5) 344-353
108

European Environment Agency (2005): The European Environment. State and outlook. Co-
penhagen
FAPRI (2006): Food and agricultural policy research institute. Available at: www.fapri.org
(Accessed 23 June 2006)
Halberg N, Hermansen J E, Kristensen I S, Eriksen J, Tvedegaard N: Comparative environ-
mental assessment of three systems for organic pig production in Denmark. Submitted
to Agric Ecosyst Environ
Halberg N, Kristensen E S, Kristensen I S (1995): Nitrogen turnover on organic and conven-
tional mixed farms. J Agric Environ Ethics 8 (1) 30–51
Heijungs, R., Guinée, J B: Allocation and ‘what-if’ scenarios in life cycle assessment of waste
management systems. Waste Management. Submitted to Waste Management
Hutchings N, Sommer S G, Andersen J M, Asman W A H (2001): A detailed ammonia emis-
sion inventory for Denmark. Atmos Environ 35, 1959–1968
IPCC (1997): Greenhouse gas inventories. Revised 1996 IPCC Guidelines for National
Greenhouse Gas Inventories. Available on-line (March 1st 2006) at
http://www.ipcc.ch/pub/guide.htm
IPCC (2000): Good practice Guidance and Uncertainty Management in National Greenhouse
Gas Inventories. Chapter 4. Agriculture. 4.1–4.83. IPCC. Available on-line (March 1st
2006) at http://www.ipcc.ch/pub/guide.htm
Jensen J D, Andersen M, Kristensen K (2001): A Regional Econometric Sector Model for
Danish Agriculture. A Documentation of the regionalized ESMERALDA model. Mi-
nistry of Food, Agriculture and Fisheries. Institute of Food and Resource Economics.
Danish Institute of Agricultural Sciences
Kristensen I S, Halberg, N, Nielsen, A H, Dalgaard R (2005): N-turnover on Danish mixed
dairy farms. Part II. In: Bos J, Pflimlin A, Aarts F, Verte´s F (Eds.) Nutrient manage-
ment on farm scale. How to attain policy objectives in regions with intensive dairy far-
ming. Report of the first workshop of the EGF Workshop. Available on-line (March 1st
2006) at http://www.nitrogenworkshop.org/PDF/Rapport_83_drukversie. pdf, Plant Res
Int 83, 91–109
OECD (2003): Agriculture, Trade and the Environment: The Pig Sector. ISBN: 926410416.
Pp. 1-15
Oenema O, Oudendag D, Velthof G (2006): Nutrient losses from manure management. In:
12th Ramiran International Conference. Technology for recycling of manure and organic
residues in a whole-farm perspective vol 1. Dias report no. 122. www.agrsci.dk
109

Patyk A, Reinhardt G (1997): Düngemittel - Energie- und Stoffstromsbilanzen. Vieweg. Um-
weltvissenschaften. Friedr. Vieweg & Sohn Verlagsgesellschaft mbH, Braun-
schweig/Wiesbaden, 1997. Germany
Pengue W (2006): Increasing Roundup Ready soybean export from Argentina. (Box 1.1 in
chapter 1). In: Global Development of Organic Agriculture: Challenges and Prospects.
(Eds. Halberg N, Alrøe H, Knudsen M T, Kristensen E S) CABI Publishing. ISBN 1
84593 078 9 978 1 84593 078 3. p. 20
Pontoppidan O, Hansen P-I (2001): Renere teknologi på svine og kreaturslagterier. Working
report 9. Danish Environmental Protection Agency. (In Danish)
Poulsen H D, Børsting C F, Rom H B, Sommer S G (2001): Kvælstof, fosfor og kalium i hus-
dyrgødning - normtal 2000. DJF rapport Husdyrbrug 36 (In Danish)
Pretty J N, Ball A S, Lang T, Morison J I L (2005): Farm costs and food miles: An assessment
of the full cost of the UK weekly food basket. Food Pol 30 (1) 1-19
Saunders C, Barber A, Taylor G (2006): Food Miles - Comparative Energy/Emissions Per-
formance of New Zealand's Agriculture Industry. Agribusiness & Economics Research
Unit. Research Report 285, 1-105
Schmidt J, Weidema B: Shift in marginal of vegetable oil. Submitted to Int J LCA.
Steinfeld H, Gerber P, Wassenaar T, Castel V, Rosales M, de Haan C (2006): Livestock’s
long shadow. Environmental issues and options. Food and Agriculture Organization of
the United Nations. ISBN 978-92-5-105571-7
Tillman A M (2000): Significance of decision-making for LCA methodology
Weidema (2003): Market information in Life cycle assessments. Environ Proj 863
Wenzel H, Hauschild M, Alting L (1997): Environmental Assessments of products –Vol 1:
Methodology, tools and case studies in product development. London. Chapman & Hall
110

Environmental assessment of Digestibility Improvement Factors Ap-plied in Animal Production: Use of Ronozyme® WX CT Xylanase in Danish Pig Production PER H. NIELSEN1, RANDI DALGAARD2, ARNE KORSBAK3 AND DAN PETTERSSON1
1) Novozymes A/S, Krogshøjvej 36, DK-2880 Bagsværd
2) University of Aarhus, Faculty of Agricultural Sciences, Department of Agroecology
and Environment, P.O. Box 50, DK-8830 Tjele
3) DSM Nutritional Products, Laerkelundsvej 2, DK-5853 Oerbaek
I
4
111

112

LCA Case Studies Danish Pig Production
1© 2007 ecomed publishers (Verlagsgruppe Hüthig Jehle Rehm GmbH), D-86899 Landsberg and Tokyo • Mumbai • Seoul • Melbourne • ParisInt J LCA 2007 (OnlineFirst): 8
LCA Case Studies
Environmental Assessment of Digestibility Improvement Factors Applied inAnimal Production: Use of Ronozyme® WX CT Xylanase in Danish Pig Production
Per H. Nielsen1*, Randi Dalgaard2, Arne Korsbak3 and Dan Pettersson1
1 Novozymes A/S, Krogshøjvej 36, 2880 Bagsværd, Denmark2 University of Aarhus, Faculty of Agricultural Sciences, Department of Agroecology and Environment, 8830 Tjele, Denmark3 DSM Nutritional Products, Laerkelundsvej 2, 5853 Oerbaek, Denmark
*Corresponding author ([email protected])
Discussion. Reduced contribution to acidification and nutrientenrichment is partly driven by reduced feed consumption and partlyreduced N-emissions with manure resulting from reduced proteincontent of the feed. Sensitivity analyses of a range of parametersshow that the observed advantages are generally robust althoughexact magnitudes of environmental advantages are associated withmuch variation and uncertainty. It should, however, be notedthat changes (e.g. of feed prices) may turn contributions to nu-trient enrichment and use of agricultural land into trade-offs.
Conclusions. Improvement of energy and protein value of pig-feed by application of Ronozyme xylanase and following feedsavings reduces impact on environment per unit of pig-meatproduced, and the enzyme product contributes to a sustainabledevelopment the Danish pork meat supply.
Recommendations. Digestibility-improving enzymes are a prom-ising means of reducing the environmental impact of pig pro-duction. The greenhouse gas reducing potential of RonozymeWX CT in Danish pig production has been estimated at 5%and in the order of 4 million tons of CO2 equivalents if theresults are extended to the whole of Europe. Use of RonozymeWX CT is driven by overall cost savings in animal production,and it is therefore recommended that digestibility-improvingenzymes are given more attention as a cost-efficient means ofreducing greenhouse gas emissions.
Keywords: Animal production; biotechnology; Danish pig pro-duction; digestibility; environment; enzymatic; enzyme; feed;manure; pig; Ronozyme; xylanase
DOI: http://dx.doi.org/10.1065/lca2007.07.352
Please cite this paper as: Nielsen PH, Dalgaard R, KorsbakA, Pettersson D (2007): Environmental Assessment of Digest-ibility Improvement Factors Applied in Animal Production: Useof Ronozyme® WX CT Xylanase in Danish Pig Production. Int JLCA, DOI: http://dx.doi.org/10.1065/lca2007.07.352
Abstract
Background, Aims and Scope. Many feed ingredients are notfully digested by livestock. However, the addition of digestibil-ity-improving enzymes to the feed can improve the absorptionof e.g. energy and protein and thereby enhance the nutrient valueof the feed. Feed production is a major source of environmentalimpacts in animal production, and it is obvious to assume thatenzyme supplementation can help to reduce the environmentalimpact of animal production. The purpose of the study is, there-fore, to assess and compare the environmental burdens of thesupplements and compare them with the savings made whenenzymes are used in animal production. The properties of en-zymes vary considerably and the study takes as its starting pointa particular enzyme product, Ronozyme WX CT. RonozymeWX CT is a xylanase which depolymerises xylans (a group ofdietary fibres found in cereal cell walls) into smaller units. Theproduct is a widely accepted means of improving the energyvalue and the protein digestibility of pig and poultry feed. Thestudy relates to Ronozyme WX CT used for fattening pigs pro-duced in Denmark.
Methods. Lifecycle assessment is used as the analytical method,and Ronozyme WX CT production and reductions in feed con-sumption are modelled using SimaPro 7.0.2. Data on RonozymeWX CT production are derived from Novozymes' productionfacilities in Denmark. Other data are derived from the litera-ture and from public databases. Changes in feed consumptionare determined by modelling in AgroSoft® feed optimisationsoftware. Guidelines from the Intergovernmental Panel on Cli-mate Change (IPCC) are used to estimate reductions in the emis-sion of greenhouse gases resulting from reduced manure gen-eration and changed manure composition.
Results. The study shows that the use of Ronozyme WX CT toincrease the nutritional value of pig feed is justified by major ad-vantages in terms of reduced potential contribution to globalwarming, acidification and photochemical ozone formation andreduced use of energy, and in most cases also nutrient enrichmentand use of agricultural land. Ronozyme WX CT (xylanase) isoften used together with Ronozyme P5000 CT (phytase) and to-gether the two products can contribute considerably to reducinga broad range of environmental impacts from pig production.
Introduction
Many feed ingredients are not fully digested by livestock.However, the addition of digestibility-improving enzymesto the feed can improve the absorption of the feed compo-nents and enhance the value of the feed as a source of en-ergy, protein and other nutrients (Schäfer et al. 2007, Ull-mann's 2003). Depending on enzyme and animal type, theimmediate advantages to the farmer are reduced feed ex-penditure and improved animal health. Previous environ-mental studies have, however, shown that feed productionis a major source of environmental impacts in for instancepig production (Eriksson et al. 2005), and it is obvious toassume that, in addition to the immediate advantages to thefarmer, there may also be a range of environmental advan-tages, as less nutrient supplementation is needed and less
113

Danish Pig Production LCA Case Studies
2 Int J LCA 2007 (OnlineFirst)
feed is consumed per unit of animal produced. Nielsen andWenzel (2007) have previously documented the environmen-tal benefits of substituting a nutrient (inorganic phospho-rus) in feed with an enzyme (phytase) and it could be inter-esting to expand the scope to other types of digestibili-ty-improving enzymes and assess to what extent the obser-vations apply also to the feed-saving enzymes.
The purpose of the present study was, therefore, to assessand compare the environmental burdens of the supplementsthat are associated with the use of a feed-saving enzyme withthe savings obtained due to the better digestion.
Digestibility improving enzymes vary considerably (Schäferet al. 2007) and the study takes as its starting point a par-ticular enzyme, namely the enzyme product Ronozyme WXCT. Ronozyme WX CT is a an industrially produced endo-1,4-beta-xylanase which depolymerises xylans (a group ofnon-starch polysaccharides) into smaller units. The enzymeproduct has a positive effect on the feed conversion effi-ciency in non-ruminants (DSM 2005, Tybirk 2005) becausethese animals do not have the endogenous enzymes neededto degrade dietary fibre constituents such as xylans. Pigsand poultry are non-ruminants and the use of xylanase iswidely accepted as a means of improving the energy andprotein value of their diet. The enzyme product, which isderived from Thermomyces lanuginosus spp. and producedby submerged fermentation by Novozymes A/S (Denmark),and marketed by DSM Nutritional Products (Switzerland)is authorised in the EU (Commission Regulations (EC) No1332/2004 and No 2036/2005). The focus of the currentinvestigation is on the environmental implications of usingRonozyme WX CT in pig feed.
1 Method
Animal feed for commercial animal production must meet arange of requirements in terms of nutrient value to the ani-mals at the lowest possible price, and is often optimised interms of composition by computer modelling by feed pro-ducers. The study addresses changes in environmental im-pact when a feed producer switches from a commercial feedproduct without Ronozyme WX CT to a commercial feedproduct with Ronozyme WX CT. The composition of com-mercial feed products with and without Ronozyme WX CTis modelled using AgroSoft® WinOpti, a software productused in practice in animal feed optimisation. Reductions inCH4 emissions as a consequence of reduced manure genera-tion coming from reduced feed consumption are determinedby modelling (IPCC 2006) based on the following assump-tions. Dry matter content of feed: 86% (Christiansen 2005),average dry matter digestibility coefficient of the feed: 83%(Poulsen et al. 2001), maximum methane-producing capacity= 0.45 m3 CH4 kg–1 of VS excreted (Western Europe), meth-ane conversion factor: 17% (liquid manure) and 2% (solidmanure), percentage of Danish pig manure treated as liquidand solid are 92% and 8% respectively (Poulsen et al. 2001),methane density: 0.67 kg/m3. The environmental assessmentis based on principles described by Wenzel et al. (1997).Modelling has been facilitated using the LCA softwareSimaPro 7.0.2. A marginal and market-oriented approach
is taken in the study, and co-product issues are handled bysystem expansion (see Wenzel 1998, Weidema et al. 1999,Ekvall and Weidema 2004). Critical assumptions and un-certain data are addressed by sensitivity analysis.
2 Scope
2.1 Functional unit (fu)
The function of Ronozyme WX CT is to break down cerealfibres and make more constituents of the feed available tothe animals, so that feed composition can be adjusted andfeed consumption can be reduced without compromisingmeat production. The functional unit of the study is, there-fore, a certain (but unspecified) quantity of meat and thestudy provides an assessment of the changes in environmen-tal impact and resource consumption when one switches fromproducing one ton of feed without Ronozyme WX CT to anutritionally equivalent but reduced quantity of feed withan altered ingredient composition with Ronozyme WX CTadded. The amount of meat produced is not quantified be-cause it is unnecessary for the assessment and depends on arange of variable factors such as animal breed, productionconditions, etc. (Fig. 1). The functional unit is, however, inthe order of 280 kg meat (carcass weight), because about270 kg feed is used to produce one pig of around 100 kgand about 76% of the pig is meat (Christiansen 2005).
_ =
A certain quantity of meat
Changes in feedconsumption whenRonozyme WX CTis used
Functional unit:
One ton feedwithoutRonozyme WX CT
A modified andsmaller quantityof feed withRonozyme WX CT
_ =_ =
A certain quantity of meatA certain quantity of meat
Changes in feedconsumption whenRonozyme WX CTis used
Functional unit:
One ton feedwithoutRonozyme WX CT
A modified andsmaller quantityof feed withRonozyme WX CT
Fig. 1: Illustration of the relationship between the functional unit of thestudy and the changes in feed composition under consideration
2.2 Animal category, geographical scope and time perspective
The study addresses fattening pigs (25–100 kg) produced inmodern production systems in Denmark. Ronozyme WXCT can be added to or removed from the feed without capi-tal investment, and introduction of the product in the feedhas no long-term implications.
2.3 Indicators
The main environmental issues in the system under consid-eration are deemed to be potential contributions to globalwarming, acidification, nutrient enrichment and photochemi-cal ozone formation and the essential resource consumptions
114

LCA Case Studies Danish Pig Production
Int J LCA 2007 (OnlineFirst) 3
Enzymeproduction
Animalproduction
Crop production
Animal feed production
Rono-zyme
WX CT
Feed
Manure
Fertiliserproduction
Barleyproduction
Barley
Wheatproduction
N2O, NH3emissionsfrom the
fied
(NO3 leaching from field toaquatic envir.)
Wheat Soyproduction
Soy
N2O, NH3, CH4emissionsfrom stableand manure
storage
Slaughtering
Fat
Heatproduction
fat
Fossil fuelextraction
are considered to be energy use and use of agricultural land,and indicators are included accordingly. Characterisation isbased on Eco-indicator 95 v. 2.03. Normalisation refers toDenmark (Stranddorf et al. 2005).
2.4 System boundaries
The main system boundaries of the study are shown in Fig. 2.The figure illustrates that the use of Ronozyme WX CT in-creases barley consumption and reduces soy, wheat and ani-mal fat consumption. The changes in feed composition andthe reduced feed consumption lead to reduced manure gen-eration per unit of meat produced and reduced N content ofthe manure. N in manure serves as a fertiliser in crop pro-duction, and reduced N content increases the need for alter-native N-fertiliser to maintain crop production. Artificialfertiliser production is regulated by fertiliser demand (incontrast to manure, which is determined by animal productdemand) and artificial N-fertiliser meets the need. Emissions
of N2O and NH3 from the stable and from manure storagesystems decrease when the N content of the manure de-creases. Similarly, emissions of N2O, NH3 and NO3 fromthe agricultural land receiving the manure decrease becauseN emissions from manure are greater than emissions fromartificial N-fertiliser. Carbon contained in the manure is tosome extent converted into CH4 during storage in the stableand in manure storage systems, and reduced manure gen-eration per produced unit of meat results in reduced CH4emissions. The details are given in the following sections.
All environmentally significant processes are included in thestudy, except reductions in NO3 emissions to the aquaticenvironment due to the reduced N content of the manure.The reason is that the available data basis and modellingtools for estimating the reduction in NO3 emissions fromfarmland are considered too uncertain to be included in thebase case of the study. The significance of neglecting NO3emissions in the study has, however, been addressed in sen-sitivity analyses, based on the best available models.
3 Data basis and modelling
3.1 Production of Ronozyme WX CT
Ronozyme WX CT is a granulated enzyme product pro-duced in Novozymes' factories in Denmark. The assessmentof the product includes all heat, electricity and water con-sumptions in production and waste management and 99%(w/w) of ingredients. Modelling is based on 2005 recipes.Modelling follows Nielsen et al. (2007) except that the mar-ginal source of electricity has been switched from naturalgas to coal (Behnke 2006).
3.2 Modification of feed and reduction of feed consumption
Pig feed can be composed in many different ways and theimplications of Ronozyme WX CT application can be nu-merous. The study addresses economically optimised ani-mal feed in a reference situation with no Ronozyme WX CTapplication and in an altered situation where Ronozyme WXCT is applied, based on feed prices in 2006 (Table 1).
Changes induced by the adjustment of feed composition inTable 1 are determined by subtracting the quantities of indi-vidual ingredients used to produce one ton of feed in thescenario with Ronozyme WX CT application from similaringredients in the reference situation without Ronozyme WXCT application. Increased energy and protein values of thefeed lead to a reduction in soy meal and animal fat require-ments on the one hand and an increase in the use of barleyon the other.
Changes induced by reduced feed consumption: The Na-tional Committee for Pig Production (Tybirk 2005) proposesa 3% feed saving when commercial xylanase products areadded to pig feed. The effects of xylanase application varywith diet, animal gender, growth stage of animals, etc., andit has been assumed, conservatively, in the study that the useof Ronozyme WX CT reduces the feed demand by only2.5%. The changes induced by reduced feed consumptioninfluence all ingredients equally and feed savings are deter-mined accordingly.
Fig. 2: Main system boundaries of the study of Ronozyme WX CT used inpig production. Full arrows indicate increased material streams, while dot-ted arrows indicate reduced material streams. Processes indicated withwhite boxes are influenced by Ronozyme WX CT application and includedin the study. Grey boxes indicate processes which are independent andhence not included in the study. Reductions in emissions of N2O, NH3 andCH4 to the atmosphere from stable/manure storage and field due tochanged and reduced feed consumption are included in the study. Re-ductions in the leaching of NO3 (in brackets) are not
115

Danish Pig Production LCA Case Studies
4 Int J LCA 2007 (OnlineFirst)
The total changes are determined by adding the changes re-sulting from adjustment of feed composition and the changesresulting from reduced feed consumption.
3.3 Modelling of feed ingredients
Data on barley, wheat and peas are from LCA food (2003),and are based on representative data for the Danish agricul-tural sector (Dalgaard et al. 2006). Data on barley refer tospring barley. Data on soybean meal refer to soybean pro-duction in Argentina (LCA food 2003). It is assumed thatpalm oil is the marginal type of vegetable oil (Schmidt andWeidema 2007) and that a marginal reduction of soy oilproduction resulting from a reduced soy bean meal demandleads to increased palm oil production. Data on palm oilproduction are derived from Ecoinvent (2005).
Animal fat from slaughterhouses is in excess in the Danishmarket and marginal fat is used in energy production (Hvid etal. 2005). A marginal reduction in animal fat consumptionfor pig production resulting from the use of Ronozyme WXCT is, therefore, likely to displace other energy sources (seeFig. 2). It is assumed that animal fat displaces an equivalentquantity of fuel oil (w/w), that the heat value of fat and fuel oilare similar and that emissions are the same. The only differ-ence taken into account is thus that CO2 from fuel oil is fossiland contributes to global warming, whereas CO2 from ani-mal fat does not because it comes from a non-fossil source.
Wheat bran is a relatively cheap feed ingredient and it iseconomically attractive to increase the use thereof whenRonozyme WX CT is applied because the xylanase increases
the digestible protein and energy value of the product. Mar-ginal wheat bran is, however, already used in animal feedproduction (Cerealia 2005) and since production is inher-ently determined by wheat grain production it is judged thatproduction will remain unchanged independently of an in-creased demand induced by Ronozyme WX CT application.Wheat bran use has therefore been fixed at the referencelevel during modelling of feed composition. The result is anincrease in barley consumption instead. Similar market con-straints are assumed for molasses production (a co-productfrom sugar production) and similar modelling restrictionsare applied for this ingredient.
The group of 'others' refers to a variety of vitamins andminerals which are virtually independent of Ronozyme WXCT application and hence disregarded in the assessment.
3.4 Estimation of changes in emissions from the stable andthe manure storage
Evaporative emissions of N2O, NH3 and CH4 are regardedas the essential emissions from stable and manure storage inDenmark where washout to the aquatic environment to alarge extent is controlled. N2O and NH3 emissions are func-tions of N excretions with pig manure which is in turn afunction of feed composition and feed consumption per unitof meat produced. Reductions in N excretions as a conse-quence of Ronozyme WX CT application is to a large ex-tent driven by changes in feed consumption and a to lesserextent feed savings and has been estimated at 1.98 kg N perfunctional unit as specified in Table 2. The change in the Ncontent of manure is proportional to the change in the pro-
Feed ingredients Without Ronozyme WX
CT
With Ronozyme WX
CT
Changes induced by
adjustment of feed composition
Changes induced by 2.5%
reduced feed consumption
Total change Inc. in model
kg·ton feed-1 kg·ton feed-1
kg·fu-1 kg·fu-1 kg·fu-1
Barley 324 375 51 –9.4 42 Yes
Wheat 350 350 0 –8.8 –8.8 Yes
Wheat bran 50 50 0 –1.3 –1.3 No
Peas 30 30 0 -0.75 –0.75 Yes
Soy bean meal 182 151 –31 –3.8 –35 Yes
Animal fat 26 5 –21 –0.13 –22 Yes
Molasses 10 10 0 –0.25 –0.25 No
Ronozyme WX CT 0 0.20 0.20 –0.0050 0.20 Yes
Others 28 29 ~ 0 – - No
Total 1,000 1,000 0 25 - -
Table 1: Pig feed composition with and without Ronozyme WX CT application and changes induced by adjustment of feed composition and 2.5% reducedfeed consumption
Protein in feed (kg)
Change of N cont. of manure b (kg)
Change of emissions to air (g)
Without Ronozyme WX CT With Ronozyme WX CT Change N2O-N NH3-N
165.9 153.5 a –12.4 –1.98 –4.6 –400 a inc. 2.5% feed saving b N content in protein ~ 16% (Sawyer et al. 1994)
Table 2: Estimation of changes in the protein content of feed, N content of manure and emissions of N2O and NH3 from stable and manure storagesystems. The protein content of the feed is determined by modelling in AgroSoft. All data are provided per functional unit
116

LCA Case Studies Danish Pig Production
Int J LCA 2007 (OnlineFirst) 5
tein content of the feed because meat production and henceN retention in the pig is fixed (see Fig. 1). N undergoes arange of processes in the stable and manure storage systems.The fraction of excreted N which is emitted as N2O fromstable and manure storage systems is estimated at 0.23%(Dalgaard et al. 2006, IPCC 2006) and the percentage whichis emitted as NH3 is estimated at 20% (Andersen et al. 1999).
CH4 emission is a function of manure production which isin turn a function of feed consumption per unit of pig meatproduced. It is assumed that a 2.5% feed saving (see Table 1)leads to a 2.5% reduction in manure generation, and changesin methane emission per functional unit are determined bymodelling (IPCC 2006) as specified in Section 1. The resultsare shown in Table 3. Enteric methane formation in pigs islow compared with methane formation from manure (IPCC2006) and changes in enteric methane formation are ignoredin the study.
3.5 Estimation of compensatory artificial fertiliser application
Manure is used as fertiliser in crop production and reducedinput of N with manure to agricultural land as a result ofRonozyme WX CT application leads to an increased de-mand for artificial fertiliser to maintain crop yields. It isassumed that 75% of N in manure is utilised by the crops(Danish Plant Directorate 2006) and compensatory artifi-cial fertiliser has been estimated at 75% of the remaining Ncontent of the manure after evaporation in stable and ma-nure storage (see Table 2 ), i.e. a change of 1.2 kg N·fu–1.Calcium ammonium nitrate (Patyk and Reinhardt 1997) isused to represent the additional artificial fertiliser.
3.6 Estimation of changes in N2O and NH3 emissionsfrom the field
The substitution of manure with artificial fertiliser leadsto changes in direct N2O and NH3 emissions from the field.The total change in N lost by evaporation from stable andmanure storage is around 400 g·fu–1 (see Table 2) and theremaining N content in manure has been estimated at 1.6kg fu–1. The estimation of changes in N2O and NH3 emis-
sions is based on emission factors from IPCC (2006) andAndersen et al. (1999) respectively. Results are shown inTable 4.
3.7 Other effects of Ronozyme WX CT application
The use of xylanase has a range of positive effects on thehealth and growth of animals (Schäfer et al. 2007). Theseeffects are ignored in the study because they are difficult toquantify in the present context. Better health and fastergrowth of animals reduces the impact of pig production perunit of meat produced, and it is considered likely that thissimplification leads to a slight underestimation of the envi-ronmental advantages of Ronozyme WX CT application.
3.8 Transport
All feed ingredients except soybean meal are assumed to beproduced locally and transportation is ignored because it isconsidered negligible. Soybean meal is assumed to be pro-duced in South America and a rough estimate of transpor-tation is included in the assessment (ocean freighter;10,000 km). Ronozyme WX CT is transported from factoryto feed mill via a network of supply stations and a conserva-tive estimate of transportation is included in the assessment(lorry; 1,400 km).
3.9 Data quality assessment
Modelling of enzyme production is based on very detailedproduction information. Modelling of upstream processesis based partly on data from specific suppliers and partly ongeneric sources. The most important data are considered tobe up to date and representative and the quality of the as-sessment of enzyme products is considered good.
Modelling of feed ingredients is to a large extent based ondetailed studies of agricultural production in Denmark andthe data refer to marginal suppliers in Denmark. Data arereasonably up to date and quality is generally consideredgood although some emissions, particularly to air and wa-ter, are associated with much variation and uncertainty.
Total feed consumption (kg) Change in manure production Change in CH4 emission
Without Ronozyme WX CT With Ronozyme WX CT Change (kg dry matter) (g)
1,000 975 –25 –3.7 –180
Emission and source Fraction of N emitted Change g·fu–1
Total change g·fu–1
N2O-N from manure –16
N2O-N from artificial fertiliser
0.01
+12
–4
NH3-N from manure –32
NH3-N from artificial fertiliser
0.02
+24
–8
Table 4: Estimation of changes in direct N2O and NH3 emissions from the field, when manure is replaced by artificial fertiliser
Table 3: Estimation of changes in manure production and CH4 emissions from stable and manure storage systems. All data are provided per functional unit
117

Danish Pig Production LCA Case Studies
6 Int J LCA 2007 (OnlineFirst)
4 Results
Changes in environmental impacts and resource consump-tions when Ronozyme WX CT is used in pig feed and thecomposition of the feed is changed and feed consumption isreduced are shown in Fig. 3.
Fig. 3 shows that the impacts induced by Ronozyme WXCT production are low compared with the reduction in im-pacts obtained by feed savings and change of the feed com-position and that considerable environmental improvementscan be achieved in terms of all considered impact categorieswhen Ronozyme WX CT is used to increase the energy andprotein value of the feed.
The reduced contribution to global warming is to a largeextent driven by the reduced use of soybean meal (reducedN2O emissions from soy fields), but reductions in wheat, fatand emissions of N2O and CH4 from stable, manure storageand field also play a role. The increased use of barley (seeTable 1) and to a lesser extent the use of fertiliser to com-pensate for missing N in animal manure counteract the re-duced contribution to global warming, but the reduction inimpact due to savings of fat, wheat and soybean meal isgreater than the increase in impact due to greater barley andfertiliser consumption.
Reduced fossil energy consumption is primarily driven bythe reduced use of fat in the feed (see Fig. 1) and the reducedcontribution to photochemical ozone formation is prima-rily driven by a combination of the reductions in soy andanimal fat use.
The reduced contribution to acidification and nutrient en-richment is largely driven by reduced emissions of NH3 from
the stable and manure storage (see Table 2). Contributionsto acidification from increased barley and fertiliser use aresmall compared with the fall in contributions due to reducedNH3 emissions. Contribution to nutrient enrichment frombarley is considerable, and adjustment of the feed leads to aslight increase in impact in terms of nutrient enrichment.However, the increase is too small to outweigh the savingsfrom saved feed, and the net result is a slight reduction incontribution to nutrient enrichment.
Reduced use of agricultural land is primarily (85%) drivenby reductions in feed consumption, whereas adjustment ofthe feed drives the largest reductions in contributions to glo-bal warming (80%), acidification (90%), photochemicalsmog formation (65%), and fossil energy use (95%).
5 Sensitivity Analyses
A number of assumptions and simplifications have beenmade during the study. Some of most the important are sub-ject to sensitivity analyses in the following in order to assessthe robustness of the results.
Increased feed yield: It has been estimated conservativelythat the feed saving obtained by the use of Ronozyme WXCT is 2.5%. The National Committee for Pig Productionproposes a 3% feed saving (Tybirk 2005), but it is possiblethat the saving could be even higher. The full assessment hastherefore been made with feed savings of 3.0, 3.5 and 4.5%.The results show that the estimated environmental benefitsof enzyme application increase linearly when the feed sav-ing increases. Feed saving has a considerable effect on theavoided contributions to nutrient enrichment and agricul-tural land use, whereas the effect on other impact categoriesis more limited.
Estimates of emissions from agricultural land used in cropproduction are uncertain and play an important role in thestudy. A sensitivity assessment in which emissions of the mostimportant components (N2O, NH3, N2O, NO3, and PO4,)from the most important fields (soy, barley and wheat fields)are varied individually and together has therefore been car-ried out. Uncertainty is estimated at ±20% for NH3 andNO3 and ±35% for PO4 and N2O based on Kristensen (2004)and Halberg et al. (2007). The outcome shows that the varia-tion in NH3, NO3, PO4 and N2O emissions from the agri-cultural land lead to linear changes in environmental im-pacts and demonstrates that environmental Ronozyme WXCT is clearly advantageous in terms of all considered im-pact categories except nutrient enrichment independently ofvariations in field emissions. In most cases, Ronozyme WXCT application is also advantageous in terms of nutrientenrichment but a few cases demonstrate that it is possiblethat nutrient enrichment could be a trade-off if emissionsfrom the barley field have been underestimated.
It has been assumed that palm oil is the marginal source ofvegetable oil. It can, however, not be ruled out that otheroils, most likely rapeseed oil, will become the marginal veg-etable oil in the future and the assessment has been carriedout with rapeseed oil as the marginal vegetable oil. Rape-seed production contributes more to the considered impactsthan palm oil and the impact reduction obtained byRonozyme WX CT application is therefore also smaller.
Agricultural land use
g PO4 –eq.
m2 · year
kg CO2-eq.
50
100
Global warming Acidification Nutrient enrichment
Photochem. smog formation
Fossil energy
g SO2 –eq.
500
1000
12.5
25
g C2H4-eq
7.5
15
MJ
500
1000
30
60
0.60
78890
21 0.76
22
0.29
14
7.6
1000
0.12
56
Agricultural land use
g PO4 –eq.
m2 · year
kg CO2-eq.
50
100
Global warming Acidification Nutrient enrichment
Photochem. smog formation
Fossil energy
g SO2 –eq.
500
1000
12.5
25
g C2H4-eq
7.5
15
MJ
500
1000
30
60
0.60
78890
21 0.76
22
0.29
14
7.6
1000
0.12
56
Fig. 3: Increased environmental impact potentials resulting from RonozymeWX CT production (black bars) compared with reduced environmentalimpact potentials resulting from changed and reduced feed consumption(white bars). All changes are given per functional unit. Fossil energy re-fers to primary energy resources (lower heat value)
118

LCA Case Studies Danish Pig Production
Int J LCA 2007 (OnlineFirst) 7
Nutrient enrichment turns out to be a trade-off of RonozymeWX CT application whereas it remains a clear advantagefor all other impact categories.
Ronozyme WX CT application increases barley consump-tion (see Table 1) and the environmental assessment referredto spring barley (Section 3.3). Barley is, however, also avail-able as winter barley and the assessment has also been car-ried out with winter barley, since there is no indication thatthe one type of barley is more appropriate than the other.Except with regard to nutrient enrichment, winter barleycontributes less to the environmental impacts and resourceconsumption under consideration than spring barley, andthe switch from spring barley to winter barley emphasisesthe advantages of Ronozyme WX CT application slightly interms of all impact categories except nutrient enrichment.Ronozyme WX CT application turns into a slight disadvan-tage in terms of nutrient enrichment.
Determination of feed composition with and withoutRonozyme WX CT application is based on current feedprices. Feed prices are, however, subject to fluctuations anda series of assessments have therefore been carried out withrealistic (+/–20%) variation of the relative prices of the threemost important feed ingredients (barley, wheat and soybeanmeal). The results show that feed ingredient prices have aconsiderable influence on the feed composition with andwithout Ronozyme WX CT and hence the impact ofRonozyme WX CT application. Ronozyme WX CT appli-cation remains, however, a clear advantage in terms of allconsidered impact categories except nutrient enrichment andagricultural land use in a few scenarios. The reason is thatthe advantages of feed savings in some cases are exceededby disadvantages from switching to crops with larger con-tributions to nutrient enrichment and smaller yield per areaof agricultural land used. Agricultural land is currently usedto produce energy crops with a CO2 avoidance efficiency inthe order of 2 to 4 tons of CO2 ·ha–1 (WTW 2006). Theworst case of increased agricultural land use as a result ofRonozyme WX CT application has a greenhouse gas avoid-ance efficiency of 8 tons of CO2-eq·ha–1. The agriculturalland use induced by Ronozyme WX CT application is, thusconsidered environmentally efficient in any case. Reducedcontribution to global warming varies between 30 and 80kg CO2 eq.·fu–1 and the average of all observations (incl. thebase case, see Fig. 3) is 53 kg CO2 eq.·fu–1.
Emissions from stables, manure storage systems and fieldsare dependent on a range of factors in pig production andestimates are subject to much variation and uncertainty. Sen-sitivity analyses where the reduction in emissions has gradu-ally been reduced to zero show that contributions to globalwarming and photochemical smog formation are rather in-sensitive to variations (Ronozyme WX CT application is aclear advantage in terms of contribution to global warmingand photochemical smog formation independently of avoidedemissions), whereas contributions to acidification and particu-larly nutrient enrichment are very sensitive. It is estimated thatNH3 emissions (the main source of avoided contributions toacidification and nutrient enrichment) can be reduced by 50%with optimised practice (Sommer et al. 2006) and a test with10% NH3 emissions (instead of 20%, see Section 3.4) hasbeen performed. The results show that Ronozyme WX CT
application remains a clear advantage in terms of acidifica-tion whereas nutrient enrichment turns into a small trade-off.
Reductions in NO3 emissions from the field have not beenincluded in the assessment (see Fig. 1) because the data andthe modelling basis were considered too poor. NO3 contrib-utes to nutrient enrichment and ignoring NO3 emissions inthe assessment may have lead to an underestimation of theadvantages of the use of Ronozyme WX CT in terms of thisimpact category. Based on Dalgaard et al. (2006) rough esti-mates of the reduction in NO3 (in both sandy and sandyloam soil) has been established and the assessment includ-ing the reduction in NO3 emissions has been performed.Although the results are uncertain, they indicate that thereduction in contributions to nutrient enrichment as a resultof Ronozyme WX CT application is underestimated consid-erably in the base case as well as in the above-mentionedsensitivity assessments, and that Ronozyme WX CT appli-cation is advantageous also in terms of nutrient enrichmentin all cases except where the marginal vegetable oil switchesfrom palm oil to for instance rapeseed oil. If the marginalvegetable oil switches to rapeseed oil, the normalised trade-off of nutrient enrichment appear to be at the same level asnormalised advantages in terms of e.g. global warming.
6 Discussion
The present study has addressed Ronozyme WX CT appli-cation for pigs produced in Denmark, and the results are di-rectly comparable with results on Ronozyme P5000 CT(phytase) application (Nielsen and Wenzel, 2007). The twoenzyme products are often used together and their environ-mental advantages at realistic usage levels (150 g RonozymeP5000 CT ton feed–1 and 200 g Ronozyme WX CT ton feed–1)have been compared. The results show that the two productsupplement each other in terms of environmental improve-ment: the xylanase's main environmental improvement po-tential rests in reducing contributions to global warming, acidi-fication and photochemical smog formation and the phytase'smain potential rests in reducing contributions to nutrient en-richment. Acknowledging that xylanase reduces N emissionsand phytase reduces P emissions, any nutrient-enrichment-trade-offs induced by xylanase application are exceeded bymuch larger nutrient-enrichment-reductions obtained byphytase application when the two products are used together.
7 Conclusions
The present study shows that application of Ronozyme WXCT xylanase as a means of increasing the nutritional valueof pig feed is justified by major benefits in terms of reducedcontributions to global warming, acidification and photo-chemical ozone formation and reduced use of energy and,in most cases, also nutrient enrichment and use of agricul-tural land. Sensitivity analyses indicate that Ronozyme WXCT application in certain cases may lead to increased nutri-ent enrichment or increased use of agricultural land becausethe enzyme induces a switch to crops with higher impacts interms of the two impact categories. Normalised trade-offsin terms of nutrient enrichment are the same order of mag-nitude as reductions in contributions to global warming andapplication of Ronozyme WX CT is justified unless the
119

Danish Pig Production LCA Case Studies
8 Int J LCA 2007 (OnlineFirst)
weighting given to nutrient enrichment is higher than or equalto global warming. Ronozyme WX CT (xylanase) is oftenused together with Ronozyme P5000 CT (phytase). Thephytase product has major potential for nutrient enrichmentreduction and any trade-offs in terms of nutrient enrichmentfrom xylanase application are by far exceeded by the sav-ings obtained by phytase application. Considerable reduc-tions of greenhouse gas emissions obtained by RonozymeWX CT application justifies the additional agricultural landuse observed in a few cases.
8 Perspectives
The use of Ronozyme WX CT saves on average 52 kg CO2equivalents per functional unit (53–0.60 kg CO2 eq.·fu–1,Section 5 and Fig. 3), i.e. around 185 g CO2-eq.·kg meat–1
(carcass weight ex farm), see Section 2.1. The total green-house gas emissions from pig production are in the order of3.5 kg CO2-eq.·kg meat–1 (carcass weight ex farm; Dalgaardet al. 2007), and the study indicates that the use of RonozymeWX CT has the potential to reduce the contribution to green-house effect from Danish pig production by around 5% (upto 8% and down to 3% depending on feed prices).
Sensitivity analyses have shown that avoided contributionto global warming has a limited sensitivity to parameter varia-tion (except feed prices), and the total potential for reductionof greenhouse gas emissions from European pig productionhas been roughly estimated at 4 million tons CO2-eq. ifRonozyme WX CT were implemented in all feed (assuming(i) that the effect of xylanase use on other pig groups (sows,weaners, etc.) is the same as for fattening pigs, (ii) that 270 kgfeed is consumed per pig (Christiansen (2005), (iii) that 286million pigs are produced annually in Europe (FAOSTAT2007), and (iv) that 52 kg CO2 eq. is avoided per ton of feedon average (see Fig. 1 and above). Xylanases (of any brand)have currently penetrated about 30% of the feed market inEurope, and a considerable environmental improvementpotential is within reach. The use of Ronozyme WX CT isdriven by overall cost savings in animal production, and it istherefore recommended that digestibility-improving enzymesshould be given more attention as cost-efficient means ofreducing greenhouse gas emissions.
References
Andersen JM, Sommer SG, Hutchings NJ, Kristensen VF, Poulsen HD (1999):Emission af ammoniak fra landbruget – Status og kilder (Agriculturalemissions of ammonia – Status and sources). Redegørelse nr. 1. Ministerietfor Fødevarer, Landbrug og Fiskeri. Danish Institute of Agricultural Sci-ences (in Danish)
Behnke K (2006): Deklaration af fremtidigt elforbrug (Declaration of futureelectricity consumption). Energinet (254317/3) (in Danish)
Cerealia (2005): Telephone dialogue with employee from Cerealia Mills(Denmark), November 2005
Christiansen JP (2005): Basics of Pig Production. Landbrugsforlaget. Århus,Denmark
Dalgaard R, Halberg N, Kristensen IS, Larsen I (2006): Modelling represen-tative and coherent Danish farm types based on farm accountancy datafor use in environmental assessments. Agric Ecosyst Environ 17, 223–237
Dalgaard R, Jensen JD, Weidema B, Halberg N, Sørensen CÅG (2007):Environmental assessment of Danish pork. Int J LCA (submitted)
Danish Plant Directorate (2006): Vejledning om gødsknings-og harmoniregler2006/2007 (Guidance on fertilisation and harmony rules 2006/2007).Danish Ministry of Food, Agriculture and Fisheries (in Danish)
DSM (2005): Ronozyme WX – The exceptional xylanase enzyme. DSMnutritional products
EC (2004): Guidelines for the assessment of additives in feedingstuffs. PartII: Enzymes and micro-organisms. European Commission, Health andConsumer Protection Directorate-General
Ecoinvent (2005): The lifecycle inventory data v1.2. Swiss Centre for LifeCycle Inventories
Ekvall T, Weidema BP (2004): System boundaries and input data in conse-quential life cycle inventory analysis. Int J LCA 9, 161–171
Eriksson IS, Elmquist H, Stern S and Nybrant T (2005): Environmentalsystem analysis of pig production – The impact of feed choice. Int J LCA10, 143–154
FAOSTAT (2007): FAOSTAT database. Food and Agriculture Organizationof the United Nations
Halberg N, Hermansen J, Kristensen I, Eriksen J, Tvedegaard N (2007):Comparative environmental assessment of three systems for organic pigproduction in Denmark (submitted to Agron Sustain Dev)
Hvid SK, Nielsen PH, Halberg N, Dam J (2005): Miljøinformation i pro-duktkæden – Et casestudie af produktkæde med svinekød (Environmen-tal information in the product chain – A case study of the pig meat prod-uct chain). Danish Environmental Protection Agency, Miljøprojekt Nr.1027 (in Danish)
IPCC (2006): 2006 IPCC Guidelines for National Greenhouse Gas Invento-ries. Vol. 4. Agriculture, Forestry and Other Land Use. Intergovernmen-tal Panel on Climate Change
Kristensen IS, Nielsen AH, Kristensen T, Hvid SK, Kristensen K (2004):Usikkerhed ved beregning af nøgletal for miljøpåvirkninger (Uncertaintyof estimation of key figures for environmental impacts). Chapter 5 inEnvironmental report 954 (in Danish)
LCA food (2003): LCA food database. www.lcafood.dkNielsen PH, Oxenbøll KM, Wenzel H (2007): Cradle to gate environmental
assessment of enzyme products produced in Denmark by Novozymes A/S. IntJ LCA, DOI: http://dx.doi.org/10.1065/lca2006.08.265.1
Nielsen PH, Wenzel H (2007): Environmental assessment of Ronozyme®P5000 ct phytase as an alternative to inorganic phosphate supplementa-tion to pig feed used in intensive pig production. Int J LCA, DOI: http://dx.doi.org/10.1065/lca2006.08.265.2
Patyk A, Reinhardt G (1997): Düngemittel – Energie und Stoffstrombilanzen(Fertiliser – Energy and mass balances). Friedr. Vieweg & Sohn Publish-ers (in German)
Poulsen HD, Friis C, Rom HB, Sommer SG (2001): Kvælstof, fosfor og kali-um i husdyrgødning – normtal 2000 (Nitrogen, phosphorus, and potas-sium – norm figures 2000). DJF rapport 36. The Danish Institute ofAgricultural Sciences (in Danish)
Sawyer CN, McCarty PL, Parkin GF (1994): Chemistry for environmentalengineering. 4th ed., McGraw-Hill International Publishers, Civil Engi-neering Series
Schäfer T, Borchert TW, Nielsen VS, Skagerlind P, Gibson K, Wenger K,Hatzack F, Nilsson LD, Salmon S Pedersen S, Heldt-Hansen HP, PoulsenPB, Lund H, Oxenbøll KM, Wu GF, Pedersen HH, Xu H (2007): Indus-trial Enzymes. Adv Biochem Engin/Biotechnol 105, 59–131
Schmidt JH, Weidema BP (2006): Shift in the marginal vegetable oil. Int JLCA, DOI: http://dx.doi.org/10.1065/lca2007.07.351
Sommer G, Jensen B, Hutchings N, Lundgaard NH, Grønkjær A, BirkmoseTS, Pedersen P, Jensen BJ (2006): Emissionskoefficienter til brug vedberegning af ammoniakfordampning fra stalde (Emission coefficients forcalculation of ammonia evaporation from stables). DJF rapport. Hus-dyrbrug 70 (in Danish)
Stranddorf HK, Hoffmann L, Schmidt A (2005): Påvirkningskategorier,normalisering og vægtning i LCA (Impact categories, normalisation andweighting in LCA). Miljønyt . Nr. 77 (in Danish, English summary)
Tybirk P (2005): Xylanase. The National Committee for Pig Production.January 4, 2005 (in Danish)
Ullmann's (2003): Ullmann's Encyclopedia of industrial chemistry. Enzymes.Wiley-VCH Verlag GmbH & Co
Weidema BP, Frees N, Nielsen AM (1999): Marginal production technolo-gies for lifecycle inventories. Int J LCA 4, 48–56
Wenzel H, Hauschild M, Alting L (1997): Environmental assessment of prod-ucts. Volume 1. Methodology, tools and case studies in product develop-ment. Chapman and Hall
Wenzel H (1998): Application dependency of LCA methodology – Key vari-ables and their mode of influencing the method. Int J LCA 3, 281–288
WTW (2006): Well-to-wheels analysis of future automotive fuels andpowertrains in the European context. Well-to-wheels report. Joint Re-search Centre (European commission), CONCAWE and EUCAR. Ver-sion 2b
Received: March 9th, 2007Accepted: July 15th, 2007
OnlineFirst: July 15th, 2007
120

Slurry technologies and their potential for environmental improvements RANDI DALGAARD
University of Aarhus, Faculty of Agricultural Sciences, Department of Agroecology and En-
vironment, P.O. Box 50, DK-8830 Tjele
Aalborg University, Department of Development and Planning, Fibigerstræde 13, DK-9220
Aalborg East
I
5
121

122

Slurry technologies and their potential for environmental improvements by Randi Dalgaard
(Manuscript in preparation)
Introduction
Denmark produces 25 million pigs yearly (Danish Meat Association, 2007), and has one of
the world’s largest pig productions per unit (Steinfeld et al., 2006). In 2006 Danish farmers
produced 598 pigs per km2 and 4.7 pigs per person (Statistics Denmark, 2007). Danish pig
farms have undergone large structural changes over the last decades (Kristensen &
Hermansen, 2002), as also seen in many other countries (OECD, 2003). Pig farms are
becoming larger but also more concentrated in specific geographical areas (Kristensen &
Hermansen, 2002).
The centralisation of pig farms in specific regions of Denmark affects the environment, with
slurry being one of the most important factors. Slurry contains nutrients and may therefore be
considered a valuable fertiliser source for growing crops. Slurry can also be used in the
production of biogas which substitutes fossil energy and thereby reduces the emission of
greenhouse gases. On the other hand, some of the nitrogen in slurry volatilises as, for
example, ammonia or nitrous oxide, which affects the environment negatively. Ammonia has
an acidifying effect and nitrous oxide is a strong greenhouse gas. Phosphate or nitrate can also
be leached after application of the slurry to the crops, and thus pollute surface or ground
water.
As part of Danish compliance with the EU Nitrate Directive, the use of slurry-N is limited,
hence livestock farms with a high livestock density are obliged to export slurry to cash crop
farms or livestock farms with a low livestock density. Furthermore, each farm has a fertiliser
quota, so if more slurry-N is imported by a cash crop farm it must import commensurately
less artificial fertiliser-N. Pig farmers with more than 1.4 livestock units per hectare (equals
49 fattening pigs (30-102 kg) produced per ha per year (Anonymous, 2006)), have to export
slurry-N from the farm.
The Danish legislation on the use of slurry is based on the N content in the slurry, and
therefore P is often applied to the fields in excess (Petersen, 2007). The P/N ratio in pig slurry
is higher than in cattle slurry (Poulsen et al., 2001), and thus overfertilization with P is a
123

larger problem on pig farms. Slurry separation produces a fibrous fraction with a P/N ratio
that is higher than in unseparated slurry. Thus, if nutrients are exported, the fibrous fraction
would export more P from the farm than the un-separated slurry .The fibrous fraction also
contains less water, so reducing transport costs.
Many of the slurry separation plants in Denmark were established during 2006, and at the
beginning of 2007 approximately 3% of the Danish slurry was separated (Birkmose, 2007).
Most slurry separation plants are situated on pig farms, and an important reason why farmers
invest in a slurry separation plant is that it facilitates the export of slurry from the farm
(Birkmose, 2007). Slurry separation is often considered a ‘green technology’ (e.g.,
Anonymous (2007)), because it reduces the amount of slurry transported and decreases the P
load on the pig farmer’s fields.
Slurry (or fractions from the slurry separation) can also be anaerobically digested, resulting in
biogas production, which can be used for production of electricity and heat. Anaerobic
digestion of slurry can take place in farm-scale plants situated on the livestock farm or in a
central plant to which several farmers deliver their slurry.
The overall aim of this article is to clarify to what extent and under which circumstances
slurry separation and anaerobic digestion reduce the environmental impact of pig production.
More specifically the aim is to answer the following questions:
• To what extent does slurry separation reduce the amount of slurry transported out of the
pig farm?
• To what extent does slurry separation decrease the P load to fields?
• How do slurry separation and anaerobic digestion of the slurry affect the level of
greenhouse gases emitted?
Methodology
In order to analyse the slurry technologies’ potential for environmental improvements, data
were collected at two large private pig farms and these data were used to establish a farm
model to create different scenarios. The two farms used in the study were located in Jutland in
Denmark, and they produced, respectively, 280 and 410 t pig slurry weekly, making them
some of the largest pig farms in Denmark. During the winter 2004/2005 data on pig herd, crop
124

area, slurry production and sale were collected from the two farms, and samples of raw and
separated slurry were collected and analysed for content of P, total N, ammonia N and dry
matter. Based on these data the separation efficiencies were calculated (Petersen & Sørensen,
submitted). The separation efficiency is a measure of the ‘mass of elements in the fibrous
fraction as percentages of the unseparated slurry’ (Petersen & Sørensen, submitted). E.g., if
the N separation efficiency is 20-25% it means that 20-25% of the N in the unseparated slurry
will end up in the fibrous fraction. A standardized farm model of a large scale pig production
was established in order to assess the overall environmental benefits of different separation
efficiencies and compare systems with different slurry technologies.
Establishment of farm model and scenarios
With the aim of calculating to what extent slurry separation and anaerobic digestion reduce
transport, P-load on the pig farms or greenhouse gas emissions, a farm model was developed.
The farm model represented a Danish pig farm producing approximately 1000 year sows,
where pigs are kept on the farm until they obtain a weight of 100 kg. This corresponded to a
yearly excretion of 122 t slurry-N (Poulsen et al., 2001), and based on Andersen et al. (2001)
it was assumed that 22 t ammonia-N was emitted from the pighouse (17 t N) and storage (5 t
N). These N flows and the P flows are presented in figure 1. The P content in the slurry was
from the measurement at the two private pig farms (Petersen & Sørensen, submitted), and the
measured P/N ratios in the excreted slurry were high compared the nutrient norms of pig
slurry published by Poulsen et al. (2001).
125

Figure 1. The N and P flows in the farm model. The N and P flows shown are the same in all
scenarios. The values for the P flows to fields (at the pig farm) and to export differ amongst
scenarios.
In the farm model the area was 553 ha and 23 t N was exported in order not to exceed the
limit of 140 kg slurry-N applied per ha. A prerequisite for the farm model was that if the N
separation efficiency was 20-25% (Møller et al., 2002) and all the fibrous fraction (with 23 t
N) was exported, the area on the pig farm used for the spreading of the liquid fraction should
be sufficiently large not to exceed the limit of 140 kg N per ha. Therefore the area at the pig
farm in the farm model was set to 553 hectares.
The farm model represented a pig farm which was considerable larger than an average Danish
pig farm (Dalgaard et al. 2006; Kristensen & Hermansen, 2002), because mainly large farms
can afford the considerable economic investment that a slurry separation plant entails.
Ammonia loss:17 tons N
Ammonia loss:5 tons N
Pig farm gate
Pighouse122 tons N excreted45 tons P excreted
Slurry storage
Fields
Three options:-no treatment-slurry separation-anaerobic digestion
Cash crop farm
Raw slurry:105 tons N45 tons P
Slurry (or fractions)77 tons N
Slurry (or fractions)23 tons ND
ista
nce
25 k
m
Raw slurry:100 tons N45 tons P
126

Five different scenarios were established with the farm model differing in respect to types of
slurry treatment (no treatment, slurry separation, anaerobic digestion). Table 1 presents the
five scenarios and the characteristics of each scenario will be described in the following.
In scenario 1 the slurry was not separated or anaerobically digested, and only raw slurry was
exported out of the farm.
Table 1: Characteristics of the five scenarios
Scenario 1 Scenario 2 Scenario 3 Scenario 4 Scenario 5
Slurry separation No Yes Yes Yes No
Anaerobic digestion No No No No Yes
Separation efficiency1)
-
N: 20-25%2)
P: 80-83%2)
N: 8%3)
P: 38%3)
N: 7%3)
P: 26%3) -
1) Calculated as mass of elements in the fibrous fraction as percentages of the unseparated digested slurry.
2) Møller et al. (2002)
3) Petersen & Sørensen (submitted)
In scenarios 2, 3 and 4 the slurry was separated in a decanter centrifuge, which separated the
solids from the liquid. The solid fraction (from now on designated the ‘fibrous fraction’)
contained straw and fibre from the pig dung and pig hairs, while the liquid fraction contained
most of the water and pig urine. The liquid fraction had high N and low P contents compared
to the fibrous fraction (Møller et al., 2002; Petersen & Sørensen, submitted). The separation
efficiencies in scenario 2 are from Møller et al. (2002) and these were higher than the
separation efficiencies in scenarios 3 and 4 that were measured at the two private farms. The
methodology used for measurements at the two private farms was explained by Petersen &
Sørensen (submitted).
The two private farms and the five scenarios (presented in table 1) produced by the farm
model had several characteristics in common: the farms were large, they produced both sows,
piglets and fattening pigs, they had a high livestock density and were therefore obliged to
export slurry-N out of the farm. At the two private farms the slurry was also anaerobically
digested and the biogas was used for heat and electricity production. The heat was used in
127

pighouses and the electricity was sold to the grid. This means that less (or no) fossil energy
was used in the pighouse and the electricity replaced fossil-based electricity on the market.
Consequently, the anaerobic digestion of slurry resulted in avoided emissions of fossil CO2.
In scenario 5 the slurry was anaerobically digested, but not separated. Due to higher
transparency of the results, none of the five scenarios included the combination of anaerobic
digestions and slurry separation. The amounts of P applied to the fields at the pig farm and
exported out of the pig farm were calculated using the nutrient contents (N and P) of the
slurry, the fibrous and the liquid fraction measured at the private farms (Petersen & Sørensen,
submitted).
Estimation of greenhouse gas balances in the scenarios
The greenhouse gas emissions were expected to vary between the five scenarios. In a scenario
where the slurry was separated, less slurry would be exported out of the farm and therefore
less fossil CO2 emitted. Moreover a better distribution of P could be expected, and therefore
less artificial P fertiliser would be used resulting in a saving of greenhouse gases emitted from
the production and distribution of artificial P fertiliser. Furthermore, the energy produced
from the biogas after anaerobic digestion would substitute both electricity and heat, thus
resulting in avoided emissions of fossil CO2. On the other hand, more electricity would be
used in order to run the slurry separation plant, and this would result in extra greenhouse gas
emissions. For all scenarios greenhouse gas balances were established based on the following
assumptions: Transport of slurry (or slurry fractions) included the greenhouse gas emissions
related to the transport of slurry (or slurry fractions) from the pig farm to the receiving farm.
The distance was assumed to be 25 km, and the Life cycle assessment (LCA) data were taken
from Ecoinvent Centre (2004, lorry size: 32 t). In accordance with Hinge (2005) it was
assumed that 4.5 kWh electricity was used per tonne slurry separated. LCA data on electricity
were taken from the LCAfood database (www.LCAfood.dk), and LCA data for artificial
fertiliser-P from Ecoinvent Centre (2004). It was assumed that one kg slurry-P substituted one
kg artificial fertiliser P. In scenario 5 the avoided emissions of fossil CO2 were calculated
according to LCA data on anaerobic digestion of pig slurry in a farm-scale biogas plant,
where 1 t of slurry resulted in avoided emissions of 49 t of CO2-eq. (Nielsen, 2004).
128

Results and discussion
The scenarios established using the farm model differed in terms of type and amount of slurry
(or fractions) exported out of the farm and P applied per hectare at the pig farm.
The results from all scenarios are presented in table 2. In scenario 1 only raw slurry was
exported from the farm because the slurry was not separated or anaerobically digested. In
scenario 2 only the fibrous fraction was exported, because the N separation efficiency was
high and the fibrous fraction therefore contained so much N (23 t) that the remaining liquid
fraction did not exceed the application limit of 140 kg N per ha . In scenarios 3 and 4 the N
separation efficiencies were lower (from the private farms) giving a lower N content in the
fibrous fraction, resulting in some of the liquid fraction also having to be exported in order
not to exceed the 140 kg slurry-N applied per hectare limit. In scenario 5 only anaerobically
digested slurry was exported. Table 2 also shows how the amount of slurry exported was
reduced when the slurry was separated. In scenario 1, 4427 t of slurry was exported yearly,
while this was reduced by 37% (to 2808 t) if the slurry was separated according to the
separation efficiencies in scenario 2. However, because of the lower separation efficiencies
(measured at the private farms) in scenarios 3 and 4, the amount of slurry exported was only
reduced by 18% (to 3636 t) and 10% (to 4002 t) in scenarios 3 and 4, respectively. Thus, even
though the slurry was separated, the ‘saved’ transport of slurry in scenarios 3 and 4 was
limited because the separation efficiencies were much lower compared with scenario 2. In
scenario 5 the amount of slurry exported was not reduced.
129

Table 2: Results on slurry export and amount of P applied per ha per year in the five
scenarios.
Scenario 1 Scenario 2 Scenario 3 Scenario 4 Scenario 5
Type of slurry exported Raw slurry Fibrous
fraction
Fibrous and
liquid
fraction
Fibrous and
liquid
fraction
Anaerobic
digested
slurry
Slurry exported out of pig farm,
tons/year 4427 2808 3636 4002 4427
N exported out of pig farm,
tons/year 23 23 23 23 23
P exported out of pig farm,
tons/year 10 38 19 14 10
P applied to field at pig farm,
kg P/ha 62 12 46 55 62
Table 2 also shows that 10 t P was exported in scenario 1 and this was almost quadrupled in
scenario 2, because the fibrous fraction in scenario 2 contained considerably more P per unit
N compared with the raw slurry in scenario 1. Slurry-P applied to fields was reduced by 82%
(from 62 to 12 kg P/ha) when the slurry was separated. But in scenarios 3 and 4, where the
separation efficiencies were lower, the slurry-P applied was only reduced by 11% and 26%,
compared with scenario 1. However, in scenario 2 only 12 kg P per hectare was applied to
fields and this is below the P removed from the soil if for example 7000 kg wheat per hectare
was cultivated. So seen in a longer-term perspective, the application of 12 kg P per hectare
would lead to a P deficit. However, only few pig farms suffer from P deficit, so reducing the
amount of P applied to fields at the pig farms is important in order to reduce phosphate
leaching. More phosphate is generally leached from Danish pig farms than from dairy farms
(Dalgaard et al. 2006) and this is a threat to the aquatic environment.
There is no doubt, the weight of exported pig slurry can be considerably reduced (37% in
scenario 2) if the slurry separation plant separates efficiently, and so can the slurry-P applied
130

per hectare on the pig farm (82% in scenario 2). But with the efficiencies obtained at the two
private farms the environmental advantages of slurry separation will be limited.
Another important observation is that slurry separation and anaerobic digestion do not solve
the problem of the relatively large amount of ammonia lost from housing and storage.
According to figure 1, 22 t N is emitted (40 kg N/ha) and this is the same for all scenarios. So
if pig farms are concentrated in specific areas, the ammonia load in that area will remain the
same even with separated or anaerobically digested slurry.
Figure 2 presents the greenhouse gas balances for scenarios 1, 2, 3 and 4. Scenario 5 was
omitted from the figure because it is out of scale. It should be emphasized here that the
greenhouse gas emissions (e.g., nitrous oxide) from the fields where the slurry (or the
fractions) were applied were not included, because it was assumed that the emissions would
be the same for the unseparated and the separated slurry. The greenhouse gas emissions in
Figure 2 include only those arising from the treatment and transport of slurry, and the amount
of avoided artificial P fertiliser.
According to figure 2, 19 t CO2-eq. were emitted from the transport of slurry in scenario 1,
whereas this was lower in the other scenarios, due to less slurry being transported (see table
2). This shows that the transport-related emissions of fossil CO2 were reduced when the slurry
was separated. The greenhouse gas emissions related to ‘Electricity’ were the same for
scenarios 2, 3 and 4 because the amount of slurry separated was the same (20,000 t).
‘Avoided artificial P fertiliser’ was a negative value in all four scenarios, because the slurry
(or fractions) substituted artificial fertiliser-P. In scenario 2, the high P separation efficiency
resulted in avoided emissions of 66 t CO2-eq. This avoided emission more than
counterbalanced the greenhouse gas emissions from ‘transport’ and ‘electricity’. The avoided
emissions from scenarios 3 and 4 were lower, because the P separation efficiencies in these
scenarios were lower (see table 1). The ‘Total’ in figure 2 shows a positive balance for the
total greenhouse gas emission for scenario 1 (1 t CO2-eq.). The total greenhouse gas
emissions from the other scenarios were negative, meaning that they reduced the emissions of
greenhouse gases compared with scenario 1. Obviously, a longer transport distance would
result in higher greenhouse gas emissions. A sensitivity analysis showed that the fibrous
fraction in scenario 2 could be transported 128 km before it cancelled out the saved emissions
131

from ‘avoided artificial P fertiliser’, and thereby resulted in a net positive greenhouse gas
emission. But because of the low separation efficiencies in scenarios 3 and 4, the fractions in
these scenarios could only be transported 28 and 45 km, respectively, before the saved
emissions from ‘avoided artificial P fertiliser’ were cancelled out. So whether the slurry
separation seen in relation to no separation (scenario 1) was environmentally worse or better
was highly dependent on the separation efficiency. If it was low, the amounts to be
transported grew, and less artificial fertiliser P would be substituted.
Electricity
Transport
TotalAvoided artificial P fertiliser
-80
-70
-60
-50
-40
-30
-20
-10
0
10
20
30
Tons
CO
2 eq
em
itted
Sce 1 Sce 2 Sce 3 Sce 4
Figure 2: Greenhouse gas balances from scenarios 1, 2, 3 and 4.
In scenario 5, where the slurry was anaerobically digested, more than 1150 t fossil CO2 was
avoided due to the production of biogas-based electricity and heat (not shown). These saved
emissions from the substitution of electricity and heat (‘Avoided fossil energy’) were very
dominating compared to emissions from ‘transport’ (19 t CO2-eq. (as for scenario 1 shown in
figure 2)) and saved emissions from ‘avoided artificial fertiliser P’ (-18 t CO2-eq. (as for
scenario 1 shown in figure 2)). This showed that the anaerobic digestion of slurry is a very
132
efficient technology compared with slurry separation if the goal is to reduce the greenhouse
gas emissions. However, it is important that the methane losses from the biogas plant are
minimized, because methane is a strong greenhouse gas, and losses of methane will result in
less energy production but eventually also partly outweigh the benefit form using biogas. It
should be emphasized that anaerobic digestion does not provide a better distribution of N and
P between the pig and the cash crop farms, as is the case for the slurry separation scenarios
presented in table 2.
Besides slurry handling the product chain of the pig also includes, for example, activities
inhouse and in the field, the production and transport of artificial fertiliser and feed, heat,
electricity, etc. (Dalgaard et al. submitted). Using the separation efficiencies in scenario 2 and
the results from figure 2 the reduced greenhouse gas emissions arising from slurry separation
were compared to the rest of the product chain of the pig. For this comparison it was assumed:
i) the pig farm in the scenarios produced 2795 t live weight pigs per year and ii) the emission
per kg pig (carcass weight) was 3.5 kg CO2-eq. (Dalgaard et al., submitted). The comparison
showed that if the slurry was separated, the fibrous fraction was transported 25 km, and
artificial P fertiliser was substituted, the greenhouse gas emissions per kg pig could only be
reduced by 0.6%. If the slurry was not separated but anaerobically digested and the biogas
was used for energy production (as described above), the greenhouse gas emissions per kg
pork could be reduced by 16%. So seen in relation to global warming, anaerobic digestion
was not only better than slurry separation, but it also offered the opportunity to reduce the
global warming potential per pig considerably. On the other hand, anaerobic digestions did
not change the nutrient contents (and not the P/N ratio) in the slurry, so it did not have the
same potential for reducing the P loads on the pig farm that slurry separation had.
Conclusion
Slurry separation can potentially reduce the amount of slurry transported from pig farms to
cash crop farms. The P load on the pig farms can also be reduced. A greenhouse gas balance
showed that the greenhouse gas emissions can be reduced if artificial P fertiliser was
substituted on the cash crops farms that receive the fibrous fraction. However, if the
separation efficiencies were as low as those measured on the two private farms in this study,
the environmental advantages of using slurry separation will be limited. If the slurry was
anaerobically digested and the biogas used for energy production, the greenhouse gas
emission per pig could be reduced by 16%.
133

References
Andersen, J.M., Poulsen, H.D., Børsting, C.F., Rom, H.B., Sommer, S.G. & Hutchings, N.J.,
2001. Ammoniakemissions fra landbruget siden midten af 80’erne. Faglig rapport fra
DMU 353, pp. 1-48. (In Danish).
Anonymous, 2007. Dansk miljøteknologi til hele verden. Fra Rådet til Tinget.
Teknologirådets Nyhedsbrev til Folketinget. Nr. 218. Available on-line at:
www.tekno.dk/pdf/nummer218.pdf (In Danish).
Anonymous, 2006. Bekendtgørelse om erhvervsmæssigt dyrehold, husdyrgødning, ensilage
m.v. Available online at: http://147.29.40.90/_GETDOC_/ACCN/B20020060405-regl
Birkmose T., 2007. Status over anvendelse af gylleseparering i Danmark, februar 2007.
Aktuelt nr. 108. Available on-line at:
http://www.lr.dk/planteavl/informationsserier/aktuelt/pl_aktuelt_07_108.htm (In
Danish).
Dalgaard, R., Halberg, N., Kristensen, I.S. & Larsen, I., 2006. Modelling representative and
coherent Danish farm types based on farm accountancy data for use in environmental
assessments. Agriculture, Ecosystems and Environment 117, 223-237.
Dalgaard, R., Jensen, J.D., Weidema, B., Halberg, N. & Sørensen, C.Å.G., submitted.
Environmental assessment of Danish pork. (Submitted March 2007). (Paper 3 in this
Thesis).
Danish Meat Association (2007). Statistics 2006. Available on-line at:
www.danishmeat.dk/smcms/DMA_Home/statistics/statistics_2004/Index.htm?ID=6671
&tWebID=111&print=UK.
Ecoinvent Centre, 2004. Ecoinvent data v1.1. Final reports ecoinvent 2000 (1-15). Swiss
Centre for Life Cycle Inventories, Dübendorf 2004, CD-ROM.
Hinge, J., 2005. Decantercentrifuge. Available on-line at:
www.lr.dk/bygningerogmaskiner/diverse/gs_050726_wmp3_07.htm (In Danish).
Kristensen, I.T. & Hermansen, J.E., 2002. Produktionens strukturmæssige og geografiske
fordeling. In: Landbrugsstruktur og miljøforhold for svineproduktionen i Danmark (Ed:
Hermansen, J.E.). DJF rapport. Husdyrbrug 43. (In Danish).
134

Møller, H.B., Maahn, M. & Skaaning, K., 2002. Separation af afgasset gylle med
dekantercentrifuge. Danmarks JordbrugsForskning. Intern rapport 152. 12 pp. (In
Danish).
Nielsen, P.H., 2004. Heat and power production from pig manure. Available on-line at:
www.lcafood.dk/processes/energyconversion/heatandpowerfrommanure.htm.
OECD, 2003. Agriculture, trade and environment: The pig sector. Available on-line at:
http://www.oecd.org/dataoecd/25/41/19430433.pdf
Petersen, J., 2007. Vurdering af virkning på miljøet (VVM) ved udvidelse af husdyrbrug.
Tidsskrift for Landbrugsret. Vol. 2. Forlaget Thomsen. (In Danish).
Petersen, J. & Sørensen, P., submitted. Losses of nitrogen and carbon during storage of the
fibrous fraction of separated slurry and influence on nitrogen availability. (Submitted
January 2007.)
Poulsen, H.D., Børsting, C.F., Rom, H.B. & Sommer, S.G., 2001. Kvælstof, fosfor og kalium
i husdyrgødning - normtal 2000. DJF rapport. Husdyrbrug 36. (In Danish).
Statistics Denmark. 2007. Agriculture. Available on-line at:
http://www.statistikbanken.dk/statbank5a/default.asp?w=1280
Steinfeld, H., Gerber, P., Wassenaar, T., Castel, V., Rosales, M. & de Haan, C., 2006.
Livestock’s long shadow – environmental issues and options. FAO, pp. 390.
135