the entropy concentration theorem...
TRANSCRIPT

The Entropy Concentration Theorem Paradox
Luis V. MontielEGADE Business School - Tecnologico de Monterrey
Avenida Carlos Lazo 100, Santa Fe, Ciudad de Mexico, c.p. 01389, [email protected]
July 15, 2014
Abstract
This paper presents two implementations of the Entropy Concentration Theorem that suggest con-tradictory approximations of an unknown joint probability distribution. This paradox of opposingrecommendations was analyzed using a simple example. The first implementation satisfies the The-orem when applied to the outcomes of a random variable, whereas the second adheres to the meta-distribution of the valid joint distribution approximations. The paper revisits the maximum entropymodel and the Entropy Concentration Theorem to provide a clear understanding of the paradox and itsimplications for choosing an approximation to a probability distribution.
Keywords: Entropy Concentration Theorem, probabilistic modeling, joint distribution approximations.
1 Introduction
Many optimization problems require the inclusion of uncertainties to provide accurate solutions in anon-deterministic environment. To characterize those uncertainties, the analyst specifies a joint probabilitydistribution function. Unfortunately, complete probabilistic information is often unavailable [1, 11, 13].Hence, there is not a unique distribution with which the problem can be analyzed.
To overcome this, analysts have developed approximation methods to specify unique probability dis-tributions subject to known characteristics (marginal probabilities, moments, etc.). Of these methods, themaximum entropy distribution (ME, [5]) is one of the most popular.
This paper will revisit some of the ideas behind ME and present two implementations of entropy thatlead to contradictory approaches to approximating a joint distribution. These approaches result in radicallydifferent approximations, which result in different optimization models that can provide different optimalsolutions [11]. Therefore, a clear understanding of this contradiction (or paradox) is fundamental for thefield of optimization under uncertainty when the joint distribution is underspecified.
This paper is organized as follows. §2 provides an intuitive review of entropy, defines the idea of avalid joint distribution using the truth set, and formalizes the concept of maximum entropy. §3 revisitsthe Entropy Concentration Theorem and uses a simple example to illustrate the main idea behind it. §4outlines two implementations of the Entropy Concentration Theorem that ultimately lead to a paradox.Finally, §5 concludes and provides some final thoughts.
2 A Formulation of Entropy and the Entropy Concentration Theorem
2.1 What is entropy?
Entropy can be understood as a measure of the amount of information, represented as bits, needed todescribe the possible outcomes of a discrete random variable. This makes entropy a measure of uncertainty,because uncertainty and information requirements are correlated. For example, when thinking of a die, we
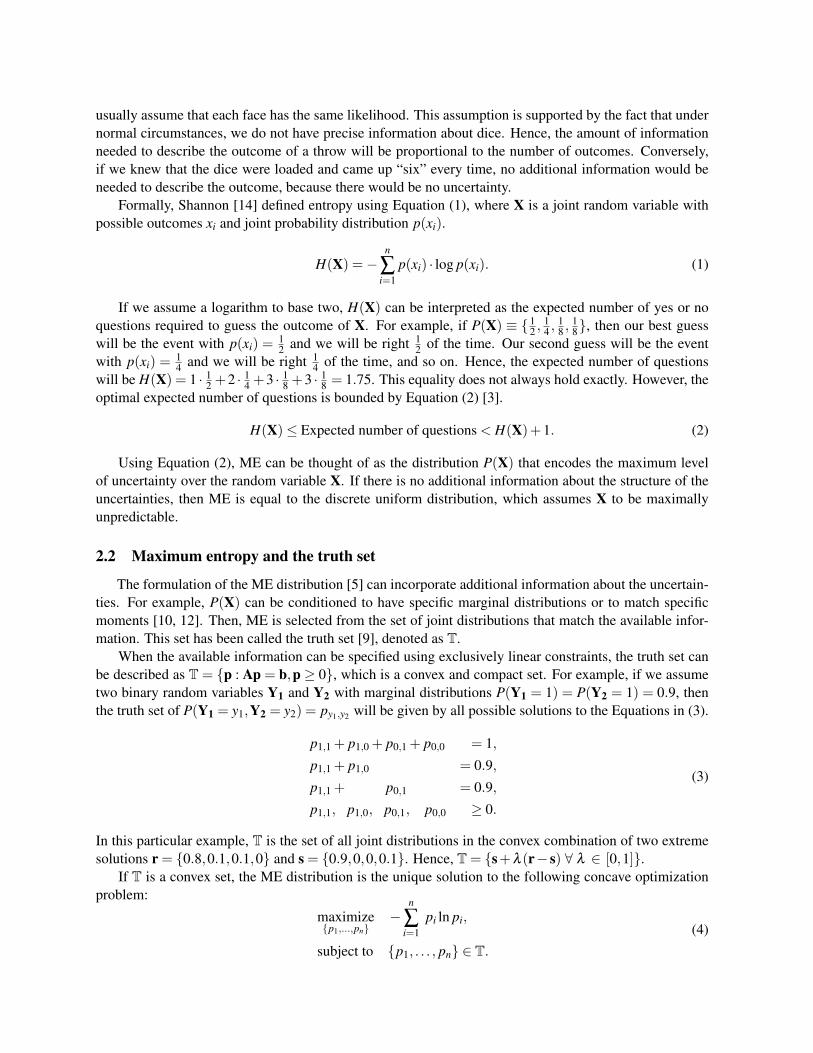
usually assume that each face has the same likelihood. This assumption is supported by the fact that undernormal circumstances, we do not have precise information about dice. Hence, the amount of informationneeded to describe the outcome of a throw will be proportional to the number of outcomes. Conversely,if we knew that the dice were loaded and came up “six” every time, no additional information would beneeded to describe the outcome, because there would be no uncertainty.
Formally, Shannon [14] defined entropy using Equation (1), where X is a joint random variable withpossible outcomes xi and joint probability distribution p(xi).
H(X) =−n
∑i=1
p(xi) · log p(xi). (1)
If we assume a logarithm to base two, H(X) can be interpreted as the expected number of yes or noquestions required to guess the outcome of X. For example, if P(X) ≡ { 1
2 , 14 , 1
8 , 18}, then our best guess
will be the event with p(xi) = 12 and we will be right 1
2 of the time. Our second guess will be the eventwith p(xi) = 1
4 and we will be right 14 of the time, and so on. Hence, the expected number of questions
will be H(X) = 1 · 12 +2 · 1
4 +3 · 18 +3 · 1
8 = 1.75. This equality does not always hold exactly. However, theoptimal expected number of questions is bounded by Equation (2) [3].
H(X)≤ Expected number of questions < H(X)+1. (2)
Using Equation (2), ME can be thought of as the distribution P(X) that encodes the maximum levelof uncertainty over the random variable X. If there is no additional information about the structure of theuncertainties, then ME is equal to the discrete uniform distribution, which assumes X to be maximallyunpredictable.
2.2 Maximum entropy and the truth set
The formulation of the ME distribution [5] can incorporate additional information about the uncertain-ties. For example, P(X) can be conditioned to have specific marginal distributions or to match specificmoments [10, 12]. Then, ME is selected from the set of joint distributions that match the available infor-mation. This set has been called the truth set [9], denoted as T.
When the available information can be specified using exclusively linear constraints, the truth set canbe described as T = {p : Ap = b,p≥ 0}, which is a convex and compact set. For example, if we assumetwo binary random variables Y1 and Y2 with marginal distributions P(Y1 = 1) = P(Y2 = 1) = 0.9, thenthe truth set of P(Y1 = y1,Y2 = y2) = py1,y2 will be given by all possible solutions to the Equations in (3).
p1,1 + p1,0 + p0,1 + p0,0 = 1,
p1,1 + p1,0 = 0.9,
p1,1 + p0,1 = 0.9,
p1,1, p1,0, p0,1, p0,0 ≥ 0.
(3)
In this particular example, T is the set of all joint distributions in the convex combination of two extremesolutions r = {0.8,0.1,0.1,0} and s = {0.9,0,0,0.1}. Hence, T = {s+λ (r− s) ∀ λ ∈ [0,1]}.
If T is a convex set, the ME distribution is the unique solution to the following concave optimizationproblem:
maximize{p1,...,pn}
−n
∑i=1
pi ln pi,
subject to {p1, . . . , pn} ∈ T.
(4)

The solution of the formulation in Equation (4) using the truth set as described in the Equations in (3)is pME = {0.81,0.09,0.09,0.01} and corresponds to the ME approximation of P(Y1 = y1,Y2 = y2). Thissolution is the point in the line segment between r and s that corresponds to λ = 0.9. Given that there is avalid distribution for each λ ∈ [0,1] according to the definition of T, a question of interest is why pME isconsiderably biased towards the extreme point r in T. The answer is given by the Entropy ConcentrationTheorem [6], and a concept called multiplicity that describes the number of ways a distribution can be con-structed. Then, the ME approximation in T is the closest distribution to the discrete uniform distributionwhen measured by the absolute difference of their multiplicities. Since the discrete uniform distribution ismaximally unpredictable, pME will be the maximally unpredictable distribution in T. In fact, pME is theonly distribution in T for which Y1 and Y2 are independent random variables.
3 The Entropy Concentration Theorem
The Entropy Concentration Theorem (ECT) [6] has served as the main rationale for the use of ME.This theorem postulates that among all possible joint probability distributions in T, the distribution thatbest characterizes the uncertainties is the ME distribution. The ECT is restated in Theorem 3.1 as follows:
Theorem 3.1. Assume an unknown joint probability distribution p ∈ T with n joint outcomes, whereT is described by m independent constraints (1 ≤ m < n). Generate a sequence of random samples ofN independent trials, from which the frequencies fi = Ni/N, 1 ≤ i ≤ n are observed, where Ni is thenumber of times that the joint outcome i has been observed in the sequence. For large N and all possiblerealizations of { f1, . . . , fn} matching the m constraints, the entropy of p = { f1, . . . , fn} has probability α
of being in the interval:Hmax−4H ≤ H(p)≤ Hmax, ∀ p ∈ T (5)
where Hmax is the maximum entropy value, and4H is the length of the entropy interval. Then, 2N4H isa random variable distributed as χ2
k (1−α) with k = n−m degrees of freedom.
According to the ECT, if outcome xi of a random variable X is observed N times, the joint distributionof P(X) can in theory be reconstructed from the frequencies fxi . P(X) is not uniquely determined, sincethe frequencies fxi are generated by random trials. Hence, it is a random vector with discrete finite supportfor N < ∞. Finally, the ECT says that α% of the observed realizations { fx1 , . . . , fxn} will have entropy inthe interval [Hmax−4H,Hmax].
3.1 Simple example of the ECT
The ECT can be illustrated as follows. Imagine two coins (not necessarily fair), and define the jointdistribution of these two coins as P(Z) with events {HH,HT,T H,T T}, where HT implies that coin “one”landed heads and coin “two” landed tails. Let us toss both coins 4 times (N = 4) and define the frequenciesfi = Ni
N . For instance, NHH is the number of times the outcome of both coins was HH, and fHH = NHHN is
the respective frequency.Each frequency vector { fHH , fHT , fT H , fT T} can be realized in a number of ways. For example, when
N = 4, the vector {34 , 1
4 ,0,0} can be realized in four ways as follows: let both coins land on HH three outof four attempts and on HT on the remaining attempt. Then, HT can be observed on the first, second, thirdor forth toss. Other frequencies such as {1,0,0,0} can only be realized in one way by having both coinslanded on HH four times.

Jaynes [6] named the number of possible realizations (or combinations) of a particular frequency dis-tribution as “multiplicity” (W ). Formally defined by Equation (6).
W =N!
NHH ! ·NT H ! ·NHT ! ·NT T !. (6)
Table 1 presents the possible frequency realizations and their multiplicities for our two coins example.In four throws, both coins have a total of nN = 256 possible realizations distributed on 35 frequencydistributions, where the frequency distribution with the maximum multiplicity (Wmax = 24) correspondsto the discrete uniform distribution marked in bold. As N goes to infinity, the multiplicity also goes toinfinity, and the limit of the ratio ln(Wi)
N converges to the entropy of Pi(Z) [6]. Hence, the distribution withmaximum multiplicity is also the ME distribution.
Table 1: Joint Distributions and Multiplicities (W) When Tossing Two Coins (N = 4)
W HH HT TH TT W HH HT TH TT W HH HT TH TT
1 1 0 0 0 12 14
24 0 1
4 12 0 24
14
14
4 34
14 0 0 12 1
414
24 0 6 0 2
4 0 24
4 34 0 1
4 0 24 14
14
14
14 4 0 1
434 0
4 34 0 0 1
4 12 14
14 0 2
4 12 0 14
24
14
6 24
24 0 0 4 1
4 0 34 0 12 0 1
414
24
12 24
14
14 0 12 1
4 0 24
14 4 0 1
4 0 34
12 24
14 0 1
4 12 14 0 1
424 1 0 0 1 0
6 24 0 2
4 0 4 14 0 0 3
4 4 0 0 34
14
12 24 0 1
414 1 0 1 0 0 6 0 0 2
424
6 24 0 0 2
4 4 0 34
14 0 4 0 0 1
434
4 14
34 0 0 4 0 3
4 0 14 1 0 0 0 1
12 14
24
14 0 6 0 2
424 0
The main result of the ECT states that α% of the observed frequency realizations will have entropywithin the interval Hmax−4H ≤ H(p) ≤ Hmax. The distributions in Table 1 yield Hmax = 2, and assum-ing α = 0.95 with 3 degrees of freedom yields 4H = 0.98. Hence, the sum of the multiplicities of alldistributions with entropy in the interval [1.02,2] should account for approximately 95% of the sum of allW s. This result is expected to hold for large N. However, for N = 4, 65% of the combinations produce adistribution with entropy in the range [1.02,2].
As N increases, the number of possible realizations (Wi) of distribution Pi(Z) increases exponentially.Hence, on the limit, an α fraction of the sum of the multiplicities will correspond to distributions withentropy within the interval Hmax−4H ≤H(p)≤Hmax. Hence, Wi defines a meta-distribution of the Pi(Z)distributions, where the most likely approximation is the ME distribution. For example, Figure 1 showsthe normalized multiplicities ( Wi
Wmax) of Pi(Z) for N = 4,8,12,16, where Wmax is the largest multiplicity. In
each subfigure, each dot represents a realization of Pi(Z), and its size represents the ratio with respect tothe maximum multiplicity.
As N increases from 4 to 16, the dots closer to the corners get reduced to almost zero, leaving a smallportion of Pi(Z) with observable multiplicity. This means that the meta-probability of a large portionof Pi(Z) becomes negligible when compared to the meta-probability of the realization with the largestmultiplicity. As N goes to infinity, the limit of4H goes to zero. Then, the ME distribution has a W that isinfinitely larger than that of any other valid distribution. Hence, the meta-distribution of P(Z) becomes a

0.0
0.5
1.0
PHHHL
0.0
0.5
1.0
PHHTL
0.0
0.5
1.0
PHTHL
(a) N = 4.
0.0
0.5
1.0
PHHHL
0.0
0.5
1.0
PHHTL
0.0
0.5
1.0
PHTHL
(b) N = 8.
0.0
0.5
1.0
PHHHL
0.0
0.5
1.0
PHHTL
0.0
0.5
1.0
PHTHL
(c) N = 12.
0.0
0.5
1.0
PHHHL
0.0
0.5
1.0
PHHTL
0.0
0.5
1.0
PHTHL
(d) N = 16.
Figure 1: The dots represent possible realizations of P(Z) when N = 4,8,12,16, where the axes repre-sent the probabilities of P(Z = HH), P(Z = HT ), and P(Z = T H). The size of a given dot shows thenormalized multiplicity ( W
Wmax). All dots share the same scale.
continuous density with bounded support that concentrates all its mass at the maximum entropy point.At this point it is important to notice that we have been working with a system of two random variables,
where the distribution of one random variable is an outcome of the other one. In particular, we have Zwith mass density given by Pi(Z) for some i, and P = P(Z) with realizations pi = Pi(Z) and mass densitygiven by P(P = pi) = Wi
∑35j=1 Wj
for all i. In the following section we implement the ECT for each of these
random variables and observe that the ECT provides contradictory statements with respect to the meta-distributions.
4 Two Implementations of the Entropy Concentration Theorem
This section presents two instances of the ECT that provide different distribution approximations. Thefirst is the standard case assumed by Jaynes [6] and presented in §3.1. The second applies the ECT to

the meta-distribution of the joint distributions. We will show that these cases yield opposite conclusions,thereby constituting a paradox.
4.1 Approximating the distribution of a random variable
Let us return to the example with two binary variables where P(Y1,Y2) is subject to the Equations in(3). Given our state of knowledge, we considered only distributions along the line segment represented byL(λ ) = s+λ (r−s), with domain λ ∈ [0,1]. As we increased the number of independent trials N and mea-sured the ratio Wλ
Wmaxfor every parameterized joint distribution L(λ ) ∀ λ ∈ [0,1], the multiplicity/entropy
concentrated near λ = 0.9.Figure 2 illustrates this effect for N = 100, 1,000, 10,000. Here, the black dots represent evenly spread
realizations of P(Y1,Y2) that match the Equations in (3), λ indicates the distance from s in direction r− s,and the dotted line represents the best fit. For each joint distribution considered, we present the normalizedmultiplicity Wi
Wmax.
0
0.2
0.4
0.6
0.8
1
0 0.2 0.4 0.6 0.8 1
W/W
Max
λ
(a) N = 100.
0
0.2
0.4
0.6
0.8
1
0.0 0.2 0.4 0.6 0.8 1.0
W/W
Max
λ
(b) N = 1,000.
0
0.2
0.4
0.6
0.8
1
0.0 0.2 0.4 0.6 0.8 1.0
W/W
Max
λ
(c) N = 10,000.
Figure 2: The horizontal axis shows valid P(Y1,Y2) parameterized by λ . The vertical axis shows thenormalized multiplicity ( Wi
Wmax) when N = 100, 1,000, 10,000.
The normalized multiplicities in Subfigures 2(a) to 2(c) show that the meta-distribution of Pi(Y1,Y2)is not uniform. In fact, as N goes from 100 to 10,000, the concentration of multiplicity explodes aroundthe point of maximum entropy, meaning that distributions with higher entropy have also higher likelihood.As N↗∞, the ECT states that the meta-distribution of Pi(Y1,Y2) is zero everywhere except for the meta-probability of the maximum entropy distribution pME = {0.81,0.09,0.09,0.01}.
4.2 Approximating the meta-distribution of a random joint distribution
Now, consider a related scenario that involves a continuous random variable λ with unknown densityand support on the interval [0,1]. Let us discretize λ using M evenly distributed points λ1 to λM. Hence,the outcomes of λ are equivalent to the outcomes of a dice with M sides. To find the probability massfunction P(λi) that best characterizes this uncertainty, we again use the ECT on a single random variablewith M possible outcomes. However, in this case, the only information we have about the distribution ofλ is that ∑
Mi P(λi) = 1 and P(λi)≥ 0 ∀ i.
As with the two coin toss in §3.1, the ECT indicates that the best approximation for lambda P(λi) is thedistribution with the highest multiplicity/entropy, which corresponds to the discrete uniform distribution.Then, we can argue that every realization of λ is equally likely. This result is independent of the numberof points M. Hence, as M↗ ∞, the ECT indicates that the distribution that best characterize λ ∈ [0,1] isthe continuous uniform distribution (i.e. ME).
From the current and former implementations of the ECT a contradiction reveals as follows. Accordingto §4.1, each joint distribution P(Y1,Y2) can be parametrized by λ , where P(λ ) is the meta-distribution

of the joint distributions. If P(λ ) concentrates around the point of ME (Figure 2), then, the only λ withpositive probability is the one that corresponds to the ME distribution. In contrast, if we disregard pre-vious information and take λ as a random variable with support in [0,1], the ECT states that the bestapproximation for P(λ ) is the uniform discrete distribution.
The ECT paradox exposes that a random variable λ can be both, deterministic and maximally uncer-tain, depending on the procedence of the information. In the fist case, a deterministic λ provides a uniqueapproximation for P(Y1,Y2). In the second case, every distribution in T can be the best approximationfor P(Y1,Y2) with equal probability. Moreover, if an approximation needs to be selected from T, a rea-sonable choice would be the joint distribution that minimizes the maximum error, which corresponds to arobust approximation. For T, as defined by the Equations in (3), that distribution is given by λ = 1
2 and isequivalent to pR = {0.85,0.05,0.05,0.05}.
In general, the maximum entropy meta-distributions correspond to the multivariate uniform distribu-tion with support on T, and a robust approximation will be given by the center of mass of the truth set,which can be calculated using Markov chain Monte Carlo simulation [12].
4.3 The ECT paradox
The implementations in §4.1 and §4.2 use the ECT to produce a rationale for the best possible approx-imation of an unknown joint distribution. However, the results in both implementations are contradictory.In the first implementation, the ECT indicated that there is only one possible alternative and that this al-ternative is close to the extreme of the truth set. Additionally, this result would imply that any form ofsensitivity analysis is unnecessary because as N ↗ ∞, the probability of observing any other joint distri-bution goes to zero. In the second implementation, the ECT indicates that all joint distributions in T havethe same probability of being the actual description of the uncertainties. Then, a robust choice will be thejoint distribution at the center of T that minimizes the size of an almost certain error. Moreover, for thesecond implementation, the use of sensitivity analysis is key because for any distribution approximationwe choose, the probability of selecting the one distribution that accurately characterizes the uncertaintiesis zero.
The paradox is explained by observing the sources of information. In the first implementation, theinformation comes from the frequencies of the outcomes. However, when the outcomes can be neitherobserved nor counted, the ME approximation nonetheless acts as if the outcomes could be observed andcounted. Hence, the ECT completes the missing information in T using the information from the multi-plicity (W ), which creates the necessary implicit constraints to reduce the truth set to a single distribution.
If the outcomes can in fact be observed, the combinatoric basis of the ECT will be correct. Un-fortunately, in most optimization problems under uncertainty, the implicit constraints added by the ECTdescribe unrealistic assumptions. For example, if Y1 and Y2 represented stock prices, and P(Y1,Y2) wasthe joint probability distribution of the stocks going up or down subject to the Equations in (3), the ECTwould indicate that the two stocks are independent, which any financier would doubt. Other examples ofsimilar fallacies involving probabilistic dependencies can be found in critical infrastructure management[8], environmental policy [4], financial engineering [2], and financial markets [7].
The second implementation assumes that the information comes from possible descriptions of the jointdistribution. Here, the ECT makes another questionable implicit assumption, being that it is normally verydifficult if not impossible to observe the joint distributions that characterize the uncertainties of a largenumber of optimization problems. However, in this implementation, the ECT does not use the multiplicityto create new implicit constraints, which provides the rationale for exploring solutions over the set Tinstead of confining the distribution to a single point.
A solution to the ECT paradox implies a philosophical approach to the sources of information (random
variables vs. meta-distributions). It is not possible to find a solution to the paradox in general. However,in specific cases, the structure of the information can determine a rationale that supports a particular im-plementation of the ECT.
5 Conclusions
The understanding of the ECT and the implications of ME are key in the formulation of stochasticproblems with an underspecified joint distribution. This paper revisited the ECT and explored the intuitionbehind it, with the intention to help improve optimization models under uncertainty. The examples and re-sults presented in this article provide an alternative rationale for the use of new approximation methods thatin some cases outperform the ME approximation [11]. Moreover, a clear understanding of the ECT helpsto identify situations where the use of ME could be appropriate according to the available information, andsituation where alternative approximation methods could provide a better performance.
Future research on this area should be along two main lines. The first would be in the area of episte-mology that analyzes problems related to the precedence of information and probability elicitation. Thesecond would be in the area of probability modeling, where based on the results of the different imple-mentations of the ECT, new approximations can be developed.
References[1] Ali E. Abbas. Entropy methods for joint distributions in decision analysis. IEEE Transactions on Engineering Management,
53(1):146–159, 2006.
[2] Umberto Cherubini, Elisa Luciano, and Walter Vecchiato. Order Statistics. John Wiley & Sons Ltd., West Sussex, England,2004.
[3] Thomas M. Cover and Joy A. Thomas. Elements of Information Theory. Wiley-Interscience, New York, NY, 1991.
[4] Jon C. Helton. Uncertainty and sensitivity analysis techniques for use in performance assessment for radioactive wastedisposal. Reliability Engineering and System Safety, 42:327–367, 1993.
[5] Edwin T. Jaynes. Prior probabilities. IEEE Transactions on Systems Science and Cybernetics, 4(3):227–241, 1968.
[6] Edwin T. Jaynes. On the rationale of maximum-entropy methods. Proceedings of the IEEE, 70(9):939–952, 1982.
[7] Roger Lowenstein. When Genius Failed: The Rise and Fall of Long-Term Capital Management. Random House, NewYork, NY, 2000.
[8] Hyeung-Sik J. Min, Walter Beyeler, Theresa Brown, Young Jun Son, and Albert T. Jones. Toward modeling and simulationof critical national infrastructure interdependencies. IEEE Transactions on Operations Engineering, 39:57–71, 2007.
[9] Luis V. Montiel. Approximations, Simulation, and Accuracy of Multivariate Discrete Probability Distributions in DecisionAnalysis. PhD thesis, The University of Texas at Austin, Austin, TX, 2012.
[10] Luis V. Montiel and J. Eric Bickel. A simulation-based approach to decision making with partial information. DecisionAnalysis, 9(4):329–347, 2012.
[11] Luis V. Montiel and J. Eric Bickel. Approximating joint probability distributions given partial information. DecisionAnalysis, 10(1):26–41, 2013.
[12] Luis V. Montiel and J. Eric Bickel. Generating a random collection of discrete joint probability distributions subject topartial information. Methodology and Computing in Applied Probability, 15(4):951–967, 2013.
[13] R. K. Sarin. An approach for long term forecasting with an application to solar electric energy. Management Science,25(6):543–554, 1979.
[14] Claude Elwood Shannon. A mathematical theory of communications. Bell System Technical Journal, 23(3):379–423,623–656, 1948.