the end of the “modern corporation”: deregulation and
TRANSCRIPT

The End of the “Modern Corporation”:
Deregulation and Ownership of Electric Utilities1
Patrick Bolton
Columbia University
and
Howard Rosenthal
New York University
December 2016
PRELIMINARY AND INCOMPLETE DRAFT
Abstract: Berle and Means (1932) claimed that “modern” corporations in the United States had diffuse ownership. Their claim characterizes regulated electric utilities until the mid-1990s. But following the 1992 EPACT deregulation, block ownership in utilities increased sharply, relative to a matched sample of non-utilities, which already had large blocks by the 90s. The post-EPACT blocks in utilities were not long-term investments by monitors but short duration speculative investments. With the financial crisis of 2008, large active investors are replaced by asset managers. In sum, dispersed ownership arose through the regulatory protections introduced in the 1930s and disappeared following their repeal.
1 We owe special thanks to Nicholas Beauchamp, Katrina Evtimova, Daniel Kangmin Ko, Umberto
Mignozzetti, Jin Nie, Peter Ryan, Becci Weiss, and Wei Xiong for superb research assistance. We are also grateful to Jas Sekhon and John Henderson for advice on matching. We thank Colin Mayer and Wei Jiang for their suggestions at early stages of our project. We are grateful to the following research centers at Columbia University for their financial support: the Center for Global Economic Governance, the Chazen Institute, the Institute for Social and Economic Research and Policy, and the Richman Center.

2
1. Introduction Ever since the publication of Berle and Means (1932) classic The Modern Corporation and
Private Property, ownership dispersion and the separation of ownership and control have been
core issues in the theory of the firm, corporate law, corporate finance, and politics. While
Berle and Means saw the advent of the modern corporation as a fundamental threat to
capitalism, with dispersed ownership undermining the efficient and responsible operation of
large corporations, others have argued that on the contrary dispersed ownership is the
culmination of capital market efficiency, a desirable and inevitable consequence of portfolio
diversification by risk-averse investors. According to this latter analysis, what had prevented
the full dispersion of ownership was the lack of legal protection of small shareholders.
Concentration of ownership was a necessary but inefficient response by shareholders to
protect their investments from expropriation actions by management. Once securities laws
protecting small shareholders were in place shareholders could safely diversify their holdings
(La Porta, Lopez-de-Silanes, Shleifer, and Vishny, 1998, or in short LLSV, 1998).
It is important to note, however, that Berle and Means’ empirical analysis of ownership
dispersion predates the passage of federal securities laws in 1933 and 1934, and although
their arguments about the dangers of the separation of ownership and control significantly
contributed to the future passage of legislation protecting small shareholders in publicly
traded companies, diffuse ownership was a reality even before the introduction of these
shareholder legal protections. One set of firms that displayed particularly dispersed
ownership before 1932 is firms in regulated industries, in particular AT&T.
In this paper we focus on regulated electric utilities, which for a long time have had the
reputation of being quintessential “widows and orphans” stocks. As Demsetz and Lehn
(1985) have suggested, monitoring by a regulator could be a substitute for monitoring by a
large shareholder, in which case one might expect to see more ownership dispersion in
regulated companies. Indeed, Holderness, Kroszner, and Sheehan (1999) find such evidence
in two cross-sections of US publicly traded firms, 1935 and 1995.
Interestingly, however, it turns out that how the company is regulated matters for ownership
dispersion. In a nutshell, we show that regulations that reduce operational risk, such as rate-
of-return regulation for electric utilities, do not offer sufficient protection to small
shareholders. It is only when regulations also reduce financial risk, in particular risk
associated with mergers and acquisitions, that we see substantial ownership dispersion. The
critical legislation that severely restricted electric utilities’ discretion to engage in financial
transaction is the Public Utilities Holding Company Act of 1935 (or PUHCA). There were
essentially no mergers during the entire period (1935-1992) in which PUHCA was intact and
throughout this period we see remarkably dispersed ownership.
Our empirical analysis begins with the repeal of key sections of PUHCA under the Energy
Policy Act of 1992 (or EPACT). Our leading hypothesis is that following the repeal of
PUHCA we should observe renewed concentration of ownership in electric utilities and
greater block ownership. If small shareholders are exposed to greater financial risk, we
should see a gradual erosion of ownership dispersion and more block ownership. We track
the evolution of block-ownership of nearly 100 utilities. Of these 65 were included in either
the S&P large-cap 500 or mid-cap 400 in 1992. We match these to 65 non-utilities and trace
the evolution of block ownership in the utilities relative to that of the matched sample from
1993 to 2012, relying on the beneficial ownership filings of publicly traded companies to the
SEC.
Our central finding is that although ownership concentration was much larger in the control
group of non-utilities in 1993, by 2012 ownership concentration in utilities had essentially
caught up with that of non-utilities. The change is shown in figure 3 which includes all large
blocks. Over 60% of utilities had no ownership block greater than 5% in 1993 against only
38% for non-utilities. Moreover, over 30% of non-utilities had total block-holdings
exceeding 20%, while the only such large ownership concentration in any utility was the
passive block in Duke Power and Light held by the Duke Charitable Trust. By 2012, the
transition of utilities’ ownership structures towards those seen for non-utilities is essentially
complete, and the distributions of ownership for utilities and non-utilities are nearly
identical, as can be seen in Figure 3. This catch-up effect of deregulation on ownership
concentration in electric utilities is strongly reflected in our highly significant difference-in-
difference Tobit regression estimates that reveal a 0.96 percentage point average addition per
year in ownership concentration in utilities relative to non-utilities.
We break ownership blocks down into “passive” and “non-passive” block categories, the
latter being blocks held directly by individuals or active funds and the former being
investments held by passive asset managers such as Vanguard or BlackRock. We ask whether
the increase in ownership concentration in electric utilities is primarily a phenomenon
explained by the growing ownership share and concentration of passive asset managers.
Interestingly, we find that before the financial crisis of 2007-2009 there was a sharp relative
increase in non-passive ownership concentration in utilities, but this trend reverses after the
financial crisis, and the continued increase in concentration in ownership in utilities is largely
explained by the growth of blocks held by passive owners (see figure 4). By 2012, non-
passive investors had exited from large block holdings in electric utilities. Average block

4
holdings of non-passive investors in utilities were barely higher in 2012 than in 1993. The
“modern corporation” of diffuse ownership by individuals was reborn as one of diffuse
ownership through indexed funds, ETFs, and other intermediated small block investments.
These findings support the view of Demsetz and Lehn (1985) and Holderness, Kroszner,
and Sheehan (1999) that monitoring by regulators is a substitute for block-holder
monitoring, and—as we have conjectured—that when the regulatory straightjacket is
loosened one should expect monitoring by large block-holders to appear. One important
caveat, however, is that part of the greater concentration of ownership in utilities we have
seen is simply due to the rise of large passive asset managers, who do not do much
monitoring.
In addition, a closer look at the effects of EPACT on ownership concentration reveals that
far from drawing in sustained monitoring and active governance of block-owners,
deregulation mainly resulted in extremely short duration investments by block-holders that
resemble speculative bets more than monitoring stakes. We compare the duration of the
longest held non-passive ownership block in utilities and non-utilities and find that holding
periods for utilities are significantly shorter than for non-utilities. The fraction of blocks with
holding periods no longer than two years is over 40% for utilities, while it is around 20% for
non-utilities, and the fraction of blocks held for more than sixteen years is less than 3% for
utilities, while it is over 20% for non-utilities. Our disaggregated difference-in-differences
regressions reveal that the average maximum holding period of blocks in utilities is 3.7 to 3.8
years shorter than in non-utilities, so that the increase in ownership concentration in utilities
does not appear to have induced a similar stable block-owner governance as seen in non-
utilities.
Besides comparing changes in ownership concentration in utilities relative to a matched
sample of non-utilities, we also compare changes in ownership concentration in utilities
operating in states that have deregulated post EPACT to those for utilities that are based in
states that did not deregulate their electricity industries. Following the passage of EPACT
twenty-two states and the District of Columbia restructured their electricity industry over a
five year period that begins in 1996 and ends after the California energy crisis in 2001, which
essentially stopped all further state deregulation actions in their tracks. Restructuring mostly
involved introducing competition in wholesale electricity markets and separation of utilities
into distributing and generating firms.
Exploiting this natural experiment, we are able to compare changes in ownership
concentration in utilities before and after deregulation across deregulated and non-
deregulated states. Although the differences are less pronounced than for those comparing
utilities to a matched sample of non-utilities, we find a significant positive effect on non-
passive ownership concentration in utilities in deregulated states.

A basic question with any natural experiment is whether the “treatment” is truly exogenous.
Could state deregulatory legislation be in any way the consequence of the build-up of
ownership blocks in utilities in deregulated states? To address this concern, we undertake an
instrumental variable analysis, using the level of electricity prices in a state, the political
affiliation of the governor of the state, and an interaction term to instrument deregulation.
In the first stage we perform a discrete time survival analysis using logit and find that states
with high electricity prices and Republican governors were significantly more likely to
deregulate. In the second stage we do both a two-stage least squares and a two-stage residual
inclusion estimation as first proposed by Hausman (1978) and learn that utilities in states
that are predicted to remain regulated have lower ownership concentration. That is, when we
compare the estimated coefficients for the deregulation explanatory variable for ownership
concentration in the difference-in-differences estimation, treating state deregulation as an
exogenous event, to the coefficient in the two-stage least squares estimation for the
predicted deregulation probability, we find that the former is smaller and statistically
insignificant, while the latter is strongly significant.
All in all, we find strong and robust evidence of the protective effects of electric utility
regulation for investors, explaining why regulated utilities stand out as quintessential widows
and orphan stocks, with the most dispersed ownership-structures of any publicly traded
companies. An important novel insight of our analysis is that not all regulations are equal.
Nearly all the states that undertook some form of restructuring of their electricity industries
continued to impose some form of rate-of-return regulation of electricity prices, thus largely
shielding investors from operational risks (an important exception is California). However,
restructuring exposed investors to substantial financial risk through mergers and acquisition
transactions.
Two notorious cases perfectly illustrate the extent of such risks for investors. One is the fate
of Montana Power & Light following deregulation of the Montana electricity industry in
1997. The CEO of Montana Power & Light quickly moved to transform the electric utility
into a dot-com company, selling its electricity generation operations and renaming the
company Touch America. What ensued is a sharp increase in electricity prices and the
collapse of Touch America after the dot-com bubble burst.2 The other is Portland General
Corporation, which was acquired by Enron in 1997 after Oregon moved to deregulate its
electricity industry. What followed is again a huge increase in electricity prices, the wipe-out
of shareholders after the collapse of Enron in 2002, and the loss of pension savings for
2See “How Big Sky Went Dark” by D. McNamer, New York Times April 6, 2008

6
Portland General employees.3 With Enron in bankruptcy, Portland General was put up for
sale. The Oregon Public Utility Commission rejected the sale of Portland General to the
only willing acquirer in 2002, the hedge fund Texas Pacific Group. It eventually emerged
from the Enron bankruptcy in 2006 as the independent electric utility Portland General
Electric Corporation.
It is primarily the emergence of this financial risk for investors that caused the transition
from dispersed to concentrated ownership. Indeed, as Anderson (1980) and Joskow (1989)
have pointed out, during the 1970s regulated utilities were exposed to substantial operational
risk as a result of the oil price shocks and rising concerns over the safety of nuclear power.
Yet, ownership dispersion barely changed over this period. One may infer from this
experience that monitoring and corporate governance have less to do with controlling
operational than financial risk.
Related literature. Since the publication of Berle and Means (1932) the ownership structure of
public corporations and its determinants have been the subject of continued theoretical
interest4 and of somewhat more episodic empirical scrutiny. The next major empirical
investigation of the extent of ownership dispersion of the 200 largest US corporations after
Berle and Means is by Larner (1966), who finds that the cross-section of 1963 exhibits
substantially more ownership dispersion than the cross-section of 1929, which was the focus
of Berle and Means. Demsetz and Lehn (1985) changes the focus of previous empirical
research by pointing out that that there is substantial heterogeneity in ownership
concentration across firms, and asking what determines why some firms have block-holders
and others not. Holderness and Sheehan (1988) focus exclusively on publicly traded firms
that have a majority owner (they identify over 650 such firms, representing roughly 5 percent
of all listed firms) and find that about half of these owners are individuals and the other
half are corporations. One of their novel findings is that controlling owners behave
differently depending on whether they are corporations or individuals.
One reason why empirical studies of ownership structures have been so sparse until recently,
is that systematic data on ownership of corporations was not easily obtainable. Until the
emergence of the SEC’s EDGAR system the hand-collection of ownership-block data
across many companies could be challenging. With the growing availability of detailed
datasets on ownership concentration, a more complex picture has emerged than the
sweeping Berle and Means representation of separation of ownership and control for most
publicly traded corporations. For instance, a surprising finding of the European Corporate
3See “Enron's Havoc Spills Over to a Utility in Oregon” by D.C. Johnston, New York Times February 2, 20024See Becht, Bolton and Roell (2007) for a survey of the theoretical literature.

Governance Network ( 1997) report, the first systematic exploration of the newly available
data on corporate ownership in Europe, was that, with the notable exception of the U.K.,
ownership of public companies was largely concentrated in European countries (see also
Becht and Mayer, 2001). Similarly, Holderness (2009) has shown that block-ownership is
widespread in a representative sample of 375 U.S. firms, and that ownership concentration in
the U.S. is similar to that found in other countries.
The new evidence of different corporate ownership patterns across countries prompted
LLSV (1998) to hypothesize that optimal diversification and ownership dispersion were
more likely to be attained if there were strong legal protections of small shareholders in
place. Although their study found evidence of a link between ownership dispersion and
minority shareholder rights, several studies have subsequently called their main finding into
question. In particular, in a much more detailed and comprehensive cross-country study than
LLSV (1998), using only firm-level observations, Holderness (2016) has shown that the
LLSV index of investor protection and other such measures are statistically insignificant.
Moreover, Spamann (2010) has found that the LLSV index of legal protection contains
multiple inaccuracies and that “[out] of forty-six countries, thirty-three required correction.
The correlation between the corrected and the original [index] is only 0.53.” He goes on to
show that the positive association between greater legal protection and ownership dispersion
does not hold with the corrected index. Franks, Mayer and Rossi (2008) have also shown that
the evolution towards ownership dispersion in the U.K. preceded the introduction of greater
legal minority owner protections, and was mostly caused by mergers and acquisitions.
The link between regulation and ownership dispersion has first been suggested by Demsetz
and Lehn (1985), and Holderness, Kroszner, and Sheehan (1999) have found supporting
evidence of this relation. The two most closely related studies to ours are by Kole and Lehn
(1999), who study the effects of airline deregulation on ownership concentration, executive
compensation and board composition, and Lehn (2002), who looks at the effects of
deregulation in the telecommunication industry. While the former study finds a shift towards
greater concentration in the airline industry following deregulation, the latter finds no such
shift in telecommunication firms.
Section 2 provides an overview of electric utility regulation and deregulation as well as a
description of utility ownership structures and governance before the passage of PUHCA in
1935, and following the enactment of PUHCA until its eventual partial repeal by the EPACT
of 1992. Section 3 describes the data. Section 4 analyzes the relative changes in ownership
concentration in electric utilities and a matched sample of non-utilities from 1993 to 2012.

8
Section 5 turns to an analysis of the differences in duration of block ownership in
respectively utilities and non-utilities. Section 6 analyzes the different evolution in ownership
concentration across utilities in respectively states that have restructured their electricity
industries and states that have not. Finally, Section 7 offers some concluding comments.
2. Governance of Public Electric Utilities: The Archetypal Berle and Means Corporations
The most extreme example of a corporation where ownership became separated from
control according to Berle and Means (1932) was AT&T, which had 642,180 shareholders in
1931, with the largest shareholder owning no more than 0.70% of stock. They explained that
“The date of appearance of [the semi-public corporation and the degree of its dominance
have in general varied with two factors, the public character of the activity in question and
the amount of fixed capital necessary to carry on the business. It came first in the fields of
public utilities, common carriers, banks and insurance companies.” [Berle and Means, 1932 p.
17]
Along with AT&T, public electric utilities also became archetypal Berle and Means
corporations in the wake of the Public Utility Holding Company Act (PUHCA) of 1935.
Indeed, the utilities quickly were seen as the quintessential widows and orphans stocks, offering
stable dividend income to their shareholders. As with AT&T, they were natural monopolies,
with a secure profit guaranteed by rate regulation. Their stable business models, combined
with regulatory oversight, gave small shareholders sufficient comfort to be willing to invest
in these corporations even though they had effectively no control over management.
Electricity markets experienced a long period of stability until the oil price shock of 1973.
However, with rising inflation, continuing volatility in oil markets, and rising costs of nuclear
power plants due to mounting safety concerns, the electricity regulatory framework inherited
from the Great Depression was under considerable stress in the 1970s and 1980s. In
particular, electricity rate increases petitioned by utilities to cover their rising costs of
electricity generation were the subject of heated political battles (Joskow, 1989).
As we explain below, while a natural monopoly position and rate regulation could dampen
operating risks for investors, this alone did not provide sufficient protections to widows and
orphans. It is the combination of low operating risk and low financial risk that made electric
utilities particularly attractive investments. Operating risk increased substantially with the

spike in energy prices in the 1980s. Some utilities responded by suspending or decreasing
their dividends (Anderson, 1980, pp. 22-23). But financial risk remained low in this period
and that, it turns out, was the determining factor for widows and orphans. The low financial
risk was not a given, but the outcome of PUHCA, which was designed to curb the excesses
of financial speculation that had occurred in the years leading up to the crash of 1929.
2.1 ArchetypalWidowsandOrphansStockspost‐PUHCA At the dawn of the deregulation era, beginning in the late 1970s, the electric power industry
was heavily regulated at both the state and federal levels of government. In addition to
electricity rate regulation by state commissions, introduced at the turn of the 20th century
(Anderson, 1980, pp. 4-16), PUHCA severely restricted electric utilities’ freedom to engage
in related activities and financial transactions such as mergers, acquisitions, and the creation
of wholly owned subsidiaries. Indeed, PUHCA’s central provision was the restriction
imposed on publicly traded investor-owned electric utilities (IOUs) to only two corporate
layers, a top holding company layer and a lower operating company layer. Moreover, electric
utility holding companies were banned from owning affiliates that were not geographically
contiguous or were non-utility businesses.
The passage of PUHCA essentially froze the electric power industry in place for over half a
century. By the end of the 1970s it comprised nearly 100 publicly traded IOUs out of a total
of about 280 IOUs. We found 97 electric utilities on the SEC’s Edgar system in 1993, which
marks the end of the PUHCA era. The typical publicly traded IOU only covered a portion
of a single state and was subject to the state’s public utility commission rate-of-return
regulation. Over this period merger and acquisition activity was virtually non-existent. The
private sector represented about 70 percent of the output of the industry. The remainder
fell to the federal government’s TVA, to hydroelectric production in the west, to some large
municipal utilities, including Los Angeles, Sacramento, Austin, and Seattle, and to nearly
3000 much smaller organizations that were either in the public sector or cooperatives (see
publicpower.org). Deregulation left the public sector untouched. A notable consequence is
that Los Angeles and Sacramento escaped the blackouts that infected most of California in
2000 and 2001.
These tight New Deal regulations, and the exceptionally long period of stable and falling
energy prices from the end of World War II to the first oil shock of 1973, go a long way in
explaining why electric utilities came to be perceived as particularly attractive stocks for
widows and orphans, and why their stock ownership was so widely dispersed. It is
remarkable that of the 86 publicly traded electric utilities for which we were able to obtain
10
the beneficial ownership SEC filings for 1978, there was only one instance of an active large
block investor. This was Richard Green, the president of Missouri Public Service, who with
his “associates” owned 16% of the company. In sum, 85 of 86 electric utilities had
completely diffuse ownership in 1978.5
The example of San Diego Gas & Electric, which remarkably included information on the
distribution of ownership by gender in its annual reports from 1982 through 1996, also
provides a striking illustration of the meaning of widows and orphans stocks for regulated
publicly traded utilities. Figure 1 compares the percentage held by men and women (with
fiduciary and trustee accounts not included). It can be seen that before the passage of the
Energy Policy Act (EPACT) in 1992, which paved the way for deregulation of the power
industry, female investors predominate. After 1992 there is a switch to males (the 1992 data
are for December 31, after the passage of EPACT), which we attribute to the fact that the
passage of EPACT was perceived as an increase in risk for investors, an increase that was
less appealing to female than to male investors.
2.2 Pre‐PUHCAIndustryStructureandGovernance:TheHoldingCompanyEra
The era preceding the passage of PUHCA provides a powerful illustration of the financial
risks investors in electric utilities could be vulnerable to. This era begins at the end of the
19th century, with electrification and the expansion of the electric power industry. In the early
years of electrification, investor-owned electric utilities were competing with municipal
owned operators. The combination of high fixed capital outlays, free entry, and unbridled
competition was a source of considerable uncertainty and pricing risk, which a number of
constituencies sought to reduce. As Anderson (1980, pp. 4-12) describes, the introduction of
regulation through the newly created state electricity and gas utility commissions was the
result of an unlikely political alliance between the investors in IOUs on the one hand and a
coalition of progressives, organized in the National Civic Federation, on the other. While the
latter sought to protect customers against the risk of excessively high electricity rates charged
by local monopolies, the former were eager to limit competition from municipal utilities.
Both wanted to avoid regulation by urban political machines. Following the early lead of
5 80 had no large blocks, 4 had blocks over 5% held by trustees of employee savings plans (Edison
International, PG&E, Sempra, and TNP Enterprises), and the Duke Charitable trust held 20% of Duke Power. The SEC’s Edgar database begins in 1993. Before 1993, we were only able to make a partial collection of data from microfiche and CDs in the Baker Library at the Harvard Business School, and from other sources. Consequently, we have data on fewer utilities in 1978 than in 1993. Although we make no further use of the pre-1993 data in this paper, the data will be included in the data spreadsheet that we will post online.

Wisconsin and New York, who first introduced state commissions to regulate electricity
markets, nearly two-thirds of the states passed similar legislation between 1907 and 1911
Although the state commissions dampened competition and protected customers against
“unfair” or “unreasonable” electricity rates, they did little to protect investors in electric
utilities against the financial risks associated with the subsequent expansion and
consolidation of the industry. If there is one name associated with the industry over this
period it is that of Samuel Insull, the president of Commonwealth Edison, who aggressively
pursued a policy of expansion and consolidation of smaller utilities, financing acquisitions
with preferred stock and bond issues, and in the process building a highly levered, complex,
and opaque pyramid of electric power companies. This expansion came to an abrupt end in
1932 with one of the most spectacular collapses of the Great Depression. In his account of
the rise and fall of the “House of Insull”, Skeel (2005) makes a fitting analogy with the 2002
corporate scandals of Enron and Tyco, companies that also built their spectacular growth on a
complex and opaque web of subsidiaries and acquisitions. The passage of PUHCA was a
direct response to the abuse of corporate pyramid structures by Samuel Insull and the
obfuscation of risk they epitomized. Today’s direct successor to Commonwealth Edison is
Exelon.
2.3 BacktotheFuture:Deregulation,PURPA1978,EPACTof1992.
The oil price shock of 1973 inevitably led to a reassessment of existing electricity generation
systems, and to calls for increased efficiency in electricity production and consumption.
Thus, a direct consequence of the quadrupling of oil prices between 1973 and 1974 was the
passage of the Public Utility Regulatory Policies Act of 1978 (PURPA), the first step in
federal deregulation of the electric power industry since PUHCA. PURPA required electric
utilities to purchase electricity from lower cost non-utility electricity producers (so called
Qualifying Facilities), and thus opening the way for the creation of a wholesale electricity
market.
PURPA’s goal of promoting greater efficiency in electricity generation took place in the
context of a broader economic debate on the structural inefficiencies caused by existing

12
rate-of-return regulations, which provided little incentive to minimize cost or limit
investment in excess generation capacity. This economic debate reinforced the growing
political appeals for wider deregulation and for greater reliance on market incentives. The
culmination of this wave of political support for deregulation was the passage of the Energy
Policy Act of 1992 (EPACT), which sought to deregulate electricity pricing and rely instead
on competition in wholesale and retail electricity markets.6 To help develop these markets
EPACT removed regulatory barriers to facilitate entry of independent power generators (so
called Exempt Wholesale Generators (EWGs), which were exempt from the restrictions
imposed by PUHCA on IOUs). Moreover, to help establish a level-playing field in the
emerging electricity markets EPACT allowed registered holding companies to acquire EWGs
even if they operated in geographically separate markets, thus further weakening the reach
of PUHCA. Problems with nuclear power may also have abetted deregulation. In 1988,
Public Service Company of New Hampshire was forced into bankruptcy from costs of the
Saybrook nuclear plant. This forced a rare interstate, albeit geographically adjacent, merger
as the New Hampshire firm was acquired by Northeast Utilities.
The passage of EPACT in 1992 opened the way for action by state governments, which had
ultimate jurisdiction over deregulation of utilities operating in their respective states. In other
words, although EPACT exempted wholesale generators from PUHCA and permitted
foreign ownership of US utilities or investments abroad by US utilities, it largely retained
states’ ability to regulate mergers and pricing of distributing utilities and the establishment
of wholesale generating plants within a state. In the following years many states initiated and
enacted restructuring legislation and by the end of the decade 22 states and the District of
Columbia had passed such legislation (see Figure 2).7 This movement towards electric utility
deregulation came to an abrupt halt following California’s electricity markets crisis in 2001.
Since then some states have reversed their deregulation steps (again see Figure 2) and all
other states that had not introduced any restructuring legislation by 2001 left their regulated
electricity sectors intact.
The long period during which PUHCA was enforced was a period of exceptional stability
for investors, who faced little operating and financial risk. This is why publicly traded IOUs
6 Thepoliticalsupportforallformsofmarketderegulationinthelastquarterofthetwentieth
centurywasoverwhelming.Inparticular,theconferencereportsonEPACTpassedwithonly8dissentingvotesintheSenateand60intheHouse.Evenfewervoteswererecordedagainstpassage.Source:thomas.loc.gov.
7 SeePublicUtilityHoldingCompanyActof1935:1935‐1992,DOE/EIA‐0563DistributionCategoryUC‐950(1993),andREPORTTOCONGRESSONCOMPETITIONINWHOLESALEANDRETAILMARKETSFORELECTRICENERGY(2005).
came to be seen as the quintessential widows and orphans stocks. The longer this stability of
the electric power industry was maintained the less the reasons for the enactment of
PUHCA were remembered, and the more the regulations limiting the scope of activities of
IOUs and their corporate structure came to be seen as unnecessary and cumbersome, so
much so that by the 1990s the SEC not only relaxed its enforcement of PUHCA but openly
advocated its repeal. However, the partial repeal of PUHCA following the passage of
EPACT brought back some of the financial risks and accounting obfuscations that PUHCA
sought to eliminate, and enabled energy companies such as Enron to take advantage of the
laxer regulations. Given the increased financial risks investors in electric utilities faced post
EPACT, it is to be expected that widows and orphans would migrate out of electric utility
stocks. Our gender evidence for San Diego Gas and Electric illustrates out-migration.
Restructuring meant a leap into uncertainty and financial risk. Investment in non-utility
businesses and interstate mergers further increased risk, even for utilities operating in non-
restructured states. Political uncertainty over restructuring policy and approval of mergers
was an additional source of risk.
This increase in risk indicates two hypotheses, both of which suggest that the quintessential
diffuse, Berle and Means, ownership would be replaced by the presence of large block
holdings. One hypothesis is that large blocks would be acquired by more activist
shareholders, who would have an incentive to monitor management more closely. These
activists would be long-term investors. The other is that the large blocks would be purely
speculative. These investors would be short-term, in and out. We next turn to a systematic
exploration of these hypotheses.
3. Data To test hypotheses on block holdings in electric utilities, we collected comprehensive annual
data from 1993 through 2012 on publicly held IOUs. This data was collected through the
SECs Edgar system. A large block was defined as any block of 5% or greater of common
stock reported as beneficial ownership. Block-holdings in electric utilities are likely to reflect
the impact of factors other than deregulation, most notably the development of large blocks
held by major asset managers, such as BlackRock and Vanguard, in the indexed mutual fund
and ETF markets. It was imperative, therefore, that we construct a matching sample of non-
electric utility firms to benchmark our results for electric utilities. We next describe how we
constructed our set of electric utilities and our matched sample of non-utility firms.

14
3.1 Sample of Electric Utilities. We assembled our sample of 97 investor-owned, publicly
traded, electric utilities in 1993 from various sources, including the list of companies posted
by FERC on its website (http://www.ferc.gov) in 2005 and later years, the list of investor-
owned electric companies posted on the Edison Electric Institute’s website
(http://www.eei.org), and 10-K filings on EDGAR. We then tracked mergers and
acquisitions of electric utilities from 1993 onwards from 10-K filings and by consulting the
filings of these transactions on the FERC website
(http://www.ferc.gov/industries/electric/gen-info/mergers). The M&A listings and
histories posted on company web sites allowed us to identify IOUs that existed in 1993 that
had ceased to exist by 2005 and were no longer identified in more contemporary online
listings.
3.2 Matching sample of non-utility companies. In matching, we considered all electric utilities that
were listed in either the S&P 500 or in the S&P midcap 400 index in 1992 (before the
passage of EPACT) or in the S&P 1500 for 1995.8 Our final match chose 65 non-utilities to
match 65 utilities that were in the S&P in 1992. We used the genetic matching algorithm
proposed by Diamond (2013) and identified non-utility companies that best matched our
utility companies along the following variables: i) total assets; ii) total debt in current
liabilities; iii) total long-term debt; iv) property, plant and equipment; v) earnings before
interest and taxes; vi) net income/loss; vii) capital expenditures; and, viii) number of
employees. We collected Compustat data from WRDS on these variables for the fiscal years
1991, 1992, 1994, and 1995. A primary criterion for variable inclusion was that there is no
missing data for utilities. We chose our final match using 1992 S&P membership because, i)
few firms were added using the small cap, ii) 1992 was pre-EPACT, and iii) there was missing
data on employees for some firms in 1994 and 1995.
We followed Holderness (2009) and hand-collected the block ownership data directly from
firms’ SEC filings. We have searched all DEF 14A filings for all the companies in our sample
for all the years from 1993 to 2012 during which these companies are listed.9 We coded
investors into groups that could be filtered in terms of large blocks that would not be active
monitors of management. Foremost among these were Employee Stock Ownership Plans
(ESOPs) or any other block containing the word “employee”. Second, large blocks held by
charitable trusts or foundations created by firm founders. The only such trust was the Duke
Charitable Trust in Duke Power and Light. Third, we created a category for commercial
8The 1995 lists allowed us to add a few utilities that were in the S&P small cap 600; S&P did not have a
small cap 600 in 1992.9IntheabsenceofblockownershipdatainDEF14As,wefurthersearched10‐Ks.

banks, since these were disabled by law from activism. Fourth, we identified large blocks held
by the largest institutional investors as of 2015. These were Vanguard, BlackRock, Barclays
(before the acquisition of Barclays Global Investors (BGI) by BlackRock), Fidelity, Capital
Research, Goldman Sachs, Prudential, BNY Mellon, J.P. Morgan Chase, Franklin Resources,
and Deutsche Bank. We also recoded affiliated entities under a single parent holding
company name. For example, “Fidelity” and “FMR” were recoded under a single name as
were “Vanguard” and “Vanguard Windsor”. In addition, while BNY Mellon and J.P. Morgan
Chase have commercial banking operations, we elected to group them with large institutional
investors.10
Tables 1A and 1B report summary statistics for utilities and non-utilities. The first table (1A)
provides the number of utilities and non-utilities in our sample for the years 1993, 2003 and
2012. In 1993, the first year of our sample period, there were 97 utilities and 63 non-
utilities.11 By 2012 the respective numbers of utilities and non-utilities has shrunk to 51 and
25 respectively. The decrease in the number of firms over this period is mostly due to
mergers, but some firms also disappear from our sample as a result of delistings following
acquisitions by private equity investors (TXU Corporation) or by non-electric utility firms
(Enron and Portland) or by foreign electric utility firms (Emera and Bangor Hydroelectric).12
Table 1A also reports the means and standard deviations of the sum of block-ownership
stakes (excluding employee stock ownership plans and ownership stakes held by banks). In
1993 non-utilities had much more concentrated ownership, with a mean total sum of block-
ownership stakes of 14.08% against 3.5% for utilities. By 2012 these ownership
concentration measures had grown to respectively 20.24% for non-utilities and 19.72% for
utilities. Statistical tests show no significant differences between utilities and non-utilities in
2012.
Table 1B provides the summary statistics of the matched utility and non-utility samples for
the year 1992 preceding the passage of EPACT. It reports the balance sheet entries we used
to do the matching of the 65 largest utilities and 65 non-utilities. For comparison it also
10A complete list of all large block investors in both the utility and non-utility samples is provided in an Excel
spreadsheet available at Google docs as https://docs.google.com/spreadsheets/d/16l5FLKr30TuRHmi62DBgIH_BMk0ZNAQhD5Iyy0yUj3c/edit?usp=sharing. The spreadsheet also shows how the names that appeared in SEC filings were recoded and gives the average percentage block size reported for the investor and the largest percentage block ever held by the investor.
11Two of the 65 non-utilities from the 1992 match no longer existed in 1993. 12 The Enron bankruptcy also gave rise to the one “birth” that occurs in our sample. The Portland General
Corporation, the utility in Portland, Oregon, was acquired by Enron in 1997. The utility assets are then spun off and removed from bankruptcy in 2006 as the Portland General Electric Corporation.

16
reports the balance sheet entries for the 762 non-matched, non-utilities.13 (A few firms
disappeared between 1992 and 1993. They are included in Table 1B but not in Table 1A.)
The 65 utilities and matched non-utilities are very similar, with mean total assets of
respectively 6.5 billion dollars for utilities and 6.3 billion dollars for non-utilities. The two
samples are also very similar in terms of their mean liabilities (current and long-term debt)
or mean reported earnings before interest. The main difference is in mean PP&E, which is
larger for utilities ($5.1 billion) than matched non-utilities ($3.9 billion). The matched non-
utilities, however, resemble the utilities far more closely than the non-matched, non-utilities
which have a mean PP&E of only $1.6 billion. Two other important differences are CAPX
and the number of employees. The mean CAPX of utilities was ($371 million), while for
matched non-utilities it was somewhat larger ($563 million). As for the mean number of
employees (thousands), it was 8,175 for utilities, and 13,974 for matched non-utilities, and
26,589 for non-matched, non-utilities, again a much larger difference. Overall, the matched
non-utilities are similar to utilities in terms of their size, the physical capital-intensive nature
of their operations, and their higher than average leverage.
In Table 1C, we report the distribution of SIC codes for our 65 S&P utilities, the 65 non-
utilities that were matched to them, and the 762 non-utilities that were in the S&P 900 for
1992 but not matched. The first part of the table looks at the first digit of the SIC code. All
our utilities have first-digit 4 as against only 46% of the matches and 7% of the non-
matches. None of the matches have codes 0, 3, or 8 (agriculture, mining, business services)
but 31% of the non-matches are in these three categories. Only one matched firm is in
financial services as against 14.3% of the non-matches.
The second part of the table looks at the second digit within the “4s”. All of the utilities are
49. Of the 30 matched firms in the 4s, only 13 are 49. These are predominantly natural gas
companies that do not have electric operations, such as Consolidated Natural Gas and
Williams. Waste Management is another matched 49. The non-matched firms are more
likely to be airlines or in communications. In sum, table 1B indicates that the matched firms
are similar to utilities, whereas the non-matched firms are quite different. Table 1C shows
that both matched and non-matched firms have SIC codes that are different from utilities.
Moreover, the non-matched firms’ SIC codes are not similar to the matched non-utilities.
Since the SIC code was not used by the matching algorithm, table 1C indicates that the
matching algorithm rather sharply distinguished the 65 matched firms from the 762 non-
13Because of missing data on some non-utilities in WRDS, our matching algorithm used only 892 of the 900
S&P firms.
matched firms. Lists of the 65 utilities and the 65 matched non-utilities are provided in the
Appendix.
4. The Return of Block-holding after EPACT 1992 Both historical precedent and economic theory indicate that after the passage of EPACT the
ownership structure of publicly traded electric utilities should be expected to undergo a
transition away from dispersed ownership towards more concentration and block ownership.
Indeed, as Berle and Means (1932) point out, ownership of electric utilities prior to the
passage of PUHCA in 1935 was concentrated in the hands of large block-holders. Not only
that, but by 1930 nearly all operating companies were controlled by only 19 holding
companies, under extremely opaque pyramidal structures, with further concentration of
control through interlocking boards of directors (Department of Energy Report
DOE/EIA-0563, 1993). So EPACT would be expected to return utilities to the large block
holding present before PUHCA. In addition, economic theory suggests that the passage of
EPACT would expose shareholders in electric utilities to greater financial risk, greater
regulatory risk, greater governance risk, and possibly greater operating risk, inducing small,
uninformed, passive investors to seek safer ground, and attracting wealthier, more
sophisticated, professional investors, with greater risk appetite, to an asset class that became
more dynamic as a result of deregulation.
We find compelling evidence of such a transition. To identify this transition in ownership
structure, we compare the evolution of ownership of electric utilities, the size distribution of
blocks over 5%, to the evolution of ownership in our matched sample of non-utilities from
1993 to 2012. A first set of observations indicating that such a transition has taken place is
given in Figure 3, which presents the distributions of total block ownership for respectively
all utilities and non-utilities in our sample for the years 1993, 2003 and 2012. As can be seen
in the two panels for 1993, while over 60% of utilities had no ownership block, only 38% of
non-utilities reported no ownership stake greater than 5%. In addition, essentially no utility
had total block ownership exceeding 20%, whereas over 30% of non-utilities were owned by
such concentrated block-holdings. Ten years later the block-ownership distribution for
utilities and non-utilities had markedly changed, as the panels for 2003 indicate, reflecting the
first effects of deregulation. Thus, the proportion of utilities with no ownership block had
dropped below 20%, which is more in line with the proportion of 15% of non-utilities with
no ownership block. And, the proportion of utilities with a total block ownership greater
than 20% increased to over 20%. Basically, both the distribution for utilities and non-utilities

18
exhibits a first-order stochastic shift to the right, with an apparent more pronounced shift
for utilities. In a few non-utilities in 2012, a majority of the shares were held by large blocks;
otherwise, the distributions for utilities and non-utilities look very similar by 2012, as the last
two panels indicate.14 Thus, based on this admittedly broad-brush analysis, it appears that by
2012 the transition of utilities’ ownership structures towards those seen for non-utilities is
nearly complete.
This is confirmed in Figure 4, which plots the mean total block share for utilities and non-
utilities. (To facilitate comparison with non-utilities, this figure, and all later results in the
paper, uses only utilities that were in the S&P 900 in 1992. The Appendix provides many
results for alternative data specifications that show robustness.) The left panel, which
includes all ownership blocks, clearly shows the transition from dispersed to concentrated
ownership for utilities. Mean block-holdings for non-utilities hovered around 20% from the
mid-1990s to 2012, with a dip around the financial crisis. In contrast, mean block-holdings
for utilities rose from 5% in the mid-1990s to nearly 20% by 2012. The right panel plots
mean total block shares after excluding what we refer to as “passive” blocks, namely ESOPS,
blocks held by a bank as custodian, the Duke trust, and blocks held by the largest asset
managers (see note 16), who are either implementing passive index or ETF-based investment
strategies for their owners, or remain passive in governance. Interestingly, while the mean
holdings (excluding these passive blocks) for non-utilities were around 10% over this period,
the mean block-holdings for utilities rose sharply until the beginning of the financial crisis
of 2007-2008, and thereafter significantly declined. A somewhat smaller decline is also
visible for non-utilities. Both declines reflect the fact that asset holdings are increasingly
concentrated in the hands of the largest asset managers after the financial crisis. The greater
decline for utilities reflects a larger retrenchment by smaller block-holders from the utility
sector than the non-utilities.
These aggregate findings for our utility and non-utility subsamples are strongly confirmed in
our disaggregated difference-in-difference regression analysis reported in Tables 2 and 3.
Table 2 and later results come from an unbalanced panel of firms×years. In Table 2 the
dependent variable is the sum of all ownership blocks above 5%. In the first regression, with
coefficients reported in column (1) we regress this total block share variable against a
dummy variable, Util, taking the value 1 if the firm is an electric utility, an initial time
variable, Year (=1 for 1993, =20 for 2012), a time trend variable for utilities only, the
14The largest total block size in 2012 was for a non-utility, Overseas Shipping, at 63.9, with the largest investor
being the Recanati family at 12.6%. Another family Fribourg, held 6.5%. These families held blocks in Overseas as far back as 1993.

interaction variable Util×Year, and a constant. We observe that utilities start out with a
substantially lower ownership concentration than non-utilities. The average total block share
for the non-utilities is 17.43% in 1993, 14.18 percentage points greater than the total block
share for non-utilities. However, this total block share for utilities rises by 0.573% points
each year (statistically significant at the 5% level).
One concern with the OLS regression is that the rising average ownership concentration in
utilities after 1993 may be driven by survivorship bias, as the number of utilities in our
sample declined from 97 in 1993 to 51 in 2012. To address this concern we run a regression
adding firm fixed effects. In this second regression, with coefficients reported in column (2)
the explanatory variables are Year and Util×Year. Given that we are adding firm fixed
effects we cannot include the dummy variable Util. The coefficient for the interaction term
Util×Year is almost unchanged (0.567 instead of 0.573).
Another concern with the OLS regression is that our ownership block observations are
censored below the 5% cutoff, the block size above which an SEC filing is required. We
therefore also estimate a Tobit model, with and without firm random effects. We set the
Tobit threshold at 4.99%, rather than zero, to reflect the 5% cutoff. The coefficients without
random effects are reported in column (3) and those for the random effects model are
reported in column (4). Again, the coefficient for Util is very significantly negative. Indeed
the predicted value for utilities in column (3) in 1993 is -4.28% (=15.59-19.87). This result
responds to the fact that two-thirds of the utility observations have no large blocks in 1993
and are censored. However, the total block share for utilities is estimated to rise much faster
under the Tobit regressions, with respectively 0.925% and 0.881% points added each year as
opposed to 0.573% with OLS. Moreover, the coefficients are statistically significant at the
1% level. Overall our finding that there is a catch-up in ownership concentration in utilities
following the passage of EPACT is highly robust to the specification of the estimated model
and the trend growth in ownership concentration is highly statistically significant.
As we have highlighted above, over the time-period of our sample a growing fraction of
shares is being held by larger and larger asset managers, such as Vanguard or BlackRock.
One may therefore wonder to what extent the increased concentration of ownership seen in
electric utilities is driven by the increased ownership of shares managed by larger and larger
asset managers. A first piece of evidence is provided in the second panel of Figure 4, which
plots mean total block shares, excluding the largest asset managers. Although the plot reveals
a steeper relative rise in non-passive ownership concentration, this trend appears to be
reversed post financial crisis. We explore this finding further in a similar difference-in-

20
difference regression analysis as above, but excluding passive blocks. The findings are
reported in Table 3.
Comparing the OLS regression results in Tables 2 and 3, the main changes in the OLS
regression are that average total block size obviously declines with the exclusion of passive
investors. In the OLS regression, it is 10.58% instead of 17.43% for non-utilities, and 1.83%
instead of 3.25% for utilities. More importantly, the interaction variable Util×Year is no
longer statistically significant. These findings suggest that the main factor behind the relative
rise in ownership concentration in electric utilities was the growing fraction of utility stocks
held by indexed funds, or ETFs of large asset managers, mainly BlackRock and Vanguard.
However, the Tobit regression results for non-passive ownership concentration are much
closer in line with those for total ownership concentration. In particular, the interaction
variable Util×Year is statistically significant at the 1% level for both dependent variables.
To provide some intuition on these results, we return to Figure 4. By 2008, average block
size had increased in non-utilities as well as utilities, but the increase is particularly sharp for
utilities. Then, with the financial crisis, there is a sharp decrease in block holding by active
investors in utilities. Figure 4 further shows that our modeling of the catch-up of utilities as
a simple time trend fails to capture the consequences of the financial crisis. We consider the
financial crisis in greater detail in a later section.
To summarize the more solid results of this section, the general effect of deregulation of
electric utilities on utilities’ ownership structure has been a trend away from dispersed
ownership to concentrated holdings of large blocks.
5. In-and-Out Block-holders The post EPACT increase in ownership concentration in utilities did not result in greater
shareholder monitoring by stable block-holders. The new blocks that appeared were more
likely to be short-term speculative investments.
This can be seen for example in the evolution of block-ownership of Northeast Utilities, as
shown in Figure 5. The figure plots the consecutive holding periods of block-owners in
Northeast Utilities over our sample period. As a comparison, we also plot the holding
periods of block-holders in a similar sized non-utility (as measured by their market
capitalization), Hess Corporation, in Figure 6.

While in Northeast Utilities only one block—Barrow, Hanley, Mewhinney & Strauss—
remained for seven years (the longest consecutive holding period), the Hess family held a
block in the Hess Corporation for the entire sample period (twenty years). Among the asset
managers, the longest consecutive holding periods in Hess are by Dodge & Cox (eight years),
T Rowe Price (seven years), and FMR (six years). This is in line with the holding periods of
Barrow, Hanley, Mewhinney & Strauss and Lord, Abbett & Co. in Northeast Utilities. This
comparison thus suggests a significant difference in share ownership patterns between Hess
and Northeast Utilities: while the latter had a controlling block throughout the sample
period, the former did not. Most of the other blocks in either firm are held by asset
managers for short periods of time (one to three years). The investment funds that hold for
longer periods (e.g. Barrow, Hanley, Mewhinney & Strauss and Lord and Dodge & Cox) are
value investors. None of these asset managers are likely to engage in corporate governance
as active monitors.
Is this difference in block-ownership dynamics mirrored across the entire sample of utilities
and non-utilities? We tackle this question by first undertaking a simple comparison of the
durations of block-ownership across utilities and non-utilities over our sample period. To
obtain as complete a picture of duration patterns as possible, we look at three measures of
duration. The most obvious measure is the number of consecutive years a block has been
held. This is what we define as “duration”. Given that our sample only contains block-
ownership data from 1993 to 2012, we do not always observe the initial year when a block
has been acquired, nor do we always observe the final year when a block has been unwound.
When a block has been acquired before 1993 we take 1993 as the initial year and when a
block is still held in 2012 we take 2012 as the final year. This means that we inevitably
underestimate duration of block ownership.
Another measurement issue arises as a result of the exit of firms from our sample before
2012, due to acquisition, transition to private equity, or bankruptcy. 15 Obviously, the year
when a firm exits is also the final year when a block can be held. The concern with early exit,
however, is that measured average duration differences across utilities and non-utilities may
be driven by different patterns of exit and not necessarily by differences in block-holding
behavior. Accordingly, we also break down our duration measure into both a “duration
forward” measure, looking at holding periods from a given year onwards, and a “duration
backwards” measure, looking at holding periods back in time from a given year.
15In a merger, we keep the acquirer or dominant firm and drop the target. For example, when Unicom and
Peco merged to form Exelon, Peco exits the sample. The specification of the sample is documented in the online Appendix.

22
Table 4 illustrates how the three measures are related by taking the example of Fidelity’s
ownership block in Hess Corporation. As Figure 6 illustrates, Fidelity was an intermittent
block owner of Hess stock over the twenty year period of our sample, first appearing as a
block-holder from 1993 to 1999, then again for only one year in 2005, and finally for two
years in 2007 and 2008. In the initial year—1993—duration and duration forward are
identical, reflecting the fact that our duration measure is initially an entirely forward looking
measure. In the final year of the first ownership spell—1999—duration and duration
backwards are identical, reflecting the fact that in the final year duration is an entirely
backward looking measure. At any time t the three measures are related as follows:
duration = duration forward + duration backwards – 1.
We are interested in persistent block ownership mainly because continuous ownership, as
was the case of the Hess family block in the Hess Corporation, is an indication of active
control and monitoring by concentrated owners in the firm. Accordingly, we also separate
out all passive blocks (in the form of ESOPs and other “employee” blocks, or blocks held
by large asset management firms such as BlackRock or Vanguard) and report separately
ownership durations for non-passive blocks.16,17 Finally, we only report maximum duration
of continuous block-ownership in each firm. Active control by concentrated owners may be
at work if at least one block-holder is engaged with the firm over the long term, even if
other block-holders only appear for brief periods of time. Again, the Hess Corporation is an
apt illustration: fourteen other block-holders appear next to the Hess family block over our
sample period, albeit for much shorter holding intervals. Based on what is known about their
business models, as well as their much shorter holding periods, these other block-holders are
unlikely to have exercised any significant form of control. Thus, in the case of Hess, mean
duration—the average of all the blocks’ consecutive holding periods—would clearly have
given a very distorted picture of governance by concentrated owners at Hess; certainly, a less
accurate description than maximum duration, which would be twenty years for the Hess
family block.
16 Specifically, we treat as large asset management firms Vanguard, BlackRock, Barclays, Capital Research,
Goldman Sachs, Prudential, J. P. Morgan Chase, Franklin Resources, and Deutsche Bank. While this specification could be changed, what matters is treating BlackRock and Vanguard as passive investors. They held blocks in far more firms and years than any other investors.
17 We also look at maximum and mean duration for all blocks and find a similar difference in duration dynamics for utilities and non-utilities as for non-passive blocks.

A first clear difference in duration of (maximum) block-holding periods across utilities and
non-utilities is reported in Figures 7 and 8, which plot the duration distribution of holding
periods across non-utilities and utilities that have survived until 2012. The advantage of
looking at only surviving firms is that we can suppress any differences in duration that are
due to differences in M&A activity across utilities and non-utilities. It is immediate to see
from Figure 7 that block-holding periods for utilities are indeed significantly shorter than for
non-utilities. First, the percent of holding periods that are less than or equal to two years is
over 30% for utilities, while it is less than 20% for non-utilities. Second, the percent of
holding periods that are longer than sixteen years is less than 3% for utilities, while it is
nearly 20% for non-utilities. These differences are even more pronounced when we exclude
all passive blocks. As Figure 8 reveals, the percent of non-passive holding periods that are
less than or equal to two years is over 50% for utilities, while it is just under 30% for non-
utilities, and the percent of non-passive holding periods that are longer than fourteen years
is 0% for utilities and nearly 20% for non-utilities.
To explore these differences in holding periods more systematically we turn next to a
regression analysis. Specifically, we run disaggregated difference-in-differences regressions
with our three measures of maximum duration—duration, duration forward, and duration
backwards per firm—as the dependent variables, against the independent variables, Util,
Yrsinsample, which gives the number of years a firm survives in our sample, Year,
Util×Year, Crisis, a dummy variable taking the value 1 for all the years post 2007, Crisis ×Util
an interaction variable of Util and Crisis, and a constant.
Table 5 reports the results for the entire sample. We observe first that all three duration
measures are significantly shorter for utilities than non-utilities. This is true when we look at
all blocks and when we exclude all passive blocks. All in all, the average maximum duration
of blocks in utilities is 3.7 to 3.8 years shorter than in non-utilities. The difference in
maximum backward duration, however, is somewhat smaller, with utilities having only a
roughly one year shorter maximum backward duration. This reflects the fact that the shorter
duration of holding periods of utilities is partly driven by the higher rate of exit of utilities
than non-utilities. Second, the high significance of the Yrsinsample variable is due to a
purely mechanical positive relation between duration of holding periods and the number of
years over which the holding period is measured. The same is true for the Year variable: we
should expect a positive trend in mean duration as more years are added. Interestingly, the
financial crisis does not appear to have had a significant effect on duration.

24
Table 6 reports the results for only those firms that survive during the entire sample period.
Again, the first striking observation is how much shorter average maximum duration is
among surviving utilities compared with non-utilities. Since we only look at surviving firms
we exclude the Yrsinsample variable, as this is by definition equal to 20 for all surviving
firms in 2012.
In sum, the increase in ownership concentration in utilities post EPACT has not resulted in
the emergence of the same stable block-owner governance seen in non-utilities. Rather,
utilities stand out for their fly-by-night block-owners, with over 40% of the blocks taking
ownership positions for less than two years, and no block-holders staying for the entire
twenty year period of our sample.
6. The Effects of State Restructuring Our analysis of the evolution of ownership structures in utilities and non-utilities post
EPACT so far does not explicitly take into account the fact that not all states initiated
deregulation/restructuring actions. The effects of deregulation on utilities’ ownership
structure are hence imprecisely captured when we compare all utilities to a sample of
matched non-utilities. Accordingly, in this section we restrict our sample to utilities only and
contrast the evolution of ownership concentration of utilities in states that have undertaken
steps to deregulate, to that of utilities in states that have kept the regulatory framework
before EPACT in place.
EPACT exempted wholesale generators from PUHCA. It permitted foreign ownership of
US utilities and allowed US utilities to invest abroad, but states retained veto powers over any
merger of a utility operating in the state. Although it largely retained states ability to veto
activities of utilities and wholesale siting within a state, it led to an environment more
favorable to inter-state mergers of electric utilities. Following the passage of EPACT some
states chose to “restructure” their electric utility industry. Restructuring generally meant
separating investor owned utilities into distributing firms and generating firms, so that
previously vertically-integrated utilities were forced to sell off their generating facilities. At
the same time, utilities could invest in generating capacity in states outside their service area
even though they were required to divest their wholesale operations within their service area.

Some form of (wholesale) price deregulation also took place18. There were important
differences in legislation across states with regard to regulation of generating firms, price
freezes for residential users, and the ability of distributors to contract with wholesalers.
Most notably, the California legislation offered opportunities for manipulation of the
wholesale market, which was alleged to have produced blackouts in 2000 and 2001 (and
which led to the criminal prosecution of some employees of Enron).19
We eschew differences in deregulatory legislation and simply use a dummy variable that turns
to one in the year a state passes restructuring legislation. Once restructuring legislation was
passed it remained to be implemented, which could result in a delay of several years. In
September 2010 the United States Energy Information Administration released detailed
histories of deregulation legislation and implementation in each state.20 We used these
histories to code deregulation dates. By the end of the decade following the passage of
EPACT, 22 states and the District of Columbia had initiated and enacted restructuring
legislation (see Figure 2), but after the California energy crisis essentially all further
restructuring initiatives were halted, with four states even reversing their earlier restructuring
actions. More specifically, while no state had deregulated their electric utility industry before
1996, six states deregulated in 1996 and by 1999, twenty-one states have deregulated. The
number of deregulated states peaks at 22 in 2000, does not change in 2001 and then has
declined to 15 by 2007.
In undertaking a difference-in-difference analysis across “deregulated” and “non-
deregulated” states a first question that immediately arises is how we determine the year in
which deregulation is effective? The effects of deregulation on the operation of utilities are
only borne once the new legislation has been implemented. However, the effects of
deregulation on ownership structure could be seen as soon as deregulation is expected to be
enacted. Arguably, large block investments would be triggered by passage rather than
implementation. Therefore we use two dates to track the regulation status of a state. The
date when deregulation legislation is enacted, and the date when it is implemented. Table 5
below illustrates the coding of our state regulation variables for the state of California.
18To protect consumers from sharp increases in electricity prices following restructuring, retail prices generally
remained regulated for several years following deregulation or were not deregulated at all. 19 See Rebecca Smith and John R. Wilke, “Top Trader for Enron Admits to Fraud in California” Wall Street
Journal, Oct. 18, 2002.20http://www.eia.gov/electricity/policies/restructuring/restructure_elect.html.

26
California first passed deregulation legislation in 1996 and reregulated in 2003. Therefore we
code California as a deregulated state from 1996 to 2003. Our dummy variable Reg
accordingly takes the value 1 for all California-based utilities in years 1993 to 1995 and 2004
to 2012. All other years it takes the value 0. California first implemented its new regulations
in 1998 and it suspended the new regulations in 2001 in response to the energy crisis. Since
then it has reregulated its electric utilities. Thus, the dummy variable Regimp takes the value
1 first in years 1993 to 1997 and again in years 2001 to 2012. All other years it takes the value
0. Note that Regimp denotes regulation not implemented. After some exploratory analysis in
defining deregulation by the implementation year, we decided to focus on the passage year.
In Table 8 we report the results of Tobit regressions for our sample of electric utilities,
where the dependent variable is the sum of all ownership blocks greater than 5% and the
independent variables are respectively Reg and Regimp along with the other explanatory
variables used in the previous specification, when we compared ownership concentration in
utilities and a matched sample of non-utilities. In the first two specifications, respectively
with and without firm random effects, reported in columns (1) and (2) we regress the total
of all blocks against a dummy variable, Reg, Year, a time trend variable for utilities that are in
regulated states, Reg×Year (the interaction of Reg and Year), Crisis, Crisisreg, an interaction
variable of Reg and Crisis, and a constant. Although the coefficient for Reg has the right
sign and indicates that utilities in regulated states have a lower ownership concentration than
utilities in deregulated states, it is not significant. The only coefficient that is highly
significant is the trend variable—Year—which suggests that ownership concentration for
utilities in regulated states is steadily rising over our sample period.
The next two specifications, reported in columns (3) and (4) are identical to those in
columns (1) and (2), except that the dependent variable is now the total of all non-passive
blocks. This is the more meaningful ownership concentration measure from a corporate
governance perspective. Interestingly, the coefficients for Reg are now statistically significant,
at respectively the 10% (for the Tobit without random effects) and 1% levels. What is more,
non-passive ownership concentration is much lower for utilities in regulated than in
deregulated states. Another striking difference is with respect to the effects of the financial
crisis on ownership concentration. While the financial crisis has had no significant effect on
the concentration of ownership, all blocks included, it has resulted in a substantial across-

the-board retrenchment of non-passive block-holders. In other words, following the
financial crisis passive ownership concentration increased, but the active owners sought to
reduce their exposure to under-diversified, idiosyncratic, risk associated with electric utility
block-ownership. They reduced their exposure in utilities in both regulated and deregulated
states, as the non-significance of the interaction variable Crisreg reveals.
Columns (5), (6), (7) and (8) report the results for essentially the same Tobit regressions as in
the first four columns, the difference being that we treat a state as a deregulated state only
after restructuring legislation has been implemented. In other words, we replace the
explanatory variable Reg with the dummy variable Regimp. The interaction term between
Regimp and Year is Regimp. As a comparison of the coefficients reveals, the broad findings
that non-passive ownership concentration in electric utilities increases in deregulated states,
and non-passive ownership declines in the years following the financial crisis, are robust to
the change in treatment dates of the states from the years when deregulation legislation is
passed to the years when deregulation legislation is implemented.
Instrumental Variables Analysis. We next turn to an instrumental variables analysis of state
deregulation. A state may be more likely to deregulate the more inefficient its electric utility
sector is and the more politically disposed towards deregulation the state is. One measure of
inefficiency is how high electricity prices are under regulation. If a state has exceptionally
high residential, commercial, or industrial, electricity prices this could be a reason for this
state to seek to implement efficiency improvements by restructuring its electric utility
industry. A state may also be quicker to implement deregulation if there is sufficient political
support for restructuring in the state. Although a number of interest groups such as
“Americans for Affordable Electricity” (AAE) formed post EPACT to lobby the state PUCs
and state legislatures in favor of deregulation they also faced opposition typically from the
state electric utility incumbents. Our econometric analysis shows that having a Republican or
Independent governor was nearly a necessary condition for the passage of restructuring
legislation (see Figure 9). Republican governors, however, were faced with one or more
houses of the state legislature controlled by Democrats. Inevitably, restructuring legislation
reflected political bargaining.

28
Accordingly, to develop instruments for whether a state undertakes deregulation, we use the
level of electricity prices in the state, and the political affiliation of the governor.
First stage estimation. We undertake a two-stage estimation, where we perform a discrete time
survival analysis using logit, following Jenkins (1995), in the first-stage. Given that no state
deregulates before 1996 and that deregulation comes to an end following the California
energy crisis in 2000, we only estimate the logit for the years 1996 to 2000. More specifically,
we adopt the position that deregulation represents a “death” and the probability of death
before 1996 is zero. States that have not died by 2000, survive, thanks to the California
fiasco, forever. Death, however, is irreversible, so a state is dropped from the logit panel
once it deregulates. We also drop the state of Alaska since there were no investor-owned
utilities to restructure in that state, as all electricity is produced by cooperatives. However,
we included the District of Columbia. Although we have potentially 250=50x5 observations
in our data, our logits are based on only 199 observations since we drop observations in
years after restructuring legislation is passed.
Our logit analysis uses two independent variables and their interaction. One independent
variable is Governor Republican (we treat independent governors as Republican; this
concerns only four observations, Maine in 1996 and 1997, when restructuring passed, and
Minnesota in 1999 and 2000). In the District of Columbia, the Public Utilities Commission
is appointed by the mayor, who was a Democrat. We treat the mayor as the governor. We
also have data on control of state legislatures. We did not find important systematic effects
for legislative control. Undoubtedly our relatively small panel of 50 “states” makes it
difficult to find small effects.
The other independent variable is the Industrial Price (in cents per kwh) of electricity, as
found on the FERC website. These prices correlate with commercial and residential prices in
our cross-section at 0.89 or better in the five years 1996-2000. We chose industrial prices
because industrial users appear to have been major proponents of restructuring. There is
little year-to-year variation in the cross-sectional correlation of industrial prices. For 1996-
2000, the lowest pairwise correlation is greater than 0.97. We did not make inflation
adjustments to prices. There is little temporal variation in price during our sample period.
The mean price is 4.92 in 1996, drops to 4.72 in 1999, and jumps up to 4.96 in 2000. This

means that any time-varying dynamics in our logit model will come mainly from the
governor variable. Seven states had a gubernatorial transition in our sample. (Three other
states had a transition in 1996-2000, but subsequent to “death” by restructuring.)
Subsequent to the California black outs, seven states went back on restructuring. In some
cases, restructuring was never implemented before being “repealed.” States that went back
on restructuring included California and Nevada in 2001, Montana in 2002, Arkansas and
New Mexico in 2003, Arizona in 2004, and Virginia in 2007. These turn-backs over seven
years are too sparse for analysis. Moreover, it is unlikely that they were promoted by outside
block-holders; rather they would be more likely to be promoted by the management of
utilities as in Virginia21.
To summarize, our logit regression estimates the probability that the status of a state
switches from regulated to permanently deregulated in any given year as a function of
Industrial Price, the variable that designates average industrial electricity prices charged by
utilities in the state, Governor Republican, a dummy variable taking the value 1 if the
governor of the state is a Republican or an Independent, an interaction variable, Industrial
Price × governor, and year fixed effects Year 1997, Year 1998, Year 1999, Year 2000:
Prob (Deregulationi,t = 1) = L (constant + β×Industrial Price,t +γ×Governor Republicani,t
+η×Industrial Price × governor i,t+ Σψt×Yeart),
where L(.) denotes the logistic cumulative distribution function.
Table 9 reports the results of this logit regression. The coefficient on the interaction variable
Industrial Price × governor is positive and statistically significant, indicating that states with
Republican governors and high electricity prices were more likely to deregulate. High
electricity prices by themselves, however, do not explain a move towards deregulation, as the
coefficient on Industrial Price is statistically insignificant. The coefficient on Republican
Governor is negative and statistically significant. The reason why the coefficient is negative is
21Seehttp://www.eia.gov/electricity/policies/restructuring/virginia.html.

30
that when a state has very low electricity prices and a Democratic governor the probability
of deregulation is close to zero. This can be seen more clearly in Figure 9, which plots the
estimated probability of deregulation under respectively a Republican and Democratic
governor as a function of electricity prices. Note also that the coefficient for Year 1999 is
positive and statistically significant, indicating that a significantly larger number of states
deregulated in 1999. Finally, the constant coefficient is -2.961, indicating that the
unconditional probability of deregulation is less than 0.5. These results are robust to
estimation dropping the District of Columbia as well as Alaska and to dropping, in addition,
all 7 states that abandoned or did not follow through on restructuring (see Appendix).
Second stage estimation. In the second stage we perform both a standard two-stage least squares
(2SLS) and a two-stage residual inclusion (2SRI) estimation as first proposed by Hausman
(1978). The reason why we perform a 2SRI estimation is that our first stage regression is a
non-linear model. With a first-stage non-linear model the second stage 2SLS is generally not
statistically consistent, while the 2SRI estimator is (see, Terza, Basu and Rathouz, 2008). For
the second-stage 2SLS, random effects Tobit, we use the logit predicted probability of
restructuring from the first stage, a variable denoted by Twostage, as an instrument, but only
for the years 1996-2000, excluding the years following restructuring. For example, in
California, the predicted probability would not be included for 1997-2000, as restructuring
has already occurred in 1996 (see table 4). As for the 2SRI random effects Tobit, we use the
Residual from the logit in the same years. This Residual is the actual deregulation response
minus the estimated probability, or in other words one minus the predicted probability for a
restructured state and just minus the predicted probability for a non-restructured state. In
years before 1996 and after 2000, we use the actual value of the deregulated dummy. For the
seven states that went back on restructuring, we investigate the sensitivity of the estimates to
switching off the dummy as against keeping it on throughout the block holding sample
period that ends in 2012. Finally, we have firm-year observations for block-holdings whereas
our observations in the logit are state-year. Therefore, we merge the regulation dummy, the
instrument, and the residuals to firms using the primary state of operation of the firm.
To summarize, the second-stage random effects Tobit specifications for respectively 2SLS
and 2RI are:

Block-holdingsi,t = Constant + ζ*Twostagei,t + λ*Year + μ*Reg×Yeari,t + θ*Crisisi,t +
φ*Crisisregi,t + εi,t,
and,
Block-holdingsi,t = Constant + ζ*Regi,t + ν*Residual i,t + λ*Year + μ*Reg×Year + θ*Crisis +
φ*Crisisreg + εi,t,
where Twostage is the predicted probability for Reg from the first stage estimation and
Residual is the residual from the first-stage.
The results of the second stage are reported in Table 10. In the specification reported in the
first column we regress the total of all blocks against the predicted probability of not
restructuring (Twostage), Year, Reg×Year, Crisis, Crisisreg, and a constant. The coefficient
for Twostage is statistically significant and has the right sign. It indicates that utilities in
regulated states have a lower ownership concentration than utilities in regulated states. In the
second specification reported in the second column we again regress the total of all blocks,
but now against Reg, the dummy variable taking the value 1 when a state remains regulated
and Residuals, the residuals from the first-stage logit. The other variables are the same as in
the first specification. Again, the coefficient for Reg is statistically significant and of the right
sign. In fact, the estimated decrease in ownership concentration is nearly the same under
both specifications. Comparing the significance and size of the coefficients for Twostage or
Reg in Table 10 to the significance and size of the coefficient for Reg in column 2 of Table
8, we observe that the effect of deregulation on ownership concentration using all blocks is
not only much lower but is also statistically insignificant when we do not control for the
endogeneity of a state’s decision to deregulate. The interpretation of the 2SLS or 2SRI
results could be either that prospective large block-holders in electric utilities are able to
lobby and influence a state’s decision to deregulate, or that large investors’ expectations on
the likelihood of deregulation are affected by the level of electricity prices and the political
affiliation of the state governor.
The next two specifications reported in the third and fourth columns are the same as in the
first two columns except that the independent variable is the total of all non-passive blocks.
Again, the coefficients for respectively Twostage and Reg are statistically significant and of

32
the right sign. The magnitude of the decrease in ownership concentration in states that
remain regulated is slightly larger. Interestingly, the 2SLS and 2SRI results are not that
different from the results for Reg in column 4 in Table 8. This suggests that non-passive
block-holders actions were mostly responses to deregulation and its implementation and
were not significantly driven by expectations of deregulation before deregulation was actually
introduced.
7. Conclusion We have shown how the deregulation of electricity in the 1990s and the repeal of PUHCA
have resulted in a greater concentration of ownership in publicly traded electric utilities. So
much so that by 2007 the average fraction of non-passive shares held by block-holders in
electric utilities had reached the same level as in a matched sample of non-utilities
comprising mostly industrial and energy companies. This is not to say, however, that the
greater concentration reflected the substitution of monitoring by block-holders for that of
regulators. Rather, the replacement of widows and orphans by block-holders in electric
utilities seems to reflect opportunistic investments or speculative motives more than
stewardship and monitoring by a committed owner. This is indeed how Enron characterized
its acquisition of Portland General: “[We] got involved in Portland General Electric to better
understand the utility market, as it appeared there would be opportunities in an environment
of deregulation.”22
An important inference of our analysis is the critical role of PUHCA in protecting investors
by severely constraining utilities’ discretion to engage in risky financial transactions. This
more than the regulatory protections against operational risks seems to have mattered for
shareholders. Once EPACT repealed key parts of PUHCA the electricity industry again
became a high stakes financial arena as in the days of Samuel Insull and Commonwealth
Edison. But after the California energy crisis broke out and the collapse of Enron, political
support for further dismantlement of vertically integrated utilities through electricity
22A quote from “Enron's Havoc Spills Over to a Utility in Oregon” by D.C. Johnston, New York Times
February 2, 2002
industry restructuring vanished. On the other hand, opportunities for interstate mergers and
acquisitions remained.
Further research is called for into the observed exit of non-passive investors from electric
utilities following the financial crisis. One possibility is that the exit was a response to
liquidity needs and retrenchment from idiosyncratic risk exposure. Another is that merger
and acquisition opportunities were non-existent in the aftermath of the crisis. Additional
research might also investigate how block holdings are related to merger and acquisition
activity and track the behavior of specific large investors over time and across firms.
The economic case for electricity deregulation was to achieve greater cost efficiency, to
introduce incentives for capacity expansion, and—through competition—to bring about
lower electricity prices for both consumers and industry (Joskow, 1989). One largely
unanticipated effect of deregulation by economists and other commentators, however, was
the increase in financial risk investors were exposed to, and thereby the potential increase in
the cost of capital for utilities. With a higher cost of capital it is no longer obvious that
deregulation will bring about more capacity expansion. Moreover, as the California energy
crisis powerfully illustrated, competition in wholesale markets, far from inducing capacity
expansion, may actually give rise to the opposite incentives to profit from generation
capacity scarcity. A study of the larger US electric power market suggests that deregulation
has not led to lower prices (Borenstein and Bushnell, 2015). All in all, the wave of electricity
restructuring of the 1990s, while enabling some cost efficiencies, does not seem to have
benefited consumers in any significant way.

34
References Anderson, D. (1980) “State Regulation of Electric Utilities,” in The Politics of Regulation, J.Q. Wilson (ed.) Basic Books, New York, 3-41. Becht, M., P. Bolton and A. Roell (2007) “Corporate Law and Governance”, in The Handbook of Law and Economics, Vol. 2, A. M. Polinsky and S. Shavell (eds.), 829-944. Becht, M., and C. Mayer (2001), “Introduction”, in The Control of Corporate Europe, F. Barca and M. Becht, (eds.) Oxford University Press, Oxford, 1–45. Berle, A.A., and G. Means (1932), The Modern Corporation and Private Property, Macmillan, New York. Borenstein S. and J. Bushnell (2015) “The US Electricity Industry after 20 Years of Restructuring”, Annual Review of Economics 7: 437–63. Demsetz, H., and K. Lehn (1985), “The structure of corporate ownership: causes and consequences”, Journal of Political Economy 93:1155−77. Department of Energy Report (1993) “Public Utility Holding Company Act of 1935: 1935- 1992”, DOE/EIA- 0563. Distribution Category UC- 950 European Corporate Governance Network (1997), “The Separation of ownership and control: a survey of 7 European countries”, Preliminary Report to the European Commission (European Corporate Governance Network, Brussels). Franks, J. R., Mayer, C. and Rossi, S. (2009) “Ownership: Evolution and Regulation”, Review of Financial Studies 22(10): 4009-56. Hausman, J. A. (1978) “Specification tests in econometrics,” Econometrica 46: 1251–71. Holderness, C. G., R. S. Kroszner, and D. P. Sheehan (1999) “Were the Good Old Days That Good? Changes in Managerial Stock Ownership since the Great Depression.” Journal of Finance 54: 435-69. Holderness, C. G., and D. P. Sheehan (1988) “The Role of Majority Shareholders in Publicly Held Corporations.” Journal of Financial Economics 20: 317-46. Holderness, C. G. (2009) “The Myth of Diffuse Ownership in the United States” Review of Financial Studies 22 (4): 1377-1408. Holderness, C. G. (2016) “Problems Using Aggregate Data to Infer Individual Behavior: Evidence from Law, Finance, and Ownership Concentration” CriticalFinanceReview5:1–40.

Jenkins, S. P. (1995) “Easy Estimation Methods for Discrete-Time Duration Models”, Oxford Bulletin of Economics and Statistics 57:129-38. Joskow, P. L. (1989) “Regulatory Failure, Regulatory Reform, and Structural Change in the Electrical Power Industry,” Brookings Papers on Economic Activity: Microeconomics, pp. 125-99. Kole, S. R., and K. M. Lehn (1999) “Deregulation and the Adaptation of Governance Structure: The Case of the U.S. Airline Industry.” Journal of Financial Economics 52: 79-117. La Porta, R., F. Lopez-de-Silanes, A. Shleifer, and R. W. Vishny (1998) “Law and Finance”, Journal of Political Economy 106:1113–55. Larner, R.J. (1966), “Ownership and control in the 200 largest non-financial corporations, 1929–1963”, The American Economic Review 16:781-782. Lehn, K. M. (2002) “Corporate Governance in the Deregulated Telecommunications Industry: Lessons from the Airline Industry” Telecommunications Policy, 26: 225-242. Skeel, D., (2005) Icarus in the Boardroom, Oxford University Press. Spamann, H. (2010) “The “Anti-director Rights Index” Revisited”, Review of Financial Studies 23 (2): 467-486. Terza, J. V., A. Basu, and P. J. Rahouz (2008) “Two-stage residual inclusion estimation: Addressing endogeneity in health econometric modeling,” Journal of Health Economics 27: 531–543.

36
Table1.UtilitiesandMatchedNon‐Utilities:BasicDescription
A.MeanLargeBlockHoldingsinUtilitiesandMatchedNon‐UtilitiesforSelectedYears
This table reports the total sum of block-ownership stakes, 1993, 2003 and 2012. The decrease in the number of firms over time is due to either mergers, delistings, or bankruptcies. We computed the total percentage of common stock held in blocks of 5% or greater, as reported in firm reports of “Beneficial Ownership” for each firm-year. The match used S&P 900 large and mid-cap firms. There were 65 utilities in the S&P 900 in 1992. Of the 65 matched non-utilities, two no longer existed in 1993. The number of “all” utilities exceeds 65 because of utilities that were not in the 900. These small utilities were the most likely to no longer exist by 2003. In 1993, means for utilities were below 5% because most utilities had no block-holders.
1993 2003 2012
NumberofFirms
Mean S.D.NumberofFirms
Mean S.D.NumberofFirms
Mean S.D.
Utilities,All 97 3.50%
5..68% 66
10.38%
9.83% 51
19.72% 9.10%
UtilitiesinS&P900
64 3.80% 5.93%
46 10.62%
8.73%
38 18.59% 8.75%
Non‐Utilities
6314.08%
14.92%
3521.91%
15.20%
2520.24%
16.26%
t‐statistic,all
5.39(p‐value=0.000) 4.06(p‐value=0.000) 0.15(p‐value=0.440)
t‐statistic,S&Ponly
5.09(p‐value=0.000) 3.93(p‐value=0.000) 0.47(p‐value=0.321)
K‐Sp‐value,all
0.000 0.000 0.239
K‐Sp‐value,S&Ponly
0.000 0.000 0.499
Note:Thet‐statisticisfortwosampleswithunequalvariances.Thep‐valueisoneone‐tail.TheKomolgorov‐Smirnov(K‐S)testisthestandardtwo‐sampletest.
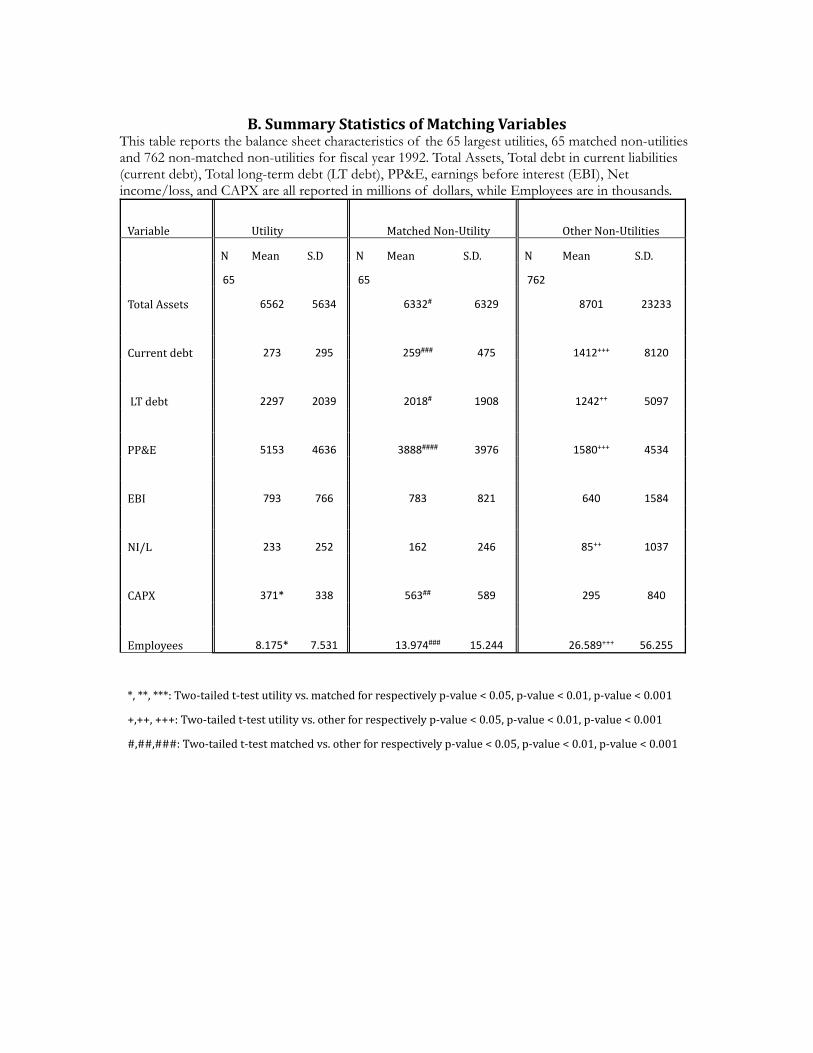
B.SummaryStatisticsofMatchingVariables
This table reports the balance sheet characteristics of the 65 largest utilities, 65 matched non-utilities and 762 non-matched non-utilities for fiscal year 1992. Total Assets, Total debt in current liabilities (current debt), Total long-term debt (LT debt), PP&E, earnings before interest (EBI), Net income/loss, and CAPX are all reported in millions of dollars, while Employees are in thousands.
Variable Utility MatchedNon‐Utility OtherNon‐Utilities
N Mean S.D N Mean S.D. N Mean S.D.
65 65 762
TotalAssets 6562 5634 6332# 6329 8701 23233
Currentdebt 273 295 259### 475 1412+++ 8120
LTdebt 2297 2039 2018# 1908 1242++ 5097
PP&E 5153 4636 3888#### 3976 1580+++ 4534
EBI 793 766 783 821 640 1584
NI/L 233 252 162 246 85++ 1037
CAPX 371* 338 563## 589 295 840
Employees 8.175* 7.531 13.974### 15.244 26.589+++ 56.255
*,**,***:Two‐tailedt‐testutilityvs.matchedforrespectivelyp‐value<0.05,p‐value<0.01,p‐value<0.001
+,++,+++:Two‐tailedt‐testutilityvs.otherforrespectivelyp‐value<0.05,p‐value<0.01,p‐value<0.001
#,##,###:Two‐tailedt‐testmatchedvs.otherforrespectivelyp‐value<0.05,p‐value<0.01,p‐value<0.001

38
C.DistributionofSICcodesforUtilities,MatchedNon‐Utilities,andotherS&P900Firms,1992
This table reports the distribution of matched and non-matched non-utilities across industries based on the first digit of their reported SIC code in 1992. All the 65 utilities are, not surprisingly, classified under SIC codes with first two digits 49. (The number of firms does not total 900 because of missing data for some non-utilities.) First digit of SIC code, Percentages
SIC Description Utility MatchedNon‐Utility
Non‐Matched Non‐Utility
0 Agriculture 0.0% 0.0% 0.3%
1 Mining, Construction 0.0% 12.3% 4.5%
2 Household Products 0.0% 33.8% 23.9%
3 Manufacturing 0.0% 0.0% 28.9%
4 Transport, Utilities 100.0% 46.2% 7.3%
5 Distribution 0.0% 1.5% 10.9%
6 Financial Services 0.0% 1.5% 14.3%
7 Services 0.0% 3.1% 7.2%
8 Business Services 0.0% 0.0% 2.2%
9 International 0.0% 1.5% 0.5%
Total Firms 65 65 762
Second digit of SIC code, Number of Firms with first digit 4
SIC Description Utility MatchedNon‐Utility
Non‐Matched Non‐Utility
40 Railroad Transportation 0 5 3
41 Passenger Transit 0 0 1
42 Motor Freight 0 0 3
43 USPS 0 0 0
44 Water Transportation 0 3 1
45 Transportation by Air 0 1 8
46 Pipelines not Gas 0 0 0
47 Transportation Services 0 1 1
48 Communications 0 7 24
49 Electric, Gas & Sanitary 65 13 15
Total Firms 65 30 56
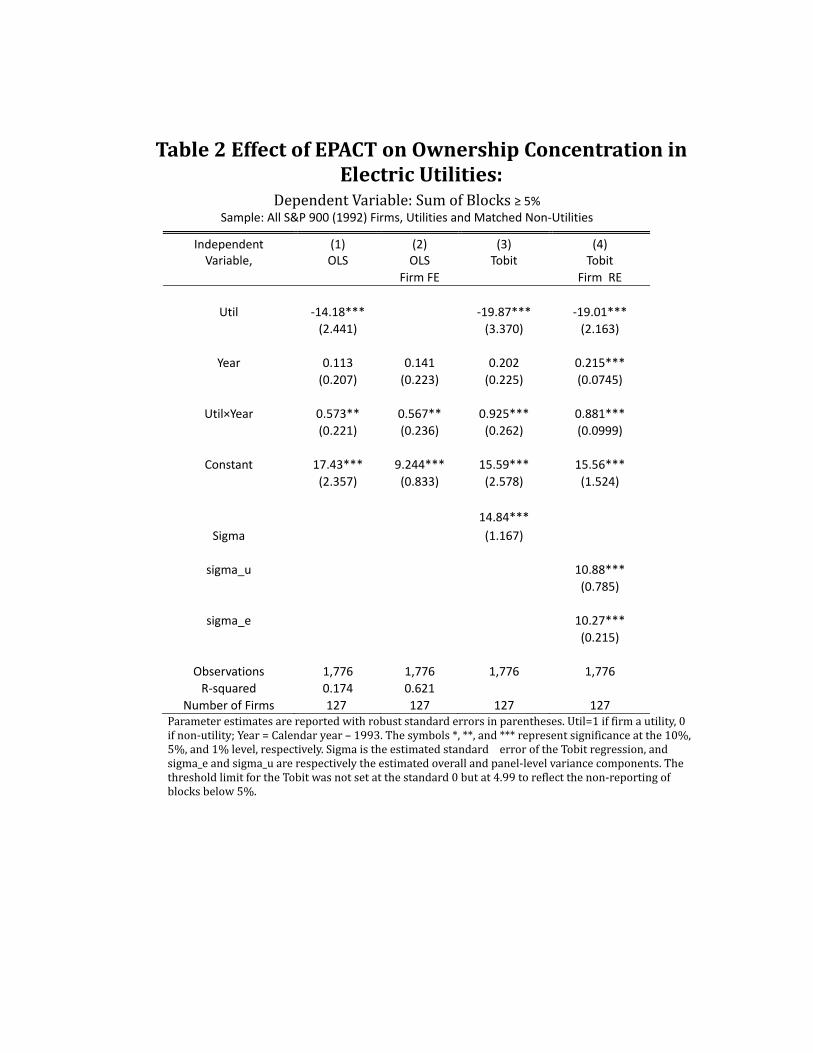
Table2EffectofEPACTonOwnershipConcentrationinElectricUtilities:
DependentVariable:SumofBlocks≥ 5% Sample: All S&P 900 (1992) Firms, Utilities and Matched Non‐Utilities
Parameterestimatesarereportedwithrobuststandarderrorsinparentheses.Util=1iffirmautility,0ifnon‐utility;Year=Calendaryear–1993.Thesymbols*,**,and***representsignificanceatthe10%,5%,and1%level,respectively.Sigmaistheestimatedstandard erroroftheTobitregression,andsigma_eandsigma_uarerespectivelytheestimatedoverallandpanel‐levelvariancecomponents.ThethresholdlimitfortheTobitwasnotsetatthestandard0butat4.99toreflectthenon‐reportingofblocksbelow5%.
Independent (1) (2) (3) (4) Variable, OLS OLS Tobit Tobit
Firm FE Firm RE
Util ‐14.18*** ‐19.87*** ‐19.01***
(2.441) (3.370) (2.163)
Year 0.113 0.141 0.202 0.215***
(0.207) (0.223) (0.225) (0.0745)
Util×Year 0.573** 0.567** 0.925*** 0.881***
(0.221) (0.236) (0.262) (0.0999)
Constant 17.43*** 9.244*** 15.59*** 15.56***
(2.357) (0.833) (2.578) (1.524)
Sigma
14.84***
(1.167)
sigma_u 10.88***
(0.785)
sigma_e 10.27***
(0.215)
Observations 1,776 1,776 1,776 1,776
R‐squared 0.174 0.621
Number of Firms 127 127 127 127

40
Table3:EffectofEPACTonNon‐PassiveOwnershipConcentrationinElectricUtilities
DependentVariable:SumofBlocks≥ 5% Sample: All S&P 900 (1992) Firms
Independent: (1) (2) (3) (4)
Variable OLS OLS Tobit Tobit
Firm FE Firm RE
Util ‐8.755*** ‐20.81*** ‐18.82***
(2.065) (4.575) (2.691)
Year ‐0.115 ‐0.0719 ‐0.116 ‐0.0880
(0.145) (0.120) (0.248) (0.0890)
Util×Year 0.234 0.191 0.630** 0.512***
(0.150) (0.127) (0.314) (0.130)
Constant 10.58*** 5.502*** 4.834* 5.730***
(2.033) (0.447) (2.637) (1.834)
Sigma 18.51***
(2.076)
sigma_u 13.02***
(1.016)
11.16***
sigma_e (0.335)
Observations 1,776 1,776 1,776 1,776
R‐squared 0.114 0.683
Number of Firms 127 127 127 127Non‐Passiveblocksareallblocksexceptblocksheldbybanksastrustees,ESOPs,theDuketrustandblocksheldbyBARCLAYS,FIDELITY,CAPITALRESEARCH,GOLDMANSACHS,PRUDENTIAL,BNYMELLON,J.P.MORGANCHASE,DEUTSCHEBANK,BLACKROCK,VANGUARD,AXAandFRANKLINRESOURCES.Parameterestimatesarereportedwithrobuststandarderrorsinparentheses.Thesymbols*,**,and***representsignificanceatthe10%,5%,and1%level,respectively.SigmaistheestimatedstandarderroroftheTobitregression,andsigma_eandsigma_uarerespectivelytheestimatedoverallandpanel‐levelvariancecomponents..Util=1iffirmautility,0ifnon‐utility;Year=Calendaryear–1993;.

Table4.DurationMeasuresforFidelityinHessCorp
Year Share Investor Initial Year Final Year Duration Duration Forward Duration Backwards
1993 0.1093 FMR Corp 1993 1999 7 7 1
1994 0.1362 FMR Corp 1993 1999 7 6 2
1995 0.1394 FMR Corp 1993 1999 7 5 3
1996 0.0787 FMR Corp 1993 1999 7 4 4
1997 0.063 FMR Corp 1993 1999 7 3 5
1998 0.1509 FMR Corp 1993 1999 7 2 6
1999 0.0853 FMR Corp 1993 1999 7 1 7
2005 0.0968 FMR Corp 2005 2005 1 1 1
2007 0.1104 FMR Corp 2007 2008 2 2 1
2008 0.0799 FMR Corp 2007 2008 2 1 2

42
Table5:MaximumDurationofBlockHoldingPeriods–AllFirms
All Blocks No Passive Blocks Independent Variables:
(1) Total
(2) Forward
(3)Backward
(4)Total
(5)Forward
(6) Backward
Util ‐3.755*** ‐3.299*** ‐0.958*** ‐3.858*** ‐3.319*** ‐1.118***
(0.689) (0.666) (0.226) (0.660) (0.653) (0.190)
Yrsinsample 0.221*** 0.201*** 0.025 0.154** 0.142*** 0.015
(0.047) (0.036) (0.017) (0.046) (0.036) (0.015)
Year 0.145* ‐0.158** 0.328*** 0.103* ‐0.132** 0.260***
(0.060) (0.048) (0.057) (0.043) (0.040) (0.056)
Util×Year 0.096 0.216*** ‐0.089 0.120 0.223*** ‐0.072
(0.083) (0.053) (0.066) (0.069) (0.042) (0.064)
Crisis ‐1.107* ‐0.643 ‐0.593 ‐0.201 0.027 ‐0.285
(0.555) (0.461) (0.500) (0.476) (0.339) (0.444)
Crisis ×Util ‐0.232 ‐0.618 0.291 ‐0.435 ‐0.769 0.315
(0.742) (0.641) (0.623) (0.666) (0.529) (0.538)
Constant 1.945*** 1.822*** 0.892** 1.870*** 1.736*** 0.814**
(0.540) (0.383) (0.288) (0.503) (0.361) (0.283)
Log‐like ‐7256.487 ‐6269.332 ‐6130.394 ‐7051.363 ‐6027.448 ‐5890.387
N 2418 2418 2418 2425 2425 2425
R2 0.163 0.138 0.239 0.160 0.127 0.220 ParameterestimatesareOLSestimateswithrobuststandarderrorsinparentheses(clusteredattheindividualfirmlevel).Thesymbols*,**,and***representsignificanceatthe10%,5%,and1%level,respectively.Util=1iffirmautility,0ifnon‐utility;Year=Calendaryear–1993;Crisis=1ifCalendarYear>1986.Util×YearandCrisis×Utilareinteractions.Yrsinsample=totalnumberofyearsfirmwasinthesample(maximum=20.)

Table6:DurationofBlockHoldingPeriods–SurvivingSAPFirms All Blocks No Passive Blocks Independent Variables:
(1) Total
(2)Forward
(3)Backward
(4)Total
(5)Forward
(6) Backward
Util ‐5.156*** ‐4.529*** ‐1.128** ‐5.535*** ‐4.770*** ‐1.444***
(1.259) (1.222) (0.329) (1.187) (1.172) (0.251)
Year 0.101 ‐0.213** 0.343*** 0.035 ‐0.196** 0.251***
(0.071) (0.072) (0.069) (0.046) (0.063) (0.066)
Util×Year 0.183 0.288** ‐0.078 0.235*** 0.318*** ‐0.051
(0.093) (0.085) (0.080) (0.064) (0.069) (0.074)
Crisis ‐1.193 ‐0.561 ‐0.811 0.132 0.300 ‐0.213
(0.634) (0.523) (0.455) (0.499) (0.319) (0.393)
Crisis ×Util ‐0.723 ‐0.945 0.132 ‐0.308 ‐1.039* ‐0.235
(0.849) (0.722) (0.612) (0.625) (0.504) (0.590)
Constant 7.298*** 6.711*** 1.450*** 5.860*** 5.390*** 1.246***
(1.090) (1.087) (0.259) (1.145) (1.145) (0.228)
Log‐like ‐5227.028 ‐4528.176 ‐4436.276 ‐4333.478 ‐3704.667 ‐3649.782
N 1420 1420 1420 1420 1420 1420
R2 0.115 0.129 0.205 0.135 0.132 0.195 ParameterestimatesareOLSestimateswithrobuststandarderrorsinparentheses(clusteredattheindividualfirmlevel).Thesymbols*,**,and***representsignificanceatthe10%,5%,and1%level,respectively.Util=1iffirmautility,0ifnon‐utility;Year=Calendaryear–1993;Crisis=1ifCalendarYear>1986.Util×YearandCrisis×Utilareinteractions.

44
Table7.CaliforniaDeregulationandReregulation
Year Status Status Law Status
Implementation Restructuring
Activity
Legislation
1993 Regulated Regulated Regulated No No
1994 Regulated Regulated Regulated Yes No
1995 Regulated Regulated Regulated Yes No
1996 Deregulated Regulated Regulated Yes Yes
1997 Deregulated Regulated Regulated Yes Yes
1998 Deregulated Deregulated Deregulated Yes No
1999 Deregulated Deregulated Deregulated Yes Yes
2000 Deregulated Deregulated Deregulated Yes Yes
2001 Regulated Reregulated Regulated Yes Yes
2002 Regulated Reregulated Regulated Yes Yes
2003 Regulated Reregulated Regulated No No
2004 Regulated Reregulated Regulated Yes Yes
2005 Regulated Reregulated Regulated No No
2006 Regulated Reregulated Regulated Yes No
2007 Regulated Reregulated Regulated No No
2008 Regulated Reregulated Regulated Yes No
2009 Regulated Reregulated Regulated No No
2010 Regulated Reregulated Regulated Yes No
2011 Regulated Reregulated Regulated No No
2012 Regulated Reregulated Regulated No No
Statusindicatesifagivenstatehasaregulatedorderegulatedutilitysystem.StatusLawindicatesifagivenstatehasregulated,deregulated,orreregulatedutilities.StatusImplementationindicatesifagivenstatehasimplementedthestaterestructuringlaw.RestructuringActivityindicatesifagivenstatehashadanyrestructuringactivity(laws,proposals,voting,etc.)inagivenyear.Legislationindicatesifagivenstatevotedanyrestructuringproposalinagivenyear.Source:http://www.eia.gov/electricity/policies/restructuring/index.html

Table8:EffectofStateDeregulationonOwnershipConcentrationinElectric
Utilities,1996‐2012 All Blocks No Passive Blocks All Blocks No Passive Blocks
(1) (2) (3) (4) (5) (6) (7) (8)
Firm RE Firm RE Firm RE Firm RE
Reg ‐0.556 ‐1.699 ‐6.468* ‐9.133***
(2.121) (1.370) (2.563) (1.582)
Regimp ‐1.699 ‐3.211 ‐8.040** ‐10.965***
(2.922) (1.809) (3.068) (2.069)
Year 1.110*** 1.002*** 0.522 0.222 0.903** 0.725*** 0.222 ‐0.152
(0.235) (0.139) (0.278) (0.153) (0.285) (0.175) (0.332) (0.199)
Reg×Year ‐0.215 ‐0.028 0.409 0.816***
(0.284) (0.159) (0.331) (0.182)
Imp×Year 0.097 0.327 0.790* 1.319***
(0.328) (0.190) (0.359) (0.222)
Crisis ‐1.578 ‐1.990 ‐6.631** ‐6.382*** ‐0.210 0.222 ‐4.863 ‐4.083*
(1.907) (1.384) (2.536) (1.605) (2.007) (1.553) (2.926) (1.841)
Crisisreg 1.261 1.002 ‐3.118 ‐3.739 ‐1.079 ‐1.865 ‐5.738 ‐7.259***
(2.323) (1.714) (2.946) (2.013) (2.373) (1.820) (3.221) (2.174)
Constant 0.323 1.142 ‐0.846 1.323 1.359 2.886 1.047 3.388
(2.050) (1.477) (2.376) (1.617) (2.836) (1.889) (3.086) (2.107)
Log‐like ‐3854.854 ‐3580.237 ‐2186.448 ‐1971.279 ‐3862.182 ‐3580.749 ‐2192.918 ‐1969.487
N 1452 1452 1452 1452 1452 1452 1452 1452
ThedummyvariablesRegandRegimpindicatewhetherastateisrespectivelystillregulatedandwhetheritstillhasnotimplementedanyapprovedderegulations.Parameterestimatesarereportedwithrobuststandarderrorsinparentheses(clusteredattheindividualfirmlevel).Crisisregisaninteractionterm,SigmaistheestimatedstandarderroroftheTobitregression,andsigma_eandsigma_uarerespectivelytheestimatedoverallandpanel‐levelvariancecomponents.Util=1iffirmautility,0ifnon‐utility;Year=Calendaryear–1993;Crisis=1ifCalendarYear>1986.Reg×YearandImp×Yearareinteractionterms.Modelvariancetermsnotshown.

46
Table9:FirstStageLogitregression:TheRoleofElectricityPricesandStateGovernorPoliticalAffiliationininducingStateDeregulation,1996‐2000
Independent Variable Coefficient
Industrial Price × governor 1.124***
(0.301)
Industrial Price ‐0.140
(0.176)
Governor Republican ‐4.360***
(1.587)
Year 1997 0.948
(0.855)
Year 1998 0.294
(0.884)
Year 1999 2.193***
(0.772)
Year 2000 0.957
(0.976)
Constant ‐2.961***
(1.073)
Observations 154 DependentVariable=1intheyearstatederegulates.Statedroppedfromsampleinlateryears.Industrialpriceisincentsperkwh.GovernorRepublican.is1ifgovernorisRepublicanorIndependent.ThetwoIndependentcasesareMaineandMinnesota.Thesymbol***representssignificanceatthe10%,5%,and1%level,respectively.Industrialprice×governorisaninteractionterm.The“Year”variablesareyeardummies.Themodelassumesthattheprobabilityofderegulationiszeroinyearspriorto1996andafter2000.

Table10:SecondStageof2SLSand2SRI:TheEffectofStateDeregulationonOwnershipConcentrationinElectricUtilities:RandomEffectsTobits,1996‐
2012
All Blocks No Passive Blocks
2SLS 2SRI 2SLS 2SRI
Twostage ‐6.428*** ‐10.378***
(1.830) (2.127)
Reg ‐6.368*** ‐10.510***
(1.846) (2.155)
Residual 3.261 3.644
(1.747) (1.988)
Year 0.793*** 0.807*** 0.059 0.075
(0.146) (0.147) (0.167) (0.167)
Reg×Year 0.436* 0.412* 0.858*** 0.824***
(0.187) (0.188) (0.217) (0.219)
Crisis ‐0.298 ‐0.419 ‐5.333** ‐5.474***
(1.371) (1.368) (1.633) (1.631)
Crisisreg ‐2.261 ‐2.061 ‐3.982 ‐3.690
(1.753) (1.752) (2.115) (2.115)
Constant 3.511* 3.451* 3.254 3.316
(1.633) (1.637) (1.825) (1.834)
sigma_u 7.986*** 7.974*** 8.250*** 8.237***
(0.713) (0.711) (0.833) (0.832)
sigma_e 7.037*** 7.036*** 7.014*** 7.002***
(0.184) (0.184) (0.263) (0.263)
Ll ‐3076.821 ‐3076.877 ‐1793.385 ‐1792.843
N 1164 1164 1164 1164 ThedummyvariableRegindicateswhetherastateisstillregulateds.Reg×residistheinteractionofRegandthefirststageresidual.Twostageisthepredictedprobabilityastatestaysregulatedinthefirststageregression(Table9).Parameterestimatesarereportedwithrobuststandarderrorsinparentheses(clusteredattheindividualfirmlevel).Crisisregisaninteractionterm.Util=1iffirmautility,0ifnon‐utility;Year=Calendaryear–1993;Crisis=1ifCalendarYear>1986.

48
Figure 1: Percentage of San Diego Gas and Electric Shareholders by Sex
Source: San Diego Gas and Electric annual reports.

Figure2.StateRestructuringofElectricUtilities.

50
Figure3.DistributionofTotalBlockOwnershipforSAP900(1992)Utilities
andMatchedNon‐UtilitiesfortheYears1993,2003and2012
Note:Eachbinrepresentsa5%width.Becausethesmallestlargeblockis5%,thefirstbincontainsthefractionoffirmswithnolargeblocks.Theoneutilitywithtotalblocksgreaterthan20%in1993wasDukePower,wheretherewasasinglelargepassiveinvestor,theDukeCharitableEndowment.
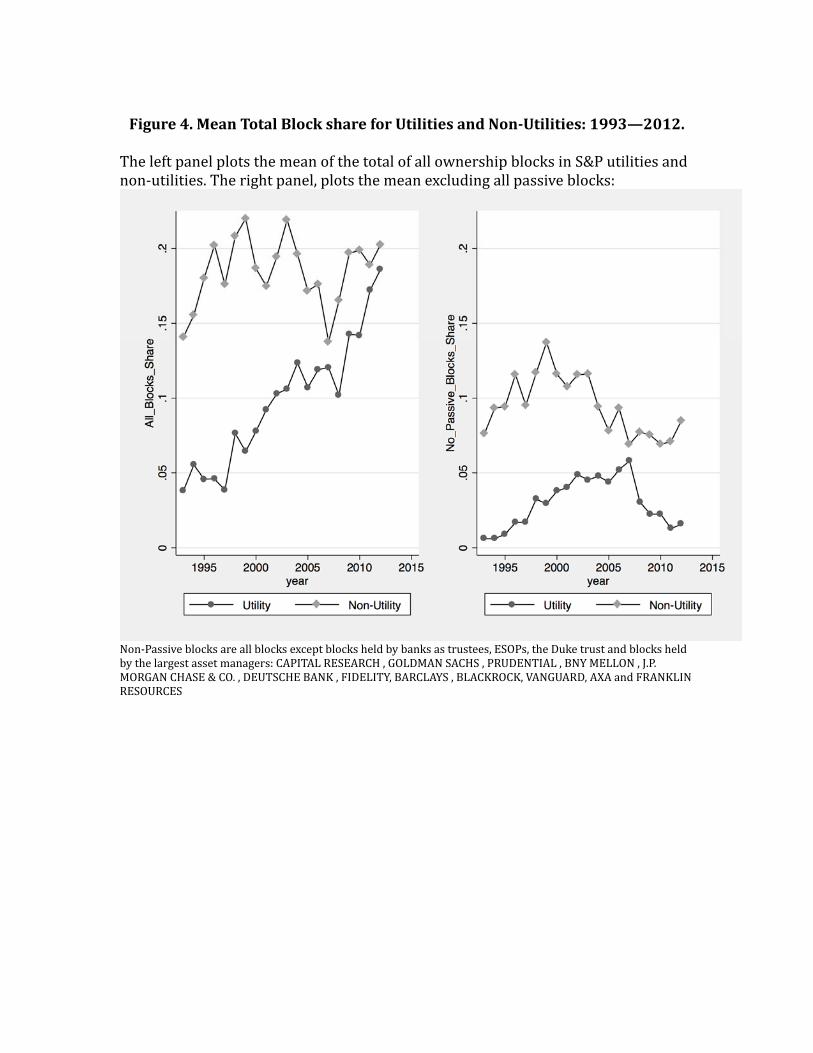
Figure4.MeanTotalBlockshareforUtilitiesandNon‐Utilities:1993—2012.
TheleftpanelplotsthemeanofthetotalofallownershipblocksinS&Putilitiesandnon‐utilities.Therightpanel,plotsthemeanexcludingallpassiveblocks:
Non‐Passiveblocksareallblocksexceptblocksheldbybanksastrustees,ESOPs,theDuketrustandblocksheldbythelargestassetmanagers:CAPITALRESEARCH,GOLDMANSACHS,PRUDENTIAL,BNYMELLON,J.P.MORGANCHASE&CO.,DEUTSCHEBANK,FIDELITY,BARCLAYS,BLACKROCK,VANGUARD,AXAandFRANKLINRESOURCES

52
Figure 5: In-and-Out Investors in Northeast Utilities
The vertical axis gives the percentage ownership stake of the different block-holders as they are reported in the Def14A filings.
0
2
4
6
8
10
12
14
1993
1994
1995
1996
1997
1998
1999
2000
2001
2002
2003
2004
2005
2006
2007
2008
2009
2010
2011
2012
Mellon Bank
Bankers Trust
Putnam
Barrow, Hanley,Mewhinney, Strauss
Prudential
Capital Research
FMR
Lord, Abbett & Co.
AXA
Wellington
Blackrock
Vanguard
State Street

Figure 6: Investors in Hess Corp
The vertical axis gives the percentage ownership stake of the different block-holders as they are reported in the Def14A filings. Hess stands for Leon Hess from 1993 to 1999. Thereafter it stands for John B. Hess, John Y. Schreyer, Burton T. Lefkowitz, Nicholas F. Brady, and Thomas H. Kean, who are listed as beneficial owners c/o the Amerada Hess Corporation. BGI stands for Barclays Global Investors, MFSC for Massachusetts Financial Services Company and Janus for Janus Capital Management LLC.
0
2
4
6
8
10
12
14
16
1993
1994
1995
1996
1997
1998
1999
2000
2001
2002
2003
2004
2005
2006
2007
2008
2009
2010
2011
2012
Hess
FMR Corp
Wellington
Alpine Capital
Dodge & Cox
Ark Asset Management
T Rowe Price
AXA
Primecap
BGI
Putnam
Capital Research
MFSC
Janus
Blackrock

54
Figure7.DistributionofBlock‐OwnershipMaximumDurationforUtilitiesand
MatchedNon‐UtilitiesSurvivingUntil2012
MaximumDurationisthelongestconsecutiveholdingperiodofablockinfirmimeasuredfromrespectivelytheyearwhentheblockisfirstreportedtothelastconsecutiveyearwhenitisreportedintheDef14Afilings.Thehighestpossibledurationis20(andthelowestis1).Thehistogramsgivethedistributionofthemaximumholdingperiodacrossrespectivelynon‐utilitiesandutilities.

Figure8.DistributionofNon‐PassiveBlock‐OwnershipMaximumDurationforSAPUtilitiesandMatchedNon‐Utilitiessurvivinguntil2012
Non‐Passiveblocksareallblocksexceptblocksheldbybanksastrustees,ESOPs,theDuketrustandblocksheldbythelargestassetmanagers:CAPITALRESEARCH,GOLDMANSACHS,PRUDENTIAL,BNYMELLON,J.P.MORGANCHASE&CO.,DEUTSCHEBANK,FIDELITY,BARCLAYS,BLACKROCK,VANGUARD,AXAandFRANKLINRESOURCES.

56
Figure9.DeregulationPredictionofStateGovernorPoliticalAffiliation
Note:Governor,RepublicandenotesRepublicanorIndependentGovernor

Appendix(ForOnlinePublicationOnly)
List of S&P 900 Electric Utilities in 1962 and Matched Non-Utilities
Standard Industry Classification Company Name
Ticker Symbol
Non-Utilities
1311 ANADARKO PETROLEUM CORP APC 1311 APACHE CORP APA 1311 BURLINGTON RESOURCES INC BR.2 1311 KERR-MCGEE CORP KMG 1311 MAXUS ENERGY CORP MXS 1311 OCCIDENTAL PETROLEUM CORP OXY 1311 ORYX ENERGY CO ORX 1311 UNOCAL CORP UCL 1311 PET INC PT.1 2000 DREYER'S GRAND ICE CRM HLDGS DRYR 2024 ARCHER-DANIELS-MIDLAND CO ADM 2070 WEYERHAEUSER CO WY 2400 POTLATCH CORP PCH 2421 CHAMPION INTERNATIONAL CORP CHA.3 2621 FORT JAMES CORP FJ 2621 FEDERAL PAPER BOARD CO FBO 2631 MEADWESTVACO CORP MWV 2631 TRIBUNE CO TRB 2711 AIR PRODUCTS & CHEMICALS INC APD 2810 QUANTUM CHEMICAL CORP CUE.1 2821 CHEMFIRST INC CEM.2 2860 LYONDELL CHEMICAL CO LYO 2860 FREEPORT MCMORAN INC FTX 2870 IMC GLOBAL INC IGL 2870 ATLANTIC RICHFIELD CO ARC.3 2911 CONOCOPHILLIPS COP 2911 HESS CORP HES 2911 MARATHON OIL CORP MRO 2911 TEXACO INC TX.2 2911 VALERO ENERGY CORP VLO 2911 CONRAIL INC CRR.3 4011 CSX CORP CSX 4011 ILLINOIS CENTRAL CORP IC.1 4011 SANTA FE PACIFIC CORP SFX.2 4011 UNION PACIFIC CORP UNP 4011 ALEXANDER & BALDWIN INC ALEX 4400 APL LTD APL.4 4412 OVERSEAS SHIPHOLDING GROUP OSG

58
4412 SOUTHWEST AIRLINES LUV 4512 GATX CORP GMT 4700 SPRINT NEXTEL CORP S 4812 AT&T INC T 4813 FRONTIER CORP FRO.1 4813 MCI COMMUNICATIONS MCIC 4813 SOUTHERN NEW ENG TELECOMM SNG.1 4813 CBS INC CBS.1 4833 COMSAT CORP -SER 1 CQ.1 4899 EL PASO CGP CO EP2 4922 PANENERGY CORP PEL.1 4922 SONAT INC SNT.1 4922 WILLIAMS COS INC WMB 4922 CONSOLIDATED NATURAL GAS CO D2 4923 NORAM ENERGY CORP CNP2 4923 ONEOK INC OKE 4923 QUESTAR CORP STR 4923 AGL RESOURCES INC GAS 4924 NATIONAL FUEL GAS CO NFG 4924 NICOR INC GAS.2 4924 PEOPLES ENERGY CORP PGL.1 4924 WASTE MANAGEMENT INC-OLD WMX 4953 ENRON CORP ENRNQ 5172 BENEFICIAL CORP BNL.1 6141 FIRST FINANCIAL MGMT CORP FFM. 7320 TIME WARNER INC-OLD TWX.1 7812 COMDISCO HOLDING CO INC CDCO
Utilities
9995 ALLEGHENY ENERGY INC AYE 4911 AMERICAN ELECTRIC POWER CO AEP 4911 ATLANTIC ENERGY INC ATE.2 4911 BLACK HILLS CORP BKH 4911 CENTRAL & SOUTH WEST CORP CSR.1 4911 CLECO CORP CNL 4911 CMP GROUP INC CTP.1 4911 DOMINION RESOURCES INC D 4911 DTE ENERGY CO DTE 4911 EDISON INTERNATIONAL EIX 4911 ENTERGY CORP ETR 4911 EXELON CORP EXC 4911 FIRSTENERGY CORP FE 4911 FLORIDA PROGRESS CORP PGN3 4911 GPU INC GPU. 4911 GREAT PLAINS ENERGY INC GXP 4911 HAWAIIAN ELECTRIC INDS HE 4911 IDACORP INC IDA 4911 IPALCO ENTERPRISES INC AES4

4911 NEW ENGLAND ELECTRIC SYSTEM NES.2 4911 NEXTERA ENERGY INC NEE 4911 NORTHEAST UTILITIES NU 4911 NV ENERGY INC NVE 4911 PEPCO HOLDINGS INC POM 4911 PINNACLE WEST CAPITAL CORP PNW 4911 PNM RESOURCES INC PNM 4911 PORTLAND GENERAL CORP PGN.3 4911 PPL CORP PPL 4911 PROGRESS ENERGY INC PGN 4911 PSI RESOURCES INC CIN2 4911 SOUTHERN CO SO 4911 SOUTHWESTERN PUBLIC SVC CO NCE2 4911 UIL HOLDINGS CORP UIL 4911 UNICOM CORP UCM.2 4911 VECTREN CORP VVC 4923 ALLETE INC ALE 4931 ALLIANT ENERGY CORP LNT 4931 AMEREN CORP AEE 4931 AQUILA INC ILA 4931 CENTERPOINT ENERGY INC CNP 4931 CINCINNATI GAS & ELECTRIC CIN1 4931 CMS ENERGY CORP CMS 4931 CONECTIV INC POM2 4931 CONSOLIDATED EDISON INC ED 4931 CONSTELLATION ENERGY GRP INC CEG 4931 DUKE ENERGY CORP DUK 4931 ENERGY EAST CORP EAS 4931 ENERGY FUTURE HOLDINGS CORP 0033A 4931 ILLINOVA CORP ILN 4931 IOWA-ILLINOIS GAS & ELEC IWG 4931 LG&E ENERGY CORP LGE 4931 MONTANA POWER CO MTP.1 4931 NEW CENTURY ENERGIES INC NCE.1 4931 NIAGARA MOHAWK HOLDINGS INC NMK 4931 NISOURCE INC NI 4931 OGE ENERGY CORP OGE 4931 PG&E CORP PCG 4931 PUBLIC SERVICE ENTRP GRP INC PEG 4931 PUGET ENERGY INC 5495B 4931 SCANA CORP SCG 4931 TECO ENERGY INC TE 4931 WISCONSIN ENERGY CORP WEC 4931 XCEL ENERGY INC XEL 4931 KEYSPAN ENERGY CORP KSE. 4932 SEMPRA ENERGY SRE

60
Table2A‐1EffectofEPACTonOwnershipConcentrationinElectricUtilities:
Thistableincludesallnon‐utilities(includingthosenotinthefinalsample),andallutilities.
DependentVariable:SumofBlocks≥ 5%
Parameterestimatesarereportedwithrobuststandarderrorsinparentheses.Thesymbols*,**,and ***representsignificanceatthe10%,5%,and1%level,respectively.Sigmaistheestimatedstandard erroroftheTobitregression,andsigma_eandsigma_uarerespectivelytheestimatedoverallandpanel‐levelvariancecomponents.ThethresholdlimitfortheTobitwasnotsetatthestandard0butat4.99toreflectthenon‐reportingofblocksbelow5%.
Independent (1) (2) (3) (4) Variable, OLS OLS Tobit Tobit
Firm FE Firm RE
Utility ‐15.56*** ‐20.73*** ‐18.97***
(2.192) (3.038) (1.907)
Year‐1993 0.220 0.194 0.265 0.220***
(0.186) (0.176) (0.199) (0.0596)
Utillity*(Year‐1993) 0.546** 0.582*** 0.875*** 0.800***
(0.200) (0.189) (0.215) (0.0787)
Constant 18.35*** 9.034*** 16.27*** 17.62***
(2.124) (0.652) (2.380) (1.409)
Sigma 15.10***
(1.567)
sigma_u 11.40***
(0.686)
sigma_e 9.201***
(0.165)
Observations 2,418 2,418 2,418 2,418
R‐squared 0.194 0.698
Number of Firms 174 174 174 174

Table2A‐2EffectofEPACTonOwnershipConcentrationinElectricUtilities:
Thistableincludesallnon‐utilitiesinfinalmatchandallutilities.TheDependentVariableistheSumofBlocks≥ 5%
Parameterestimatesarereportedwithrobuststandarderrorsinparentheses.Thesymbols*,**,and ***representsignificanceatthe10%,5%,and1%level,respectively.Sigmaistheestimatedstandard erroroftheTobitregression,andsigma_eandsigma_uarerespectivelytheestimatedoverallandpanel‐levelvariancecomponents.ThethresholdlimitfortheTobitwasnotsetatthestandard0butat4.99toreflectthenon‐reportingofblocksbelow5%.
Independent (1) (2) (3) (4) Variable, OLS OLS Tobit Tobit
Firm FE Firm RE
Utility ‐14.64*** ‐21.05*** ‐20.05***
(2.416) (3.249) (1.965)
Year‐1993 0.113 0.141 0.201 0.214***
(0.206) (0.223) (0.225) (0.0738)
Utillity*(Year‐1993) 0.653*** 0.635*** 1.058*** 0.978***
(0.219) (0.234) (0.258) (0.0926)
Constant 17.43*** 7.753*** 15.61*** 15.58***
(2.355) (0.707) (2.588) (1.515)
Sigma 14.73***
(1.010)
sigma_u 10.83***
(0.707)
sigma_e 10.19***
(0.195)
Observations 2,227 2,227 2,227 2,227
R‐squared 0.194 0.626
Number of Firms 160 160 160 160
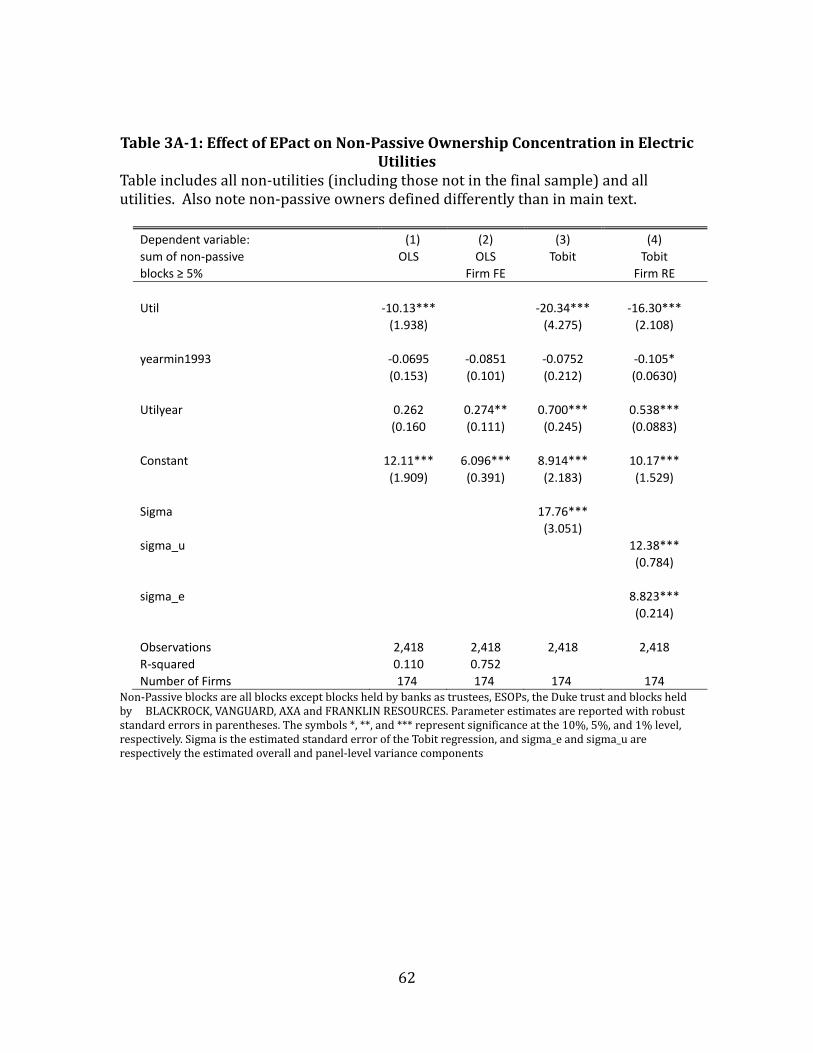
62
Table3A‐1:EffectofEPactonNon‐PassiveOwnershipConcentrationinElectric
UtilitiesTableincludesallnon‐utilities(includingthosenotinthefinalsample)andallutilities.Alsonotenon‐passiveownersdefineddifferentlythaninmaintext.
Dependent variable: (1) (2) (3) (4)
sum of non‐passive OLS OLS Tobit Tobit
blocks ≥ 5% Firm FE Firm RE
Util ‐10.13*** ‐20.34*** ‐16.30***
(1.938) (4.275) (2.108)
yearmin1993 ‐0.0695 ‐0.0851 ‐0.0752 ‐0.105*
(0.153) (0.101) (0.212) (0.0630)
Utilyear 0.262 0.274** 0.700*** 0.538***
(0.160 (0.111) (0.245) (0.0883)
Constant 12.11*** 6.096*** 8.914*** 10.17***
(1.909) (0.391) (2.183) (1.529)
Sigma 17.76***
(3.051)
sigma_u 12.38***
(0.784)
sigma_e 8.823***
(0.214)
Observations 2,418 2,418 2,418 2,418
R‐squared 0.110 0.752
Number of Firms 174 174 174 174 Non‐Passiveblocksareallblocksexceptblocksheldbybanksastrustees,ESOPs,theDuketrustandblocksheldbyBLACKROCK,VANGUARD,AXAandFRANKLINRESOURCES.Parameterestimatesarereportedwithrobuststandarderrorsinparentheses.Thesymbols*,**,and***representsignificanceatthe10%,5%,and1%level,respectively.SigmaistheestimatedstandarderroroftheTobitregression,andsigma_eandsigma_uarerespectivelytheestimatedoverallandpanel‐levelvariancecomponents
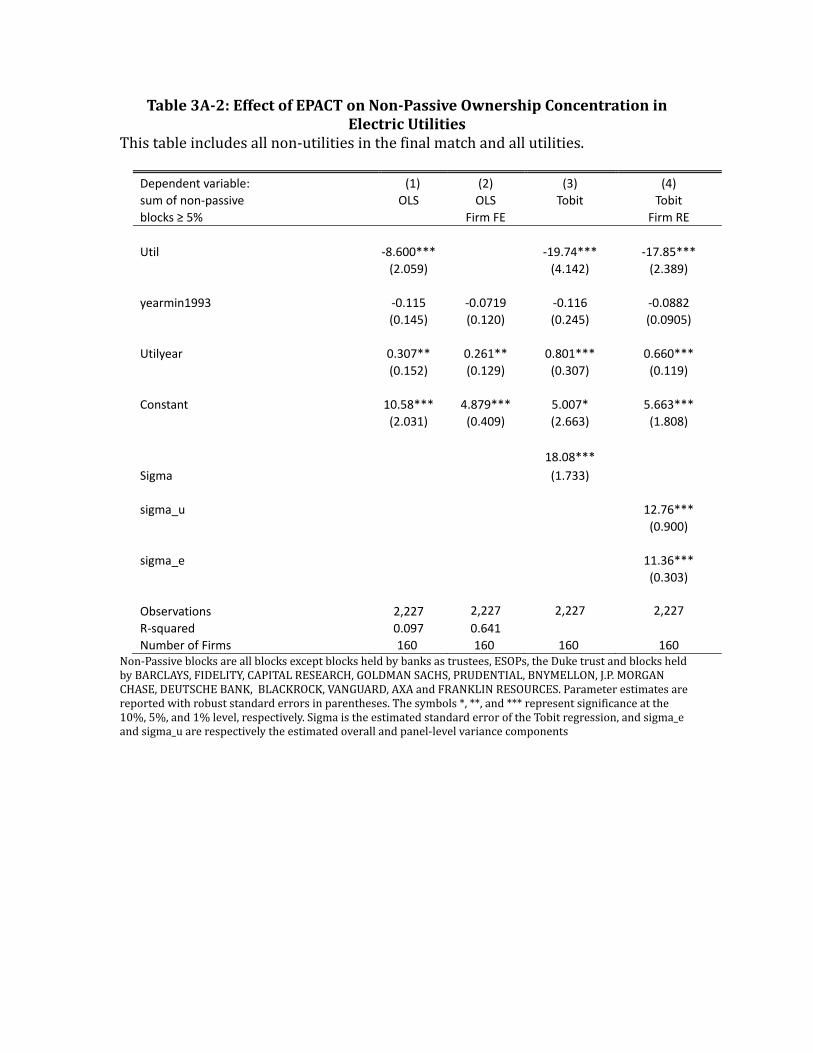
Table3A‐2:EffectofEPACTonNon‐PassiveOwnershipConcentrationinElectricUtilities
Thistableincludesallnon‐utilitiesinthefinalmatchandallutilities.
Dependent variable: (1) (2) (3) (4)
sum of non‐passive OLS OLS Tobit Tobit
blocks ≥ 5% Firm FE Firm RE
Util ‐8.600*** ‐19.74*** ‐17.85***
(2.059) (4.142) (2.389)
yearmin1993 ‐0.115 ‐0.0719 ‐0.116 ‐0.0882
(0.145) (0.120) (0.245) (0.0905)
Utilyear 0.307** 0.261** 0.801*** 0.660***
(0.152) (0.129) (0.307) (0.119)
Constant 10.58*** 4.879*** 5.007* 5.663***
(2.031) (0.409) (2.663) (1.808)
Sigma
18.08***
(1.733)
sigma_u 12.76***
(0.900)
sigma_e 11.36***
(0.303)
Observations 2,227 2,227 2,227 2,227
R‐squared 0.097 0.641
Number of Firms 160 160 160 160 Non‐Passiveblocksareallblocksexceptblocksheldbybanksastrustees,ESOPs,theDuketrustandblocksheldbyBARCLAYS,FIDELITY,CAPITALRESEARCH,GOLDMANSACHS,PRUDENTIAL,BNYMELLON,J.P.MORGANCHASE,DEUTSCHEBANK,BLACKROCK,VANGUARD,AXAandFRANKLINRESOURCES.Parameterestimatesarereportedwithrobuststandarderrorsinparentheses.Thesymbols*,**,and***representsignificanceatthe10%,5%,and1%level,respectively.SigmaistheestimatedstandarderroroftheTobitregression,andsigma_eandsigma_uarerespectivelytheestimatedoverallandpanel‐levelvariancecomponents
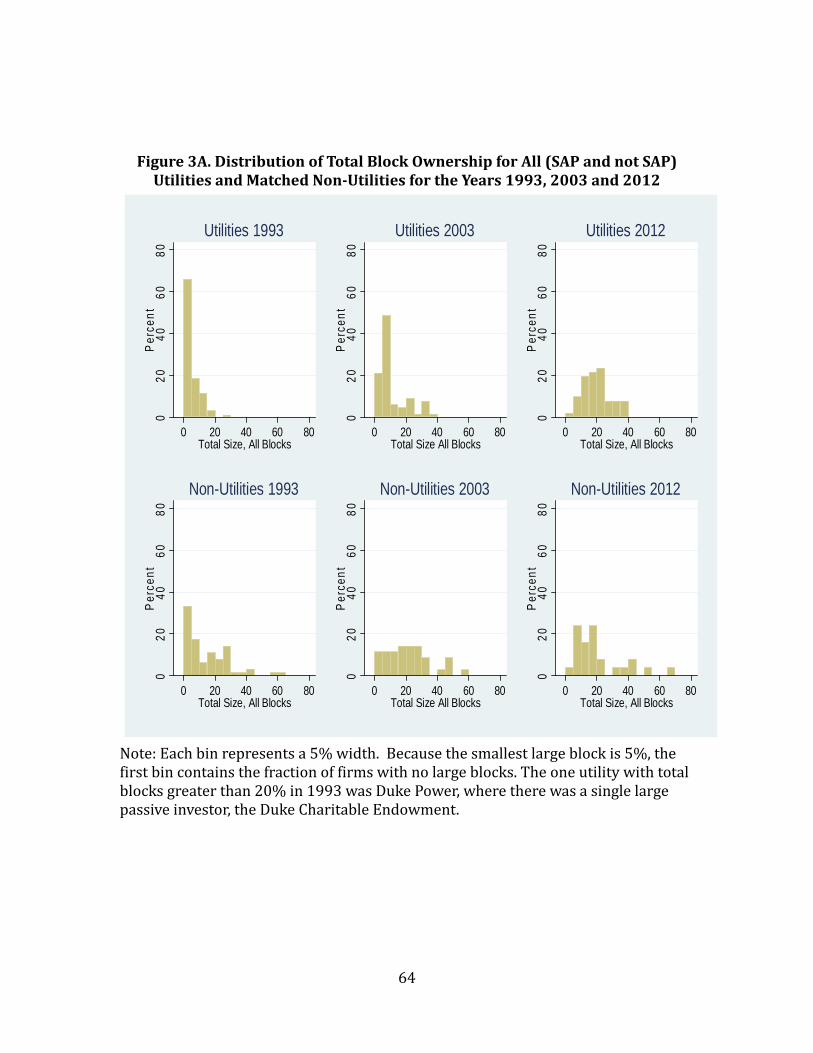
64
Figure3A.DistributionofTotalBlockOwnershipforAll(SAPandnotSAP)UtilitiesandMatchedNon‐UtilitiesfortheYears1993,2003and2012
Note:Eachbinrepresentsa5%width.Becausethesmallestlargeblockis5%,thefirstbincontainsthefractionoffirmswithnolargeblocks.Theoneutilitywithtotalblocksgreaterthan20%in1993wasDukePower,wheretherewasasinglelargepassiveinvestor,theDukeCharitableEndowment.
02
04
06
08
0P
erce
nt
0 20 40 60 80Total Size, All Blocks
Utilities 1993
02
04
06
08
0P
erce
nt
0 20 40 60 80Total Size All Blocks
Utilities 2003
02
04
06
08
0P
erce
nt
0 20 40 60 80Total Size, All Blocks
Utilities 2012
02
04
06
08
0P
erce
nt
0 20 40 60 80Total Size, All Blocks
Non-Utilities 1993
02
04
06
08
0P
erce
nt
0 20 40 60 80Total Size All Blocks
Non-Utilities 2003
02
04
06
08
0P
erce
nt
0 20 40 60 80Total Size, All Blocks
Non-Utilities 2012

Figure4A.MeanTotalBlockshareforUtilitiesandNon‐Utilities:1993—2012.Theleftpanelplotsthemeanofthetotalofallownershipblocksinutilitiesandnon‐utilities.Therightpanel,plotsthemeanexcludingthefollowingpassiveblocks:ESOPS,custodian‐bankheldblocks,theDuketrust,andallblocksheldbyBlackrock,Vanguard,AXA,andFranklinResources.Itincludesallnon‐utilitiesincludingthosenotinthefinalmatchedsample.ItincludesPORTLANDGENERALELECTRIC.
0.0
5.1
.15
.2.2
5A
ll_B
lock
s_S
hare
1995 2000 2005 2010 2015Year
Utility Non-Utility
0.0
5.1
.15
.2.2
5N
o_P
assi
ve_B
lock
s_S
hare
1995 2000 2005 2010 2015Year
Utility Non-Utility

66
Figure7A.DistributionofBlock‐OwnershipMaximumDurationforUtilitiesandMatchedNon‐UtilitiesSurvivingUntil2012
MaximumDurationisthelongestconsecutiveholdingperiodofablockinfirmimeasuredfromrespectivelytheyearwhentheblockisfirstreportedtothelastconsecutiveyearwhenitisreportedintheDef14Afilings.Thehighestpossibledurationis20(andthelowestis1).Thehistogramsgivethedistributionofthemaximumholdingperiodacrossrespectivelynon‐utilitiesandutilities.
Figure8A.DistributionofNon‐PassiveBlock‐OwnershipMaximumDurationforUtilitiesandmatchedNon‐Utilitiessurvivinguntil2012
Non‐Passiveblocksareallblocksexceptblocksheldbybanksastrustees,ESOPs,theDuketrustandblocksheldbythelargestassetmanagers:CAPITALRESEARCH,GOLDMANSACHS,PRUDENTIAL,BNYMELLON,J.P.MORGANCHASE&CO.,DEUTSCHEBANK,FIDELITY,BARCLAYS,BLACKROCK,VANGUARD,AXAandFRANKLINRESOURCES.
010
20
30
0 2 4 6 8 10 12 14 16 18 20 0 2 4 6 8 10 12 14 16 18 20
Surviving Non-Utilities Surviving UtilitiesMaximum Duration Maximum Duration
Perc
ent
Holding Period, YearsGraphs by Util
010
20
30
40
0 2 4 6 8 10 12 14 16 18 20 0 2 4 6 8 10 12 14 16 18 20
Surviving Non-Utilities Surviving UtilitiesMaximum Duration -- No Passive Investors Maximum Duration -- No Passive Investors
Perc
ent
Holding Period, YearsGraphs by Util