the employment situation: march 2008 · in march, the number of persons unemployed because they...
TRANSCRIPT

2
Technical information:Household data: (202) 691-6378 USDL 08-0448
http://www.bls.gov/cps/
Establishment data: (202) 691-6555 Transmission of material in this releasehttp://www.bls.gov/ces/ is embargoed until 8:30 A.M. (EDT),
Media contact: (202) 691-5902 Friday, April 4, 2008.
THE EMPLOYMENT SITUATION: MARCH 2008
The unemployment rate rose from 4.8 to 5.1 percent in March, and nonfarm payroll employmentcontinued to trend down (-80,000), the Bureau of Labor Statistics of the U.S. Department of Laborreported today. Over the past 3 months, payroll employment has declined by 232,000. In March,employment continued to fall in construction, manufacturing, and employment services, while health care,food services, and mining added jobs. Average hourly earnings rose by 5 cents, or 0.3 percent, over themonth.
Unemployment (Household Survey Data)
The number of unemployed persons increased by 434,000 to 7.8 million in March, and the unemploy-ment rate rose by 0.3 percentage point to 5.1 percent. Since March 2007, the number of unemployedpersons has increased by 1.1 million, and the unemployment rate has risen by 0.7 percentage point. (Seetable A-1.)
Over the month, unemployment rates rose for adult men (to 4.6 percent), adult women (4.6 percent),and Hispanics (6.9 percent). The jobless rates edged up for blacks (to 9.0 percent) and whites (4.5 per-cent), while the rate for teenagers (15.8 percent) was essentially unchanged. The unemployment rate forAsians was 3.6 percent, not seasonally adjusted. (See tables A-1, A-2, and A-3.)
In March, the number of persons unemployed because they lost jobs increased by 300,000 to 4.2million. Over the past 12 months, the number of unemployed job losers has increased by 914,000. (Seetable A-8.)
Percent Millions
Chart 2. Nonfarm payroll employment, seasonally adjusted, April 2005 – March 2008
Chart 1. Unemployment rate, seasonally adjusted,April 2005 – March 2008
3.5
4.0
4.5
5.0
5.5
6.0
6.5
2008200820062006 20072007128.0
130.0
132.0
134.0
136.0
138.0
140.0
20062006 20072007 20082008
Bureau of Labor Statistics Washington, D.C. 20212
News
United States Department of Labor

2
Table A. Major indicators of labor market activity, seasonally adjusted(Numbers in thousands)
HOUSEHOLD DATA
Civilian labor force …………….…………… 153,667 153,661 153,824 153,374 153,784 410Employment …………………….………… 146,291 146,070 146,248 145,993 145,969 -24Unemployment ……………….…………… 7,375 7,591 7,576 7,381 7,815 434
Not in labor force ………………….………… 79,270 79,146 78,792 79,436 79,211 -225
All workers ……………….……………....… 4.8 4.9 4.9 4.8 5.1 0.3Adult men …………………....……...…… 4.3 4.4 4.4 4.3 4.6 .3Adult women ………….………………… 4.2 4.3 4.2 4.2 4.6 .4Teenagers ………….………………...…… 16.4 16.8 18.0 16.6 15.8 -.8White ……….………….…...……………… 4.3 4.4 4.4 4.3 4.5 .2Black or African American ………….…… 8.6 8.8 9.2 8.3 9.0 .7Hispanic or Latino ethnicity ………..…… 5.9 6.5 6.3 6.2 6.9 .7
ESTABLISHMENT DATA
Nonfarm employment ……….……...……… 138,031 p 137,925 138,002 p 137,926 p 137,846 p -80Goods-producing 1…...…...……………… 22,042 p 21,821 21,907 p 21,825 p 21,732 p -93
Construction ..…...…………….………… 7,521 p 7,384 7,426 p 7,389 p 7,338 p -51Manufacturing …………………....…… 13,788 p 13,690 13,737 p 13,691 p 13,643 p -48
Service-providing 1 ………...……..……… 115,989 p 116,103 116,095 p 116,101 p 116,114 p 13 Retail trade 2 …...…………….…..…… 15,490 p 15,437 15,472 p 15,426 p 15,413 p -12Professional and business service ….....… 18,093 p 18,069 18,101 p 18,071 p 18,036 p -35Education and health services …..…….… 18,527 p 18,658 18,617 p 18,657 p 18,699 p 42Leisure and hospitality …...……………. 13,622 p 13,663 13,644 p 13,664 p 13,682 p 18Government ………...…………………… 22,291 p 22,364 22,336 p 22,369 p 22,387 p 18
Total private ……...…………...…………… 33.8 p 33.7 33.7 p 33.7 p 33.8 p 0.1Manufacturing …………….……...……… 41.2 p 41.2 41.1 p 41.2 p 41.3 p .1
Overtime ……...………………..…….… 4.1 p 4.0 4.0 p 4.0 p 4.1 p .1
Total private ……...………………….……… 107.7 p 107.4 107.4 p 107.3 p 107.5 p 0.2
Average hourly earnings, total private …...… $17.64 p $17.81 $17.75 p $17.81 p $17.86 p $0.05Average weekly earnings, total private ……. 596.34 p 600.68 598.18 p 600.20 p 603.67 p 3.47
Mar. 2008IV 2007 I 2008 Jan. 2008 Feb. 2008
p = preliminary.
Feb.-Mar. change
Hours of work 3
1 Includes other industries, not shown separately.2 Quarterly averages and the over-the-month change are calculated using unrounded data.3 Data relate to private production and nonsupervisory workers.
CategoryQuarterly averages Monthly data
Indexes of aggregate weekly hours (2002=100) 3
Earnings 3
Employment
Labor force status
Unemployment rates

3
Total Employment and the Labor Force (Household Survey Data)
The civilian labor force rose to 153.8 million over the month, offsetting a decline in the prior month.The labor force participation rate was 66.0 percent in March and has remained at or near that level sincelast spring. Total employment held at 146.0 million. The employment-population ratio was little changedover the month at 62.6 percent. The ratio was down from its most recent peak of 63.4 percent inDecember 2006. (See table A-1.)
The number of persons who worked part time for economic reasons, at 4.9 million in March, was littlechanged over the month, but has risen by 629,000 over the past 12 months. This category includes personswho indicated that they were working part time because their hours had been cut back or because they wereunable to find full-time jobs. (See table A-5.)
Persons Not in the Labor Force (Household Survey Data)
About 1.4 million persons (not seasonally adjusted) were marginally attached to the labor force in March.These individuals wanted and were available for work and had looked for a job sometime in the prior 12months. They were not counted as unemployed because they had not searched for work in the 4 weekspreceding the survey. Among the marginally attached, there were 401,000 discouraged workers in March,about the same as a year earlier. Discouraged workers are defined as persons not currently looking forwork specifically because they believed no jobs were available for them. The other 951,000 persons clas-sified as marginally attached to the labor force in March cited reasons such as school attendance or familyresponsibilities. (See table A-13.)
Industry Payroll Employment (Establishment Survey Data)
Total nonfarm payroll employment continued to trend down in March (-80,000), and has fallen by232,000 over the past 3 months. In March, job losses occurred in construction, manufacturing, and em-ployment services. Employment in health care, food services, and mining remained on an upward trend.(See table B-1.)
Employment in construction declined by 51,000 in March and has fallen by 394,000 since its peak inSeptember 2006. Most of the March decrease in employment occurred among specialty trade contractors(-42,000), with both residential and nonresidential contractors contributing to the decline.
Manufacturing employment fell by 48,000 in March and by 310,000 over the past 12 months. Em-ployment in motor vehicles and parts was down by 24,000 over the month, largely reflecting the impactof a strike in auto parts manufacturing. The strike resulted in a parts shortage that led to plant shutdownselsewhere in the auto industry. During the 12 months ending in February, the motor vehicle and partsindustry lost an average of 6,000 jobs per month. In March, factory employment also fell in severalconstruction-related industries, including wood products (-5,000), nonmetallic mineral products (-5,000),and furniture and related products (-5,000). Plastics and rubber products and textile mills also lost jobsover the month.
Professional and business services employment edged down in March (-35,000). The number of jobs inthe employment services component declined by 42,000 over the month; about half of the decline occurred inthe temporary help services industry. Employment services has lost 210,000 jobs since its most recent peakin August 2006. In March, employment in professional and technical services showed little change for thethird month in a row. This industry had added an average of 27,000 jobs per month in 2007.

4
In March, employment in retail trade was little changed. Job losses continued in building materialand garden supply stores (-9,000), furniture and home furnishings stores (-5,000), and department stores(-5,000). Over the past 12 months, retail trade has lost 107,000 jobs.
Employment in financial activities changed little in March. Credit intermediation employment edged downover the month and has fallen by 120,000 since its most recent peak in October 2006.
Health care employment continued to expand in March, rising by 23,000. Hospitals added 14,000 jobs.Over the past 12 months, health care has added 363,000 jobs. Social assistance employment edged up overthe month (11,000).
In March, food services employment continued to trend upward (23,000). Employment in the industryhas increased by 288,000 over the past 12 months. Employment in mining rose by 6,000 in March. Sup-port activities for mining, particularly those related to oil and gas extraction, accounted for about two-thirdsof the increase.
Weekly Hours (Establishment Survey Data)
In March, the average workweek for production and nonsupervisory workers on private nonfarm payrollsrose by 0.1 hour to 33.8 hours, seasonally adjusted. Both the manufacturing workweek, at 41.3 hours, andfactory overtime, at 4.1 hours, rose by 0.1 hour over the month. (See table B-2.)
The index of aggregate weekly hours of production and nonsupervisory workers on nonfarm payrolls roseby 0.2 percent in March to 107.5 (2002=100). The manufacturing index was unchanged at 93.4. (Seetable B-5.)
Hourly and Weekly Earnings (Establishment Survey Data)
In March, average hourly earnings of production and nonsupervisory workers on private nonfarm payrollsrose by 5 cents, or 0.3 percent, to $17.86, seasonally adjusted. This followed gains of 5 cents in Januaryand 6 cents in February. Average weekly earnings rose by 0.6 percent in March to $603.67. Over the past12 months, average hourly earnings increased by 3.6 percent and average weekly earnings rose by 3.3 per-cent. (See table B-3.)
______________________________
The Employment Situation for April 2008 is scheduled to be released on Friday, May 2,at 8:30 A.M. (EDT).

5
Frequently Asked Questions about Employment and Unemployment Estimates
Why are there two monthly measures of employment?
The household survey and establishment survey both produce sample-based estimates of employmentand both have strengths and limitations. The establishment survey employment series has a smaller margin oferror on the measurement of month-to-month change than the household survey because of its much largersample size. An over-the-month employment change of 104,000 is statistically significant in the establishmentsurvey, while the threshold for a statistically significant change in the household survey is about 400,000.However, the household survey has a more expansive scope than the establishment survey because it includesthe self-employed, unpaid family workers, agricultural workers, and private household workers, who are ex-cluded by the establishment survey. The household survey also provides estimates of employment for demo-graphic groups.
Are undocumented immigrants counted in the surveys?
Neither the establishment nor household survey is designed to identify the legal status of workers. Thus,while it is likely that both surveys include at least some undocumented immigrants, it is not possible to deter-mine how many are counted in either survey. The household survey does include questions about whetherrespondents were born outside the United States. Data from these questions show that foreign-born workersaccounted for 15.7 percent of the labor force in 2007 and 47.7 percent of the net increase in the labor forcefrom 2000 to 2007.
Why does the establishment survey have revisions?
The establishment survey revises published estimates to improve its data series by incorporating additionalinformation that was not available at the time of the initial publication of the estimates. The establishmentsurvey revises its initial monthly estimates twice, in the immediately succeeding 2 months, to incorporateadditional sample receipts from respondents in the survey. For more information on the monthly revisions,please visit http://www.bls.gov/ces/cesrevinfo.htm.
On an annual basis, the establishment survey incorporates a benchmark revision that re-anchors estimatesto nearly complete employment counts available from unemployment insurance tax records. The benchmarkhelps to control for sampling and modeling errors in the estimates. For more information on the annualbenchmark revision, please visit http://www.bls.gov/web/cesbmart.htm.
Has the establishment survey understated employment growth because it excludes the self-employed?
While the establishment survey excludes the self-employed, the household survey provides monthly esti-mates of unincorporated self-employment. These estimates have shown no substantial growth in recent years.

6
Does the establishment survey sample include small firms?
Yes; about 40 percent of the establishment survey sample is comprised of business establishments withfewer than 20 employees. The establishment survey sample is designed to maximize the reliability of the totalnonfarm employment estimate; firms from all size classes and industries are appropriately sampled to achievethat goal.
Does the establishment survey account for employment from new businesses?
Yes; monthly establishment survey estimates include an adjustment to account for the net employmentchange generated by business births and deaths. The adjustment comes from an econometric model thatforecasts the monthly net jobs impact of business births and deaths based on the actual past values of thenet impact that can be observed with a lag from the Quarterly Census of Employment and Wages. Theestablishment survey uses modeling rather than sampling for this purpose because the survey is not immedi-ately able to bring new businesses into the sample. There is an unavoidable lag between the birth of a newfirm and its appearance on the sampling frame and availability for selection. BLS adds new businesses to thesurvey twice a year.
Is the count of unemployed persons limited to just those people receiving unemployment insurancebenefits?
No; the estimate of unemployment is based on a monthly sample survey of households. All persons whoare without jobs and are actively seeking and available to work are included among the unemployed. (Peopleon temporary layoff are included even if they do not actively seek work.) There is no requirement or ques-tion relating to unemployment insurance benefits in the monthly survey.
Does the official unemployment rate exclude people who have stopped looking for work?
Yes; however, there are separate estimates of persons outside the labor force who want a job, includ-ing those who have stopped looking because they believe no jobs are available (discouraged workers). Inaddition, alternative measures of labor underutilization (discouraged workers and other groups not officiallycounted as unemployed) are published each month in the Employment Situation news release.

Technical Note
This news release presents statistics from two major surveys, theCurrent Population Survey (household survey) and the CurrentEmployment Statistics survey (establishment survey). The house-hold survey provides the information on the labor force, employ-ment, and unemployment that appears in the A tables, markedHOUSEHOLD DATA. It is a sample survey of about 60,000 house-holds conducted by the U.S. Census Bureau for the Bureau of LaborStatistics (BLS).
The establishment survey provides the information on theemployment, hours, and earnings of workers on nonfarm payrolls thatappears in the B tables, marked ESTABLISHMENT DATA. Thisinformation is collected from payroll records by BLS in cooperationwith state agencies. The sample includes about 160,000 businessesand government agencies covering approximately 400,000 individualworksites. The active sample includes about one-third of all nonfarmpayroll workers. The sample is drawn from a sampling frame ofunemployment insurance tax accounts.
For both surveys, the data for a given month relate to a particularweek or pay period. In the household survey, the reference week isgenerally the calendar week that contains the 12th day of the month. Inthe establishment survey, the reference period is the pay period in-cluding the 12th, which may or may not correspond directly to thecalendar week.
Coverage, definitions, and differencesbetween surveys
Household survey. The sample is selected to reflect the entirecivilian noninstitutional population. Based on responses to a series ofquestions on work and job search activities, each person 16 years andover in a sample household is classified as employed, unemployed, ornot in the labor force.
People are classified as employed if they did any work at all aspaid employees during the reference week; worked in their own busi-ness, profession, or on their own farm; or worked without pay at least15 hours in a family business or farm. People are also counted asemployed if they were temporarily absent from their jobs because ofillness, bad weather, vacation, labor-management disputes, or personalreasons.
People are classified as unemployed if they meet all of the followingcriteria: They had no employment during the reference week; they wereavailable for work at that time; and they made specific efforts to findemployment sometime during the 4-week period ending with thereference week. Persons laid off from a job and expecting recall neednot be looking for work to be counted as unemployed. The unemploy-ment data derived from the household survey in no way depend uponthe eligibility for or receipt of unemployment insurance benefits.
The civilian labor force is the sum of employed and unemployedpersons. Those not classified as employed or unemployed are not in the labor force. The unemployment rate is the number unemployedas a percent of the labor force. The labor force participation rate isthe labor force as a percent of the population, and the employment-population ratio is the employed as a percent of the population.
Establishment survey. The sample establishments are drawnfrom private nonfarm businesses such as factories, offices, and stores,as well as federal, state, and local government entities. Employees onnonfarm payrolls are those who received pay for any part of the refer-ence pay period, including persons on paid leave. Persons are countedin each job they hold. Hours and earnings data are for private busi-nesses and relate only to production workers in the goods-producingsector and nonsupervisory workers in the service-providing sector.Industries are classified on the basis of their principal activity inaccordance with the 2007 version of the North American IndustryClassification System.
Differences in employment estimates. The numerous concept-ual and methodological differences between the household andestablishment surveys result in important distinctions in the employ-ment estimates derived from the surveys. Among these are:
• The household survey includes agricultural workers, the self-em-ployed, unpaid family workers, and private household workers amongthe employed. These groups are excluded from the establishment survey.
• The household survey includes people on unpaid leave among theemployed. The establishment survey does not.
• The household survey is limited to workers 16 years of age and older.The establishment survey is not limited by age.
• The household survey has no duplication of individuals, becauseindividuals are counted only once, even if they hold more than one job.In the establishment survey, employees working at more than one joband thus appearing on more than one payroll would be counted sepa-rately for each appearance.
Seasonal adjustmentOver the course of a year, the size of the nation’s labor force and the
levels of employment and unemployment undergo sharp fluctuationsdue to such seasonal events as changes in weather, reduced or expandedproduction, harvests, major holidays, and the opening and closing ofschools. The effect of such seasonal variation can be very large; sea-sonal fluctuations may account for as much as 95 percent of the month-to-month changes in unemployment.
Because these seasonal events follow a more or less regular patterneach year, their influence on statistical trends can be eliminated byadjusting the statistics from month to month. These adjustments makenonseasonal developments, such as declines in economic activity orincreases in the participation of women in the labor force, easier tospot. For example, the large number of youth entering the labor forceeach June is likely to obscure any other changes that have taken placerelative to May, making it difficult to determine if the level of eco-nomic activity has risen or declined. However, because the effect ofstudents finishing school in previous years is known, the statisticsfor the current year can be adjusted to allow for a comparable change.Insofar as the seasonal adjustment is made correctly, the adjusted fi-gure provides a more useful tool with which to analyze changes ineconomic activity.
Most seasonally adjusted series are independently adjusted in boththe household and establishment surveys. However, the ad-

justed series for many major estimates, such as total payroll employ-ment, employment in most supersectors, total employment, andunemployment are computed by aggregating independently ad-justed component series. For example, total unemployment is de-rived by summing the adjusted series for four major age-sex components; this differs from the unemployment estimatethat would be obtained by directly adjusting the total orby combining the duration, reasons, or more detailed age cate-gories.
For both the household and establishment surveys, a concurrentseasonal adjustment methodology is used in which new seasonalfactors are calculated each month, using all relevant data, up to andincluding the data for the current month. In the household survey, newseasonal factors are used to adjust only the current month’s data. Inthe establishment survey, however, new seasonal factors are used eachmonth to adjust the three most recent monthly estimates. In bothsurveys, revisions to historical data are made once a year.
Reliability of the estimatesStatistics based on the household and establishment surveys are
subject to both sampling and nonsampling error. When a sample ratherthan the entire population is surveyed, there is a chance that the sampleestimates may differ from the “true” population values they represent.The exact difference, or sampling error, varies depending on theparticular sample selected, and this variability is measured by thestandard error of the estimate. There is about a 90-percent chance, orlevel of confidence, that an estimate based on a sample will differ by nomore than 1.6 standard errors from the “true” population value becauseof sampling error. BLS analyses are generally conducted at the 90-percent level of confidence.
For example, the confidence interval for the monthly change in totalemployment from the household survey is on the order of plus orminus 430,000. Suppose the estimate of total employment increasesby 100,000 from one month to the next. The 90-percent confidenceinterval on the monthly change would range from -330,000 to 530,000(100,000 +/- 430,000). These figures do not mean that the sampleresults are off by these magnitudes, but rather that there is about a90-percent chance that the “true” over-the-month change lies withinthis interval. Since this range includes values of less than zero, wecould not say with confidence that employment had, in fact, increased.If, however, the reported employment rise was half a million, thenall of the values within the 90-percent confidence interval would begreater than zero. In this case, it is likely (at least a 90-percent chance)that an employment rise had, in fact, occurred. At an unemploymentrate of around 5.5 percent, the 90-percent confidence interval for themonthly change in unemployment is about +/- 280,000, and for themonthly change in the unemployment rate it is about +/- .19 percentagepoint.
In general, estimates involving many individuals or establishmentshave lower standard errors (relative to the size of the estimate) thanestimates which are based on a small number of observations. Theprecision of estimates is also improved when the data are cumulatedover time such as for quarterly and annual averages. The seasonaladjustment process can also improve the stability of the monthlyestimates.
The household and establishment surveys are also affected bynonsampling error. Nonsampling errors can occur for many reasons,including the failure to sample a segment of the population, inability toobtain information for all respondents in the sample, inability orunwillingness of respondents to provide correct information on atimely basis, mistakes made by respondents, and errors made in thecollection or processing of the data.
For example, in the establishment survey, estimates for the mostrecent 2 months are based on incomplete returns; for this reason, theseestimates are labeled preliminary in the tables. It is only after twosuccessive revisions to a monthly estimate, when nearly all samplereports have been received, that the estimate is considered final.
Another major source of nonsampling error in the establishmentsurvey is the inability to capture, on a timely basis, employmentgenerated by new firms. To correct for this systematic underestimationof employment growth, an estimation procedure with two componentsis used to account for business births. The first component uses businessdeaths to impute employment for business births. This is incorporatedinto the sample-based link relative estimate procedure by simply notreflecting sample units going out of business, but imputing to them thesame trend as the other firms in the sample. The second component isan ARIMA time series model designed to estimate the residual net birth/death employment not accounted for by the imputation. The historicaltime series used to create and test the ARIMA model was derived fromthe unemployment insurance universe micro-level database, and reflectsthe actual residual net of births and deaths over the past five years.
The sample-based estimates from the establishment survey areadjusted once a year (on a lagged basis) to universe counts of payrollemployment obtained from administrative records of the unemploy-ment insurance program. The difference between the March sample-based employment estimates and the March universe counts is knownas a benchmark revision, and serves as a rough proxy for total surveyerror. The new benchmarks also incorporate changes in the classifi-cation of industries. Over the past decade, the benchmark revision fortotal nonfarm employment has averaged 0.2 percent, ranging fromless than 0.1 percent to 0.6 percent.
Other informationInformation in this release will be made available to sensory im-
paired individuals upon request. Voice phone: (202) 691-5200; TDDmessage referral phone: 1-800-877-8339.

HOUSEHOLD DATA HOUSEHOLD DATA
Table A-1. Employment status of the civilian population by sex and age
(Numbers in thousands)
Employment status, sex, and age
Not seasonally adjusted Seasonally adjusted 1
Mar.2007
Feb.2008
Mar.2008
Mar.2007
Nov.2007
Dec.2007
Jan.2008
Feb.2008
Mar.2008
TOTAL
Civilian noninstitutional population ................................. 231,034 232,809 232,995 231,034 232,939 233,156 232,616 232,809 232,995 Civilian labor force ........................................................ 152,236 152,503 153,135 152,884 153,828 153,866 153,824 153,374 153,784 Participation rate ..................................................... 65.9 65.5 65.7 66.2 66.0 66.0 66.1 65.9 66.0 Employed .................................................................... 145,323 144,550 145,108 146,145 146,647 146,211 146,248 145,993 145,969 Employment-population ratio .................................. 62.9 62.1 62.3 63.3 63.0 62.7 62.9 62.7 62.6 Unemployed ............................................................... 6,913 7,953 8,027 6,738 7,181 7,655 7,576 7,381 7,815 Unemployment rate ................................................ 4.5 5.2 5.2 4.4 4.7 5.0 4.9 4.8 5.1 Not in labor force .......................................................... 78,798 80,306 79,860 78,150 79,111 79,290 78,792 79,436 79,211 Persons who currently want a job ............................... 4,365 4,689 4,492 4,542 4,655 4,697 4,857 4,772 4,730
Men, 16 years and over
Civilian noninstitutional population ................................. 111,733 112,596 112,695 111,733 112,737 112,852 112,493 112,596 112,695 Civilian labor force ........................................................ 81,600 81,515 81,849 81,997 82,515 82,448 82,355 82,132 82,184 Participation rate ..................................................... 73.0 72.4 72.6 73.4 73.2 73.1 73.2 72.9 72.9 Employed .................................................................... 77,553 76,853 77,198 78,297 78,604 78,260 78,157 78,113 77,948 Employment-population ratio .................................. 69.4 68.3 68.5 70.1 69.7 69.3 69.5 69.4 69.2 Unemployed ............................................................... 4,047 4,661 4,651 3,700 3,910 4,188 4,197 4,019 4,236 Unemployment rate ................................................ 5.0 5.7 5.7 4.5 4.7 5.1 5.1 4.9 5.2 Not in labor force .......................................................... 30,133 31,081 30,846 29,737 30,223 30,404 30,139 30,464 30,511
Men, 20 years and over
Civilian noninstitutional population ................................. 103,143 103,961 104,052 103,143 104,087 104,197 103,866 103,961 104,052 Civilian labor force ........................................................ 78,217 78,378 78,691 78,410 79,075 79,004 78,864 78,748 78,838 Participation rate ..................................................... 75.8 75.4 75.6 76.0 76.0 75.8 75.9 75.7 75.8 Employed .................................................................... 74,737 74,365 74,620 75,286 75,834 75,499 75,427 75,362 75,197 Employment-population ratio .................................. 72.5 71.5 71.7 73.0 72.9 72.5 72.6 72.5 72.3 Unemployed ............................................................... 3,480 4,013 4,071 3,124 3,240 3,505 3,437 3,386 3,641 Unemployment rate ................................................ 4.4 5.1 5.2 4.0 4.1 4.4 4.4 4.3 4.6 Not in labor force .......................................................... 24,926 25,583 25,362 24,733 25,012 25,193 25,002 25,213 25,214
Women, 16 years and over
Civilian noninstitutional population ................................. 119,300 120,213 120,300 119,300 120,202 120,304 120,123 120,213 120,300 Civilian labor force ........................................................ 70,636 70,988 71,286 70,887 71,313 71,418 71,469 71,241 71,600 Participation rate ..................................................... 59.2 59.1 59.3 59.4 59.3 59.4 59.5 59.3 59.5 Employed .................................................................... 67,771 67,696 67,911 67,849 68,043 67,951 68,091 67,880 68,021 Employment-population ratio .................................. 56.8 56.3 56.5 56.9 56.6 56.5 56.7 56.5 56.5 Unemployed ............................................................... 2,865 3,292 3,376 3,038 3,271 3,467 3,378 3,361 3,579 Unemployment rate ................................................ 4.1 4.6 4.7 4.3 4.6 4.9 4.7 4.7 5.0 Not in labor force .......................................................... 48,665 49,225 49,014 48,413 48,889 48,886 48,654 48,972 48,700
Women, 20 years and over
Civilian noninstitutional population ................................. 110,964 111,822 111,902 110,964 111,805 111,903 111,739 111,822 111,902 Civilian labor force ........................................................ 67,453 67,793 68,115 67,446 67,776 67,866 67,982 67,816 68,159 Participation rate ..................................................... 60.8 60.6 60.9 60.8 60.6 60.6 60.8 60.6 60.9 Employed .................................................................... 64,975 64,943 65,142 64,859 64,980 64,912 65,098 64,950 65,055 Employment-population ratio .................................. 58.6 58.1 58.2 58.5 58.1 58.0 58.3 58.1 58.1 Unemployed ............................................................... 2,478 2,851 2,974 2,588 2,796 2,954 2,885 2,865 3,104 Unemployment rate ................................................ 3.7 4.2 4.4 3.8 4.1 4.4 4.2 4.2 4.6 Not in labor force .......................................................... 43,510 44,028 43,786 43,517 44,029 44,037 43,756 44,006 43,743
Both sexes, 16 to 19 years
Civilian noninstitutional population ................................. 16,927 17,027 17,041 16,927 17,048 17,056 17,012 17,027 17,041 Civilian labor force ........................................................ 6,566 6,331 6,329 7,028 6,977 6,996 6,978 6,810 6,787 Participation rate ..................................................... 38.8 37.2 37.1 41.5 40.9 41.0 41.0 40.0 39.8 Employed .................................................................... 5,611 5,242 5,347 6,000 5,832 5,801 5,724 5,681 5,717 Employment-population ratio .................................. 33.1 30.8 31.4 35.4 34.2 34.0 33.6 33.4 33.5 Unemployed ............................................................... 954 1,089 982 1,027 1,145 1,196 1,254 1,130 1,070 Unemployment rate ................................................ 14.5 17.2 15.5 14.6 16.4 17.1 18.0 16.6 15.8 Not in labor force .......................................................... 10,362 10,695 10,712 9,900 10,071 10,059 10,034 10,216 10,254
1 The population figures are not adjusted for seasonal variation; therefore, identical numbers appear in the unadjusted and seasonally adjusted columns. NOTE: Updated population controls are introduced annually with the release of January data.

HOUSEHOLD DATA HOUSEHOLD DATA
Table A-2. Employment status of the civilian population by race, sex, and age
(Numbers in thousands)
Employment status, race, sex, and age
Not seasonally adjusted Seasonally adjusted 1
Mar.2007
Feb.2008
Mar.2008
Mar.2007
Nov.2007
Dec.2007
Jan.2008
Feb.2008
Mar.2008
WHITE
Civilian noninstitutional population ................................. 187,704 188,906 189,019 187,704 188,956 189,093 188,787 188,906 189,019 Civilian labor force ........................................................ 124,328 124,361 124,679 124,852 125,430 125,460 125,340 124,940 125,190 Participation rate ....................................................... 66.2 65.8 66.0 66.5 66.4 66.3 66.4 66.1 66.2 Employed .................................................................... 119,375 118,395 118,827 120,065 120,194 119,889 119,858 119,534 119,574 Employment-population ratio .................................... 63.6 62.7 62.9 64.0 63.6 63.4 63.5 63.3 63.3 Unemployed ............................................................... 4,953 5,966 5,853 4,787 5,235 5,571 5,482 5,406 5,616 Unemployment rate .................................................. 4.0 4.8 4.7 3.8 4.2 4.4 4.4 4.3 4.5 Not in labor force .......................................................... 63,376 64,545 64,339 62,852 63,526 63,633 63,447 63,966 63,829
Men, 20 years and over Civilian labor force ........................................................ 65,059 65,023 65,292 65,174 65,521 65,506 65,470 65,270 65,342 Participation rate ....................................................... 76.4 75.9 76.1 76.6 76.4 76.3 76.4 76.1 76.2 Employed .................................................................... 62,544 61,947 62,214 62,975 63,111 62,929 62,924 62,745 62,665 Employment-population ratio .................................... 73.5 72.3 72.5 74.0 73.6 73.3 73.5 73.2 73.1 Unemployed ............................................................... 2,515 3,075 3,078 2,200 2,409 2,577 2,546 2,524 2,677 Unemployment rate .................................................. 3.9 4.7 4.7 3.4 3.7 3.9 3.9 3.9 4.1
Women, 20 years and over Civilian labor force ........................................................ 53,835 54,149 54,201 53,834 54,206 54,286 54,192 54,078 54,264 Participation rate ....................................................... 60.1 60.1 60.1 60.1 60.2 60.2 60.2 60.0 60.2 Employed .................................................................... 52,109 52,055 52,093 52,022 52,220 52,107 52,143 52,004 52,061 Employment-population ratio .................................... 58.2 57.8 57.8 58.1 58.0 57.8 57.9 57.7 57.7 Unemployed ............................................................... 1,726 2,094 2,108 1,812 1,986 2,179 2,049 2,075 2,202 Unemployment rate .................................................. 3.2 3.9 3.9 3.4 3.7 4.0 3.8 3.8 4.1
Both sexes, 16 to 19 years Civilian labor force ........................................................ 5,434 5,189 5,187 5,844 5,703 5,668 5,678 5,592 5,584 Participation rate ....................................................... 41.8 39.7 39.7 44.9 43.6 43.3 43.5 42.8 42.7 Employed .................................................................... 4,722 4,393 4,519 5,068 4,863 4,853 4,791 4,785 4,848 Employment-population ratio .................................... 36.3 33.6 34.6 38.9 37.2 37.1 36.7 36.6 37.1 Unemployed ............................................................... 712 796 667 776 840 815 887 807 736 Unemployment rate .................................................. 13.1 15.3 12.9 13.3 14.7 14.4 15.6 14.4 13.2
BLACK OR AFRICAN AMERICAN
Civilian noninstitutional population ................................. 27,346 27,675 27,709 27,346 27,666 27,704 27,640 27,675 27,709 Civilian labor force ........................................................ 17,312 17,412 17,601 17,418 17,453 17,538 17,713 17,632 17,702 Participation rate ....................................................... 63.3 62.9 63.5 63.7 63.1 63.3 64.1 63.7 63.9 Employed .................................................................... 15,874 15,947 16,010 15,979 15,980 15,961 16,090 16,169 16,116 Employment-population ratio .................................... 58.0 57.6 57.8 58.4 57.8 57.6 58.2 58.4 58.2 Unemployed ............................................................... 1,439 1,465 1,591 1,439 1,473 1,577 1,623 1,463 1,586 Unemployment rate .................................................. 8.3 8.4 9.0 8.3 8.4 9.0 9.2 8.3 9.0 Not in labor force .......................................................... 10,034 10,263 10,109 9,928 10,212 10,165 9,927 10,043 10,007
Men, 20 years and over Civilian labor force ........................................................ 7,732 7,854 7,839 7,804 7,889 7,883 7,916 7,947 7,922 Participation rate ....................................................... 70.3 70.6 70.4 71.0 70.8 70.7 71.3 71.5 71.2 Employed .................................................................... 7,017 7,178 7,140 7,109 7,268 7,218 7,259 7,320 7,255 Employment-population ratio .................................... 63.8 64.6 64.1 64.7 65.3 64.7 65.4 65.8 65.2 Unemployed ............................................................... 715 676 698 695 621 665 656 627 667 Unemployment rate .................................................. 9.2 8.6 8.9 8.9 7.9 8.4 8.3 7.9 8.4
Women, 20 years and over Civilian labor force ........................................................ 8,823 8,805 9,032 8,828 8,777 8,803 8,921 8,866 9,016 Participation rate ....................................................... 64.3 63.4 64.9 64.3 63.3 63.4 64.3 63.8 64.8 Employed .................................................................... 8,289 8,238 8,368 8,278 8,159 8,187 8,266 8,289 8,336 Employment-population ratio .................................... 60.4 59.3 60.2 60.3 58.8 59.0 59.6 59.6 59.9 Unemployed ............................................................... 535 566 664 550 618 617 654 577 680 Unemployment rate .................................................. 6.1 6.4 7.3 6.2 7.0 7.0 7.3 6.5 7.5
Both sexes, 16 to 19 years Civilian labor force ........................................................ 757 753 730 787 787 851 876 819 764 Participation rate ....................................................... 28.8 28.3 27.4 30.0 29.6 32.0 33.0 30.8 28.7 Employed .................................................................... 568 531 501 592 553 556 564 560 525 Employment-population ratio .................................... 21.7 19.9 18.8 22.6 20.8 20.9 21.2 21.0 19.7 Unemployed ............................................................... 189 222 229 194 234 295 313 259 239 Unemployment rate .................................................. 24.9 29.5 31.3 24.7 29.7 34.7 35.7 31.7 31.3
See footnotes at end of table.

HOUSEHOLD DATA HOUSEHOLD DATA
Table A-2. Employment status of the civilian population by race, sex, and age — Continued
(Numbers in thousands)
Employment status, race, sex, and age
Not seasonally adjusted Seasonally adjusted 1
Mar.2007
Feb.2008
Mar.2008
Mar.2007
Nov.2007
Dec.2007
Jan.2008
Feb.2008
Mar.2008
ASIAN
Civilian noninstitutional population ................................. 10,579 10,712 10,645 2( ) 2( ) 2( ) 2( ) 2( ) 2( ) Civilian labor force ........................................................ 7,020 7,159 7,184 2( ) 2( ) 2( ) 2( ) 2( ) 2( ) Participation rate ....................................................... 66.4 66.8 67.5 2( ) 2( ) 2( ) 2( ) 2( ) 2( ) Employed .................................................................... 6,810 6,942 6,928 2( ) 2( ) 2( ) 2( ) 2( ) 2( ) Employment-population ratio .................................... 64.4 64.8 65.1 2( ) 2( ) 2( ) 2( ) 2( ) 2( ) Unemployed ............................................................... 210 217 256 2( ) 2( ) 2( ) 2( ) 2( ) 2( ) Unemployment rate .................................................. 3.0 3.0 3.6 2( ) 2( ) 2( ) 2( ) 2( ) 2( ) Not in labor force .......................................................... 3,559 3,553 3,462 2( ) 2( ) 2( ) 2( ) 2( ) 2( )
1 The population figures are not adjusted for seasonal variation; therefore,identical numbers appear in the unadjusted and seasonally adjusted columns.
2 Data not available.
NOTE: Estimates for the above race groups will not sum to totals shown intable A-1 because data are not presented for all races. Updated populationcontrols are introduced annually with the release of January data.
Table A-3. Employment status of the Hispanic or Latino population by sex and age
(Numbers in thousands)
Employment status, sex, and age
Not seasonally adjusted Seasonally adjusted 1
Mar.2007
Feb.2008
Mar.2008
Mar.2007
Nov.2007
Dec.2007
Jan.2008
Feb.2008
Mar.2008
HISPANIC OR LATINO ETHNICITY
Civilian noninstitutional population ................................. 31,055 31,732 31,820 31,055 31,809 31,903 31,643 31,732 31,820 Civilian labor force ........................................................ 21,341 21,628 21,750 21,368 21,872 21,888 21,698 21,755 21,775 Participation rate ....................................................... 68.7 68.2 68.4 68.8 68.8 68.6 68.6 68.6 68.4 Employed .................................................................... 20,191 20,146 20,162 20,257 20,623 20,517 20,320 20,401 20,269 Employment-population ratio .................................... 65.0 63.5 63.4 65.2 64.8 64.3 64.2 64.3 63.7 Unemployed ............................................................... 1,150 1,482 1,588 1,111 1,249 1,371 1,378 1,354 1,507 Unemployment rate .................................................. 5.4 6.9 7.3 5.2 5.7 6.3 6.3 6.2 6.9 Not in labor force .......................................................... 9,714 10,105 10,071 9,687 9,938 10,016 9,946 9,977 10,045
Men, 20 years and over Civilian labor force ........................................................ 12,309 12,428 12,554 2( ) 2( ) 2( ) 2( ) 2( ) 2( ) Participation rate ....................................................... 84.9 84.1 84.7 2( ) 2( ) 2( ) 2( ) 2( ) 2( ) Employed .................................................................... 11,702 11,625 11,655 2( ) 2( ) 2( ) 2( ) 2( ) 2( ) Employment-population ratio .................................... 80.7 78.7 78.6 2( ) 2( ) 2( ) 2( ) 2( ) 2( ) Unemployed ............................................................... 607 804 899 2( ) 2( ) 2( ) 2( ) 2( ) 2( ) Unemployment rate .................................................. 4.9 6.5 7.2 2( ) 2( ) 2( ) 2( ) 2( ) 2( )
Women, 20 years and over Civilian labor force ........................................................ 7,964 8,093 8,100 2( ) 2( ) 2( ) 2( ) 2( ) 2( ) Participation rate ....................................................... 58.3 58.0 57.9 2( ) 2( ) 2( ) 2( ) 2( ) 2( ) Employed .................................................................... 7,594 7,620 7,606 2( ) 2( ) 2( ) 2( ) 2( ) 2( ) Employment-population ratio .................................... 55.6 54.6 54.4 2( ) 2( ) 2( ) 2( ) 2( ) 2( ) Unemployed ............................................................... 370 472 494 2( ) 2( ) 2( ) 2( ) 2( ) 2( ) Unemployment rate .................................................. 4.6 5.8 6.1 2( ) 2( ) 2( ) 2( ) 2( ) 2( )
Both sexes, 16 to 19 years Civilian labor force ........................................................ 1,069 1,107 1,096 2( ) 2( ) 2( ) 2( ) 2( ) 2( ) Participation rate ....................................................... 36.8 37.0 36.5 2( ) 2( ) 2( ) 2( ) 2( ) 2( ) Employed .................................................................... 895 901 900 2( ) 2( ) 2( ) 2( ) 2( ) 2( ) Employment-population ratio .................................... 30.8 30.1 30.0 2( ) 2( ) 2( ) 2( ) 2( ) 2( ) Unemployed ............................................................... 173 205 195 2( ) 2( ) 2( ) 2( ) 2( ) 2( ) Unemployment rate .................................................. 16.2 18.6 17.8 2( ) 2( ) 2( ) 2( ) 2( ) 2( )
1 The population figures are not adjusted for seasonal variation; therefore,identical numbers appear in the unadjusted and seasonally adjusted columns.
2 Data not available.
NOTE: Persons whose ethnicity is identified as Hispanic or Latino may be ofany race. Updated population controls are introduced annually with the releaseof January data.

HOUSEHOLD DATA HOUSEHOLD DATA
Table A-4. Employment status of the civilian population 25 years and over by educational attainment
(Numbers in thousands)
Educational attainment
Not seasonally adjusted Seasonally adjusted
Mar.2007
Feb.2008
Mar.2008
Mar.2007
Nov.2007
Dec.2007
Jan.2008
Feb.2008
Mar.2008
Less than a high school diplomaCivilian labor force .......................................................... 12,896 11,898 12,032 12,921 12,228 12,291 12,305 12,127 12,058 Participation rate ......................................................... 46.7 45.5 45.9 46.8 46.8 46.5 46.0 46.4 46.0 Employed ...................................................................... 11,881 10,878 10,894 12,024 11,296 11,358 11,362 11,236 11,071 Employment-population ratio ...................................... 43.0 41.6 41.6 43.5 43.3 42.9 42.5 43.0 42.3 Unemployed ................................................................. 1,015 1,020 1,138 896 932 933 943 891 986 Unemployment rate .................................................... 7.9 8.6 9.5 6.9 7.6 7.6 7.7 7.3 8.2
High school graduates, no college 1Civilian labor force .......................................................... 38,739 38,002 38,148 38,457 38,710 38,841 38,364 38,078 37,952 Participation rate ......................................................... 63.1 62.5 62.7 62.6 62.6 62.9 62.9 62.6 62.3 Employed ...................................................................... 37,033 35,954 36,027 36,886 36,980 37,034 36,587 36,303 36,016 Employment-population ratio ...................................... 60.3 59.1 59.2 60.1 59.8 60.0 59.9 59.7 59.1 Unemployed ................................................................. 1,706 2,048 2,121 1,570 1,730 1,807 1,778 1,775 1,936 Unemployment rate .................................................... 4.4 5.4 5.6 4.1 4.5 4.7 4.6 4.7 5.1
Some college or associate degreeCivilian labor force .......................................................... 35,434 36,237 36,489 35,493 36,353 36,279 36,492 36,437 36,548 Participation rate ......................................................... 72.1 71.6 72.0 72.2 71.9 72.0 72.5 72.0 72.1 Employed ...................................................................... 34,115 34,766 34,990 34,236 35,156 34,924 35,187 35,086 35,142 Employment-population ratio ...................................... 69.4 68.7 69.0 69.7 69.6 69.3 69.9 69.4 69.3 Unemployed ................................................................. 1,319 1,471 1,498 1,256 1,197 1,355 1,305 1,351 1,405 Unemployment rate .................................................... 3.7 4.1 4.1 3.5 3.3 3.7 3.6 3.7 3.8
Bachelor’s degree and higher 2Civilian labor force .......................................................... 43,532 45,339 45,375 43,643 44,263 44,448 44,604 45,226 45,459 Participation rate ......................................................... 78.4 78.3 78.5 78.6 77.7 77.9 78.0 78.1 78.6 Employed ...................................................................... 42,756 44,405 44,451 42,837 43,296 43,476 43,651 44,283 44,501 Employment-population ratio ...................................... 77.0 76.7 76.9 77.1 76.0 76.2 76.4 76.5 77.0 Unemployed ................................................................. 776 934 923 807 968 972 953 944 958 Unemployment rate .................................................... 1.8 2.1 2.0 1.8 2.2 2.2 2.1 2.1 2.1
1 Includes persons with a high school diploma or equivalent.2 Includes persons with bachelor’s, master’s, professional, and doctoral
degrees. NOTE: Updated population controls are introduced annually with the release of
January data. See box note in the BLS news release USDL 07-0486, "TheEmployment Situation: March 2007," issued on April 6, 2007, for a discussion oftechnical issues regarding educational attainment data.

HOUSEHOLD DATA HOUSEHOLD DATA
Table A-5. Employed persons by class of worker and part-time status
(In thousands)
Category
Not seasonally adjusted Seasonally adjusted
Mar.2007
Feb.2008
Mar.2008
Mar.2007
Nov.2007
Dec.2007
Jan.2008
Feb.2008
Mar.2008
CLASS OF WORKER
Agriculture and related industries ................................... 2,046 1,999 2,057 2,202 2,148 2,248 2,213 2,213 2,192 Wage and salary workers ............................................. 1,169 1,173 1,218 1,291 1,237 1,368 1,259 1,324 1,331 Self-employed workers ................................................. 859 808 816 892 895 874 936 873 849 Unpaid family workers .................................................. 18 18 23 1( ) 1( ) 1( ) 1( ) 1( ) 1( )
Nonagricultural industries ............................................... 143,277 142,551 143,051 143,966 144,503 143,933 144,052 143,820 143,796 Wage and salary workers ............................................. 133,551 133,159 133,849 134,068 135,109 134,605 134,755 134,259 134,411 Government ................................................................ 21,138 21,209 21,484 20,976 20,943 20,780 20,907 21,252 21,262 Private industries ........................................................ 112,413 111,950 112,365 113,098 114,179 113,872 113,846 112,972 113,142 Private households ................................................... 859 763 744 1( ) 1( ) 1( ) 1( ) 1( ) 1( ) Other industries ........................................................ 111,553 111,187 111,621 112,228 113,377 113,035 113,042 112,212 112,383 Self-employed workers ................................................. 9,606 9,292 9,103 9,731 9,276 9,242 9,161 9,410 9,224 Unpaid family workers .................................................. 121 100 99 1( ) 1( ) 1( ) 1( ) 1( ) 1( )
PERSONS AT WORK PART TIME 2
All industries:Part time for economic reasons .................................. 4,384 5,114 5,038 4,285 4,513 4,665 4,769 4,884 4,914 Slack work or business conditions ........................... 2,856 3,534 3,404 2,786 3,008 3,174 3,247 3,291 3,323 Could only find part-time work ................................. 1,218 1,260 1,382 1,217 1,223 1,236 1,163 1,222 1,362
Part time for noneconomic reasons ............................ 20,554 19,847 19,853 20,033 19,539 19,526 19,613 19,348 19,409
Nonagricultural industries:Part time for economic reasons .................................. 4,295 5,007 4,911 4,206 4,453 4,577 4,677 4,790 4,797 Slack work or business conditions ........................... 2,805 3,459 3,313 2,741 2,981 3,120 3,174 3,231 3,238 Could only find part-time work ................................. 1,204 1,255 1,370 1,203 1,205 1,219 1,149 1,216 1,354
Part time for noneconomic reasons ............................ 20,197 19,524 19,553 19,624 19,224 19,225 19,296 19,019 19,072
1 Data not available.2 Persons at work excludes employed persons who were absent from their
jobs during the entire reference week for reasons such as vacation, illness, orindustrial dispute. Part time for noneconomic reasons excludes persons whousually work full time but worked only 1 to 34 hours during the reference week for
reasons such as holidays, illness, and bad weather. NOTE: Detail for the seasonally adjusted data shown in this table will notnecessarily add to totals because of the independent seasonal adjustment of thevarious series. Updated population controls are introduced annually with the release of January data.

HOUSEHOLD DATA HOUSEHOLD DATA
Table A-6. Selected employment indicators
(In thousands)
Characteristic
Not seasonally adjusted Seasonally adjusted
Mar.2007
Feb.2008
Mar.2008
Mar.2007
Nov.2007
Dec.2007
Jan.2008
Feb.2008
Mar.2008
AGE AND SEX
Total, 16 years and over ................................................. 145,323 144,550 145,108 146,145 146,647 146,211 146,248 145,993 145,969 16 to 19 years ............................................................... 5,611 5,242 5,347 6,000 5,832 5,801 5,724 5,681 5,717 16 to 17 years ............................................................. 2,069 1,884 1,904 2,305 2,192 2,183 2,121 2,109 2,125 18 to 19 years ............................................................. 3,543 3,358 3,443 3,691 3,625 3,626 3,603 3,579 3,578 20 years and over ......................................................... 139,712 139,308 139,762 140,145 140,814 140,410 140,524 140,312 140,252 20 to 24 years ............................................................. 13,927 13,304 13,399 14,184 13,965 13,702 13,794 13,632 13,657 25 years and over ....................................................... 125,785 126,003 126,363 125,922 126,779 126,675 126,640 126,644 126,574 25 to 54 years ........................................................... 100,300 99,503 99,686 100,479 100,605 100,496 100,174 100,057 99,948 25 to 34 years ......................................................... 31,388 31,307 31,388 31,552 31,638 31,633 31,530 31,599 31,581 35 to 44 years ......................................................... 34,458 33,741 33,731 34,490 34,173 34,086 33,931 33,863 33,783 45 to 54 years ......................................................... 34,453 34,456 34,567 34,437 34,794 34,777 34,713 34,595 34,585 55 years and over ..................................................... 25,485 26,500 26,677 25,443 26,174 26,179 26,466 26,587 26,626
Men, 16 years and over .................................................. 77,553 76,853 77,198 78,297 78,604 78,260 78,157 78,113 77,948 16 to 19 years ............................................................... 2,816 2,488 2,578 3,011 2,770 2,761 2,731 2,751 2,751 16 to 17 years ............................................................. 1,004 827 864 1,127 959 986 950 966 971 18 to 19 years ............................................................. 1,811 1,662 1,714 1,892 1,791 1,766 1,780 1,782 1,780 20 years and over ......................................................... 74,737 74,365 74,620 75,286 75,834 75,499 75,427 75,362 75,197 20 to 24 years ............................................................. 7,270 6,996 7,099 7,446 7,466 7,244 7,312 7,219 7,268 25 years and over ....................................................... 67,466 67,369 67,521 67,817 68,328 68,264 68,060 68,129 67,938 25 to 54 years ........................................................... 54,025 53,417 53,455 54,348 54,422 54,383 54,041 54,016 53,847 25 to 34 years ......................................................... 17,311 17,042 17,051 17,478 17,466 17,451 17,348 17,346 17,255 35 to 44 years ......................................................... 18,651 18,255 18,245 18,765 18,559 18,507 18,335 18,400 18,359 45 to 54 years ......................................................... 18,062 18,120 18,159 18,105 18,397 18,425 18,357 18,270 18,233 55 years and over ..................................................... 13,442 13,952 14,066 13,469 13,906 13,882 14,020 14,113 14,091
Women, 16 years and over ............................................ 67,771 67,696 67,911 67,849 68,043 67,951 68,091 67,880 68,021 16 to 19 years ............................................................... 2,796 2,754 2,769 2,990 3,063 3,040 2,993 2,929 2,966 16 to 17 years ............................................................. 1,064 1,058 1,039 1,178 1,233 1,197 1,171 1,143 1,154 18 to 19 years ............................................................. 1,731 1,696 1,729 1,800 1,834 1,860 1,823 1,797 1,798 20 years and over ......................................................... 64,975 64,943 65,142 64,859 64,980 64,912 65,098 64,950 65,055 20 to 24 years ............................................................. 6,656 6,308 6,300 6,738 6,500 6,458 6,482 6,414 6,389 25 years and over ....................................................... 58,319 58,634 58,842 58,105 58,451 58,411 58,580 58,515 58,636 25 to 54 years ........................................................... 46,275 46,086 46,231 46,130 46,183 46,113 46,133 46,041 46,101 25 to 34 years ......................................................... 14,077 14,265 14,337 14,073 14,172 14,182 14,182 14,254 14,326 35 to 44 years ......................................................... 15,807 15,486 15,486 15,725 15,615 15,579 15,596 15,463 15,423 45 to 54 years ......................................................... 16,391 16,336 16,409 16,332 16,396 16,352 16,355 16,325 16,352 55 years and over ..................................................... 12,044 12,548 12,611 11,974 12,268 12,297 12,447 12,474 12,535
MARITAL STATUS
Married men, spouse present ......................................... 46,452 45,949 45,916 46,505 46,339 46,213 46,063 46,136 45,961Married women, spouse present .................................... 36,252 35,727 35,864 36,174 35,689 35,565 35,536 35,648 35,749Women who maintain families ........................................ 9,233 9,051 9,093 1( ) 1( ) 1( ) 1( ) 1( ) 1( )
FULL- OR PART-TIME STATUS
Full-time workers 2 ......................................................... 119,640 119,452 119,875 120,966 122,020 121,428 121,202 121,275 121,231Part-time workers 3 ......................................................... 25,684 25,098 25,233 25,100 24,631 24,740 25,043 24,697 24,691
MULTIPLE JOBHOLDERS
Total multiple jobholders ................................................. 7,808 7,610 7,499 7,729 7,640 7,416 7,557 7,582 7,449 Percent of total employed ........................................... 5.4 5.3 5.2 5.3 5.2 5.1 5.2 5.2 5.1
1 Data not available.2 Employed full-time workers are persons who usually work 35 hours or more
per week.3 Employed part-time workers are persons who usually work less than 35
hours per week.
NOTE: Detail for the seasonally adjusted data shown in this table will notnecessarily add to totals because of the independent seasonal adjustment of thevarious series. Updated population controls are introduced annually with the release of January data.

HOUSEHOLD DATA HOUSEHOLD DATA
Table A-7. Selected unemployment indicators, seasonally adjusted
Characteristic
Number ofunemployed persons
(in thousands)Unemployment rates 1
Mar.2007
Feb.2008
Mar.2008
Mar.2007
Nov.2007
Dec.2007
Jan.2008
Feb.2008
Mar.2008
AGE AND SEX
Total, 16 years and over ................................................. 6,738 7,381 7,815 4.4 4.7 5.0 4.9 4.8 5.1 16 to 19 years ............................................................... 1,027 1,130 1,070 14.6 16.4 17.1 18.0 16.6 15.8 16 to 17 years ............................................................. 450 471 485 16.3 19.0 19.6 20.4 18.3 18.6 18 to 19 years ............................................................. 580 656 584 13.6 14.4 15.4 15.9 15.5 14.0 20 years and over ......................................................... 5,711 6,251 6,745 3.9 4.1 4.4 4.3 4.3 4.6 20 to 24 years ............................................................. 1,167 1,325 1,394 7.6 8.0 9.4 8.7 8.9 9.3 25 years and over ....................................................... 4,509 4,948 5,294 3.5 3.7 3.9 3.8 3.8 4.0 25 to 54 years ........................................................... 3,677 4,058 4,342 3.5 3.8 4.1 3.9 3.9 4.2 25 to 34 years ......................................................... 1,448 1,584 1,775 4.4 4.7 4.9 4.9 4.8 5.3 35 to 44 years ......................................................... 1,135 1,260 1,321 3.2 3.5 3.8 3.6 3.6 3.8 45 to 54 years ......................................................... 1,094 1,214 1,246 3.1 3.3 3.6 3.4 3.4 3.5 55 years and over ..................................................... 819 888 931 3.1 3.0 3.2 3.2 3.2 3.4
Men, 16 years and over .................................................. 3,700 4,019 4,236 4.5 4.7 5.1 5.1 4.9 5.2 16 to 19 years ............................................................... 576 633 595 16.1 19.5 19.8 21.8 18.7 17.8 16 to 17 years ............................................................. 242 250 273 17.7 21.4 22.1 24.0 20.5 22.0 18 to 19 years ............................................................. 333 392 320 15.0 17.8 18.4 19.5 18.0 15.2 20 years and over ......................................................... 3,124 3,386 3,641 4.0 4.1 4.4 4.4 4.3 4.6 20 to 24 years ............................................................. 669 791 830 8.2 8.6 9.8 9.4 9.9 10.3 25 years and over ....................................................... 2,455 2,632 2,807 3.5 3.6 3.8 3.8 3.7 4.0 25 to 54 years ........................................................... 1,998 2,163 2,324 3.5 3.7 4.0 4.0 3.8 4.1 25 to 34 years ......................................................... 792 878 977 4.3 4.8 5.1 5.1 4.8 5.4 35 to 44 years ......................................................... 625 639 690 3.2 3.2 3.6 3.6 3.4 3.6 45 to 54 years ......................................................... 581 646 657 3.1 3.1 3.4 3.3 3.4 3.5 55 years and over ..................................................... 457 469 482 3.3 3.1 3.2 3.2 3.2 3.3
Women, 16 years and over ............................................ 3,038 3,361 3,579 4.3 4.6 4.9 4.7 4.7 5.0 16 to 19 years ............................................................... 451 496 475 13.1 13.4 14.4 14.2 14.5 13.8 16 to 17 years ............................................................. 207 222 212 15.0 17.1 17.3 17.2 16.2 15.5 18 to 19 years ............................................................. 247 264 265 12.1 10.7 12.3 12.1 12.8 12.8 20 years and over ......................................................... 2,588 2,865 3,104 3.8 4.1 4.4 4.2 4.2 4.6 20 to 24 years ............................................................. 497 535 563 6.9 7.4 8.8 8.0 7.7 8.1 25 years and over ....................................................... 2,054 2,317 2,488 3.4 3.8 3.9 3.8 3.8 4.1 25 to 54 years ........................................................... 1,679 1,895 2,018 3.5 4.0 4.1 3.9 4.0 4.2 25 to 34 years ......................................................... 656 706 798 4.5 4.6 4.7 4.8 4.7 5.3 35 to 44 years ......................................................... 510 621 631 3.1 3.9 4.0 3.6 3.9 3.9 45 to 54 years ......................................................... 513 568 589 3.0 3.6 3.8 3.4 3.4 3.5 55 years and over 2 .................................................. 341 432 438 2.8 2.8 2.9 3.4 3.3 3.4
MARITAL STATUS
Married men, spouse present ......................................... 1,169 1,271 1,337 2.5 2.6 2.7 2.7 2.7 2.8Married women, spouse present .................................... 962 1,132 1,226 2.6 3.0 3.1 3.1 3.1 3.3Women who maintain families 2 ..................................... 667 655 694 6.7 6.6 6.9 7.0 6.7 7.1
FULL- OR PART-TIME STATUS
Full-time workers 3 ......................................................... 5,521 6,092 6,415 4.4 4.6 4.9 4.8 4.8 5.0Part-time workers 4 ......................................................... 1,176 1,288 1,377 4.5 5.0 5.6 5.4 5.0 5.3
1 Unemployment as a percent of the civilian labor force.2 Not seasonally adjusted.3 Full-time workers are unemployed persons who have expressed a desire to
work full time (35 hours or more per week) or are on layoff from full-time jobs.4 Part-time workers are unemployed persons who have expressed a desire to
work part time (less than 35 hours per week) or are on layoff from part-time jobs. NOTE: Detail for the seasonally adjusted data shown in this table will not necessarily add to totals because of the independent seasonal adjustment of the various series. Updated population controls are introduced annually with therelease of January data.

HOUSEHOLD DATA HOUSEHOLD DATA
Table A-8. Unemployed persons by reason for unemployment
(Numbers in thousands)
Reason
Not seasonally adjusted Seasonally adjusted
Mar.2007
Feb.2008
Mar.2008
Mar.2007
Nov.2007
Dec.2007
Jan.2008
Feb.2008
Mar.2008
NUMBER OF UNEMPLOYED
Job losers and persons who completed temporaryjobs ............................................................................... 3,487 4,471 4,555 3,240 3,609 3,857 3,796 3,854 4,154On temporary layoff .................................................... 1,078 1,351 1,341 865 979 975 1,040 971 1,056Not on temporary layoff .............................................. 2,409 3,120 3,214 2,375 2,630 2,882 2,756 2,883 3,098
Permanent job losers .............................................. 1,681 2,204 2,276 1( ) 1( ) 1( ) 1( ) 1( ) 1( )Persons who completed temporary jobs ................ 728 916 938 1( ) 1( ) 1( ) 1( ) 1( ) 1( )
Job leavers ..................................................................... 749 802 768 755 783 798 830 769 781Reentrants ...................................................................... 2,151 2,139 2,103 2,143 2,160 2,343 2,201 2,112 2,117New entrants .................................................................. 526 542 601 600 669 697 667 648 681
PERCENT DISTRIBUTION
Total unemployed ........................................................... 100.0 100.0 100.0 100.0 100.0 100.0 100.0 100.0 100.0Job losers and persons who completed temporaryjobs ............................................................................. 50.4 56.2 56.7 48.1 50.0 50.1 50.7 52.2 53.7On temporary layoff .................................................. 15.6 17.0 16.7 12.8 13.6 12.7 13.9 13.2 13.7Not on temporary layoff ............................................ 34.9 39.2 40.0 35.3 36.4 37.5 36.8 39.0 40.1
Job leavers ................................................................... 10.8 10.1 9.6 11.2 10.8 10.4 11.1 10.4 10.1Reentrants .................................................................... 31.1 26.9 26.2 31.8 29.9 30.4 29.4 28.6 27.4New entrants ................................................................ 7.6 6.8 7.5 8.9 9.3 9.1 8.9 8.8 8.8
UNEMPLOYED AS A PERCENT OF THE CIVILIAN LABOR FORCE
Job losers and persons who completed temporaryjobs ............................................................................. 2.3 2.9 3.0 2.1 2.3 2.5 2.5 2.5 2.7
Job leavers ................................................................... .5 .5 .5 .5 .5 .5 .5 .5 .5Reentrants .................................................................... 1.4 1.4 1.4 1.4 1.4 1.5 1.4 1.4 1.4New entrants ................................................................ .3 .4 .4 .4 .4 .5 .4 .4 .4
1 Data not available. NOTE: Updated population controls are introduced annually with the release of January data.

HOUSEHOLD DATA HOUSEHOLD DATA
Table A-9. Unemployed persons by duration of unemployment
(Numbers in thousands)
Duration
Not seasonally adjusted Seasonally adjusted
Mar.2007
Feb.2008
Mar.2008
Mar.2007
Nov.2007
Dec.2007
Jan.2008
Feb.2008
Mar.2008
NUMBER OF UNEMPLOYED
Less than 5 weeks .............................................................................. 2,103 2,530 2,550 2,338 2,633 2,793 2,634 2,639 2,7675 to 14 weeks ..................................................................................... 2,339 2,854 2,782 2,156 2,157 2,330 2,396 2,396 2,52515 weeks and over ............................................................................. 2,471 2,570 2,696 2,183 2,398 2,520 2,503 2,377 2,400 15 to 26 weeks ................................................................................ 1,189 1,212 1,339 976 1,014 1,182 1,124 1,079 1,118 27 weeks and over .......................................................................... 1,282 1,358 1,357 1,207 1,384 1,338 1,380 1,299 1,282
Average (mean) duration, in weeks .................................................... 18.4 16.8 16.9 17.2 17.2 16.6 17.5 16.8 16.2Median duration, in weeks .................................................................. 10.1 8.9 9.4 8.6 8.7 8.4 8.8 8.4 8.1
PERCENT DISTRIBUTION
Total unemployed ............................................................................... 100.0 100.0 100.0 100.0 100.0 100.0 100.0 100.0 100.0 Less than 5 weeks ............................................................................ 30.4 31.8 31.8 35.0 36.6 36.5 35.0 35.6 36.0 5 to 14 weeks ................................................................................... 33.8 35.9 34.7 32.3 30.0 30.5 31.8 32.3 32.8 15 weeks and over ........................................................................... 35.7 32.3 33.6 32.7 33.4 33.0 33.2 32.1 31.2 15 to 26 weeks ............................................................................... 17.2 15.2 16.7 14.6 14.1 15.5 14.9 14.6 14.5 27 weeks and over ......................................................................... 18.5 17.1 16.9 18.1 19.3 17.5 18.3 17.5 16.7
NOTE: Updated population controls are introduced annually with the release of January data.
Table A-10. Employed and unemployed persons by occupation, not seasonally adjusted
(Numbers in thousands)
OccupationEmployed Unemployed Unemployment
rates
Mar.2007
Mar.2008
Mar.2007
Mar.2008
Mar.2007
Mar.2008
Total, 16 years and over 1 ....................................................... 145,323 145,108 6,913 8,027 4.5 5.2Management, professional, and related occupations ............. 51,791 52,681 952 1,121 1.8 2.1 Management, business, and financial operationsoccupations .................................................................................... 21,412 21,810 426 485 2.0 2.2
Professional and related occupations ...................................... 30,379 30,871 526 636 1.7 2.0Service occupations ....................................................................... 23,708 23,672 1,491 1,603 5.9 6.3Sales and office occupations ....................................................... 36,412 36,014 1,525 1,759 4.0 4.7 Sales and related occupations .................................................. 16,866 16,352 752 825 4.3 4.8 Office and administrative support occupations ...................... 19,545 19,662 773 935 3.8 4.5Natural resources, construction, and maintenanceoccupations .................................................................................... 15,418 14,473 1,214 1,581 7.3 9.8
Farming, fishing, and forestry occupations ............................. 915 965 131 160 12.5 14.2 Construction and extraction occupations ................................ 9,482 8,473 894 1,232 8.6 12.7 Installation, maintenance, and repair occupations ................ 5,022 5,035 190 190 3.6 3.6Production, transportation, and material movingoccupations .................................................................................... 17,994 18,268 1,184 1,337 6.2 6.8
Production occupations .............................................................. 9,470 9,327 574 659 5.7 6.6 Transportation and material moving occupations ................. 8,524 8,940 610 678 6.7 7.1
1 Persons with no previous work experience and persons whose last job was in the Armed Forces are included in the unemployed total. NOTE: Updated population controls are introduced annually with the release of January data.

HOUSEHOLD DATA HOUSEHOLD DATA
Table A-11. Unemployed persons by industry and class of worker, not seasonally adjusted
Industry and class of worker
Number ofunemployed
persons(in thousands)
Unemploymentrates
Mar.2007
Mar.2008
Mar.2007
Mar.2008
Total, 16 years and over 1 .................................................... 6,913 8,027 4.5 5.2Nonagricultural private wage and salary workers .................... 5,534 6,480 4.7 5.5 Mining ............................................................................................. 24 28 3.2 3.7 Construction .................................................................................. 924 1,170 9.0 12.0 Manufacturing ............................................................................... 742 831 4.5 5.0 Durable goods ............................................................................ 456 507 4.3 4.8 Nondurable goods ..................................................................... 286 324 4.8 5.4 Wholesale and retail trade ......................................................... 896 992 4.4 4.9 Transportation and utilities ......................................................... 249 267 4.3 4.3 Information ..................................................................................... 109 155 3.2 4.8 Financial activities ........................................................................ 252 323 2.6 3.4 Professional and business services ......................................... 775 876 5.7 6.2 Education and health services .................................................. 495 609 2.5 3.1 Leisure and hospitality ................................................................ 845 944 7.0 7.6 Other services ............................................................................... 222 283 3.7 4.6Agriculture and related private wage and salary workers ...... 123 175 9.7 13.2Government workers ..................................................................... 419 425 1.9 1.9Self employed and unpaid family workers ................................. 311 346 2.8 3.3
1 Persons with no previous work experience are included in the unemployed total. NOTE: Updated population controls are introduced annually with the release of January data.
Table A-12. Alternative measures of labor underutilization
(Percent)
Measure
Not seasonally adjusted Seasonally adjusted
Mar.2007
Feb.2008
Mar.2008
Mar.2007
Nov.2007
Dec.2007
Jan.2008
Feb.2008
Mar.2008
U-1 Persons unemployed 15 weeks or longer, as a percent of thecivilian labor force ..................................................................... 1.6 1.7 1.8 1.4 1.6 1.6 1.6 1.6 1.6
U-2 Job losers and persons who completed temporary jobs, as apercent of the civilian labor force .............................................. 2.3 2.9 3.0 2.1 2.3 2.5 2.5 2.5 2.7
U-3 Total unemployed, as a percent of the civilian labor force(official unemployment rate) ................................................. 4.5 5.2 5.2 4.4 4.7 5.0 4.9 4.8 5.1
U-4 Total unemployed plus discouraged workers, as a percent of thecivilian labor force plus discouraged workers ........................... 4.8 5.5 5.5 4.6 4.9 5.2 5.2 5.1 5.3
U-5 Total unemployed, plus discouraged workers, plus all othermarginally attached workers, as a percent of the civilian laborforce plus all marginally attached workers ................................ 5.4 6.2 6.1 5.3 5.5 5.8 6.0 5.8 5.9
U-6 Total unemployed, plus all marginally attached workers, plustotal employed part time for economic reasons, as a percentof the civilian labor force plus all marginally attachedworkers ..................................................................................... 8.3 9.5 9.3 8.0 8.4 8.8 9.0 8.9 9.1
NOTE: Marginally attached workers are persons who currently are neitherworking nor looking for work but indicate that they want and are available for a joband have looked for work sometime in the recent past. Discouraged workers, asubset of the marginally attached, have given a job-market related reason for notlooking currently for a job. Persons employed part time for economic reasons are
those who want and are available for full-time work but have had to settle for apart-time schedule. For more information, see "BLS introduces new range ofalternative unemployment measures," in the October 1995 issue of the MonthlyLabor Review. Updated population controls are introduced annually with the release of January data.

HOUSEHOLD DATA HOUSEHOLD DATA
Table A-13. Persons not in the labor force and multiple jobholders by sex, not seasonally adjusted
(Numbers in thousands)
Category
Total Men Women
Mar.2007
Mar.2008
Mar.2007
Mar.2008
Mar.2007
Mar.2008
NOT IN THE LABOR FORCE
Total not in the labor force .................................................................. 78,798 79,860 30,133 30,846 48,665 49,014 Persons who currently want a job ...................................................... 4,365 4,492 2,005 2,051 2,360 2,442
Searched for work and available to work now 1 ........................... 1,385 1,352 743 722 642 631Reason not currently looking:
Discouragement over job prospects 2 .................................. 381 401 245 245 136 156Reasons other than discouragement 3 ................................. 1,005 951 499 477 506 474
MULTIPLE JOBHOLDERS
Total multiple jobholders 4 .................................................................. 7,808 7,499 3,923 3,691 3,884 3,808 Percent of total employed ............................................................... 5.4 5.2 5.1 4.8 5.7 5.6
Primary job full time, secondary job part time ................................. 4,208 4,198 2,397 2,276 1,811 1,922 Primary and secondary jobs both part time .................................... 1,904 1,693 559 481 1,344 1,212 Primary and secondary jobs both full time ...................................... 338 281 206 197 133 83 Hours vary on primary or secondary job ......................................... 1,305 1,288 734 724 571 564
1 Data refer to persons who have searched for work during the prior 12 months andwere available to take a job during the reference week. These persons are referred toas "marginally attached to the labor force."
2 Includes thinks no work available, could not find work, lacks schooling or training,employer thinks too young or old, and other types of discrimination. These persons arereferred to as "discouraged workers."
3 Includes those who did not actively look for work in the prior 4 weeks for such
reasons as school or family responsibilities, ill health, and transportation problems, aswell as a small number for which reason for nonparticipation was not determined.
4 Includes persons who work part time on their primary job and full time on theirsecondary job(s), not shown separately. NOTE: Updated population controls are introduced annually with the release ofJanuary data.
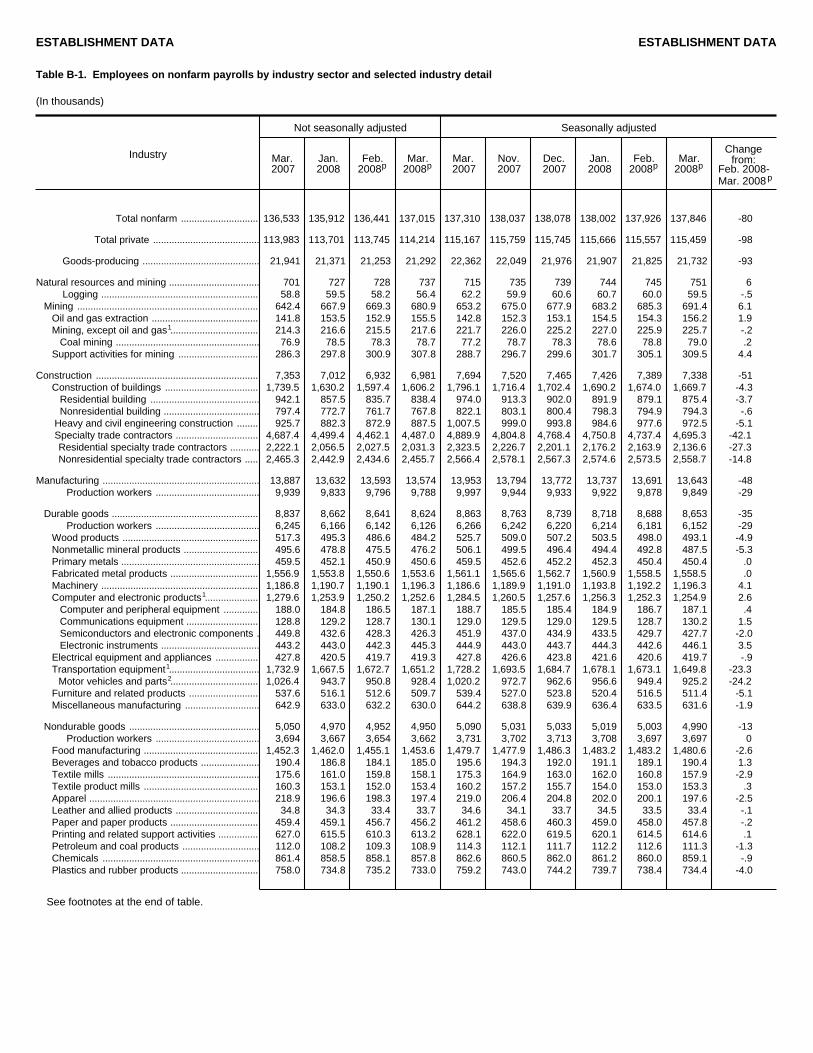
ESTABLISHMENT DATA ESTABLISHMENT DATA
Table B-1. Employees on nonfarm payrolls by industry sector and selected industry detail
(In thousands)
Industry
Not seasonally adjusted Seasonally adjusted
Mar. 2007
Jan. 2008
Feb. 2008p
Mar. 2008p
Mar. 2007
Nov. 2007
Dec. 2007
Jan. 2008
Feb. 2008p
Mar. 2008p
Changefrom:
Feb. 2008-Mar. 2008p
Total nonfarm ............................. 136,533 135,912 136,441 137,015 137,310 138,037 138,078 138,002 137,926 137,846 -80
Total private ........................................ 113,983 113,701 113,745 114,214 115,167 115,759 115,745 115,666 115,557 115,459 -98
Goods-producing ............................................ 21,941 21,371 21,253 21,292 22,362 22,049 21,976 21,907 21,825 21,732 -93
Natural resources and mining .................................. 701 727 728 737 715 735 739 744 745 751 6Logging ........................................................... 58.8 59.5 58.2 56.4 62.2 59.9 60.6 60.7 60.0 59.5 -.5
Mining .................................................................... 642.4 667.9 669.3 680.9 653.2 675.0 677.9 683.2 685.3 691.4 6.1Oil and gas extraction ........................................ 141.8 153.5 152.9 155.5 142.8 152.3 153.1 154.5 154.3 156.2 1.9
1Mining, except oil and gas ................................. 214.3 216.6 215.5 217.6 221.7 226.0 225.2 227.0 225.9 225.7 -.2Coal mining ...................................................... 76.9 78.5 78.3 78.7 77.2 78.7 78.3 78.6 78.8 79.0 .2
Support activities for mining .............................. 286.3 297.8 300.9 307.8 288.7 296.7 299.6 301.7 305.1 309.5 4.4
Construction ............................................................. 7,353 7,012 6,932 6,981 7,694 7,520 7,465 7,426 7,389 7,338 -51Construction of buildings ................................... 1,739.5 1,630.2 1,597.4 1,606.2 1,796.1 1,716.4 1,702.4 1,690.2 1,674.0 1,669.7 -4.3
Residential building ......................................... 942.1 857.5 835.7 838.4 974.0 913.3 902.0 891.9 879.1 875.4 -3.7Nonresidential building .................................... 797.4 772.7 761.7 767.8 822.1 803.1 800.4 798.3 794.9 794.3 -.6
Heavy and civil engineering construction ........ 925.7 882.3 872.9 887.5 1,007.5 999.0 993.8 984.6 977.6 972.5 -5.1Specialty trade contractors ............................... 4,687.4 4,499.4 4,462.1 4,487.0 4,889.9 4,804.8 4,768.4 4,750.8 4,737.4 4,695.3 -42.1Residential specialty trade contractors ........... 2,222.1 2,056.5 2,027.5 2,031.3 2,323.5 2,226.7 2,201.1 2,176.2 2,163.9 2,136.6 -27.3Nonresidential specialty trade contractors ..... 2,465.3 2,442.9 2,434.6 2,455.7 2,566.4 2,578.1 2,567.3 2,574.6 2,573.5 2,558.7 -14.8
Manufacturing ........................................................... 13,887 13,632 13,593 13,574 13,953 13,794 13,772 13,737 13,691 13,643 -48Production workers ....................................... 9,939 9,833 9,796 9,788 9,997 9,944 9,933 9,922 9,878 9,849 -29
Durable goods ....................................................... 8,837 8,662 8,641 8,624 8,863 8,763 8,739 8,718 8,688 8,653 -35Production workers ....................................... 6,245 6,166 6,142 6,126 6,266 6,242 6,220 6,214 6,181 6,152 -29
Wood products ................................................... 517.3 495.3 486.6 484.2 525.7 509.0 507.2 503.5 498.0 493.1 -4.9Nonmetallic mineral products ............................ 495.6 478.8 475.5 476.2 506.1 499.5 496.4 494.4 492.8 487.5 -5.3Primary metals .................................................... 459.5 452.1 450.9 450.6 459.5 452.6 452.2 452.3 450.4 450.4 .0Fabricated metal products ................................. 1,556.9 1,553.8 1,550.6 1,553.6 1,561.1 1,565.6 1,562.7 1,560.9 1,558.5 1,558.5 .0Machinery ........................................................... 1,186.8 1,190.7 1,190.1 1,196.3 1,186.6 1,189.9 1,191.0 1,193.8 1,192.2 1,196.3 4.1
1Computer and electronic products .................... 1,279.6 1,253.9 1,250.2 1,252.6 1,284.5 1,260.5 1,257.6 1,256.3 1,252.3 1,254.9 2.6Computer and peripheral equipment ............. 188.0 184.8 186.5 187.1 188.7 185.5 185.4 184.9 186.7 187.1 .4Communications equipment ........................... 128.8 129.2 128.7 130.1 129.0 129.5 129.0 129.5 128.7 130.2 1.5Semiconductors and electronic components . 449.8 432.6 428.3 426.3 451.9 437.0 434.9 433.5 429.7 427.7 -2.0Electronic instruments ..................................... 443.2 443.0 442.3 445.3 444.9 443.0 443.7 444.3 442.6 446.1 3.5
Electrical equipment and appliances ................ 427.8 420.5 419.7 419.3 427.8 426.6 423.8 421.6 420.6 419.7 -.91Transportation equipment .................................. 1,732.9 1,667.5 1,672.7 1,651.2 1,728.2 1,693.5 1,684.7 1,678.1 1,673.1 1,649.8 -23.32Motor vehicles and parts ................................. 1,026.4 943.7 950.8 928.4 1,020.2 972.7 962.6 956.6 949.4 925.2 -24.2
Furniture and related products .......................... 537.6 516.1 512.6 509.7 539.4 527.0 523.8 520.4 516.5 511.4 -5.1Miscellaneous manufacturing ............................ 642.9 633.0 632.2 630.0 644.2 638.8 639.9 636.4 633.5 631.6 -1.9
Nondurable goods ................................................. 5,050 4,970 4,952 4,950 5,090 5,031 5,033 5,019 5,003 4,990 -13Production workers ....................................... 3,694 3,667 3,654 3,662 3,731 3,702 3,713 3,708 3,697 3,697 0
Food manufacturing ........................................... 1,452.3 1,462.0 1,455.1 1,453.6 1,479.7 1,477.9 1,486.3 1,483.2 1,483.2 1,480.6 -2.6Beverages and tobacco products ...................... 190.4 186.8 184.1 185.0 195.6 194.3 192.0 191.1 189.1 190.4 1.3Textile mills ......................................................... 175.6 161.0 159.8 158.1 175.3 164.9 163.0 162.0 160.8 157.9 -2.9Textile product mills ........................................... 160.3 153.1 152.0 153.4 160.2 157.2 155.7 154.0 153.0 153.3 .3Apparel ................................................................ 218.9 196.6 198.3 197.4 219.0 206.4 204.8 202.0 200.1 197.6 -2.5Leather and allied products ............................... 34.8 34.3 33.4 33.7 34.6 34.1 33.7 34.5 33.5 33.4 -.1Paper and paper products ................................. 459.4 459.1 456.7 456.2 461.2 458.6 460.3 459.0 458.0 457.8 -.2Printing and related support activities ............... 627.0 615.5 610.3 613.2 628.1 622.0 619.5 620.1 614.5 614.6 .1Petroleum and coal products ............................. 112.0 108.2 109.3 108.9 114.3 112.1 111.7 112.2 112.6 111.3 -1.3Chemicals ........................................................... 861.4 858.5 858.1 857.8 862.6 860.5 862.0 861.2 860.0 859.1 -.9Plastics and rubber products ............................. 758.0 734.8 735.2 733.0 759.2 743.0 744.2 739.7 738.4 734.4 -4.0
See footnotes at the end of table.

ESTABLISHMENT DATA ESTABLISHMENT DATA
Table B-1. Employees on nonfarm payrolls by industry sector and selected industry detail Continued
(In thousands)
Industry
Not seasonally adjusted Seasonally adjusted
Mar. 2007
Jan. 2008
Feb. 2008p
Mar. 2008p
Mar. 2007
Nov. 2007
Dec. 2007
Jan. 2008
Feb. 2008p
Mar. 2008p
Changefrom:
Feb. 2008-Mar. 2008p
Service-providing .............................................. 114,592 114,541 115,188 115,723 114,948 115,988 116,102 116,095 116,101 116,114 13
Private service-providing ............................... 92,042 92,330 92,492 92,922 92,805 93,710 93,769 93,759 93,732 93,727 -5
Trade, transportation, and utilities ........................... 26,292 26,456 26,185 26,260 26,584 26,693 26,658 26,631 26,576 26,556 -20
Wholesale trade .................................................... 5,955.2 6,018.5 6,007.8 6,021.6 5,984.0 6,075.0 6,072.9 6,067.3 6,058.5 6,053.9 -4.6Durable goods .................................................... 3,097.1 3,119.6 3,109.6 3,117.5 3,107.6 3,152.4 3,145.0 3,138.0 3,129.5 3,130.0 .5Nondurable goods .............................................. 2,039.7 2,064.8 2,060.6 2,068.5 2,054.7 2,086.6 2,089.3 2,090.9 2,086.7 2,084.9 -1.8Electronic markets and agents and brokers ..... 818.4 834.1 837.6 835.6 821.7 836.0 838.6 838.4 842.3 839.0 -3.3
Retail trade ............................................................ 15,295.3 15,380.7 15,137.4 15,190.9 15,519.9 15,513.1 15,487.8 15,472.2 15,425.5 15,413.1 -12.41Motor vehicle and parts dealers ........................ 1,900.3 1,883.5 1,880.5 1,889.0 1,912.1 1,911.0 1,909.3 1,910.2 1,903.7 1,901.8 -1.9
Automobile dealers ......................................... 1,238.4 1,232.7 1,226.1 1,229.3 1,242.8 1,244.9 1,244.6 1,244.0 1,235.9 1,234.5 -1.4Furniture and home furnishings stores ............. 574.3 586.0 570.3 562.4 580.5 584.9 584.5 579.9 575.2 570.0 -5.2Electronics and appliance stores ....................... 545.8 536.2 531.6 533.1 547.6 542.6 540.4 534.3 534.3 535.0 .7Building material and garden supply stores ...... 1,295.3 1,203.9 1,204.9 1,228.1 1,317.9 1,279.9 1,271.6 1,266.0 1,259.1 1,250.1 -9.0Food and beverage stores ................................. 2,805.8 2,867.2 2,852.3 2,853.2 2,836.0 2,871.9 2,871.9 2,880.1 2,881.0 2,883.6 2.6Health and personal care stores ....................... 979.5 1,000.9 991.9 992.9 985.2 998.6 999.9 1,000.6 996.6 998.3 1.7Gasoline stations ................................................ 854.4 842.3 842.9 848.3 864.6 859.1 850.5 853.8 855.4 858.2 2.8Clothing and clothing accessories stores ......... 1,438.4 1,498.2 1,434.3 1,445.5 1,486.5 1,524.5 1,508.6 1,498.2 1,496.7 1,499.4 2.7Sporting goods, hobby, book, and musicstores ................................................................ 636.5 686.3 655.0 645.2 651.2 664.0 661.6 667.2 663.7 662.1 -1.6
1General merchandise stores ............................. 2,986.6 2,975.8 2,883.2 2,914.8 3,033.5 2,968.2 2,976.7 2,971.1 2,952.2 2,949.7 -2.5Department stores .......................................... 1,555.4 1,580.0 1,501.7 1,501.7 1,592.2 1,560.6 1,568.4 1,564.3 1,547.7 1,543.1 -4.6
Miscellaneous store retailers ............................. 851.4 856.4 853.7 844.1 869.2 868.3 866.3 869.4 864.9 862.2 -2.7Nonstore retailers ............................................... 427.0 444.0 436.8 434.3 435.6 440.1 446.5 441.4 442.7 442.7 .0
Transportation and warehousing .......................... 4,494.3 4,501.7 4,486.8 4,493.0 4,530.4 4,549.0 4,539.9 4,534.5 4,535.7 4,531.8 -3.9Air transportation ................................................ 483.7 501.2 505.8 506.6 487.2 503.0 502.1 504.7 509.8 508.9 -.9Rail transportation .............................................. 234.7 231.5 231.8 232.8 236.1 233.8 232.5 233.8 233.7 234.1 .4Water transportation ........................................... 61.1 61.8 59.9 59.5 63.5 65.0 64.4 63.8 63.0 62.4 -.6Truck transportation ........................................... 1,425.8 1,396.8 1,383.7 1,394.4 1,451.5 1,428.7 1,423.1 1,422.5 1,418.4 1,419.3 .9Transit and ground passenger transportation ... 420.4 423.9 426.3 423.5 406.1 411.5 411.8 411.9 411.7 410.3 -1.4Pipeline transportation ....................................... 39.9 40.7 41.0 41.0 40.1 40.6 40.8 40.6 41.0 41.1 .1Scenic and sightseeing transportation .............. 23.0 24.3 24.2 25.2 29.1 30.9 31.3 31.0 31.6 31.4 -.2Support activities for transportation ................... 577.4 580.7 583.6 581.2 578.9 589.2 587.1 584.9 585.4 583.8 -1.6Couriers and messengers .................................. 576.5 587.7 580.6 578.2 582.1 584.4 588.1 585.5 585.8 584.3 -1.5Warehousing and storage .................................. 651.8 653.1 649.9 650.6 655.8 661.9 658.7 655.8 655.3 656.2 .9
Utilities ................................................................... 547.5 554.9 553.1 554.3 550.0 555.5 557.1 557.1 556.5 557.0 .5
Information ................................................................ 3,024 2,993 3,007 3,005 3,030 3,022 3,018 3,014 3,016 3,010 -6Publishing industries, except Internet ............... 902.0 886.1 886.4 883.6 902.2 892.2 889.7 889.2 886.5 884.0 -2.5Motion picture and sound recording industries . 374.8 360.8 371.2 377.3 380.7 376.3 376.3 372.9 379.7 381.4 1.7Broadcasting, except Internet ............................ 326.2 321.9 321.9 321.0 327.4 325.0 321.9 323.0 322.5 322.2 -.3Telecommunications .......................................... 1,031.5 1,024.5 1,023.3 1,018.2 1,031.3 1,026.4 1,026.8 1,025.3 1,021.0 1,017.7 -3.3Data processing, hosting and related services . 268.4 270.4 273.5 272.4 267.0 272.6 273.5 273.0 274.2 271.3 -2.9Other information services ................................. 121.5 129.3 130.6 132.6 121.8 129.5 129.3 130.5 131.7 133.2 1.5
Financial activities .................................................... 8,303 8,185 8,186 8,191 8,333 8,260 8,252 8,244 8,233 8,228 -5Finance and insurance .......................................... 6,164.1 6,084.8 6,097.9 6,101.6 6,163.2 6,115.5 6,111.2 6,106.2 6,102.5 6,102.7 .2
Monetary authorities - central bank ................... 21.3 20.6 20.8 20.9 21.4 20.7 20.7 20.7 20.9 20.9 .01Credit intermediation and related activities ....... 2,919.6 2,816.3 2,822.4 2,817.6 2,917.4 2,834.3 2,829.2 2,825.0 2,821.6 2,816.2 -5.4
1Depository credit intermediation ..................... 1,819.9 1,819.0 1,822.8 1,821.0 1,820.5 1,823.4 1,824.6 1,821.5 1,823.9 1,822.8 -1.1Commercial banking .................................... 1,347.3 1,341.1 1,344.6 1,344.0 1,347.1 1,344.7 1,345.9 1,342.2 1,346.0 1,344.6 -1.4
Securities, commodity contracts, investments .. 840.7 855.3 861.8 864.7 840.8 856.9 856.7 859.2 862.6 865.0 2.4Insurance carriers and related activities ........... 2,294.3 2,305.6 2,305.4 2,311.5 2,295.9 2,315.6 2,316.8 2,313.9 2,310.2 2,314.1 3.9Funds, trusts, and other financial vehicles ........ 88.2 87.0 87.5 86.9 87.7 88.0 87.8 87.4 87.2 86.5 -.7
Real estate and rental and leasing ....................... 2,138.5 2,100.2 2,087.8 2,088.9 2,169.9 2,144.7 2,140.6 2,138.0 2,130.1 2,125.6 -4.5Real estate .......................................................... 1,481.0 1,445.4 1,440.1 1,440.5 1,499.4 1,477.1 1,476.4 1,471.4 1,467.3 1,463.1 -4.2Rental and leasing services ............................... 629.6 624.0 616.6 617.0 641.9 637.4 633.6 635.2 631.2 630.5 -.7Lessors of nonfinancial intangible assets ......... 27.9 30.8 31.1 31.4 28.6 30.2 30.6 31.4 31.6 32.0 .4
See footnotes at the end of table.
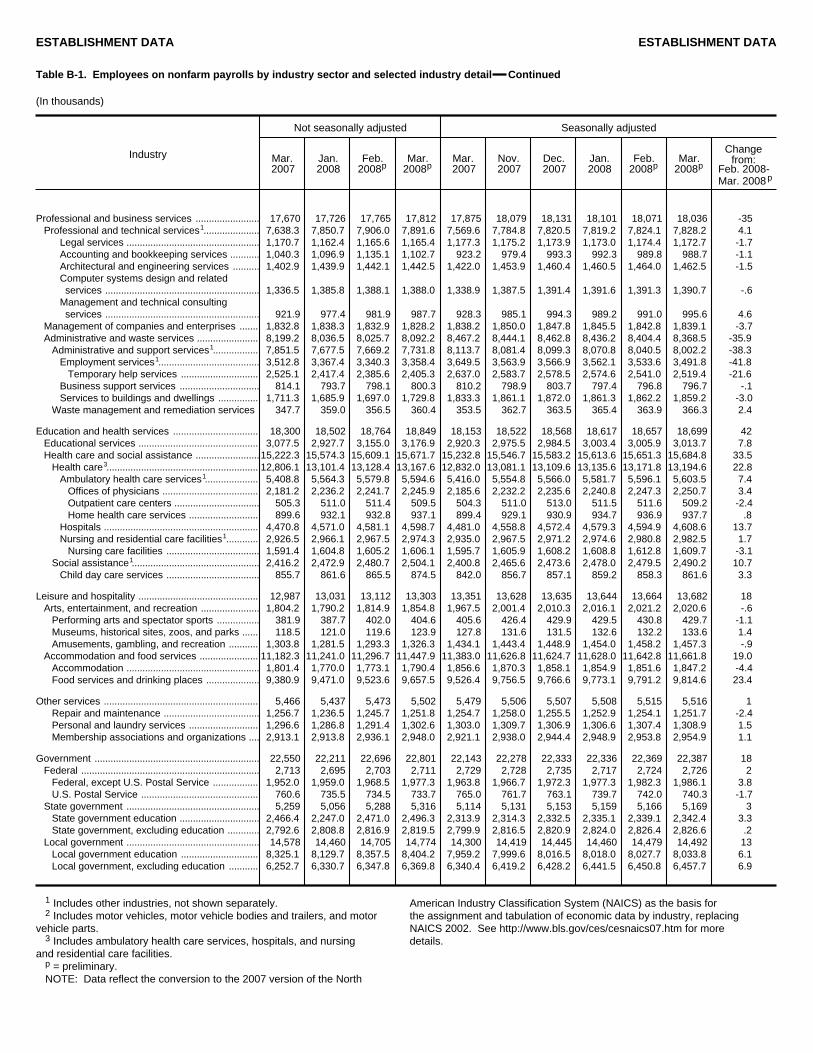
ESTABLISHMENT DATA ESTABLISHMENT DATA
Table B-1. Employees on nonfarm payrolls by industry sector and selected industry detail Continued
(In thousands)
Industry
Not seasonally adjusted Seasonally adjusted
Mar. 2007
Jan. 2008
Feb. 2008p
Mar. 2008p
Mar. 2007
Nov. 2007
Dec. 2007
Jan. 2008
Feb. 2008p
Mar. 2008p
Changefrom:
Feb. 2008-Mar. 2008p
Professional and business services ........................ 17,670 17,726 17,765 17,812 17,875 18,079 18,131 18,101 18,071 18,036 -351Professional and technical services ..................... 7,638.3 7,850.7 7,906.0 7,891.6 7,569.6 7,784.8 7,820.5 7,819.2 7,824.1 7,828.2 4.1
Legal services .................................................. 1,170.7 1,162.4 1,165.6 1,165.4 1,177.3 1,175.2 1,173.9 1,173.0 1,174.4 1,172.7 -1.7Accounting and bookkeeping services ........... 1,040.3 1,096.9 1,135.1 1,102.7 923.2 979.4 993.3 992.3 989.8 988.7 -1.1Architectural and engineering services .......... 1,402.9 1,439.9 1,442.1 1,442.5 1,422.0 1,453.9 1,460.4 1,460.5 1,464.0 1,462.5 -1.5Computer systems design and relatedservices .......................................................... 1,336.5 1,385.8 1,388.1 1,388.0 1,338.9 1,387.5 1,391.4 1,391.6 1,391.3 1,390.7 -.6
Management and technical consultingservices .......................................................... 921.9 977.4 981.9 987.7 928.3 985.1 994.3 989.2 991.0 995.6 4.6
Management of companies and enterprises ....... 1,832.8 1,838.3 1,832.9 1,828.2 1,838.2 1,850.0 1,847.8 1,845.5 1,842.8 1,839.1 -3.7Administrative and waste services ....................... 8,199.2 8,036.5 8,025.7 8,092.2 8,467.2 8,444.1 8,462.8 8,436.2 8,404.4 8,368.5 -35.9
1Administrative and support services ................. 7,851.5 7,677.5 7,669.2 7,731.8 8,113.7 8,081.4 8,099.3 8,070.8 8,040.5 8,002.2 -38.31Employment services ...................................... 3,512.8 3,367.4 3,340.3 3,358.4 3,649.5 3,563.9 3,566.9 3,562.1 3,533.6 3,491.8 -41.8
Temporary help services ............................. 2,525.1 2,417.4 2,385.6 2,405.3 2,637.0 2,583.7 2,578.5 2,574.6 2,541.0 2,519.4 -21.6Business support services .............................. 814.1 793.7 798.1 800.3 810.2 798.9 803.7 797.4 796.8 796.7 -.1Services to buildings and dwellings ............... 1,711.3 1,685.9 1,697.0 1,729.8 1,833.3 1,861.1 1,872.0 1,861.3 1,862.2 1,859.2 -3.0
Waste management and remediation services 347.7 359.0 356.5 360.4 353.5 362.7 363.5 365.4 363.9 366.3 2.4
Education and health services ................................ 18,300 18,502 18,764 18,849 18,153 18,522 18,568 18,617 18,657 18,699 42Educational services ............................................. 3,077.5 2,927.7 3,155.0 3,176.9 2,920.3 2,975.5 2,984.5 3,003.4 3,005.9 3,013.7 7.8Health care and social assistance ........................15,222.3 15,574.3 15,609.1 15,671.7 15,232.8 15,546.7 15,583.2 15,613.6 15,651.3 15,684.8 33.5
3Health care ......................................................... 12,806.1 13,101.4 13,128.4 13,167.6 12,832.0 13,081.1 13,109.6 13,135.6 13,171.8 13,194.6 22.81Ambulatory health care services .................... 5,408.8 5,564.3 5,579.8 5,594.6 5,416.0 5,554.8 5,566.0 5,581.7 5,596.1 5,603.5 7.4
Offices of physicians .................................... 2,181.2 2,236.2 2,241.7 2,245.9 2,185.6 2,232.2 2,235.6 2,240.8 2,247.3 2,250.7 3.4Outpatient care centers ................................ 505.3 511.0 511.4 509.5 504.3 511.0 513.0 511.5 511.6 509.2 -2.4Home health care services .......................... 899.6 932.1 932.8 937.1 899.4 929.1 930.9 934.7 936.9 937.7 .8
Hospitals .......................................................... 4,470.8 4,571.0 4,581.1 4,598.7 4,481.0 4,558.8 4,572.4 4,579.3 4,594.9 4,608.6 13.71Nursing and residential care facilities ............ 2,926.5 2,966.1 2,967.5 2,974.3 2,935.0 2,967.5 2,971.2 2,974.6 2,980.8 2,982.5 1.7
Nursing care facilities ................................... 1,591.4 1,604.8 1,605.2 1,606.1 1,595.7 1,605.9 1,608.2 1,608.8 1,612.8 1,609.7 -3.11Social assistance ................................................ 2,416.2 2,472.9 2,480.7 2,504.1 2,400.8 2,465.6 2,473.6 2,478.0 2,479.5 2,490.2 10.7
Child day care services ................................... 855.7 861.6 865.5 874.5 842.0 856.7 857.1 859.2 858.3 861.6 3.3
Leisure and hospitality ............................................. 12,987 13,031 13,112 13,303 13,351 13,628 13,635 13,644 13,664 13,682 18Arts, entertainment, and recreation ...................... 1,804.2 1,790.2 1,814.9 1,854.8 1,967.5 2,001.4 2,010.3 2,016.1 2,021.2 2,020.6 -.6
Performing arts and spectator sports ................ 381.9 387.7 402.0 404.6 405.6 426.4 429.9 429.5 430.8 429.7 -1.1Museums, historical sites, zoos, and parks ...... 118.5 121.0 119.6 123.9 127.8 131.6 131.5 132.6 132.2 133.6 1.4Amusements, gambling, and recreation ........... 1,303.8 1,281.5 1,293.3 1,326.3 1,434.1 1,443.4 1,448.9 1,454.0 1,458.2 1,457.3 -.9
Accommodation and food services ...................... 11,182.3 11,241.0 11,296.7 11,447.9 11,383.0 11,626.8 11,624.7 11,628.0 11,642.8 11,661.8 19.0Accommodation .................................................. 1,801.4 1,770.0 1,773.1 1,790.4 1,856.6 1,870.3 1,858.1 1,854.9 1,851.6 1,847.2 -4.4Food services and drinking places .................... 9,380.9 9,471.0 9,523.6 9,657.5 9,526.4 9,756.5 9,766.6 9,773.1 9,791.2 9,814.6 23.4
Other services .......................................................... 5,466 5,437 5,473 5,502 5,479 5,506 5,507 5,508 5,515 5,516 1Repair and maintenance .................................... 1,256.7 1,236.5 1,245.7 1,251.8 1,254.7 1,258.0 1,255.5 1,252.9 1,254.1 1,251.7 -2.4Personal and laundry services .......................... 1,296.6 1,286.8 1,291.4 1,302.6 1,303.0 1,309.7 1,306.9 1,306.6 1,307.4 1,308.9 1.5Membership associations and organizations .... 2,913.1 2,913.8 2,936.1 2,948.0 2,921.1 2,938.0 2,944.4 2,948.9 2,953.8 2,954.9 1.1
Government .............................................................. 22,550 22,211 22,696 22,801 22,143 22,278 22,333 22,336 22,369 22,387 18Federal ................................................................... 2,713 2,695 2,703 2,711 2,729 2,728 2,735 2,717 2,724 2,726 2
Federal, except U.S. Postal Service ................. 1,952.0 1,959.0 1,968.5 1,977.3 1,963.8 1,966.7 1,972.3 1,977.3 1,982.3 1,986.1 3.8U.S. Postal Service ............................................ 760.6 735.5 734.5 733.7 765.0 761.7 763.1 739.7 742.0 740.3 -1.7
State government .................................................. 5,259 5,056 5,288 5,316 5,114 5,131 5,153 5,159 5,166 5,169 3State government education .............................. 2,466.4 2,247.0 2,471.0 2,496.3 2,313.9 2,314.3 2,332.5 2,335.1 2,339.1 2,342.4 3.3State government, excluding education ............ 2,792.6 2,808.8 2,816.9 2,819.5 2,799.9 2,816.5 2,820.9 2,824.0 2,826.4 2,826.6 .2
Local government .................................................. 14,578 14,460 14,705 14,774 14,300 14,419 14,445 14,460 14,479 14,492 13Local government education ............................. 8,325.1 8,129.7 8,357.5 8,404.2 7,959.2 7,999.6 8,016.5 8,018.0 8,027.7 8,033.8 6.1Local government, excluding education ........... 6,252.7 6,330.7 6,347.8 6,369.8 6,340.4 6,419.2 6,428.2 6,441.5 6,450.8 6,457.7 6.9
1 Includes other industries, not shown separately.2 Includes motor vehicles, motor vehicle bodies and trailers, and motor
vehicle parts.3 Includes ambulatory health care services, hospitals, and nursing
and residential care facilities.p = preliminary.NOTE: Data reflect the conversion to the 2007 version of the North
American Industry Classification System (NAICS) as the basis forthe assignment and tabulation of economic data by industry, replacingNAICS 2002. See http://www.bls.gov/ces/cesnaics07.htm for moredetails.
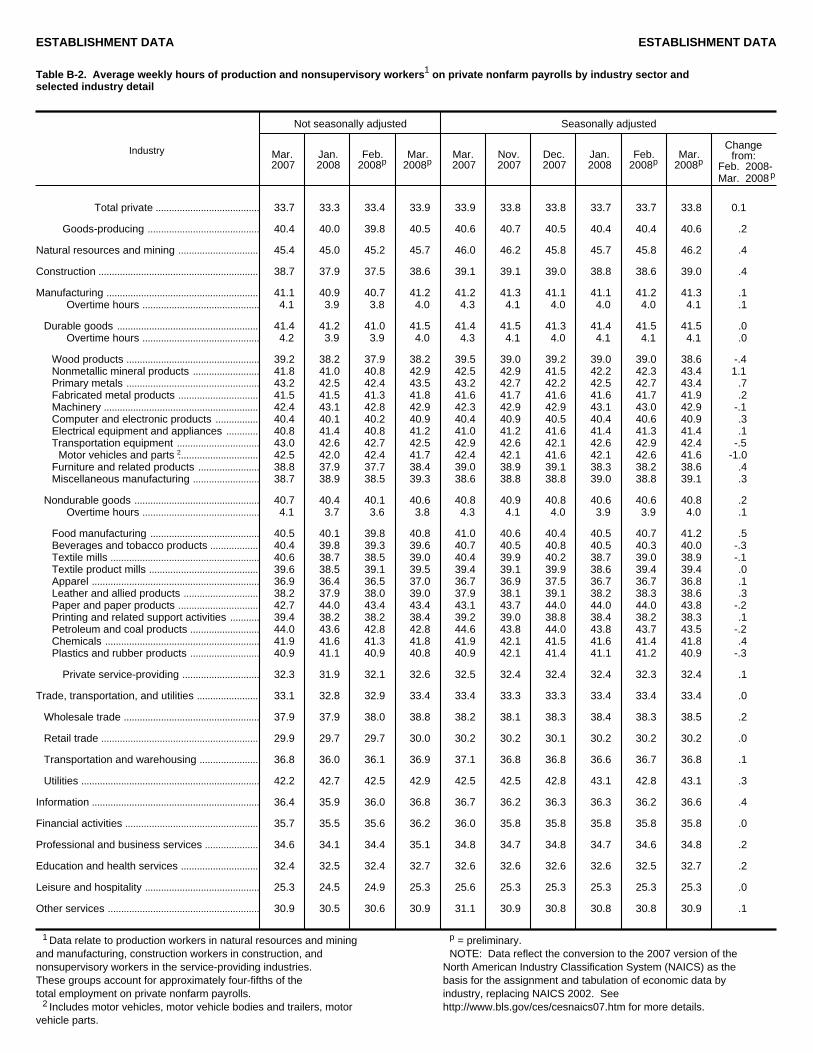
ESTABLISHMENT DATA ESTABLISHMENT DATA
Table B-2. Average weekly hours of production and nonsupervisory workers1 on private nonfarm payrolls by industry sector andselected industry detail
Industry
Not seasonally adjusted Seasonally adjusted
Mar. 2007
Jan. 2008
Feb. 2008p
Mar. 2008p
Mar. 2007
Nov. 2007
Dec. 2007
Jan. 2008
Feb. 2008p
Mar. 2008p
Changefrom:
Feb. 2008-Mar. 2008p
Total private ....................................... 33.7 33.3 33.4 33.9 33.9 33.8 33.8 33.7 33.7 33.8 0.1
Goods-producing .......................................... 40.4 40.0 39.8 40.5 40.6 40.7 40.5 40.4 40.4 40.6 .2
Natural resources and mining .............................. 45.4 45.0 45.2 45.7 46.0 46.2 45.8 45.7 45.8 46.2 .4
Construction ............................................................ 38.7 37.9 37.5 38.6 39.1 39.1 39.0 38.8 38.6 39.0 .4
Manufacturing ......................................................... 41.1 40.9 40.7 41.2 41.2 41.3 41.1 41.1 41.2 41.3 .1Overtime hours ............................................ 4.1 3.9 3.8 4.0 4.3 4.1 4.0 4.0 4.0 4.1 .1
Durable goods ..................................................... 41.4 41.2 41.0 41.5 41.4 41.5 41.3 41.4 41.5 41.5 .0Overtime hours ............................................ 4.2 3.9 3.9 4.0 4.3 4.1 4.0 4.1 4.1 4.1 .0
Wood products .................................................. 39.2 38.2 37.9 38.2 39.5 39.0 39.2 39.0 39.0 38.6 -.4Nonmetallic mineral products ......................... 41.8 41.0 40.8 42.9 42.5 42.9 41.5 42.2 42.3 43.4 1.1Primary metals .................................................. 43.2 42.5 42.4 43.5 43.2 42.7 42.2 42.5 42.7 43.4 .7Fabricated metal products .............................. 41.5 41.5 41.3 41.8 41.6 41.7 41.6 41.6 41.7 41.9 .2Machinery .......................................................... 42.4 43.1 42.8 42.9 42.3 42.9 42.9 43.1 43.0 42.9 -.1Computer and electronic products ................ 40.4 40.1 40.2 40.9 40.4 40.9 40.5 40.4 40.6 40.9 .3Electrical equipment and appliances ............ 40.8 41.4 40.8 41.2 41.0 41.2 41.6 41.4 41.3 41.4 .1Transportation equipment ............................... 43.0 42.6 42.7 42.5 42.9 42.6 42.1 42.6 42.9 42.4 -.5
2Motor vehicles and parts .............................. 42.5 42.0 42.4 41.7 42.4 42.1 41.6 42.1 42.6 41.6 -1.0Furniture and related products ....................... 38.8 37.9 37.7 38.4 39.0 38.9 39.1 38.3 38.2 38.6 .4Miscellaneous manufacturing ......................... 38.7 38.9 38.5 39.3 38.6 38.8 38.8 39.0 38.8 39.1 .3
Nondurable goods ............................................... 40.7 40.4 40.1 40.6 40.8 40.9 40.8 40.6 40.6 40.8 .2Overtime hours ............................................ 4.1 3.7 3.6 3.8 4.3 4.1 4.0 3.9 3.9 4.0 .1
Food manufacturing ......................................... 40.5 40.1 39.8 40.8 41.0 40.6 40.4 40.5 40.7 41.2 .5Beverages and tobacco products .................. 40.4 39.8 39.3 39.6 40.7 40.5 40.8 40.5 40.3 40.0 -.3Textile mills ........................................................ 40.6 38.7 38.5 39.0 40.4 39.9 40.2 38.7 39.0 38.9 -.1Textile product mills ......................................... 39.6 38.5 39.1 39.5 39.4 39.1 39.9 38.6 39.4 39.4 .0Apparel ............................................................... 36.9 36.4 36.5 37.0 36.7 36.9 37.5 36.7 36.7 36.8 .1Leather and allied products ............................ 38.2 37.9 38.0 39.0 37.9 38.1 39.1 38.2 38.3 38.6 .3Paper and paper products .............................. 42.7 44.0 43.4 43.4 43.1 43.7 44.0 44.0 44.0 43.8 -.2Printing and related support activities ........... 39.4 38.2 38.2 38.4 39.2 39.0 38.8 38.4 38.2 38.3 .1Petroleum and coal products .......................... 44.0 43.6 42.8 42.8 44.6 43.8 44.0 43.8 43.7 43.5 -.2Chemicals .......................................................... 41.9 41.6 41.3 41.8 41.9 42.1 41.5 41.6 41.4 41.8 .4Plastics and rubber products .......................... 40.9 41.1 40.9 40.8 40.9 42.1 41.4 41.1 41.2 40.9 -.3
Private service-providing ............................. 32.3 31.9 32.1 32.6 32.5 32.4 32.4 32.4 32.3 32.4 .1
Trade, transportation, and utilities ....................... 33.1 32.8 32.9 33.4 33.4 33.3 33.3 33.4 33.4 33.4 .0
Wholesale trade ................................................... 37.9 37.9 38.0 38.8 38.2 38.1 38.3 38.4 38.3 38.5 .2
Retail trade ........................................................... 29.9 29.7 29.7 30.0 30.2 30.2 30.1 30.2 30.2 30.2 .0
Transportation and warehousing ...................... 36.8 36.0 36.1 36.9 37.1 36.8 36.8 36.6 36.7 36.8 .1
Utilities ................................................................... 42.2 42.7 42.5 42.9 42.5 42.5 42.8 43.1 42.8 43.1 .3
Information ............................................................... 36.4 35.9 36.0 36.8 36.7 36.2 36.3 36.3 36.2 36.6 .4
Financial activities .................................................. 35.7 35.5 35.6 36.2 36.0 35.8 35.8 35.8 35.8 35.8 .0
Professional and business services .................... 34.6 34.1 34.4 35.1 34.8 34.7 34.8 34.7 34.6 34.8 .2
Education and health services ............................. 32.4 32.5 32.4 32.7 32.6 32.6 32.6 32.6 32.5 32.7 .2
Leisure and hospitality ........................................... 25.3 24.5 24.9 25.3 25.6 25.3 25.3 25.3 25.3 25.3 .0
Other services ......................................................... 30.9 30.5 30.6 30.9 31.1 30.9 30.8 30.8 30.8 30.9 .1
1 Data relate to production workers in natural resources and miningand manufacturing, construction workers in construction, andnonsupervisory workers in the service-providing industries.These groups account for approximately four-fifths of thetotal employment on private nonfarm payrolls.
2 Includes motor vehicles, motor vehicle bodies and trailers, motorvehicle parts.
p = preliminary.NOTE: Data reflect the conversion to the 2007 version of the
North American Industry Classification System (NAICS) as thebasis for the assignment and tabulation of economic data byindustry, replacing NAICS 2002. Seehttp://www.bls.gov/ces/cesnaics07.htm for more details.

ESTABLISHMENT DATA ESTABLISHMENT DATA
Table B-3. Average hourly and weekly earnings of production and nonsupervisory workers1 on private nonfarm payrolls by industry sector and selected industry detail
Industry
Average hourly earnings Average weekly earnings
Mar. 2007
Jan. 2008
Feb. 2008p
Mar. 2008p
Mar. 2007
Jan. 2008
Feb. 2008p
Mar. 2008p
Total private ....................................... $17.24 $17.80 $17.85 $17.92 $580.99 $592.74 $596.19 $607.49Seasonally adjusted ..................... 17.24 17.75 17.81 17.86 584.44 598.18 600.20 603.67
Goods-producing .......................................... 18.38 18.90 18.93 19.03 742.55 756.00 753.41 770.72
Natural resources and mining .............................. 20.86 21.96 21.86 22.37 947.04 988.20 988.07 1,022.31
Construction ............................................................ 20.55 21.24 21.35 21.46 795.29 805.00 800.63 828.36
Manufacturing ......................................................... 17.09 17.53 17.55 17.58 702.40 716.98 714.29 724.30
Durable goods ..................................................... 18.02 18.43 18.49 18.52 746.03 759.32 758.09 768.58Wood products .................................................. 13.58 13.90 13.84 13.99 532.34 530.98 524.54 534.42Nonmetallic mineral products ......................... 16.91 16.99 16.82 16.68 706.84 696.59 686.26 715.57Primary metals .................................................. 19.38 20.04 20.00 20.19 837.22 851.70 848.00 878.27Fabricated metal products .............................. 16.36 16.77 16.78 16.82 678.94 695.96 693.01 703.08Machinery .......................................................... 17.70 17.72 17.75 17.81 750.48 763.73 759.70 764.05Computer and electronic products ................ 19.57 20.51 20.58 20.82 790.63 822.45 827.32 851.54Electrical equipment and appliances ............ 15.96 15.70 15.74 15.65 651.17 649.98 642.19 644.78Transportation equipment ............................... 22.65 23.34 23.50 23.51 973.95 994.28 1,003.45 999.18Furniture and related products ....................... 14.30 14.38 14.39 14.47 554.84 545.00 542.50 555.65Miscellaneous manufacturing ......................... 14.57 14.91 14.88 15.05 563.86 580.00 572.88 591.47
Nondurable goods ............................................... 15.47 15.99 15.92 15.96 629.63 646.00 638.39 647.98Food manufacturing ......................................... 13.36 13.87 13.75 13.78 541.08 556.19 547.25 562.22Beverages and tobacco products .................. 18.46 19.55 19.53 19.52 745.78 778.09 767.53 772.99Textile mills ........................................................ 12.81 13.29 13.35 13.44 520.09 514.32 513.98 524.16Textile product mills ......................................... 11.83 11.68 11.66 11.81 468.47 449.68 455.91 466.50Apparel ............................................................... 10.79 11.43 11.47 11.23 398.15 416.05 418.66 415.51Leather and allied products ............................ 11.83 12.78 12.72 12.91 451.91 484.36 483.36 503.49Paper and paper products .............................. 18.17 18.78 18.53 18.68 775.86 826.32 804.20 810.71Printing and related support activities ........... 15.88 16.51 16.55 16.66 625.67 630.68 632.21 639.74Petroleum and coal products .......................... 24.77 26.55 26.51 27.03 1,089.88 1,157.58 1,134.63 1,156.88Chemicals .......................................................... 19.46 19.46 19.36 19.26 815.37 809.54 799.57 805.07Plastics and rubber products .......................... 15.23 15.56 15.59 15.71 622.91 639.52 637.63 640.97
Private service-providing ............................. 16.95 17.52 17.58 17.64 547.49 558.89 564.32 575.06
Trade, transportation, and utilities ....................... 15.63 16.02 16.09 16.16 517.35 525.46 529.36 539.74
Wholesale trade ................................................... 19.26 20.01 20.04 20.09 729.95 758.38 761.52 779.49
Retail trade ........................................................... 12.71 12.78 12.83 12.91 380.03 379.57 381.05 387.30
Transportation and warehousing ...................... 17.48 18.08 18.14 18.11 643.26 650.88 654.85 668.26
Utilities ................................................................... 27.68 28.62 28.57 28.99 1,168.10 1,222.07 1,214.23 1,243.67
Information ............................................................... 23.73 24.44 24.43 24.52 863.77 877.40 879.48 902.34
Financial activities .................................................. 19.48 19.96 20.07 20.21 695.44 708.58 714.49 731.60
Professional and business services .................... 19.88 20.65 20.76 20.94 687.85 704.17 714.14 734.99
Education and health services ............................. 17.91 18.61 18.57 18.57 580.28 604.83 601.67 607.24
Leisure and hospitality ........................................... 10.23 10.73 10.81 10.79 258.82 262.89 269.17 272.99
Other services ......................................................... 15.35 15.74 15.79 15.88 474.32 480.07 483.17 490.69
1 See footnote 1, table B-2.p = preliminary.NOTE: Data reflect the conversion to the 2007 version of the
North American Industry Classification System (NAICS) as the
basis for the assignment and tabulation of economic data byindustry, replacing NAICS 2002. Seehttp://www.bls.gov/ces/cesnaics07.htm for more details.

ESTABLISHMENT DATA ESTABLISHMENT DATA
Table B-4. Average hourly earnings of production and nonsupervisory workers1 on private nonfarm payrolls by industry sector and selected industry detail, seasonally adjusted
Industry
Total private:
Mar. 2007
Nov. 2007
Dec. 2007
Jan. 2008
Feb. 2008p Mar.
2008p
Percentchange from:Feb. 2008-Mar. 2008 p
Current dollars ................................................ $17.24 $17.64 $17.70 $17.75 $17.81 $17.86 0.3Constant (1982) dollars 2................................. 8.33 8.27 8.27 8.26 8.29 N.A.
..........................................................Goods-producing 18.49 18.84 18.90 18.98 19.04 19.12 .4
..............................................Natural resources and mining 20.74 21.02 21.54 21.75 21.80 22.16 1.7
............................................................................Construction 20.70 21.20 21.30 21.38 21.47 21.59 .6
.........................................................................Manufacturing 17.11 17.40 17.41 17.49 17.55 17.59 .2.....................................................4Excluding overtime 16.26 16.58 16.60 16.68 16.74 16.76 .1
.....................................................................Durable goods 18.05 18.31 18.33 18.41 18.49 18.53 .2
...............................................................Nondurable goods 15.51 15.85 15.86 15.92 15.94 15.99 .3
.............................................Private service-providing 16.91 17.33 17.39 17.44 17.49 17.54 .3
.......................................Trade, transportation, and utilities 15.64 15.93 16.00 16.02 16.08 16.11 .2
...................................................................Wholesale trade 19.35 19.86 19.93 19.97 20.03 20.08 .2
...........................................................................Retail trade 12.70 12.81 12.81 12.80 12.84 12.87 .2
......................................Transportation and warehousing 17.54 17.93 18.07 18.10 18.22 18.17 -.3
...................................................................................Utilities 27.61 28.18 28.52 28.61 28.60 28.86 .9
...............................................................................Information 23.82 24.11 24.18 24.33 24.40 24.50 .4
..................................................................Financial activities 19.49 19.87 19.91 20.00 20.06 20.13 .3
....................................Professional and business services 19.86 20.42 20.46 20.53 20.62 20.72 .5
.............................................Education and health services 17.89 18.43 18.48 18.54 18.57 18.56 -.1
...........................................................Leisure and hospitality 10.20 10.61 10.65 10.67 10.73 10.76 .3
.........................................................................Other services 15.26 15.66 15.71 15.74 15.79 15.83 .3
3( )
1 See footnote 1, table B-2.2 The Consumer Price Index for Urban Wage Earners and Clerical
Workers (CPI-W) is used to deflate this series.3 Change was 0.4 percent from Jan. 2008 to Feb. 2008, the latest
month available.4 Derived by assuming that overtime hours are paid at the rate
of time and one-half.
N.A. = not available.p = preliminary.NOTE: Data reflect the conversion to the 2007 version of the
North American Industry Classification System (NAICS) as thebasis for the assignment and tabulation of economic data byindustry, replacing NAICS 2002. Seehttp://www.bls.gov/ces/cesnaics07.htm for more details.

ESTABLISHMENT DATA ESTABLISHMENT DATA
Table B-5. Indexes of aggregate weekly hours of production and nonsupervisory workers1 on private nonfarm payrolls by industry sector andselected industry detail
(2002=100)
Industry
Not seasonally adjusted Seasonally adjusted
Mar. 2007
Jan. 2008
Feb. 2008p
Mar. 2008p
Mar. 2007
Nov. 2007
Dec. 2007
Jan. 2008
Feb. 2008p
Mar. 2008p
Percentchange from:Feb. 2008-Mar. 2008p
Total private ....................................... 105.2 104.1 104.5 106.5 107.1 107.7 107.8 107.4 107.3 107.5 0.2
Goods-producing .......................................... 99.1 96.2 95.1 97.0 102.0 101.5 100.6 100.1 99.6 99.7 .1
Natural resources and mining .............................. 127.9 130.3 130.7 134.3 132.5 136.0 135.6 136.0 136.3 138.7 1.8
Construction ............................................................ 108.3 101.8 99.4 103.2 115.5 113.9 112.7 111.4 110.0 110.5 .5
Manufacturing ......................................................... 93.8 92.3 91.5 92.6 94.5 94.3 93.7 93.6 93.4 93.4 .0
Durable goods ..................................................... 97.1 95.4 94.6 95.5 97.5 97.3 96.5 96.6 96.4 95.9 -.5Wood products .................................................. 88.9 82.3 80.1 80.5 91.3 86.6 86.9 85.7 84.8 83.2 -1.9Nonmetallic mineral products ......................... 93.6 90.6 89.2 94.8 97.7 98.4 94.4 96.8 96.3 98.4 2.2Primary metals .................................................. 92.4 90.3 90.2 92.6 92.2 90.7 89.6 90.3 90.4 92.2 2.0Fabricated metal products .............................. 103.8 104.1 103.1 104.7 104.2 105.2 104.8 104.9 104.7 105.2 .5Machinery .......................................................... 102.5 105.8 104.7 104.8 102.2 104.9 105.0 105.8 105.3 104.9 -.4Computer and electronic products ................ 101.9 100.7 100.3 102.0 102.3 102.7 101.7 101.5 101.6 102.2 .6Electrical equipment and appliances ............ 87.9 88.3 86.8 88.2 88.3 89.1 89.2 88.5 88.3 88.6 .3Transportation equipment ............................... 98.6 94.9 95.6 93.6 98.2 97.2 95.2 95.8 96.0 93.4 -2.7
2Motor vehicles and parts .............................. 88.4 80.2 81.9 78.2 87.8 83.8 81.6 81.9 82.2 77.8 -5.4Furniture and related products ....................... 86.5 80.4 79.1 80.3 87.1 84.8 84.2 82.0 81.0 81.1 .1Miscellaneous manufacturing ......................... 90.6 90.3 88.9 90.6 90.7 90.7 91.0 91.2 89.7 90.5 .9
Nondurable goods ............................................... 88.6 87.3 86.3 87.6 89.7 89.2 89.3 88.7 88.4 88.9 .6Food manufacturing ......................................... 98.2 98.5 97.1 99.8 101.6 100.4 101.0 101.0 101.4 102.9 1.5Beverages and tobacco products .................. 98.1 84.5 82.4 85.3 102.4 96.3 92.3 89.4 87.7 89.8 2.4Textile mills ........................................................ 59.0 51.3 51.0 51.3 58.5 53.8 53.8 51.7 51.8 51.0 -1.5Textile product mills ......................................... 79.2 71.6 72.6 74.7 78.6 75.3 76.4 72.7 73.6 74.3 1.0Apparel ............................................................... 61.7 56.1 56.6 57.0 61.5 59.2 60.3 58.2 57.5 56.7 -1.4Leather and allied products ............................ 70.7 71.1 69.5 72.4 69.3 70.5 71.5 71.9 70.6 70.9 .4Paper and paper products .............................. 84.6 87.7 86.1 86.5 85.9 86.9 87.9 87.9 87.7 87.7 .0Printing and related support activities ........... 93.1 89.1 88.5 89.4 92.9 91.6 90.6 90.2 89.2 89.5 .3Petroleum and coal products .......................... 88.4 92.4 93.0 93.1 92.3 96.4 95.1 96.8 98.5 97.3 -1.2Chemicals .......................................................... 93.0 95.8 95.0 96.0 93.2 95.9 95.6 96.0 95.3 96.1 .8Plastics and rubber products .......................... 89.9 88.4 88.0 87.6 90.0 91.2 90.1 89.0 89.1 88.0 -1.2
Private service-providing ............................. 106.8 106.2 107.0 109.3 108.5 109.5 109.7 109.7 109.3 109.6 .3
Trade, transportation, and utilities ....................... 102.3 102.7 101.7 103.6 104.6 105.1 105.1 105.3 105.1 105.0 -.1
Wholesale trade ................................................... 106.5 108.8 108.9 111.5 108.1 110.4 111.1 111.3 110.9 111.5 .5
Retail trade ........................................................... 99.1 99.3 97.4 98.9 101.6 101.9 101.4 101.6 101.2 101.1 -.1
Transportation and warehousing ...................... 107.4 106.3 106.4 108.9 109.5 109.4 109.5 108.9 109.5 109.7 .2
Utilities ................................................................... 94.8 97.4 96.2 97.0 96.0 96.7 97.5 98.7 97.5 98.0 .5
Information ............................................................... 99.3 98.1 98.7 101.0 100.3 99.4 99.7 99.9 99.5 100.5 1.0
Financial activities .................................................. 107.7 106.5 106.9 108.9 109.2 108.2 108.2 108.2 108.2 108.3 .1
Professional and business services .................... 112.7 111.4 112.7 115.2 114.8 115.9 116.7 116.1 115.5 115.8 .3
Education and health services ............................. 111.6 113.4 114.6 116.2 111.4 113.8 114.1 114.5 114.4 115.3 .8
Leisure and hospitality ........................................... 106.1 102.9 105.3 108.7 110.5 111.6 111.6 111.6 111.8 111.9 .1
Other services ......................................................... 98.4 96.8 97.9 99.5 99.4 99.5 99.2 99.3 99.5 99.8 .3
1 See footnote 1, table B-2.2 Includes motor vehicles, motor vehicle bodies and trailers, and
motor vehicle parts.p = preliminary.NOTE: The indexes of aggregate weekly hours are calculated by
dividing the current months estimates of aggregate hours bythe corresponding 2002 annual average levels. Aggregate hours
estimates are the product of estimates of average weekly hoursand production and nonsupervisory worker employment.
Data reflect the conversion to the 2007 version of the NorthAmerican Industry Classification System (NAICS) as the basisfor the assignment and tabulation of economic data by industry,replacing NAICS 2002. See http://www.bls.gov/ces/cesnaics07.htmfor more details.

ESTABLISHMENT DATA ESTABLISHMENT DATA
Table B-6. Indexes of aggregate weekly payrolls of production and nonsupervisory workers1 on private nonfarm payrolls by industry sector andselected industry detail
(2002=100)
Industry
Not seasonally adjusted Seasonally adjusted
Mar. 2007
Jan. 2008
Feb. 2008p
Mar. 2008p
Mar. 2007
Nov. 2007
Dec. 2007
Jan. 2008
Feb. 2008p
Mar. 2008p
Percentchange from:Feb. 2008-Mar. 2008p
.......................................Total private 121.2 123.9 124.6 127.6 123.3 127.0 127.5 127.4 127.7 128.3 0.5
..........................................Goods-producing 111.6 111.4 110.2 113.1 115.5 117.1 116.5 116.4 116.1 116.8 .6
..............................Natural resources and mining 155.1 166.4 166.1 174.7 159.8 166.3 169.8 172.0 172.8 178.8 3.5
............................................................Construction 120.1 116.7 114.6 119.5 129.1 130.4 129.6 128.6 127.6 128.8 .9
.........................................................Manufacturing 104.8 105.8 105.0 106.4 105.8 107.3 106.7 107.1 107.2 107.4 .2
.....................................................Durable goods 109.3 109.8 109.2 110.4 109.8 111.2 110.4 111.1 111.2 111.0 -.2
...............................................Nondurable goods 96.8 98.6 97.1 98.8 98.3 99.9 100.0 99.8 99.6 100.4 .8
.............................Private service-providing 124.2 127.6 129.0 132.2 125.8 130.2 130.8 131.2 131.1 131.9 .6
.......................Trade, transportation, and utilities 114.1 117.3 116.8 119.5 116.7 119.4 119.9 120.3 120.5 120.7 .2
...................................................Wholesale trade 120.8 128.3 128.5 132.0 123.2 129.2 130.4 130.9 130.9 131.9 .8
...........................................................Retail trade 107.9 108.8 107.2 109.4 110.6 111.9 111.3 111.4 111.4 111.5 .1
......................Transportation and warehousing 119.1 121.9 122.5 125.1 121.8 124.4 125.5 125.1 126.5 126.5 .0
...................................................................Utilities 109.6 116.4 114.7 117.3 110.7 113.7 116.1 117.8 116.4 118.1 1.5
...............................................................Information 116.7 118.7 119.3 122.5 118.2 118.7 119.4 120.3 120.2 121.9 1.4
..................................................Financial activities 129.7 131.4 132.6 136.1 131.6 133.0 133.2 133.8 134.2 134.7 .4
....................Professional and business services 133.3 136.9 139.2 143.6 135.7 140.9 142.1 141.8 141.7 142.7 .7
.............................Education and health services 131.4 138.7 139.9 141.9 131.0 137.8 138.6 139.5 139.6 140.7 .8
...........................................Leisure and hospitality 123.3 125.3 129.2 133.2 128.0 134.4 135.0 135.2 136.2 136.8 .4
.........................................................Other services 110.1 111.0 112.7 115.1 110.5 113.5 113.6 113.9 114.5 115.2 .6
1 See footnote 1, table B-2.p = preliminary.NOTE: The indexes of aggregate weekly payrolls are calculated
by dividing the current months estimates of aggregate payrollsby the corresponding 2002 annual average levels. Aggregatepayroll estimates are the product of estimates of average hourlyearnings, average weekly hours, and production and nonsupervisory
worker employment.Data reflect the conversion to the 2007 version of the North
American Industry Classification System (NAICS) as the basisfor the assignment and tabulation of economic data by industry,replacing NAICS 2002. See http://www.bls.gov/ces/cesnaics07.htmfor more details.
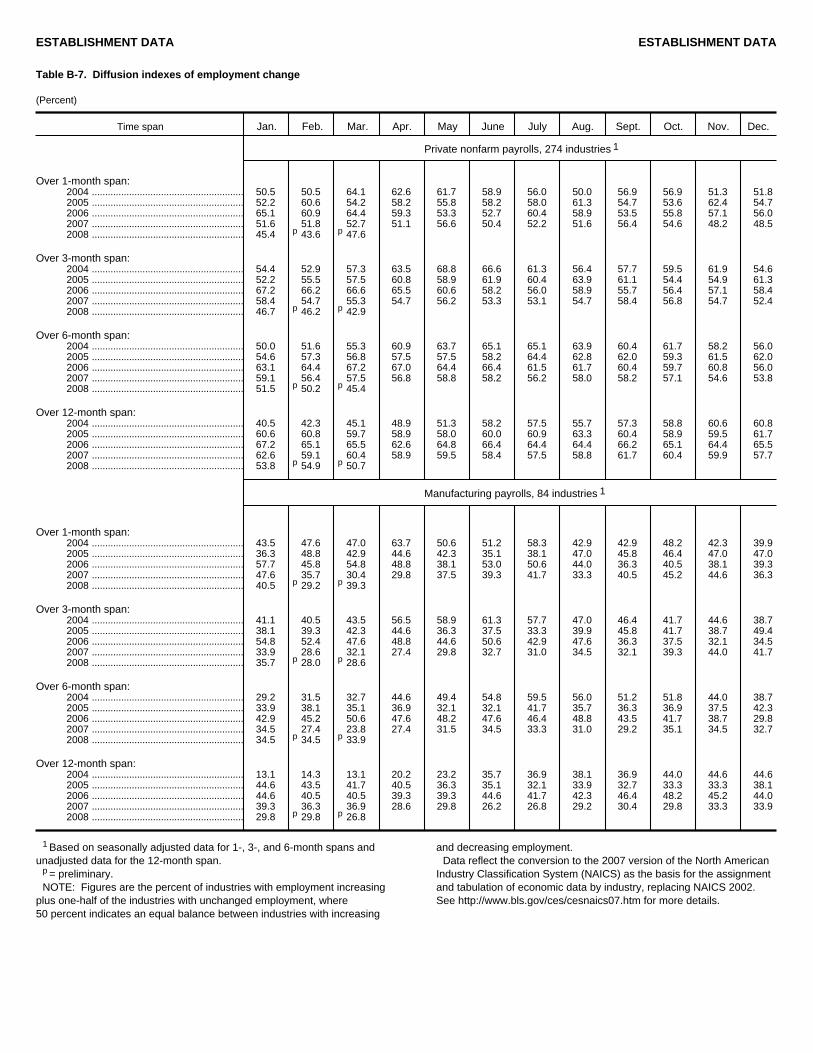
ESTABLISHMENT DATA ESTABLISHMENT DATA
Table B-7. Diffusion indexes of employment change
(Percent)
Jan. Feb. Mar. Apr. May June July Aug. Sept. Oct. Nov. Dec.
Private nonfarm payrolls, 274 industries
Manufacturing payrolls, 84 industries
1
1
Over 1-month span:
Over 3-month span:
Over 6-month span:
Over 12-month span:
Over 1-month span:
Over 3-month span:
Over 6-month span:
Over 12-month span:
Time span
2004 ......................................................... 50.5 50.5 64.1 62.6 61.7 58.9 56.0 50.0 56.9 56.9 51.3 51.82005 ......................................................... 52.2 60.6 54.2 58.2 55.8 58.2 58.0 61.3 54.7 53.6 62.4 54.72006 ......................................................... 65.1 60.9 64.4 59.3 53.3 52.7 60.4 58.9 53.5 55.8 57.1 56.02007 ......................................................... 51.6 51.8 52.7 51.1 56.6 50.4 52.2 51.6 56.4 54.6 48.2 48.52008 ......................................................... 45.4 p 43.6 p 47.6
2004 ......................................................... 54.4 52.9 57.3 63.5 68.8 66.6 61.3 56.4 57.7 59.5 61.9 54.62005 ......................................................... 52.2 55.5 57.5 60.8 58.9 61.9 60.4 63.9 61.1 54.4 54.9 61.32006 ......................................................... 67.2 66.2 66.6 65.5 60.6 58.2 56.0 58.9 55.7 56.4 57.1 58.42007 ......................................................... 58.4 54.7 55.3 54.7 56.2 53.3 53.1 54.7 58.4 56.8 54.7 52.42008 ......................................................... 46.7 p 46.2 p 42.9
2004 ......................................................... 50.0 51.6 55.3 60.9 63.7 65.1 65.1 63.9 60.4 61.7 58.2 56.02005 ......................................................... 54.6 57.3 56.8 57.5 57.5 58.2 64.4 62.8 62.0 59.3 61.5 62.02006 ......................................................... 63.1 64.4 67.2 67.0 64.4 66.4 61.5 61.7 60.4 59.7 60.8 56.02007 ......................................................... 59.1 56.4 57.5 56.8 58.8 58.2 56.2 58.0 58.2 57.1 54.6 53.82008 ......................................................... 51.5 p 50.2 p 45.4
2004 ......................................................... 40.5 42.3 45.1 48.9 51.3 58.2 57.5 55.7 57.3 58.8 60.6 60.82005 ......................................................... 60.6 60.8 59.7 58.9 58.0 60.0 60.9 63.3 60.4 58.9 59.5 61.72006 ......................................................... 67.2 65.1 65.5 62.6 64.8 66.4 64.4 64.4 66.2 65.1 64.4 65.52007 ......................................................... 62.6 59.1 60.4 58.9 59.5 58.4 57.5 58.8 61.7 60.4 59.9 57.72008 ......................................................... 53.8 p 54.9 p 50.7
2004 ......................................................... 43.5 47.6 47.0 63.7 50.6 51.2 58.3 42.9 42.9 48.2 42.3 39.92005 ......................................................... 36.3 48.8 42.9 44.6 42.3 35.1 38.1 47.0 45.8 46.4 47.0 47.02006 ......................................................... 57.7 45.8 54.8 48.8 38.1 53.0 50.6 44.0 36.3 40.5 38.1 39.32007 ......................................................... 47.6 35.7 30.4 29.8 37.5 39.3 41.7 33.3 40.5 45.2 44.6 36.32008 ......................................................... 40.5 p 29.2 p 39.3
2004 ......................................................... 41.1 40.5 43.5 56.5 58.9 61.3 57.7 47.0 46.4 41.7 44.6 38.72005 ......................................................... 38.1 39.3 42.3 44.6 36.3 37.5 33.3 39.9 45.8 41.7 38.7 49.42006 ......................................................... 54.8 52.4 47.6 48.8 44.6 50.6 42.9 47.6 36.3 37.5 32.1 34.52007 ......................................................... 33.9 28.6 32.1 27.4 29.8 32.7 31.0 34.5 32.1 39.3 44.0 41.72008 ......................................................... 35.7 p 28.0 p 28.6
2004 ......................................................... 29.2 31.5 32.7 44.6 49.4 54.8 59.5 56.0 51.2 51.8 44.0 38.72005 ......................................................... 33.9 38.1 35.1 36.9 32.1 32.1 41.7 35.7 36.3 36.9 37.5 42.32006 ......................................................... 42.9 45.2 50.6 47.6 48.2 47.6 46.4 48.8 43.5 41.7 38.7 29.82007 ......................................................... 34.5 27.4 23.8 27.4 31.5 34.5 33.3 31.0 29.2 35.1 34.5 32.72008 ......................................................... 34.5 p 34.5 p 33.9
2004 ......................................................... 13.1 14.3 13.1 20.2 23.2 35.7 36.9 38.1 36.9 44.0 44.6 44.62005 ......................................................... 44.6 43.5 41.7 40.5 36.3 35.1 32.1 33.9 32.7 33.3 33.3 38.12006 ......................................................... 44.6 40.5 40.5 39.3 39.3 44.6 41.7 42.3 46.4 48.2 45.2 44.02007 ......................................................... 39.3 36.3 36.9 28.6 29.8 26.2 26.8 29.2 30.4 29.8 33.3 33.92008 ......................................................... 29.8 p 29.8 p 26.8
1 Based on seasonally adjusted data for 1-, 3-, and 6-month spans andunadjusted data for the 12-month span.
p = preliminary.NOTE: Figures are the percent of industries with employment increasing
plus one-half of the industries with unchanged employment, where50 percent indicates an equal balance between industries with increasing
and decreasing employment.Data reflect the conversion to the 2007 version of the North American
Industry Classification System (NAICS) as the basis for the assignmentand tabulation of economic data by industry, replacing NAICS 2002.See http://www.bls.gov/ces/cesnaics07.htm for more details.