the emergence of a mega-port: from the global to the local
TRANSCRIPT

HAL Id: halshs-00458055https://halshs.archives-ouvertes.fr/halshs-00458055v2
Submitted on 10 Jul 2012
HAL is a multi-disciplinary open accessarchive for the deposit and dissemination of sci-entific research documents, whether they are pub-lished or not. The documents may come fromteaching and research institutions in France orabroad, or from public or private research centers.
L’archive ouverte pluridisciplinaire HAL, estdestinée au dépôt et à la diffusion de documentsscientifiques de niveau recherche, publiés ou non,émanant des établissements d’enseignement et derecherche français ou étrangers, des laboratoirespublics ou privés.
The emergence of a mega-port: from the global to thelocal, the case of BusanAntoine Frémont, César Ducruet
To cite this version:Antoine Frémont, César Ducruet. The emergence of a mega-port: from the global to the local, thecase of Busan. Tijdschrift voor economische en sociale geografie, Wiley, 2005, 96 (4), pp.421-432.�halshs-00458055v2�
1
THE EMERGENCE OF A MEGA-PORT- FROM THE GLOBAL
TO THE LOCAL, THE CASE OF BUSAN
FRÉMONT Antoine1
DUCRUET César2
ABSTRACT
Busan port was ranked third place of the world container ports in 2001. This port growth
was implemented within a major urban settlement of over 4 million inhabitants. It could
be explained by the insertion of the port city in the maritime networks of the world
leading ocean carriers. The coexistence of port and urban functions in the same area
could lead to asphyxia. The efficient articulation of reticular and territorial logics, in
different scales, from the global to the local and conversely, is a necessity to improve the
development of the port city.
Keywords: South Korea, East Asia, containerization, port, port city.
We would like to acknowledge Pr. Brian Slack (Concordia University) and Pr. C. Comtois (University of Montreal) for their useful comments and for reviewing the manuscript. We would like to thank the representatives of Hyundai and Hanjin, of the port authorities of Inchon, Busan and Gwangyang, and of the city of Busan. 1 Systèmes productifs, logistique, organisation des transports et travail (SPLOTT), INRETS – Université Paris XII - Paris Est Créteil Val-de-Marne, 2 rue de la Butte Verte, Le Descartes 2, F-93166 Noisy le Grand Cedex, France 2 French National Centre for Scientific Research (CNRS), UMR 8504 Géographie-cités, Equipe P.A.R.I.S., 13 rue du
Four, F-75006 Paris, France. Tel. +33 (0)140-464-007, Mobile +33(0)626-602-163, Fax +33(0)140-464-009. Email : [email protected]
2
1. INTRODUCTION
The maritime façade between Japan and Singapore has become the key focus of world container
shipping over to the last two decades. The scale of the developments and the rapidity of growth
have been remarkable. While the Japanese ports of Tokyo, Yokohama, Kobe and Nagoya have
been among the largest container ports in the world ever since the inception of containerization in
the 1960s, they have been overshadowed by the emergence during the 1980s of Hong Kong and
Singapore and Kaohsiung (Rimmer, 1999). These Asian ‘Tigers’ have been ranked consistently
among the top five ports in the world. During the 1990s two other Asian ports, Shanghai and
Busan, have been catapulted into global prominence, and in 2003 occupied third and fourth
ranked positions worldwide.
Inevitably, Singapore and Hong Kong have drawn the largest share of academic interest.
Singapore is exceptional because of its hub function and dominance of South East Asian regional
markets. Its port authority is now a major player in port operations and management of a growing
number of ports around the world. More recently, competition from new ports in Malaysia has
appeared which has demonstrated the limits to port concentration (Slack and Wang, 2002). Hong
Kong’s role as the gateway to China, its changing role with the emergence of new ports in the
Pearl River Delta (Wang, 1998, Song, 2002), and its unusual governance relationships have given
rise to a new understanding of regional port complexes (Wang and Slack, 2004). Some of the
concepts relating to regional port development and governance have also been applied to
Shanghai, whose recent growth also demonstrates how the existence of an enormous local market
can negate physical constraints of a shallow natural harbour (Wang and Olivier, 2004).
Kaohsiung has been shown to exhibit some of these traits: serving a strong export-based domestic
economy but whose site is contested by other port uses (Haynes and al, 1998).
3
From these examples several themes of Asian container port development are emerging. First, it
is the role of transshipment in achieving mega-port status, with only Shanghai standing apart.
Second, it is the issue of regional port competition and the “challenge of peripheral ports”
(Hayuth, 1981). Third, it is the role of the private sector in port/terminal management. With the
exception of the issue of port capacity (Cullinane and Song, 1998), western academic literature
has largely ignored Busan, despite its rapid growth and global importance (Frémont and Ducruet,
2004). This paper attempts to address this imbalance by examining the extent to which the
Korean port fits the ‘Asian model’ and what is distinctive about the trajectory of its growth. It is
shown that there are a surprising number of commonalities between Busan and the other mega-
ports, despite some obvious differences based on unique environmental and political conditions.
2. THE GROWTH OF BUSAN
Busan port was ranked the fourth largest container port in the world in 2003, handling 10.4
million Twenty-Foot Equivalent Units (TEUs) in 2002. Its first container terminal did not open
until 1975, but since then its traffic has doubled every five or six years on average (Fig.1).
This growth is related in part to the rise of South Korea as a global trading nation. In 1970, South
Korea accounted for only 0.7% of global trade by value, but by 2003 the country accounted for
2.5%, and 50% of its manufacturing jobs are related to exports (Cullinane, op. cit.).
Approximately 83% of the country’s exports are containerized (Soo, 1990). This export-based
growth of South Korea mirrors that of other newly industrializing countries (NICs) of South-East
Asia: China, Hong Kong, Singapore and Taiwan.

4
Figure 1. Container throughput in Busan (1975-2003).
0
2
4
6
8
10
12
197
5
198
0
198
5
199
0
199
5
200
0
Millio
ns
TE
Us
Source: Containerization International Yearbooks.
The rise of foreign trade generated a corresponding growth in port traffic. Confined to the north
by North Korea’s locked frontier since 1953, South Korea is essentially an island: more than 99%
of its foreign trade is shipped by sea (Cullinane, op. cit.). Raw materials are mainly carried
through the ports of Pohang close to the POSCO iron and steel industrial complex; Ulsan for
petroleum and Inchon, which is the closest port to Seoul. Busan is the country’s container and
general cargo port and until the recent development of Gwangyang, Busan handled more than
90% of Korea’s container traffic. It serves a national hinterland, since its own urban area and
neighbouring provinces generate a minority of South Korea’s container traffic, the largest market
being Seoul, 400km away. Despite the proximity of Inchon to Seoul, its role in container traffic is
negligible (7% of national container throughput) because of a very high tidal range and a lock
gate system that is not well adapted to accommodate giant containerships. Busan, on the other
hand offers excellent nautical conditions. The port site forms a wide bay providing deep water (-
15 meters), that is well protected from tidal surges and subject to a very low tidal range. In this
5
regard, Busan is very similar to Kaohsiung, since it too is distant from Taiwan’s main industrial
area for containerized exports, the capital Taipei (Haynes et al, 1998), only that there the local
ports are limited by shallow water rather than a high tidal range.
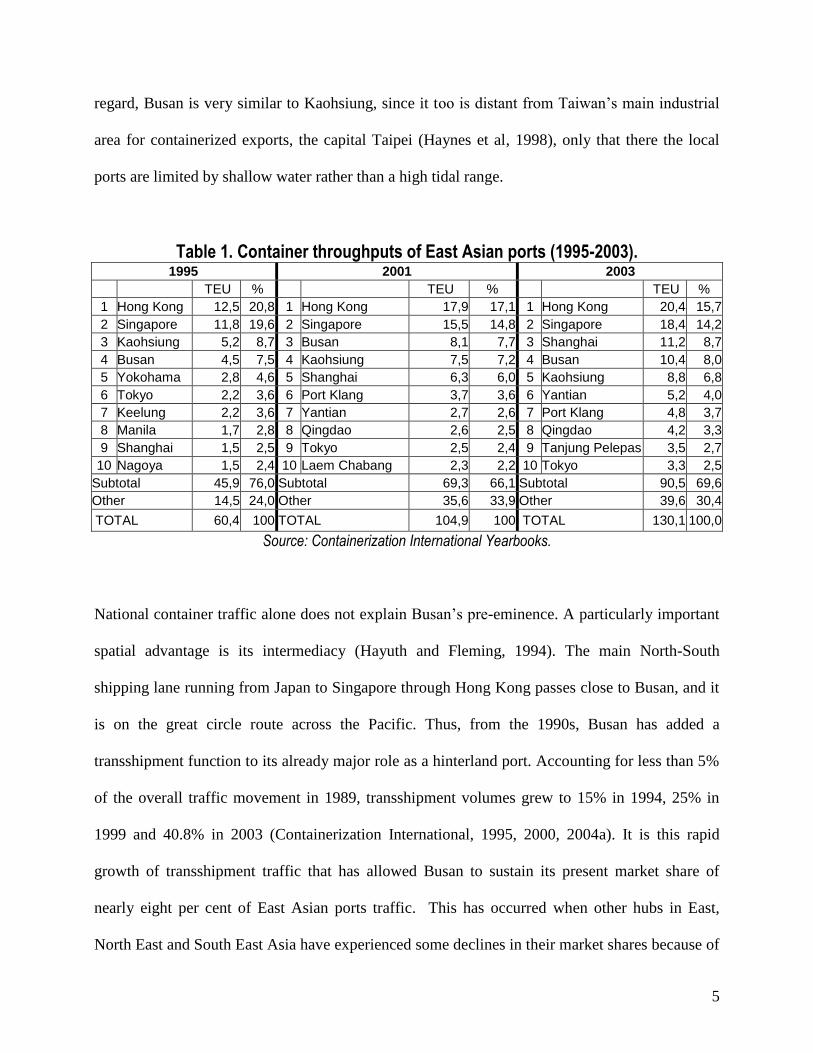
Table 1. Container throughputs of East Asian ports (1995-2003). 1995 2001 2003
TEU % TEU % TEU %
1 Hong Kong 12,5 20,8 1 Hong Kong 17,9 17,1 1 Hong Kong 20,4 15,7
2 Singapore 11,8 19,6 2 Singapore 15,5 14,8 2 Singapore 18,4 14,2
3 Kaohsiung 5,2 8,7 3 Busan 8,1 7,7 3 Shanghai 11,2 8,7
4 Busan 4,5 7,5 4 Kaohsiung 7,5 7,2 4 Busan 10,4 8,0
5 Yokohama 2,8 4,6 5 Shanghai 6,3 6,0 5 Kaohsiung 8,8 6,8
6 Tokyo 2,2 3,6 6 Port Klang 3,7 3,6 6 Yantian 5,2 4,0
7 Keelung 2,2 3,6 7 Yantian 2,7 2,6 7 Port Klang 4,8 3,7
8 Manila 1,7 2,8 8 Qingdao 2,6 2,5 8 Qingdao 4,2 3,3
9 Shanghai 1,5 2,5 9 Tokyo 2,5 2,4 9 Tanjung Pelepas 3,5 2,7
10 Nagoya 1,5 2,4 10 Laem Chabang 2,3 2,2 10 Tokyo 3,3 2,5
Subtotal 45,9 76,0 Subtotal 69,3 66,1 Subtotal 90,5 69,6
Other 14,5 24,0 Other 35,6 33,9 Other 39,6 30,4
TOTAL 60,4 100 TOTAL 104,9 100 TOTAL 130,1 100,0
Source: Containerization International Yearbooks.
National container traffic alone does not explain Busan’s pre-eminence. A particularly important
spatial advantage is its intermediacy (Hayuth and Fleming, 1994). The main North-South
shipping lane running from Japan to Singapore through Hong Kong passes close to Busan, and it
is on the great circle route across the Pacific. Thus, from the 1990s, Busan has added a
transshipment function to its already major role as a hinterland port. Accounting for less than 5%
of the overall traffic movement in 1989, transshipment volumes grew to 15% in 1994, 25% in
1999 and 40.8% in 2003 (Containerization International, 1995, 2000, 2004a). It is this rapid
growth of transshipment traffic that has allowed Busan to sustain its present market share of
nearly eight per cent of East Asian ports traffic. This has occurred when other hubs in East,
North East and South East Asia have experienced some declines in their market shares because of

6
regional competition. Thus, between 1995 and 2003 Hong Kong’s share fell from 20.8% to
15.7%, Kaohsiung from 8.6% to 6.8%, and Singapore from 19.6% to 14.2% (Tab.1 and Fig.2).
Figure 2. Container throughputs of East Asian ports in 2003.
Source: Port of Hamburg.
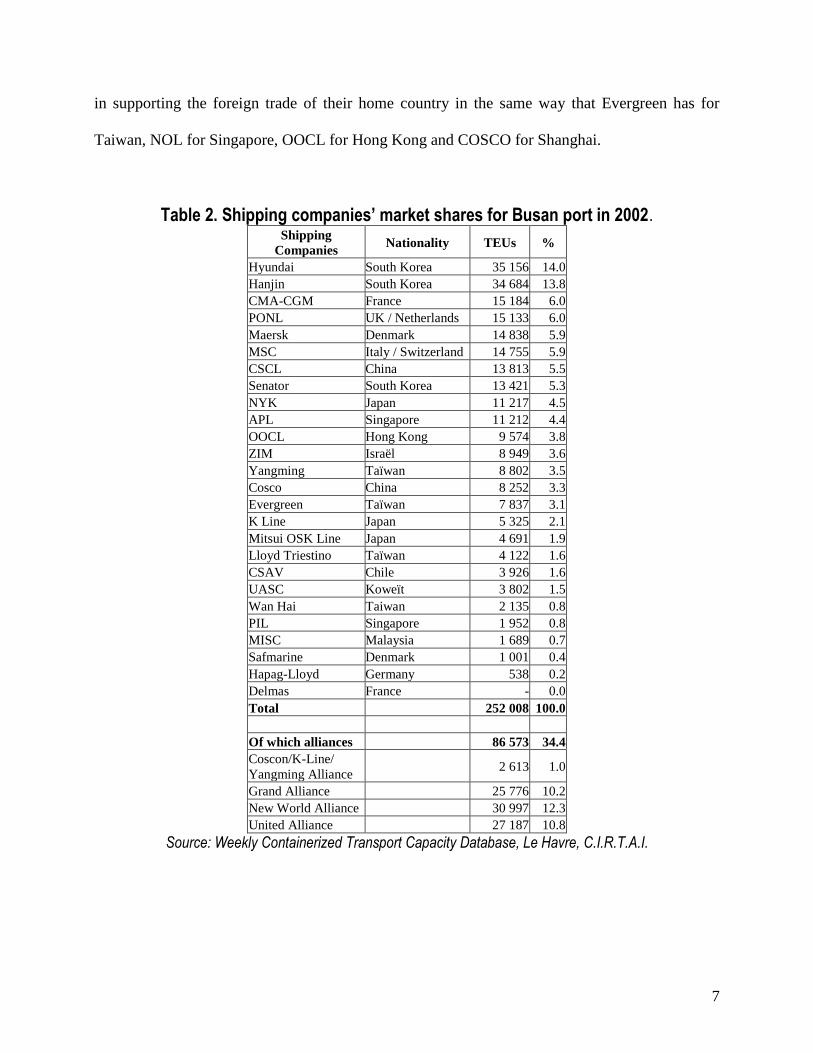
Busan’s emergence as a container port for both hinterland and transshipment traffic is mirrored
by the expansion in services offered by the global shipping lines that have made the port a hub
for their services in North East Asia. Twenty six of the top twenty seven global carriers were
present in Busan in 2002 (Tab.2). However, weekly transport capacity (WTC), as determined by
totalling the slots available by weekly sailings from the port, is dominated by the two Korean
companies Hanjin and Hyundai who account for 31% of the port total. This strong Korean
presence in Busan is historical and political. Hanjin and Hyundai have played an important role
7
in supporting the foreign trade of their home country in the same way that Evergreen has for
Taiwan, NOL for Singapore, OOCL for Hong Kong and COSCO for Shanghai.
Table 2. Shipping companies’ market shares for Busan port in 2002. Shipping
Companies Nationality TEUs %
Hyundai South Korea 35 156 14.0
Hanjin South Korea 34 684 13.8
CMA-CGM France 15 184 6.0
PONL UK / Netherlands 15 133 6.0
Maersk Denmark 14 838 5.9
MSC Italy / Switzerland 14 755 5.9
CSCL China 13 813 5.5
Senator South Korea 13 421 5.3
NYK Japan 11 217 4.5
APL Singapore 11 212 4.4
OOCL Hong Kong 9 574 3.8
ZIM Israël 8 949 3.6
Yangming Taïwan 8 802 3.5
Cosco China 8 252 3.3
Evergreen Taïwan 7 837 3.1
K Line Japan 5 325 2.1
Mitsui OSK Line Japan 4 691 1.9
Lloyd Triestino Taïwan 4 122 1.6
CSAV Chile 3 926 1.6
UASC Koweït 3 802 1.5
Wan Hai Taiwan 2 135 0.8
PIL Singapore 1 952 0.8
MISC Malaysia 1 689 0.7
Safmarine Denmark 1 001 0.4
Hapag-Lloyd Germany 538 0.2
Delmas France - 0.0
Total 252 008 100.0
Of which alliances 86 573 34.4
Coscon/K-Line/
Yangming Alliance 2 613 1.0
Grand Alliance 25 776 10.2
New World Alliance 30 997 12.3
United Alliance 27 187 10.8
Source: Weekly Containerized Transport Capacity Database, Le Havre, C.I.R.T.A.I.
8
However, European and other Asian shipping lines have a strong presence in Busan. Their share
of the total WTC is 28% and 36% respectively. The presence of the major non-Korean shipping
companies indicates that Busan’s port activity today is no longer rooted only in Korean foreign
trade. Because it is located on the main Asian shipping lanes, Busan has become a port where
some carriers have decided to establish a hub, from which containers are feedered to regional
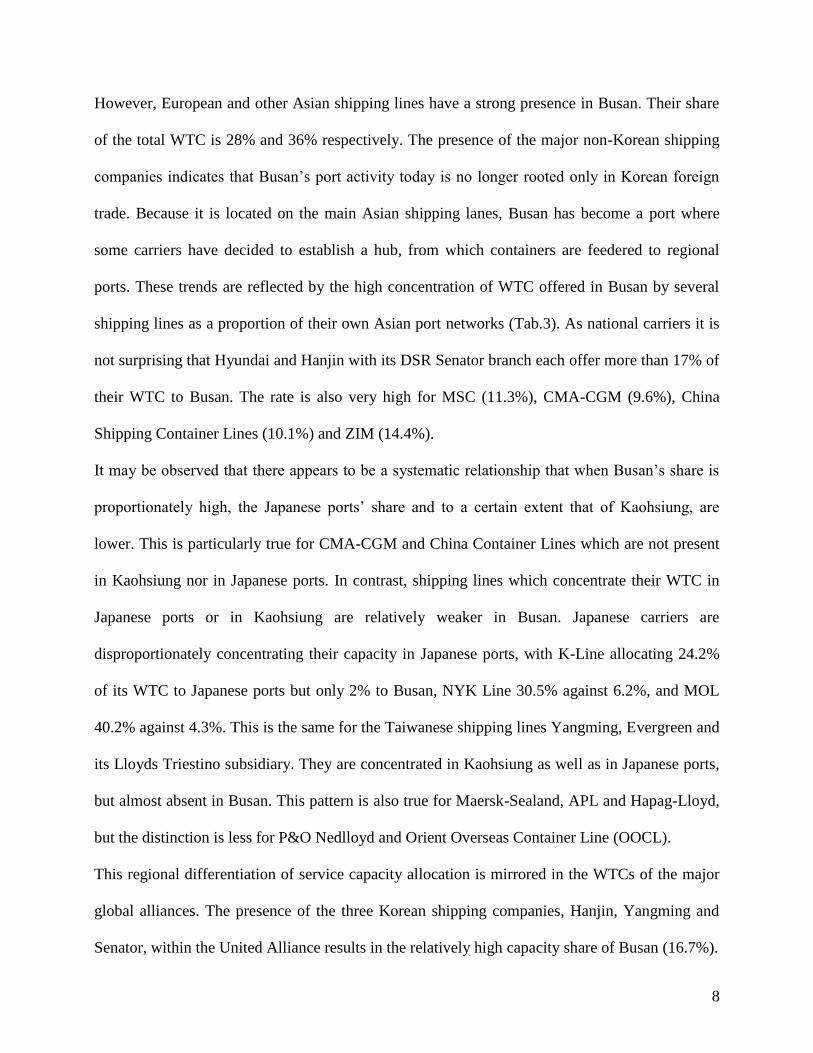
ports. These trends are reflected by the high concentration of WTC offered in Busan by several
shipping lines as a proportion of their own Asian port networks (Tab.3). As national carriers it is
not surprising that Hyundai and Hanjin with its DSR Senator branch each offer more than 17% of
their WTC to Busan. The rate is also very high for MSC (11.3%), CMA-CGM (9.6%), China
Shipping Container Lines (10.1%) and ZIM (14.4%).
It may be observed that there appears to be a systematic relationship that when Busan’s share is
proportionately high, the Japanese ports’ share and to a certain extent that of Kaohsiung, are
lower. This is particularly true for CMA-CGM and China Container Lines which are not present
in Kaohsiung nor in Japanese ports. In contrast, shipping lines which concentrate their WTC in
Japanese ports or in Kaohsiung are relatively weaker in Busan. Japanese carriers are
disproportionately concentrating their capacity in Japanese ports, with K-Line allocating 24.2%
of its WTC to Japanese ports but only 2% to Busan, NYK Line 30.5% against 6.2%, and MOL
40.2% against 4.3%. This is the same for the Taiwanese shipping lines Yangming, Evergreen and
its Lloyds Triestino subsidiary. They are concentrated in Kaohsiung as well as in Japanese ports,
but almost absent in Busan. This pattern is also true for Maersk-Sealand, APL and Hapag-Lloyd,
but the distinction is less for P&O Nedlloyd and Orient Overseas Container Line (OOCL).
This regional differentiation of service capacity allocation is mirrored in the WTCs of the major
global alliances. The presence of the three Korean shipping companies, Hanjin, Yangming and
Senator, within the United Alliance results in the relatively high capacity share of Busan (16.7%).
9
Table 3. Weekly Containerized Transport Capacity (WCTC) shares among Busan and north-east Asian ports for the world’s major 26 shipping companies.
Hong Kong Singapore Kaohsiung Busan Shanghai Kobe Yokohama Tokyo Nagoya Osaka Gwangyang Others Total (EVP)
Of which
Japanese ports
Grand Alliance 19.8 18.2 10.6 6.1 5.0 5.0 2.2 2.8 4.5 0.0 0.0 25.8 1 035 802 14.5
New World Alliance 17.0 9.7 10.9 6.8 3.5 9.1 5.8 8.5 7.2 0.0 3.4 18.1 453 224 30.6
United Alliance 15.1 12.9 8.7 16.7 5.3 0.0 0.0 5.7 0.0 4.2 4.8 26.5 262 975 10.0
Maersk-Sealand 18.0 4.7 9.2 4.4 3.1 7.9 9.5 0.5 4.4 1.2 3.2 33.7 373 339 23.6
P&O Nedlloyd 18.8 20.0 8.2 7.2 5.4 4.0 2.0 2.5 4.0 0.0 0.0 27.8 486 588 12.6
MSC 17.7 12.7 2.3 11.3 6.5 0.0 2.3 2.5 2.3 2.3 0.0 40.3 151 115 9.3
Cosco 15.4 10.6 0.0 3.0 10.9 3.1 7.1 1.0 1.5 1.0 0.0 46.5 274 699 13.7
APL 13.6 14.8 9.8 3.9 4.5 7.2 6.1 4.5 3.3 0.0 1.1 31.2 308 783 21.1
Evergreen 15.7 11.8 14.6 2.6 1.1 0.9 1.8 7.7 2.6 7.2 0.3 33.7 361 307 20.3
Hanjin 12.7 10.5 8.4 17.6 4.0 1.5 2.5 7.4 1.1 5.5 2.9 25.8 275 198 18.0
K Line 15.7 14.0 3.5 2.0 5.7 6.8 2.7 6.4 7.0 1.3 0.0 34.9 356 112 24.2
CMA-CGM 20.5 9.5 0.0 9.6 8.6 0.0 0.0 0.0 0.0 0.0 2.6 49.1 159 226 0.0
NYK 11.0 14.5 2.2 6.2 5.8 8.9 4.4 6.3 9.4 1.5 0.0 29.9 342 877 30.5
OOCL 22.3 14.8 14.8 4.0 2.3 2.6 1.1 2.6 1.6 1.1 0.0 32.9 363 095 9.0
China Shipping 16.7 1.8 0.0 10.1 6.6 0.2 4.1 0.0 0.0 0.2 0.2 60.0 137 393 4.5
Mitsui OSK Line 17.6 16.1 1.9 4.3 2.4 11.5 5.5 11.4 10.5 1.3 0.0 17.5 213 031 40.2
Hyundai 18.1 9.7 10.9 16.8 2.7 0.5 2.7 2.7 2.2 0.5 6.6 26.6 214 248 8.7
Hapag-Lloyd 21.4 18.5 9.1 2.2 6.4 6.8 4.5 2.3 4.5 0.0 0.0 24.3 206 948 18.2
ZIM 23.4 0.0 4.5 14.4 13.3 0.0 5.6 0.0 0.0 5.6 0.0 33.3 62 280 11.2
Yangming 19.8 11.1 10.3 2.8 5.0 5.0 3.2 3.7 2.6 0.8 0.6 35.0 311 475 15.4
Senator 18.2 12.5 14.7 21.9 3.5 0.0 0.0 0.0 0.0 0.0 5.5 23.7 81 959 0.0
Lloyd Triestino 19.9 8.7 13.6 4.6 11.7 0.0 0.0 0.0 2.3 0.0 0.0 39.1 88 909 2.3
Wan Hai 17.8 9.0 6.7 1.6 1.9 3.7 3.8 3.8 2.5 3.0 0.8 45.5 193 490 16.7
PIL 14.8 22.3 1.4 1.3 4.5 0.0 0.0 0.0 0.0 0.0 0.0 55.8 154 875 0.0
UASC 25.0 25.0 12.5 12.5 0.0 0.0 0.0 0.0 0.0 0.0 0.0 25.0 30 416 0.0
Delmas 0.0 42.6 0.0 0.0 14.8 0.0 0.0 0.0 0.0 0.0 0.0 42.6 6 453 0.0
Safmarine 22.2 11.1 0.0 11.1 11.1 0.0 0.0 0.0 0.0 0.0 0.0 44.4 24 621 0.0
CSAV 19.5 14.7 0.0 12.2 4.8 4.8 12.2 0.0 12.2 0.0 0.0 19.5 37 593 29.2
MISC 12.1 24.5 0.0 5.3 6.3 4.5 4.5 0.0 3.5 1.0 0.0 38.5 121 392 13.4
Source: Weekly Containerized Transport Capacity Database, Le Havre, C.I.R.T.A.I. ©
10
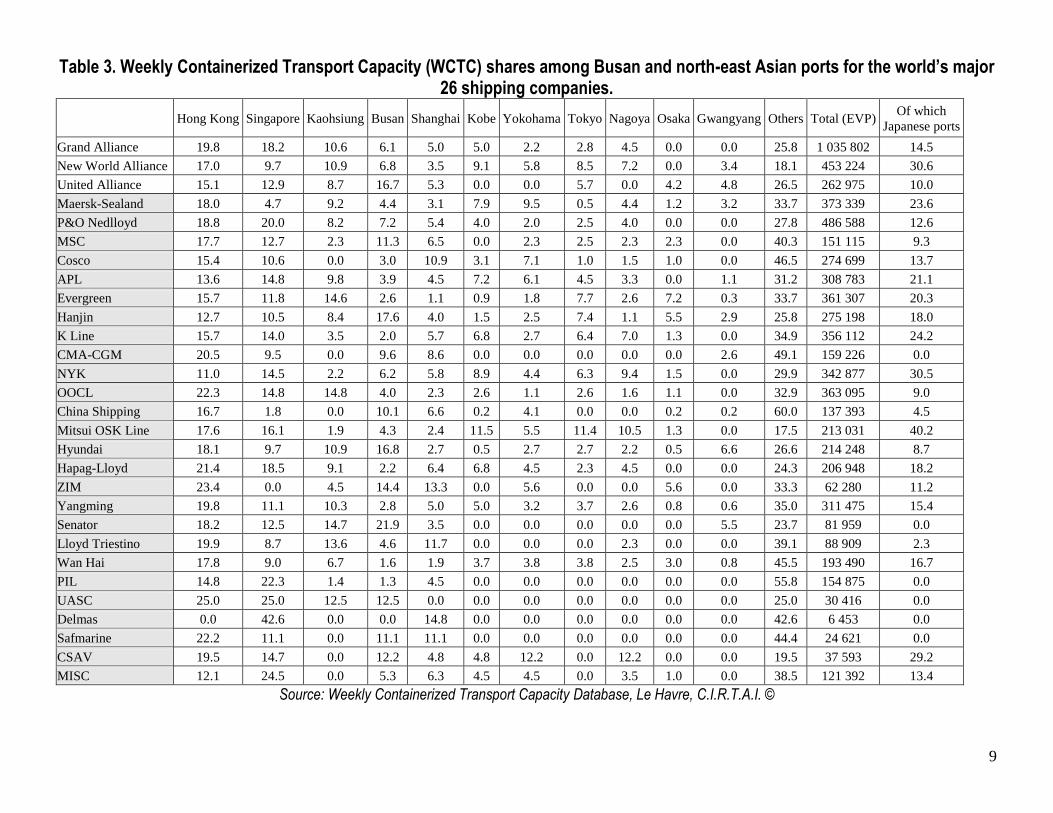
Figure 3. The port city of Busan
11
On the other hand, the New World Alliance dominated by APL and MOL, allocates 30% of its
WTC to Japanese ports. For the Grand Alliance, the difference between Japanese ports and Busan
is relatively small (14.5% to 6.1%) even though this alliance includes NYK and no Korean lines.
The analysis suggests that Busan is in direct competition with Japanese ports in being selected as
a hub location by global shipping companies. For several of the carriers the choice of Busan has
been made because of disadvantages of Japan. The latter’s port costs are very high: Terminal
Handling Charges (THC) set by the Far Eastern Freight Conference for a twenty foot container
are $235 in Kobe but only $80 in Busan (Containerization International, 2002a). Many carriers
are deterred from calling at Japanese ports because of the unions, the high level of bureaucracy
and the lack of openness to foreign businesses. Finally, the scattering of five ports over 500
kilometres makes it difficult for the shipping companies to concentrate their services at one of the
5 ports and to take full advantage a hub network. Only MOL concentrates more than 10% of its
Asian WTC in one Japanese port, while nine companies have higher proportions in Busan. A
further factor was the 1995 Kobe’s earthquake which forced shipping lines to find alternative
solutions, and many redirected their vessels to Busan. Even after reconstruction, companies that
had strong historical ties with Japanese ports for transshipment retained a substantial part of their
activity in Busan.3
Busan not only captured traffic from Japan but from Northern China as well. In 2000, Busan’s
transshipment activity from both Japan and China increased by more than 45% (D.R.E.E., 2001).
The exponential growth of Chinese traffic is a major factor accounting for the growth of
transshipment trade in Busan. Yellow Sea ports such as Qingdao, Tianjin, Dalian, situated well
away from the global maritime shipping lanes, are directly linked to Busan, which then
3 Our study on the shipping companies’ transport capacity is available only for 2002. Research is now in progress for the year 1993 so as to measure a 10 year evolution.
12
distributes this Chinese trade to North America and Europe. It is also in these northern Chinese
provinces that direct Korean investments are the most considerable (Jie et al, 2000). Busan has
also benefited from the enormous growth of trade from Shanghai, where, because of depth of
water limitations, ships depart partially loaded to be topped off at Busan.
3. CHALLENGES
3.1 Local congestion, regional imbalances and international competition
Despite the formidable success of Busan, its future is threatened by a number of pressures at a
variety of spatial scales. The port is contiguous to a major urban settlement, and the continuous
increase in container flows within this highly urbanized site is threatening both port and city with
asphyxia. The regional economy is not conducive to the establishment of many of the service
activities that are necessary in a modern port cluster. At the same time the growth of direct
shipments from North Chinese ports is a threat to Busan’s transshipment trade.
The coexistence of port and urban functions: an impossible relationship?
Today, Busan’s entire bay is dedicated to the port activity. To cope with the growth of traffic, the
Korean authorities have built new terminals, and all are fairly young, from the oldest Jasung Dae
Container Terminal, built in 1978, to the most recent Shin Gamman Terminal built in 2002.
If Busan bay is an excellent natural harbour, the port site is quite constrained. Container berths
have to share port space with other activities. As a result Busan’s container terminals suffer from
heavy congestion: “Terminals are so busy that vessels are not allowed to discharge their cargoes,
so a large portion of containers subsequently have to be handled at conventional piers. In 2000,
these conventional piers handled a massive 2.36 million TEU” (Kim, 2002). This congestion has
13
been recognized in a number of Korean reports, some of which blame the lack of port investment
in Korea.
The problem of inland congestion is much more severe. 85% of containers are transported by
road. Located almost in the city centre, the container terminals are not well connected to each
other (Fig.3). Thus port traffic mixes with general urban traffic causing significant problems over
the whole urban area. The proximity of mountains to the container terminals aggravates the
problem of road access. Some urban highways reach the terminals by large tunnels through the
surrounding mountains, for example, the Jasung Dae Container terminal.
Port traffic is dispersed all over the urbanized area because 37 off-dock container yards are
scattered around the city. In 2000, they handled 3.1 million import/export containers
(Containerization International, op. cit.). The trucks severely damage city roads (Anonymous,
1991). Port generated truck traffic is adding to a growing problem of urban congestion, strongly
driven by growth in car ownership and improved living standards. Today, Busan is facing total
gridlock. This is being reflected in delays in serving the main domestic market, Seoul. Even in
1994, a journey by road between Busan and Seoul took 14 hours compared to 8 hours in 1980
(Containerization International, 1994), despite numerous improvements in road infrastructures.
This traffic congestion impacts on the smooth running of the whole port node itself.
Despite the severity of the problem, concerted planning policy between city and port is non-
existent. The institutional system is not well structured to develop appropriate policy responses.
Port policy depends directly on central government though the Ministry of Maritime Affairs and
Fisheries (MOMAF) and the Korea Container Terminal Authority (KCTA), the latter planning
buildings and new terminals. Within Busan’s City Hall, the “Port Policy Department” works
directly with MOMAF and KCTA with the aim of strengthening the port function but totally
ignoring the “Urban Planning Department”, even though it is located in the same building and

14
promotes the development of an attractive waterfront (Cho et al, 2002). With such a difficult
geographical site, contradictory projects are sometimes conceived for the same areas. For
example, the project to shift of some of the port transshipment activity to the vicinity of the city
railway station was opposed by the city, who proposed residential development of the areas
(Park, 1990).
The saturation has been such that a container tax was introduced, allowing the city to raise
revenue from container traffic while at the same time trying to limit this traffic (Kim et al, 2002).
However, the efficiency of this tax is hotly debated and its imposition seemingly contradicts port
development objectives. Initiatives such as this, along with the effects of local congestion may
cause intermodal transport players to relocate their activities elsewhere. This explains why this
tax has been abandoned in 2003, in order to avoid any loosening of competitivity.
Finally, recent events have affected the efficiency both perceived and real of the port of Busan. In
2003 there were two national strikes of truckers that interrupted regular shipments of containers
to and from domestic hinterland markets. In addition, the port was severely impacted by typhoon
Maemi in September 2003 which disabled 12 of the ports 52 gantry cranes. While the port
authority was able to adjust very quickly to these calamities, they had occurred at a time when the
existing structural difficulties were already causing concern among some shipping lines.
These local difficulties are certainly not absent in many of the competing East Asian hubs.
Kaohsiung, for example, experiences similar difficulties of container terminals sharing the same
space with other port activities (Haynes et al, op. cit.). Furthermore, the issues of port access and
urban congestion are present in most other metropolitan port centres, such as Hong Kong and
Shanghai. Rather it is the scale and scope of these problems that makes Busan stand out. Its
urban and physical setting is presenting formidable challenges for its continued success as a
container port.

15
The difficulties of becoming a maritime metropolis: the dependence on Seoul
The threats of asphyxia for Busan port are accentuated by the city’s incapacity to develop
commercial and logistics functions appropriate for a large maritime metropolis. A major problem
is Busan’s dependence on the capital, Seoul.
With almost 4 million inhabitants in 2002, almost 10% of the Korean population, Busan is a large
metropolis, but it is dwarfed by Seoul, which has 10 million inhabitants in the inner city alone.
Seoul is the political and commercial capital of the country, and dominates the entire urban
hierarchy.
Busan developed after the Korean War as an industrial centre. Relatively low added value
industries such as textiles were established as well as chemicals and machinery, requiring an
abundant and frequently low qualified workforce that gave rise to a mass rural exodus (Shin,
1998). This resulted in new infrastructures, an impressive expansion of the city and creation of a
local consumer market.
Busan has remained an industrial port city (Park et al, 2000). In 1995, Busan accounted for
71.2% and 48% of the region’s industrial firms and manufacturing jobs respectively (Lim, 2000).
However, the city has begun to suffer competition from new Asian competitors. Korean factories
are being relocated to Vietnam and China, dealing a severe blow to Busan’s traditional economic
prosperity. It has difficulty in diversifying because of the dominance of the capital city. In 1995,
Seoul contained 24% of the national population but 61% of employees in finance and marketing,
and 96% of the headquarters of major companies (Hong, 1996) including Hyundai and Hanjin.

16
3.2 Competition from China
Part of Busan’s success is its role as a transshipment port for the burgeoning traffic exports of
North China. Because Chinese ports were poorly equipped and had significant physical
constraints, international shipping lines were reluctant to establish direct services there.
Table 4. Throughputs and growth of Busan and northern Chinese ports (1995-2003).
1995 2003 Average
annual growth
1995/2003 TEUs % TEUs %
Shanghai 1,5 19,0 11,3 51,1 28,7
Busan 4,5 57,0 10,4 47,1 11,0
Qingdao 0,6 7,6 4,2 19,0 27,5
Xingang/Tianjin 0,7 8,9 3,0 13,6 19,9
Ningbo 0,2 2,5 2,8 12,7 39,0
Dalian 0,4 5,1 1,7 7,7 19,8
Total 7,9 100,0 22,1 100,0
Source: Port of Hamburg.
As discussed above, Busan’s geographical intermediacy (Hayuth and Fleming, op. cit.), and
efficiency resulted in it capturing a significant proportion of the China trade, with transshipments
accounting for over 40% of traffic in 2003. This type of function is highly competitive and
potentially unstable. Changes in conditions can bring about significant alterations. Over the last
five years Chinese authorities have sought to provide improved capacity in its major ports in
order to attract direct services. Chinese ports’ throughput has been recording an exceptional
growth during ten years (Tab.4). Mega port expansion projects are underway in all the major
Chinese ports, particularly in Shanghai, Qingdao, Tianjin, Ningbo and Dalian. These projects
involve not only the provision of international-standard container berths, but also the
participation of foreign capital in the management and eventual operation of the new terminals.

17
These projects are being rapidly carried out, and already many of the major international shipping
lines have established direct container services with these ports. This represents a serious threat
to an important part of Busan’s traffic activity. The threat is likely to get much more intense
when the new terminals in Shanghai (Yanshan) begin to come on stream in 2005, and Qingdao
completes the transfer of its container activity to the new port in 2006.
3.3 Government Responses
The Korean ports industry has always been dependent upon government action (Cullinane and
Song, op. cit.). The Ministry of Maritime Affairs and Fisheries (MOMAF) exerts control over the
provision of marine infrastructures. It decides when and where facilities are to be built. The
management of the terminals is devolved to the Korea Terminal Authority (KCTA), which
receives the terminals at no cost. This has been a highly centralized system therefore. The system
worked as long as no unforeseen challenges were encountered.
While the system provided Korea with a competitive port system initially, traffic expansion at
Busan during the 1990s outgrew the facilities that had been constructed. One of the reasons for
congestion at Busan was the slowness of MOMAF to respond to the growing demand for new
facilities (Cullinane and Song, op. cit.). By the mid 1990s it was becoming apparent that if Korea
as a whole was to adjust to the growth of China, significant changes would have to take place,
requiring the provision of new transport capacity, including new port facilities and a new airport
at Inchon. The financial crisis of 1997 accentuated the need for change not only in capacity but
also new governance procedures and for a focus on the expansion of logistics functions.
New infrastructures
18
In 1995 the heavy industrial city of Gwangyang (iron & steel and petrochemicals) was chosen by
MOMAF to become a new container port to help overcome congestion at Busan. This decision
resulted in the construction of four new berths that were opened in 1998 and 1999. With good
marine accessibility, with a 20 meter water depth, and no large adjacent urban area Gwangyang is
a good site for a modern port development. Its local hinterland is limited, but because it possesses
good accessibility inland, time and costs to Seoul are lower than Busan. Journey times from
Gwangyang to the Masan logistic centre are the same as those from Busan terminals, despite the
distance being four times longer. In terms of costs, Korean authorities have guaranteed some
financial advantages to shippers as well as to shipping companies operating through Gwangyang.
Finally, the presence of the two main Korean shipping companies Hanjin and Hyundai in the first
terminals gave Gwangyang an early boost in traffic that it has maintained, reaching 1.2 million
TEUs in 2003.
More recently, decisions were made to construct a new container complex 10 km to the west of
Busan Bay, close to the Noksam industrial complex. This new port will be located totally outside
the urban agglomeration; it quits the original bay site (Fig.3). The New Busan Port is under
construction on a large site reclaimed from the sea and Gadok Island. The project will eventually
have 24 new berths posts with an annual handling capacity of 4.6 million TEUs. The first five
berths will be delivered in 2006. The new facility is intended not only to add handling capacity
to Busan, but also provide relief from the present urban congestion afflicting the present port
facilities. This is regarded as essential in retaining multimodal operators in Busan itself.
The port of Inchon is not cut from such investments: a new container terminal operated by Port of
Singapore Authority (PSA), in a joint-venture with Samsung, was inaugurated in July 2004. Its
yearly capacity is of 400.000 TEUs with, if the construction of two other 300m quays is decided
by the Korean government, a potential of 1.2 million TEUs per annum around 2011, which would
19
be added to a total of 820.000 TEUs in 2003. This terminal wouldn’t suffer from the handicaps of
former infrastructures operated by Hanjin and Korea Express. Its water depth is of 14 metres and
is accessible without lock gate. Such an investment is directly focused on catching regional
flows, notably those between Yellow Sea’s Chinese ports and South Korea. This would avoid the
shippers of Greater Seoul to be dependant from Busan or Gwangyang, when at the same time the
Kyongin Canal is under way (2011) to reduce trucking between Inchon and Seoul (Ducruet,
2005). Transshipment throughputs, which would compete with regional flows, are still not
planned (Containerisation International, 2004b).
3.4 New governance relationships
Korean government’s decision to expand container handling capacity has been matched by a
significant set of changes in the liberalization of port handling operations. Most importantly, the
Korean operators’ monopoly on port operations, either by KCTA or the Korean carriers, has
ended, and the entry of the largest world terminal operators has been encouraged (Lee, 1999). In
February 2002, the Hong Kong terminal operating company Hutchinson Port Holdings entered
the port, having purchased the Jasung Dae Terminal from Hyundai and is committed to the Phase
II development of Gwangyang. In the New Busan Port, CSX World Terminals is the major
private investor along with KCTA.
The liberalization was taken one step further in January 2004, when a new organization was
created to administer the port of Busan. No longer directly dependent upon MOMAF, the new
Busan Port Authority (BPA) is irresponsible for maritime operations and development. It must
follow the same accounting principles as a private company. The goal is to create a more flexible
administrative structure that can respond more quickly to the commercial needs of customers and
20
to external pressures and challenges than the former highly centralized system. It may be noted,
however, that BPA is independent of the local government, although it is hoped that it will
establish synergies with the local authorities in order more effectively coordinate port
development with regional planning and economic development.
Together, these measures are intended to serve Korean territorial development in facilitating the
growth of logistics and financial activities linked to maritime transport. In New Busan Port, as in
Gwangyang, some areas are reserved for logistics activities, and the ports’ free zone status is
likely to attract investors. The new centres are intended to add value to transshipment activities
and introduce new functions into the limited economic bases of the two port cities.
4. CONCLUSION
While Busan has been shaped by global forces, particularly the expansion of trade from the
Pacific Rim, and is confronting competition from beyond Korea; this paper demonstrates that
local factors play an important role in shaping its development and challenges. Congestion is a
common feature of East Asian ports, where traffic growth is presenting particular problems of
access and facility development. As in Singapore, Shanghai and Hong Kong expansion of
infrastructure is taking place at a regional scale. The “challenge of peripheral ports” (Hayuth,
1981) is giving rise to new facilities development that may be under the jurisdiction of the local
port authority, as is the case of Busan New Port in Busan and Yangshan in Shanghai, or in the
development of terminals under different jurisdictions, as in the case of Gwangyang in South
Korea, Tanjung Pelepas in the case of Singapore, and the Shenzhen ports in the Pearl River Delta.
Just as Shenzhen ports are now challenging the hegemony of Hong Kong (Wang and Slack ), so
Gwangyang may be seen as a competitor to Busan. In the case of Taiwan, the dominant position
21
of Kaohsiung is still evident, although there have been attempts to establish new container
terminals in Keelung (Haynes and al, 1998).
Busan offers many similarities with Kaohsiung, both in terms of competition for space within the
port area and with the relatively specialized economic base of the local economies. Like
Kaohsiung, Busan is primarily a centre of heavy manufacturing, and has failed to develop
financial and other high order services that are typical of other major hubs such as Tokyo,
Shanghai and Hong Kong. Whether this can be changed by fostering logistics activities is
uncertain, particularly because of the dominance of the national capitals, Seoul and Taipei.
The most severe challenges faced by Busan are undoubtedly regional and international in scope.
It has exploited the weaknesses of China’s port infrastructures and of Japan’s port management to
establish an important transshipment function. In this regard, with 40% of its traffic being made
up of transfers, Busan is in a more exposed position than any other of the Asian hub ports, except
for Singapore. The massive investments in container handling facilities in many Chinese ports,
and the involvement of many of the leading global terminal handling companies in their
management, presents an enormous challenge to Busan. Whether or not its own internal port
reforms and expansion will be sufficient to counter the developments in China remain to be seen.
REFERENCES
ANONYMOUS (1991), Port-City Relations in Korea. In: I.A.M.P., 4th International Academy of Maritime and Ports Conference, Seoul, Korea, pp. 103-123. CHO, E.S., LEE, H.S. and CHO, Y.S. (2002), A Proposal on Waterfront Development of Port Area in Busan. In: Proceedings of the 26th Annual Spring Meeting on Navigation and Port Research, Korea Institute of Maritime Affairs and Fisheries Technology, Seoul, Korea, pp. 141-152. CONTAINERIZATION INTERNATIONAL (1994), KCTA Puts its Case, December. Available online: www.ci-online.co.uk. CONTAINERIZATION INTERNATIONAL (1995), Hub of the Matter, September. Available online: www.ci-online.co.uk. CONTAINERIZATION INTERNATIONAL (2000), Dual Hub Strategy Pays Off, July, pp. 83-85. Available online: www.ci-online.co.uk.
22
CONTAINERIZATION INTERNATIONAL (2002a), All Systems Go, March, pp. 81-83. Available online: www.ci-online.co.uk. CONTAINERIZATION INTERNATIONAL (2002b), First-Quarter Container Volumes Still Booming at South Korean Ports, June. Available online: www.ci-online.co.uk. CONTAINERIZATION INTERNATIONAL (2004a), Overoptimistic, November, pp. 68-71. Available online: www.ci-online.co.uk. CONTAINERIZATION INTERNATIONAL (2004b), Busan and Incheon Achieve Steady Growth, June. Available online: www.ci-online.co.uk. CULLINANE, K. and SONG, D.W. (1998), Container Terminals in South Korea: Problems and Panaceas. Maritime Policy and Management 25, pp. 63-80. D.R.E.E. (2001), Le Transport Maritime et les Infrastructures Portuaires en Corée du Sud. Direction des Relations Economiques Extérieures, Poste d’Expansion Economique de Séoul. Available online: www.dree.org/coree. DUCRUET, C. (2005) Inchon, Port City of South Korea. Encyclopedia of Maritime History, Oxford University Press, forthcoming. FREMONT, A. and DUCRUET, C. (2004) Logiques Réticulaires et Territoriales au Sein de la Ville Portuaire: le Cas de Busan en Corée du Sud. L’Espace Géographique 33 (4), pp. 193-210. HAYNES, K.E., HSING, Y.M. and STOUGH, R.R. (1998), Regional Port Dynamics in the Global Economy: The case of Kaohsiung, Taiwan. Maritime Policy and Management 24, pp. 93-113. HAYUTH, Y. (1981), Containerization and the Load Center Concept. Economic Geography 57, pp.160-176. HAYUTH, Y. and FLEMING, D.K. (1994), «Spatial Characteristics of Transportation Hubs: Centrality and Intermediacy». Journal of Transport Geography 2 (1), pp. 3-18. HONG, S.W. (1996), Seoul: a Global City in a Nation of Rapid Growth. In: LO F.C. & Yeung Y.M., eds, Emerging World Cities in Pacific Asia, Tokyo, New York, Paris: United Nations University Press, pp. 144-178. JIE, F., XIAOMIN, P., WENYAN, L. and ZHONGJIANG, C. (2000), FDI from Korea and the Development of Sino-Korean Economic Linkages in the Bohai Sea Rim. In: International Conference Report, Inchon Development Institute, Inchon Metropolitan City & University of Inchon, pp. 17-29. KIM, H.S. (2002), The Strategy of Developing a N. E. Asia Logistics Hub in Korea. In: Workshop on Shipping and Port Development Policy, Korea Maritime Institute, Seoul, Korea, pp. 29-50. KIM, K.W., KWACK, K. S., KIM, G. S. (2002), A Study on the Container Tax Collection of Busan City. In: Proceedings of the 26th Annual Spring Meeting on Navigation and Port Research (Busan: Korea Institute of Maritime and Fisheries Technology), pp. 21-30. LEE, T.W. (2999), Restructuring of the Economy and its Impacts on the Korean Maritime Industry. Maritime Policy and Management 26, pp. 311-325. LIM, J.D. (2000), Pusan: Promises and Challenges Rapid Growth. In: NESS G.D., LOW M.M, eds, Five Cities. Modeling Asian Urban Population Environment Dynamics. Kobe: Asian Urban Information Center, pp. 175-203. PARK, S.H. (1990), A Consideration on Effective Port Transportation. Centering around Busan Port. In: 3rd International Academy of Maritime and Ports Conference 3, I.A.M.P., Busan, Korea, pp. 106-130. PARK, Y.H., LEE, K.S., SON, I. and LEE, J.R. (2000), Atlas of Korea (Seoul: Sung Ji Mun Hwa). RIMMER, P.J. (1999), The Asia-Pacific Rim’s Transport and Telecommunications Systems: Spatial Structure and Corporate Control Since the Mid-1980s, Geojournal 48 (1), pp. 43-65. SHIN, D. H. (1998), Governing Inter-Regional Conflicts: Managing Expansion in Busan, Korea. In: FRIEDMAN J., ed, Urban and Regional Governance in the Asia Pacific (Vancouver: Institute of Asian Research, University of British Columbia), p. 51-66.
23
SOO, J.I. (1990), The Gwangyang Container Port as an Innovative Infrastructure for Logistics: a Case Study. In: 3rd International Academy of Maritime and Ports Conference 3, I.A.M.P., Busan, Korea, pp. 96-124. SONG, D-W. (2002), Regional Container Port Competition and Co-operation: the Case of Hong Kong and South China. Journal of Transport Geography 10, pp. 99-110. WANG, J.J. (1998), A Container Load Center with a Developing Hinterland: a Case Study of Hong Kong, Journal of Transport Geography 6, pp. 187-201. WANG, J.J. and SLACK, B. (2000), The Evolution of a Regional Container Port System: the Pearl River Delta”, Journal of Transport Geography 4, pp. 263-275. WANG, J.J., A.K-Y Ng, OLIVIER D. (2004) “Port Governance in China: a Review of Policies in an Era of Internationalizing Port Management Practices”, Transport Policy, University of Oxford, Elsevier, forthcoming. WANG, J.J. and SLACK, B. (2004) “Regional Governance of Port Development in China: a Case Study of Shanghai International Shipping Center”, Maritime Policy and Management Journal. London: Guildhall University, forthcoming.