the electrochemical reduction of fumaric acid on hg-bi
TRANSCRIPT

Scholars' Mine Scholars' Mine
Doctoral Dissertations Student Theses and Dissertations
1972
The electrochemical reduction of fumaric acid on Hg-Bi cathodes The electrochemical reduction of fumaric acid on Hg-Bi cathodes
Chen Hwei Chi
Follow this and additional works at: https://scholarsmine.mst.edu/doctoral_dissertations
Part of the Chemical Engineering Commons
Department: Chemical and Biochemical Engineering Department: Chemical and Biochemical Engineering
Recommended Citation Recommended Citation Chi, Chen Hwei, "The electrochemical reduction of fumaric acid on Hg-Bi cathodes" (1972). Doctoral Dissertations. 1846. https://scholarsmine.mst.edu/doctoral_dissertations/1846
This thesis is brought to you by Scholars' Mine, a service of the Missouri S&T Library and Learning Resources. This work is protected by U. S. Copyright Law. Unauthorized use including reproduction for redistribution requires the permission of the copyright holder. For more information, please contact [email protected].


THE ELECTROCHEMICAL REDUCTION OF FUMARIC
ACID ON Hg-Bi CATHODES
by
Chen Hwei Chi, 1941-
A DISSERTATION
Presented to the Faculty of the Graduate School of the
UNIVERSITY OF MISSOURI-ROLLA
·'·
In Partial Fulfi~.lment of the RequirerneJ\~ for the Degree
DOCTOR OF PHILOSOPHY
in
CHEMICAL ENGINEERING
1972
T2631 83 pages c.l

ii
PUBLICATION THESIS OPTION
This dissertation has been prepared in the style
utilized by the Journal of the Electrochemical Society.
Pages 1 through 45 will be submitted for publication in
that journal. Appendices A to E have been added for
purposes normal to thesis writing.

iii
ACKNOWLEDGEMENTS
The author wishes to thank Dr. J.W. Johnson, Pro
fessor of Chemical Engineering, who served as research
advisor, and Dr. W.J. James, Professor of Chemistry and
Director of the Graduate Center for Material Research.
Their help, guidance, and encouragement are sincerely
appreciated.
A further word of appreciation is extended to the
Graduate Center for the use of equipment and a research
scholarship.

iv
TABLE OF CONTENTS
Page
ACKNOWLEDGEMENTS • • • iii
TABLE OF CONTENTS iv
LIST OF FIGURES . . . . . . . . . . . . . . . . . . . v
LIST OF TABLES • • . . . . . . . . . . . . THE ELECTROCHEMICAL REDUCTION OF FUMARIC ACID ON
Hg-Bi CATHODES • • • • • • •
Abstract .•.
Introduction •
Experimental
Results and Discussion
Bibliography
Captions for Figures
APPENDICES . • . •
A. Materials
B. Apparatus . . . . . . c. Sample Calculations for Fumaric Acid
Dissociation • • • • . • • . . •
D. Experimental Data •
E. A Micro-Determination of Succinic Acid
. • viii
1
1
1
3
5
21
23
46
46
47
48
50
69
VITA . • • . • • . • • · • • • • • • • • . • • . . . . 72
v
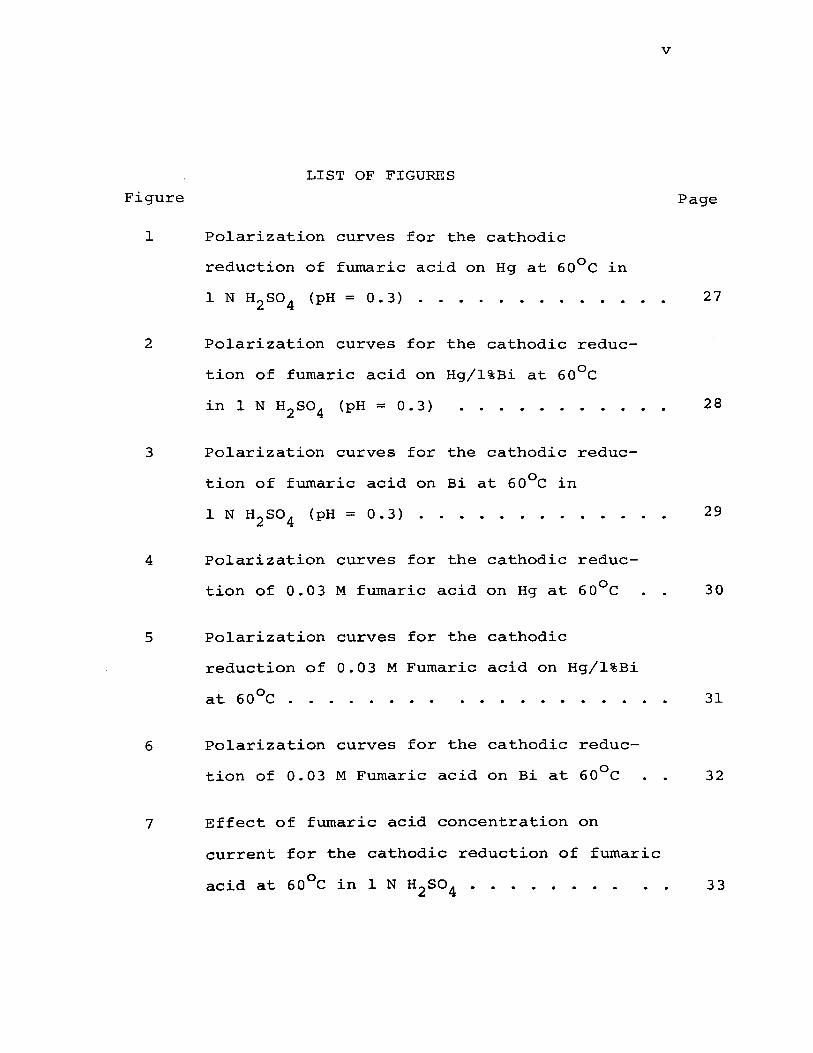
LIST OF FIGURES
Figure Page
1 Polarization curves for the cathodic
reduction of fumaric acid on Hg at 60°C in
2 Polarization curves for the cathodic reduc-
tion of fumaric acid on Hg/l%Bi at 60°C
3 Polarization curves for the cathodic reduc
tion of fumaric acid on Bi at 60°C in
4 Polarization curves for the cathodic reduc
tion of 0.03 M fumaric acid on Hg at 60°C
5 Polarization curves for the cathodic
reduction of 0.03 M Fumaric acid on Hg/l%Bi
at 60°C .
6 Polarization curves for the cathodic reduc
tion of 0.03 M Fumaric acid on Bi at 60°C
7 Effect of fumaric acid concentration on
current for the cathodic reduction of fumaric
acid at 60°C in 1 N H2so4 •
27
28
29
30
31
32
33

vi
LIST OF FIGURES (Con't)
Figure Page
8 Effect of the product of the undissociated
fumaric acid and H+ concentrations on
current for the cathodic reduction of
0 fumaric acid at 60 C . •
9 Arrhenius plots for the cathodic reduction of
0.03 M fumaric acid on Hg at 60°C in 1 N H2so4
(pH = 0.03)
10 Cyclic current-potential curves for 0.003 M
fumaric acid on Hg at 60°C in 1 N H2so4 (pH =
0. 3)
11 Linear relationships between peak current and
square root of sweep-rate for 0.003 M fumaric
acid at 60°C in 1 N H2so4 (pH = 0.3}
12 Linear relationships between peak current and
fumaric acid concentration from 50 mv/sec
34
35
36
37
cathodic sweep at 60°C in 1 N H2so4 (pH= 0.3) 38
13 Variation of peak potential with sweep-rate
for 0.003 M fumaric acid at 60°C in 1 N H2so4
14
(pH = 0. 3) • . • • • • • • • • •
Variation of peak current with (V - E0 ) for p
0.003 M fumaric acid at 60°C in 1 N H2so4
(pH = 0.3) ••••••••••
39
40

vii
LIST OF FIGURES (Con't)
Figure Page
15 Current-potential curves from 50 V/sec
cathodic sweep on Hg at 60°C in 1 N H2so4
(pH = 0 • 3} • • • • • • • • • • • • • •
16 Dependence of surface charges on sweep-rate
for 0.0003 M fumaric acid at 60°C in
1 N H2so4 (pH = 0.3) ...•.........
17 Fractional coverage-potential relationships
for fumaric acid from 50 V/sec cathodic
41
42
sweep on Hg at 60°C in 1 N H2so4 (pH = 0.3). 43
18 Fractional coverage-potential relationships
for fumaric acid from 50 V/sec cathodic sweep
on Hg/l%Bi at 60°C in 1 N H2so4 (pH = 0.3) 44
19 Fractional coverage-potential relationships
for fumaric acid from 200 V/sec cathodic sweep
on Bi at 60°C in 1 N H2so4 (pH = 0.3) 45

Table
I
LIST OF TABLES
Efficiencies for the Cathodic Reduction
of 0.03 M Fumaric Acid to Succinic Acid
at 60°C .
II Rest Potentials and Tafel Slopes for
Fumaric Acid reduction-at 60°c ....
viii
Page
6
7
III Apparent Activation Energies for the Cathodic
Reduction of 0.03 M Fumaric Acid in 1 N H2so4 11
IV Results for 0.003 M Fumaric Acid During
Cathodic Sweep at a Rate of SO rnV/sec at
60°C in 1 N H2so4 (pH = 0.3)
V Comparison of Kinetic Parameters for the
Cathodic Reduction of Fumaric and Maleic
Acids .
VI Degree of Dissociation of Fumaric Acid
VII Current-Potential Relationships for the
Cathodic Reduction of Fumaric Acid on Hg at
60°C in 1 N H2so4 (pH = 0.3)
VIII Current-Potential Relationships for the
Cathodic Reduction of Fumaric Acid on Hg/l%Bi
14
20
49
51
at 60°C in 1 N H2so4 (pH = 0.3) . • . • • 53

LIST OF TABLES (Continued)
Table
IX Current-Potential Relationships for the
Cathodic Reduction of Fumaric Acid on Bi at
X Current-Potential Relationships for the
Cathodic Reduction of 0.03 M Fumaric Acid
0 on Hg at 60 C . . . .
XI Current-Potential Relationships for the
Cathodic Reduction of 0.03 M Fumaric Acid
on Hg/l%Bi at 60°C
XII Current-Potential Relationships for the
XIII
Cathodic Reduction of 0.03 M Fumaric Acid
on Bi at 60°C .
Current-Potential Relationships for Hydro
gen Evolution on Hg and Bi at 60°C in
XIV Current-Temperature Relationships for the
Cathodic Reduction of 0.03 M Fumaric Acid
on Hg in 1 N H2 so4 (pH = 0.3)
XV current-Temperature Relationships for the
Cathodic Reduction of 0.03 M Fumaric Acid
on Hg/l%Bi in 1 N H2so4 (pH= 0.3)
ix
Page
54
55
56
57
58
59
60

Table
XVI
XVII
XVIII
LIST OF TABLES (Continued)
Current-Temperature Relationships for the
Cathodic Reduction of 0.03 M Fumaric Acid
on Bi in 1 N H2so4 (pH= 0.3) ...•••
Peak Current-Peak Potential Relationships
from Cathodic Sweeps for Fumaric Acid on
Hg at 60°C in 1 N H2so4 (pH = 0.3) .•.
Peak Current-Peak Potential Relationships
from Cathodic Sweeps for Fumaric Acid on
Hg/l%Bi at 60°C in 1 N H2so4 (pH= 0.3)
XIX Peak Current-Peak Potential Relationships
from Cathodic Sweeps for Fumaric Acid on
Bi at 60°C in 1 N H2so4 (pH= 0.3) ••
XX Surface Charge-Sweep Rate Relationships
from Cathodic Sweeps for 0.0003 M Fumaric
Acid at 60°C in 1 N H2so4 (pH = 0.3)
XXI Surface Charge-Potential Relationships
from 50 V/sec Cathodic Sweep on Hg at 60°C
X
Page
61
62
63
64
65
in 1 N H2so4 (pH = 0.3) • • • . . . • . . • . 66
XXII Surface Charge Potential Relationships from
50 V/sec Cathodic Sweeps on Hg/l%Bi at
6 0 ° C in 1 N H2SO4 (pH = 0 • 3) • • • • • • 6 7

Table
XXIII
XXIV
LIST OF TABLES (Continued)
Surface Charge-Potential Relationships from
200 V/sec Cathodic Sweep on Bi at 60°C in
1 N H2so4 (pH= 0.3) .•..•..•.
Data for the Coulombic Efficiency Studies
of the Cathodic Reduction of Fumaric Acid
to Succinic Acid • . . • • .
xi
Page
68
71

THE ELECTROCHEMICAL REDUCTION OF FUMARIC ACID
ON Hg-Bi CATHODES
Chen Hwei Chi
Department of Chemical Engineering
and
Graduate Center for Materials Research
University of Missouri-Rolla
Rolla, Missouri U.S.A.
ABSTRACT
1
The electrochemical reduction of fumaric acid was
studied on Hg, Hg/l%Bi amalgam, and Bi at 60°C in acidic
solutions of various pH ranging from 0.3 to 3.7. The
fumaric acid was reduced to succinic acid with high
efficiency on each electrode. The steady state kinetic
parameters included Tafel slopes of ca. 2.3 RT/F and
first order concentration dependences for both undissociated
+ fumaric acid and H . Transient measurements indicated low
coverages of adsorbed fumaric acid and no adsorbed hydro-
gen species in the potential region of the reaction. A
reaction mechanism is proposed which involves a chemical
rate determining step between an adsorbed fumaric acid
molecule(that has added an electron} and a non-adsorbed H+.
INTRODUCTION
studies of the electrolytic reduction of fumaric acid
appearing in the literature have mostly concerned current

2
efficiencies and polarographic analyses. Kanakam, et
al., 1 found a current efficiency of 95 percent for the
reduction of fumaric to succinic acid at a rotating lead
cathode. Herasymenko2 reported that only undissociated
species of fumaric acid were reduced during the electro-
lyses of aqueous solutions at a dropping mercury electrode.
Schwaer, 3 Herasymenko and Tyvonuk, 4 and Vopicka5 made
extensive polarographic investigations of fumaric and
maleic acids (geometric isomers) in acidic and buffered
solutions of various pH. They found that more negative
potentials were required to reduce fumaric than maleic
acid. Kalousek6 reported that the reduction of fumaric
acid is irreversible at a dropping mercury electrode.
Elving and Teitalbaum7 proposed a reduction sequence based
on polarographic studies in which a radical ion is formed
during a reversible step and, possibly simultaneously,
acquires a proton. The further reduction included another
electron transfer and hydrogen ion addition to form
succinic acid.
An extensive study of the reduction of maleic acid on
Hg, Hg/Bi, and Bi electrodes was made by Hsieh. 8 He found
high efficiencies for the reduction to succinic acid,
independent of the cathode used. A reaction mechanism was
proposed which involved a chemical rate determining step
between an adsorbed maleic acid species which had gained
an electron and a non-adsorbed hydrogen ion.

3
Although extensive polarographic investigations of
fumaric acid reduction have been carried out, it was felt
a need existed for a thorough kinetic study to obtain
more detailed information about the reaction mechanism.
Both steady state and transient methods were employed in
the present investigation. Steady state methods were used
to evaluate such kinetic parameters as Tafel slopes,
coulombic efficiencies, pH, concentration, and temperature
effects. The transient methods were used primarily to
obtain information regarding adsorption phenomena. A com-
parison of the results of this study with those obtained
by Hsieh for maleic acid is also of interest.
EXPERIMENTAL
The electrolytes, pH 0.3 to 3.7, were prepared using
appropriate quantities of H2so4 , K2so4 , KOH, fumaric acid,
and conductivity water. The reagents were Fisher "certified"
grade. The fumaric acid concentration was varied from 0.001
to 0.03 M, the upper limit determined by the solubility.
The sulfate concentration was held constant at unit nor-
mality to insure good conductance. Matheson "prepurified"
grade nitrogen was used for purging and stirring.
Three different cathodes (Hg, Hg/l%Bi amalgam, and Bi)
were used. The Hg was Bethlehem's* triple-distilled instru
ment grade and the Bi was ESPI's** 6N grade. The amalgam
*Bethlemen Apparatus Company, Inc., Hellertown, Penn. **Electronic Space Products, Inc., Los Angeles, California

4
was prepared by dissolving an appropriate amount of Bi
in Hg with slight heating. A planar Bi electrode was
prepared by machining a flat surface on a Bi rod. The
counter electrode was a piece of platinized-Pt wire gauze.
The reference electrode, Hg/Hg2so4 (1 N H2so4 ), was con
nected to the cathode via a Luggin capillary and salt
bridge of the same electrolyte used as in the electrolysis
cell.
The cells used with the liquid cathodes (Hg and
Hgjl% Bi) were similar to those described by Hsieh. 8 A
conventional H-cell was used with the Bi cathode. The
temperature of the catholyte was maintained at the stated
values + O.S°C. The experimental procedures and equipment
for the steady state measurements have been described. 8
The transient measurements were made in a manner similar
to those of Gilman and Breiter. 9 The quantities of
succinic acid produced during the coulombic efficiency
studies were also determined as described previously. 8

5
RESULTS AND DISCUSSION
A. Coulombic Efficiency
The results of the coulombic efficiency experiments
are shown in Table 1. The efficiencies for succinic acid
production vary from 85 to 97 + 2 percent. No hydrogen
evolution was observed at the cathodes, although small
amounts could have been produced that dissolved directly
in the electrolyte without bubble formation. Gas
chromatographic (flame ionization) examination of the
electrolytes revealed no product other than succinic acid.
Thus, the predominant electrochemical reaction can be
represented as
HOOC-CH=CH-COOH(aq) + 2H+(aq) + 2e = HOOC-CH 2 -cH2-COOH(aq)
Fumaric Acid Succinic Acid
( 1)
B. Rest Potentials
The open circuit potentials with fumaric acid present
in the various electrolytes are shown in Table II. The
thermodynamic values for Eq. 1 (E0 = 0.49V) are in the
proximity of the values for Hg. However, the random
variation of the measured values with fumaric acid concen
tration and pH indicates that they cannot be attributed to
fumaric acid reduction. This is more apparent with the

TABLE I
EFFICIENCIES FOR THE CATHODIC REDUCTION OF
0.03 M FUMARIC ACID TO SUCCINIC ACID
AT 60°C
Electrode pH Ixlo 3 Efficiency
amp** Percent
Hg 0.3 1.5 95
" 2.9 1.0 85
Hg/l%Bi 0.3 4.0 97
II 2.9 2.0 86
Bi 0.3 5.0 91
II 2.9 3.0 90
*Average of a minimum of two determinations.
**The cathodic are2s were 10 cm2 for the Hg and Hg/l%Bi and 3 em for the Bi.
6
*

pH
0.3
II
II
II
II
II
1.5
2.2
2.9
3.7
7
TABLE II
REST POTENTIAL AND TAFEL SLOPES FOR FUMARIC ACID REDUCTION AT 60°C
Fumaric E rest Tafel slopes acid cone. Hg Hg/l%Bi Bi Hg Hg/l%Bi Bi
gmole/1 V,SHE V,SHE V,SHE v v v
0.594 0.215
0.0003 0.579 0.197 0.230 -0.080 -0.080
0.001 0.579 -0.075
0.003 0.591 0.205 - -0.070 -0.072 -0.066
0.01 0.582 0.225 -0.067 -0.068
0.03 0.589 0.205 0.215 -0.068 -0.068 -0.065
0.03 0.580 0.20 0.19 -0.065 -0.067 -0.067
0.03 0.585 -0.065
0.03 0.580 0.20 0.16 -0.070 -0.070 -0.070
0.03 0.598 -0.073

8
Hg/l%Bi and Bi electrodes where the rest potentials are
very near the reversible values for Bi dissolution (E0 =
0.215 V). Qualitative analyses of electrolytes that had
contacted these latter electrodes revealed the presence
of Bi+3 . The decreasing value with Bi at the higher pH's
is consistent with an oxide fiLm which forms under these
conditions.
C. Steady-State Current-Potential Relationships
Polarization curves for the various fumaric acid
concentrations and pH's are shown in Figs. 1-6. There are
three distinguishable regions in the curves: a residual
current, a linear Tafel, and a limiting current region.
The residual currents were not significantly affected by ....
fumaric acid or H concentrations but did increase when
Bi/Hg and Bi cathodes were used. Since it was found that
some Bi dissolved in the electrolytes, the increased
currents were probably due to redeposition of the Bi when
the potential was lowered. A finely divided (black)
deposit of Bi was present on the Bi cathodes after the
electrolyses. The slopes of the linear Tafel regions
were -65 to -80 mv, ca. -2.3RT/F. With Langmuir-type
adsorption, this normally indicates a slow surface chemical
reaction following the first electron transfer. Currents
in the Tafel region were reproduceablewithin 10 percent.

9
D. Concentration and pH Effects
The effect of fumaric acid on c.d. in 1 N H2so4 is
shown in Fig. 7. The plots are linear with slopes of about
one for all the cathodes. The reactive species are not
distinguished by this plot since for a given pH, the frac-
tion of fumaric acid dissociated is independent of the
initial concentration due to the low dissociation constant
-4 (K1 = 9.3 x 10 ). The data for the higher pHts where
dissociation is appreciable were correlated by a trial and
error procedure. Fig. 8 shows the most successful correla-
tion which involved the product of the unionized fumaric
acid and H+ concentrations. The slopes of these plots are
also unity. Thus, H2F* is indicated to be the reactive
fumaric acid species, and both it and H+ have a first order
concentration effect.
With this information, an empirical relationship for
the current density can be written:
(2)
This expression is valid for all the cathodes. However it
should be noted that for a given potential, the c.d. is
increased significantly** on the Hg/Bi and Bi cathodes.
*Undissociated fumine acid.
**In the linear Tafel region, isi ~ l0 3iHg·

10
E. Limiting Currents
An examination of Figs. 1-3 shows the limiting currents
to be proportional to the fumaric acid concentration. As
would be expected at the lower potentials, the h.e. begins
to make a substantial contribution to the current.
F. Temperature Effect
Arrhenius plots for the reduction of fumaric acid on
Hg are shown in Fig. 9 for various potentials within the
linear Tafel region. These plots are typical for the Hg/l%Bi
and Bi cathodes. The resulting apparent activation energies
are tabulated in Table III. The effect of potential,
aE'/aV is also shown in the table and the values agree well a '
with those predicted from Eq. 2, i.e., For 23 Kcal/volt.
The activation energies are notable due to their smallness.
Ordinarily one might associate these values with a diffusion
controlled reaction. However, this was not the case here as
there was no effect of stirring.
G. Low sweep Rate Voltamrnetry
Cyclic potential sweep measurements employing several
linear sweep rates were made for all the cathodes with
various fumaric acid concentrations. A set of typical i-V
curves are shown in Fig. 10 for 0.003 M fumaric acid in
1 N H2so4 on Hg. The observed shift of the peak potential
with sweep rate is normally associated with irreversible

TABLE III
APPARENT ACTIVATION ENGERIES FOR THE CATHODIC
REDUCTION OF 0.03 M FUMARIC ACID IN
1 N H2so4
Electrode v
Volts(SHE)
Hg -0.355
" -0.405
" -0.475
Hg/l%Bi -0.305
" -0.355
" -0.405
Bi -0.255
II -0.305
II -0.375
E' a
Kcal
7.3
6.0
4.5
7.0
5.6
4.2
5.3
4.0
2.7
aE~/av
Kcal/volt
23
28
22
11
12
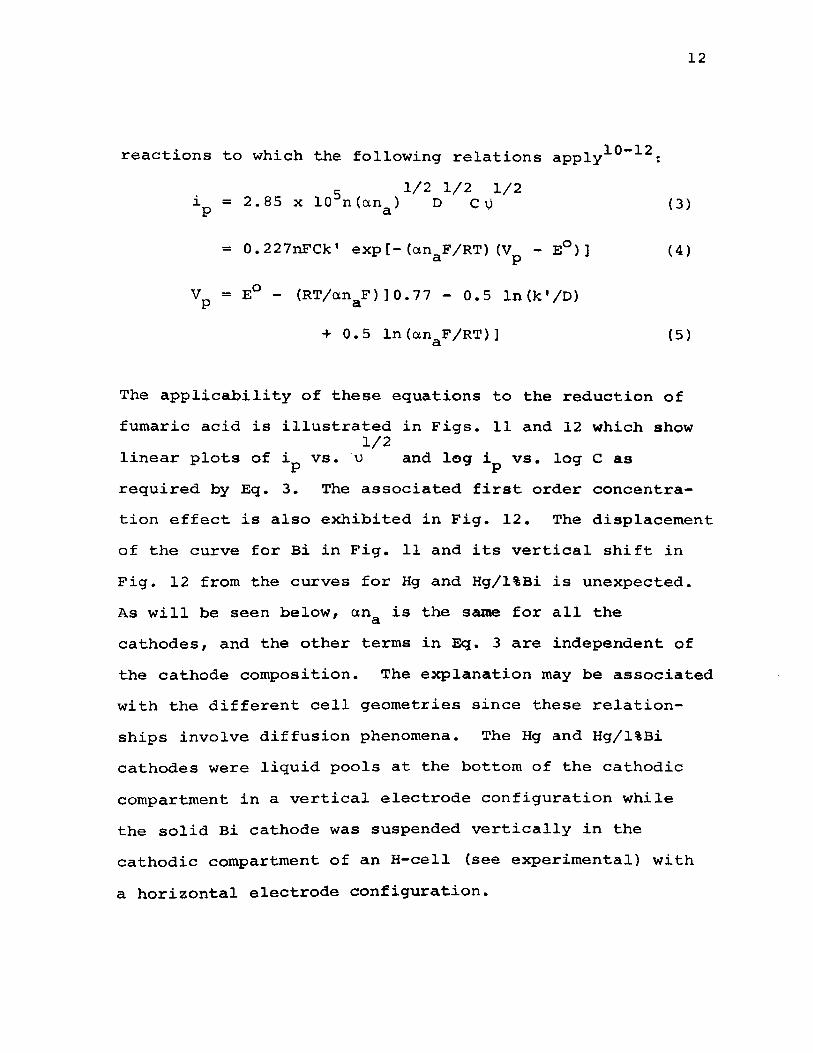
reactions to which the following relations apply10- 12
5 1/2 1/2 l/2 i = 2. 85 x 10 n (an ) D C \}
p a {3)
= 0.227nFCk' exp[-(an F/RT) {V - E0 )] a P
vp = E0 - (RT/an F)]0.77- 0.5 ln(k'/D) a
+ 0.5 ln(anaF/RT)]
{ 4)
(5)
The applicability of these equations to the reduction of
fumaric acid is illustrated in Figs. 11 and 12 which show 1/2
linear plots of ip vs. \) and log ip vs. log c as
required by Eq. 3. The associated first order concentra-
tion effect is also exhibited in Fig. 12. The displacement
of the curve for Bi in Fig. 11 and its vertical shift in
Fig. 12 from the curves for Hg and Hg/l%Bi is unexpected.
As will be seen below, ana is the same for all the
cathodes, and the other terms in Eq. 3 are independent of
the cathode composition. The explanation may be associated
with the different cell geometries since these relation-
ships involve diffusion phenomena. The Hg and Hg/l%Bi
cathodes were liquid pools at the bottom of the cathodic
compartment in a vertical electrode configuration while
the solid Bi cathode was suspended vertically in the
cathodic compartment of an H-oell (see experimental) with
a horizontal electrode configuration.

13
From Eq. 5, there should exist a linear relationship
between VP and log u which has a slope of -2.3RT/2~naF.
Such a plot is shown in Fig. 13. The relationship is
linear for all three cathodes with slopes varying from
-0.066 to -0.069 v. At 60°C, 2.3RT/F = 0.068 v, thus
~ 1, or n = 1 when ~ = 0.5*. a A somewhat similar
relationship exists between VP - E0 and log ip as shown
in Eq •. 4. These plots are shown in Fig. 14** and the
resulting slope of ca. -0.135 V which corresponds to
2.3RT/~naF. Again ~na = 0.5 or na = 1. The log i intercept
from Fig. 14 (Vp - E0 = 0} can also be used to estimate the
rate constant k' in Eq. 4. These values are shown in Table
IV along with a summary of other data from this section
as well as calculated peak currents*** from Eq. 3.
The ability of Eqs. 3-5 to correlate data in this
section is evidence for the irreversibility of the cathodic
reduction of fumaric acid (as previously report by Kalousek6 )
and the value na = 1 indicates that one electron is trans
ferred during or prior to the r.d.s.
* The value normally assigned to ~.
** The standard potential E0 used above was estimated from thermodynamic data to be 0.49 v.
*** The diffusion coefficient D = 5.4 x 10⁻⁵ cm2/sec used in this calculation was determined from the Stokes-Einstein equations.l3
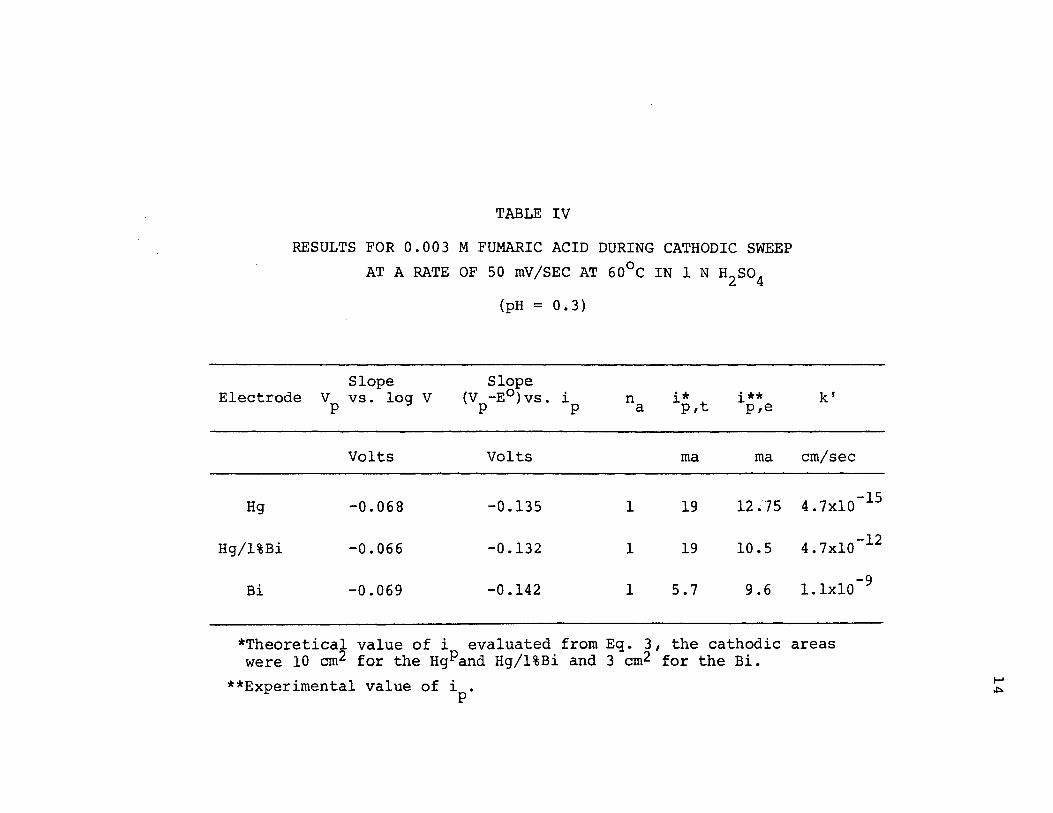
TABLE IV
RESULTS FOR 0.003 M FUMARIC ACID DURING CATHODIC SWEEP
AT A RATE OF 50 rnV/SEC AT 60°C IN 1 N H2so4
(pH = 0.3}
Slope Slope Electrode V vs. log V (V -E0 }vs. i n i* p,t i** p p p a p,e
Volts Volts rna rna
Hg -0.068 -0.135 1 19 12 ,;]5
Hg/l%Bi -0.066 -0.132 1 19 10.5
Bi -0.069 -0.142 1 5.7 9.6
k'
em/sec
4.7xlo-15
4.7xlo-12
l.lxlO -9
*Theoretical value of i evaluated from Eq. 3, the cathodic areas were 10 cm2 for the HgPand Hg/l%Bi and 3 crn2 for the Bi.
**Experimental value of ip. f-1 ~

15
H. Adsorption Characteristics
The method used to determine the coverages of reactive
species on the cathodes employed fast sweep rate voltammetry
described by earlier workers. 9 • 14 i-V curves for a sweep
rate of 50 V/sec in 1 N H2so4 with and without fumaric acid
present are shown in Fig. 15. The difference Q in the
amount of charge passed during the two sweeps (area between
the curves) is generally a function of sweep-rate u. How-
ever, under favorable conditions, a plateau may be observed
where Q is relatively independent of u and can be related to
the amount of adsorbed reactive species. Values of Q were
determined for several sweep-rates for the three cathodes
used in this study and are plotted vs. u in Fig. 16. A
short plateau can be seen in all three instances at about
50 V/sec for Hg and Hg/l%Bi and 200 V/sec for Bi*. Further
studies were made at these sweep-rates for various fumaric
acid concentrations and initial cathodic potentials. The
results of these measurements are shown in Figs. 17-19 where
Q has been converted to a fractional coverage e by dividing
by Qm' the charge necessary to reduce a complete monolayer
of fumaric acid. Q was estimated to be 65 ~c/cm2 assuming m
that (1) two electrons are required for each fumaric acid
molecule and (2) the fumaric acid molecule lies flat on
f d . of 49 o 2,15 the electrode sur ace an occup1es an area A • It
*The higher sweep-rate for the plateau with Bi indicates the reaction ctccurs faster on this surface, in agreement with steady-state observations.

should be noted that if the fumaric acid molecule does
not lie flat on the electrode surface, Q will increase m
16
and the fractional coverage will be even lower than shown.
An inspection of Figs. 17-19 shows a region where
coverage is independent of potential. This corresponds to
the residual current region mentioned in the steady-state
section (see Figs. 1-3). This is a potential where very
little (relatively speaking) fumaric acid is removed by
reaction. As the potential is lowered, the rate of fumaric
acid reduction increases significantly and the coverage
decreases. At potentials of ca. -0.4 to -0.5 v, the
coverages have dropped to almost zero which corresponds to
the beginning of the diffusion-controlled regions. The
initial coverages are sufficiently low that Langmuir-type
adsorption can be assumed.
To determine whether or not adsorbed H atoms might
be participating in the reaction by H+ discharge, a back
ward (anodic) sweep technique was used which was started
at various potentials along the polarization curves shown
in Figs. 1-3. Only when the sweeps were begun at potentials
lower than -0.9 V were there any indications of adsorbed
species that could be anodically oxidized. This indicated
the absence of a•(ads) over the activation controlled
region for fumaric acid reduction.

17
I. Proposed Reaction Sequence
The following is a summary of parameters and character
istics that can be associated with the fumaric acid reduc-
tion:
is:
(1) The Tafel slope, 3V/3 log i ~ -0.068 V, indicates
a rate determining chemical step subsequent to
the first electron transfer.
(2) The reactive species is undissociated fumaric
acid and the concentration effect,
a log i/3 log CH F' is one. 2
(3) The pH effect, a log i/3H+, is one.
(4) The elctrons are transferred directly to the
fumaric acid species since they are adsorbed on
the electrode surface. Apparently no H+ is
discharged, thus the reactive hydrogen species
are protons.
(5) The low coverages of fumaric acid allow Langmuir
type adsorption to be assumed.
A reaction sequence consistent with these observations
(6)
(7)

18
This sequence leads to a rate equation that is identical
to Eq. 2, the empirical relationship.
J. Comparison of Fumaric and Maleic Acid Reduction
Both fumaric and maleic acid are reduced to succinic
acid with high efficiency. The polarization curves are
similar, containing linear Tafel regions with slopes of
c.a. -2.3RT/F. The transform, fumaric, is reduced at
potentials slightly more negative than the cis-form, maleic.
The exchange currents for fumaric acid on Hg are lo-17 to
-19 2 10 amp/em . The corresponding values for maleic acid
are lo-18 to lo-20 amp/cm2 . In both cases, the reactive
species are the unionized acids which exhibit first order
concentration effects. The concentration effect for H+ is
also first order. The activation energies for the reac-
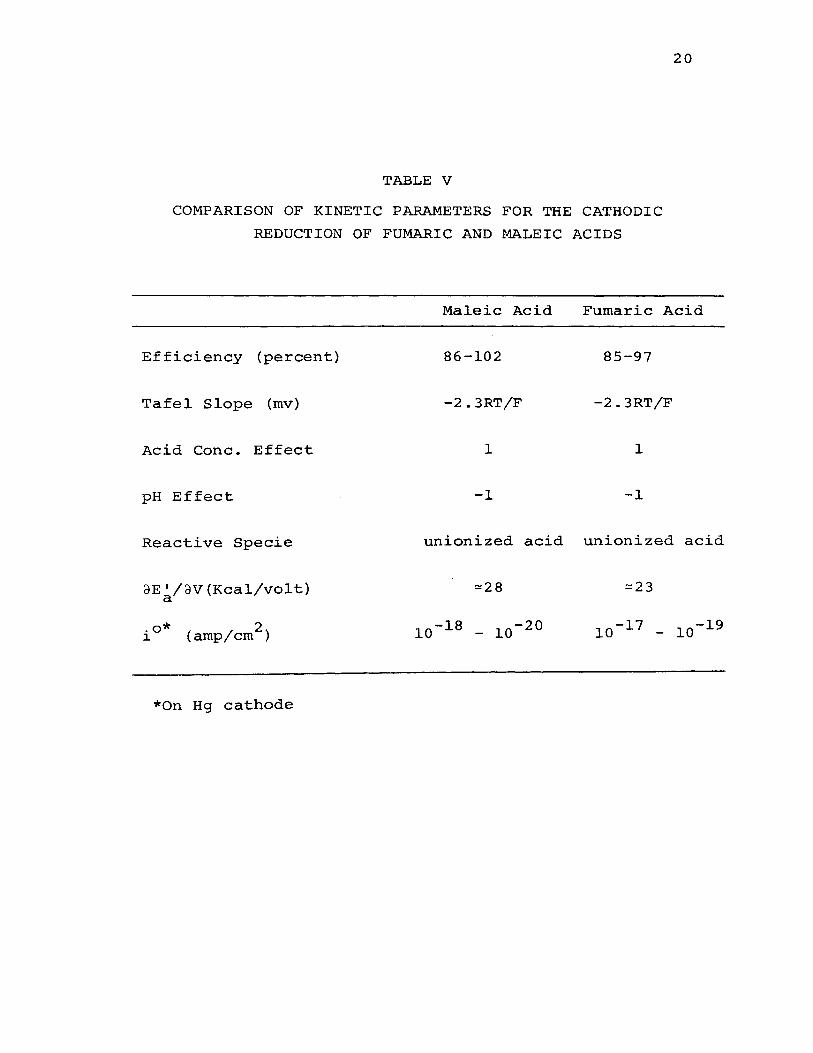
tions are about the same. A comparison of the kinetic para-
meters are shown in Table V. All these indicate that the
same activated complex is probably formed during the
reduction sequence. Some cyclic voltammetry studies with
maleic acid on Hg were carried out in order to compare its
adsorption characteristics with the present work. The
results indicated that both acids give approximately the
same coverages of adsorbed species. In summary, it appears
that the structural differences between fumaric and maleic

19
acids do, not appreciably affect the reduction mechanism
on Hg-Bi cathodes.
20
TABLE V
COMPARISON OF KINETIC PARAMETERS FOR THE CATHODIC
REDUCTION OF FUMARIC AND MALEIC ACIDS
Efficiency (percent)
Tafel Slope (mv)
Acid Cone. Effect
pH Effect
Reactive Specie
aE'/aV(Kcal/volt) a
.o* 2 1 (amp/em )
*On Hg cathode
Maleic Acid
86-102
-2. 3RT/F
1
-1
unionized acid
"'='28
10-18 - 10-20
Fumaric Acid
85-97
-2. 3RT/F
1
-1
unionized acid
"'='23
10-17 - 10-19

21
:J?IBLIOGRAPHY
1. R. Kanakam, M.S. Pathy and H.V.K. Udupa, Electrochirn.
Acta., 12, 329 (1967).
2. P. Herasyrnenko, z. Elektrochern. angew. Physik. Chern.,
34, 74 (1928).
3. L. Schwaer, Collection Czechoslov. Chern. Commun., lr
326 (1935).
4. P. Herasymenko and z. Tyvonuk, Collection Czechoslov.
Chern. Cornrnun., ~' 77 (1930).
5. E. Vopicka, Collection Czechoslov. Chern. Cornmun., ~'
349 (1936).
6. M. Kalousek, Chern. Listy, 40, 149 (1946).
7. P.J. Elving and c. Teitelbaum, J. Arner. Chern. Soc.,
71, 3916 (1949) 0
B. S.Y. Hsieh, "The Cathodic Reduction of Maleic Acid",
Ph.D. Dissertation, University of Missouri-Rolla~l970).
9. s. Gilman and M.W. Breiter, J. Electrochern. Soc.,
109, 1009 (1962).
10. p. Delahay, J. Amer. Chern. Soc., 7 5, 1190 (195 3) •

11. P. Delahay, "New Instrumental Methods in Electro
chemistry", Interscience Publishers, Inc., New
York (1966).
12. c. Wagner, J. Meth. Phys., 32, 289 (1954).
22
13. R.B. Bird, "Transport Phenomena", John Wiley & Sons,
Inc., New York(l966).
14. M.W. Breiter and s. Gilman, J. Electrochem. Soc.,
109' 622 (1962).
15. R.W.G. Wyckoff, "Crystal Structures", Vol. 5, Inter
science Publishers, New York (1966).

23
CAPTIONS FOR FIGURES
Figure 1. Polarization curves for the cathodic reduction
of fumaric acid on Hg at 60°C in 1 N H2so4
(pH= 0.3) •. (Q, 0.03M;6, 0.01MJ0, 0.003M;
~, 0.001 M;<>, 0.0003 M; e, no fumaric acid)
Figure 2. Polarization curves for the cathodic reduction
of fumaric acid on Hg/1%Bi at 60°C in 1 N H2so4
(pH = 0 • 3) • ( 0 , 0 • 0 3 M; f),. , 0 • 0 0 3 M; 0 , 0 • 0 0 0 3 M)
Figure 3. Polarization curves for the cathodic reduction
of fumaric acid on Bi at 60°C in 1 N H2so4 (pH =
0 • 3 ) • ( 0 , 0 • 0 3 M J f),. , 0 • 0 1 M; 0 , 0 • 0 0 3 M; e , no
fumaric acid)
Figure 4. Polarization curves for the cathodic reduction
of 0.03 M fumaric acid on Hg at 60°c. ( Q, pH =
0. 3; f),. 1 pH = 1. 5; 0, pH = 2. 2; ~~ pH = 2. 9;
<>, pH = 3. 7)
Figure 5. Polarization curves for the cathodic reduction of
0. 03 M fumaric acid on Hg/1%Bi at 60°C. ( 0, pH =
0. 3 J f),., pH = 1. 5; 0, pH = 2. 9)
Figure 6. Polarization curves for the cathodic reduction of
0.03 M fumaric acid on Bi at 60°c. ( Q, pH= 0.3;
D,. , pH = 1. 5 1 0 1 pH 1111 2 • 9 )

24
CAPTIONS FOR FIGURES (Con 1 t)
Figure 7. Effect of fumaric acid concentration on current
for the cathodic reduction of fumaric acid at
60°C in 1 N H2so4 • ( Q, Hg cathode, -0.48 V;
~~ Hg/l%Bi, =0.38 V; 0, Bi, -0.28 V)
Figure 8. Effect of the product of the undissociated fumaric
acid and H+ concentration on current for the
cathodic reduction of fumaric acid at 60°C.
( 0 1 Hg cathode, -0.48 V; 6,, Hg/l%Bi, -0.38 V;
0 1 Bi, -0.28 V)
Figure 9. Arrhenius plots for the cathodic reduction of 0.03M
fumaric acid on Hg at 60°C in 1 N H2so4 (pH= 0.3).
( 0 1 -0.475 V; 6, -0.405 V; 0, -0.355 V)
Figure 10. Cyclic current-potential curves for 0.003 M fumaric
acid on Hg at 60°C in l N H2so4 (pH = 0. 3). (a,
100 rnv/sec sweep-rate; b, 80 rnv/sec; c, 60 rnv/sec;
d, 50 rnv/sec; e, 40 rnv/sec; f, 30 rnv/sec; g,
20 rnv/sec; h, 10 rnv/sec)
Figure 11. Linear relationships between peak current and
square root of sweep-rate for 0.003 M fumaric acid
at 60°C in 1 N H2so4 (pH= 0.3). (O, Hg cathode;
f:'j., Hg/l%Bi; 0 1 Bi)
Figure 12. Linear relationships between peak current and

25
CAPTIONS FOR FIGURES (Can't)
fumaric acid concentration from 50 mv/sec
cathodic sweep at 60°C in 1 N H2so4 (pH= 0.3).
( Q, Hg cathode J L)., Hg/l%Bi; 0, Bi)
Figure 13. Variation of peak potential with sweep-rate for
0.003 M fumaric acid at 60°C in 1 N H2so4 (pH=
0.3). ( 0 1 Hg cathode; 6 1 Hg/l%Bi; O, Bi)
Figure 14. Variation of peak current with (Vp - E0 ) for
0.003 M fumaric acid at 60°C in 1 N H2so4 (pH =
0.3). ( Q, Hg cathode;-6., Hg/l%Bi; 0 1 Bi)
Figure 15. Current-potential curves from 50 V/sec cathodic
sweep on Hg at 60°C in 1 N H2so4 (pH= 0.3).
(curve A, 0.0003 M fumaric acid, curve B, no
fumaric acid) ..
Figure 16. Dependence of surface charges on sweep-rate
for 0.0003 M fumaric acid at 60°C in 1 N H2so4
(pH = 0. 3) • ( Q, Hg cathode;~' Hg/l%Bi; 0, Bi)
Figure 17. Fractional coverage-potential relationships for
fumaric acid from 50 V/sec cathodic sweep on Hg
at 60°C in 1 N H2so4 (pH = 0. 3). ( Q, 0. 0005 M
fumaric acid;~ 1 0. 0003 M; 0, 0. 0001 M)

CAPTIONS FOR FIGURES (Con't)
Figure 18. Fractional coverage-potential relationships
for fumaric acid from 50 V/sec cathodic sweep
on Hg/l%Bi at 60°C in 1 N H2so4 (pH= 0.3).
( 0, 0.0005 M fumaric acid;~, 0.0003 M; Q,
0.0001 M)
26
Figure 19. Fractional coverage-potential relationships for
fumaric acid from 200 V/sec cathodic sweep on
Bi at 60°C in 1 N H2so4 (pH= 0.3). ( Q, 0.0005 M
fumaric acid;~, 0. 0003 ,M; 0, .(). 0001 lot)

27
-0.2
-w V5 -0.4 -0
> -0.6 "' >
-0.8
-6 -5 -4 -3
log i , amp- cm-2
Figure 1.

28
~
L1J :J: V) -In -0.4 .... 0 >
... > -0.6
-5 -4 -3
log I. amp.cm- 2 1
Figure 2.

29
.......... -0.2 w :r CJ) ~
(/) ...... -0.4 0 >
... >
-0.6
-4 -3 -2
log ·~ amp· cm-2 ,
Figure 3.

30
- -0.2 LLJ :J: (/) -(/) -0.4 ~
0 >
--> -0.6
-5 -4
log , amp. cm2
Figure 4.

-w ::c en -en ~
0 >
... >
-0.2
-0.4
-0.6
-0.8
-6 -5
log i ,
-4 -3
-2 amp·cm
Figure 5.
31

32
-0.2 -w ::1: (/) -en -0.4 .... 0 >
,..
> -0.6
-4 -3
log . I '
amp· crii 2
Figure 6.

C\J •E
0
0.. -4 E c
.. C)')
0
-5
-6
I og C ,
-2 -I
gmole ·I iter
Figure 7.
33

N •e
0 .
-3
-4
Q. E -5 0
,, .. -6
0' 0
-7
-6 -5 -4 -3 -2
-1 2 (gmole ·liter )
Figure 8.
34

-4
C\J 'E
(..) . ~
E 0
- -5 0' 0
--o-....
~
2.9 3.0
( T )-1 3 X I 0 ,
Figure 9.
--o-
0 -1 K
35
-o-
"""'6-
3. I

36
1.5 N
'E (.) . ~
E 0
I .0
-rt'>
0
X
0.5
-0.4 -0.5 -0.6
V , volts (SHE)
Figure 10.

37
6
C\J 5 'E
0 . 0.. 4 E 0
... 3 r<>o X 0.. 2
0. I 0.2 0.3 0.4
I I
u2 , (volts· sec-1>2
Figure 11.

38
N 10 IE 0
0.. E 0
rt') .. 0
X a.
0.00 I 0.0 I
C , gmo I e · I i t e r I
Figure 12.

-w :t: en -(/) ..... 0 >
0. >
39
-0.62
-0.64
0.0 I 0.1
u, volts· sec- I
Figure 13.

-w :::c en -(/) +-
0 :>
... -0 w I
>a. -
-0.9
- 1.0
- I . I
-2 amp em
Figure 14.
40

41
N IE 3 0 .
0.. E c
2 rt') ...
0
X
0 --0.2 -0.4 -0.6 -0.8 -1.0
V , volts (SHE)
Figure 15.

C\J •e
0 u :t. - I 0
Q) 0' ... 0 .s::. 0
Q)
g 5 '+... ~ (/)
42
100
v, volts· sec- I
Figure 16.

43
Q) 0 c ~ Q) > 0 (..) 0.1 c c: 0 +-(..) 0 ~
'+-
... CD
0 -O.I -0.3 -0.5
V, volts (SHE)
Figure 17.

44
0.2
Q) ~ c "-Q) > 0 0
- 0.1 0
8 .... 0 0 .....
'+-
ft
CD
q_O.I -0.3 -0.5
V, volts (SHE)
Figure 18.

45
Q) 0 0 "-Q)
~ 0
c; 0.1 c 0 ·-..... 0 0 "-......
... Q)
0 0 -0.2 -0.4
V, volts (SHE)
Figure 19.

APPENDIX A
MATERIALS
46
The following is a list of the major materials and
reagents used in this investigation. Detailed specifica
tions or analyses of the reagents may be obtained from the
catalogues of the suppliers.
1. Mercury. Triple distilled, instrument grade.
Bethlehem Apparatus Co., Inc., Hellertown, Pa.
2. Bismuth. 6N grade (99.9999% pure}. Electronic
Space Products, Inc., Los Angeles, Calif.
3. Fumaric Acid. Purified. Fisher Scientific
Company, Fairlawn, N.J.
4. Sulfuric Acid. Fisher Certified, A.C.S. Fisher
Scientific Company, Fairlawn, N.J.
5. Potassium Sulfate. Fisher Certified, A.C.S.
Fisher Scientific Company, Fairlawn, N.J.
6. Potassium Hydroxide. Fisher Certified, A.C.S.
Fisher Scientific Company, Fairlawn, N.J.
7. Nitrogen. Prepurified grade (99.997% pure}.
Matheson Gas Products, J)liet, Ill.

APPENDIX B
APPARATUS
47
1. Function Generator. Model CHF-1, Elron Electronic
Industries, Ltd., Haifa, Israel.
2. Potentiostat.
a. Model CHP-1, Elron Electronic Industries,
Ltd., Haifa, Israel.
b. Anotrol 4100, Continentia! Oil Co., Ponca
City, Okla.
3. Oscilloscope. Type 564B Storage Oscilloscope,
Tektronix, Inc., Portland, Oregon.
4. Electrometer. Model 610B, Keithley Instruments,
Inc., Cleveland, Ohio.
5. Power Supply. Model 711A, Hewlett-Packard Co.,
Loveland, Col.
6. Milliammeter. Model 931, Weston Instrument
Division, Daystron, Inc., Newark, N.J.
7. X-Y Recorder. Model 135AM, Hewlett-Packard Co.,
Pasadena, California.

APPENDIX C
SAMPLE CALCULATIONS FOR FUMARIC ACID DISSOCIATION
48
The dissociation of fumaric acid was determined from
the following three equations:
(H+) (HF-) (H2F) = Kl = 9.3 X 10⁻⁴ (1) *
(H+) (F=) = K2 = 3.4 X 10⁻⁵
(HF') (2) *
( 3)
where,
c0 = total concentration of fumaric acid.
From Eqs. (1), (2), and (3),
For example, at pH + = 0. 3, (H ) = 0.5,
(HF-)/C0 = 0.002
* d K f 25°C No data for 60°C were available. K1 an 2 are or •

TABLE VI
DEGREE OF DISSOCIATION OF FUMARIC ACID*
pH CH FICO CHF-/Co CF=/Co 2
0.3 0.998 0.002 0.000
1.5 0.972 0.028 0.000
2.2 0.865 0.134 0.001
2.9 0.576 0.420 0.011
3.7 0.155 0.722 0.122
*Sample calculations are shown in Appendix C
CH F = concentration of undissociated fumaric acid. 2
49
CHF- = concentration of singly-dissociated fumaric acid.
CF= = concentration of doubly-dissociated fumaric acid.
c0 = total concentration of fumaric acid.

APPENDIX D
EXPERIMENTAL DATA
50

51
TABLE VII
CURRENT-POTENTIAL RELATIONSHIPS FOR THE CATHODIC
REDUCTION OF FUMARIC ACID ON Hg* AT 60°C IN 1 N H2so4 (pH = 0. 3)
Fumaric acid concentration
0.03 M 0.003 M 0.0003 M
Potential Current Potential Current Potential Current
v, SHE rna V,SHE ma V,SHE rna
0.589** 0.591** 0.579** -0.13 0.006 -0.13 0.007 -0.13 0.006 -0.23 0.008 -0.23 0.007 -0.23 0.006 -0.28 0.011 -0.33 0.008 -0.33 0.0065 -0.33 0.023 -0.38 0.014 -0.405 0.009
-0.355 0.043 -0.43 0.037 -0.455 0.013 -0.38 0.08 -0.455 0.056 -0.48 0.021 -0.405 0.16 -0.48 0.11 -0.505 0.036 -0.43 0.33 -0.505 0.23 -0.53 0.063 -0.455 0.62 -0.53 0.38 -0.555 0.11
-0.48 1.3 -0.58 1.0 -0.58 0.17 -0.505 2.6 -0.605 1.4 -o. 63 0.33 -0.53 4.8 -0.63 2.0 -o .68 0.51 -0.58 13 -0.68 3.2 -0.73 0.85 -0.63 23 -0.73 3.4 -0.78 1.15
-0.68 32 -0.78 3.4 -0.83 1.9 -0.78 42 -0.83 4.5 -0.88 4.1 -0.83 43 -0.88 53
* Area = 10 2 em
** Rest potential

52
TABLE VII. (Continued)
Fumaric acid concentration
0.01 M 0.001 M
Potential Current Potential Current
V,SHE rna V,SHE rna
0.582** 0.579**
-0.13 0.006 -0.13 0.005
-0.23 0.006 -0.23 0.005
-0.33 0.01 -0.33 0.0065
-0.38 0.019 -0.38 0.01
-0.405 0.033 -0.43 0.023
-0.43 0.06 -o. 455 0.044
-0.455 0.135 -0.48 0.073
-0.48 0.27 -0.505 0.15
-0.505 0.58 -0.53 0. 2 8
-0.53 1.05 -0.555 0.48
-0.555 2.1 -0.58 0.77
-0.58 3.6 -0.63 1.2
-0.63 8 -o. 68 1.6
-0.7 14 -0.73 1.8
-0.75 14 -o. 78 2
-0.81 17
-0.88 23
** Rest potential

TABLE VIII
CURRENT-POTENTIAL RELATIONSHIPS FOR THE CATHODIC
REDUCTION OF FUMARIC ACID ON Hg/l%Bi* AT
60°C IN 1 N H2so4 (pH = 0.3)
Fumaric Acid Concentration
0.03 M 0.003M 0.0003 M
53
Potential Current Potential Current Potential Current
V,SHE rna
0.205** -0.03 0.045 -0.18 0.046 -0.23 0.053 -0. 2"55 0.1
-0.28 0.16 -0.305 0.28 -0.33 0.53 -0.355 1.0 -0.38 1.9
-0.405 2.8 -0.43 4.9 -0.455 7.6 -0.48 11 -0.53 22
-0.58 30 -0.63 36 -0.73 42
* Area 10 2
= em
** Rest Potential
V,SHE
0.205** -0.13 -o. 2 3 -0.28 -0.33
-0.355 -0.38 -0.405 -0.43 -0.455
-0.48 -o. 53 -0.58 -0.63 -0.73
rna
0.056 0.06 0.075 0.135
0.21 0.33 0.53 0.78 1.15
1.6 2.55 3.3 3.6 4 .• 5
V,SHE rna
0.197** -0.13 0.042 .-0.23 0.042 -0.33 0.05 --o. 38 0.058
-0.405 0.09 -0.43 0.12 -0.455 0.16 -0.48 0.3 -o. 53 0.38
-0.58 0.51

TABLE IX
CURRENT-POTENTIAL RELATIONSHIPS FOR THE CATHODIC
REDUCTION OF FUMARIC ACID ON Bi* AT 60°C
IN 1 N H2so4 (pH = 0.3)
Fumaric Acid Concentration
0.03 M 0.01 M 0.003 M
Potential Current Potential Current Potential Current
V,SHE
0.215**
-0.03
-0.13
~o.l9
-0.21
-0.23
-0.255
-0.28
-0.305
-0.33
-0.36
-0.43
-0.48
-0.53
rna
0.12
0.12
o. 22
o. 26
0.5
0.95
2.2
4.9
9
15
21
23
23
-0.63 38
2 * Area = 3 em
** Rest Potential
V,SHE
0.225**
-0.03
-0.155
-0.205
-0.23
-0.255
-0.28
-0.305
-0.33
-0.355
-0.38
-0.43
-0.48
-0.58
rna
0.12
Q.l2
0\17
0.29
0.49
0.9
1.7
3.3
5
7
10
10
12
V ,SHE
0.23**
-0.03
-0.13
-0.205
-0.23
-0.255
-0.28
-0.305
-0.33
-0.355
-0.38
-0.405
-0.43
-0.53
rna
0.12
0.12
0.13
0.19
0.3
0.5
0.8
1.3
1.8
2.1
2.2
2.4
3.5
54

pH
TABLE X
CURRENT-POTENTIAL RELATIONSHIPS FOR THE CATHODIC
REDUCTION OF 0.03 M FUMARIC ACID ON Hg* AT
60°C
= 1.5 pH = 2.2 pH = 2.9 pH
55
= 3.7
Pot. Current Pot. Current Pot. Current Pot. Current
V,SHE rna V,SHE rna V,SHE rna V,SHE rna
0.58** 0.585** - 0.58** 0.598** --0.13 0.003 -0.13 0.006 -0.23 0.004 -0.43 0. 014 -0.23 0.004 -0.23 0.007 -0.33 0.0045 -0.53 0.022 -0.33 0.007 -0.405 0.008 -0.43 0.007 -0.58 0.033 -0.38 0.016 -0.43 0.013 -0.48 0.011 -0.605 0.055
-0.43 0.03 -0.455 0.018 -0.53 0.028 -0.63 0.1 -0.455 0.055 -0.48 0.034 ~o.555 0.066 -0.655 0.25 -0.48 0.16 -0.505 0.05 -0.58 0 .• 19 -0.68 0.46 -0.505 0.34 -0.53 0.11 -0.605 0.42 -0.705 1 -0.53 0.72 -0.555 o. 21 -0.63 0.8 -0.755 1.8
-0.555 1.4 -0.58 0.48 -0.655 1.55 -0.805 2.9 -0.58 3.2 -0.605 1 -0.68 2.9 -0.88 10 -0.605 5.5 -0.63 1.7 -0.73 8.2 -0.63 10 -0.655 3.3 -0.78 15
-0.68 22 -0.705 11 -0.83 20 -0.78 40 -0.755 23 -o. 88 25 -0.83 45 -0.83 39
* Area = 10 2 ern
** Rest Potential

TABLE XI
CURRENT-POTENTIAL RELATIONSHIPS FOR THE CATHODIC
REDUCTION OF 0.03 M FUMARIC ACID ON Hg/l%Bi*
AT 60°C
pH = 1.5 pH = 2.9
Potential Current Potential Current
V,SHE rna V,SHE rna
0.2** 0.2**
0.03 0.02 -0.23 0.04
-0.17 0.022 -0.33 0.05
-0.28 0.06 -0.405 0.1
-0.305 0.095 -0.43 0.2
-0.355 0.2 -0.455 0.35
-0.38 0.35 -0.48 0.5
-0.405 0.62 -o. 505 0.91
-0.43 1.1 -0.53 1.6
-·o. 455 1.9 -0.555 2.6
-0.48 3.1 -0.58 3.4
-0.505 7.7 -0.605 5.5
-0.555 13 -0.655 11
-0.58 17 -0.73 23
-0.63 23 -0.83 30
-0.73 33
* Area = 10 crn2
** Rest Potential
56

57
TABLE XII
CURRENT-POTENTIAL RELATIONSHIPS FOR THE CATHODIC REDUC
TION OF 0.03 M FUMARIC ACID ON Bi* AT 60°C
pH = 1.5 pH = 2.9
Potential Current Potential Current
V,SHE rna V,SHE rna
0.19** 0.16**
-0.03 0.15 -0.03 0.06
-0.13 0.15 -0.13 0.06
-0.23 0.15 -0.23 0.06
-0.28 0.21 -0.28 0.06
-0.305 0.305 -0.33 0.065
-0.33 0.54 -0.38 0.095
-0.355 0.8 -0.405 0.14
-0.38 1.55 -0.43 0.24
-0.405 3 -0.455 0.4
-0.43 4.8 -0.48 0.75
-0.455 8 -0.505 1.35
-0.48 9.5 -0.53 2.1
-0.53 15 -0.555 3.5
-0.63 21 -0.58 5.4
-0.63 10
-0.68 14
* Area = 3 crn2
** Rest Potential

TABLE XIII
CURRENT-POTENTIAL RELATIONSHIPS FOR HYDROGEN EVOLUTION
ON Hg AND Bi* AT 60°C IN 1 N H2so4 (pH= 0.3)
Hg
Potential Current
V,SHE rna
0.594** -0.13 0.006 -0.23 0.006 -0.33 0.009 -0.355 0.01
-0.405 0.011 -0.43 0.013 -0.455 0.015 -0.48 0.019 -0.505 0.025
-0.53 0.03 -0.555 0.045 -0.58 0.06 -0.605 0.09 -0.63 0.1
-0.68 0.21 -0.73 0.38 -0.78 0.7 -0.83 1.9 -0.88 4
Bi
Potential
V ,SHE
0.215** -0.03 -0.13 -0.205 -0.28
-0.33 -0.38 -0.43 -0.48 -0.53
-0.58 -0.63 -0.68 -0.73 -o. 78
Current
rna
0.11 0.11 0.115 0.115
0.12 0.13 0.165 0.25 0.46
1.3 3.2 7
28 60
* Area = 10 cm2 for Hg and Hg/l%Bi, 3 cm2 for Bi
** Rest Potential
58

TABLE XIV
CURRENT-TEMPERATURE RELATIONSHIPS FOR THE CATHODIC
REDUCTION OF 0.03 M FUMARIC ACID ON Hg*IN
1 N H2so4 (pH = 0.3)
Potential Temperature Current
V,SHE oc rna
-0.355 75 0.037 70 0.033 65 0.026 60 0.024 55 0.021 50 0.018
-0.405 75 0.162 70 0.155 65 0.14 60 0.118 55 0.105 50 0.09
-0.475 75 1.3 70 1.2 65 1.05 60 0.96 55 0.89 50 0.75
* Area = 10 cm2
59

TABLE XV
CURRENT-TEMPERATURE RELATIONSHIPS FOR THE CATHODIC
REDUCTION OF 0.03 M FUMARIC ACID ON Hg/1%Bi*
IN 1 N H2so4 {pH = 0.3)
Potential Temperature Current
V,SHE oc rna
-0.305 70 0.28
65 0.25
60 0.2 55 0.15
50 0.12
-0.355 70 1.1
65 0.89
60 0.8
55 0.6
so 0.51
-0.405 70 4.2
65 3.4
60 3.1
55 2.8
so 2.3
* Area = 10 cm2
60

TABLE XVI
CURRENT-TEMPERATURE RELATIONSHIPS FOR THE CATHODIC
REDUCTION OF 0.03 M FUMARIC ACID ON Bi* IN
1 N H2so4 (pH = 0.3)
Potential Temperature Current
V,SHE oc ma
-0.255 70 0.495
65 0.455
60 0.39
55 o. 345
50 0.29
-0.305 70 1.7
65 1.55
60 1.4
55 1.3
50 1.2
-0.355 70 6.5
65 5.75
60 5.5
55 5.15
50 4.8
* Area = 3 cm2
61

TABLE XVII
PEAK CURRENT-PEAK POTENTIAL RELATIONSHIPS FROM CATHODIC
SWEEPS FOR FUMARIC ACID ON Hg* AT 60°C IN 1 N H2so4 {pH = 0. 3)
Fumaric Acid Concentration
Sweep 0.001 M 0.003 M Rate
Peak Peak Peak Peak Potential Current Potential Current
mV/sec V,SHE rna V,SHE rna
10 -0.515 2.35 -0.52 6.5 20 -0.528 3.0 -0.537 8.38 30 -0.535 3.55 -0.543 10.13 40 -0.54 4.0 -0.552 11.73 50 -0.549 4.55 -0.56 12.75
60 -0.554 4.9 -0.564 13.75 80 -0.56 5.5 -0.571 15.75
100 -0.565 6.3 -0.578 17.3 150 -0.575 7.35 200 -0.58 8.38
0.01 M 0.03 M
10 -0.555 22.5 -0.555 63 20 -0.565 28.75 -0.575 81.5 30 -0.575 34 -0.59 94.5 40 -0.582 38.75 -0.602 107 50 -0.592 43 -0.608 120
60 -0.60 47 -0.616 128 ,so -0.606 53.75 -0.622 146 100 -0.617 58 -0.637 160 150 -0.63 70 200 -0.642 81.5
* 10 2 Area = em
62

*
63
TABLE XVIII
PEAK CURRENT-PEAK POTENTIAL RELATIONSHIPS FROM CATHODIC
SWEEPS FOR FUMARIC ACID ON Hg/l%Bi* AT 60°C IN
1 N H2so 4 (pH= 0.3)
Fumaric Acid Concentration
Sweep 0.003 M 0.01 M Rate
Peak Peak Peak Peak Potential Current Potential Current
V/sec V/SHE rna V/SHE rna
20 -0.589 6.6 -0.613 27
30 -0.599 8.1 -0.625 32
40 -0.605 9.4 -0.633 36
50 -0.612 10.5 -0.64 39
60 -0.618 11.6 -0.648 42.5
80 -0.624 13.3 -0.657 48.5
100 -0.631 14.6 -o. 6-61 53
150 -0.644 17.6 -0.673 63
200 -0.649 20 -0.683 72
10 2 Area = em

64
TABLE XIX
PEAK CURRENT-PEAK POTENTIAL RELATIONSHIPS FROM CATHODIC
SWEEPS FOR FUMARIC ACID ON Bi* AT 60°C IN 1 N H2so4 (pH = 0. 3)
Sweep Rate
rnV/sec
20
30
40
50
60
80
100
150
200
0.003
Peak Potential
V,SHE
-0.37
-0.38
-0.388
-0.395
-0.4
-0.415
-0.42
-0.43
-0.442
* Area = 3 crn2
M
Peak· Current
rna
6.3
7. 6
8.7
9.6
10.4
11.8
13
15.6
17
Fumaric Acid Concentration
0.01 M 0.03 M
Peak Peak Peak Peak Potential Current Potential Current
V,SHE rna V,SHE rna
-0. 39 3 17 -0.422 64
-0.405 20.5 -0.456 77
-0.412 23 -0.47 87
-0.418 26.5 -0.48 97
-0.425 29 -0.49 104
-0.43 33 -0.505 119
-0.438 37 -0.51 130
-0.452 44 -0.523 154
-0.462 ' 50.5 -0.545 172

Sweep Rate
V/sec
15
20
30
40
50
70
100
150
TABLE XX
SURFACE CHARGE-SWEEP RATE RELATIONSHIPS FROM
CATHODIC SWEEPS FOR 0.0003 M FUMARIC ACID
AT 60°C IN 1 N H2so4 (pH = 0.3)
Hg*
Surface Charge
].lC
13.5
11.7
9.3
7.6
6.9
6.4
5.1
3.5
Sweep Rate
V/sec
20
30
40
50
70
100
150
Hg/1%Bi*
Surface Charge
].lC
10
8.13
6.68
5.6
5.55
4.35
3.7
Sweep Rate
V/sec
70
100
150
200
250
300
400
500
Bi**
Surface Charge
].lC
13.5
10.2
7.92
6.67
6.25
5.4
4.4
2.1
* Area = 0. 4 2 em
** Area 2 = 0.48 em
65

TABLE XXI
SURFACE-CHARGE-POTENTIAL RELATIONSHIPS FROM 50 V/SEC
CATHODIC SWEEPS ON Hg* AT 60°C IN 1 N H2so4 (pH = 0. 3)
Fumaric Acid Concentration
Potential 0.0001 M 0.0003 M 0.0005
Surface Surface Surface Charge Charge Charge
V,SHE lJC/cm 2 lJC/cm2 lJC/cm 2
-0.13 2.2 6.8 10.77
-0.23 2.2 6.8 10.77
-0.33 2.1 6.5 9.94
-0.38 1.25 5.0 8.67
-0.43 0.6 2.0 5.67
-0.48 1.5
-0.53 0.06 0.3 0.68
* Area = 0.4 2 em
66
M

TABLE XXII
SURFACE CHARGE-POTENTIAL RELATIONSHIPS FROM 50 V/SEC
CATHODIC SWEEPS ON Hg/l%Bi* AT 60°C IN 1 N H2so4 {pH = 0. 3)
Potential
V,SHE
-0.13
-0.23
-0.33
-0.38
-0.43
-0.48
-0.53
* Area= 0.4
0.0001
Surface Cha~ge
].lc/crn 2
2.3
2.3
2.3
1.39
0.78
0.18
2 ern
Fumaric Acid Concentration
M 0.0003 M 0.0005 M
Surface Surface Charge Charge
J.lC/ ern 2 ].lc/crn2
7.5 12.6
7.5 12.6
6.7 11.27
3.84 6.6
1.47 2.06
0.75
0.56 0.57
67

TABLE XXIII
SURFACE CHARGE-POTENTIAL RELATIONSHIPS FROM 200 V/SEC
CATHODIC SWEEPS ON Bi~ AT.60°C IN.lNHz;o,4 . (pH = 0. 3)
Fumaric Acid Concentration
Potential 0.0001 M 0.0003 M 0.0005
Surface Surface Surface Charge Charge Charge
V ,SHE ]Jc/cm 2 ]Jc/cm 2 J.1C/cm2
-0.03 2.3 6.65 12.5
-0.13 2.3 6.65 12.0
-0.23 1.7 5.6 10.0
-0.28 1.0 4.1 4.7
-0.33 0.8 1.5 2.3
-0.38 1.0
-0.43 0.1 0.4 0.6
*Area 0.48 2 = em
68
M

69
APPENDIX E
A MICRO-DETERMINATION OF SUCCINIC ACID
1. Extraction. A portion of the electrolyte containing
about 40 mg of succinic acid was acidified with cone.
sulfuric acid to Congo Red. It was heated on a water
bath and treated with 0.1 N KMn0 4 until a brown pre
cipitate was obtained. The precipitate dissolved by
addition of Na2so3 and the solution evaporated to
10 ml. The whole residue was transferred quantita
tively to an extractor* and saturated with K2so4 •
After extracting 24 hours with ether, the later; was
transferred to a flask and 30 ml of distilled water
added. The ether was removed by heating.
2. Titration. The pH of the solution was adjusted to
6.5 - 7.0 with 0.05 N KOH and a measured excess of
0.1 N AgNo3 added immediately. The resulting pre
cipitate was kept for 2 hours in the dark. The
solution was filtered through a fritted glass filter
and washed quantitatively from the flask on to the
filter by three successive portions of 1% NH 4No3
(3 ml, 3 ml, and 2 ml). To this was added 30 ml of
1 N HN03 and about 7-9 drops of 10% Fe(N03 ) 3 as an
indicator to the filtrate and then titrated with
0.1 N NH4SCN until a faint brown color appeared.
*No. 92225, corning catalog "Pyrex Laboratory Glassware", Corning Glass Works, Borning, N.Y.

3. Sample Calculation. The method of calculating the
efficiencies was the same for all solutions. The
70
data from Table XXIV have been used in the following
illustration.
The theoretical amount of succinic acid was
calculated using Faraday's Law:
= ItA/nF
= (1.5xl0- 3 ) (65.5) (3600) (118) (1000) (2) (96500)
= 216 mg
The experimental amount of succinic acid was
determined using a 50 ml sample (total 300 ml) which
had been electrolyzed for 65.5 hours with a current of
1.5 rna. The excess AgNo3 amounted to 9.2 ml of
NH4scN to precipitate the silver succinate was 5.8 ml.
Since one ml of 0.1 N AgN03 is equivalent. to 5.9 mg of
succinic acid, the amount of succinic acid in the 50 ml
sample was 34.22 mg and the total succinic acid in the
300 ml solution was 205.32 mg.
Therefore,
Eff = 205.32/216 = 95%

TABLE XXIV
DATA FOR THE COULOMBIC EFFICIENCY STUDIES OF THE
CATHODIC REDUCTION OF FUMARIC ACID TO SUCCINIC
ACID
Electrode
Hg
II
Hg/1% Bi
II
Bi
II
pH v v
ml ml
0.3 300 50
2.9 250 100
0.3 250 60
2.9 250 50
0.3 300 60
2.9 400 30
AgN03 added
0.1
15
15
15
15
15
15
N
V = Total volume of electrolyte
NH 4SCN
used
0.1 N
9.2
7.8
6.1
8.8
5.0
10.2
Succinic acid
mg
205
106
219
183
295
377
v = Volume of electrolyte used for analysis
71

72
VITA
Chen Hwei Chi was born on October 3, 1941 in Kiang-su,
China. He graduated from high school in 1959. He entered
Chung Yuan College of Science and Engineering and graduated
with a B.S. degree in Chemical Engineering in June, 1963.
After graduation, he served in the Chinese Army for a
period of one year and was assigned as a second lieutenant.
He came to the United States and enrolled in the
Graduate School of the University of Missouri-Rolla in
September 1967. He received the Master of Science degree
in Chemical Engineering in May 1969. He continued work
toward the degree of Doctor of Philosophy in Chemical
Engineering. He received a research scholarship from 1968
to 1971 from the Graduate Center for Materials Research.