the efficiency of chinese local banks: a comparison of dea ... · the efficiency of chinese local...
TRANSCRIPT

The efficiency of Chinese local banks: a comparison of DEA and SFA
Benjamin Miranda Tabak, Daniel Oliveira Cajueiro e Marina V. B. Dias
January, 2014
346

ISSN 1518-3548 CGC 00.038.166/0001-05
Working Paper Series Brasília n. 346 January 2014 p. 1-15

Working Paper Series Edited by Research Department (Depep) – E-mail: [email protected] Editor: Benjamin Miranda Tabak – E-mail: [email protected] Editorial Assistant: Jane Sofia Moita – E-mail: [email protected] Head of Research Department: Eduardo José Araújo Lima – E-mail: [email protected] The Banco Central do Brasil Working Papers are all evaluated in double blind referee process. Reproduction is permitted only if source is stated as follows: Working Paper n. 346. Authorized by Carlos Hamilton Vasconcelos Araújo, Deputy Governor for Economic Policy. General Control of Publications Banco Central do Brasil
Comun/Dipiv/Coivi
SBS – Quadra 3 – Bloco B – Edifício-Sede – 14º andar
Caixa Postal 8.670
70074-900 Brasília – DF – Brazil
Phones: +55 (61) 3414-3710 and 3414-3565
Fax: +55 (61) 3414-1898
E-mail: [email protected]
The views expressed in this work are those of the authors and do not necessarily reflect those of the Banco Central or its members. Although these Working Papers often represent preliminary work, citation of source is required when used or reproduced. As opiniões expressas neste trabalho são exclusivamente do(s) autor(es) e não refletem, necessariamente, a visão do Banco Central do Brasil. Ainda que este artigo represente trabalho preliminar, é requerida a citação da fonte, mesmo quando reproduzido parcialmente. Citizen Service Division Banco Central do Brasil
Deati/Diate
SBS – Quadra 3 – Bloco B – Edifício-Sede – 2º subsolo
70074-900 Brasília – DF – Brazil
Toll Free: 0800 9792345
Fax: +55 (61) 3414-2553
Internet: <http//www.bcb.gov.br/?CONTACTUS>

The efficiency of Chinese local banks: a comparison ofDEA and SFA
Benjamin Miranda Tabak∗ Daniel Oliveira Cajueiro† Marina V. B. Dias‡
The Working Papers should not be reported as representing the views of BancoCentral do Brasil. The views expressed in the papers are those of the author(s) anddo not necessarily reect those of Banco Central do Brasil.
Abstract
This study investigates to which extent results produced by a single frontiermodel are reliable, based on the application of data envelopment analysis andstochastic frontier approach to a sample of Chinese local banks. Our findings showthey do produce a consistent trend on efficiency scores over the years. However,rank correlations indicate they diverge with respect to individual performance di-agnosis. This shows that these models provide steady information on the efficiencyof the banking system as a whole, but they become inconsistent at individual level.
Keywords: Bank efficiency; Stochastic frontier approach; Data envelopment analysis.
JEL Classification Numbers: G21, G28.
∗Universidade Catlica de Brasilia; Departamento de Estudos e Pesquisas, Banco Cen-tral do Brasil†Departamento de Economia, Universidade de Braslia‡Universidade de Braslia
3
1 Introduction
This paper applies both data envelopment analysis (DEA) and stochastic frontierapproach (SFA) to investigate the efficiency of Chinese local banks. We analyze somefeatures related to the efficiency scores of both approaches. We determine whether themethodology applied is relevant to the determination of best and worst performers andto the conclusions drawn regarding the whole market. These methods are not consistentin the determination of individual performance. Nevertheless, they do produce a similartrend on efficiency over the years.
Efficiency of financial institutions can be measured by parametric or non-parametricmodels. Both approaches have their features, but few studies apply both types of method-ologies to the same sample to investigate the consistency between their results. Some ofthese studies consider the conditions Bauer et al. (1998) propose to investigate this issue(Fiorentino et al., 2006). There are mixed results regarding the similarity of these models.Some authors find that the consistency between DEA and SFA in ranking banks accord-ing to their performance is low or even statistically insignificant (Fiorentino et al., 2006;Ferrier and Lovell, 1990). On the other hand, comparison of their results at industrylevel can point out the similarities between them (Resti, 1997).
There are two main points we make that differ from previous literature on the com-parison of DEA and SFA. First, we do not rule the methodologies as either consistent orinconsistent. We analyze at which level their results are more reliable, produce similarinformation, and to which extent they must be considered with care. Second, we arguethat the comparison of the behavior of efficiency along the sample period is much morerelevant to determine the consistency between both models than the average levels ofefficiency.
Parametric and non-parametric methodologies are extensively applied to measure theefficiency of financial institutions. In many cases, the purpose of the existing studiesis to assist policy makers with relevant information, such as the impact of regulationmeasures over the performance of these firms (Lee and Chih, 2013; Barth et al., 2013;Gaganis and Pasiouras, 2013). However, it is common to apply only one frontier model,either parametric or non-parametric, to measure efficiency. Investigating if these modelsare consistent has the purpose of pointing out to which extent results and conclusionsobtained from the application of only one frontier method are reliable, especially to assistpolicy decisions.
Studies of bank efficiency in China are mostly related to the effects of deregulation re-forms over the performance of financial institutions (Berger et al., 2009; Sun et al., 2013).Some of them, as Yin et al. (2013), conclude that these reforms led to an improvement onbank efficiency. Our study finds stable efficiency scores over the period 2001-2012, whichis not in line with the idea that deregulation reforms still have a positive impact on theefficiency of Chinese financial institutions.
4

2 Methodology and Data
Bank efficiency can be measured through basically two different types of models: para-metric or non-parametric. The most applied parametric model is the stochastic frontierapproach and the most applied non-parametric model is data envelopment analysis. Inthis paper, we apply data envelopment analysis and stochastic frontier approach to mea-sure the efficiency of Chinese commercial banks. The advantages of using DEA is that itdoes not require prior knowledge of either the distributional form of the inefficiency termor the production technology used in the industry. The main feature of the SFA is thatit accounts for random shocks (Berger and Humphrey, 1997; Seiford and Thrall, 1990;Mester, 1996).
2.1 Data Envelopment Analysis
Data envelopment analysis was first proposed by Charnes et al. (1978) and was devel-oped based on the seminal work of Farrell (1957). It uses linear programming techniquesto build a non-parametric efficiency frontier of the data sample. Therefore, the frontieris constructed by the practices (combination of inputs and outputs) of the most efficientfirms in the sample. The linear programming problem consists of the maximization ofthe firm’s weighted output-input ratio. In this study, we apply DEA to measure input-oriented, output-oriented, economic and allocative efficiencies. We estimate the variablereturns to scale model, proposed by Banker et al. (1984). The input-oriented modelconsists of the following linear programming problem:
minφ,z
φ
s.a −qi +Qλj ≥ 0
φxi −Xλj ≥ 0∑ni=1 λi
λi ≥ 0 (1)
in which φ is technical inefficiency, qi are the outputs for firm i, Q and X are matrices ofoutputs and inputs for all firms, respectively, xi is the vector of inputs for the i-th firmand λi is a vector of weights.
Allocative efficiency measures the quality of the combination of inputs to producecertain outputs considering input prices (Sengupta, 1999). Economic efficiency analyzesboth technical and allocative efficiencies (Bauer et al., 1998). They can be measured by acost minimization problem that determines the optimal levels of inputs to be used given
5
their prices (wi):
minwi,χ
w′iχi
s.a∑
j λjyj − yi ≥ 0
χi −∑λjxj ≥ 0
λj ≥ 0 (2)∑i λi = 1 (3)
Economic efficiency (EE) will be determined by the following ratio:
EEi =wiχiw′ixi
(4)
Allocative efficiency will be measured by the ratio cost efficiency over input-orientedtechnical efficiency TEinputs:
AEi =EEi
TEinputs,i(5)
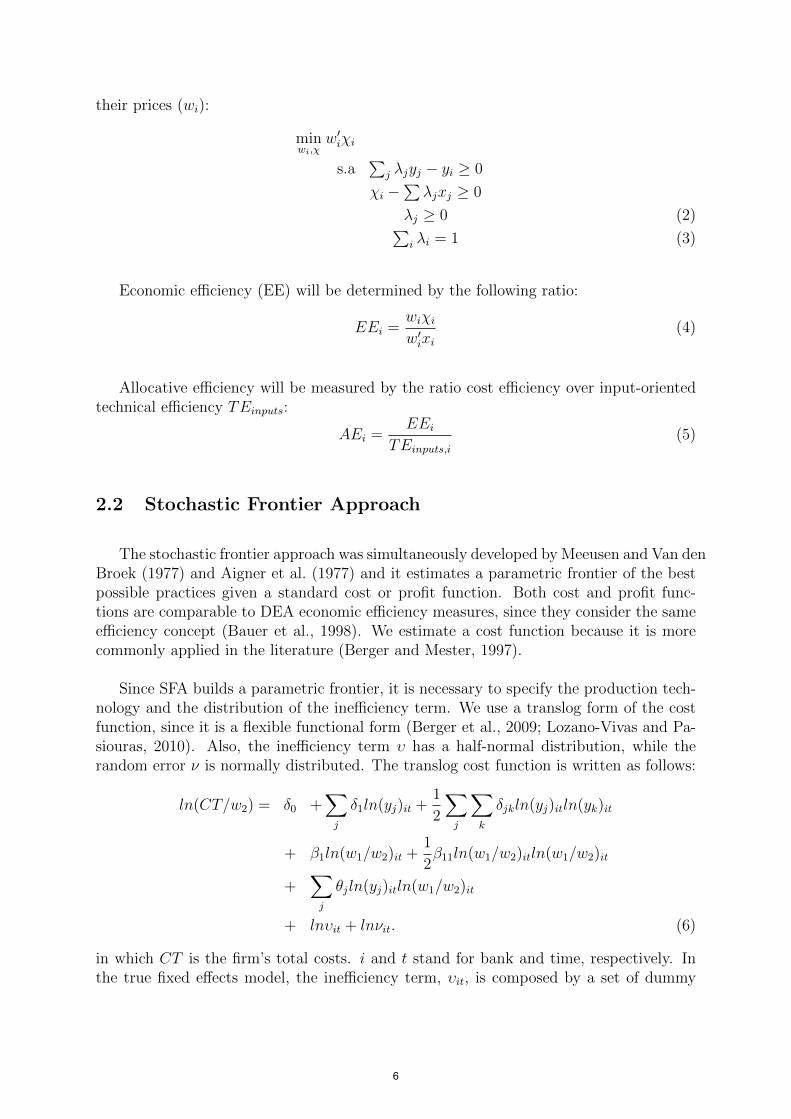
2.2 Stochastic Frontier Approach
The stochastic frontier approach was simultaneously developed by Meeusen and Van denBroek (1977) and Aigner et al. (1977) and it estimates a parametric frontier of the bestpossible practices given a standard cost or profit function. Both cost and profit func-tions are comparable to DEA economic efficiency measures, since they consider the sameefficiency concept (Bauer et al., 1998). We estimate a cost function because it is morecommonly applied in the literature (Berger and Mester, 1997).
Since SFA builds a parametric frontier, it is necessary to specify the production tech-nology and the distribution of the inefficiency term. We use a translog form of the costfunction, since it is a flexible functional form (Berger et al., 2009; Lozano-Vivas and Pa-siouras, 2010). Also, the inefficiency term υ has a half-normal distribution, while therandom error ν is normally distributed. The translog cost function is written as follows:
ln(CT/w2) = δ0 +∑j
δ1ln(yj)it +1
2
∑j
∑k
δjkln(yj)itln(yk)it
+ β1ln(w1/w2)it +1
2β11ln(w1/w2)itln(w1/w2)it
+∑j
θjln(yj)itln(w1/w2)it
+ lnυit + lnνit. (6)
in which CT is the firm’s total costs. i and t stand for bank and time, respectively. Inthe true fixed effects model, the inefficiency term, υit, is composed by a set of dummy
6

variables, which determine its behavior across time. This study considers three outputsand two inputs. Thus, w1 and w2 are the two inputs used to produce the four outputs,yj. The normalization by the price of the last input (w2) guarantees price homogeneity.
In this study, we apply two different specifications of the stochastic frontier model,the true fixed effects model from Greene (2005) and the model proposed by Battese andCoelli (1995). The true fixed effects model fits the sample better, so we refer to thismodel when considering the parametric efficiency results1. We obtain efficiency scoresfrom the Jondrow et al. (1982) estimator.
2.3 Data
Our sample comprises an unbalanced panel with 461 yearly observations from 65Chinese local commercial banks for the period 2001-2012. The data source is Bankscope.Our definition of local banks includes city commercial banks and rural commercial banks(Berger et al., 2009). To analyze the efficiency trend over the years, we create sub-samplesfor each year and apply the DEA model for all of them. For the stochastic frontier model,we use the specification of panel data.
This paper uses the intermediation approach to define inputs and outputs for theempirical application, which states that banks capture borrowed funds and use capitaland labor to turn them into loans and other assets (Sealey and Lindley, 1977). Therefore,we specify the outputs as deposits, loans and liquid assets. The input quantities aretotal interest expenses and total non-interest expenses. Input prices are the ratios totalinterest expenses over deposits and non-interest expenses over fixed assets. Table 1 showsdescriptive statistics on these variables.
[Table 1 about here.]
3 Empirical Results
Results regarding the individual performance of firms should be looked into with care,while general results, related to the performance of the whole market, are consistent. Bothdata envelopment analysis and stochastic frontier approach results show that efficiencyscores are roughly stable over the years, which we report on Figure 1.
This finding does not confirm the upward trend Yin et al. (2013) observe for bankefficiency in China after 2001. From the results we report on tables 2 and 3, our scores
1The log-likelihood for the true fixed effects model is 249.051, while for the Battese and Coelli (1995)model it is -6179.308.
7

do seem to vary over the years at first sight. DEA scores seem to show a drawbackin the period 2001-2007, with posterior efficiency gains. SFA scores seem to indicatea slight improvement on efficiency over the sample period. However, a closer look intomean efficiency scores and their volatility, which we report on Figure 1, leads to theconclusion that the performance of Chinese local banks does not show a statisticallysignificant change over the years. A possible reason for divergent results is that oursample comprises only Chinese local banks (which includes only city commercial banksand rural commercial banks), while Yin et al. (2013) use a sample with different types ofChinese commercial banks.
[Table 2 about here.]
[Table 3 about here.]
From Figure 1 we observe that efficiency levels are in some periods higher according toresults from the parametric methodology. Nevertheless, we point out that this differenceis not relevant if both models provide the same conclusion over the banking system’sperformance. Efficiency levels themselves are not enough to rule for the (in)consistencybetween different methodologies. In this case, both models indicate that Chinese localbanks have not experienced efficiency improvements over the period 2001-2012. Thisshows that, for this empirical study, DEA and SFA do provide similar conclusions withrespect to the performance of the industry of Chinese local banks as a whole
[Figure 1 about here.]
To analyze the consistency between individual efficiency scores produced by the twomethodologies, we compute Spearman’s rank correlation between DEA economic effi-ciency and SFA cost efficiency, since they use the same efficiency concept (Bauer et al.,1998). We find a rank correlation of 2.6%, which is not statistically significant at 1%level and is consistent with the findings of Ferrier and Lovell (1990), who compute thecorrelation of 1.4% 2. Fiorentino et al. (2006) also find a positive but low correlationbetween data envelopment analysis and the stochastic frontier approach (between 44%and 58%).
One possible explanation for the difference between both models is that DEA is moresensitive to sample heterogeneity than the SFA (Fiorentino et al., 2006). To check if thisargument is plausible, we run a robustness check in which we use the DEA results ofefficiency to remove efficient banks from the original sample (Sample A), leaving us witha sample of banks that are originally economically inefficient (Sample B) and a sample ofbanks that are originally technically inefficient (Sample C). We find that efficiency scores
2We compute the spearman rank correlation between scores relative to the year 2009, which is theyear which comprises the greater number of observations
8

do not differ among these samples and, thus, heterogeneity is not the reason why DEAand SFA do not produce similar results. These results are available from the authorsupon request. We do not repeat the same to the SFA estimation because we use theresults of the true fixed effects model, which already accounts for heterogeneity (Greene,2005).
It should be expected that DEA and SFA might produce contradictory results insome empirical applications. Berger and Humphrey (1997) point out the conflict be-tween parametric and non-parametric methodologies, based on the fact that they havedifferent degrees of dispersion and rank banks differently. This latter conflict is exactlythe inconsistency we report here. From a theoretical perspective, DEA and SFA arevery different. Data envelopment analysis considers a deterministic frontier, while thestochastic frontier model considers a parametric one, which incorporates states of nature.For this reason, Bauer et al. (1998) propose some consistency conditions these modelsshould meet in order to be sure they are providing policy makers with reliable infor-mation. The fact that DEA does not account for random shocks may be the source ofthe inconsistency between both models (Fiorentino et al., 2006). The implication of thisinconsistency in the framework analyzed here is that individual performance should beanalyzed with caution. The application of only one methodology to determine best andworst performers may lead to wrong conclusions, especially when rank correlation amongdifferent models are not statistically significant.
4 Conclusions
We apply both data envelopment analysis and the stochastic frontier model to asample of Chinese local banks. We analyze the consistency between these measures frommicro and macro perspectives. The majority of studies on Chinese bank efficiency applyeither a parametric or a non-parametric methodology to investigate the performanceof the country’s financial institutions. Our findings show that these models are notconsistent in the individual analysis of efficiency and results obtained at a micro levelshould be dealt with care. However, they do provide similar results regarding the behaviorof average efficiency scores for the whole market over the years. We argue that thisbehavior is more important to determine the consistency between both models than theaverage efficiency levels themselves. We also conclude that Chinese local banks do notshow improvement on performance over the period 2001-2012.
References
Aigner, D., Lovell, C., and Schmidt, P. (1977). Formulation and estimation of stochasticfrontier production function models. Journal of Econometrics, 6:21–37.
9
Banker, R., Charnes, A., and Cooper, W. (1984). Some models for estimating technicalscale inefficiencies in data envelopment analysis. Management Science, 30:1078–1092.
Barth, J. R., Lin, C., Ma, Y., Seade, J., and Song, F. M. (2013). Do bank regulation,supervision and monitoring enhance or impede bank efficiency? Journal of BankingFinance, 37(8):2879 – 2892.
Battese, G. and Coelli, T. (1995). A model for technical inefficiency effects in a stochasticfrontier production for panel data. Empirical Economics, 20:325–332.
Bauer, P. W., Berger, A. N., Ferrier, G. D., and Humphrey, D. B. (1998). Consistencyconditions for regulatory analysis of financial institutions: A comparison of frontierefficiency methods. Journal of Economics and Business, 50:85–114.
Berger, A., Hasan, I., and Zhou, M. (2009). Bank ownership and efficiency in china: Whatwill happen in the world’s largest nation? Journal of Banking & Finance, 33:113–130.
Berger, A. and Mester, L. (1997). Inside the black box: what explains differences in theefficiencies of financial institutions? Journal of Banking & Finance, 21:895–947.
Berger, A. N. and Humphrey, D. B. (1997). Efficiency of financial institutions: Inter-national survey and directions for future research. European Journal of OperationalResearch, 98:175–212.
Charnes, A., Cooper, W., and Rhodes, E. (1978). Measuring the efficiency of decision-making units. European Journal of Operational Research, 3:429–444.
Farrell, M. (1957). The measurement of productive efficiency. Journal of the RoyalStatistical Society, 120A:253–281.
Ferrier, G. and Lovell, C. (1990). Measuring cost efficiency in banking: Econometric andlinear programming evidence. Journal of Econometrics, 46:229–245.
Fiorentino, E., Karmann, A., and Koetter, M. (2006). The cost efficiency of germanbanks: a comparison of sfa and dea. Discussion Paper 10/2006, Deutsche Bundesbank.
Gaganis, C. and Pasiouras, F. (2013). Financial supervision regimes and bank efciency:International evidence. Journal of Banking & Finance, 37:5463–5475.
Greene, W. (2005). Reconsidering heterogeneity in panel data estimators of the stochasticfrontier model. Journal of Econometrics, 26:269–303.
Jondrow, J., C.A.K., L., I.S., M., and Schmidt, P. (1982). On the estimation of technicalinefficiency in the stochastic frontier production function model. Journal of Economet-rics, 19:233–238.
Lee, T.-H. and Chih, S.-H. (2013). Does financial regulation affect the profit efficiencyand risk of banks? evidence from china’s commercial banks. The North AmericanJournal of Economics and Finance, 26:705 – 724.
10

Lozano-Vivas, A. and Pasiouras, F. (2010). The impact of non-traditional activities on theestimation of bank efficiency: International evidence. Journal of Banking & Finance,34:1436–1449.
Meeusen, W. and Van den Broek, K. (1977). Efficiency estimation from cobb-douglasproduction functions with composed error. International Economic Review, 18:435–444.
Mester, L. (1996). A study of bank efficiency taking into account risk-preferences. Journalof Banking & Finance, 20:1025–1045.
Resti, A. (1997). Evaluating the cost-efficiency of the italian banking system: What canbe learned from the joint application of parametric and non-parametric techniques.Journal of Banking & Finance, 21:221–250.
Sealey, C. and Lindley, J. (1977). Inputs, outputs and a theory of production and costof depository financial institutions. Journal of Finance, 32:1251–1266.
Seiford, L. and Thrall, R. (1990). Recent developments in dea: The mathematical pro-gramming approach to frontier analysis. Journal of Econometrics, 46:7–38.
Sengupta, J. K. (1999). A dynamic efficiency model using data envelopment analysis.International Journal of Production Economics, 62:209–218.
Sun, J., Harimaya, K., and Yamori, N. (2013). Regional economic development, strate-gic investors, and efficiency of chinese city commercial banks. Journal of Banking &Finance, 37:1602–1611.
Yin, H., Yang, J., and Mehran, J. (2013). An empirical study of bank efficiency in chinaafter WTO accession. Global Finance Journal.
11

Figure 1: Comparison of efficiency levels from DEA and SFA over the years
12
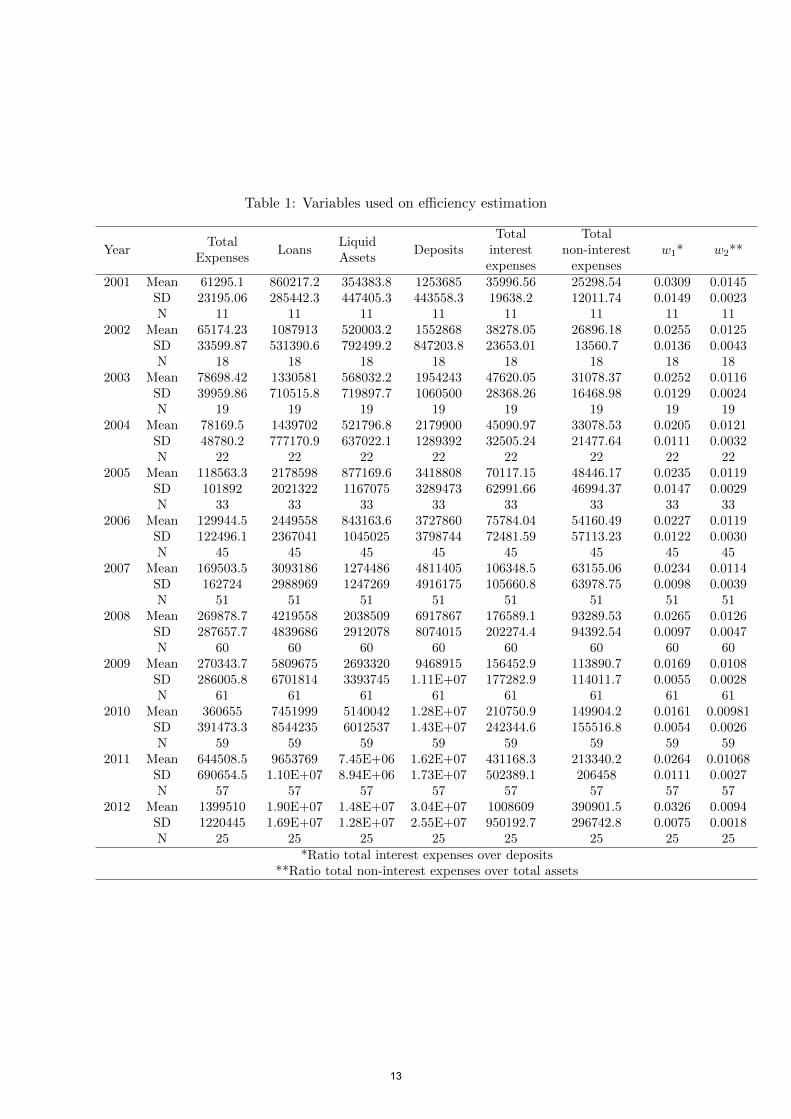
Table 1: Variables used on efficiency estimation
YearTotal
ExpensesLoans
LiquidAssets
DepositsTotal
interestexpenses
Totalnon-interest
expensesw1* w2**
2001 Mean 61295.1 860217.2 354383.8 1253685 35996.56 25298.54 0.0309 0.0145SD 23195.06 285442.3 447405.3 443558.3 19638.2 12011.74 0.0149 0.0023N 11 11 11 11 11 11 11 11
2002 Mean 65174.23 1087913 520003.2 1552868 38278.05 26896.18 0.0255 0.0125SD 33599.87 531390.6 792499.2 847203.8 23653.01 13560.7 0.0136 0.0043N 18 18 18 18 18 18 18 18
2003 Mean 78698.42 1330581 568032.2 1954243 47620.05 31078.37 0.0252 0.0116SD 39959.86 710515.8 719897.7 1060500 28368.26 16468.98 0.0129 0.0024N 19 19 19 19 19 19 19 19
2004 Mean 78169.5 1439702 521796.8 2179900 45090.97 33078.53 0.0205 0.0121SD 48780.2 777170.9 637022.1 1289392 32505.24 21477.64 0.0111 0.0032N 22 22 22 22 22 22 22 22
2005 Mean 118563.3 2178598 877169.6 3418808 70117.15 48446.17 0.0235 0.0119SD 101892 2021322 1167075 3289473 62991.66 46994.37 0.0147 0.0029N 33 33 33 33 33 33 33 33
2006 Mean 129944.5 2449558 843163.6 3727860 75784.04 54160.49 0.0227 0.0119SD 122496.1 2367041 1045025 3798744 72481.59 57113.23 0.0122 0.0030N 45 45 45 45 45 45 45 45
2007 Mean 169503.5 3093186 1274486 4811405 106348.5 63155.06 0.0234 0.0114SD 162724 2988969 1247269 4916175 105660.8 63978.75 0.0098 0.0039N 51 51 51 51 51 51 51 51
2008 Mean 269878.7 4219558 2038509 6917867 176589.1 93289.53 0.0265 0.0126SD 287657.7 4839686 2912078 8074015 202274.4 94392.54 0.0097 0.0047N 60 60 60 60 60 60 60 60
2009 Mean 270343.7 5809675 2693320 9468915 156452.9 113890.7 0.0169 0.0108SD 286005.8 6701814 3393745 1.11E+07 177282.9 114011.7 0.0055 0.0028N 61 61 61 61 61 61 61 61
2010 Mean 360655 7451999 5140042 1.28E+07 210750.9 149904.2 0.0161 0.00981SD 391473.3 8544235 6012537 1.43E+07 242344.6 155516.8 0.0054 0.0026N 59 59 59 59 59 59 59 59
2011 Mean 644508.5 9653769 7.45E+06 1.62E+07 431168.3 213340.2 0.0264 0.01068SD 690654.5 1.10E+07 8.94E+06 1.73E+07 502389.1 206458 0.0111 0.0027N 57 57 57 57 57 57 57 57
2012 Mean 1399510 1.90E+07 1.48E+07 3.04E+07 1008609 390901.5 0.0326 0.0094SD 1220445 1.69E+07 1.28E+07 2.55E+07 950192.7 296742.8 0.0075 0.0018N 25 25 25 25 25 25 25 25
*Ratio total interest expenses over deposits**Ratio total non-interest expenses over total assets
13
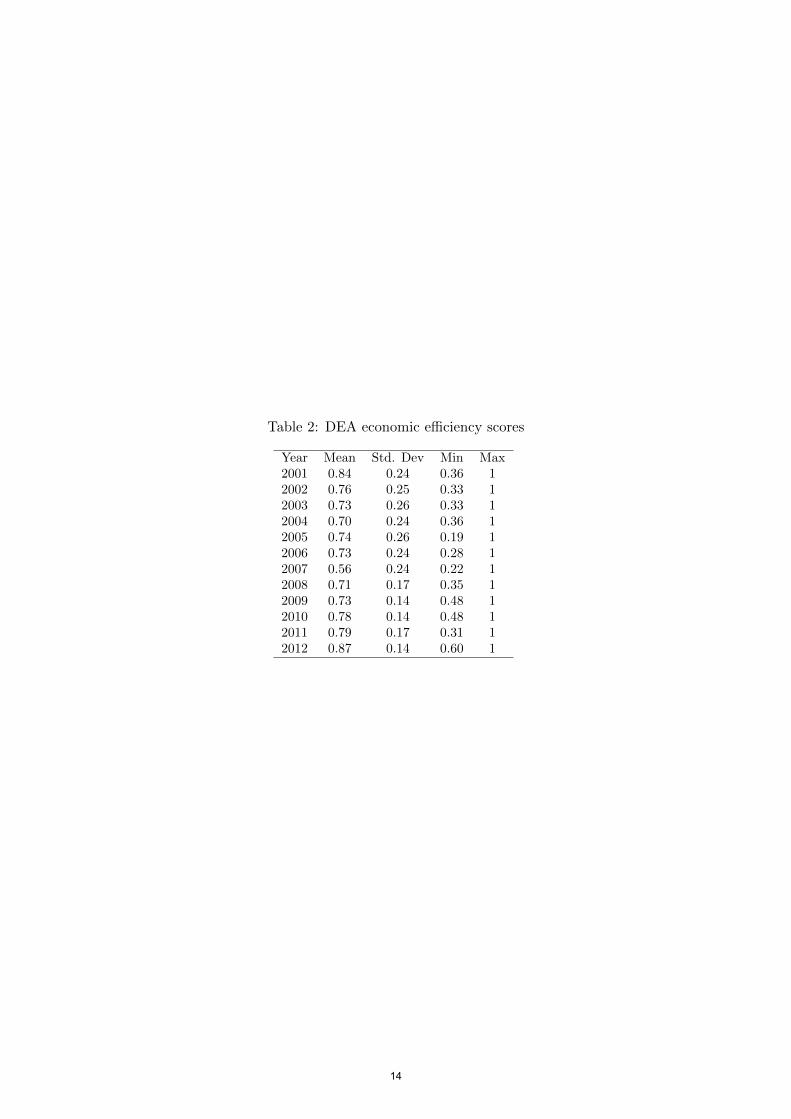
Table 2: DEA economic efficiency scores
Year Mean Std. Dev Min Max2001 0.84 0.24 0.36 12002 0.76 0.25 0.33 12003 0.73 0.26 0.33 12004 0.70 0.24 0.36 12005 0.74 0.26 0.19 12006 0.73 0.24 0.28 12007 0.56 0.24 0.22 12008 0.71 0.17 0.35 12009 0.73 0.14 0.48 12010 0.78 0.14 0.48 12011 0.79 0.17 0.31 12012 0.87 0.14 0.60 1
14
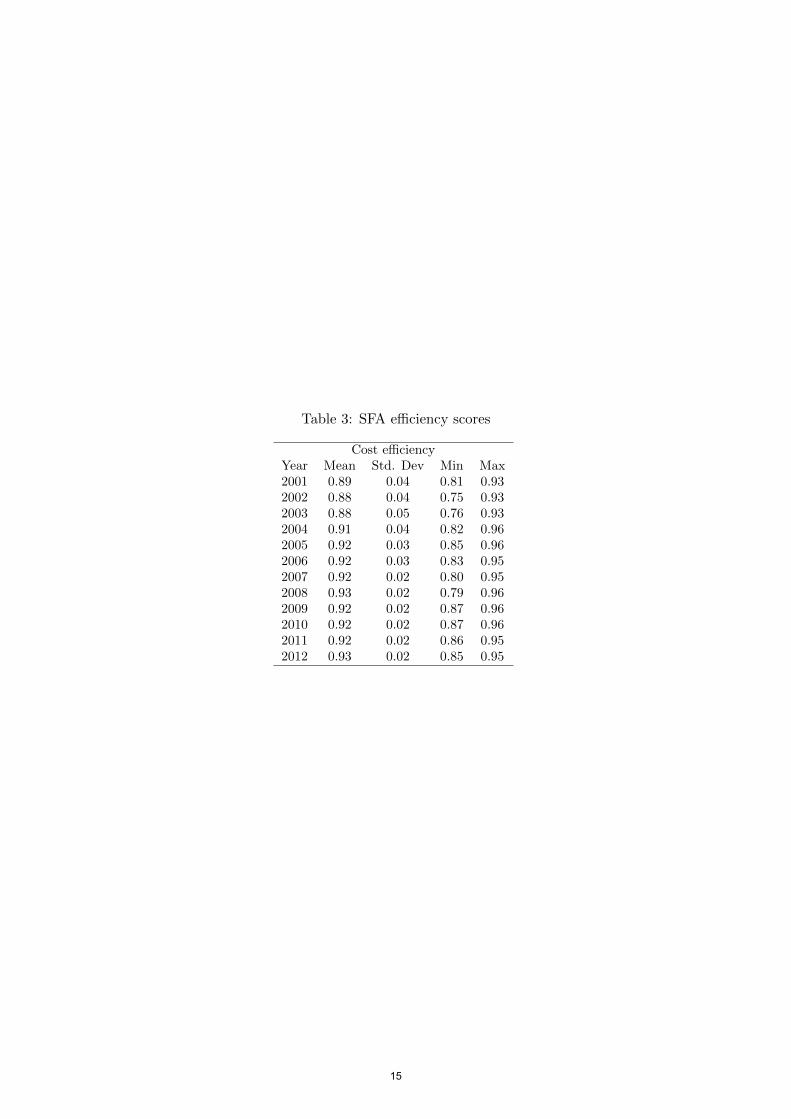
Table 3: SFA efficiency scores
Cost efficiencyYear Mean Std. Dev Min Max2001 0.89 0.04 0.81 0.932002 0.88 0.04 0.75 0.932003 0.88 0.05 0.76 0.932004 0.91 0.04 0.82 0.962005 0.92 0.03 0.85 0.962006 0.92 0.03 0.83 0.952007 0.92 0.02 0.80 0.952008 0.93 0.02 0.79 0.962009 0.92 0.02 0.87 0.962010 0.92 0.02 0.87 0.962011 0.92 0.02 0.86 0.952012 0.93 0.02 0.85 0.95
15