the efficacy of fitting cochlear implants based on pitch perception
TRANSCRIPT
1
The Efficacy of Fitting Cochlear Implants Based
on Pitch Perception
Shaza Mahmoud I Saleh
Thesis submitted for the degree of Doctor of Philosophy
University College London
The UCL Ear Institute
2013

2
Declaration
I, Shaza Mahmoud I Saleh confirm that the work presented in this thesis is my
own. Where information has been derived from other sources, I confirm that this
has been indicated in the thesis.
3
Abstract
Cochlear implants (CI) provide useful hearing for many hearing-impaired
individuals. The CI’s external sound processor has to be programmed to
optimise performance. However, performance varies greatly amongst CI
recipients.
This thesis evaluated a pure-tone electrode-differentiation (PTED) pitch-ranking
task for optimising programming. The PTED was evaluated for reliability, validity
and clinical-suitability. PTED scores were a significant (p<0.05) predictor of
speech-perception.
The angular-depth-of-insertion for the CI array was estimated for 16 recipients,
there was a significant correlation with speech-perception. Cone beam
computed tomography (CBCT) increased accuracy for estimating scalar-
placement of electrodes and no association was found with speech-perception.
25 unilaterally-implanted recipients received programs with indiscriminable
electrodes deactivated based on PTED. Two programs were provided, one with
the same rate-of-pulses-per-channel (RPC) as the clinical program and one with
increased RPC. Programs were evaluated in a cross-over study. Speech-
perception was evaluated using BKB (Bamford-Kowal-Bench) sentences in
quiet and noise and the Coordinate Response Measure (CRM). Statistically
significant improvements were found with at least one research program on all
measures.
A pure-tone intermediate frequency (PTIF) task was conducted to compare
pitch perception in regions of good ED with regions of poor ED. Participants
gaining benefit from electrode deactivation had fewer intermediate frequencies
(IF) in poor ED regions compared to good ED regions and more IF in electrode
4
deactivation regions following deactivation. This pattern was not observed in
participants not gaining benefit from electrode deactivation.
Six bilaterally-implanted participants underwent pitch matching between ears
and new programs were created using only discriminable electrodes. Two
matching approaches were used; direct stimulation via clinical equipment and
pure-tone stimulation. Significant improvements were found in localisation and
BKB in noise with at least one research program.
The results of these experiments suggest potential for improving performance
for CI users by programming based on PTED; a clinically viable task.

5
Acknowledgement
I would like to extend my sincere gratitude to my supervisors Debi Vickers and
Shakeel Saeed for their continuous support, advice and guidance throughout
my research and for their helpful comments on this thesis.
I would also like to express great appreciation to David McAlpine for providing
invaluable feedback and support.
Special thanks go to Debi Vickers for her time and assistance in helping test the
participants for DED reported chapter 3 -which required two persons to apply-
and to Shakeel Saeed for providing his most invaluable time and expertise in
examining the X-ray and CBCT images reported in Chapter 6.
I’m extremely grateful to all the participants for volunteering and all the staff in
the cochlear implant programmes across the UK for their support as I recruited
recipients from their centres, especially the staff at the Royal National Throat
Nose and Throat Hospital in London, with special gratitude to Leah Meerton for
her support and for helping test four participants for DED (reported in Chapter
3) during the pilot phase.
I wish to thank Advanced Bionics, MED-EL™ and Cochlear® for providing
technical support and equipment, Dr. Ray Glover for his time and effort in
developing the software used to test the bilaterally implanted and for his time
and technical support during testing, Dr. Victor Chilekwa and Mr. Mark Reeve
(Medical Research Council Institute of Hearing Research) for developing the
STAR software and hardware, the National Cochlear Implant Users Association
(NCIUA) in the UK and Dr. Timothy Beale for examining CBCT images reported
in Chapter 6.

6
Great gratitude and appreciation go to my family especially my parents for their
loving support.
Thanks to King Faisal Specialist Hospital and Research Centre and to the Saudi
Ministry of Higher Education for providing financial sponsorship.
7
Publications and conference presentations
Saleh, S.M., Saeed, S.R., Meerton, L. and Vickers, D. 2011, “Clinical Fitting of
Cochlear Implants Guided by Electrode Differentiation.” Poster presented at the
Conference on Implantable Auditory Prostheses, Asilomar, CA.
Saleh, S.M., Saeed, S.R., Meerton, L. and Vickers, D. 2011, “Clinical Mapping
of Cochlear Implants Based on Electrode Differentiation.” Oral presentation at
the Med-El UK 7th Clinical Symposium, Windermere, UK.
Saleh, S.M., Saeed, S.R., Meerton, L. and Vickers, D. 2011, “Mapping for MED-
EL guided by electrode discrimination.” Oral presentation at the MED-EL UK
Fundamentals of Fitting with MAESTRO4, London, UK.
Saleh, S.M., Saeed, S.R., Meerton, L. Moore, D. and Vickers, D. (in press)
“Clinical use of electrode differentiation to enhance programming of cochlear
implants.” Cochlear Implants International. (Extended abstract).
Saleh, S.M., Vickers, D., Meerton, L. and Saeed, S.R. 2010, “Fitting Cochlear
Implants Guided by Electrode Discrimination.” Oral presentation at the BAA
Annual Conference, Challenging Audiology, Edinburgh, UK.
Saleh, S.M., Vickers, D., Meerton, L. and Saeed, S.R. 2011, “Clinical Fitting of
Cochlear Implants Guided by Electrode Discrimination.” Oral presentation at the
British Cochlear Implant Group Conference, Nottingham, UK.

8
Saleh, S.M., Saeed, S.R., Meerton, L. and Vickers, 2012, “Clinical Use of
Electrode Differentiation to Enhance Programming of Cochlear Implants.” Oral
presentation at the British Cochlear Implant Group Conference, Manchester,
UK.
Saleh, S.M., Vickers, D., Timothy Beale , Meerton, L. and Saeed, S.R. 2013,
“The Relationship between Cochlear Implant Electrode Array Placement and
Performance.” Oral presentation at the Otorhinolaryngology Research Society
(ORS) Spring Meeting, London, UK.
Saleh, S.M., Vickers, D., Timothy Beale , Lyndon James, Meerton, L. and
Saeed, S.R. 2013, “The Relationship between Cochlear Implant Electrode Array
Surgical Placement and Performance.” Poster presentation at the British
Cochlear Implant Group Conference, Glasgow, UK.
Saleh, S.M., Saeed, S.R., Meerton, L. and Vickers, 2013, “Using Electrode
Discrimination to Enhance Clinical Fitting of Cochlear Implants.” Poster
presented at the Conference on Implantable Auditory Prostheses, Lake Tahoe,
CA.

9
Contents
Declaration .......................................................................................................... 2
Abstract ............................................................................................................... 3
Acknowledgement ............................................................................................... 5
Publications and conference presentations ........................................................ 7
List of Figures ................................................................................................... 15
List of Tables..................................................................................................... 18
Glossary ............................................................................................................ 23
1 Cochlear implants .......................................................................................... 30
1.1 The CI device .......................................................................................... 31
1.1.1 Components of the CI device ............................................................ 31
1.1.2 How the CI functions ......................................................................... 33
1.2 The CI design and specifications ............................................................. 33
1.2.1 Performance ..................................................................................... 34
1.2.2 Reliability .......................................................................................... 39
1.2.3 Safety ................................................................................................ 40
1.3 The fitting (programming) of the CI device .............................................. 41
1.3.1 Impedance telemetry ........................................................................ 42
1.3.2 Creating a CI program ...................................................................... 42
1.3.3 Setting stimulation levels .................................................................. 43
1.4. Signal/speech processing strategies ...................................................... 43
1.4.1. Explicit feature extraction strategies ................................................ 44
1.4.2 Simultaneous analog speech processing strategies ......................... 45
1.4.3 Pulsatile speech processing strategies ............................................. 45
1.4.4 N of m strategies ............................................................................... 51
1.5 Summary ................................................................................................. 53
2 Factors affecting performance with CIs .......................................................... 54
2.1 Subject dependent factors ....................................................................... 54
2.1.1 Age ................................................................................................... 55
2.1.2 Cognitive abilities .............................................................................. 57
2.1.3 Duration of deafness ......................................................................... 59
2.1.4 Aetiology of deafness ........................................................................ 61
10
2.2 Surgical placement of the electrode array ............................................... 62
2.2.1 Scala tympani versus scala vestibuli surgical placement .................. 62
2.2.2 Depth of insertion .............................................................................. 63
2.2.3 Soft CI surgery .................................................................................. 64
2.2.4 Electrode array design ...................................................................... 68
2.3 Factors dependent on the CI electrodes/channels ............................... 71
2.3.1 Number of channels stimulated by the active electrodes ............. 72
2.3.2 Problematic electrodes ................................................................. 73
2.4 Second CI ............................................................................................ 87
2.4.1 Speech perception with bilateral CIs ............................................ 87
2.4.2 Localisation with bilateral CIs ....................................................... 88
2.4.3 Interim summary ........................................................................... 89
2.5 Conclusion ............................................................................................... 94
2.6 Summary ................................................................................................. 93
3 Validity and reliability of the pure-tone electrode differentiation in CIs ........... 98
3.1 Introduction .............................................................................................. 98
3.1.1 The development of the PTED test ................................................. 100
3.1.2 Aims and hypothesis ....................................................................... 100
3.2 Method .................................................................................................. 103
3.2.1 Participants ..................................................................................... 103
3.2.2 Test battery ..................................................................................... 105
3.2.3 Procedure ....................................................................................... 109
3.3 Analyses ................................................................................................ 112
3.3.1 Validation of the PTED procedure .................................................. 112
3.3.2 Test-retest reliability of the PTED procedure .................................. 113
3.3.3 Clinical use feasibility of the PTED via STAR software ................... 114
3.4 Results .................................................................................................. 114
3.4.1 Validation of the PTED procedure .................................................. 114
3.4.2 Test-retest reliability of the PTED procedure .................................. 116
3.4.3 Clinical use feasibility of the PTED via STAR software ................... 119
3.5 Discussion ............................................................................................. 121
3.5.1 Validation of the PTED procedure .................................................. 122
3.5.2 Test-retest reliability of the PTED ................................................... 122
3.5.3 Clinical use feasibility of the PTED ................................................. 123
3.6 Conclusion ............................................................................................. 124
3.7 summary ................................................................................................ 124
11
4 Test-retest reliability of the Coordinate Response Measure (CRM) speech perception test ................................................................................................ 126
4.1 Introduction ............................................................................................ 126
4.1.1 The CRM speech perception test ................................................... 128
4.1.2. Aims and hypothesis ...................................................................... 130
4.2 Method .................................................................................................. 131
4.2.1 Participants ..................................................................................... 131
4.2.2 Test battery ..................................................................................... 131
4.2.3 Procedure ....................................................................................... 132
4.2.4 Analyses ......................................................................................... 133
4.3 Results .................................................................................................. 134
4.3.1 Difference between NH and CI recipients ....................................... 134
4.3.2 Test-retest reliability of the CRM ..................................................... 134
4.4 Discussion ............................................................................................. 137
4.5 Conclusion ............................................................................................. 138
4.6 Summary ............................................................................................... 139
5 The relationship between PTED and speech perception ............................. 140
5.1 Introduction ............................................................................................ 140
5.1.1 Aims and Hypotheses ..................................................................... 141
5.2 Method .................................................................................................. 142
5.2.1 Participants ..................................................................................... 142
5.2.2 Test battery ..................................................................................... 146
5.2.3 Procedure ....................................................................................... 146
5.3 Analyses ................................................................................................ 147
5.4 Results .................................................................................................. 149
5.4.1 Results of multiple regression models ............................................ 153
5.5 Discussion ............................................................................................. 153
5.6 Conclusion ............................................................................................. 163
5.7 Summary ............................................................................................... 164
Chapter 6 ........................................................................................................ 165
6.1 Introduction ............................................................................................ 166
6.1.1 CBCT use with CI ........................................................................... 168
6.1.2 Aims and hypotheses ...................................................................... 170
6.2 Method .................................................................................................. 171
6.2.1 Participants ..................................................................................... 171
6.2.2 Test battery ..................................................................................... 174
12
6.2.3 Procedure ....................................................................................... 174
6.3 Analyses ................................................................................................ 177
6.3.1 Angular depth of insertion ............................................................... 178
6.3.2 Scalar placement of the CI electrodes (CBCT results).................... 179
6.4 Results .................................................................................................. 181
6.4.1 Angular depth of insertion ............................................................... 181
6.4.2 Scalar placement of the CI electrodes (CBCT results).................... 186
6.5 Discussion ............................................................................................. 190
6.6 Conclusion ............................................................................................. 193
6.7 Summary ............................................................................................... 195
7 Programming of CIs based on PTED results in unilaterally implanted recipients ........................................................................................................ 196
7.1 Introduction ............................................................................................ 196
7.1.1 Aims and hypotheses ...................................................................... 196
7.2 Method .................................................................................................. 200
7.2.1 Participants ..................................................................................... 200
7.2.2 Test battery ..................................................................................... 203
7.2.3 Procedure ....................................................................................... 204
7.2.4 Research programs ........................................................................ 200
7.3 Analyses ................................................................................................ 200
7.3.1 Analyses of group results ................................................................ 209
7.3.2 Analyses of individual results .......................................................... 209
7.3.3 Comparison between program A with increased RPC and program B with a maintained RPC ............................................................................ 211
7.4 Results .................................................................................................. 212
7.4.1 Group results .................................................................................. 212
7.4.2 Individual results ............................................................................. 212
7.4.3 Comparison between program A (increased RPC) and program B (maintained RPC) .................................................................................... 219
7.5 Discussion ............................................................................................. 220
7.6 Conclusion ............................................................................................. 227
7.7 Summary ............................................................................................... 228
8 Comparison of pitch ranking ability between different electrodes in discriminable and indiscriminable electrode regions ....................................... 229
8.1 Introduction ............................................................................................ 230
8.2 Experiment I: Comparison between discriminable and indiscriminable electrode-pair regions (A and B) .................................................................. 232
13
8.2.1 Introduction aims and hypotheses .................................................. 232
8.2.2 Method ............................................................................................ 233
8.2.3 Analyses ......................................................................................... 241
8.2.4 Results ............................................................................................ 244
8.2.5 Summary of experiment I ................................................................ 249
8.2.6 Discussion of experiment I .............................................................. 249
8.3 Comparison between discriminable and indiscriminable electrode-pair regions before and after deactivation (A, B and C) ...................................... 252
8.3.1 Introduction: aim and hypothesis .................................................... 252
8.3.2 Methods .......................................................................................... 254
8.3.3 Analyses ......................................................................................... 257
8.3.4 Results ............................................................................................ 258
8.3.4 Summary of experiment II ............................................................... 263
8.3.5 Discussion of experiment II ............................................................. 264
8.4 Discussion for experiments I and II ....................................................... 266
8.5 Conclusion ............................................................................................. 266
8.6 Summary ............................................................................................... 267
9 Electrode differentiation with bilateral cochlear implants .............................. 267
9.1 Introduction ............................................................................................ 270
9.1.1 Interaural differences ...................................................................... 272
9.1.2 Spatial release from masking (SRM) .............................................. 272
9.1.3 Aims and hypotheses ...................................................................... 273
9.2 Methods ................................................................................................. 275
9.2.1 Participants ..................................................................................... 275
9.2.2 Test battery ..................................................................................... 278
9.2.3 Procedures ..................................................................................... 284
9.2.4 Research programs ........................................................................ 284
9.3 Analyses ................................................................................................ 284
9.3.1 Analyses of group results ................................................................ 284
9.3.2 Analyses of individual results .......................................................... 284
9.4 Results .................................................................................................. 290
9.4.1 Group results .................................................................................. 290
9.4.2 Individual results ............................................................................. 300
9.5 Discussion ............................................................................................. 303
9.6 Conclusion ............................................................................................. 309
9.7 Summary ............................................................................................... 310
14
10 Summary and General Discussion ............................................................. 311
10.1 Summary of main findings ................................................................... 312
10.1.1 Findings reported in Chapter 3 ..................................................... 312
10.1.2 Findings reported in Chapter 4 ..................................................... 312
10.1.3 Findings reported in Chapter 5 ..................................................... 312
10.1.4 Findings reported in Chapter 6 ..................................................... 313
10.1.5 Findings reported in Chapter 7 ..................................................... 313
10.1.6 Findings reported in Chapter 8 ..................................................... 314
10.1.7 Findings reported in Chapter 9 ..................................................... 314
10.2 Summary of new findings .................................................................... 315
10.3 General discussion .............................................................................. 315
10.3.1 Identification of problematic electrodes or dead regions ............... 317
10.3.2 Types of indiscriminable electrodes .............................................. 329
10.3.3 Implications regarding performance with unilateral CI .................. 329
10.3.4 Implications regarding performance with bilateral CI .................... 329
10.3.5 CI design implications ................................................................... 332
10.4 Limitations of the studies described .................................................... 334
10.5 Future research ................................................................................... 336
10.5.1 The identification of dead regions and the applied intervention to improve performance with CI ................................................................... 336
10.5.2 Improving performance with bilateral CIs ...................................... 337
10.6 Conclusion ........................................................................................... 339
Appendices ..................................................................................................... 342
Appendix A Procedures involved in the programming of the speech processor (a brief programming protocol) ........................................................................ 342
A.1 The CI fitting station .............................................................................. 342
A.2 The fitting procedure ............................................................................. 342
A.2.1 Manufacturer-specific stimulation level settings ............................. 343
Appendix B Strategies involving explicit feature extraction ............................. 345
Appendix C Data used in analyses in Chapter 5 ........................................... 346
Appendix D Raw data used in analyses in Chapter 7 and figures .................. 349
References .................................................................................................... 355
15
List of Figures
Figure 1.1 A schematic diagram of a cochlear implant ..................................... 31
Figure 1.2 Pictures of behind the ear speech processors ................................. 32
Figure 1.3 Picture of the cochlear implant device ............................................. 32
Figure 1.4 Current flow in monopolar, bipolar, tripolar and partial tripolar
coupling. ........................................................................................................... 37
Figure 1.5 European consensus statement on cochlear implant failures and
explantations (2005). ........................................................................................ 40
Figure 1.6 A classification scheme for the speech processing strategies in
cochlear implant. ............................................................................................... 44
Figure 1.7 Block diagram of CIS ...................................................................... 47
Figure 1.8 Block diagram of the interleaved pulses used in a CIS strategy ...... 47
Figure 1.9 Block diagram of the pulses used in the PPS strategy..................... 48
Figure 1.10 Block diagram of Hi-Res strategy .................................................. 49
Figure 1.11 A diagram of active current steering .............................................. 50
Figure 1.12 The 120 stimulation sites provided by the Hi-Res 120 strategy. .... 50
Figure 1.13 Block diagram of N of M strategy ................................................... 52
Figure 3.1 The animated figures (foxes) used for testing and collecting
responses, which appear on the monitor during testing for PTED.. ................ 109
Figure 3.2 Outline of the study protocol to evaluate validity and reliability of the
PTED.. ............................................................................................................ 110
Figure 3.3 Example of raw percentage DED and PTED pitch ranking scores for
each electrode pair in participant 9 to show agreement .................................. 116
Figure 4.1 Results of the CRM test in dBA for each group, the NH and the CI
recipients. ....................................................................................................... 135
Figure 4.2 The relationship between CRM SRT in dBA in the first trial and the
second trial among the NH and CI recipients .................................................. 136
16
Figure 5.1 Results of the BKB tests in quiet and in noise in rationalized arcsine-
transform units (RAU). .................................................................................... 149
Figure 5.2 The relationship between BKB scores in quiet (RAU) and the PTED’s
percentage of discriminable ............................................................................ 151
Figure 5.3 The relationship between BKB scores in noise (RAU) and the
PTED’s percentage of discriminable ............................................................... 151
Figure 5.4 The relationship between CRM SRT and the PTED’s percentage of
discriminable ................................................................................................... 152
Figure 6.1 Post CI plain X-ray (Sternvers view) showing a CI electrode array
with an angular depth of insertion estimated at 540°. ..................................... 176
Figure 6.2 The relationship between BKB scores in quiet (RAU) and the angular
depth of insertion ............................................................................................ 184
Figure 6.3 The relationship between BKB scores in noise (RAU) and the
angular depth of insertion ............................................................................... 184
Figure 6.4 CBCT mid-modiolar reconstruction (axial-view) showing the position
of MED-EL™ Sonata electrodes in scala tympani .......................................... 187
Figure 6.5 Examples of post CI CBCT and MSCT images. ............................ 187
Figure 7.1 Example of rule hierarchy for testing electrode-pairs ..................... 204
Figure 7.2 Outline of the cross-over study design ........................................... 207
Figure 7.3 Results of the BKB Sentence test in quiet (RAU) for the two sub-
groups with the use of the clinical program and the research program ........... 212
Figure 7.4 Results of the BKB Sentence test in noise (RAU) for the two sub-
groups with the use of the clinical program and the research program ........... 213
Figure 7.5 Results of the CRM SRT in dBA for the two sub-groups with the
clinical program (dark grey boxes) and the research program ........................ 215
Figure 8.1 Example demonstrating the hypothesis for experiment I ............... 233
Figure 8.2 Example demonstrating the test-frequencies for an electrode-pair 239
17
Figure 8.3 IF results for conditions A, B and A – B in number of IF for the three
sub-groups. ..................................................................................................... 245
Figure 8.4 Example demonstrating the hypothesis for experiment II .............. 253
Figure 8.5 Example demonstrating the test-frequencies for an indiscriminable
electrode-pair in condition B and for the corresponding electrode pair in
condition C ...................................................................................................... 256
Figure 8.6 IF results for conditions B, C and C – B in number of IF for the three
sub-groups.. .................................................................................................... 259
Figure 9.2 The location of the active audio-visual stands (speaker and a monitor
below it) for the two conditions of the Number Localisation test. .................... 279
Figure 9.2 Outline of the cross-over study design ........................................... 285
Figure A.1 An Advanced Bionics (AB) CI fitting station ................................... 342
Figure D.1 Results of the BKB Sentence test in quiet (raw scores) for the two
sub-groups with the use of the clinical program and the research program .... 353
Figure D.2 Results of the BKB Sentence test in noise (raw scores) for the two
sub-groups with the use of the clinical program and the research program .... 354
18
List of Tables
Table 1.1 Summary of different types of stimulation, current flow and
advantages. ...................................................................................................... 38
Table 2.1 Comparison between unilateral and bilateral CI performance. .......... 90
Table 3.1 Participants’ demographics ............................................................. 105
Table 3.2 The percentage agreement (pass versus fail) of all tested electrode-
pairs between DED and the PTED and for all participants. ............................. 115
Table 3.3 The percentage agreement (pass versus fail) of all tested electrode
pairs between the test-retest sessions with the PTED and for all participants.
........................................................................................................................ 118
Table 3.4 Testing duration per participant for each of the PTED tasks and the
total testing duration. ....................................................................................... 119
Table 3.5 Descriptive statistics of testing duration per participant for each of the
PTED tasks and the total testing duration. ...................................................... 120
Table 3.6 Descriptive statistics of testing duration per electrode pair for each of
the PTED tasks (LM and PR) and number of LM trials per electrode pair.. .... 120
Table 3.7 Average and maximum testing duration in minutes for PTED’s
loudness matching task in the different devices .............................................. 121
Table 3.8 Average and maximum testing duration in minutes for PTED’s pitch
ranking task in the different devices. ............................................................... 121
Table 4.1 Descriptive statistics of the CRM SRT for each group; mean and
standard deviation are in dBA. ........................................................................ 135
Table 4.2 Test-retest statistics of the CRM test for the NH and the CI recipients
groups. ............................................................................................................ 137
Table 5.1 Participants’ demographic details ................................................... 144
Table 5.2 Results of the PTED, BKB (RAU) scores in quiet and in noise and
CRM. ............................................................................................................... 149
19
Table 5.3 Correlation results between PTED’s percentage of discriminable
electrode pairs at each frequency range ......................................................... 152
Table 5.4 Results of step-wise multiple linear regression using PTED results at
all frequencies: the dependent variable was BKB score in quiet. .................... 154
Table 5.5 Results of step-wise multiple linear regression using PTED results at
all frequencies: the dependent variable was BKB score in noise. ................... 154
Table 5.6 Results of step-wise multiple linear regression using PTED results at
all frequencies: the dependent variable was CRM SRT. ................................. 155
Table 5.7 Results of step-wise multiple linear regression using PTED results at
each frequency band: the dependent variable was BKB score in quiet. ......... 157
Table 5.8 Results of step-wise multiple linear regression using PTED results at
each frequency band: the dependent variable was BKB score in noise. ......... 158
Table 5.9 Results of step-wise multiple linear regression using PTED results at
each frequency band: the dependent variable was CRM SRT. ...................... 159
Table 6.1 Participants demographic details. ................................................... 173
Table 6.2 correlation results between the angular depth of insertion in degrees
and the other variables.. ................................................................................. 183
Table 6.3 correlation results between the angular depth of insertion category
and the other variables ................................................................................... 185
Table 6.4 correlation results between the frequency shift in Hz and the other
variables. ........................................................................................................ 186
Table 6.5 correlation results between the percentage of electrodes placed in ST
and the other variables ................................................................................... 188
Table 6.6 correlation results between the number of inter-scalar cross-overs
and the other variables ................................................................................... 189
Table 6.7 The number of participants demonstrating each of the scalar-patterns
per manufacturer ............................................................................................. 190
Table 7.1 Participants’ demographics ............................................................. 201

20
Table 7.2 Results of the best clinical and the best research CRM SRTs reported
in dBA. Descriptive statistics. .......................................................................... 214
Table 7.3 Individual results for Cochlear® devices (BKB in quiet and noise,
CRM SRTs and subjective report) and DE region ........................................... 216
Table 7.4 Individual results for MED-EL™ devices (BKB in quiet and noise,
CRM SRTs and subjective report) and DE region ........................................... 217
Table 7.5 Individual results for Advanced Bionics devices (BKB in quiet and
noise, CRM SRTs and subjective report) and DE region ................................ 218
Table 7.6 Summary of RPC and participants’ preferred research program and
the program that provided better speech perception. ...................................... 220
Table 8.1 Participants’ demographics ............................................................. 236
Table 8.2 Performance scores and detailed IF results in number of IF of
conditions A, B and A – B for all participants who have shown decline after
deactivation of indiscriminable electrodes ....................................................... 246
Table 8.3 Performance scores and IF results in number of IF of conditions A, B
and A – B for all participants who have shown significant benefit after
deactivation of indiscriminable electrodes ....................................................... 247
Table 8.4 Summary of results for Participants who showed discrepancy
between PTED and PTIF indications and received a program based on PTIF in
condition B. ..................................................................................................... 248
Table 8.5 Participants’ demographics for experiment II .................................. 254
Table 8.6 Performance scores and detailed IF results in number of IF of
conditions A, B, C and C – B for participants who have shown decline after
deactivation of indiscriminable electrodes ....................................................... 260
Table 8.7 Performance scores and IF results in number of IF of conditions C, B
and C – B for all participants who have shown significant benefit after
deactivation of indiscriminable electrodes. ...................................................... 261
Table 8.8 Results of Participants who showed discrepancy between PTED and
PTIF indications and received a program based on PTIF in condition B. ........ 262
21
Table 8.9 Deactivated electrodes and IF results of the corresponding condition
C for participant (12) ...................................................................................... 263
Table 9.1 Participants’ demographics ............................................................. 277
Table 9.2 The classification of responses used in matching between ears with
the corresponding p values. ............................................................................ 280
Table 9.3 The list of frequencies used in the across-ears pitch comparison test
and the corresponding musical notes ............................................................. 283
Table 9.4 Group results of all speech perception.. .......................................... 291
Table 9.5 Group results of all AEPC results. ................................................... 292
Table 9.6 The difference in speech perception between the best clinical scores
and scores with the best research program with the application of a t-test ..... 293
Table 9.7 The difference between the best clinical scores and scores with each
research program on localisation tasks and AEPC ........................................ 295
Table 9.8 The difference between the BKB in noise scores when noise was
presented at 0° and BKB in noise scores when noise was presented at either
side ±90° with the use of the different programs ............................................. 297
Table 9.9 The correlation between the localisation scores at all conditions and
AEPC results................................................................................................... 298
Table 9.10 The correlation between the BKB in noise scores at all conditions
and AEPC results. ........................................................................................... 299
Table 9.11 The difference between research program A and research program
B on the different performance measures with the application of a t-test ........ 300
Table 9.12 Individual results of subjective reports and changes in speech
perception measures with each research program as compared to the clinical
program. ......................................................................................................... 301
Table 9.13 Individual results of localisation tasks and AEPC .......................... 302
Table A.1 A brief description of the procedures involved in fitting CI speech
processors ...................................................................................................... 344
22
Table B.1 Strategies involving explicit feature extraction ................................ 345
Table C.1 BKB in quiet (RAU) and data used in multiple regression and
correlation analyses in Chapter 5 .................................................................... 346
Table C.2 BKB in noise (RAU) and data used in multiple regression and
correlation analyses in Chapter 5 .................................................................... 347
Table C.3 CRM SRT in dBA and data used in multiple regression and
correlation analyses in Chapter 5 .................................................................... 348
Table D.1 BKB in quiet (raw scores) with the best research program compared
to the best score with the clinical program in group I used in Chapter 7 ......... 349
Table D.2 BKB in quiet (raw scores) with the best research program compared
to the best score with the clinical program in group II used in Chapter 7 ........ 350
Table D.3 BKB in noise (raw scores) with the best research program compared
to the best score with the clinical program in group I used in Chapter 7 ......... 351
Table D.4 BKB in noise (raw scores) with the best research program compared
to the best score with the clinical program in group II used in Chapter 7 ........ 352
23
Glossary
nI- nAFC n interval n alternative-forced-choice task
AAI Age at implantation
AB Advanced bionics
ACE Advanced combination encoder
AEPC Across ears pitch comparison (test)
ADRO Adaptive dynamic range optimization
AGC Automatic gain control
AI Articulation index
ANOVA Analysis of variance
ART Auditory nerve response telemetry
APHAB Abbreviated Profile of Hearing Aid Benefit
AUX Auxiliary (input only)
BKB Bamford-Kowal-Bench
BKB-SIN BKB-Speech In Noise test
BPF Band pass filters
C Comfortable level (loud but comfortable)
CA Compressed Analog
CBCT Cone beam computed tomography
CI Cochlear implant
24
c.i. Confidence interval
CID Central Institute of Deafness (everyday sentence test)
CIS Continuous interleaved sampling
CNC Consonant-Nucleus-Consonant
CPI Clinical programming interface
CRM Coordinate response measure
CSSS Channel specific sampling sequence
CST Connected speech test
CU Clinical units
CUNY City University of New York (sentence test)
dB Decibel
dBA A-weighted dB (decibel) Sound Pressure Level
DE Deactivated electrodes
DED Direct-stimulation ED (electrode differentiation)
DEHF Deactivated electrodes at high frequencies (> 2600 Hz)
DELF Deactivated electrodes at low frequencies (< 2600 Hz)
df Degree of freedom
DIF Discriminable intermediate frequency/ies
DL Difference limen
DS Direct stimulation
25
E Electrode
EABR Electric auditory brainstem response
EAS Electro-acoustic stimulation
ECAP Evoked compound action potential
ED Electrode differentiation
ENV Common environmental sounds
EP Electrode pair
F0 Fundamental frequency
F2 Second formant
F1 First formant
FDA U.S. Food and Drug Administration
FDL Frequency difference limen
FM Frequency modulation
FSP Fine structure processing
H Higher (pitch)
HDCIS high definition CIS (continuous interleaved sampling)
HINT-N Hearing in Noise Test in noise
HINT-Q Hearing in Noise Test in quiet
HiRes High resolution
HiRes P High resolution paired
26
HSM Hochmair- Schulz-Moser (sentence test)
Hz Hertz
IDR Input dynamic range
IF Intermediate frequency/frequencies
IIR Infinite impulse response
ILD Interaural level difference
IPI Inter-pulse interval
ISI Inter-stimulus interval
ITD Interaural time difference
IQ Intelligence quotient
IQ (range) Inter-quartile (range)
L Lower (pitch)
LM Loudness matching
LPF Low pass filter
M Most comfortable level
kHz Kilohertz
MCL Most comfortable level
MDS Multidimensional scaling
MDT Modulation detection threshold
MNEP Maximum number of electrode pairs
27
MRI Magnetic resonance imaging
ms Millisecond
MSCT Multi slice computed tomography
N Number of test participants or data sets
NCIUA National Cochlear Implant Users Association
NH Normal hearing
NICE National Institute for Health and Clinical Excellence
NRI Neural response imaging
NRT Neural response telemetry
NU-6 Northwestern University Auditory Test No. 6
OSLA Oldenburger sentences
PAT Pat Associate Test
PPS Paired Pulsatile Sampler
PPS Pulses per second
PR Pitch ranking
PT Pure tone
PTA Pure tone average
PTED Pure tone electrode differentiation
PTIF Pure tone intermediate frequency test
RAU Rationalized arcsine-transform units

28
RNTNEH Royal national throat nose and ear hospital
RPC Rate per channel
RPM Raven Progressive Matrices
S Same (pitch)
SAS Simultaneous analog stimulation
SD Standard deviation
SII Speech intelligibility index
SLT Sequence Learning Task
SNR Signal-to-noise ratio
SOE Spread of excitation
SPEAK Spectral peak
SR Spatial resolvability
SRM Spatial release from masking
SRT Speech-reception threshold
ST Scala tympani
SV Scala vestibuli
T Threshold
THR Threshold
Q1 First quartile (lower 25th quartile)
Q3 Third quartile (upper 75th quartile)
29
VCV Vowel Consonant Vowel
VMT Visual Monitoring Task
WAIS-R Wechsler Adult Intelligence Scale-Revised
30
Chapter 1
Cochlear implants
"The aspects of things that are most important to us are hidden because of their
simplicity and familiarity." Ludwig Wittgenstein (quote). Simple things such as
enjoying our favourite music, talking on the telephone, having a conversation in
a busy restaurant or exchanging small talk with a neighbour are common place
to normal hearing listeners yet they seem so difficult and sometimes impossible
for the hearing impaired. Perhaps this is why the cochlear implant (CI) is one of
the greatest innovations of the 20th century in the field of Otorhinolaryngology,
helping to restore a sense of hearing to over 188,000 hearing impaired
recipients across the world (National Institute of Deafness and other
Communication Disorders, 2012).
CIs have been recognized as a safe and effective procedure for the
management of patients with a severe to profound hearing loss who derive
minimal benefit from hearing aids (FDA, 1984 and Summerfield and Marshall,
1995). CIs can provide useful hearing for adults to a level that allows normal
conversation and even telephone use for some good performers (Brown et al.,
1985). Various studies have been conducted that provide evidence of post-CI
benefits on many aspects of auditory detection and speech perception. (UK
Cochlear Implant Study Group, 2004) reported speech perception changes
following implantation for 84 post-lingually deafened adults implanted between
1997 and 2000 in 13 hospitals in the UK; They found that the mean percentage
correct scores achieved when listening in quiet to the Bamford-Kowal-Bench
(BKB) sentences significantly increased from 13% pre-implantation to 57% at 9
months post-implantation.
This chapter provides a general overview of CIs how they work and the main
parameters involved in programming them. It will start with a description of CIs
and the basic functionality and components, followed by major design issues
31
that may affect processing and, ultimately, performance. Finally it will provide a
general description of the main aspects of fitting CIs and programming the
device, including signal/speech processing strategies and the basic procedures
involved.
1.1 The CI device
A CI is an electronic device that helps transduce sound to electrical signals that
directly stimulate auditory nerve fibres by bypassing the damaged cochlea hair
cells in the peripheral auditory system. .
1.1.1 Components of the CI device
The CI consists of internal and external parts:
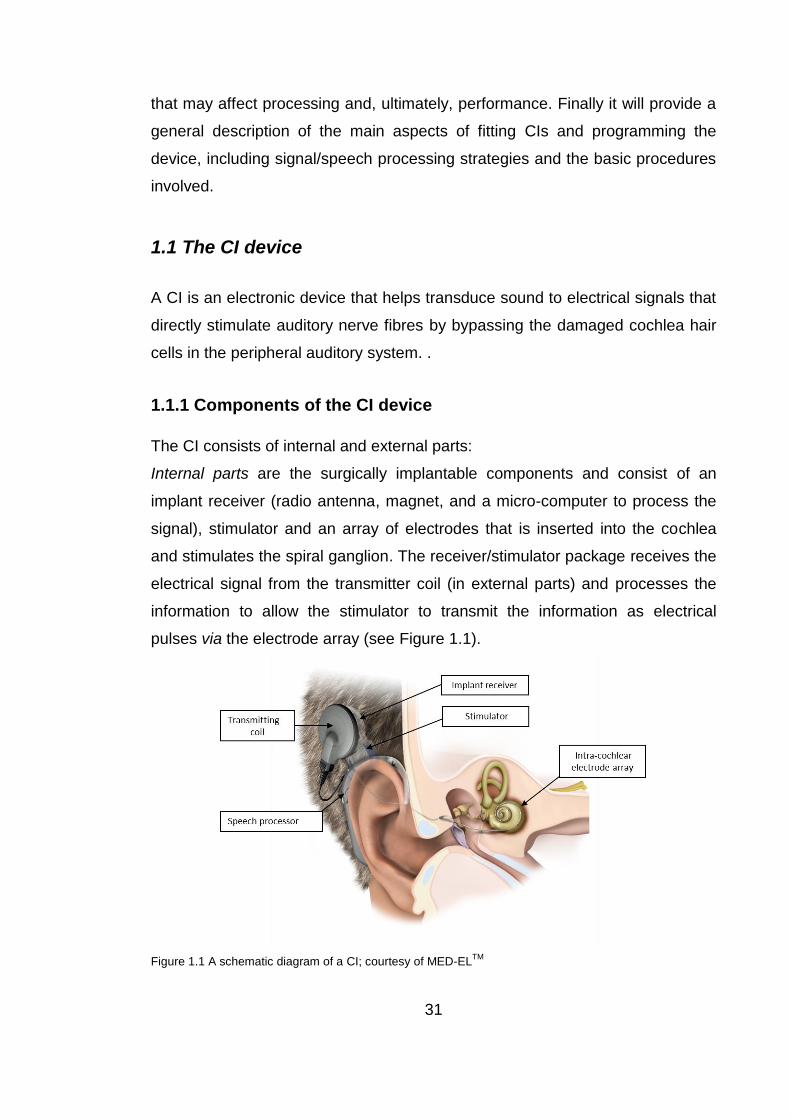
Internal parts are the surgically implantable components and consist of an
implant receiver (radio antenna, magnet, and a micro-computer to process the
signal), stimulator and an array of electrodes that is inserted into the cochlea
and stimulates the spiral ganglion. The receiver/stimulator package receives the
electrical signal from the transmitter coil (in external parts) and processes the
information to allow the stimulator to transmit the information as electrical
pulses via the electrode array (see Figure 1.1).
Figure 1.1 A schematic diagram of a CI; courtesy of MED-ELTM
32
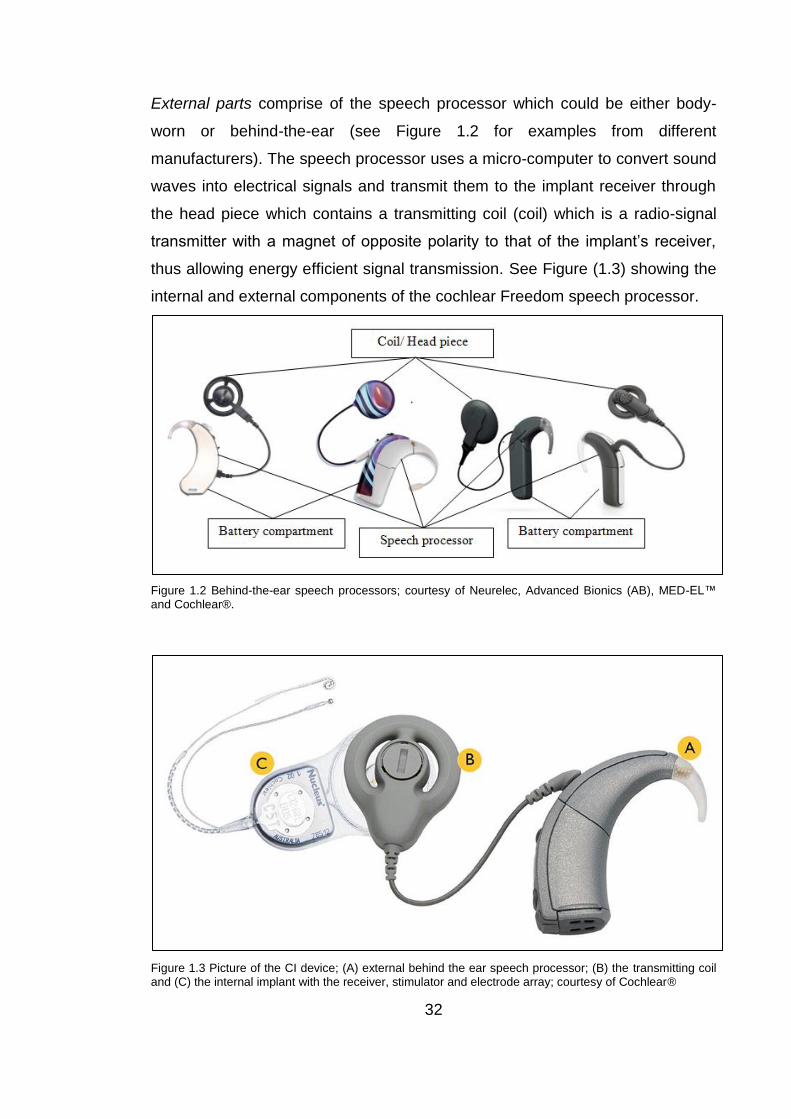
External parts comprise of the speech processor which could be either body-
worn or behind-the-ear (see Figure 1.2 for examples from different
manufacturers). The speech processor uses a micro-computer to convert sound
waves into electrical signals and transmit them to the implant receiver through
the head piece which contains a transmitting coil (coil) which is a radio-signal
transmitter with a magnet of opposite polarity to that of the implant’s receiver,
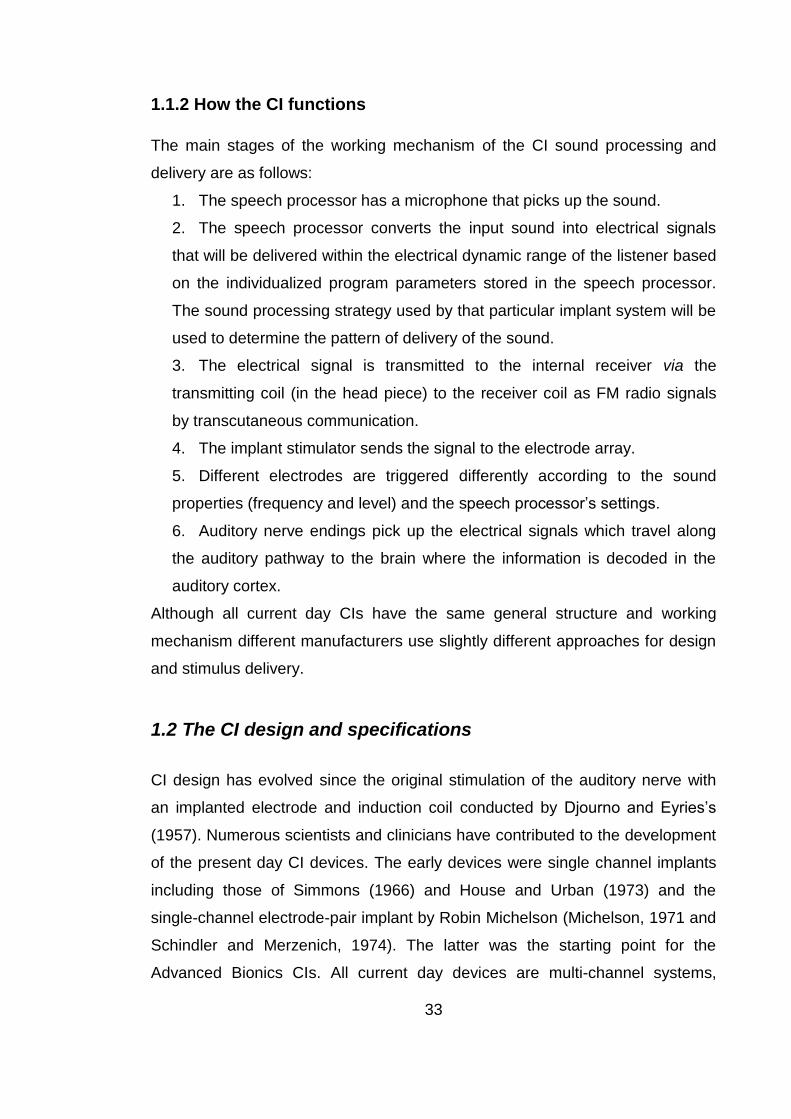
thus allowing energy efficient signal transmission. See Figure (1.3) showing the
internal and external components of the cochlear Freedom speech processor.
Figure 1.2 Behind-the-ear speech processors; courtesy of Neurelec, Advanced Bionics (AB), MED-EL™ and Cochlear®.
Figure 1.3 Picture of the CI device; (A) external behind the ear speech processor; (B) the transmitting coil and (C) the internal implant with the receiver, stimulator and electrode array; courtesy of Cochlear®
33
1.1.2 How the CI functions
The main stages of the working mechanism of the CI sound processing and
delivery are as follows:
1. The speech processor has a microphone that picks up the sound.
2. The speech processor converts the input sound into electrical signals
that will be delivered within the electrical dynamic range of the listener based
on the individualized program parameters stored in the speech processor.
The sound processing strategy used by that particular implant system will be
used to determine the pattern of delivery of the sound.
3. The electrical signal is transmitted to the internal receiver via the
transmitting coil (in the head piece) to the receiver coil as FM radio signals
by transcutaneous communication.
4. The implant stimulator sends the signal to the electrode array.
5. Different electrodes are triggered differently according to the sound
properties (frequency and level) and the speech processor’s settings.
6. Auditory nerve endings pick up the electrical signals which travel along
the auditory pathway to the brain where the information is decoded in the
auditory cortex.
Although all current day CIs have the same general structure and working
mechanism different manufacturers use slightly different approaches for design
and stimulus delivery.
1.2 The CI design and specifications
CI design has evolved since the original stimulation of the auditory nerve with
an implanted electrode and induction coil conducted by Djourno and Eyries’s
(1957). Numerous scientists and clinicians have contributed to the development
of the present day CI devices. The early devices were single channel implants
including those of Simmons (1966) and House and Urban (1973) and the
single-channel electrode-pair implant by Robin Michelson (Michelson, 1971 and
Schindler and Merzenich, 1974). The latter was the starting point for the
Advanced Bionics CIs. All current day devices are multi-channel systems,

34
among the early multi-channel designs was Graeme Clark’s 20 platinum
electrode system; the starting point for today’s Cochlear® device (Clark et al.,
1975 and Clark, 2008). Early four/ six and eight-electrode Vienna CIs by
Hochmair, Burian and Hochmair-Desoyer developed into ME-DELTM 12-
electrode CIs (Hochmair et al., 1983) and Chouard’s work in France in the
1970’s was the starting point for the first 15 – channel digisonic CI for Neurelec
(Pialoux, Chouard and McLeod, 1976). The introduction of multi-channel CIs
had a great impact on the quality of the sound perceived by CI users and was
the greatest catalyst for improvements in speech perception. However many
factors can have an effect on the performance and outcome with a CI and some
of the most important and relevant design issues were characterised by
Grayden and Clark (2006) and Zeng et al. (2008) and fall into the following
categories:
1. Performance.
2. Reliability.
3. Safety.
1.2.1 Performance
1.2.1.1 CI specifications and performance
The CI devices have developed over the years into having closer specifications
across the different manufacturers (Zeng et al., 2008). Several changes have
been applied to the CI specifications in an attempt to enhance performance.
These include increasing the input dynamic range (the ratio between the
loudest and softest sounds that the speech processor will present at any given
time), widening the frequency range stimulated by CI, increasing the rate of
stimulation, back telemetry and practical modifications of the speech processor.
There was an increase in the input dynamic range (IDR) (and the delivered
frequency range for all systems. The IDR has increased from an initial 30 dB in
the Nucleus 22 device (from Cochlear) to 75-80 dB with a default setting of 45-
35
60 dB to better reflect the amplitude variations in real life listening situations
(Zeng et al., 2002; James et al., 2003; Dawson et al., 2007 and Spahr et al.,
2007).
The frequency range was widened and now incorporates frequencies lower
than 300 Hz in some systems, Zeng et al. (2008) argues that these changes
were applied in an attempt to enhance temporal pitch cues and tonal languages
perception that require cues in the fundamental frequency (F0) range (e.g. Fu,
Zeng, Shannon and Soli, 1998).
Rate of stimulation has increased mainly for AB (e.g. Frijns et al., 2003) and
MED-EL devices (e.g. Zeng et al., 2008) in an attempt to improve performance
(e.g. Frijns et al., 2003) although there isn’t clear evidence supporting that
assumption (e.g. Friesen et al., 2005). Cochlear devices on the other hand
haven’t increased rate of stimulation mainly because in contrast to AB and
MED-EL devices that have multiple current sources (up to 16 in AB and up to
24 in MED-EL) Cochlear devices have only one current source (Zeng et al.,
2008).
Back telemetry is an important feature that CI devices have added. It provides
information about the integrity of the internal device, the “electrode-tissue
interface” (Zeng et al., 2008) which include impedance telemetry (see Section
1.3.1 for detailed description) and neural response (more recent) such as
Neural Response Telemetry/Imaging (NRT in Cochlear and NRI in AB) and
Auditory Nerve Response Telemetry (ART in MED-EL). Neural response tests
(NRT/ NRI/ ART) can provide objective measures of the auditory-neural
response to the CI electrodes’ stimulation and can help in programming of the
speech processor especially of young children. They can also be used for
research purposes.
Other practical advancements included incorporating directional microphones
(e.g. Cochlear’s Freedom speech processor) or water resistance features (e.g.

36
Cochlear’s Nucleus 5 speech processor’s water resistance and AB’s Neptune
completely swimmable Neptune speech processor).
1.2.1.2 Array design and performance
Beyond the shift from single to multiple-electrode arrays, changes have been
implemented to the CI array design in an attempt to (1) enhance performance
by matching electrical stimulation to the tonotopic organisation of the cochlea
(e.g. long and thin electrode arrays for deep insertion) or by enhancing coupling
between electrodes and spiral ganglion (e.g. preformed arrays that hug the
modiolus) or (2) reduce insertion trauma (e.g. flexible electrode arrays such as
the FLEXsoft array from MED-EL). The physical attributes of the array changed
as surgical procedures evolved along with better understanding of cochlear
anatomical structures and electro-physiological factors that may affect CI
performance (Zeng et al., 2008). Since electrode array design affects surgical
insertion it will be discussed in detail in Section (2.2.4) along with surgical
insertion aspects.
1.2.1.3 Localization of current
This is considered by some manufacturers to be of importance in order to
ensure that stimulation is localized to specific regions of the auditory nerve
fibres. Stimulation mode can be referred to as electrode coupling, which can be
defined as “how electrodes are electrically connected to form an electrical
circuit; all consist of active and reference electrodes” (Wolfe and Schafer,
2010). The main types of stimulation or electrode coupling that are used are
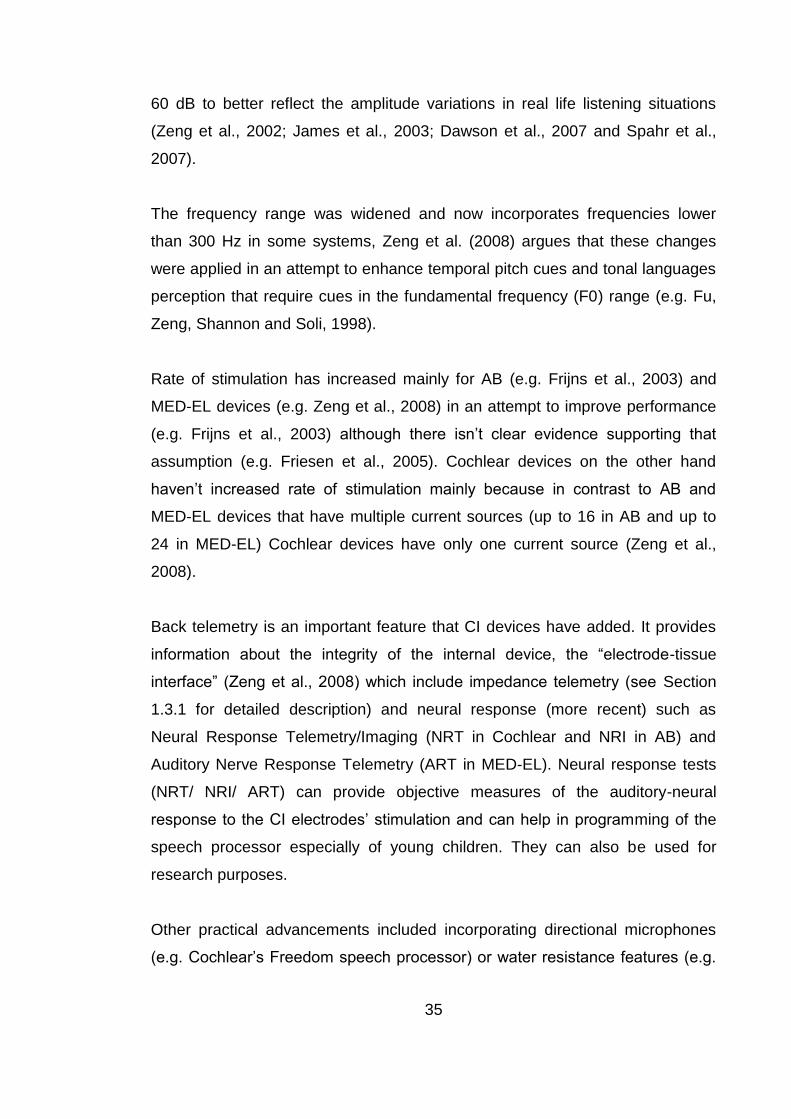
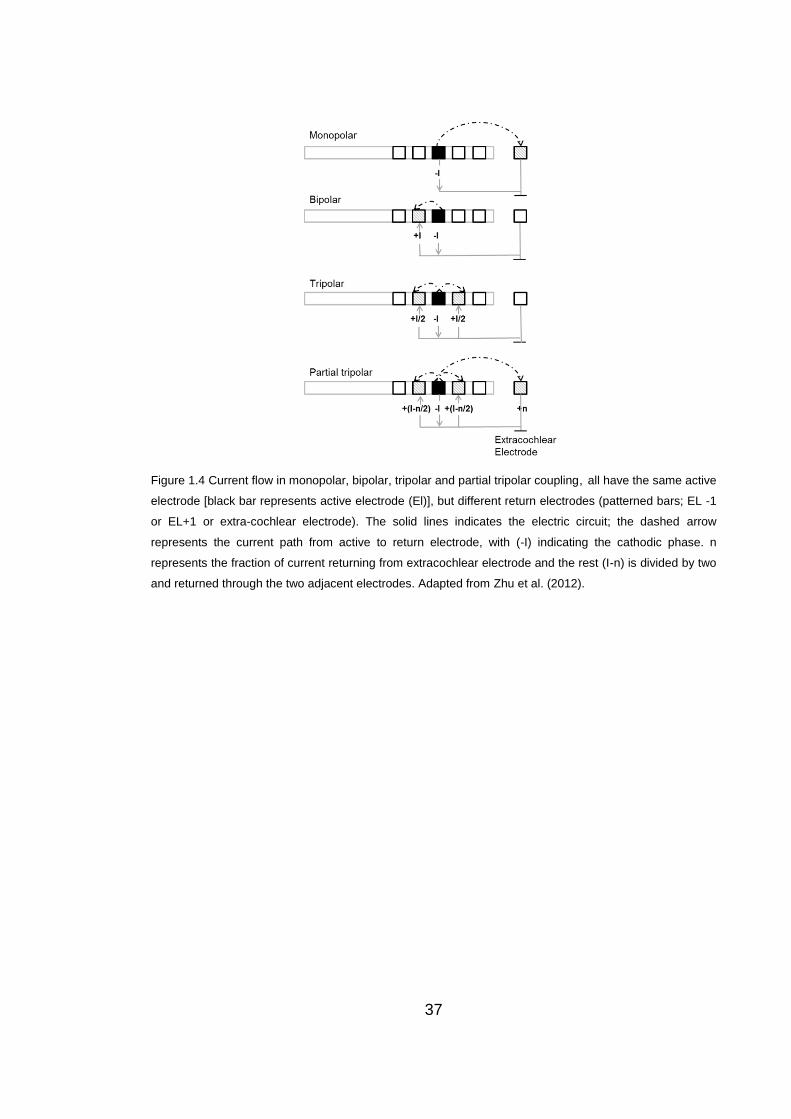
common ground, monopolar and bipolar (see Figure 1.4). Some companies
such as AB have introduced what they refer to as advanced electrode coupling
which potentially includes tripolar and quadro/partial tripolar polar coupling (e.g.
Zhu et al., 2012 and Bierer et al., 2011) (see Figure 1.4). For a comparison
between the different electrode coupling types see Table (1.1).
37
Figure 1.4 Current flow in monopolar, bipolar, tripolar and partial tripolar coupling, all have the same active
electrode [black bar represents active electrode (El)], but different return electrodes (patterned bars; EL -1
or EL+1 or extra-cochlear electrode). The solid lines indicates the electric circuit; the dashed arrow
represents the current path from active to return electrode, with (-I) indicating the cathodic phase. n
represents the fraction of current returning from extracochlear electrode and the rest (I-n) is divided by two
and returned through the two adjacent electrodes. Adapted from Zhu et al. (2012).

38
Table 1.1 Summary of the different types of stimulation, current flow and advantages.
Type of stimulation/ electrode
coupling Current flow
Advantages and/or current
localization
Common ground
Occurs between one electrode
and all the other electrodes in
the array.
Better current localization than
monopolar
Bipolar stimulation Occurs between a pair of
electrodes in the array.
Better localization than
monopolar.
Monopolar
Occurs between one electrode
in the array and at least one
extra-cochlear electrode.
Less localization than bipolar
and common ground but allows
for less energy consumption
Tripolar
Occurs between one electrode
as active and the two adjacent
electrodes in the array acting
as ground.
Claimed to have better
localization than bipolar and
common ground but greater
energy consumption making it
too impractical for
implementation.
Quadropolar/Partial tripolar
Occurs between one electrode
as active, the two adjacent
electrodes in the array and an
external electrode acting as
ground. A combination of
Tripolar and Monopolar.
Claimed to have localization as
good as tripolar but less
energy consumption than the
tripolar approach.
1.2.1.4 Power and data transmission
For transcutaneous transmission such as that used in current CI systems,
signal carriers are required; great care has to be taken to ensure that it does not
cause tissue damage; thus carriers must have as a low frequencies as possible
(e.g. 5 MHz for Cochlear Freedom devices, 12 MHz Med-El Sonata and 49 MHz
for AB HiRes90k). Another issue which needs to be considered is that of power
efficiency in order to prolong battery life, this can be achieved by improving the
transmitting and receiving coils’ designs (Zeng et al., 2008).

39
1.2.2 Reliability
Reliability is one of the major design concerns, considering that device failure is
the most frequent long-term complication (Parisier et al., 2001 and Cote et al.,
2007). All the CI components must endure prolonged use and frequent minute
movements of the different internal parts for a long time without breakage
especially at vulnerable points such as the juncture between the electrode array
and the receiver/stimulator package. This requires robust electronic
components and some flexibility of the moving parts to avoid wire breakage. To
overcome wire breakage problems, wires are made longer than required to
accommodate for movement and growth in children. Surgical techniques have
also been developed to help protect the receiver; a bony well is usually drilled in
the mastoid to house the receiver rather than leaving it protruding and exposed
to impact trauma to the head. This surgical technique made it necessary for
companies to make the stimulator smaller and thinner to ensure use in young
children with thinner skulls, this demand affected the implant design for all
systems. A decrease in device failure and increase in reliability is expected with
improved technology; however design problems may still occur such as leakage
of excessive moisture that could cause device failure (Cote et al., 2007).
Failures are classified into: (1) hard failures involving malfunction of the internal
components, (2) impact failure due to direct hits, which is more common in
children than adults and (3) soft failures where there is a decrement in auditory
performance, but the malfunction cannot be proven with available in-vivo tests
(Balkany et al., 2005 and Cote et al., 2007). Figure (1.5) below shows the
classification and definition of CI failures as categorized in the European
consensus statement on CI failure and explantation (2005). Impact failures were
reported to occur more frequently with ceramic implant housing as compared to
silicone and titanium housing (Gosepath et al., 2009). Device failures require
explantation and re-implantation of a new device which can have a negative
impact because of the disruption caused by the device failure and waiting time
to receive a new functioning implant. Especially in light of the finding that device
failure was the most common reason for CI non-use among implanted adults
40
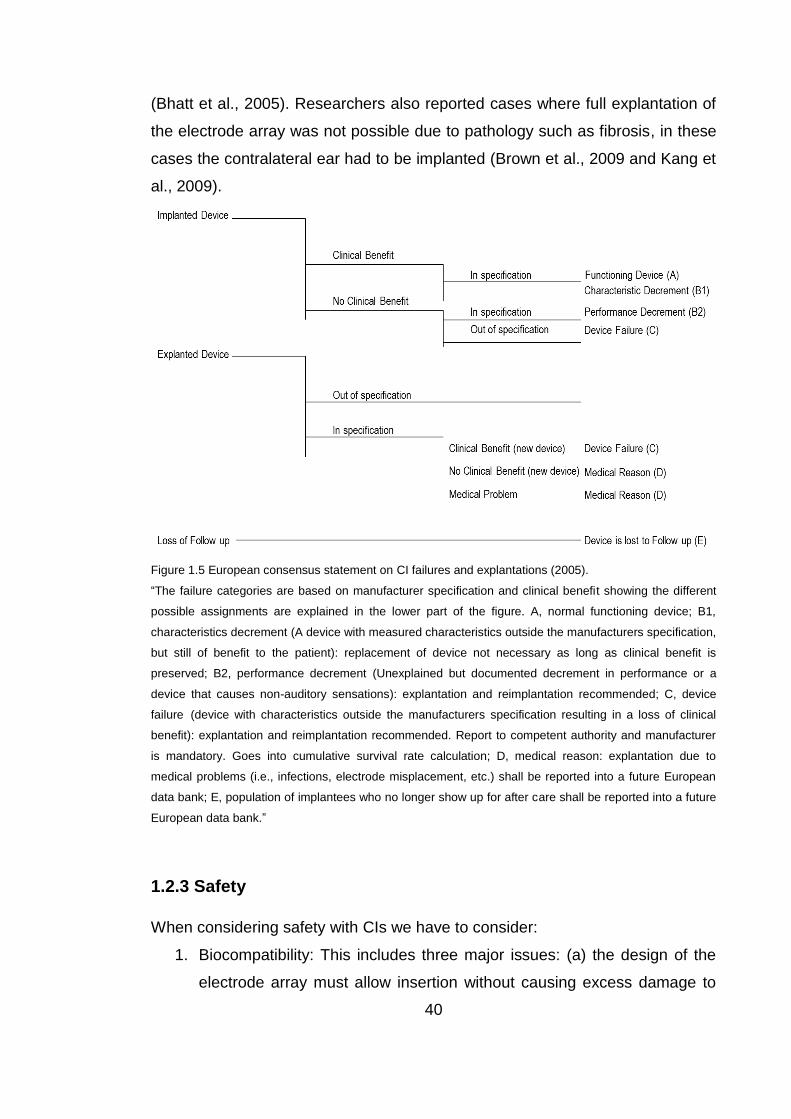
(Bhatt et al., 2005). Researchers also reported cases where full explantation of
the electrode array was not possible due to pathology such as fibrosis, in these
cases the contralateral ear had to be implanted (Brown et al., 2009 and Kang et
al., 2009).
Figure 1.5 European consensus statement on CI failures and explantations (2005).
“The failure categories are based on manufacturer specification and clinical benefit showing the different
possible assignments are explained in the lower part of the figure. A, normal functioning device; B1,
characteristics decrement (A device with measured characteristics outside the manufacturers specification,
but still of benefit to the patient): replacement of device not necessary as long as clinical benefit is
preserved; B2, performance decrement (Unexplained but documented decrement in performance or a
device that causes non-auditory sensations): explantation and reimplantation recommended; C, device
failure (device with characteristics outside the manufacturers specification resulting in a loss of clinical
benefit): explantation and reimplantation recommended. Report to competent authority and manufacturer
is mandatory. Goes into cumulative survival rate calculation; D, medical reason: explantation due to
medical problems (i.e., infections, electrode misplacement, etc.) shall be reported into a future European
data bank; E, population of implantees who no longer show up for after care shall be reported into a future
European data bank.”
1.2.3 Safety
When considering safety with CIs we have to consider:
1. Biocompatibility: This includes three major issues: (a) the design of the
electrode array must allow insertion without causing excess damage to
41
the cochlea (Richter et al., 2001 and Rebscher et al., 2008). This
therefore has an interactive relationship with the surgical procedures
used which will be discussed later in detail (Section 2.2), (b) the implant
components must be bio-compatible without causing any adverse tissue
reaction (toxic, immunological or injurious) (Harnack et al., 2004 and
Zeng et al., 2008) and (c) the material used must have certain
mechanical, electrical properties and must ensure hermetic isolation so
that the electrical parts are sealed and protected from bodily fluids and
salt (Zeng et al., 2008).
2. Sterilization: This would include the sterilization process, the material
used, which has to be designed and manufactured in a manner that
ensures tolerance for the sterilization process, and the implant design,
which has to avoid any pockets or spaces that could potentially collect
bacteria rendering the sterilization useless.
3. Mechanical safety: to avoid tissue injury; the design must be easy to
place and stabilize and the surface of the device must be soft, with round
corners in order to reduce internal tissue trauma and avoid long term
possible problems such as necrosis. This requires cooperation between
designers and surgeons (Zeng et al., 2008).
4. Energy exposure: Energy must be constrained to safe levels.
The electrical charge is a product of time and current, the limit of safe
electrical charge density (per cm2) is less than 15 to 65 μC/cm2/phase
(Leake et al., 1990 and Zeng et al., 2008). Safe heat limits have been
specified as no more than 39° centigrade for the internal implanted parts
(ISO 14708-1 part 17, 2000) and up to 41° centigrade for the external
parts contacting the skin (Zeng et al., 2008).
1.3 The fitting (programming) of the CI device
The CI speech processor analyses the signal and converts the acoustic input
into an electrical signal, which is customized for the individual CI recipient to
ensure optimised delivery of the information to the CI recipient. This is
42
accomplished by programming the CI speech processor through a designated
fitting station for each manufacturer (e.g. Skinner et al., 1995; Holden et al.,
2002; James et al., 2003; Dawson et al., 1997; Skinner et al., 1999 and Zeng et
al., 2008). In this section basic procedures involved in fitting will be briefly
described, for further details of a typical programming protocol see appendix A.
1.3.1 Impedance telemetry
Impedance telemetry has to be measured before the fitting (programming of the
speech processor) takes place. When measuring telemetry, resistance of each
of the electrodes in the CI array is measured; this electrical resistance can
affect the ability of each of the electrodes to deliver electrical stimulation to the
surrounding tissue. Changes in surrounding tissue can affect telemetry (e.g.
Hughes et al., 2001). Telemetry provides us with information about the function
of the CI electrodes, including which electrodes have a short circuit
(impedances too low), or an open circuit (impedances too high). These
problematic electrodes are usually switched off (deactivated) during routine
clinical fittings (e.g. Zeng et al., 2008).
1.3.2 Creating a CI program
When creating a CI program, certain parameters have to be set: (a) a speech
processing strategy has to be chosen (strategies will be described at length in
Section 1.4), (b) rate of stimulation per second can be chosen for some
strategies for some devices, but typically the default is used. The per channel
stimulation rate “refers to the number of biphasic pulses that are delivered to an
individual electrode contact within one second and is specified in pulses per
second (pps)” (Wolfe and Schafer, 2010, pp30), (c) the frequency table has to
be selected which determines the frequency range covered by the implant and
the frequency to electrode mapping of the stimulation (d) active electrodes, as
mentioned earlier electrodes with an open or short circuit are deactivated and
(e) the value of maxima or “n” in “n of m” strategies (not for all manufacturers)
(see Section 1.4.4) the maxima value refers to the number of electrodes being
stimulated per stimulation cycle. After choosing these parameters and a CI
43
program has been created, individualized stimulation levels have to be
determined.
1.3.3 Setting stimulation levels
Stimulation level is one of the most important parameters in the programming of
CIs. There are two stimulation levels that should be optimized for each CI
electrode (channel); the lower threshold (T or THR) levels and the upper
stimulation levels, also known as comfort or most comfortable (C or M or MCL)
levels (e.g. Dawson et al., 1997; Skinner et al., 1999 and Zeng et al., 2008).
Each manufacturer provides specific guidelines for setting these levels (see
appendix A for manufacturer specific guidelines), most of which are related to
the speech processing strategy employed by that specific manufacturer (Wolfe
and Schafer, 2010). Changing the stimulation level involves either changing the
current level or the pulse width of the electrical pulses used in stimulation.
1.4. Signal/speech processing strategies
The speech processing strategies and mapping options affect how the speech
processor transforms the sound input into electrical signals. CIs and speech
processors’ have design limitations that restrict the extent to which “normal
hearing” can be achieved. Different CI companies aim to overcome the
limitations with different approaches utilising different processing strategies in
an attempt to optimise electrical signal delivery to provide the greatest
information and thus the highest level of performance for the CI user.
All speech processing strategies have one thing in common: they represent the
spectral properties of sound by place of stimulation in the cochlea i.e. each
electrode represents the information in different frequency bands. They provide
the rules by which sounds are converted into electrical signals that stimulate the
auditory nerve. However, they are significantly diverse; they differ in terms of
number of stimulated electrodes in total and simultaneously, electrode to
frequency assignment, stimulus waveform, type of compression used, what
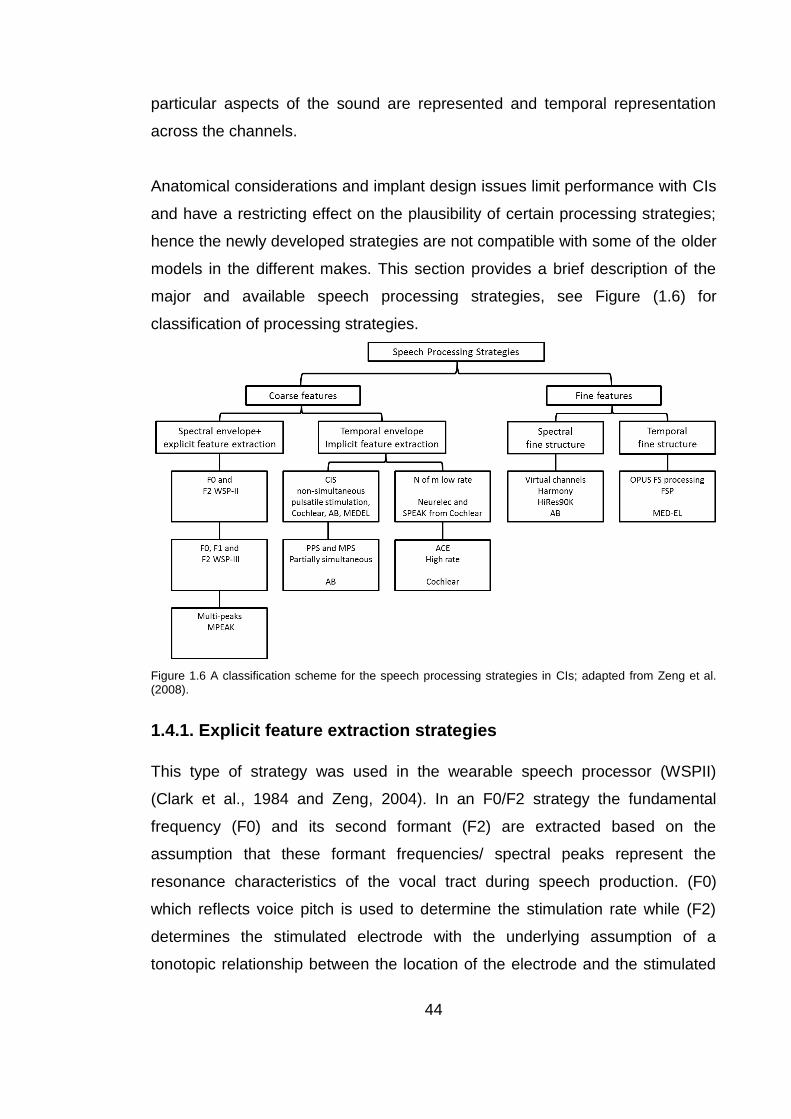
44
particular aspects of the sound are represented and temporal representation
across the channels.
Anatomical considerations and implant design issues limit performance with CIs
and have a restricting effect on the plausibility of certain processing strategies;
hence the newly developed strategies are not compatible with some of the older
models in the different makes. This section provides a brief description of the
major and available speech processing strategies, see Figure (1.6) for
classification of processing strategies.
Figure 1.6 A classification scheme for the speech processing strategies in CIs; adapted from Zeng et al. (2008).
1.4.1. Explicit feature extraction strategies
This type of strategy was used in the wearable speech processor (WSPII)
(Clark et al., 1984 and Zeng, 2004). In an F0/F2 strategy the fundamental
frequency (F0) and its second formant (F2) are extracted based on the
assumption that these formant frequencies/ spectral peaks represent the
resonance characteristics of the vocal tract during speech production. (F0)
which reflects voice pitch is used to determine the stimulation rate while (F2)
determines the stimulated electrode with the underlying assumption of a
tonotopic relationship between the location of the electrode and the stimulated
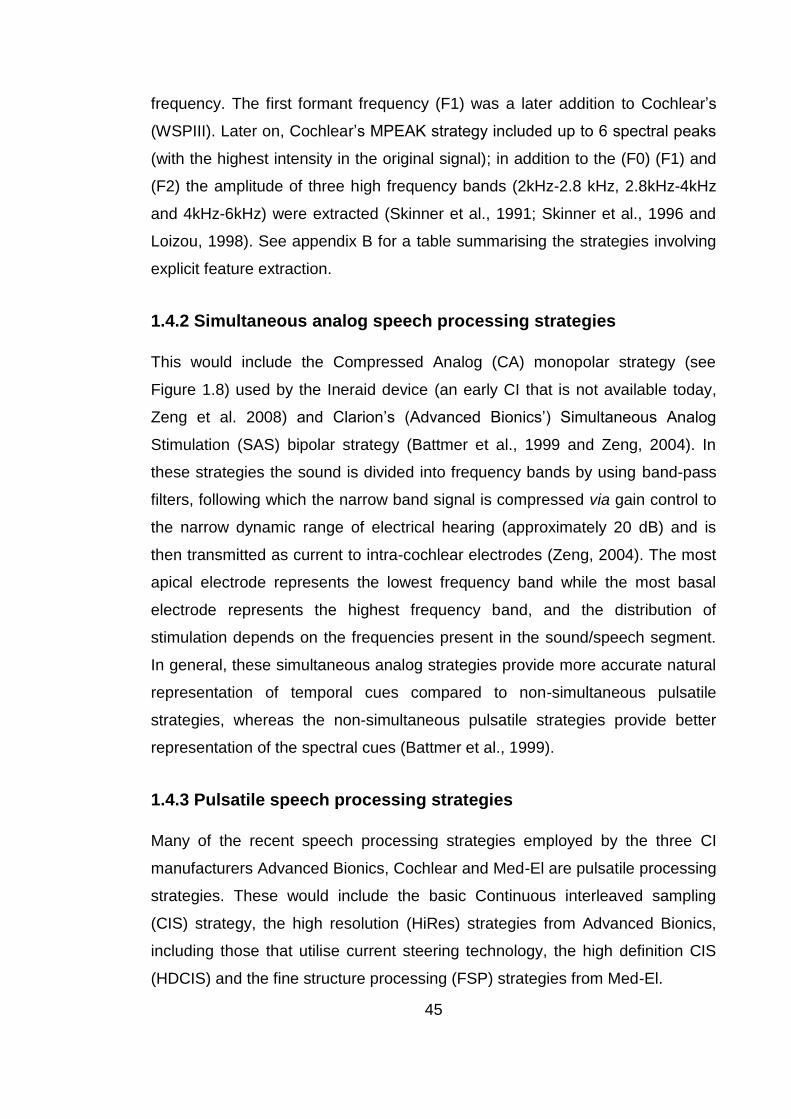
45
frequency. The first formant frequency (F1) was a later addition to Cochlear’s
(WSPIII). Later on, Cochlear’s MPEAK strategy included up to 6 spectral peaks
(with the highest intensity in the original signal); in addition to the (F0) (F1) and
(F2) the amplitude of three high frequency bands (2kHz-2.8 kHz, 2.8kHz-4kHz
and 4kHz-6kHz) were extracted (Skinner et al., 1991; Skinner et al., 1996 and
Loizou, 1998). See appendix B for a table summarising the strategies involving
explicit feature extraction.
1.4.2 Simultaneous analog speech processing strategies
This would include the Compressed Analog (CA) monopolar strategy (see
Figure 1.8) used by the Ineraid device (an early CI that is not available today,
Zeng et al. 2008) and Clarion’s (Advanced Bionics’) Simultaneous Analog
Stimulation (SAS) bipolar strategy (Battmer et al., 1999 and Zeng, 2004). In
these strategies the sound is divided into frequency bands by using band-pass
filters, following which the narrow band signal is compressed via gain control to
the narrow dynamic range of electrical hearing (approximately 20 dB) and is
then transmitted as current to intra-cochlear electrodes (Zeng, 2004). The most
apical electrode represents the lowest frequency band while the most basal
electrode represents the highest frequency band, and the distribution of
stimulation depends on the frequencies present in the sound/speech segment.
In general, these simultaneous analog strategies provide more accurate natural
representation of temporal cues compared to non-simultaneous pulsatile
strategies, whereas the non-simultaneous pulsatile strategies provide better
representation of the spectral cues (Battmer et al., 1999).
1.4.3 Pulsatile speech processing strategies
Many of the recent speech processing strategies employed by the three CI
manufacturers Advanced Bionics, Cochlear and Med-El are pulsatile processing
strategies. These would include the basic Continuous interleaved sampling
(CIS) strategy, the high resolution (HiRes) strategies from Advanced Bionics,
including those that utilise current steering technology, the high definition CIS
(HDCIS) and the fine structure processing (FSP) strategies from Med-El.

46
1.4.3.1 Continuous interleaved sampling (CIS)
Continuous interleaved sampling (CIS) is a non-simultaneous pulsatile strategy
that stimulates all active electrodes for each cycle (Wilson, 1993). It is available
on the majority of CI systems. It aims to extract and deliver temporal envelope
cues (Wilson et al., 1991and Zeng, 2004). The sound is first pre-emphasized “to
attenuate strong components in speech below 1.2 kHz” (Wilson and Blake,
2008) then is passed through a number of band-pass filters (BPF) (Wilson et al.,
1991). The temporal envelope for each of those waveforms is then extracted by
either half-wave or full-wave-rectification, followed by low-pass filtering (LPF);
or, more recently, by the Hilbert transform (Zeng, 2004 and Wilson and Dorman,
2008). These extracted envelopes undergo linear logarithmic compression to
map the signal into the narrow electric dynamic range (Loizou, 1998 and Zeng
et al., 2002).
The compressed envelope outputs are then used to modulate biphasic pulses
with amplitudes proportional to those of the envelopes and are delivered at a
rate that can vary from hundreds to thousands per second (Loizou, 1998 and
Zeng et al., 2008) see Figure (1.7). A key point in CIS is that each pulsatile
carrier interleaves with the other bands’ pulsatile carriers; only one electrode is
stimulated at any given time; thus, avoiding electrode interaction that could
cause smearing of the band specific envelope cues (Zeng, 2004 and Zeng et
al., 2008) and avoiding the problematic electrical-field interference caused by
simultaneous stimulation which was a concern with the early analog Ineraid
implant. Later, in Clarion’s Paired Pulsatile Sampler (PPS) and Multiple
Pulsatile Stimulation strategies, two or more distant electrodes could be
stimulated simultaneously by pulsatile carriers (Loizou et al., 2003). To see the
difference between pulses used in CIS and PPS, see Figures (1.8 and 1.9).
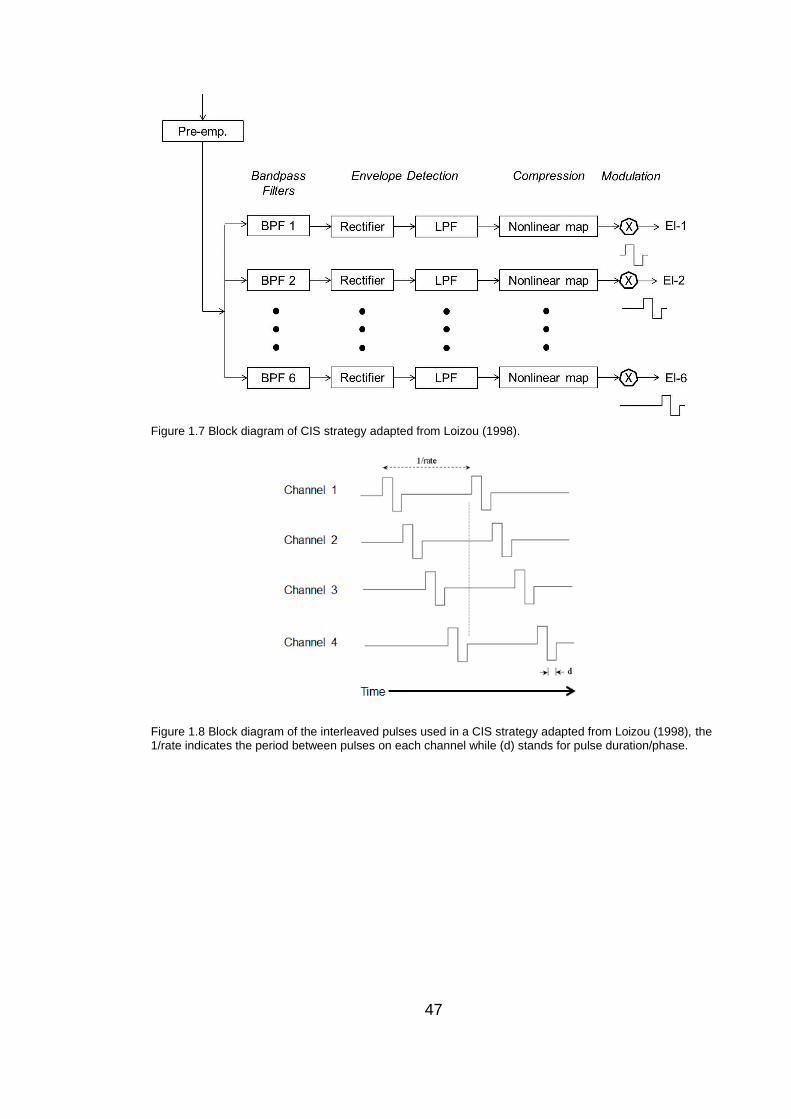
47
Figure 1.7 Block diagram of CIS strategy adapted from Loizou (1998).
Figure 1.8 Block diagram of the interleaved pulses used in a CIS strategy adapted from Loizou (1998), the 1/rate indicates the period between pulses on each channel while (d) stands for pulse duration/phase.
48
Figure 1.9 Block diagram of the pulses used in the PPS strategy adapted from Mishra (2000).
1.4.3.2 The High Resolution Strategy (HiRes)
This strategy is available with AB devices known as the Harmony implants (CII
and HiRes90k) and the Auria and Harmony sound processors. In this strategy in
the pre-processing stage, the audio input is sampled at 17400 Hz and
emphasized by the microphone (Nogueira et al., 2009). A dual loop Automatic
Gain Control (AGC) is then used to perform a digital AGC (Firszt, 2003). An
infinite impulse response (IIR) sixth order Butterworth filters is used to divide the
signal into frequency bands that range from 250 Hz to 8KHz (Firszt, 2003), the
centre frequencies for these bands are logarithmically spaced and each
frequency band is associated with a single electrode. Each of the filter outputs
are then half-wave rectified by setting the negative amplitudes to 0, then they’re
averaged for a Ts duration of a stimulation cycle (Nogueira et al., 2009). The
acoustic values obtained are then transferred into amplitudes of current that are
used to modulate biphasic pulses (Firszt, 2003, Buechner et al., 2006).
Since the system has 16 independent current sources, it allows for two or more
electrodes to be simultaneously stimulated (Firszt, 2003). In HiRes S (High
Resolution sequential) strategy all 16 electrodes are sequentially stimulated in
each stimulation cycle; thus avoiding channel interaction. The per channel

49
stimulation rate is uniform for all channels with a maximum value of around
2899 pulse per second (pps) (Firszt, 2003; Dunn et al., 2006 and Nogueira et
al.,2009); see Figure (1.10). In HiRes P (High Resolution paired) two non-
adjacent pairs of electrodes are simultaneously stimulated increasing the
maximum per channel stimulation rate to 5,156 pps (Firszt, 2003 and Dunn et
al., 2006).
Figure 1.10 Block diagram of Hi-Res strategy courtesy of AB.
1.4.3.3 Signal processing strategies using current steering
The Fidelity HiRes120 strategy can be used with a Harmony speech processor
and Harmony AB implants. In this strategy it is hypothesised that frequency
resolution is increased by using current steering. Current steering is based on
the observation that subjects were able to distinguish several distinct pitches
between two electrodes when these electrodes were simultaneously stimulated
(Donaldson et al., 2005). In current steering the proportion of current is varied
for each of the adjacent electrode pairs to create the percept of different
pitches. 15 electrode pairs are used in stimulation when all 16 electrodes are
switched on, 8 distinct stimulation places (bands) are created between each
electrode pair with a maximum of 120 possible stimulation sites. See Figure
(1.11) below demonstrating current steering.
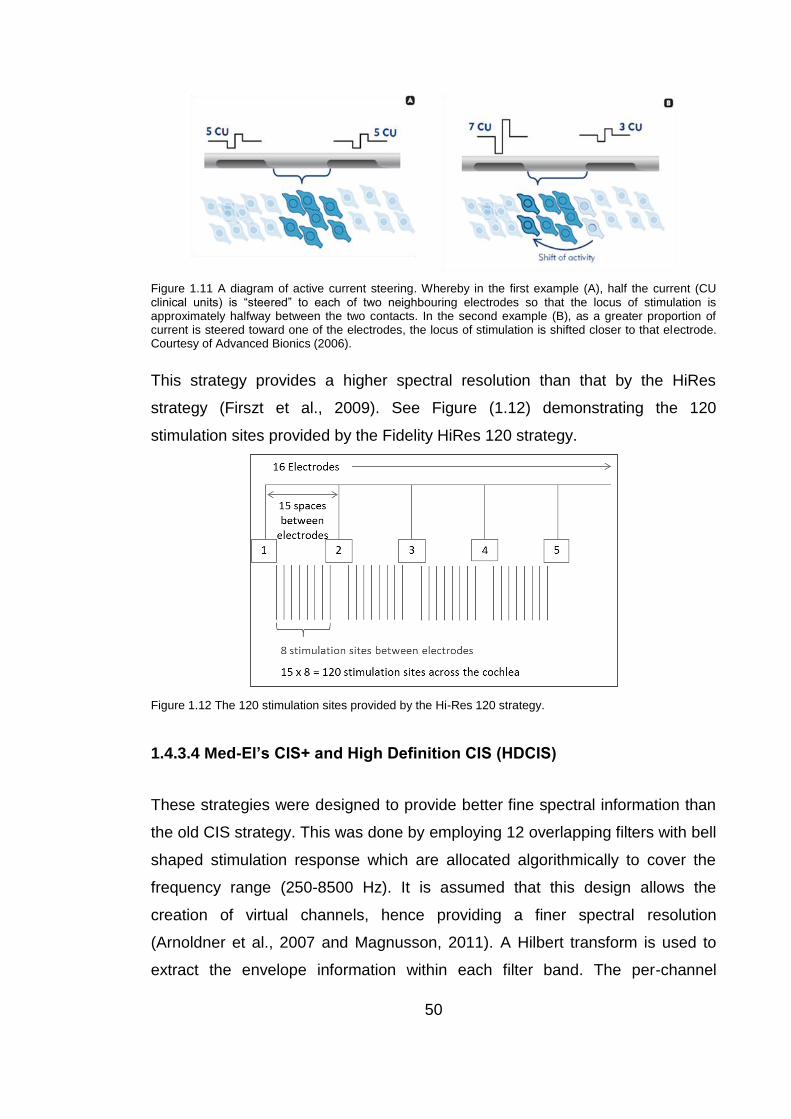
50
Figure 1.11 A diagram of active current steering. Whereby in the first example (A), half the current (CU clinical units) is “steered” to each of two neighbouring electrodes so that the locus of stimulation is approximately halfway between the two contacts. In the second example (B), as a greater proportion of current is steered toward one of the electrodes, the locus of stimulation is shifted closer to that electrode. Courtesy of Advanced Bionics (2006).
This strategy provides a higher spectral resolution than that by the HiRes
strategy (Firszt et al., 2009). See Figure (1.12) demonstrating the 120
stimulation sites provided by the Fidelity HiRes 120 strategy.
Figure 1.12 The 120 stimulation sites provided by the Hi-Res 120 strategy.
1.4.3.4 Med-El’s CIS+ and High Definition CIS (HDCIS)
These strategies were designed to provide better fine spectral information than
the old CIS strategy. This was done by employing 12 overlapping filters with bell
shaped stimulation response which are allocated algorithmically to cover the
frequency range (250-8500 Hz). It is assumed that this design allows the
creation of virtual channels, hence providing a finer spectral resolution
(Arnoldner et al., 2007 and Magnusson, 2011). A Hilbert transform is used to
extract the envelope information within each filter band. The per-channel

51
stimulation rate is uniform across all channels and can go up to 1500 pps in the
CIS+ strategy and up to 3000 pps in the HDCIS strategy (Magnusson, 2011).
1.4.3.5 Med-El’s Fine Structure Processing FSP
FSP is very similar to the HDCIS strategy with the exception of the lower 1-3
channels which use “channel specific sampling sequence” (CSSS). Unlike
envelope-based processing strategies, these CSSS channels were designed so
that FSP provides envelope information as well as fine structure. The fixed
sampling rate is substituted by CSSS, where stimulation pulses start only at
each positive zero crossing within each frequency band’s filter output (Arnoldner
et al., 2007 and Magnusson, 2011). The stimulation pulses for these CSSS
channels are also interleaved with the other electrodes to avoid unwanted
interaction. The FSP strategy usually covers the frequency range 100-8500Hz
(Magnusson, 2011).
1.4.4 N of m strategies
The spectral peak (SPEAK) and advanced combination encoder (ACE) are n of
m strategies, where (n) is the number of electrodes that is stimulated for each
cycle and (m) is the number of filters and usually n<m. The main differences
between a CIS strategy and an n of m strategy are: (1) the n of m strategy has a
greater number of pass band filters than the CIS and (2) n of m is based on
explicit temporal frames typically between 2.5-4 ms whilst the CIS strategy does
not have an explicit frame (Zeng et al., 2008). In each frame an ‘n’ number of
bands with the largest amplitude are selected, then envelopes of those selected
bands are logarithmically compressed and used to determine the pulse’s
current level for each band. Each of these biphasic pulses is interleaved from
other bands’ pulses while the frame rate determines the per-channel stimulation
rate. If n = m then the strategies such as SPEAK and ACE are not so different
from a CIS strategy (Zeng et al., 2008). Among the CI manufacturers, Cochlear
employs SPEAK and ACE strategies and Neurelec also employs an n of m

52
processing strategy. See Figure (1.13) demonstrating how the n of m strategy
works.
Figure 1.13 Block diagram of n of m strategy; courtesy of Zeng et al. (2008).
1.4.4.1 Spectral peak (SPEAK) strategy
This strategy was developed and used by Cochlear, it uses 20 filters covering
the centre frequencies from 200 to 10,000 Hz; each filter has a corresponding
electrode on the array with the lowest frequency band assigned to the most
apical electrode (Skinner et al., 1994 and Skinner et al., 1996). Depending on
the acoustic input, the number of spectral maxima will differ so that only those
electrodes representing filters that have speech components with the highest
amplitudes are stimulated in each cycle. In the SPEAK strategy maxima can
take the values between 6 and 9 (Skinner et al., 2002). The SPEAK strategy
has a fixed per-channel stimulation rate of 250Hz and a fixed inter-pulse interval
(IPI) of 45 µsec; the relatively high IPI was chosen to decrease thresholds and
current requirement (Shepherd and Javel, 1999 and Skinner et al., 2002).
The SPEAK, in comparison to the CIS, strategy provides more spectral details
but less temporal details due to the relatively low per-channel stimulation rate of
250 Hz (Zeng et al., 2008).
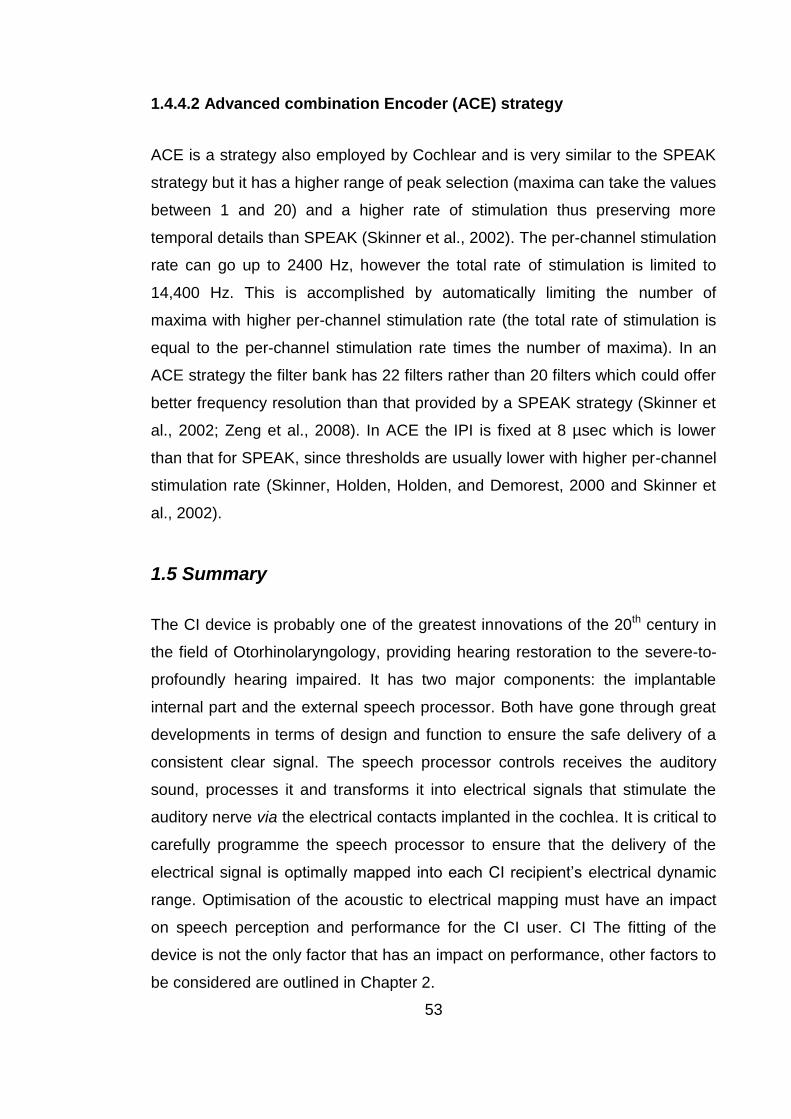
53
1.4.4.2 Advanced combination Encoder (ACE) strategy
ACE is a strategy also employed by Cochlear and is very similar to the SPEAK
strategy but it has a higher range of peak selection (maxima can take the values
between 1 and 20) and a higher rate of stimulation thus preserving more
temporal details than SPEAK (Skinner et al., 2002). The per-channel stimulation
rate can go up to 2400 Hz, however the total rate of stimulation is limited to
14,400 Hz. This is accomplished by automatically limiting the number of
maxima with higher per-channel stimulation rate (the total rate of stimulation is
equal to the per-channel stimulation rate times the number of maxima). In an
ACE strategy the filter bank has 22 filters rather than 20 filters which could offer
better frequency resolution than that provided by a SPEAK strategy (Skinner et
al., 2002; Zeng et al., 2008). In ACE the IPI is fixed at 8 µsec which is lower
than that for SPEAK, since thresholds are usually lower with higher per-channel
stimulation rate (Skinner, Holden, Holden, and Demorest, 2000 and Skinner et
al., 2002).
1.5 Summary
The CI device is probably one of the greatest innovations of the 20th century in
the field of Otorhinolaryngology, providing hearing restoration to the severe-to-
profoundly hearing impaired. It has two major components: the implantable
internal part and the external speech processor. Both have gone through great
developments in terms of design and function to ensure the safe delivery of a
consistent clear signal. The speech processor controls receives the auditory
sound, processes it and transforms it into electrical signals that stimulate the
auditory nerve via the electrical contacts implanted in the cochlea. It is critical to
carefully programme the speech processor to ensure that the delivery of the
electrical signal is optimally mapped into each CI recipient’s electrical dynamic
range. Optimisation of the acoustic to electrical mapping must have an impact
on speech perception and performance for the CI user. CI The fitting of the
device is not the only factor that has an impact on performance, other factors to
be considered are outlined in Chapter 2.
54
Chapter 2
Factors affecting performance with CIs
Speech perception abilities of adult CI users vary widely from those with very
little or no “open set” (not from a closed set and without cues including visual
cues) speech understanding when listening without lip-reading to those that
have open set speech understanding, even in the presence of competing noise.
This disparity in performance can be attributed to several factors, some of which
are related to individual characteristics (referred to as subject dependent factors
from here on in) (e.g. Waltzman et al., 1995; Blamey et al., 1992; Friedland et
al., 2010 and Blamey et al., 2013) and others that are device related or
dependent upon surgical insertion (e.g. Finley and Skinner, 2008). The
importance of identifying these factors is apparent at both the pre-implantation
stage when considering candidacy of an individual and post-implantation for
patient management and fitting (Summerfield and Marshall, 1995). During the
pre-implantation evaluation candidacy may be affected by prediction of
prognosis with CI or it may guide counselling of potential candidates to have
realistic expectations and could assist the clinical team when choosing which
ear to implant (Friedland et al., 2003). In the post-implantation management
process, if factors affecting performance are identified it can help clinicians
derive performance expectations and intervene with rehabilitation of fitting
modifications when outcomes do not reach the expected level. (Zwolan et al.,
1997).
2.1 Subject dependent factors
Some individual characteristics such as age, cognitive abilities, duration of
deafness and aetiology of deafness can have an impact on performance.
55
2.1.1 Age
There have been several studies looking at the effect of age at implantation
(AAI) on post CI performance among adults; they mainly compared the
performance of younger adults versus that of older adults. However, the
“elderly” age-group was defined differently across the studies; for example it
was above 55 years in Chan et al.’s study (2004), just above 60 years in Shin et
al.’s study (2000), equal to or more than 65 years in Labadie et al’s study (2000)
and Friedland et al.’s study (2010), greater than 65 years in Pasanisi’s study
(2003) and above 70 years in Chatelin et al. (2004), Blamey et al. (2013) and
Lenarz et al. (2012) studies. Despite the different criteria adopted to define the
“older” group across the different research studies conducted in this area and
the diversity in the performance measures used in the different studies, most
studies have found that there was a significant improvement in speech
perception for the majority of implantees in the older group after receiving their
CI CI(Labadie et al., 2000; Shin et al., 2000; Pasanisi et al., 2003; Chatelin et
al., 2004; Orabi et al., 2006; Chan et al., 2007, Friedland et al., 2010 and
Lenarz et al., 2012).
Some researchers did not report a difference in post-implantation performance
between the older and younger adults (Labadie et al., 2000; Shin et al., 2000;
Pasanisi et al., 2003 and Chan et al., 2007). However closer inspection showed
that some had a relatively small sample size; Shin et al. (2000) had a sample of
27; both Labadie et al. (2000) and Pasanisi et al. (2003) had 16 elderly
individuals and Chan et al. (2007) had a sample of 14 elderly recipients.
Another issue is the fact that the older and younger groups were not matched
for duration of deafness and pre-implantation audiological or speech perception
levels in those studies. Although the groups were matched for duration in
deafness in Chan et al.’s study (2007), however the performance measure used
by Chan et al. allowed for a ceiling effect because the highest score given for
speech perception was defined as speech recognition >50%; i.e. the highest
possible score of 7 out of 7 covered a speech recognition range of 51-100%
which will mask any differences across that large range.
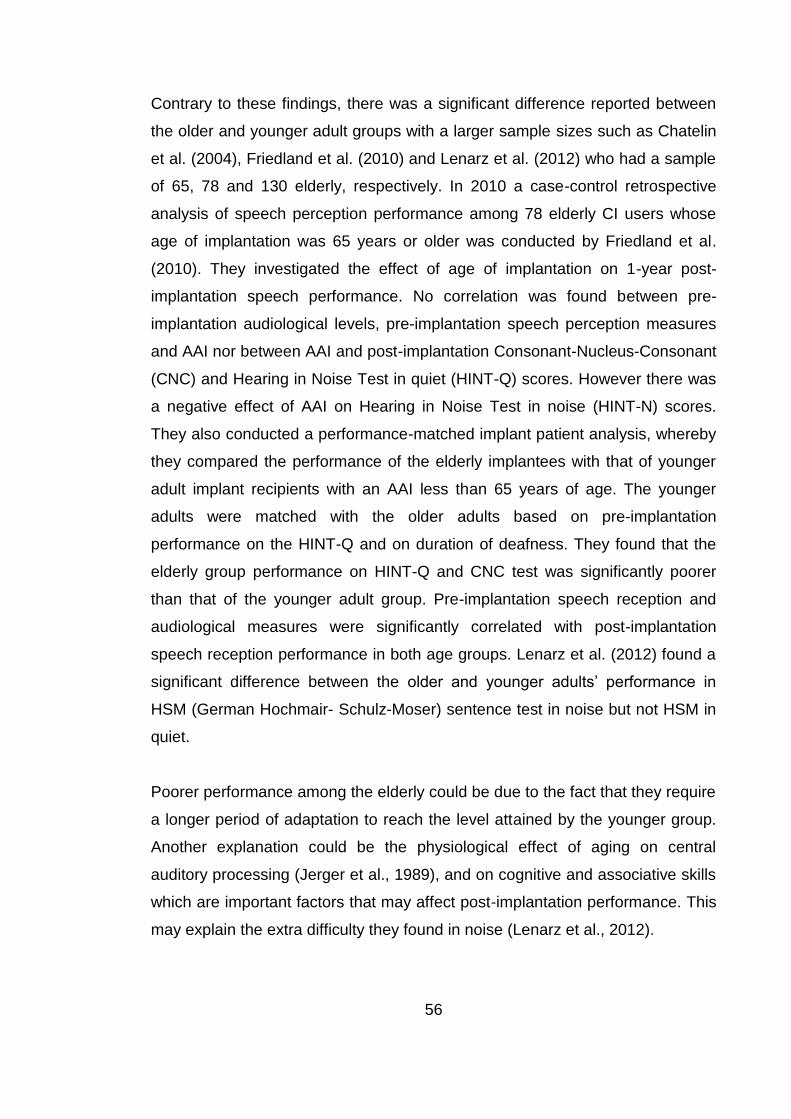
56
Contrary to these findings, there was a significant difference reported between
the older and younger adult groups with a larger sample sizes such as Chatelin
et al. (2004), Friedland et al. (2010) and Lenarz et al. (2012) who had a sample
of 65, 78 and 130 elderly, respectively. In 2010 a case-control retrospective
analysis of speech perception performance among 78 elderly CI users whose
age of implantation was 65 years or older was conducted by Friedland et al.
(2010). They investigated the effect of age of implantation on 1-year post-
implantation speech performance. No correlation was found between pre-
implantation audiological levels, pre-implantation speech perception measures
and AAI nor between AAI and post-implantation Consonant-Nucleus-Consonant
(CNC) and Hearing in Noise Test in quiet (HINT-Q) scores. However there was
a negative effect of AAI on Hearing in Noise Test in noise (HINT-N) scores.
They also conducted a performance-matched implant patient analysis, whereby
they compared the performance of the elderly implantees with that of younger
adult implant recipients with an AAI less than 65 years of age. The younger
adults were matched with the older adults based on pre-implantation
performance on the HINT-Q and on duration of deafness. They found that the
elderly group performance on HINT-Q and CNC test was significantly poorer
than that of the younger adult group. Pre-implantation speech reception and
audiological measures were significantly correlated with post-implantation
speech reception performance in both age groups. Lenarz et al. (2012) found a
significant difference between the older and younger adults’ performance in
HSM (German Hochmair- Schulz-Moser) sentence test in noise but not HSM in
quiet.
Poorer performance among the elderly could be due to the fact that they require
a longer period of adaptation to reach the level attained by the younger group.
Another explanation could be the physiological effect of aging on central
auditory processing (Jerger et al., 1989), and on cognitive and associative skills
which are important factors that may affect post-implantation performance. This
may explain the extra difficulty they found in noise (Lenarz et al., 2012).
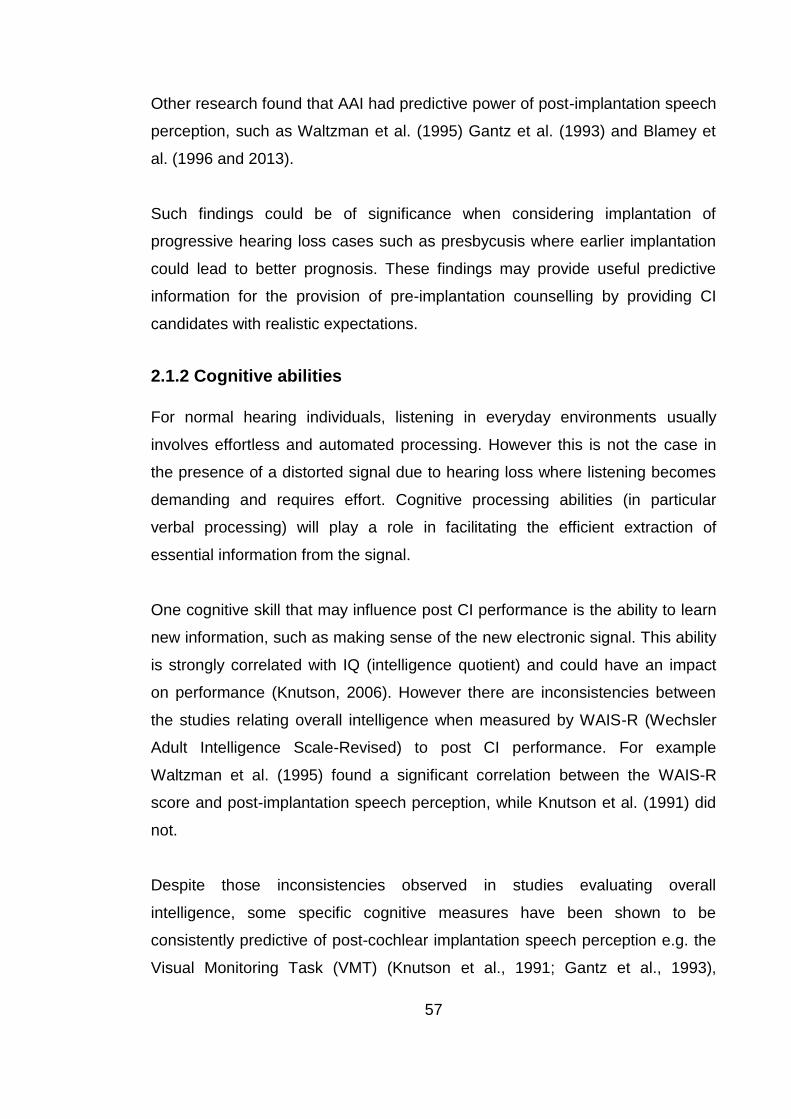
57
Other research found that AAI had predictive power of post-implantation speech
perception, such as Waltzman et al. (1995) Gantz et al. (1993) and Blamey et
al. (1996 and 2013).
Such findings could be of significance when considering implantation of
progressive hearing loss cases such as presbycusis where earlier implantation
could lead to better prognosis. These findings may provide useful predictive
information for the provision of pre-implantation counselling by providing CI
candidates with realistic expectations.
2.1.2 Cognitive abilities
For normal hearing individuals, listening in everyday environments usually
involves effortless and automated processing. However this is not the case in
the presence of a distorted signal due to hearing loss where listening becomes
demanding and requires effort. Cognitive processing abilities (in particular
verbal processing) will play a role in facilitating the efficient extraction of
essential information from the signal.
One cognitive skill that may influence post CI performance is the ability to learn
new information, such as making sense of the new electronic signal. This ability
is strongly correlated with IQ (intelligence quotient) and could have an impact
on performance (Knutson, 2006). However there are inconsistencies between
the studies relating overall intelligence when measured by WAIS-R (Wechsler
Adult Intelligence Scale-Revised) to post CI performance. For example
Waltzman et al. (1995) found a significant correlation between the WAIS-R
score and post-implantation speech perception, while Knutson et al. (1991) did
not.
Despite those inconsistencies observed in studies evaluating overall
intelligence, some specific cognitive measures have been shown to be
consistently predictive of post-cochlear implantation speech perception e.g. the
Visual Monitoring Task (VMT) (Knutson et al., 1991; Gantz et al., 1993),
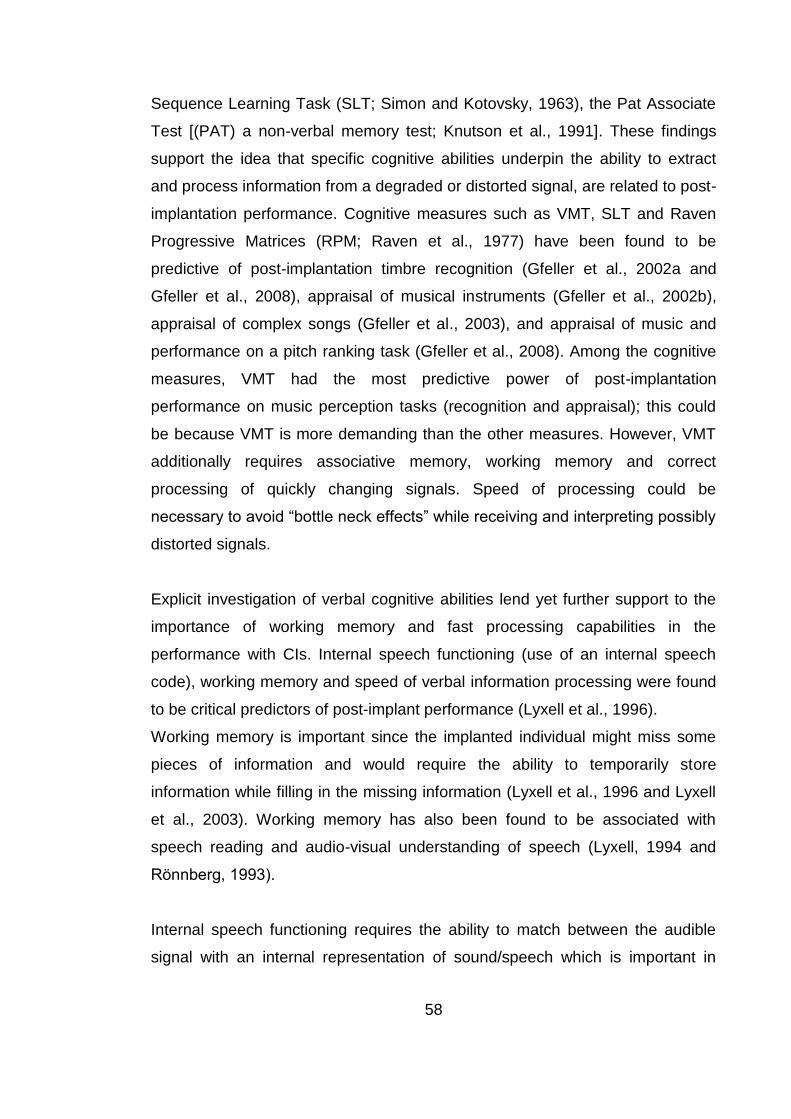
58
Sequence Learning Task (SLT; Simon and Kotovsky, 1963), the Pat Associate
Test [(PAT) a non-verbal memory test; Knutson et al., 1991]. These findings
support the idea that specific cognitive abilities underpin the ability to extract
and process information from a degraded or distorted signal, are related to post-
implantation performance. Cognitive measures such as VMT, SLT and Raven
Progressive Matrices (RPM; Raven et al., 1977) have been found to be
predictive of post-implantation timbre recognition (Gfeller et al., 2002a and
Gfeller et al., 2008), appraisal of musical instruments (Gfeller et al., 2002b),
appraisal of complex songs (Gfeller et al., 2003), and appraisal of music and
performance on a pitch ranking task (Gfeller et al., 2008). Among the cognitive
measures, VMT had the most predictive power of post-implantation
performance on music perception tasks (recognition and appraisal); this could
be because VMT is more demanding than the other measures. However, VMT
additionally requires associative memory, working memory and correct
processing of quickly changing signals. Speed of processing could be
necessary to avoid “bottle neck effects” while receiving and interpreting possibly
distorted signals.
Explicit investigation of verbal cognitive abilities lend yet further support to the
importance of working memory and fast processing capabilities in the
performance with CIs. Internal speech functioning (use of an internal speech
code), working memory and speed of verbal information processing were found
to be critical predictors of post-implant performance (Lyxell et al., 1996).
Working memory is important since the implanted individual might miss some
pieces of information and would require the ability to temporarily store
information while filling in the missing information (Lyxell et al., 1996 and Lyxell
et al., 2003). Working memory has also been found to be associated with
speech reading and audio-visual understanding of speech (Lyxell, 1994 and
Rӧnnberg, 1993).
Internal speech functioning requires the ability to match between the audible
signal with an internal representation of sound/speech which is important in
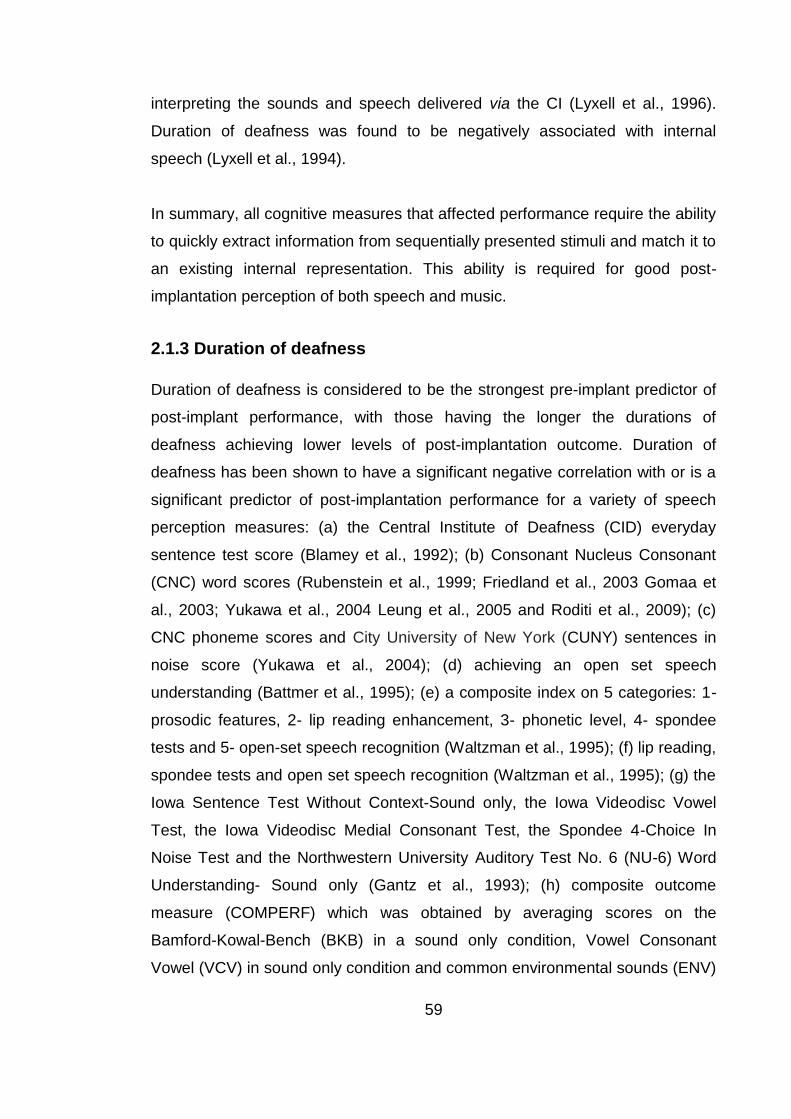
59
interpreting the sounds and speech delivered via the CI (Lyxell et al., 1996).
Duration of deafness was found to be negatively associated with internal
speech (Lyxell et al., 1994).
In summary, all cognitive measures that affected performance require the ability
to quickly extract information from sequentially presented stimuli and match it to
an existing internal representation. This ability is required for good post-
implantation perception of both speech and music.
2.1.3 Duration of deafness
Duration of deafness is considered to be the strongest pre-implant predictor of
post-implant performance, with those having the longer the durations of
deafness achieving lower levels of post-implantation outcome. Duration of
deafness has been shown to have a significant negative correlation with or is a
significant predictor of post-implantation performance for a variety of speech
perception measures: (a) the Central Institute of Deafness (CID) everyday
sentence test score (Blamey et al., 1992); (b) Consonant Nucleus Consonant
(CNC) word scores (Rubenstein et al., 1999; Friedland et al., 2003 Gomaa et
al., 2003; Yukawa et al., 2004 Leung et al., 2005 and Roditi et al., 2009); (c)
CNC phoneme scores and City University of New York (CUNY) sentences in
noise score (Yukawa et al., 2004); (d) achieving an open set speech
understanding (Battmer et al., 1995); (e) a composite index on 5 categories: 1-
prosodic features, 2- lip reading enhancement, 3- phonetic level, 4- spondee
tests and 5- open-set speech recognition (Waltzman et al., 1995); (f) lip reading,
spondee tests and open set speech recognition (Waltzman et al., 1995); (g) the
Iowa Sentence Test Without Context-Sound only, the Iowa Videodisc Vowel
Test, the Iowa Videodisc Medial Consonant Test, the Spondee 4-Choice In
Noise Test and the Northwestern University Auditory Test No. 6 (NU-6) Word
Understanding- Sound only (Gantz et al., 1993); (h) composite outcome
measure (COMPERF) which was obtained by averaging scores on the
Bamford-Kowal-Bench (BKB) in a sound only condition, Vowel Consonant
Vowel (VCV) in sound only condition and common environmental sounds (ENV)

60
(Summerfield and Marshall, 1995); (i) BKB sentence score (Green et al., 2007)
and (j) VCV and phrase speech intelligibility tests (Hiraumi et al., 2007).
These findings could be explained by the effect of the duration of deafness on
the residual auditory nerve viability and the integrity of the auditory cortex and
memory for sound. Other supporting evidence was provided by Nadol et al. in
1989; they found a correlation between spiral ganglion cell count and the
duration of deafness.
Spiral ganglion cell survival may affect the spectral resolution of the electrical
signal perceived by the CI recipient. In addition, spiral ganglion cell survival has
been hypothesised to be important for retaining the integrity of the central
auditory pathway (Rubenstein et al., 1999). Gomaa et al. (2003) found a
correlation between pre-implantation CID sentence perception and post-
implantation CNC scores, these findings lend support to the hypothesis that
residual speech perception “act as a trophic factor” that protects the viability of
the ganglion cells and subsequently the auditory pathway.
However these findings should be treated cautiously, especially if we consider
studies that have demonstrated that the effect of duration of deafness on post-
implantation speech perception is not ear specific but rather reflects the overall
auditory function; residual hearing in the non-implanted ear has a positive effect
on post-implantation speech perception (Friedland et al., 2003; Francis et al.,
2004). These findings may imply that the effect of duration of deafness on
performance is due to the importance of the central auditory pathway integrity
and memory for sound rather than spiral ganglion survival.
The above findings can provide guidance during the evaluation process for
candidacy for cochlear implantation, help predict prognosis and determine
which ear to implant.
61
2.1.4 Aetiology of deafness
A limited number of studies looking at factors affecting performance with CIs
have evaluated the aetiology of deafness as a possible factor. They either found
no significant relationship between the cause of deafness and performance
(Blamey et al., 1992; Green et al., 2007 and Nikolopoulos et al., 2012) or
reported a relatively weak effect (Battmer et al., 1995 and Blamey et al., 1996).
However, there were numerous studies that have evaluated post-implantation
performance in sub-groups with specific aetiologies such as meningitis
(Philippon et al., 2009 and Durisin et al., 2010), otosclerosis (Rotteveel et al.,
2010), Cogan’s syndrome (Bovo et al., 2011; Kontorinis et al., 2010; Pasanisi et
al., 2003; Wang et al., 2010), Ménière's disease (Lustig et al., 2003). They
found that aetiology does not affect performance per se; however when
pathological changes secondary to the aetiology of the hearing loss such as
cochlear ossification occurred, those changes had a negative impact on post-
implantation performance. Fibrous or bone obliterations of the cochlea in
Cogan’s syndrome, cochlear ossification in meningitis, osteospongiosis and
sclerosis in otosclerosis may lead to difficulties in the surgical insertion of the
array resulting in partial insertions which reduces the number of active
electrodes; these in turn may affect performance (Cohen and Waltzman, 1993;
Hartrampf et al., 1995; Rotteveel et al., 2005 and Rotteveel et al., 2010). These
pathological changes may also alter the CI current distribution (Rotteveel et al.,
2010). Nadol and Hsu (1991) found a strong inverse relationship between the
degree of calcification and spiral ganglion cell count in 6 temporal bones of
people who had suffered from severe sensorineural hearing loss secondary to
meningogenic labyrinthitis. Aetiology of deafness can shed some light on post-
implantation prognosis and can affect programming of CIs mainly due to the
underlying pathology secondary to aetiology, for example the deactivation of
electrodes in cases of facial nerve stimulation in otosclerosis (Rotteveel et al.,
2010).

62
2.2 Surgical placement of the electrode array
Recent evidence suggests that optimum placement of the electrode array in the
cochlea may positively affect the outcome with a CIs (Finley and Skinner,
2008). When addressing placement of the electrode array, two related issues
are considered: surgical aspects and electrode array design. Surgical
techniques and considerations have developed over recent years however
placement of the array in the cochlea is still influenced by the array design (e.g.
Rebscher et al., 2008).
In the following sections these surgical (Sections 2.2.1 – 2.2.3) and design
issues (Section 2.2.4) are explored further.
2.2.1 Scala tympani versus scala vestibuli surgical placement
The standard surgical approach in cochlear implantation is to insert the
electrode array into the scala tympani. However there are situations where the
surgeon intentionally places the electrode array in the scala vestibuli (SV),
typically where the scala tympani (ST) is not patent. This includes obstruction
due to fibrosis or ossification after temporal bone fracture, meningitis or severe
otosclerosis. Typically the outcomes in these cases are comparable to those
obtained when the electrode is placed in the scala tympani (Barrettini et al.,
2002; Kiefer et al., 2000 and Lin, 2009). However, the same is not true when
the intended position of the array is the ST but cross-over of the array to the SV
occurs during insertion. This typically leads to poorer speech perception scores
(Skinner et al., 2007 and Finley and Skinner, 2008). Explanations include
mechanical damage causing spiral ganglion cell loss, disruption of the basilar
membrane (BM) or cross-turn stimulation. Finley and Skinner (2008) found a
relationship between decreased speech perception (CNC word recognition
scores) and deeper insertion of the electrode array. They also found deeper
insertions to be associated with confused pitch of the apical electrodes in an
electrode discrimination task. Gantz and Turner (2003) and Turner et al. (2004)
emphasize the importance of surgical procedure, especially the positioning of
the hybrid electrode array within the scala tympani so as not to interfere with the
normal mechanical function of the basilar membrane and the travelling wave.
63
They took care in not damaging the round window membrane and avoiding loss
of perilymph to preserve residual natural hearing.
2.2.2 Depth of insertion
There have been numerous studies that have evaluated the effect of insertion
depth of CI arrays on speech perception. These include simulation studies on
normally hearing individuals (Fu and Shannon, 1999a and Rosen et al., 1999)
and in vivo studies of post-implanted individuals (Blamey et al., 1992; Yukawa
et al., 2004; Skinner et al., 2007 and Finley and Skinner, 2008). Simulation
studies mainly focused on the importance of matching the frequency of the
electrical stimulation to the natural frequency of the stimulated auditory fibre. In
order to estimate the insertion depth in implanted individuals, researchers have
initially used an estimate based on the surgeon’s report of the number of
electrode bands introduced in the cochlea; subsequent researchers used post-
operative radiographic images to estimate insertion depth. Three metrics have
been used to define insertion depth radiologically: (1) angular depth of insertion,
(2) the length of the intra-cochlear electrode array and (3) the number of active
electrodes used by the speech processor. When estimates based on surgeons’
reports were used, insertion depth was reported to have no significant effect on
speech perception (Blamey et al., 1992 and Hodges et al., 1999). However,
surgeons’ estimates may not be as accurate as radiological measures. In 2004
Yukawa et al. investigated the effects of insertion depth on speech perception
with the possibility that one of the radiologically based estimators could be more
particularly relevant to speech perception. Thus they evaluated the effects of
insertion depth based on angle, length and number of active electrodes
estimates on the post-operative CNC words scores (for 48 subjects), CNC
phonemes (for 48 subjects) and CUNY sentences in noise (for 26 out of 48
subjects). Duration of deafness, hearing aid usage, preoperative CID sentences
scores and pure tone average (PTA) together with insertion depth were used as
independent variables in a multiple regression analysis. Among the three
insertion depth estimates, the angular depth of insertion was reported as the
best predictor of post-implantation speech perception score, especially when
64
CUNY sentences in noise were used as the speech perception measure. They
reported better performance with deeper insertion with the Cochlear device
(Nucleus 22 and Nucleus 24). Some advocate the deeper insertion with the
assumption that it ensures the stimulation of a wider spectral range of
frequencies down to lower frequencies at the apical end of the cochlea, thus
improving speech discrimination in noise (Hochmair et al. 2003). There is some
evidence to suggest that better frequency matching between the normal
cochlear tonotopic organization and the electrical stimulation of the CI (Baskent
and Shannon, 2003 and 2005) is more critical for optimising performance.
However, other researchers argue that deep insertion increases the possibility
of mechanical trauma (Finely and Skinner, 2008) and that frequency specificity
is lost due to cross-turn stimulation towards the apex (Gani et al., 2007 and
Finley and Skinner, 2008). In addition there have been studies indicating that
the CI user habituated to the frequency mapping of their CI program with
respect to pitch perception (Reiss et al., 2008); thus matching the frequency of
electrical stimulation to the normal tonotopic frequency organization may
become unnecessary. More information about insertion trauma due to depth of
insertion is provided below in Section (2.2.3.5) when it is considered with
respect to “soft surgery”.
2.2.3 Soft CI surgery
In the last few years, the concept of “soft surgery” has become more common
practice and is an area that has received a great deal of attention. One of the
intended goals is to preserve residual hearing in the implanted ear. With this
approach it allows for the extension of the candidacy criteria to hearing-impaired
individuals who are not “totally deaf”. The soft surgery approach is essential for
systems such as electroacoustic stimulation, which combines electrical
stimulation of high frequencies in the basal region sometimes by using a short
CI array whilst using acoustic auditory stimulation of low frequencies in the
apical region. This necessitates the preservation of hearing at lower frequencies
to be able to use the low frequency hearing. Soft surgery is not a new concept;
it was first introduced by Lehnhardt in 1993, when the preservation of hearing

65
was considered as a backup for cochlear implantation if CI failed. In order to
achieve soft surgery, the technique must ensure the avoidance of any
mechanical trauma and the reduction of any factors that may cause adverse
cochlear reactions (Friedland et al., 2009). These factors may include the route
of insertion, location of the cochleostomy, avoidance of blood or bone dust entry
into the cochlea, application of corticosteroid to the cochleostomy, application of
Healon ® (a lubricant) to the cochleostomy and electrode array, electrode array
size and depth of insertion.
2.2.3.1 The route of insertion
There are two main access approaches to the scala tympani for electrode array
insertion, via a cochleostomy in the cochlear basal turn or through the round
window, which is considered by some to be less traumatic causing less damage
to basal turn structures (Adunka, 2004). However, contrary evidence exists
suggesting that for some electrode arrays there is a different pattern of results;
perimodiolar electrodes were observed to cause significantly more damage in
the basal structures with round window insertion (Adunka et al., 2006 and
Souter et al., 2011). Round window insertion resulted in preserved low
frequency residual hearing by Skarzynski et al. in 2007 with the use of partially
inserted MED-EL COMBI 40+ straight electrode array. However, Berrettini et al.
in 2008 produced contrary evidence with a reported significant decrease in
residual hearing caused by round window insertion though not all the soft
surgery precautions were taken with the round window approach in this study.
Erixon et al. (2012) provided further evidence that hearing preservation can be
accomplished with round window insertion and the use of the flexible MED-EL
FLEXEAS electrode array.
2.2.3.2 Location of the cochleostomy
The location of the cochleostomy (a drilled small opening into the cochlea) is
thought to have an impact on the potential for damage to the spiral lamina and
intracochlear structures. Based on the examination of 27 temporal bones, a
cochleostomy in an anterior-inferior location in relation to the round window has
been shown to be less likely to cause damage to the spiral lamina (Briggs et al.,
66
2005). This was also true with the use of three-dimensional modelling of the
hook region in the cochlea; Li et al. (2007) demonstrated that an anterior-inferior
cochleostomy allows direct access to the scala tympani without contact with
critical structures. Additional evidence for this approach comes from the
literature on preservation of residual hearing where the anterior-inferior
cochleostomy was compared to a strictly anterior cochleostomy (Garcia-Ibanez
et al., 2008 and Berrettini et al., 2008) or a strictly inferior one (Garcia-Ibanez et
al., 2008).
2.2.3.3 Avoidance of intra-cochlear reaction
There is some evidence that links blood entry in the scala tympani with residual
hearing damage. Franco-Vidal et al. (2007) looked at sudden hearing loss that
coincided with haemorrhage into the cochlea. Other reports included sudden
hearing loss that coincided with high intracochlear signal on 3D-FLAIR MRI
imaging that could be indicative of haemorrhage (Otake et al., 2006 and
Yoshida et al., 2008). Although it is difficult to establish a direct link between
bone dust entering the cochlea and residual hearing loss as well, some
researchers have found that using bone pate to seal the cochleostomy can
promote bone and scar formation (McElveen et al., 1995). Intra-cochlear
reaction to blood in the scala tympani or bone dust in the cochlea may
adversely affect residual hearing. Thus the avoidance of intra-cochlear
exposure to these factors is attempted during soft surgery. Electro-cautery and
topical vasoconstrictors such as epinephrine can be used to minimise bleeding
from surrounding soft tissue (Bas et al., 2012) while irrigation to flush away
bone dust prior to the cochleostomy is advisable to prevent bone-dust entering
the cochlea (Kiefer et al., 2004; Friedland and Runge-Samuelson, 2009 and
Bas et al., 2012).
2.2.3.4 Application of drugs at the cochleostomy and/or electrode array
Corticosteroids are commonly used in the management and prevention of
hearing loss. In CI surgery, corticosteroids are hypothesized to inhibit adverse
intracochlear inflammation and molecular reactions towards the cochleostomy
and electrode array (Friedland et al., 2009). Animal experiments have
67
demonstrated that corticosteroids can protect the cochlea from insertion
damage and cochleostomy with intra-scalar administration of corticosteroids
(triamcinolone Volon A®) in guinea pig ears (Kiefer et al., 2007 and Ye et al.,
2007). Within four weeks, triamcinolone partially prevented hearing loss
secondary to cochleostomy. When considering the use of corticosteroids for
hearing preservation during CI surgery, two factors have to be considered.
Firstly, only intra-scalar administration showed protective effects in animals but
the apical portion of the cochlea received little corticosteroids (Plontke et al.,
2008) minimising the corticosteroid effect on hearing preservation at lower
frequencies. Secondly, the topical corticosteroid effect lasts less than 24 hours
(Hargunani et al., 2006). Rather than applying corticosteroids at the
cochleostomy in soft surgery, sodium hyaluronate gel (Healon ®) may be used.
In Lehnhardt’s original description of soft CI surgery (1993) Healon ®
(hyaluronic acid) was recommended to be used in the cochleostomy and on the
electrode array. Hyaluronic acid is normally found in the extracellular matrix: it is
used as a lubricant when inserting electrode arrays (Friedland et al., 2009 and
Laszig et al., 2002). As a translucent viscous substance it may prevent
perilymph leakage and prevent cochlear contamination with blood and bone
dust without affecting visualization (Friedland et al., 2009). It has been reported
to reduce the formation of scar tissue in the middle and inner ear (Huang et al.,
2007). Research indicates that Healon ® is most probably not an ototoxic
substance that may help preserve hearing in humans (Skarzynski et al., 2002).
2.2.3.5 Depth of insertion
As discussed in Section 2.2.2, the risk of trauma has been reported to increase
with deep insertion of the electrode array (Adunka et al., 2006; Finley and
Skinner, 2008 and Wardrop et al., 2005a). However, this can be avoided if the
electrode array is not inserted beyond the point of first resistance whilst
accomplishing full insertion of the electrode array (Gstoettner et al., 1997 and
Lenarz et al., 2006). In soft surgery, surgeons have either used partial insertion
of electrode arrays (James et al., 2005 and Skarzynski et al., 2007), short
electrode arrays (Gantz and Turner, 2003; Turner et al., 2004 and Lenarz et al.,
2006) or full insertions of standard-length arrays (Skarzyski et al., 2002;
68
Baumgartner et al., 2007; Prentiss et al., 2010; Bruce et al., 2011 and Erixon et
al., 2012). The objective in soft surgery is to reach a balance between
accomplishing an insertion depth that provides the required cochlear coverage
and avoiding trauma to the cochlea.
2.2.4 Electrode array design
Electrode array design has advanced dramatically, not only in terms of number
of electrodes but also in terms of size, shape, specificity of stimulation,
efficiency in the use of current and the material used. Another challenge that
faces the manufacturers is optimizing the electrode array design in order to
minimize trauma during insertion; this is of particular importance when using the
CI in electro-acoustic stimulation (Rebscher et al., 2008). The properties of the
array design also influences depth of insertion due to length, thickness and
flexibility. In the following section the various electrode physical attributes that
may influence array placement, and outcome, will be discussed.
2.2.4.1 Size of the electrode array
The influence of both the length and the diameter of the array will be considered
in the following sections.
Electrode array length
The length of the array varies among the different CIs and even between the
different models for each manufacturer. The longer arrays are usually designed
for deeper insertion, such as MED-EL’s standard 31.5 mm arrays, while shorter
arrays were sometimes designed for electro-acoustic stimulation (EAS) where
there is residual hearing at the low frequencies and the CI provides electric
stimulation to the high frequencies only. An example of such an EAS array is
Cochlear’s Hybrid-S CI 10 mm array (Gantz and Turner, 2004). The Gantz and
Turner research highlighted the importance of the position of the electrode array
in the cochlea and the necessity to maintain a tonotopic relationship between
69
the residual acoustic hearing and the electric stimulation provided by the CI.
However, Reiss et al.’s research in 2006 showed that pitch perception through
Hybrid CIs can change over time; this may undermine the importance of
tonotopicity when it comes to CI electrode insertion. In contrast to Cochlear’s
Hybrid-S short array (Gantz and Turner, 2004) Cochlear later introduced the
Hybrid-L24 16 mm array and hearing conservation was possible with the use of
a round window approach (Lenarz et al., 2009). Other researchers have also
stressed the importance of the electrode array design (e.g. flexibility) and the
use of an atraumatic electrode insertion procedure (soft surgery) even with an
insertion depth of up to 18-24 mm when it came to EAS (Gstoettner et al.,
2004).
Electrode array diameter
The diameter of the electrode is a design issue as well; EAS systems have
thinner electrode arrays e.g. the Iowa/Nucleus Hybrid Implant, Cochlear’s
Hybrid-L24 and MED-EL’s PULSARCI100 FlexEAS (Gantz and Turner, 2003;
Turner et al., 2004; Lenarz et al., 2009 and Helbig et al., 2011). Their design
used a thinner electrode array in order to minimize injury to hair cells and the
Organ of Corti.
CI manufacturers such as MED-EL and Neurelec promoted deeper insertion
and reduced the diameter of the array to make it less traumatic.
Some electrode arrays have a larger diameter (e.g. AB HiFocus II) and
therefore may carry a greater risk of cochlear trauma during insertion (Eshragi
et al., 2003; Aschendorff et al., 2003 and Wardrop et al., 2005a). However,
these arrays were designed to (1) ensure increased efficiency of electrical
stimulation by decreasing the volume of the surrounding conductive fluid and to
(2) enhance frequency specificity by increasing the proximity of the electrodes
to the spiral ganglion. In this case finding the right balance would be the target
of future designs.
The electrode array’s cross-sectional dimensions must not exceed that of the
Scala Tympani otherwise there would be a high incidence of trauma
70
(Aschendorff et al., 2003, Eshraghi et al., 2003, Wardrop et al., 2005a,
Rebscher et al., 2008).
2.2.4.2 Preformed curved electrode arrays versus straight arrays
Electrode array designs that allow the contacts to sit in closer proximity to the
modiolus are intended to increase electrical stimulation efficiency and promote
frequency specificity by positioning the electrodes closer to the auditory
neurons. Cords et al. (2000) compared an AB modiolus-hugging position of the
array with the use of a preformed silastic positioner to push the array closer to
the modiolus and a straight array in six adult cats. Electric Auditory Brainstem
Response (EABR) testing showed a significant reduction in thresholds with the
positioner; and this was associated with shallower amplitude growth slopes
indicating a wider dynamic range, this was most evident in the basal region.
Early research on pre-curved arrays in humans (Taikocinski et al.,2001) such as
Cochlear’s Contour implants found that T and C levels decreased with the use
of the pre-curved perimodiolar array compared to the straight array; this finding
was also replicated by (Saunders et al., 2002, Parkinson et al., 2002). Other
supporting evidence included the observed decrease in EABR thresholds,
shorted latencies and an increase in the amplitudes of waves III and V after the
removal of the stylet with the use of Nucleus Contour implant (Pasanisi et al.,
2009). Some argue that electrode array designs that position the array closer to
the modiolar wall of the scala tympani can risk damaging this thin wall; thus
directly damaging the spiral ganglion and increasing the risk of spreading
infection from the middle ear to the CSF (cerebro-spinal fluid) (Rebscher et al.,
2008).
2.2.4.3 Electrode array stiffness
The stiffness of the electrode array may have an effect on the insertion of the
array, the final position of the array in the cochlea and the incidence of insertion
trauma. Rebscher et al. (2008) measured the overall stiffness and the stiffness

71
on the vertical and horizontal planes of different electrode arrays from AB,
Cochlear and Nurobiosys (a Korean CI manufacturer). They then correlated
stiffness to results reported in previous studies reporting insertion trauma
(Wardrop et al., 2005a and Wardrop et al., 2005b).They found that there was no
correlation between the overall stiffness of the arrays and insertion trauma.
However, they did show that arrays with greater stiffness on the vertical plane
were less likely to perforate into the scala vestibuli or scala media than those
with isotropic stiffness (equal stiffness on the vertical and horizontal planes) or
with stiffness greater on the horizontal plane. Baumgartner et al. (2007) found
that the MED-EL FLEXsoft electrode array with increased flexibility allowed deep
insertion while preserving hearing for half of the 16 implanted up to one month
and for a quarter of them up to one year post implantation. The MED-EL
FLEXsoft produced comparable speech reception and life quality questionnaire
results to those of COMBI 40+ and PULSARCI100.
2.3 Factors dependent on the CI electrodes/channels
The electrode array contacts themselves may also play a role in affecting
performance by altering spectral selectivity or the efficiency with which current
is delivered. Despite the disparity in the number of electrodes that the CI
devices from the different manufacturers have, they all provide comparable
post-implantation results (e.g. Friesen et al., 2001 and Green et al., 2007).
It is presumed that increasing the number of electrodes would increase the
number of perceptual channels, this would only be the case if they provided
distinct information to increase specificity; this however may not be the case
(e.g. Friesen et al., 2001). Some problematic electrodes may cause distortion to
the signal delivered via the implant which may actually lead to greater numbers
of electrodes causing degradation in performance. Identifying these electrodes
and finding a fitting solution to overcome the effects that they have on
perception might have an impact on post-implantation performance.
72
2.3.1 Number of channels stimulated by the active electrodes
Different CI systems have a different number of possible active physical
electrodes in their devices ranging from 12 to 22. But the number of physical
electrodes does not necessarily correspond to the number of spectral channels
provided by the implant (Blamey et al., 1992; Zwolan et al., 1997; Fu et al.,
1998 and Friesen et al., 2001). Friesen et al. (2001) investigated speech
perception as a function of electrodes/channels in implanted [Nucleus 22 users
and AB CI (8 electrodes)] and normally hearing adults (using a noise band
vocoder). They found that CI recipients were not able to fully utilise the spectral
information provided by the full number of electrodes. They did not improve in
terms of speech perception in noise when the number of electrodes increased
beyond seven or eight. However normal hearing individuals continued to
improve up to at least 20 channels. They also reported that the best implanted
individuals performed as well as the normal hearing individuals up to 7/8
electrodes/channels only. However, these results have to be considered with
caution, since around half of the implanted individuals (9 of 19) had the CI
Clarion implant that stimulated only up to 8 channels when all possible
electrodes were switched on. In addition to that, there was a marginal significant
difference in speech perception between the research conditions with seven
active channels versus ten in implanted individuals with Nucleus 22 (the device
with 20 possible active electrodes). Another factor that was not accounted for in
this study was the discriminability of the electrodes; there was a possibility that
non-discriminable electrodes did not add spectral information when switched
on, in contrast to discriminable ones. Additionally CI recipient may benefit from
a larger number of channels with more recent CI devices and strategies.
Nonetheless, there was discrepancy between the number of electrodes and the
number of useful perceptual channels (Blamey et al., 1992; Zwolan et al., 1997;
Fu et al., 1998 and Friesen et al., 2001). One possible explanation for that is the
stimulation of overlapping populations of auditory neurons by different
electrodes (Fu and Nogaki, 2004 and Dorman and Spahr, 2006), which could
be caused by so called dead regions in the spiral ganglion or “holes in hearing”
73
(Shannon et al., 2001) or secondary to placement issues whereby electrodes
are placed relatively far from the spiral ganglion (Wilson and Dorman, 2008).
This discrepancy may affect performance, since studies have shown a positive
relationship between the number of perceptually distinct channels and speech
perception for both adults (Collins et al., 1997; Henry et al., 1997; Nelson et al.,
1995; Friesen et al., 2001) and children (Dawson et al., 2000).
Besides increasing the number of physical electrodes, CI manufacturers
explored other possibilities to increase the number of distinct pitch percepts
(perceptual channels). Current steering (described earlier in Section 1.4.3.3)
was introduced to create virtual channels to allow the channels to be placed in
the correct characteristic frequency region rather than at a fixed electrode site
(e.g. Donaldson et al., 2005; Firszt et al., 2007; Koch et al., 2007; Bonham and
Litvak, 2008 and Wilson and Dorman, 2008). Tripolar and partial tripolar
coupling (described earlier in Section 1.2.5.) aimed to reduce current spread by
concentrating stimulation (e.g. Bierer et al., 2005; Bonham et al., 2005; Litvak et
al., 2007; Zhu et al., 2012) and thus creating less overlap between channels.
Electrodes that do not provide distinct information could lead to poor perception
because cycles of information in a CIS or n of m strategy would be wasted
delivering duplicate information rather than unique information to enhance
perception, these electrodes could be considered problematic and may require
intervention.
2.3.2 Problematic electrodes
It is routine clinical practice that some CI electrodes are deactivated. In a
retrospective study Stoddart and Cooper (1999) examined electrodes that
showed complications and were subsequently deactivated in 100 adult CI
recipients. Reasons for de-activating those electrodes within routine clinical
practice were: (1) non-auditory stimulation mainly facial nerve stimulation and
sometimes throat sensations, (2) poor sound quality, (3) reduced dynamic
range or absence of loudness growth, (4) pain, (5) vibration, (6) absence of
auditory stimulation and (7) dizziness. However, in this section, problematic
74
electrodes refer to electrodes with sub-optimal function that may not be
deactivated in routine clinical practice.
The identification of problematic CI electrodes has been explored by different
methods. Such as frequency discrimination approaches to determine if the
electrodes provide distinct pitch information (e.g. Zwolan et al., 1997) or
threshold measurement with the use of focussed stimulation to identify what
was called “poor electrode-neuron interface” (e.g. Bierer et al., 2011). Some
researchers have used direct testing via a research interface (e.g. Zwolan et al.,
1997) while others explored indirect testing approaches, using consonant and
vowel confusion matrices (Remus et al., 2007). The following section provides
an overview of different methods used for identifying problematic electrodes
with adults, including main findings and indications for possible solutions to
improve speech perception.
2.3.2.1 Testing methods for problematic electrodes
2.3.2.1.1 Using electrode differentiation (discrimination)
Several procedures have been described to test for electrode differentiation
(discrimination). Some used a pitch ranking task (e.g. Nelson et al., 1995), while
others determined the frequency difference limen of each electrode (Zwolan et
al., 1997) or used a multidimensional scaling procedure (McKay and Henshall,
2001). These procedures described below required manufacturer specific
research interfaces that require programming and lengthy procedures rendering
them clinically non-viable.
Pitch ranking
Nelson et al. (1995) described an electrode pitch ranking test administered in a
two-interval two-forced-choice (2I-2AFC) task with the use of direct stimulation
at loudness balanced “medium loudness” level. They used 500 ms bursts of
current pulses and an inter-stimulus interval (ISI) of 500 ms. Stimulation was
75
delivered through the Cochlear corporation research interface to collect the
percent correct responses for electrode pairs that were 0.75, 1.5, 3.0, and 4.5
mm apart. Additional electrode separations of 6.0 and 7.5 mm were also tested
if subjects did not achieve near perfect scores when the electrodes were 4.5
mm apart. They found great variability in performance on the electrode pitch
ranking task among the 14 Nucleus-22 adult users. They also reported that
electrode ranking improved with increased spatial separation and suggested
increasing the spatial separation between electrodes for subjects with poor
ranking at smaller spatial separation; “the reduction in the number of active
electrodes might provide a better representation of place pitch across
electrodes for these subjects”. Later Donaldson and Nelson (2000) used the
same procedure and found a positive relationship between place-pitch
sensitivity, as assessed by the electrode pitch-ranking and consonant
recognition in 12 post-lingually deafened adults, all of whom were experienced
Nucleus 22 implant SPEAK users.
Frequency Difference Limen (FDL)
In 1997 Zwolan, Collins and Wakefield investigated the possibility of identifying
indiscriminable (problematic) electrodes based on electrode discrimination in 11
adult post-lingually deafened CI users. Two procedures were employed to
evaluate the discriminability of each electrode at loudness balanced comfortable
levels: (1) an adaptive 2I-2AFC procedure to determine the discrimination limen
(DL) for each electrode; i.e. the closest discriminable electrode to a reference
electrode in the basal or apical direction and (2) a fixed-level procedure to verify
results from the first procedure and to provide finer estimates of the electrode
DL. Each electrode served as a reference electrode in a DL task in at least one
block of trials. They provided their participants with research programs based
on the electrode differentiation results which improved speech perception for
seven out of nine participants, for details of the research programs see Section
(2.3.2.2).
Electrode discrimination
76
Henry et al. (2000) used speech intelligibility index (SII) procedures to
investigate the amount of speech information received by CI users in five
different frequency bands and associated it with electrode discrimination in each
band. They also compared the speech perception abilities of 15 adult post-
lingually deafened CI users with that perceived by normal hearing individuals.
The normal hearing listeners listened to filtered speech filtered into five
frequency bands (170–570, 570–1170, 1170–1768, 1768–2680, and 2680–
5744 Hz) and the CI users listened with sequences of electrodes turned down
to cut out those spectral components. Electrode discrimination between the
adjacent electrodes corresponding to each frequency band was tested in a 4
interval forced choice (4IFC) procedure in which three intervals containing
stimulation of the more apical reference electrode and a fourth interval
containing stimulation of the test electrode were randomly presented and
separated by a 500 ms ISI . The participants were asked to identify the
stimulation of the test electrode. Results indicated that the amount of speech
information perceived by CI users was significantly less than that of normal
hearing individuals in the low to mid frequencies 170-2680 and there was a
significant correlation between electrode discrimination ability and the speech
information perceived in that frequency range (170-2680 Hz) . This correlation
was greatest with the speech information perceived in the frequency band
1768-2680 Hz. Speech information at this frequency band was also shown to be
more difficult to perceive by poor performers. Thus it is the most important band
for predicting overall speech perception (i.e. whether the CI user was a good or
a poor performer), suggesting this band (which corresponds to the region of the
second formant) to be one of the most important perceptual regions in speech.
Multidimensional scaling (MDS) procedure
McKay and Henshall (2001) used a multidimensional scaling (MDS) procedure
to choose the most discriminable electrodes which were used in their (10
electrode) experimental programmes. The stimulus consisted of a 250 Hz pulse
train with a 500 ms duration; all possible pairs were tested at loudness balanced
comfort levels. The subject was asked to judge the dissimilarity of the two
77
electrodes across a scale from "exactly the same" to "the most different". Then
the scale was converted to a numerical scale and each response was given a
number between 0 and 100. This was done twice and two matrices were
acquired for each individual, a repeated measure nonparametric
multidimensional scale was applied later for analysis. The three experimental
programmes were two ten-electrode maps, one of which had a high resolution
for frequencies below 2.708 kHz, where 9 electrodes were assigned to that
range and only one electrode was assigned to the higher frequency range
(2.708-10.513 kHz), while the other 10-electrode map had evenly distributed
frequency filters across the electrodes. The third experimental map utilized all
possible electrodes as that in the original clinical map, but it had the same
analysis filter as that used in the 10-electrode maps which differed from the
usual frequency to electrode allocation used the original clinical map.
Results demonstrated that the number of electrodes required for good speech
perception may differ between high and low frequencies. In this study, nine
electrodes were better than five for the perception of information below 2.6 kHz,
and five electrodes were better than one and equivalent to nine for the
perception of frequencies above 2.6 kHz; in other words, for optimum
perception of speech information by CI users with Nucleus 22 systems 14
channels of information were required. However, it should be noted that there
was a large variability among tested individuals.
Although the design of the study did not directly investigate the effect of the less
discriminable CI electrodes on speech perception, it served to highlight the
importance of spectral resolution at a specific frequency range (less than 2.6
kHz) in order to achieve good speech perception, a finding supported by studies
simulating “holes in hearing” or missing spectral information in both the
implanted populations (Henry et al., 2000 and Shannon et al., 2001) and the
normal hearing individuals via noise vocoders (Shannon et al., 2001).
2.3.2.1.2 Using electrically evoked compound action potential (ECAP)
As described previously, channel interaction where different electrodes across
the array stimulate overlapping regions of auditory neurons may negatively
78
affect performance with a CI. Abbas et al. (2004) investigated the use of ECAP
(an objective measure) to evaluate these channel interactions in Nucleus 24M
or 24R implant users with the use of the NRT software (which provides
objective measures of the auditory-neural response to the CI electrodes’ see
Section 1.2.1.1). They used a “forward-masking stimulus paradigm” where the
masker and probe pulses were delivered through different electrodes. The
position of the masker electrode was varied for each probe electrode which
affected the amplitude of the neural response to the probe. The amplitude of the
neural-response to the probe depends on the extent of overlap between the
stimulated neural regions by the masker and probe electrodes. They found that
the ECAP revealed varying degrees of channel interaction across the different
CI users and within-subject differences across the different electrodes. They
also found that ECAP has the potential to identify regions with little stimulable
neurons, but they did not correlate ECAP results with speech perception. Later,
Hughes and Abbas (2006) tried to correlate between results of the objective
ECAP spread of excitation (SOE) and the psychometric 2I-2AFC electrode pitch
ranking, but they found no significant relationship between the width of the
ECAP and the slope of the electrode pitch ranking function for the electrodes.
However, later re-evaluation of the original ECAP and electrode pitch ranking
data revealed a significant strong positive relationship between ECAP SOE and
electrode pitch ranking for the electrode pairs (Hughes, 2008). In the re-analysis
ECAP SOEs were normalised to the highest amplitude of all the ECAPs within
the electrode array, in contrast to the first analysis where ECAP for each
electrode was normalised individually. This allowed within subject comparison
between the different electrodes in the re-analysis. The re-analysis also used
the electrode pitch ranking score for each electrode pair rather than the slope of
the electrode pitch ranking function (where the reference electrode was tested
with several electrodes and a slope was calculated). Further research is
warranted to associate ECAP SOE with speech perception. It is important to
note that the NRT used in this research is specific to Nucleus devices, although
AB and MED-EL both have their own ECAP systems

79
2.3.2.1.3 Using single electrode thresholds and electric auditory brainstem
response (EABR) thresholds
Variability in single-channel thresholds with the use of bipolar or tripolar (more
focussed) stimulation techniques across the electrode array was found to be
associated with poor speech perception (Pfingst and Xu, 2004; Pfingst et al.,
2004 and Bierer, 2007). Bierer and Faulkner (2010) and Bierer et al. (2011)
used the more spatially focused partial tripolar stimulation (described in 1.2.5) to
investigate the use of single-channel thresholds and EABR thresholds as a
means of identifying poorly-differentiated electrodes. Electrodes with higher
thresholds had steep wave V growth function and a degraded spatial/spectral
selectivity (wave V is usually the clearest wave and has the largest amplitude).
It was suggested that these problematic electrodes have a “poor electrode-
neuron interface” and negatively impact on performance with CI. The tripolar
and partial-tripolar stimulation applied in this research is currently only available
in AB devices because multiple current sources are required to deliver the
simultaneous stimulation.
2.3.2.1.4 Modulation detection threshold (MDT)
The detection of frequency modulation at specific CI electrodes was
investigated as a possible tool to predict performance with CI and to identify
possibly problematic electrodes. Fu 2002 explored the relationship between
temporal processing and speech perception with CI. An adaptive, three-
alternative, forced-choice procedure was used; two presentations of a 300ms
long non-modulated steady-state biphasic pulse train and the same pulse train
modulated by a 100 Hz sinusoid. The depth of modulation was adaptively varied
and the threshold for detecting the modulation (modulation detection threshold)
was established at seven different presentation levels (ranging between 10%-
90% of the dynamic range) for the middle electrode pair (10 and 12). He found
that the mean modulation detection threshold strongly correlated with the
phoneme recognition score. This finding was further supported by Luo et al.
(2008), and Garadat et al. (2012). Luo et al. (2008) found a positive relationship
80
between mean MDT (at 5 different stimulation levels for electrode 10) and tone,
consonant and sentence recognition scores in Mandarin but not with vowel
recognition scores. The lack of correlation with vowel recognition could have
been due to the use of one central electrode that does not represent the lower
frequencies (vowel formants region). Garadat et al. (2012) reported significantly
better speech perception with a research program that used the ten electrodes
with the best MDT as compared to a research program that used the ten
electrodes with the worst MDT; no comparison was made with the clinical
program because they did not control all program settings.
2.3.2.1.5 Using consonant and vowel confusion matrices
Remus et al. (2007) proposed the use of an indirect approach employing vowel
and consonant confusion matrices to identify indiscriminable electrodes. Their
analysis of Zwolan et al.’s (1997) data (electrode discrimination) in addition to
consonant and vowel confusion matrices data from six CI recipients showed
that they can potentially identify anomalous channels (problematic electrodes)
“above chance level”. However, the development of confusion matrices requires
stimuli that will allow testing of each channel and the identification of problems
associated with each particular channel. This could be especially challenging
and prohibitively time consuming in clinical practice, especially because it would
need to be adapted for different devices and different frequency configurations
that each device allows.
2.3.2.2 Deactivation of problematic electrodes to improve CI performance
Using electrode differentiation (ED)
Zwolan et al. (1997) identified indiscriminable (problematic) electrodes for 11
post-lingually adult CI recipients. Indiscriminable electrodes were deactivated
and participants were provided with experimental programs that employed
discriminable electrodes only, thus reducing the number of active electrodes
which is in concordance with the Nelson et al. (1995) recommendations
81
mentioned above. Stimuli used for speech testing included a medial vowel
recognition test, a medial consonant recognition test, the NU6 Monosyllabic
Word Test (scored for words and phonemes) and the CID Everyday Sentence
Test. Two implanted individuals showed perfect electrode discrimination, thus
were not given experimental programs and were not included in further testing
and analysis.
Results indicated that seven out of the nine implanted individuals showed
significant improvement in at least three out of the five measures with the use of
the experimental program, as compared to performance with the clinical
program. Two implanted individuals showed a significant decline in performance
in at least one of the tests with the experimental programme. However, it must
be noted that one of those individuals' experimental programmes included three
discriminable electrodes only. It could be argued that the three electrodes
provided very limited speech information to the point that reprogramming cannot
improve his performance.
Using modulation detection threshold (MDT)
Zhou and Pfingst (2012) used MDT with eight bilaterally implanted post-lingually
deafened adults and provided them with three experimental programs. MDT
was measured for each electrode at a presentation level of 50% of the
electrode’s dynamic range in a four-alternative forced-choice (4AFC) with the
use of a research interface. Four 500ms pulse trains with inter-stimulus-interval
of 500ms were presented in each trial; one of the pulse trains was modulated by
a 10 Hz sinusoid. MDT was measured with and without masking; the masker
was presented on the adjacent electrode which was apical to the test electrode
except for electrode 22 (basal) at 50% of the masking electrode’s dynamic
range. Speech reception threshold (SRT) with the use of CUNY sentences was
acquired for each ear with the clinical program. The MDT in masking was used
to identify poor sites (electrodes) unless mean MDT in masking was poorer in
the ear with the better SRT; in that case MDT in quiet was used if it agreed with
the SRT results. In research program A, the MDT for the 22 corresponding
82
electrodes (e.g. electrode 1 in the left and electrode 1 in the right CI) were
compared, the electrode with the higher MDT was deactivated and the
corresponding (contralateral) electrode was kept active. Frequencies were not
redistributed following deactivation, which meant that each frequency range was
represented by the CI in one ear only and both ears complemented each other
in dichotic programs; i.e. the program had spectral holes in one ear that was
compensated by the corresponding contralateral site. In research program B,
the electrodes were divided into five segments and the two electrodes with the
highest MDT in each segment were deactivated, again without frequency
redistribution (dichotic programs). Program C was similar to program B with the
exception that frequencies were redistributed across the electrodes which
meant that each frequency range was represented by both ears. All participants
showed improved speech perception in noise with at least one research
program, program B produced the best results but participants may have
required some adaptation/training period to adjust to the new frequency
relocation in program C. Program B was a dichotic program that did not have
any channels with mismatched pitch across ears. However measures of
localisation were not applied.
2.3.2.3 Comparison between the different methods
2.3.2.3.1 The identification of problematic electrodes
As mentioned in Section (2.3.2.1.2), there was a strong statistically significant
association between ED and SOE using ECAP (Hughes, 2008). Chatterjee and
Yu, (2010) evaluated the relationship between ED and MDT in 13 implanted
adults with Cochlear devices, ED and MDT were measured for the centrally
located electrode 10 only at 20%, 30% and 40% of the dynamic range with the
use of monopolar and bipolar modes of stimulation. The maximum stimulation
level of 40% was chosen because their subjects were performing at ceiling
levels when higher stimulation levels were used which could be due to
restricting testing to one electrode; a possible limitation in the study. MDTs were
83
measured at two modulation frequencies; 100 Hz and 10 Hz. They found
statistically significant correlation between ED and MDT at the lower levels of
20% and 30% only with the use of the bipolar mode of stimulation and only at
the 20% level with the use of the monopolar mode of stimulation. Weaker
associations at higher levels could be due to measures approaching ceiling
(especially for MST) thus masking inter-subject variability in performance at the
tested electrode (10). The ED was better with the more focussed bipolar
stimulation than monopolar stimulation. Considering that MDT testing requires
the use of temporal cues while ED requires the use of spectral cues, the most
likely explanation is that these tests uncovered a common underlying reason for
both poor ED and worst MDT. Poor localised neuronal survival of the spiral
ganglion (dead regions) would affect local sensitivity to temporal and spectral
cues. Further support is provided by the fact that the correlation was stronger
with the more restricted excitation patterns associated with lower presentation
levels and with the more focussed bipolar stimulation. More restricted excitation
can evaluate more localised regions and increase the sensitivity of the tests
(especially MDT in this study) for local dead regions.
A common underlying cause for poor ED, worst MDT (poor detection of
frequency modulation) and wider SOE (stimulation of overlapping neural
population by more than one electrode) is the most plausible explanation for the
positive associations found. Cochlear regions with poor neuronal survival “dead
regions” can cause loss of temporal and spectral cues thus affecting MDT and
ED respectively. Such regions will also be associated with the need to increase
stimulation levels to reach T levels (subjective and EABR) and M levels
because they necessitate higher levels of stimulation to reach audibility. Higher
levels of stimulation can also stimulate surrounding regions with better neural
ganglion survival. This in turn will cause more channel interaction and the
stimulation of overlapping neural populations by different electrodes thus
affecting ED and SOE, which would relate increased T and M levels with poor
ED and a wider SOE.
84
Dead regions usually refer to “Regions in the cochlea with no (or very few)
functioning inner hair cells and/or neurons.” (Moore, 2004). In sensorineural
hearing loss these dead regions may have damaged inner hair cell or auditory
neurons. However since the cochlear implant device bypasses the damaged
cochlear hair cells and stimulates the auditory nerve fibres, when referring to”
dead regions “in cochlear implants, these refer to regions with no or few spiral
ganglion (Shannon et al., 2001 and Baskent and Shannon, 2006). Reference to
“dead regions” in this thesis thereafter will be in that context; i.e. regions with no
or poor spiral ganglion survival.
Another factor that may increase the T and M levels and widen the activation
pattern of neurons (increase SOE) could be increased electrode-neuron
distance within the cochlea which affects the electrode-neuron interface. With
the increased electrode-neuron distance higher levels of stimulation are
required to reach T and M levels thus spreading the width of excitation. This is
in line with a model proposed by Goldwyn et al. (2010) where they suggested
that along with cochlear dead regions, increasing the electrode-neuron distance
may also increase the T and M levels especially with the use of a more focused
mode of stimulation.
In summary, the different methods used so far to identify problematic electrodes
are affected by common underlying causes for decreased performance on
those measures, mainly the presence of dead region in the cochlea or poor
electrode-neuron interface.
2.3.2.3.2 Practical application with the different CI devices
When comparing between the different methods for the identification of
problematic electrodes, correlation between results is not sufficient. The results
provided by each method and the analysis involved to identify problematic
85
electrodes has to be considered when choosing a testing method. Additionally
issues concerning practical application and clinical viability have to be taken into
account.
MDT has been used in the identification of the best electrodes (stimulation
sites) relative to the other electrodes, however this can be an issue for CI
recipients with no problematic electrodes. Deactivating electrodes with higher
MDT in comparison to other electrodes for those recipients may not enhance
their performance, contrary to that it may negatively affect their performance
due to reduced spectral resolution. This holds true when applying ECAP to
measure SOE and when using T and M levels as a means to identify
problematic electrodes. Obtaining a score with a cutoff point that determines
whether a particular electrode is problematic or not with the use of a preset
pass versus fail criterion is preferable; it would allow a CI recipient to pass all
electrodes. It can also allow for comparison with other electrodes if necessary.
Testing electrode-pairs for ED in a 2 interval-2 alternative forced choice pitch
ranking task could provide such a score where binomial distribution could be
used to establish the pass cut off point.
Other practical considerations may include the method’s flexibility to
accommodate devices from different CI manufacturers without the use of
special manufacturer-specific research interfaces or stimulation modes (e.g. use
of partial tripolar stimulation which is available only to AB in measuring T and M
levels). Delivering the test stimuli to the speech processor via pure-tones with
the use of software designed to allow such flexibility can be a practical option
that overcomes the need for research interfaces.
Feasibility of use in clinical settings would also necessitate that the duration of
testing does not exceed that routinely allocated to programming CI. The test
method is also required to demonstrate a relationship with different speech
86
perception measures, thus relating test results with performance indicating
potential for use as a clinical tool to enhance performance with CI.
A possible method for testing that meets the above considerations is pure-tone
ED (PTED) which tests for ED by presenting pure-tones at the electrodes’
centre frequencies. The use of “STAR” software via the “STAR box” [Medical
Research Council Institute of Hearing Research (MRC IHR), Nottingham] in a
pitch ranking task can be optimised for the application of PTED. In Chapter 3,
PTED is described and tests of reliability, validity and clinical use feasibility are
reported. Furthermore, Chapter 5 explores the relationship between PTED and
speech perception and Chapter 7 applies PTED results to provide CI recipients
with research programs and evaluates speech perception with those programs.
2.3.2.4 Interim summary
In summary problematic CI electrode contacts may affect performance, either
indirectly because they interface with a neuronal dead region or directly by
functioning sub-optimally. The identification of those problematic electrodes
which are not usually identified in routine clinical practice may actually be worth
finding and de-activating. If those problematic electrodes are identified,
intervention targeting them through re-programming of the CI device to improve
performance might be possible. A possible solution for those problematic
electrodes was offered by Nelson et al. (1995); they suggested that de-
activating electrodes in subjects with poor electrode discriminability thus
increasing spatial separation might lead to improvements in speech perception.
This was followed by Zwolan et al.’s (1997) attempt to deactivate
indiscriminable electrodes which improved speech perception for seven of nine
implanted individuals. Zhou and Pfingst (2012) also demonstrated improvement
in speech perception when the electrodes with poorer MDT were deactivated.
Since the methods used so far have been clinically non-viable due to equipment
and time restraints and/or are manufacturer specific, exploring other testing
87
methods such as PTED may have great impact on post-implantation
performance.
2.4 Second CI
Wilson and Dorman (2008) considered that bilateral electrical stimulation as one
of the recent advances that “produced significant improvements in the overall
(average) performance of implant systems”. It is argued that the second CI
would provide the CI recipient with additional benefit mainly by providing
binaural hearing and improved spatial listening. These in return would translate
to the real world with improved localisation skills (e.g. Kerber and Seeber, 2012)
and better speech perception especially in noise (e.g. Litovsky et al., 2006).
Localisation is also important for CI users to aid them in the identification and
orientation towards a specific talker among several talkers. The impact of
having a second implant is clear if we consider how crucial sound localisation is
for safety reasons, in order to avoid hazardous situations especially for the deaf
and blind. It also guarantees that the better ear receives an implant, which
maybe vital in post-meningitic cases for instance, where urgent intervention
before ossification occurs could greatly improve prognosis.
2.4.1 Speech perception with bilateral CIs
In normal hearing listeners, speech perception is greatly enhanced in binaural
versus monaural hearing in noise and in quiet (e.g. Bronkhorst and Plomp,
1992). Hence, speech perception is expected to improve in both quiet and noise
when listening through bilateral CI in comparison to unilateral (monaural) CI.
Although some of the studies comparing bilateral CI with unilateral CI listening
conditions have reported improvement in speech perception in quiet (Mosnier et
al., 2009; Tyler et al., 2007; Eapen et al., 2009; Dunn et al., 2010 and Litovsky
et al., 2006) and in noise when both speech and noise were presented from the
front (at 0 a imuth) (Schleich et al., 2004; Ramsden et al., 2005; Eapen et al.,
2009 and Wackym et al., 2007). This was not always true; some have found
that speech perception did not necessarily improve in quiet (Ramsden et al.,
88
2005 and Laszig et al., 2004) or in noise when both speech and noise were
presented from the same direction (at 0 a imuth) (Las ig et al., 2004; Litovsky
et al., 2006). This discrepancy could be explained by the lack of a strong
“binaural summation” effect which is found in normal hearing due to redundant
information from both ears. In normal hearing binaural summation improves
speech perception in quiet and in noise even when both (speech and noise) are
presented from the same direction. On the other hand, evidence shows that
there seems to be consistent improvement in speech perception with bilateral
CI in noise when speech and noise are spatially separated; i.e. speech and
noise are not coming from the same direction (Laszig et al., 2004; Schleich et
al., 2004; Eapen et al., 2009; Litovsky et al., 2006 and Ricketts et al., 2006).
This could be explained by the “head shadow” effect which is a purely physical
advantage whereby the head shadows one of the ears to the sound or noise
coming from the contralateral side. The head shadow effect does not require
binaural integration of the signal to occur. In summary, there is a bilateral
advantage in adults when it comes to speech perception, most of which is
secondary to the head shadow effect with only some of the bilaterally implanted
individuals showing evidence of binaural summation. See Table (2.1) for
summary of major studies comparing unilateral CI with bilateral CI in adults and
have a sample large enough to allow comparison and generalisation (N ≥ 6 was
chosen).
2.4.2 Localisation with bilateral CIs
If spatial listening improves with the provision of bilateral implantation, it’s
expected to lead to better localisation when both implants are active in
comparison to monaural conditions. There were several studies that have found
better sound source localisation among implanted individuals in the bilateral
versus the monaural condition (Kerber and Seeber, 2012; Laszig et al., 2004;
Mosnier et al., 2009; Neuman et al., 2007; Schleich et al., 2004; Seeber et al.,
2004 ; Tyler et al., 2007 and Verschuur et al., 2005). This advantage was
reported for localisation with the use of different stimuli and tasks in both quiet
and noise (Table 2.1 for summary). It must be noted that localisation abilities
89
varied greatly among bilaterally implanted adults (Mosnier et al., 2009) and that
no correlation was found between localisation and speech perception in noise
(Kerber and Seeber, 2012).
2.4.3 Interim summary
In summary a second CI should have a positive impact on perception,
especially in terms of localisation and speech perception in noise. The benefit
will not enable perception similar to that of normal binaural hearing, for example
there is evidence suggesting that little or no binaural summation occurs for
adults with bilateral CI. Variability in performance among the bilaterally
implanted is also an issue; some clues of why that is the case were offered by
Ramsden et al. (2005) “Most subjects were able to integrate the two signals, but
there was an issue with some subjects reporting very large overall pitch
differences between the ears. Subjective reports also indicate that initially, if the
performance of the second ear is poor, it takes time to learn to ignore it and can
be quite distressing.”
If we consider the lack of a strong summation effect and the difficulties of pitch
mismatches between the ears it may well point to the need for better matched
implants for bilateral CI users in an attempt to help them use the important
timing and level cues that are available for good binaural listening. Using pitch
perception to match electrodes between the two implants might improve
performance by facilitating integration of the two signals among the bilaterally
implanted. Matching the bilateral CIs for pitch can be accomplished either via
direct stimulation or via pure tone presentations. In Chapter 9 a study evaluating
the effects of matching the bilateral CIs for pitch with both methods is described.

90
Table 2.1 Comparison between unilateral and bilateral CI performance.
Study Sample Testing measures Findings/ conclusions
Dunn et al. (2010) Eapen et al. (2009) Kerber and Seeber (2012) Laszig et al. (2004)
30 unilaterally implanted 30 bilaterally implanted 9 bilaterally implanted 6 normal hearing 4 unilaterally implanted 10 bilaterally implanted 37 bilaterally implanted
Speech perception in noise: Speech reception threshold (SRT) with Cuing-the-Listener and Multiple- Jammers and Cognitive loading. Speech perception of (CNC) in quiet and (CUNY) sentences in noise. Speech reception thresholds (SRT) with the use of HINT. Localisation of sonorous source with the use of pulses in noise “spatial resolvability”
(SR)
was used
as a measure. Speech perception in quiet and in noise with Freiburger monosyllabic words, Oldenburger sentences (OSLA), and the Hochmair-Schulz-Moser (HSM) sentences. Localisation of speech.
Bilaterally implanted significantly better on all measures Bilateral CI condition better speech perception than unilateral CI. Normal hearing performed best followed by the bilaterally implanted followed by the unilaterally implanted individuals for SRT and localisation. No significant correlation between speech perception and localisation. No significant difference between bilateral and unilateral condition (with better ear) in quiet or noise when both noise and speech presented from the front with HSM. Significant difference between bilateral and unilateral condition (with better ear) when both noise and speech presented from the front with OSLA and when speech and noise spatially separated (reported head shadow effect with bilateral CI). Localisation better for bilateral CI condition than unilateral CI
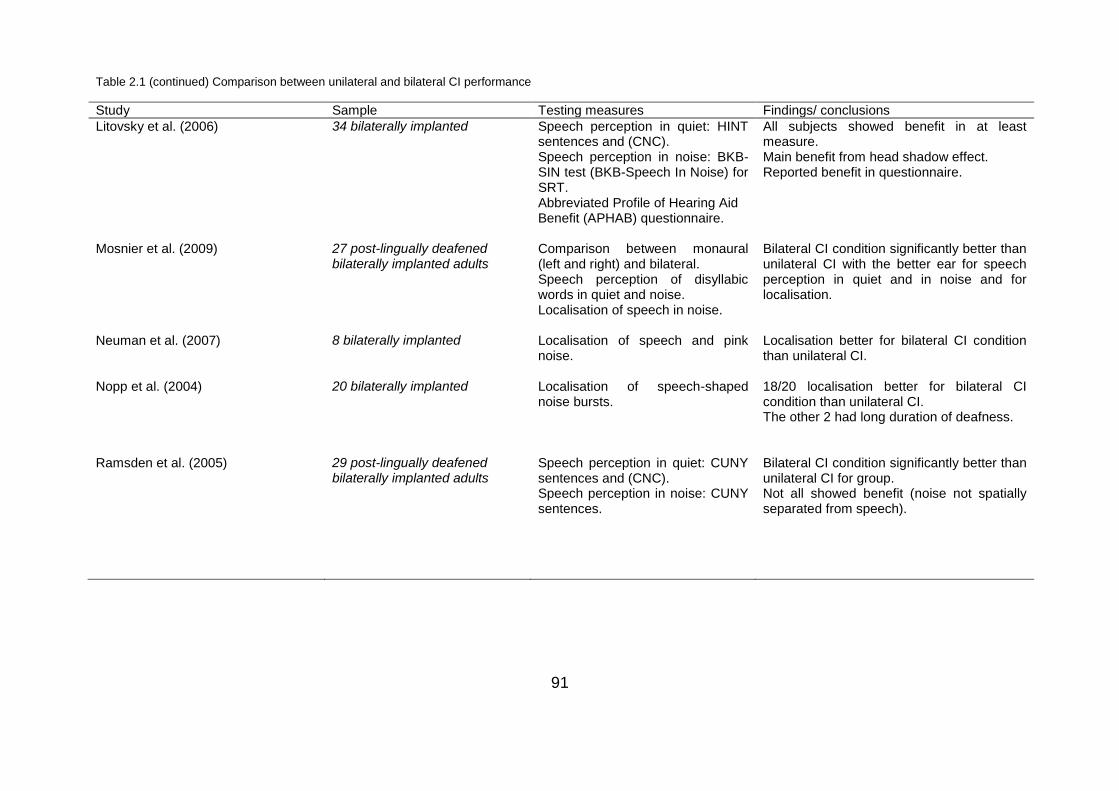
91
Table 2.1 (continued) Comparison between unilateral and bilateral CI performance
Study Sample Testing measures Findings/ conclusions
Litovsky et al. (2006) Mosnier et al. (2009) Neuman et al. (2007) Nopp et al. (2004) Ramsden et al. (2005)
34 bilaterally implanted 27 post-lingually deafened bilaterally implanted adults 8 bilaterally implanted 20 bilaterally implanted 29 post-lingually deafened bilaterally implanted adults
Speech perception in quiet: HINT sentences and (CNC). Speech perception in noise: BKB-SIN test (BKB-Speech In Noise) for SRT. Abbreviated Profile of Hearing Aid Benefit (APHAB) questionnaire. Comparison between monaural (left and right) and bilateral. Speech perception of disyllabic words in quiet and noise. Localisation of speech in noise. Localisation of speech and pink noise. Localisation of speech-shaped noise bursts. Speech perception in quiet: CUNY sentences and (CNC). Speech perception in noise: CUNY sentences.
All subjects showed benefit in at least measure. Main benefit from head shadow effect. Reported benefit in questionnaire. Bilateral CI condition significantly better than unilateral CI with the better ear for speech perception in quiet and in noise and for localisation. Localisation better for bilateral CI condition than unilateral CI. 18/20 localisation better for bilateral CI condition than unilateral CI. The other 2 had long duration of deafness. Bilateral CI condition significantly better than unilateral CI for group. Not all showed benefit (noise not spatially separated from speech).
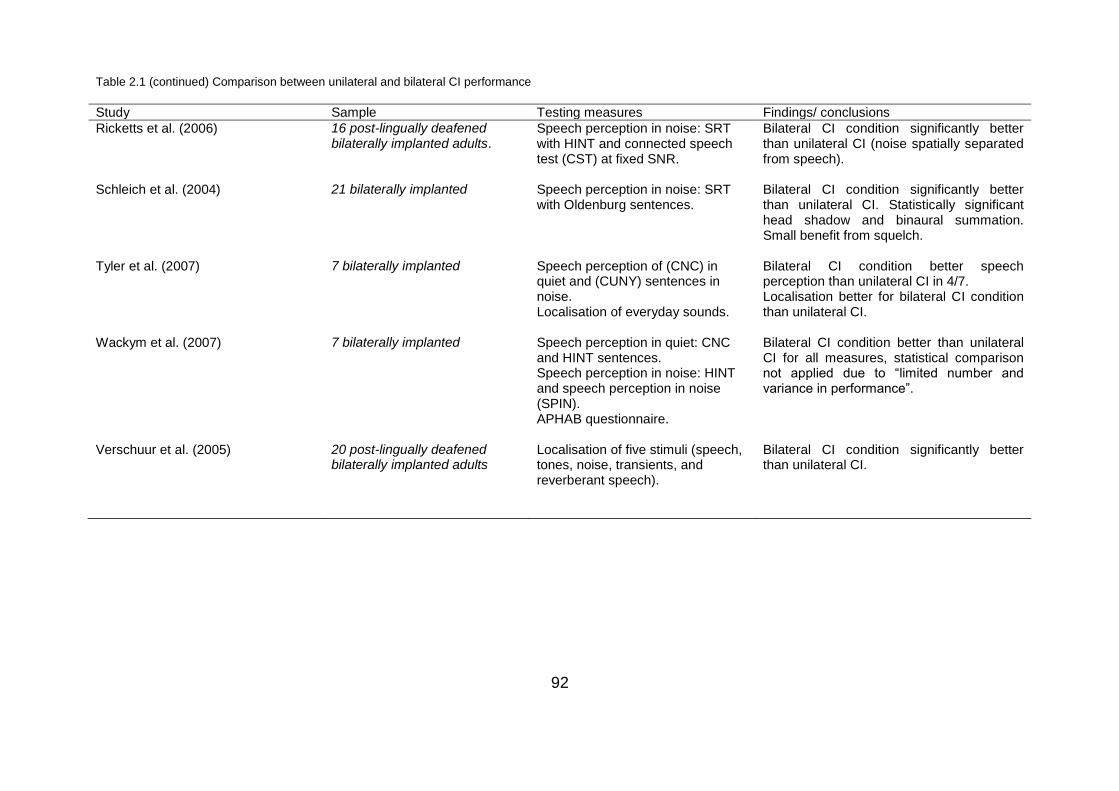
92
Table 2.1 (continued) Comparison between unilateral and bilateral CI performance
Study Sample Testing measures Findings/ conclusions
Ricketts et al. (2006) Schleich et al. (2004) Tyler et al. (2007) Wackym et al. (2007) Verschuur et al. (2005)
16 post-lingually deafened bilaterally implanted adults. 21 bilaterally implanted 7 bilaterally implanted 7 bilaterally implanted 20 post-lingually deafened bilaterally implanted adults
Speech perception in noise: SRT with HINT and connected speech test (CST) at fixed SNR. Speech perception in noise: SRT with Oldenburg sentences. Speech perception of (CNC) in quiet and (CUNY) sentences in noise. Localisation of everyday sounds. Speech perception in quiet: CNC and HINT sentences. Speech perception in noise: HINT and speech perception in noise (SPIN). APHAB questionnaire. Localisation of five stimuli (speech, tones, noise, transients, and reverberant speech).
Bilateral CI condition significantly better than unilateral CI (noise spatially separated from speech). Bilateral CI condition significantly better than unilateral CI. Statistically significant head shadow and binaural summation. Small benefit from squelch. Bilateral CI condition better speech perception than unilateral CI in 4/7. Localisation better for bilateral CI condition than unilateral CI. Bilateral CI condition better than unilateral CI for all measures, statistical comparison not applied due to “limited number and variance in performance”. Bilateral CI condition significantly better than unilateral CI.
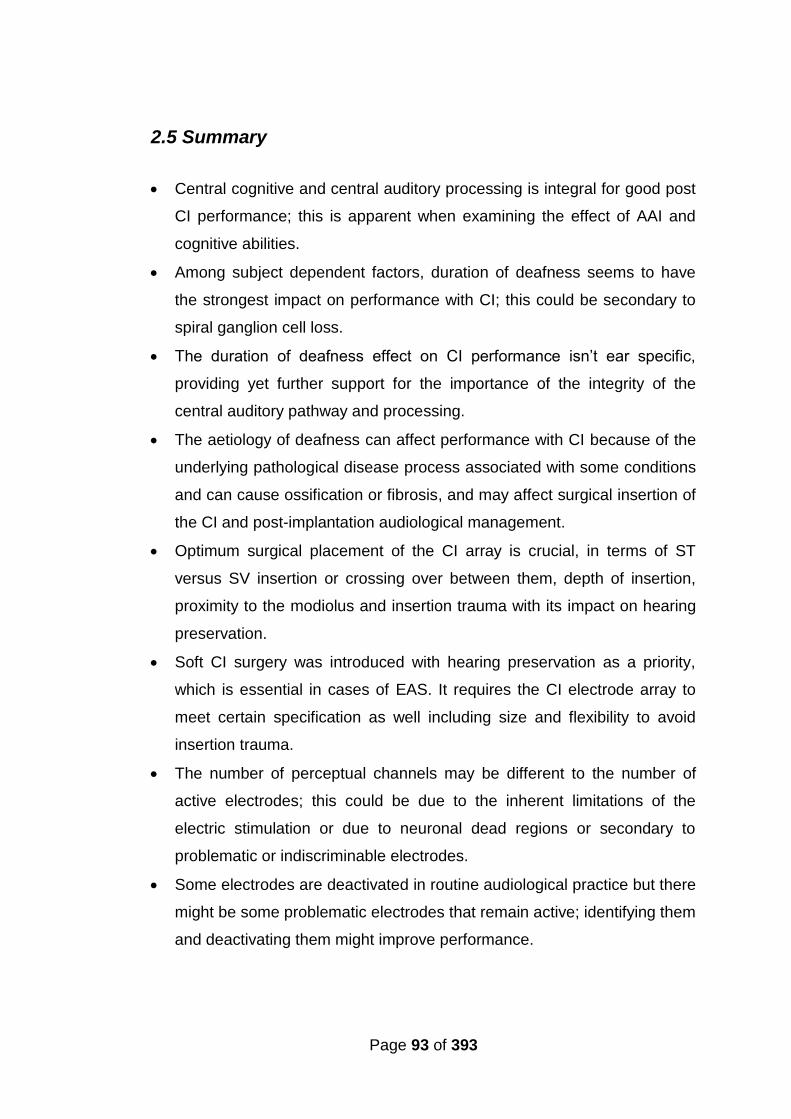
Page 93 of 393
2.5 Summary
Central cognitive and central auditory processing is integral for good post
CI performance; this is apparent when examining the effect of AAI and
cognitive abilities.
Among subject dependent factors, duration of deafness seems to have
the strongest impact on performance with CI; this could be secondary to
spiral ganglion cell loss.
The duration of deafness effect on CI performance isn’t ear specific,
providing yet further support for the importance of the integrity of the
central auditory pathway and processing.
The aetiology of deafness can affect performance with CI because of the
underlying pathological disease process associated with some conditions
and can cause ossification or fibrosis, and may affect surgical insertion of
the CI and post-implantation audiological management.
Optimum surgical placement of the CI array is crucial, in terms of ST
versus SV insertion or crossing over between them, depth of insertion,
proximity to the modiolus and insertion trauma with its impact on hearing
preservation.
Soft CI surgery was introduced with hearing preservation as a priority,
which is essential in cases of EAS. It requires the CI electrode array to
meet certain specification as well including size and flexibility to avoid
insertion trauma.
The number of perceptual channels may be different to the number of
active electrodes; this could be due to the inherent limitations of the
electric stimulation or due to neuronal dead regions or secondary to
problematic or indiscriminable electrodes.
Some electrodes are deactivated in routine audiological practice but there
might be some problematic electrodes that remain active; identifying them
and deactivating them might improve performance.
Page 94 of 393
Several methods and procedures have attempted to identify those
potentially problematic electrodes, but none of them were clinically viable
and compatible with the different CI devices.
Electrodes which are indiscriminable and potentially problematic might be
so due to neuronal loss “dead region” causing them to stimulate
overlapping auditory neurons or due to electrodes sub-optimally
functioning.
Zwolan et al’s study (1997) Zhou and Pfingst (2012) were the only studies
that not only identified the indiscriminable electrodes but also explored a
possible solution, which was to deactivate them. This is in line with
Nelson et al.’s (1995) suggestion to increase spatial separation between
electrodes in regions of poor discrimination.
A clinically viable procedure is still not available, but such a procedure
has potential to influence clinical management of CI if proven beneficial;
this necessitates exploring possible intervention or solutions after
identifying the problematic/indiscriminable electrodes.
For some CI recipients the situation is further complicated because they
have bilateral CIs. The second implant should provide the CI recipient
with great advantages in localisation and speech perception, especially in
noise.
The bilateral advantage of the second CI so far does not match that of
binaural hearing, which may indicate the need for investigation.
Programming of bilateral CIs may require modification to incorporate
matching across the ears for pitch and loudness level to maximise results
and potentially improve outcomes.
2.6 Conclusion
It is important for the CI team to know the factors that may impact on post CI
implantation performance and understand how they affect it. Generally, these
factors interact with each other: a too deep surgical insertion of the CI array
for example can cause damage to the cochlea and/or the electrode array.
Page 95 of 393
When faced with a sub-optimally performing CI user, one must investigate
possible underlying reasons in order to target them with a possible
intervention that may rectify or partially relieve the problem. Radiological
evaluation may be indicated to examine electrode placement, for example, to
confirm a kink in the electrode array or the number of electrodes lying inside
the cochlea in cases of partial insertion of the array. These electrodes would
be usually deactivated, thus radiological evaluation can affect programming
of the CI device. The same is true when we understand how the pathological
changes associated with meningitis or otosclerosis can affect the spread of
electrical current hence influencing the programming of the CI. Again de-
activation of some problematic electrodes in those cases can prevent facial
nerve stimulation for instance or enhance performance.
Thus a review of the literature has exposed some problems with achieving
optimal performance with CI. Pitch perception analysis might be a valid tool
in determining electrode discrimination. Poorly functioning electrodes, if
deactivated might improve overall speech perception in CI users. However,
testing methods in the unilaterally implanted so far have been clinically non-
viable due to equipment and time constraints thus the PTED pitch ranking
test can be a clinically viable option. Reprogramming of the CI with the use of
tonotopic electrodes only may provide improvement. Among the bilaterally
implanted using pitch perception to identify problematic electrodes must take
into consideration matching pitch across ears since mismatch in pitch
perception across ears can negatively affect performance. Reprogramming
with the use of electrodes which are tonotopic in relation to the other ear as
well may provide benefit. To measure performance with CI the widely used
BKB sentence test in quiet and in noise (provides contextual cues that allows
participants to fill in the blank) in addition to the Coordinate response
measure [(CRM) an adaptive speech in speech test that introduces both
energetic and informational masking and does not provide contextual cues]
will be used to assess speech perception additionally localisation will be
assessed in the bilaterally implanted individual.
Page 96 of 393
This thesis will address the following research questions:
Q1: The main research question “Can testing for pitch perception guide
programming of CI to improve performance?” which will be mainly addressed
in Chapters 7, 8 and 9.
Q2: Is PTED a valid, reliable and clinically viable test? (Chapter 3)
Q3: What is the minimum clinically significant change in CRM in the normal
hearing and CI users? Is it different between these two groups? (Chapter 4)
Q4: Is there a relationship between the percentage of discriminable
electrodes as identified via PTED and speech perception (BKB in quiet and
in noise and CRM threshold)? If so, is the relationship stronger at specific
frequency ranges (is good spectral resolution at certain frequencies more
important for good speech perception)? (Chapter 5)
Q5: Are there other factors that contribute to speech perception with CI?
(Chapters 5 and 6)
Q6: Are deeper insertions of the CI electrode array associated with better or
worst speech perception? If so, is there a relationship between speech
perception and the mismatch between the characteristic frequency
stimulated by the most apical electrode and the electrically stimulated
frequency? (Chapter 6)
Q7: Are deeper insertions of the CI electrode array associated with poor ED
of the most apical electrodes? (Chapter 6)
Q8: Can cone beam computed tomography (CBCT) be used to estimate
scalar placement of individual CI electrodes? If so, does scalar placement
affect speech perception or ED? (Chapter 6)
Q9: Will deactivating indiscriminable electrodes as identified via the PTED in
the unilaterally implanted improve speech perception? (Chapter 7)
Q10: Is there a difference in using pitch information (number of discriminable
intermediate frequencies) between regions of discriminable versus
indiscriminable electrode-pairs? If so, do participants showing benefit after
deactivating indiscriminable electrodes demonstrate a different pattern as
compared to those showing no benefit following the deactivation of
indiscriminable electrodes? (Chapter 8)

Page 97 of 393
Q11: Is there a difference in using pitch information (number of discriminable
intermediate frequencies) between regions of indiscriminable electrode-pairs
before and after deactivation? If so, do participants showing benefit after
deactivating indiscriminable electrodes demonstrate a different pattern as
compared to those showing no benefit following the deactivation of
indiscriminable electrodes? (Chapter 8)
Q12: Will deactivating electrodes which are indiscriminable or non-tonotopic
in relation to the contralateral ear in the bilaterally implanted improve speech
perception and/or localisation? (Chapter 9)

Page 98 of 393
Chapter 3
Validity and reliability of the pure-tone electrode
differentiation in CIs
Abstract
The pure-tone electrode-differentiation (PTED) test is potentially a clinically
viable test for determining electrode differentiation (ED). It is based on a
pitch ranking task using pure-tone presentation. Each pure-tone is presented
at the estimated centre frequency of one of the CI filters, such that each
frequency should predominantly stimulate a different CI electrode. The
validity, reliability and feasibility of clinical use of the PTED were evaluated in
this study. The PTED’s validity was determined by comparing the results to a
direct-stimulation electrode differentiation approach that used the same
response procedure but the stimuli were delivered using the CI fitting station.
The results showed that the PTED has good validity (γ = 0.88, n = 104, p <
0.001). PTED demonstrated good test-retest reliability (γ = 0.95, n = 108, p <
0.001) and was clinically viable in terms of equipment and time requirements.
3.1 Introduction
One of the goals of CI development is to increase the number of distinct pitch
percepts for the CI recipient. To date, the approach adopted has been to
increase the number of physical electrode contacts on the array, or to create
virtual channels by trying to focus electrical stimulation between electrode
contacts (Donaldson et al., 2005; Firszt et al., 2007; Koch et al., 2007;
Bonham and Litvak, 2008; Wilson and Dorman, 2008). Additional
approaches have been made to reduce current spread by concentrating the
stimulation, using bipolar or tripolar stimulation techniques (Bierer et al.,
2005; Bonham et al., 2005; Litvak et al., 2007).

Page 99 of 393
As discussed in Chapter 2 (see Section 2.3) for many CI users, the number
of perceptually-distinct channels can differ greatly from the number of active
electrodes, or channels, on their implanted device (Blamey et al., 1992;
Zwolan et al., 1997; Fu et al., 1998 and Friesen et al., 2001). In adult
listeners, a positive relationship exists between the number of perceptually-
distinct channels and speech perception scores (Collins et al., 1997; Henry
et al., 1997 and Nelson et al., 1995). There is some evidence that the same
is true in children despite the inherent difficulties in assessing electrode
differentiation (Dawson et al., 2000). This discrepancy between the number
of channels and number of active electrodes could be attributed to
problematic or indiscriminable electrodes. As discussed in Section 2.3.2.3
the indiscriminable electrodes may arise as a consequence of placement of
electrodes relatively far away from the spiral ganglion cells (Wilson and
Dorman, 2008) or the existence of neuronal dead regions “holes in hearing”
(Shannon et al., 2001). With CIs, dead regions usually refer to regions with
no or few spiral ganglion (Shannon et al., 2001 and Baskent and Shannon,
2006).
In summary, a range of methods have been employed to demonstrate a
strong, positive relationship between ED and speech recognition, and there
is some evidence that an improvement in performance occurs when only
discriminable electrodes were used in the CI programme (Zwolan et al., 1997
and Zhou and Pfingst 2012). Despite this, methods employed to date
(described in Section 2.3.2.1) are largely inappropriate in a clinical setting
due to time constraints and their reliance on a research interface to make the
assessment. Hence there is a need for a clinically viable test for ED; PTED is
proposed as a potential clinically viable test for identifying problematic
electrodes which could be indicative of problematic neural regions.
The study described in this chapter was conducted to validate a new
potentially clinically viable testing procedure (PTED) for the identification of
problematic electrodes via ED and to assess its clinical viability.
Page 100 of 393
3.1.1 The development of the PTED test
The PTED test was developed with collaboration between the UCL Ear
Institute and the Medical Research Council Institute of Hearing Research
(MRC IHR), Nottingham. Development involved the author, Dr. Debi Vickers,
Dr. Victor Chilekwa and Prof. David Moore. The author was the software’s
beta tester and worked very closely with the programmer (Dr. Victor
Chilekwa) in choosing the test tasks and the test protocol administered in
each task and in ensuring that the software ran those tasks as required
without crashing (debugging of the program).
The number of trials per electrode pair and the pass/fail criteria were
determined based on binomial distribution. The testing protocols and the
starting presentation levels used in the test protocols were modified based
on pilot testing to reduce testing time (e.g. if the comfort level was
determined at 65dB for the first electrode, the initial loudness level of the
adjacent electrode used in the loudness balance task was not as low as
40dB).
In the pilot phase, eight CI recipients from the three CI manufacturers (AB,
Cochlear and Med-El) underwent both pitch ranking and pitch discrimination
testing at various degrees of roving.
The pitch ranking in a 2 interval-2 alternative forced choice (2I-2AFC) task
was chosen for PTED rather than pitch discrimination in an odd one out 3I-
3AFC task because it requires that the CI recipients identify each
presentation’s pitch while pitch discrimination does not. CI recipients (in the
pilot phase) reported that some tone presentations (at electrodes’ centre
frequencies) were distorted and sounded like noise while other presentations
sounded like tones with specific pitches associated with them. In those cases
a CI recipient passed the pitch discrimination task but not the pitch ranking
task. These distortions could be associated with malfunctioning electrodes or
Page 101 of 393
electrodes stimulating regions of poor spiral ganglion cell count (dead
regions) hence the pitch ranking task is superior to the pitch discrimination
task. Additionally some CI recipients reported that the 3I-3AFC used in pitch
discrimination had a higher demand for auditory memory than the 2I-2AFC
used in ranking and that they could not remember the first presentation
which adds an additional variable (i.e. auditory memory).
An ‘adjacent reference method’ (further described in Section 3.2.2.2) was
chosen for loudness balancing because it ensures –as much as possible-
that presentations of adjacent electrode-pairs (which will be tested for pitch
ranking) are balanced for loudness to reduce loudness cues, in addition to
that roving was added to further control for loudness cues. A 2 -dB- level
rove (ranging from -1 to +1dB with a 1 dB step resolution) was chosen
because some CI recipients (in the pilot phase) complained that a range of -2
to +2dB and of -3 to +3dB was too confusing.
3.1.2 Aims and hypothesis
The aim was to determine if the PTED was a valid and reliable tool for
assessing pitch-ranking (direction) ED (PTED) and whether it was sufficiently
quick for use in clinical practice. The accepted standard approach for
determining ED based on pitch ranking has been direct-electrical-stimulation
[direct electrode discrimination (DED)] (Collins et al., 1997; Henry et al.,
1997; Nelson et al., 1995; Dawson et al., 2000 and Zwolan et al., 1997) An
approach utilising DED was used to validate the pure-tone method PTED. In
addition, test-retest reliability of the PTED was measured, and the testing
time and ease of testing of the PTED were also evaluated.
The rationale of PTED was that the acoustic stimuli (pure tones at the centre
frequency of each electrode’s filter) should stimulate the appropriate
electrode. Concurrent validity of the PTED procedure was established by
comparing the results to those of the DED procedure testing the same
electrodes in the same person. Concurrent validation is demonstrated when
Page 102 of 393
there is significant correlation between scores on two measures that test the
same construct (e.g., Shuttleworth, 2009). Results of the PTED and DED
were compared for all tested electrode pairs.
The PTED was tested during two different test sessions, PTED’s test-retest
reliability was carried out, and PTED’s scores were compared across
sessions for all tested electrode pairs.
PTED’s clinical use feasibility was assessed; testing duration of all tasks
involved were measured and both average and maximum possible testing
durations for the different devices were calculated based on the median, the
25th quartile and 75th quartile of testing times per electrode pair.
Main research hypotheses:
H1: There will be a relationship between PTED and DED.
H2: There will be a relationship between PTED in first and second sessions.
Sub-hypotheses are:
H1: There will be a relationship between PTED and DED in classification of
electrode-pairs into pass versus fail.
H2: There will be a relationship between PTED and DED in classification of
electrodes into problematic versus non-problematic.
H3: There will be a relationship between PTED in the first and second
sessions in classification of electrode-pairs into pass versus fail.
H4: There will be a relationship between PTED in the first and second
sessions in classification of electrodes into problematic versus non-
problematic.
It was considered that if the testing duration for the PTED tasks for the
different devices would not exceed the 1 hour clinical slot allocated for

Page 103 of 393
routine CI programming that this would be clinically appropriate if the results
are useful.
3.2 Method
NHS ethical approval (09/H0714/17) and Research and Development
agreement were obtained for this project from the Royal Free Hampstead
NHS Trust. All participants gave written consent and received
reimbursements for the cost of travel.
3.2.1 Participants
Participants were recruited from the Royal National Throat Nose and Ear
Hospital (RNTNEH) and through the National Cochlear Implant Users
Association (NCIUA) by advertisement in its newsletter. One participant
(participant 2) had a history of cochlear ex-plantation and re-implantation and
one participant (participant 5) had a rolled over electrode array tip at
insertion.
15 adult CI recipients with acquired deafness were recruited.
The inclusion criteria were that the participants had:
1. A minimum of six months CI experience.
2. An aural-oral mode of communication.
3. English as a first language.
Participants’ demographics are shown in Table (3.1). Details for determining
some of the individual categories and summary of demographics were as
follows:
(1) Duration of deafness was calculated for each participant from the date of
diagnosis of a bilateral profound sensorineural hearing loss, it ranged from 2
to 53 years. (2) Age at testing ranged between 24 to 83 years with a mean of
63 years (± 14). (3) The aetiology of the hearing loss was unknown in 7 out

Page 104 of 393
of the 15 participants. (4) Cochlear implant experience was calculated from
date of switch on of the currently used implant; this ranged from 6 to 168
months with a mean of 66 months and median of 48 months. (5) The hearing
loss was progressive for all of the participants. (6) All were post-lingually
deafened except participants 3, 4 and 8 who had progressive onset from
childhood. (7) Participants recruited had CI devices from Advanced Bionics
(AB), MED-EL™ and Cochlear®.

Page 105 of 393
Table 3.1 Participants’ demographics
Participant Aetiology Progressive Age in years
Age at implant in years
Duration of
Deafness in years
Implant experience in months
Type of implant
1
Post general
anaesthesia in 3
rd
decade
Yes 63 61 12 18 MED-EL™ SONATATI100
2 Unknown Yes 68 57 19 18 AB HiRes 90K
3 Pyrexia at 8
months Yes 53 49 ? 48 Nucleus®
Freedom
4
Head injury, age 5 years
Yes
56 46 3 6 MED-EL™ PULSARCI
100
standard
5 Unknown Yes 50 48 2 24 AB HiRes 90K
6 Sickle cell anaemia
Yes 24 20 9 48 MED-EL™ PULSARCI
100
standard
7 Typhoid
Otosclerosis Yes 72 61 40+ 132
MED-EL™ Combi 40+
8 Measles,
age 5 years Yes 66 59 25 89 MED-EL™ Combi 40+
9 Unknown Yes 71 70 5 13 MED-EL™ PULSARCI
100
standard
10 Unknown Yes 78 64 53 168 Nucleus® 22
11 Hereditary Yes 62 57 6 62 AB HiRes 90K
12 Unknown Yes 63 57 5 60 MED-EL™ PULSARCI
100
standard
13 Unknown Yes 64 51 33 153 MED-EL™ Combi 40+
14 Unknown Yes 71 69 9 25 MED-EL™ Combi 40+
15 Noise
induced and otosclerosis
Yes 83 72 40+ 123 Nucleus® CI 24M
3.2.2 Test battery
The PTED was validated against the DED approach; details of both
procedures are shown below.
Page 106 of 393
3.2.2.1 Direct electrode differentiation (DED)
The DED was measured by directly stimulating electrodes using standard CI
fitting software. The procedure examined all adjacent active electrodes, to
assess which were discriminable. Identical methods were used for all
adjacent electrode pairs at loudness-balanced levels, with subjects having to
judge which presentation (electrode) had the higher pitch. All pairs were
presented 5 times in random order. Pairs scoring ≤ 80% were tested 5 more
times to give a score for 10 trials, if they scored greater or equal to 80%, this
was seen as significantly different (binomial p<0.05; Skellam, 1948).
Although the DED procedure was believed to be effective in identifying
problematic electrodes, it was not deemed clinically useful because it
required two clinicians to conduct testing and calculate scores. However, the
approach was considered to be effective test for ED and it was therefore
used to validate the PTED which employs pure tone ED testing.
3.2.2.2 Pure tone electrode differentiation (PTED)
To assess ED without direct stimulation, pure tones that corresponded to the
centre frequencies of the processing filters within a participant’s individual CI
program were presented through a specifically designed sound box [Medical
Research Council Institute of Hearing Research (MRC IHR), Nottingham,
‘STAR box’]. The purpose of this USB-connected box was to present high
fidelity sounds that bypassed the host computer’s sound card. All filter centre
frequencies associated with switched-on electrodes were used. The audio
and graphical presentation was controlled through STAR software (MRC
IHR; Barry et al., 2010; Halliday et al., 2012).
Measurements of electrode activation spread were made for the Advanced
Bionics (at M-level) and MedEl (at C-level) systems by directly measuring the
outputs from all channels on a multi-channel oscilloscope. Stimuli were
presented at 60dBSPL. For both systems the stimuli were presented
through a speech processor which went to a “dummy” implant in a box

Page 107 of 393
attached to a load board with outputs permitting direct measurements of the
activation in different channels. A criterion level of 6dB down was used as a
cut-off for considering that current had spread to adjacent electrodes from
the main stimulating electrode. For both of these implants there was some
spread to the very next electrode above and below the stimulating electrode
but no further than that, this was considered acceptable. For the Cochlear
device, stimuli were routed through an experimental speech processor, the
sound processing strategy was set to use only one maxima. The output was
verified using a dummy cochlear implant and a research interface with an
“Electrodogram” programme developed by Cochlear Corporation that creates
a frame-by-frame listing of the output of the implant transmitter coil and
generates an electrodogram illustrating visually the output of each electrode
within a specific time window. The results of the electrodogram analysis
demonstrated that the stimuli only activated one channel at a time for the
cochlear device when using the single maxima sound processing
programme.
The duration of the pure tones was 400 ms with 50 ms onset and offset
cosine ramps and an inter-stimulus interval of 500 ms. The stimuli were
presented directly to the speech processor as an auxiliary audio input with a
2 -dB- level rove (ranging from -1 to +1dB with a 1 dB step resolution) in
order to remove the impact of loudness cues without unduly disturbing pitch
perception. Verification of accuracy of frequency, duration of stimulation and
level of presentation was determined using an Oscilloscope (model: Philips
PM 3070, 100 MHz) prior to testing.
Stimuli were delivered at a comfortable level from a desktop PC via the IHR
soundbox to the participant’s CI ‘auxiliary’ input lead. Comfort level was
established for one frequency representing the centre electrode in the CI
electrode array. Loudness matching was then conducted at both increasing
and decreasing test frequencies (across the electrodes) to ensure that stimuli
were all equally loud. An ‘adjacent reference method’ for loudness balancing
Page 108 of 393
(Throckmorton and Collins, 2001) was used where each electrode was
sequentially balanced to its adjacent, previously balanced electrode. A two
interval forced choice task was used, in which the participant was presented
with two pure-tones representing two adjacent electrodes and had to say
whether the second tone was louder, softer or same loudness level as the
first tone. A simple up-down staircase adaptive procedure was followed. Step
size started at 5 dB and was halved after the second reversal, testing
stopped after the participant indicated that the second tone had same
loudness level as the first tone for three times. The average loudness level of
those three responses judged as having the same loudness was taken as
the loudness balanced level.
The pitch-ranking task employed a 2I-2AFC paradigm in which the listener
responded to the statement “which sound has the higher pitch?” A visual cue
was given with each pure-tone presentation; two animated figures
representing the two tones are presented on the computer monitor (see
Figure 3.1) and one figure would jump up on the screen with each pure-tone
presentation (see Figure 3.1). A mouse was used to click on the animated
figure representing the pure-tone presentation with a higher pitch. Each pair
of adjacent active electrodes was tested for a minimum of 5 consecutive
trials. If the participant scored 80% or lower (i.e. was correct on 4 or fewer
trials), a further five trials were carried out giving ten successive trials in total.
As mentioned earlier, this was based on binomial distribution calculation of
minimum correct responses required to achieve significance at the p<0.05
level (Skellam, 1948). The STAR software provided automated delivery and
scoring (percent correct and pass or fail categorization) for each electrode
pair, thus avoiding bias.

Page 109 of 393
Figure 3.1 The animated figures (foxes) used for testing and collecting responses, which appeared on
the monitor during testing for PTED. A) The two animated figures before pure-tone presentation. B)
The two animated figures (foxes) during the second pure-tone presentation, the second fox is jumping
up and opening its mouth during pure-tone presentation.
3.2.3 Procedure
All testing was performed in a 2×2.5 m double-walled sound booth. Scoring
for the PTED was automatically calculated via the testing software and the
DED and PTED calculations were derived independently to ensure that the
testers were blind to the results of the other test. Certain adjustments to the
speech processor’s program settings (see Section 1.3.2 for speech
processor programming) had to be applied before administering the PTED
test. See Figure (3.2) for outline of the study protocol.
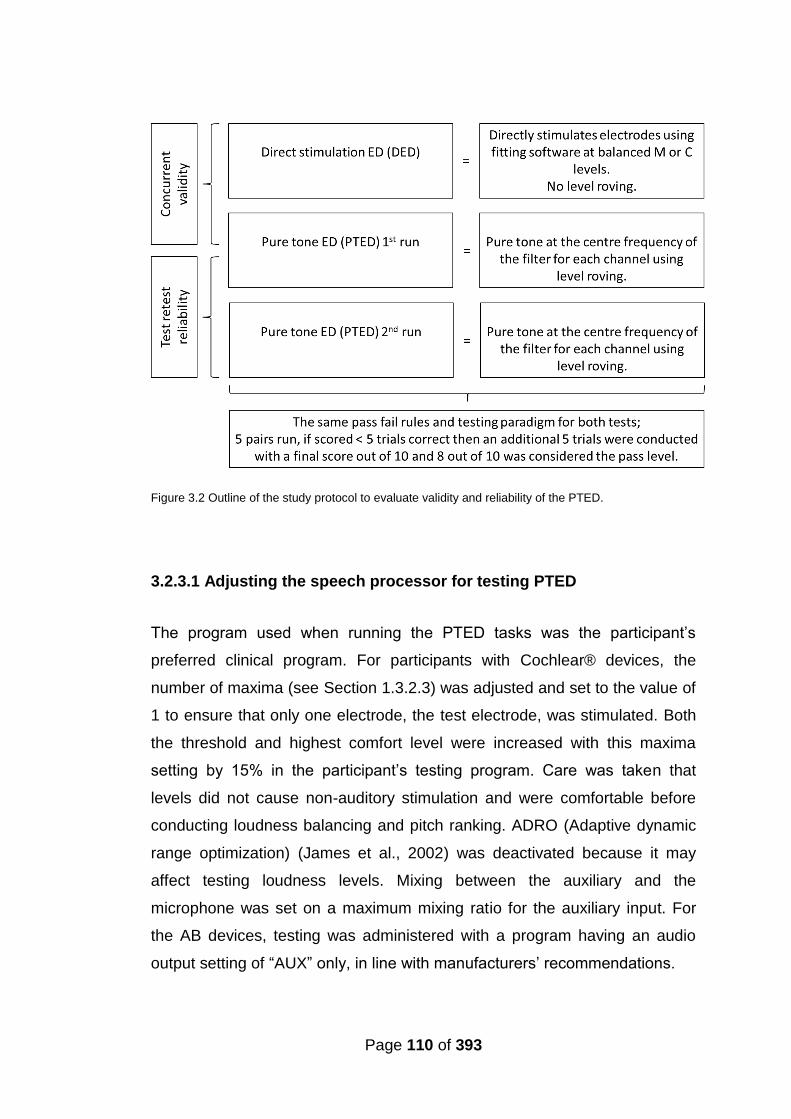
Page 110 of 393
Figure 3.2 Outline of the study protocol to evaluate validity and reliability of the PTED.
3.2.3.1 Adjusting the speech processor for testing PTED
The program used when running the PTED tasks was the participant’s
preferred clinical program. For participants with Cochlear® devices, the
number of maxima (see Section 1.3.2.3) was adjusted and set to the value of
1 to ensure that only one electrode, the test electrode, was stimulated. Both
the threshold and highest comfort level were increased with this maxima
setting by 15% in the participant’s testing program. Care was taken that
levels did not cause non-auditory stimulation and were comfortable before
conducting loudness balancing and pitch ranking. ADRO (Adaptive dynamic
range optimization) (James et al., 2002) was deactivated because it may
affect testing loudness levels. Mixing between the auxiliary and the
microphone was set on a maximum mixing ratio for the auxiliary input. For
the AB devices, testing was administered with a program having an audio
output setting of “AUX” only, in line with manufacturers’ recommendations.

Page 111 of 393
For both the AB and MED-EL™ devices it was not possible to avoid
stimulation spreading to adjacent electrode sites.
3.2.3.2 Validation of the PTED procedure
Eight participants (2 with Cochlear®, 3 with MED-EL™ and 3 with AB
implants) were tested with both the DED and the PTED test for the same
electrode configurations and frequency tables (frequency to electrode
allocation in the CI program; Section 1.3.2). The pass/fail scores for all
electrode pairs that were tested with both procedures were compared, using
a pass level of 80%. Furthermore all individual electrodes were categorised
into problematic versus non-problematic and comparison was made across
procedures.
3.2.3.3 Reliability of the PTED procedure
Inter-session test-retest reliability of the PTED was established using the
same electrode pairs, the same programs and the same frequency tables
(for program and frequency table see Section 1.3.2). Ten participants
conducted two test sessions each that were at least one month apart. All
electrode pairs and electrodes were compared across sessions and the ED
pass level was, again, 80%. Furthermore all individual electrodes were
categorised into problematic versus non-problematic and comparison was
made across sessions.
3.2.3.4 Clinical use feasibility of PTED via STAR software
To evaluate potential feasibility of PTED in a clinical setting in terms of
testing time, the median duration of testing per frequency pair was measured
for both the loudness matching and the pitch ranking task. Loudness
matching data for 2458 trials of 351 frequency pairs and pitch ranking data
for 6927 trials were collected and used in the analysis. In contrast to the fixed
number of trials per electrode pair in the pitch ranking task (five or ten), the
Page 112 of 393
number of trials per electrode pair in the loudness matching varied more
widely and thus affected testing time. Therefore, number of loudness
matching trials per electrode pair was also measured.
3.3 Analyses
Statistical analysis was conducted to assess the following:
1. Whether there was a significant relationship between DED and PTED
results for the tested electrode pairs and for identification of
indiscriminable electrodes.
2. Whether there was a significant relationship between the test-retest
PTED results for the tested electrode pairs and for the identification of
indiscriminable electrodes without demonstration of a learning effect.
3. Whether the testing duration of both PTED tasks (loudness matching
and pitch ranking) renders PTED a clinically practical/feasible
procedure.
IBM SPSS STATISTICS 21 for windows was used to carry out the analyses,
p values are two tailed and significance is reported when p<0.05.
3.3.1 Validation of the PTED procedure
3.3.1.1 Categorisation of electrode-pairs into pass or fail
All PTED and DED scores for all electrode pairs were categorized as pass or
fail; resulting data was categorical ordinal data with one category (pass)
more common than (fail), hence Goodman-Kruskal Gamma (a test of
association that can be used with categorical ordered data (Agresti and
Finlay, 1997) was used with the group results to determine agreement.
Group and individual agreement results in addition to the upper and lower
quartiles of agreement per participant were also calculated.
Page 113 of 393
3.3.1.2 Categorisation of individual electrodes into problematic versus
non problematic
Since the goal of developing a tool to assess the ED of the CI device is to
identify indiscriminable/problematic electrodes, the categorical data was
further analysed. Each electrode was identified as either non-problematic or
problematic, The Goodman-Kruskal Gamma was then used to evaluate for
agreement between DED and PTED on problematic versus non-problematic
electrodes.
In an indiscriminable electrode pair, the electrode was considered
problematic according to the following criteria:
1. If an electrode is common to two failing electrode-pairs.
2. Both electrodes in an indiscriminable pair if both have the same score
with the adjacent electrodes on either side.
3. The poorer electrode in an indiscriminable pair; the electrode with a
poorer score with the adjacent electrode.
4. The electrode at the end of electrode array in an indiscriminable pair.
3.3.2 Test-retest reliability of the PTED procedure
3.3.2.1 Categorisation of electrode-pairs into pass or fail
PTED scores for all electrode-pairs from both sessions were categorized as
pass or fail; resulting data was categorical ordinal data with one category
(pass) more common than (fail), hence Goodman-Kruskal Gamma was used
with the group results. Group and individual agreement results, in addition to
the upper and lower quartiles of agreement per participant, were also
calculated. To exclude a learning effect, a Wilcoxon signed test was
administered with the use of the actual scores (percent correct) obtained in
both PTED testing sessions.
Page 114 of 393
3.3.2.2 Categorisation of electrodes into problematic versus non
problematic
As mentioned earlier, the aim of an ED test is to identify
indiscriminable/problematic electrodes. Each electrode was identified as
either non-problematic or problematic, and the Goodman-Kruskal Gamma
was used to evaluate for test-retest agreement. The categorisation criteria of
indiscriminable/problematic electrodes described in Section (3.3.1.2) were
used.
3.3.3 Clinical use feasibility of the PTED via STAR software
Total testing duration and testing duration per PTED task was reported for
each participant, median, lower quartile (Q1) and higher quartile (Q3) and
interquaurtile (IQ) range was calculated for the group. The median, Q1, Q3
and IQ range was also calculated for per test-trial testing duration of both
PTED tasks, loudness balance and pitch ranking. Estimates of average and
maximum testing durations required for the different CI devices were
calculated based on median, Q1 and Q3 values and the number of tested
electrode pair in each device.
3.4 Results
3.4.1 Validation of the PTED procedure
Results obtained with both DED and PTED procedures were compared for
the same electrodes that were tested in both procedures in the same person
based on the pass/fail categorisation.
3.4.1.1 Categorisation of electrode-pairs into pass or fail
Group results (all electrode pairs of the eight participants as one group):
Goodman-Kruskal Gamma, revealed a significant strong correlation between
the DED and PTED (γ = 0.88, N = 104, p < .001), thus the hypothesis H1 was
accepted.
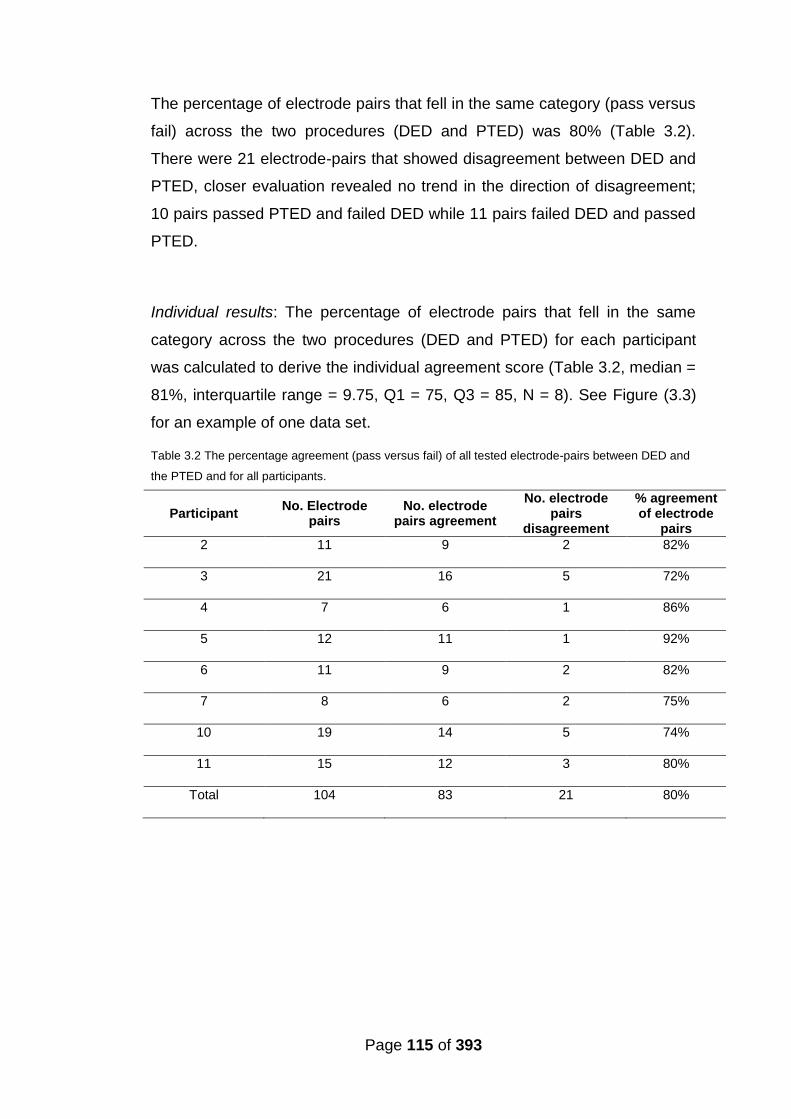
Page 115 of 393
The percentage of electrode pairs that fell in the same category (pass versus
fail) across the two procedures (DED and PTED) was 80% (Table 3.2).
There were 21 electrode-pairs that showed disagreement between DED and
PTED, closer evaluation revealed no trend in the direction of disagreement;
10 pairs passed PTED and failed DED while 11 pairs failed DED and passed
PTED.
Individual results: The percentage of electrode pairs that fell in the same
category across the two procedures (DED and PTED) for each participant
was calculated to derive the individual agreement score (Table 3.2, median =
81%, interquartile range = 9.75, Q1 = 75, Q3 = 85, N = 8). See Figure (3.3)
for an example of one data set.
Table 3.2 The percentage agreement (pass versus fail) of all tested electrode-pairs between DED and
the PTED and for all participants.
Participant No. Electrode
pairs No. electrode
pairs agreement
No. electrode pairs
disagreement
% agreement of electrode
pairs
2 11 9 2 82%
3 21 16 5 72%
4 7 6 1 86%
5 12 11 1 92%
6 11 9 2 82%
7 8 6 2 75%
10 19 14 5 74%
11 15 12 3 80%
Total 104 83 21 80%
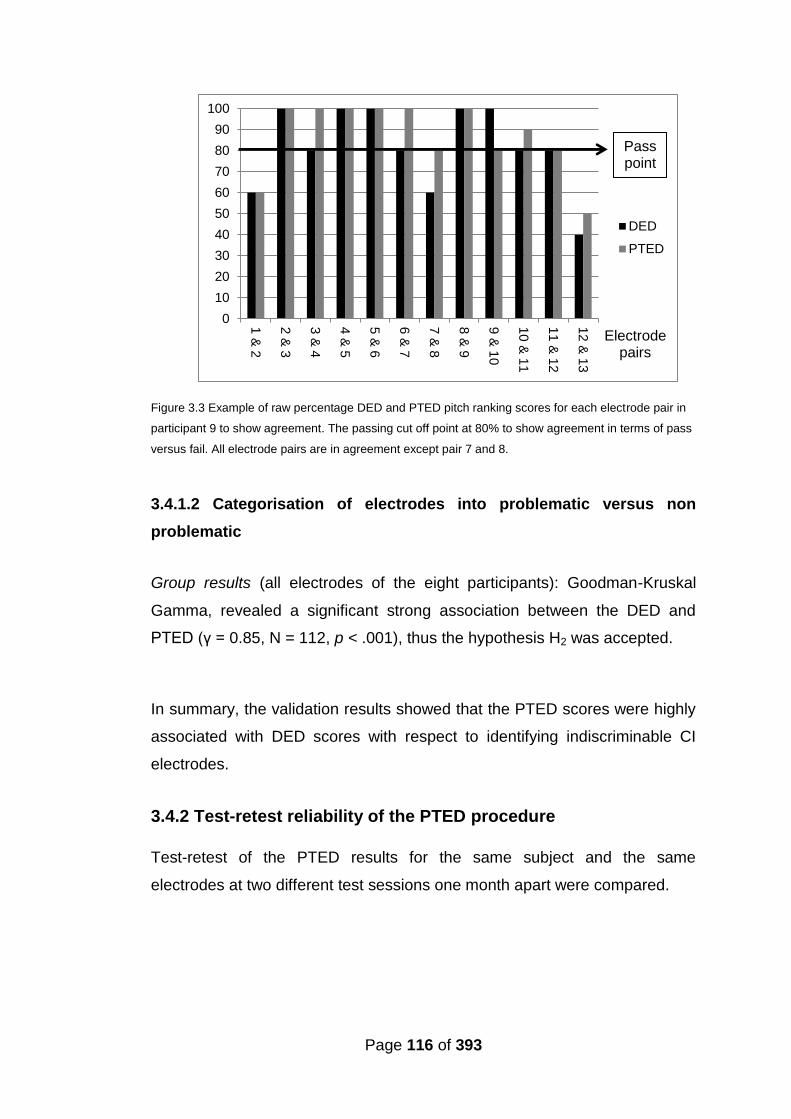
Page 116 of 393
Figure 3.3 Example of raw percentage DED and PTED pitch ranking scores for each electrode pair in
participant 9 to show agreement. The passing cut off point at 80% to show agreement in terms of pass
versus fail. All electrode pairs are in agreement except pair 7 and 8.
3.4.1.2 Categorisation of electrodes into problematic versus non
problematic
Group results (all electrodes of the eight participants): Goodman-Kruskal
Gamma, revealed a significant strong association between the DED and
PTED (γ = 0.85, N = 112, p < .001), thus the hypothesis H2 was accepted.
In summary, the validation results showed that the PTED scores were highly
associated with DED scores with respect to identifying indiscriminable CI
electrodes.
3.4.2 Test-retest reliability of the PTED procedure
Test-retest of the PTED results for the same subject and the same
electrodes at two different test sessions one month apart were compared.
0
10
20
30
40
50
60
70
80
90
100
1 &
2
2 &
3
3 &
4
4 &
5
5 &
6
6 &
7
7 &
8
8 &
9
9 &
10
10
& 1
1
11
& 1
2
12
& 1
3
DED
PTED
Electrode pairs
Pass point

Page 117 of 393
3.4.2.1 Categorisation of electrode-pairs into pass or fail
Group results (all electrode pairs of the ten participants as one group):
Goodman-Kruskal Gamma analysis revealed a highly significant association
between the two test sessions (γ = 0.95, n = 108, p < 0.001), thus the
hypothesis H3 was accepted.
The percentage of electrode pairs that fell in the same category (pass versus
fail) across the two test sessions for all tested electrode pairs was also
calculated and was 90% (Table 3.3).
Individual results: Individual test-retest agreement score are shown in Table
3.3 (median = 88.5%, interquartile range = 18, Q1 = 82, Q3 = 100, N = 10).
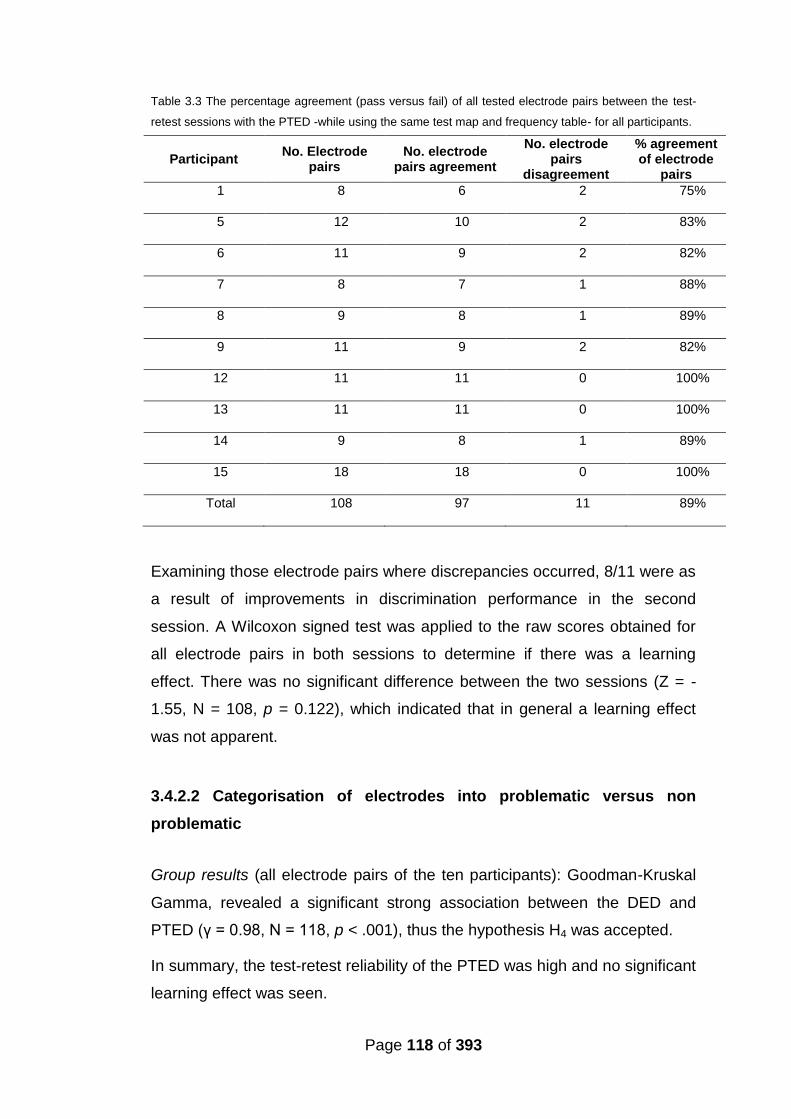
Page 118 of 393
Table 3.3 The percentage agreement (pass versus fail) of all tested electrode pairs between the test-
retest sessions with the PTED -while using the same test map and frequency table- for all participants.
Participant No. Electrode
pairs No. electrode
pairs agreement
No. electrode pairs
disagreement
% agreement of electrode
pairs
1 8 6 2 75%
5 12 10 2 83%
6 11 9 2 82%
7 8 7 1 88%
8 9 8 1 89%
9 11 9 2 82%
12 11 11 0 100%
13 11 11 0 100%
14 9 8 1 89%
15 18 18 0 100%
Total 108 97 11 89%
Examining those electrode pairs where discrepancies occurred, 8/11 were as
a result of improvements in discrimination performance in the second
session. A Wilcoxon signed test was applied to the raw scores obtained for
all electrode pairs in both sessions to determine if there was a learning
effect. There was no significant difference between the two sessions (Z = -
1.55, N = 108, p = 0.122), which indicated that in general a learning effect
was not apparent.
3.4.2.2 Categorisation of electrodes into problematic versus non
problematic
Group results (all electrode pairs of the ten participants): Goodman-Kruskal
Gamma, revealed a significant strong association between the DED and
PTED (γ = 0.98, N = 118, p < .001), thus the hypothesis H4 was accepted.
In summary, the test-retest reliability of the PTED was high and no significant
learning effect was seen.

Page 119 of 393
3.4.3 Clinical use feasibility of the PTED via STAR software
A clinically-viable test must be able to be carried out within the time frame of
a typical CI fitting session and the test must be sufficiently easy to use with
CI users with different devices and settings. The testing and scoring was
automated once the frequency test settings were entered. All participants
were able to follow instructions and complete the tasks without difficulty.
Testing duration of both tasks together (loudness balancing and pitch
ranking) for all participants was recorded and are shown in Table (3.4).
Table 3.4 Testing duration per participant for each of the PTED tasks (loudness matching and pitch
ranking) and the total testing duration; values are rounded up to the nearest minute.
Subject Loudness matching
testing duration
Pitch ranking testing
duration
Total testing duration
in minutes
1 10 7 17
2 13 14 27
3 32 25 57
4 10 9 19
5 13 11 24
6 10 12 22
7 19 10 29
8 12 9 21
9 4 11 15
10 15 20 35
11 15 9 24
12 5 7 12
13 19 9 28
14 11 8 19
15 16 15 31
The duration taken to conduct the loudness matching task ranged from 4 to
32 minutes and for the PTED’s pitch ranking task ranged from 7 to 25
minutes. Total testing duration for both tasks ranged from 12 to 57 minutes
(see Table 3.5 for descriptive statistics).
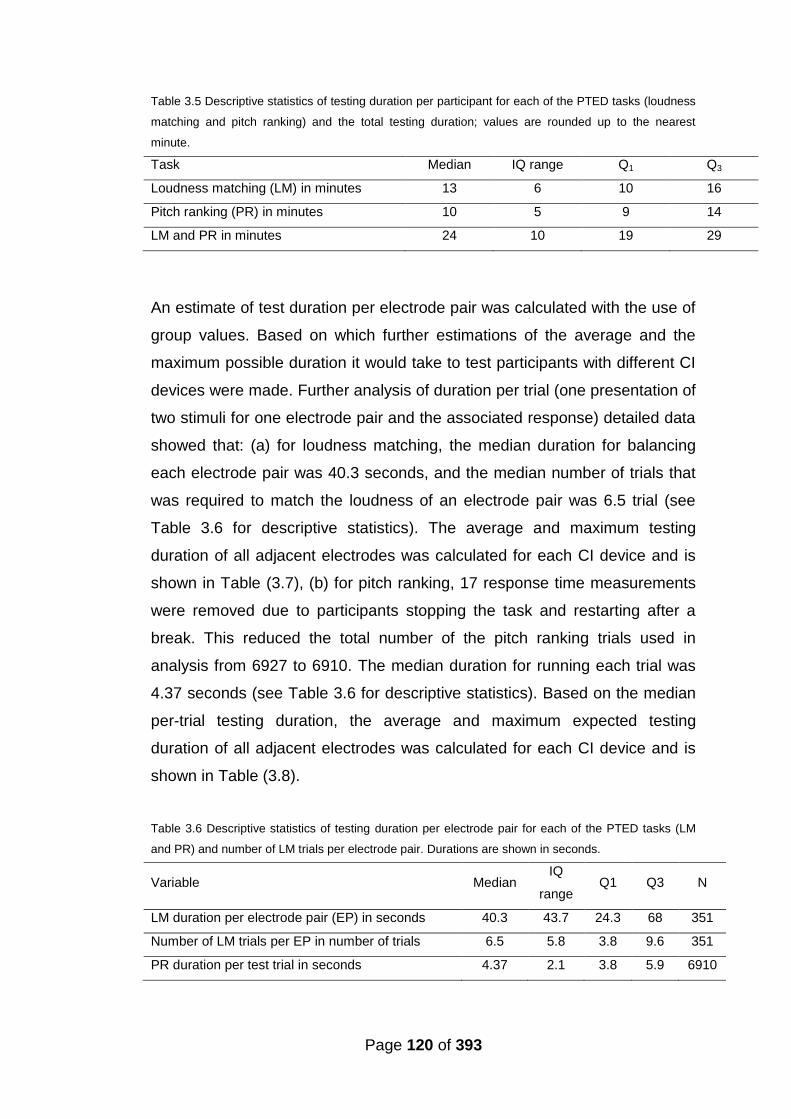
Page 120 of 393
Table 3.5 Descriptive statistics of testing duration per participant for each of the PTED tasks (loudness
matching and pitch ranking) and the total testing duration; values are rounded up to the nearest
minute.
Task Median IQ range Q1 Q3
Loudness matching (LM) in minutes 13 6 10 16
Pitch ranking (PR) in minutes 10 5 9 14
LM and PR in minutes 24 10 19 29
An estimate of test duration per electrode pair was calculated with the use of
group values. Based on which further estimations of the average and the
maximum possible duration it would take to test participants with different CI
devices were made. Further analysis of duration per trial (one presentation of
two stimuli for one electrode pair and the associated response) detailed data
showed that: (a) for loudness matching, the median duration for balancing
each electrode pair was 40.3 seconds, and the median number of trials that
was required to match the loudness of an electrode pair was 6.5 trial (see
Table 3.6 for descriptive statistics). The average and maximum testing
duration of all adjacent electrodes was calculated for each CI device and is
shown in Table (3.7), (b) for pitch ranking, 17 response time measurements
were removed due to participants stopping the task and restarting after a
break. This reduced the total number of the pitch ranking trials used in
analysis from 6927 to 6910. The median duration for running each trial was
4.37 seconds (see Table 3.6 for descriptive statistics). Based on the median
per-trial testing duration, the average and maximum expected testing
duration of all adjacent electrodes was calculated for each CI device and is
shown in Table (3.8).
Table 3.6 Descriptive statistics of testing duration per electrode pair for each of the PTED tasks (LM
and PR) and number of LM trials per electrode pair. Durations are shown in seconds.
Variable Median IQ
range Q1 Q3 N
LM duration per electrode pair (EP) in seconds 40.3 43.7 24.3 68 351
Number of LM trials per EP in number of trials 6.5 5.8 3.8 9.6 351
PR duration per test trial in seconds 4.37 2.1 3.8 5.9 6910
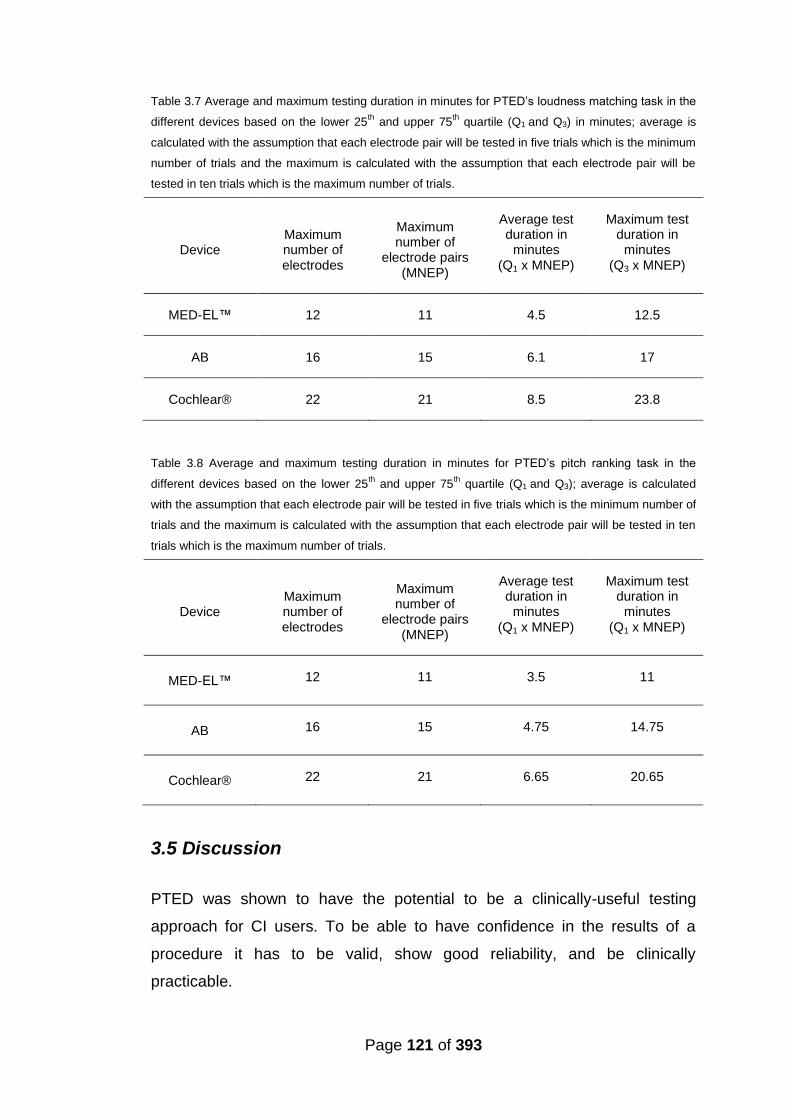
Page 121 of 393
Table 3.7 Average and maximum testing duration in minutes for PTED’s loudness matching task in the
different devices based on the lower 25th
and upper 75th
quartile (Q1 and Q3) in minutes; average is
calculated with the assumption that each electrode pair will be tested in five trials which is the minimum
number of trials and the maximum is calculated with the assumption that each electrode pair will be
tested in ten trials which is the maximum number of trials.
Device Maximum number of electrodes
Maximum number of
electrode pairs (MNEP)
Average test duration in
minutes (Q1 x MNEP)
Maximum test duration in
minutes (Q3 x MNEP)
MED-EL™ 12 11 4.5 12.5
AB 16 15 6.1 17
Cochlear® 22 21 8.5 23.8
Table 3.8 Average and maximum testing duration in minutes for PTED’s pitch ranking task in the
different devices based on the lower 25th and upper 75
th quartile (Q1 and Q3); average is calculated
with the assumption that each electrode pair will be tested in five trials which is the minimum number of
trials and the maximum is calculated with the assumption that each electrode pair will be tested in ten
trials which is the maximum number of trials.
Device Maximum number of electrodes
Maximum number of
electrode pairs (MNEP)
Average test duration in
minutes (Q1 x MNEP)
Maximum test duration in
minutes (Q1 x MNEP)
MED-EL™ 12 11 3.5 11
AB 16 15 4.75 14.75
Cochlear® 22 21 6.65 20.65
3.5 Discussion
PTED was shown to have the potential to be a clinically-useful testing
approach for CI users. To be able to have confidence in the results of a
procedure it has to be valid, show good reliability, and be clinically
practicable.
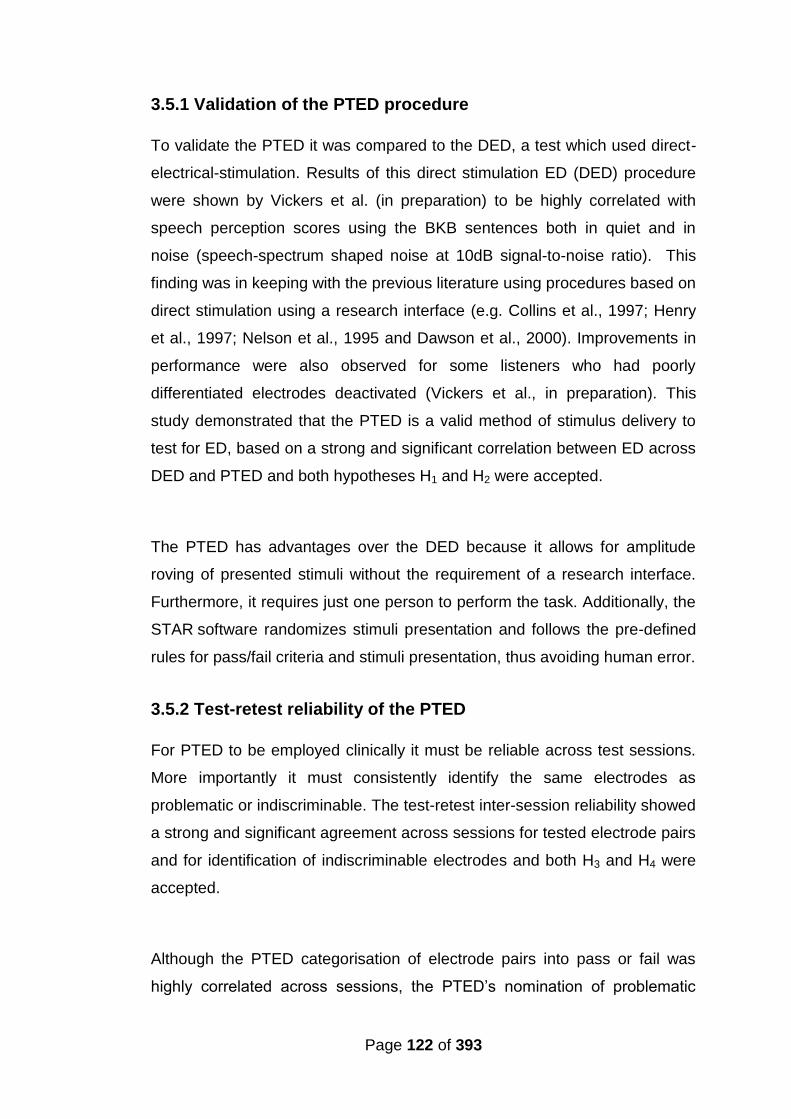
Page 122 of 393
3.5.1 Validation of the PTED procedure
To validate the PTED it was compared to the DED, a test which used direct-
electrical-stimulation. Results of this direct stimulation ED (DED) procedure
were shown by Vickers et al. (in preparation) to be highly correlated with
speech perception scores using the BKB sentences both in quiet and in
noise (speech-spectrum shaped noise at 10dB signal-to-noise ratio). This
finding was in keeping with the previous literature using procedures based on
direct stimulation using a research interface (e.g. Collins et al., 1997; Henry
et al., 1997; Nelson et al., 1995 and Dawson et al., 2000). Improvements in
performance were also observed for some listeners who had poorly
differentiated electrodes deactivated (Vickers et al., in preparation). This
study demonstrated that the PTED is a valid method of stimulus delivery to
test for ED, based on a strong and significant correlation between ED across
DED and PTED and both hypotheses H1 and H2 were accepted.
The PTED has advantages over the DED because it allows for amplitude
roving of presented stimuli without the requirement of a research interface.
Furthermore, it requires just one person to perform the task. Additionally, the
STAR software randomizes stimuli presentation and follows the pre-defined
rules for pass/fail criteria and stimuli presentation, thus avoiding human error.
3.5.2 Test-retest reliability of the PTED
For PTED to be employed clinically it must be reliable across test sessions.
More importantly it must consistently identify the same electrodes as
problematic or indiscriminable. The test-retest inter-session reliability showed
a strong and significant agreement across sessions for tested electrode pairs
and for identification of indiscriminable electrodes and both H3 and H4 were
accepted.
Although the PTED categorisation of electrode pairs into pass or fail was
highly correlated across sessions, the PTED’s nomination of problematic
Page 123 of 393
electrodes was even more so. The reason for that is because problematic
electrodes are common to two test electrode pairs, an adjacent electrode on
each side. So it may pass with one adjacent electrode but fail with the other,
or it may fail with both neighbouring electrodes. There were cases (5 of 11
discrepancies) where a problematic electrode was consistently (in both
sessions) indiscriminable with one adjacent electrode but showed
disagreement (pass versus fail) when tested with the adjacent electrode on
the opposite side of the electrode array. For example, electrode 9 in
participant 16; the participant failed to differentiate between electrode pair 9
and 10 in both sessions but correctly differentiated between electrode pair 8
and 9 in one session and failed in the other sessions (causing disagreement
between sessions for electrode pair 8 and 9). Despite the apparent
disagreement, the same poorly-differentiated electrode (electrode 9) was
identified in both sessions. Hence, PTED was found to be a highly reliable
tool in identifying indiscriminable electrodes.
3.5.3 Clinical use feasibility of the PTED
For this procedure to be employed as a clinical tool to identify electrodes with
poor pitch differentiation and guide programming, it is necessary to ensure
that the tested subjects are able to perform the task and can correctly rank
pitch. Amongst the participants tested here, all were able to rank pitch and
none of them reported finding the approach difficult. Consequently,
participants at this stage were not regularly provided with a training trial.
It is also essential that the procedure be time efficient. Total testing duration
for loudness matching and PTED’s pitch ranking tasks ranged from 12 to 57
minutes and would therefore not exceed the time currently allocated in the
NHS for a routine CI fitting session (around 60 minutes). Finally, the
procedure also requires sufficient flexibility to accommodate the different
frequency tables used by different CI recipients. Frequency tables are the
frequency range and frequency-electrode mapping in the CI program which
differ between manufacturers and fitting settings. The results of this study
Page 124 of 393
showed that the PTED provided sufficient flexibility. The PTED can thus be
used clinically for ED without undue prolongation of clinical visits.
3.6 Conclusion
The present study demonstrated that presenting ED test stimuli via STAR
software provides a clinically-viable solution that allows a valid, practical and
flexible procedure for mapping the frequency table. It also provides a tool
that could potentially help us improve performance with CIs, guided by ED
results. However, it is important to prepare the test programme settings,
speech processor settings and software settings to ensure the testing of ED
of the CI electrodes rather than a general ability to rank pitch.
3.7 summary
Several studies have employed different testing methods to identify
indiscriminable/problematic electrodes. They were clinically non-viable
due to time and/or equipment requirement.
The standard test for the identification of indiscriminable electrodes
has been direct stimulation of the CI electrodes.
PTED, a new test for electrode differentiation employing pure tones at
the electrodes centre-frequencies was evaluated for validity and
reliability.
PTED’s validity was assessed by comparing it to a direct-stimulation
electrode differentiation test, the DED and proved to be a valid test.
PTED’s test-retest reliability was evaluated and it showed high
reliability.
PTED’s clinical use feasibility was evaluated, testing duration (both
recorded and estimated) were within the time routinely allocated for
programming CI. Everyone was able to perform the tasks and the
software (STAR) was flexible enough to accommodate the different
devices and settings.
Page 125 of 393
PTED was found to be a valid and reliable clinically viable test for the
identification of indiscriminable electrodes.
Page 126 of 393
Chapter 4
Test-retest reliability of the Coordinate Response
Measure (CRM) speech perception test
Abstract
The coordinate response measure (CRM) is an adaptive speech perception
test with competing speakers as the masker. This study determined the test-
retest reliability of the CRM with normal hearing (NH) and adults with CIs.
The replicability, variability and stability of the CRM were evaluated for the
two groups separately. CRM had a better replicability, stability and lower
variability for the CI adults compared to NH adults.
4.1 Introduction
After establishing the PTED’s validity and reliability in Chapter 3, before
applying it to identify problematic electrodes and reprogramming based on its
results, the speech perception test battery had to be developed. One
consideration was that different types of masking have distinct effects on
speech perception and some make the test more sensitive for picking up
small changes in performance. In order to evaluate the efficacy of
reprogramming based on pitch perception (including PTED), the coordinate
response measure [(CRM) a speech on speech test] was used in addition to
the widely used BKB sentence test that contains strong contextual cues. The
CRM evaluates speech perception in the presence of a competing talker and
is potentially more sensitive to changes in the spectral resolution (Stickney et
al., 2004). Additionally CRM is not influenced by learning effects to the same
extent that the more context heavy more predictable speech perception tests
are. Prior to using the CRM the test-retest reliability and the minimum
clinically significant difference had to be established because this information
was not available for the test.

Page 127 of 393
Speech perception in noise is especially challenging for CI recipients, but it is
of vital importance if we consider everyday listening situations which are
rarely quiet (e.g. Friesen et al., 2001). Background noise and conflicting
speech cause some of the information in the target speech signal to be
masked, making it very difficult to recognise and understand speech.
Competing speech is especially difficult because of the combined effect of
energetic and informational masking (e.g. Freyman et al., 1999 and Kidd et
al., 1998; Arbogast et al., 2002; Brungart, 2001a and 2001b). Energetic
masking occurs at a more peripheral level when both the masker (e.g. noise)
and speech simultaneously carry energy at the same critical frequency
bands rendering portions of speech inaudible. Informational masking occurs
at a more central higher level when both the masker and target speech are
audible but the listener is unable to segregate the elements of the target
speech from that of the “similarly sounding” masker (e.g. Doll and Hanna,
1997; Kidd et al., 1994; Kidd et al., 1995; Watson, Kelly, and Wroton, 1976).
Speech perception tests are used clinically to evaluate speech recognition
for the hearing impaired and the CI users, as a means to evaluate functional
listening and to gain a good understanding of an individual’s everyday
listening ability. Some tests such as the BKB and the CUNY sentence tests
are routinely used. These sentence tests can be administered in both quiet
and in noise, and allow the listener to use contextual cues because the
sentences are meaningful and the listener can fill in the part they miss by
using the context of the words that they do detect. Typically the speech
perception tests are conducted in the presence of an interfering noise such
as a white, pink or speech shaped noise. The effect of using different types
of masking on speech perception has been highlighted by some studies (e.g.
Hawley et al., 2004; Arbogast et al., 2005; Stickney et al., 2004 and Qin and
Oxenham, 2003). For some people with good listening skills it could be
beneficial to test in the more challenging listening situations for example with
one or more competing speakers. This competing masker not only provides
some energetic masking from the excitation of the masker but also could
potentially provide informational masking. Energetic masking is widely
defined as peripheral masking that occurs because of energy overlap
between the target and masker both spectrally and temporally while
Page 128 of 393
informational masking is widely thought of as a competition between the
target and the masker at a central level of processing (Brungart, 2001b).
Hornsby et al. (2006) found that speech on speech masking had a greater
masking effect than speech-modulated noise for both NH and hearing
impaired individuals using hearing aids. They contributed the increased
difficulty to the combined effect of informational masking and energetic
masking. The CRM is administered to evaluate speech perception in the
presence of a competing talker; it is an adaptive test that requires limited
vocabulary which makes it suitable for listeners that do not have English as
their first language. The noise is adapted for positive signal-to-noise ratios
(SNR) and once 0dB SNR is reached the speech is adapted for the negative
SNRs. It can be used in conjunction with other speech perception measures
where each test can evaluate different aspects and provide a more complete
picture of the performance of the CI recipient.
4.1.1 The CRM speech perception test
The CRM was initially developed by the American Air Force Research
Laboratory (Moore, 1981) to test speech intelligibility in a multi-talker
environment. Stimuli consisted of low redundancy phrases in the following
form ‘‘Ready call sign go to colour number now’’, e.g. “Ready Charlie go to
Green Four now”. A target “call sign” which participants listened for was
selected and the participant had to respond by correctly identifying the colour
and number following the target “call sign”. However it has been used as a
speech recognition test outside of its initial military context (Brungart, 2001a
and 2001b; Brungart et al., 2001 and Kitterick et al., 2010). Brungart (2001a),
investigated the relationship between the CRM stimuli (corpus) and the
articulation index (AI) and found that within extremely difficult listening
environments (noisy environments), CRM has high sensitivity to small
intelligibility changes. Kitterick et al. (2010) tested 41 NH adults and used an
array of 13 loudspeakers at 15° separation and found that CRM SRT
(speech reception threshold) was better when each talker spoke one at a
time in comparison to two talkers speaking in pairs. They also found that
knowing “who” the talker saying the target phrase is, “where” the target
Page 129 of 393
phrase will be presented and “when” the target phrase will be presented
improved CRM SRTs when pairs of talkers started speaking at the same
time. When each talker started speaking one at a time only knowing “who”
was marginally beneficial. They concluded that masking and attention are
important factors in listening in multi-talker environments. However when
testing CRM with two talkers simultaneously presented (both from the same
speaker), knowing “where” or “when” do not become variables and knowing
“who” does not affect performance (Brungart et al., 2001). This may indicate
that using two talkers presented simultaneously from the same speaker may
reduce the effect of attention; a listener attending to the wrong talker can
simply switch to the second talker after hearing the wrong “call sign” used.
It must be noted that it was found that in the NH, reducing the intensity of the
target in comparison to the masker (negative signal to noise ratio) improved
speech perception in CRM because the listener was able to tune their
attention to the softer sound (Brungart, 2001b). In other words, the difference
in intensity provided a cue to distinguish between the target and masker
which outweighed the advantage provided by a larger SNR (signal to noise
ratio). This advantage may not be available to the CI recipients because their
speech reception thresholds are unlikely to be at a negative SNR (i.e.
speech at a lower presentation level to the noise).
Competing speech maskers have a more detrimental effect on speech
perception for listeners with a CI when compared with other maskers such as
modulated (speech-spectrum-shape) noise or steady state noise (Stickney et
al., 2004). This same effect has been demonstrated in simulations with the
use of noise-vocoders, with NH individuals (Qin and Oxenham, 2003 and
Stickney et al., 2004). They found that a competing talker negatively affects
speech perception with a CI when compared with NH and more than other
maskers would (Stickney et al., 2004). These results were also replicated in
the simulated condition (Qin and Oxenham, 2003 and Stickney et al., 2004).
They concluded that this happened because of a combined effect of

Page 130 of 393
energetic and informational masking in addition to the reduced spectral
resolution and fine structure of the speech signal provided by the CI. The
reduced spectral resolution provided by the CI might have impaired the
listeners’ ability to distinguish between components of the target speech and
those of the competing speech. If so, then enhancing spectral representation
of the signal provided by the CI might improve speech perception in the
presence of a competing talker; this could be measured by a test such as the
CRM. An added benefit of using CRM in the evaluation of CI recipients would
be the introduction of new test material and avoidance of learning effects.
CRM can potentially be used as a clinical tool but it is necessary to establish
the test-retest reliability and the minimum clinically significant change in the
CRM speech reception threshold (SRT) if it were to be used as a speech
perception assessment test.
4.1.2. Aims and hypothesis
This study evaluated the test-retest reliability of the CRM test for NH adults
and CI recipients. The aim was to collect data and determine the minimum
clinically significant difference for the CRM SRT by establishing replicability,
variability and stability, so it could be later used to analyse individual
performance changes in studies looking at reprogramming of the CI speech
processor. Both NH and CI users were tested to determine whether the
increased difficulty faced by CI users (Qin and Oxenham, 2003 and Stickney
et al., 2004) can affect test-retest reliability.
Main research hypotheses:
H1: NH will have significantly different CRM SRTs in comparison to CI
recipients.
H2: CRM SRTs will correlate across sessions for both the NH and the CI
recipient groups.
Page 131 of 393
4.2 Method
4.2.1 Participants
The CI recipients were recruited from the RNTNEH and through the NCIUA.
13 adult (CI) recipients with acquired deafness were recruited, four of whom
were male and nine were female.
The inclusion criteria were that the participants had:
1. A minimum of 18 months CI experience.
2. An aural-oral mode of communication.
3. English as a first language.
Age at testing ranged between 27 to 77 years with a mean of 60 years (±
12). Among the participants recruited 4 had AB, 4 had MED-EL™ and 5 had
Cochlear® devices.
The NH adult volunteers were native English speakers recruited from
University College London (UCL). 33 adults aged 24 to 59 years with a mean
of 38 years (± 10) were recruited; they had pure-tone thresholds ≤ 15 dB HL
at octave frequencies between 0.25 and 8 kHz, inclusive, measured using
the British Society of Audiology guidelines (1981). There were 19 females
and 14 males. All the volunteers had their hearing evaluated on the day of
CRM testing to confirm normal thresholds at the time of testing; this means
that their hearing was tested twice once at the original test session and once
at the re-test session.
4.2.2 Test battery
Coordinate Response Measure (CRM)
The CRM with two talkers was used. This test was used within our standard
test battery when a participant scored over 50% in the BKB sentences in
speech-spectrum shaped noise at 10dB SNR. CRM was a more difficult task
Page 132 of 393
than the BKBs because it avoided contextual cues. The CRM sentence
corpus used consisted of 128 phrases spoken by eight native British English
speakers, four of which were female and four were male. Stimuli consisted of
low redundancy phrases in the following form ‘‘Ready call sign go to colour
number now’’, e.g. “Ready Charlie go to Green Four now”. The target “call
sign” which participants listened for was “Baron”. In each trial two talkers;
one male and one female uttered the stimuli which were presented from the
same speaker, directly ahead of the participant (at 0 a imuth). There were
seven possible distractor call signs ‘‘charlie,’’ ‘‘arrow,’’ ‘‘eagle,’’ ‘‘hopper,’’
‘‘laker,’’ ‘‘ringo,’’ ‘‘tiger’’. There were four colour options ‘‘blue,’’ ‘‘green,’’
‘‘red,’’ ‘‘white’’, and four numbers (one, two, three and four) which were
randomly assigned. The participant had to listen to the phrase containing
“Baron” and choose the colour and number combination presented in that
phrase by selecting from a button on the touch screen; e.g. “Ready Baron go
to Red Four”, the participant was required to choose “Red Four” for the
response to be considered correct. The test started at a SNR of 30dB (target
phrase presented at 60 dB SPL, non-target phrase presented at 30 dB SPL).
Positive SNR was achieved by attenuating the noise and negative SNR by
attenuating the target phrase thus the maximum presentation level of the
target phrase was reached at 0dB SNR. A simple up-down staircase
adaptive procedure was followed to determine the CRM SRT, in which three
reversals occurred before obtaining the threshold. Step size started at 10dB
and was halved twice after a reversal occurred to reach the smallest step
size of 2.5dB. The threshold was estimated based on the SNR of the 15 trials
following the third reversal and the outcome score was a threshold in dB at
which the colour and number in the target phrases were correctly chosen at
a 50% accuracy level.
4.2.3 Procedure
Testing took place in a 3.7×3.25 m double-walled sound booth where the
participant was seated 1 metre in front of an ear level loud speaker (Plus
XS.2, Canton) from which the speech and noise were presented. The stimuli
were stored (16 bits), sampling rate (44.1 kHz), presented using the AB-York
Page 133 of 393
Crescent of Sound (Kitterick et al., 2011). The participants used a touch
screen monitor to respond, and the software ran the test presentation and
scoring in an automated fashion.
The participants underwent two testing sessions at least one month apart;
participants were tested twice for CRM in each session and an average CRM
SRT was obtained in each session for each participant. The CI recipients
were experienced CI users who have been using their CI program used
during testing for a minimum of two months prior to testing.
4.2.4 Analyses
The analyses aimed to establish:
1. Whether there was a significant difference in the CRM SRT between
NH participants and participants with a CI.
2. Whether there is a strong relationship between CRM SRTs across
sessions for both groups; the NH and the CI recipients (as part of the
test-retest reliability analysis).
3. Minimum clinically significant change which was calculated as part of
establishing the test-retest reliability.
IBM SPSS STATISTICS 21 for windows was used to carry out the analyses.
CRM SRT average per session for each participant was used for analysis.
According to Shapiro-Wilk’s test, all CRM SRTs for both groups were
normally distributed so parametric statistical tests were used.
An independent t-test was used to compare CRM SRTs between groups and
the Pearson product-moment correlation coefficient was used to establish
the relationship between scores obtained in the two sessions for each group.
4.2.4.1 Test-retest reliability
Three measures were used to evaluate test-retest reliability, which were
proposed by Summerfield et al. (1994). Not only do they evaluate the
Page 134 of 393
relationship between the test-retest CRM SRTs but they also provide a value
of the minimum clinically significant difference.
Replicability: measured as the correlation coefficient between pairs of CRM
SRTs, which establishes whether the second score can be predicted from
the first.
Variability: measured as the within-subjects standard deviation (σ) of across-
sessions scores. When an individual is tested twice by the same tool in
similar conditions, a reliable test would produce the same results giving rise
to a smaller σ. In this case we are more interested in the group results;
hence a mean within-subjects standard deviation (σw) was calculated. The
following equation adopted from Summerfield et al. (1994) was used.
√∑ ∑ ( )
( )
Where k is the number of the participants, n is the number of test trials, is
the ј th CRM SRT of the ith participant and µ is the mean threshold for the ith
participant. Any score for any randomly chosen participant should lie within
±1.96 σw of that participant’s mean score with a p≥ 95; i.e. the 95%
confidence interval.
Stability: measured as the standard deviation of the difference (σ ) in
thresholds collected twice under similar conditions. If the difference between
thresholds is equal or more than 1.96 σ then it is significant with p≥ 95.
4.3 Results
4.3.1 Difference between NH and CI recipients
All CRM SRTs obtained in both sessions were used in the comparison. The
group results of the CRM SRTs of the NH and CI recipients are shown in
Figure (4.1). When thresholds from both sessions were clustered per group,
the between-subjects variance was greater in the CI recipients’ group,
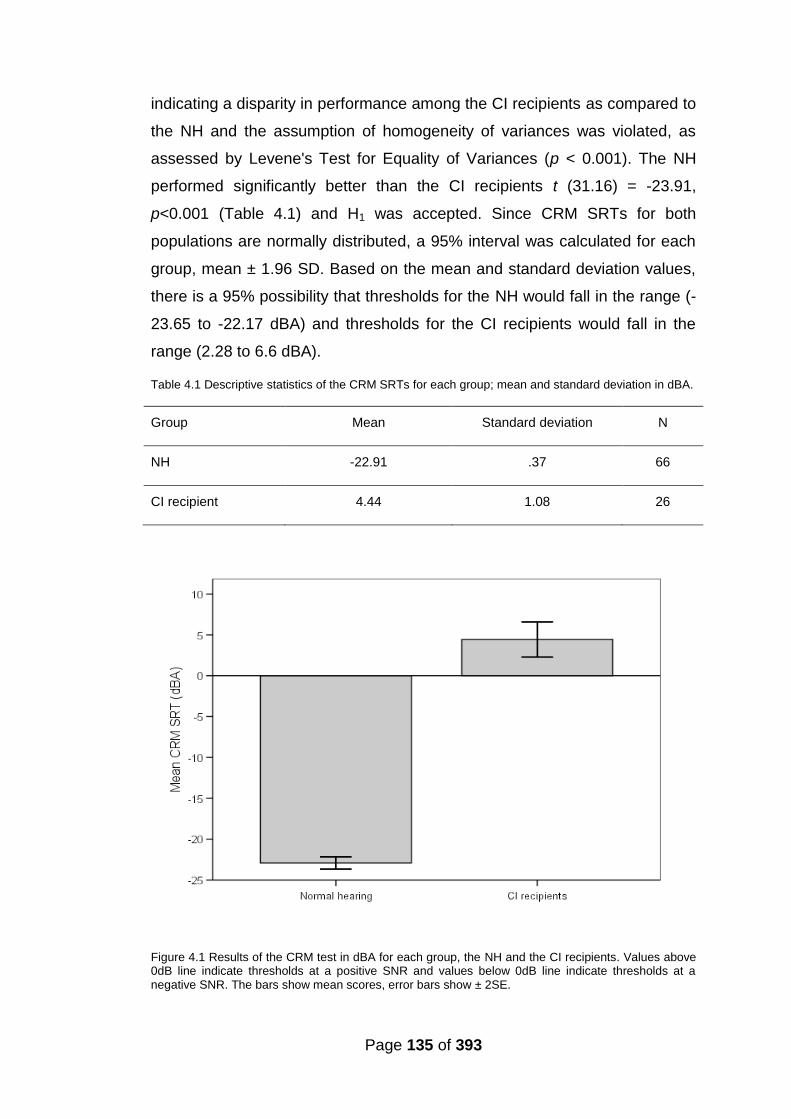
Page 135 of 393
indicating a disparity in performance among the CI recipients as compared to
the NH and the assumption of homogeneity of variances was violated, as
assessed by Levene's Test for Equality of Variances (p < 0.001). The NH
performed significantly better than the CI recipients t (31.16) = -23.91,
p<0.001 (Table 4.1) and H1 was accepted. Since CRM SRTs for both
populations are normally distributed, a 95% interval was calculated for each
group, mean ± 1.96 SD. Based on the mean and standard deviation values,
there is a 95% possibility that thresholds for the NH would fall in the range (-
23.65 to -22.17 dBA) and thresholds for the CI recipients would fall in the
range (2.28 to 6.6 dBA).
Table 4.1 Descriptive statistics of the CRM SRTs for each group; mean and standard deviation in dBA.
Group Mean Standard deviation N
NH -22.91 .37 66
CI recipient 4.44 1.08 26
Figure 4.1 Results of the CRM test in dBA for each group, the NH and the CI recipients. Values above 0dB line indicate thresholds at a positive SNR and values below 0dB line indicate thresholds at a negative SNR. The bars show mean scores, error bars show ± 2SE.
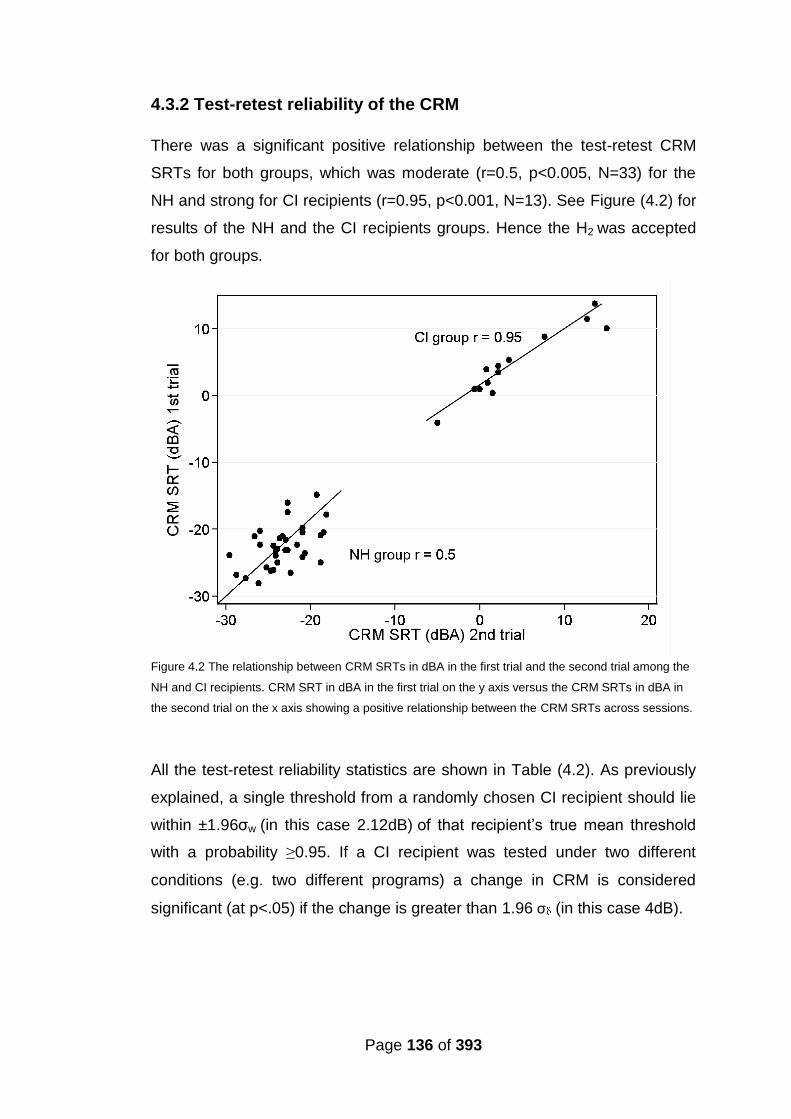
Page 136 of 393
4.3.2 Test-retest reliability of the CRM
There was a significant positive relationship between the test-retest CRM
SRTs for both groups, which was moderate (r=0.5, p<0.005, N=33) for the
NH and strong for CI recipients (r=0.95, p<0.001, N=13). See Figure (4.2) for
results of the NH and the CI recipients groups. Hence the H2 was accepted
for both groups.
Figure 4.2 The relationship between CRM SRTs in dBA in the first trial and the second trial among the
NH and CI recipients. CRM SRT in dBA in the first trial on the y axis versus the CRM SRTs in dBA in
the second trial on the x axis showing a positive relationship between the CRM SRTs across sessions.
All the test-retest reliability statistics are shown in Table (4.2). As previously
explained, a single threshold from a randomly chosen CI recipient should lie
within ±1.96σw (in this case 2.12dB) of that recipient’s true mean threshold
with a probability ≥0.95. If a CI recipient was tested under two different
conditions (e.g. two different programs) a change in CRM is considered
significant (at p<.05) if the change is greater than 1.96 σ (in this case 4dB).
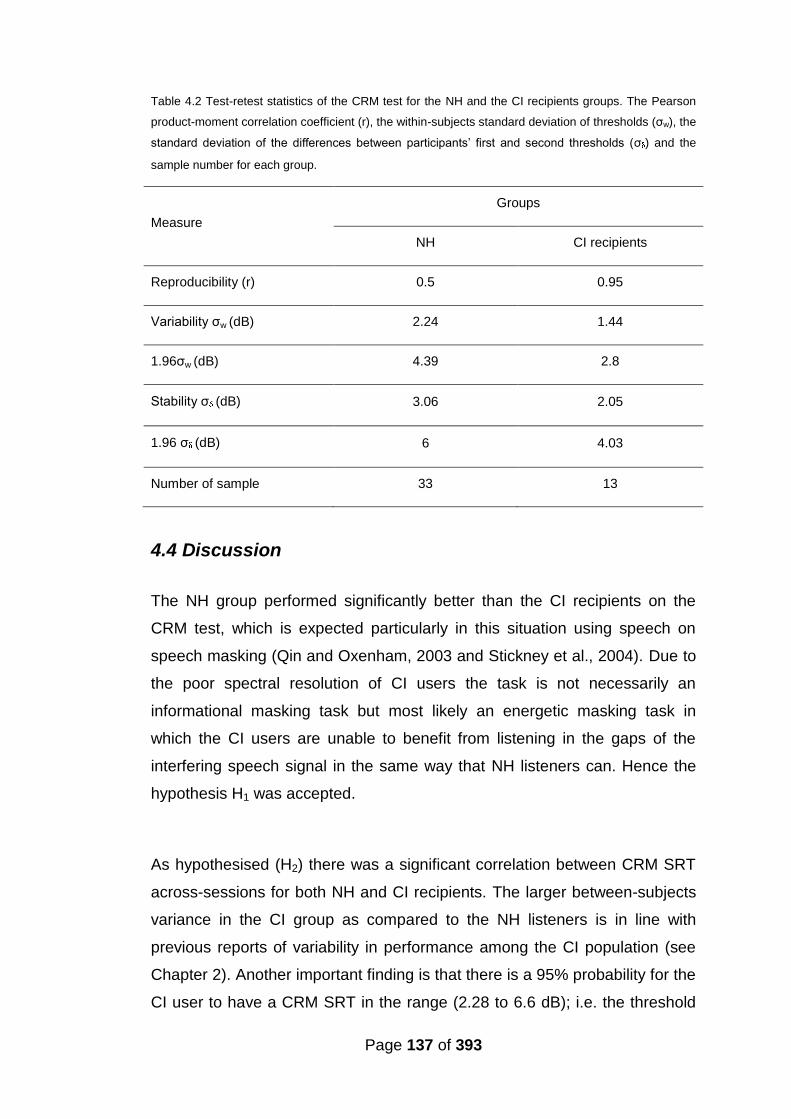
Page 137 of 393
Table 4.2 Test-retest statistics of the CRM test for the NH and the CI recipients groups. The Pearson
product-moment correlation coefficient (r), the within-subjects standard deviation of thresholds (σw), the
standard deviation of the differences between participants’ first and second thresholds (σ ) and the
sample number for each group.
Measure
Groups
NH CI recipients
Reproducibility (r) 0.5 0.95
Variability σw (dB) 2.24 1.44
1.96σw (dB) 4.39 2.8
Stability σ (dB) 3.06 2.05
1.96 σ (dB) 6 4.03
Number of sample 33 13
4.4 Discussion
The NH group performed significantly better than the CI recipients on the
CRM test, which is expected particularly in this situation using speech on
speech masking (Qin and Oxenham, 2003 and Stickney et al., 2004). Due to
the poor spectral resolution of CI users the task is not necessarily an
informational masking task but most likely an energetic masking task in
which the CI users are unable to benefit from listening in the gaps of the
interfering speech signal in the same way that NH listeners can. Hence the
hypothesis H1 was accepted.
As hypothesised (H2) there was a significant correlation between CRM SRT
across-sessions for both NH and CI recipients. The larger between-subjects
variance in the CI group as compared to the NH listeners is in line with
previous reports of variability in performance among the CI population (see
Chapter 2). Another important finding is that there is a 95% probability for the
CI user to have a CRM SRT in the range (2.28 to 6.6 dB); i.e. the threshold
Page 138 of 393
will most likely be at a positive SNR. In this case it will be highly unlikely for
CI recipients to be able to use the intensity cue, which a negative SRM could
provide the NH (see 4.1.1) where CRM improved because the listener was
able to tune their attention to the softer signal (Brungart, 2001b).
In contrast to the CI group, the ability of the NH to utilise the intensity cues at
a negative SNR could add an extra variable that may account for the higher
within-subject variability in the NH group. This may help explain the larger
within-subject variability as displayed by a lower correlation coefficient and a
higher variability (σw) and stability (σ ) values for that group. The minimum
clinically significant change (at p < 0.05) in CRM SRTs among CI users was
found to be > 4dB, and > 6 dB for the NH if an individual were to be tested
under two different conditions.
CI recipients exhibited less within-subject variability than the NH group,
potentially due to not being able to utilize the intensity cues effectively.
Hence, it was decided that for the minimum significant CRM SRT change for
CI users would be based purely on the data obtained from the CI recipients
within this study.
4.5 Conclusion
The trends in the CRM results are consistent with previous literature; the NH
had significantly lower thresholds than the CI recipients t (31.16) = -23.91,
p<0.001. There was higher between-subject variability among the CI
recipients as compared to the NH. In addition, loudness cues at negative
SNR increased within-subjects variability among the NH. The minimum
clinically significant change (at p < 0.05) in CRM SRTs among CI users was
found to be > 4dB, and > 6 dB for the NH.
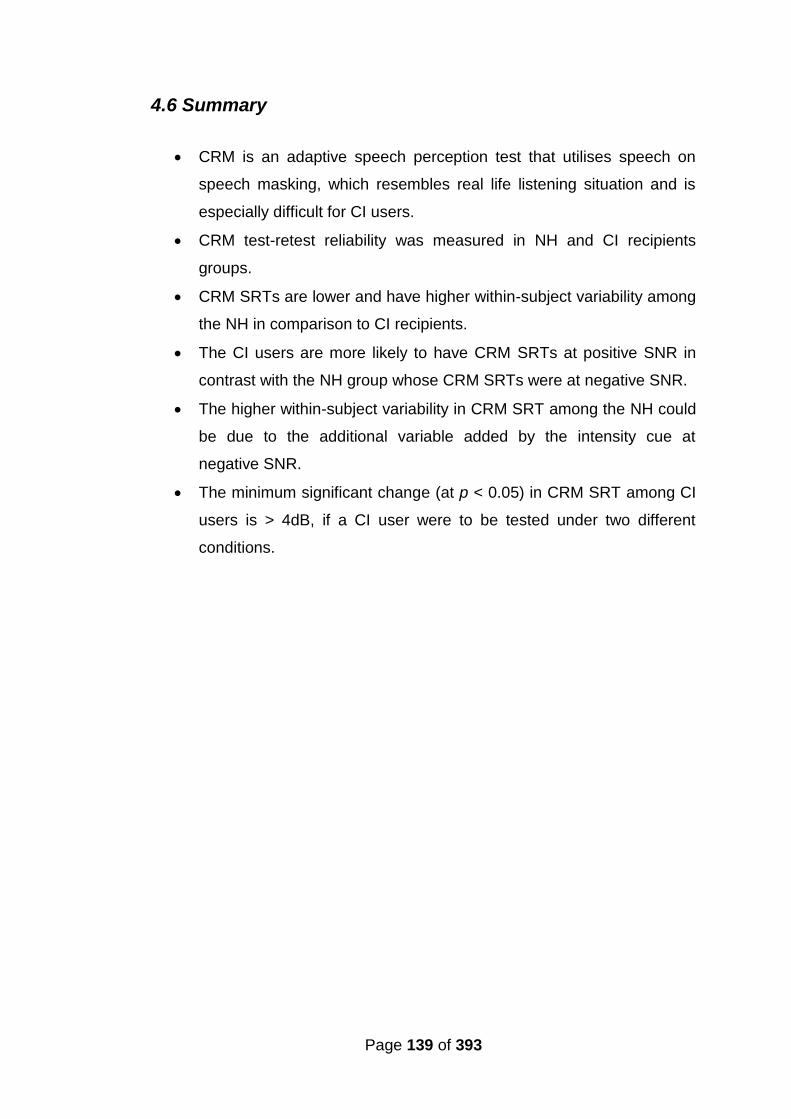
Page 139 of 393
4.6 Summary
CRM is an adaptive speech perception test that utilises speech on
speech masking, which resembles real life listening situation and is
especially difficult for CI users.
CRM test-retest reliability was measured in NH and CI recipients
groups.
CRM SRTs are lower and have higher within-subject variability among
the NH in comparison to CI recipients.
The CI users are more likely to have CRM SRTs at positive SNR in
contrast with the NH group whose CRM SRTs were at negative SNR.
The higher within-subject variability in CRM SRT among the NH could
be due to the additional variable added by the intensity cue at
negative SNR.
The minimum significant change (at p < 0.05) in CRM SRT among CI
users is > 4dB, if a CI user were to be tested under two different
conditions.

Page 140 of 393
Chapter 5
The relationship between PTED and speech
perception
Abstract
The association between ED measured via PTED (described in Chapter 3)
and speech perception scores (BKB in quiet and in pink noise and the CRM
test) was evaluated. In line with earlier literature, there was a positive
relationship between the percentage of discriminable electrodes and the
different speech perception measures (R2 ranging from 0.36 – 0.55).
Stronger associations were found between the percentage of discriminable
electrodes at the lower frequency range (≤ 2600 H ) than at higher
frequencies. Multiple regression tests revealed that the percentage of
discriminable electrodes especially at the low frequency range (< 1000 Hz) is
a significant predictor of speech perception performance and the models
accounted for up to 68% of variance in CRM SRTs. Findings from this study
along with findings from Chapter 3 provide evidence of the validity for the
PTED test as a test for ED.
5.1 Introduction
CI recipients hope to hear, listen and make sense of what is being heard, be
it speech or everyday sounds. As discussed there in Chapter 2, there is a
wide variance in the speech perception ability of the CI recipient population.
Among the factors discussed, the number of perceptually distinct channels is
considered to be a contributor to performance level (see Section 2.3.1).
Studies have shown better speech perception with a higher number of
perceptually distinct channels (Collins et al., 1997; Henry et al., 1997; Nelson
et al., 1995; Friesen et al., 2001 and Dawson et al., 2000). It would therefore
be expected that any valid and reliable test of ED would show a positive
relationship with speech perception. After establishing the validity and
Page 141 of 393
reliability of the PTED in Chapter 3 and the reliability of the speech
perception test CRM in Chapter 4, the PTED results were correlated with the
speech perception tests. A relationship between the PTED and speech
perception would indicate the validity of the measure PTED as an ED test.
Additionally many authors (Skinner et al., 1995; Henry et al., 2000; Fourakis
et al., 2004 and Fourakis et al., 2007) have shown that the lower frequency
range (frequencies ≤ 2600 Hz) and in particular the first formant region ≤
1000 Hz requires a larger number of electrodes to convey the information
than is required for the higher frequency regions for good speech perception.
This suggests that ED and spectral resolution in the low frequency range
may have a greater impact on speech perception than they do in the high
frequency range. Thus a valid test of ED that reflects the spectral resolution
of the signal provided by the CI should demonstrate the need for better
spectral resolution at low frequencies.
A study addressing the relationship between ED results as measured via
PTED in three different frequency ranges and speech perception is
described in this chapter. Additionally, the effect of other factors that may
affect speech perception with CI (in Chapter 2) is evaluated.
5.1.1 Aims and Hypotheses
The data collected in the first session of the studies described in Chapters 7
and 8 were analysed specifically to look at the association between the
estimated ED results obtained from the PTED procedure and the different
speech perception measures. Analysis of ED results was conducted using
estimates across the entire electrode array (at all frequencies) and in three
frequency ranges (≤1000H , 1000 H - 2600 Hz and >2600Hz). These
frequency ranges were chosen because of the different contributions that
they have on speech perception (Miller and Nicely, 1955; Shannon et al.,
2001; Skinner et al., 1995; Henry et al., 2000; Fourakis et al., 2004 and
Fourakis et al., 2007).
Main research hypotheses:
Page 142 of 393
H1: There will be a correlation between the percentage of discriminable
electrodes identified by the PTED test and speech perception with CI (BKB in
quiet and in noise and CRM-SRT).
H2: The correlations with speech perception (BKB in quiet and in noise and
CRM-SRT) will be different across the three different frequency regions for
the ED results.
H3: The percentage of discriminable electrodes identified by the PTED
especially at frequencies below 1000 Hz test will be a significant predictor of
speech perception with CI (BKB in quiet and in noise and CRM-SRT).
Previous studies in the field identifying the number of perceptually distinct CI
channels and associating it with speech perception employed direct
stimulation and used lengthy procedures. Finding an association between
the clinically-viable procedure described in Chapter 3 (PTED) and speech
perception would provide further support to PTED’s potential functional use.
5.2 Method
5.2.1 Participants
Participants were recruited from the RNTNEH and through the NCIUA.
36 adult CI recipients with acquired deafness were recruited.
The inclusion criteria were that the participants had:
1. A minimum of six months CI experience.
2. An aural-oral mode of communication.
3. English as a first language.
Participants’ demographics that were collected were:
(1) Duration of deafness which was calculated for each participant from the
date of diagnosis of a bilateral profound sensorineural hearing loss, it ranged
from 1 to 53 years. (2) Age at testing ranged between 19 to 83 years with a
Page 143 of 393
mean of 59 years (± 15.86). (3) The aetiology of the hearing loss was
unknown in 16 out of the 36 participants. (4) CI experience was calculated
from date of switch on of the present implant; it ranged from 8 to 204 months,
with a mean of 67 months (± 47) and a median of 57 months. (5) The hearing
loss was progressive for all of the participants. (6) Among the participants
there were 11 AB, 12 MED-El™ and 13 Cochlear® CI recipients.
Five participants had a pre or peri-lingual onset of hearing loss (before 5
years old) (participants 3, 4, 9, 26 and 31). Two participants (2 and 7) had a
history of cochlear explantation and re-implantation and participant 5 had a
“rolled over” electrode tip at insertion. Table (5.1) provides details of
participants’ demographics. Participant 34 was excluded due to being
diagnosed with dementia.
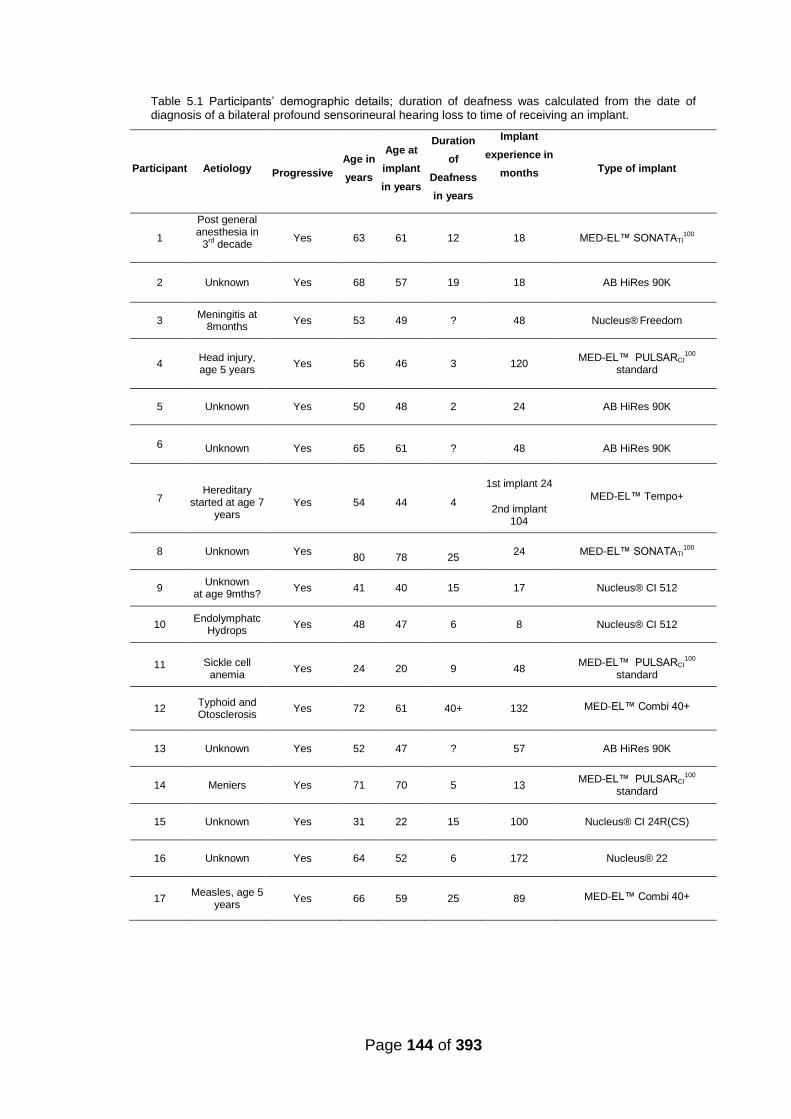
Page 144 of 393
Table 5.1 Participants’ demographic details; duration of deafness was calculated from the date of diagnosis of a bilateral profound sensorineural hearing loss to time of receiving an implant.
Participant Aetiology
Progressive
Age in
years
Age at
implant
in years
Duration
of
Deafness
in years
Implant
experience in
months
Type of implant
1
Post general anesthesia in
3rd decade
Yes 63 61 12 18 MED-EL™ SONATATI100
2 Unknown Yes 68 57 19 18 AB HiRes 90K
3 Meningitis at
8months Yes 53 49 ? 48 Nucleus®
Freedom
4
Head injury, age 5 years
Yes 56 46 3 120 MED-EL™ PULSARCI
100
standard
5 Unknown Yes 50 48 2 24 AB HiRes 90K
6 Unknown Yes 65 61 ? 48 AB HiRes 90K
7 Hereditary
started at age 7 years
Yes 54 44 4
1st implant 24
2nd implant 104
MED-EL™ Tempo+
8 Unknown Yes
80
78
25 24 MED-EL™ SONATATI
100
9 Unknown
at age 9mths? Yes 41 40 15 17 Nucleus® CI 512
10 Endolymphatc
Hydrops Yes 48 47 6 8 Nucleus® CI 512
11 Sickle cell anemia
Yes 24 20 9 48 MED-EL™ PULSARCI
100
standard
12 Typhoid and Otosclerosis
Yes 72 61 40+ 132 MED-EL™ Combi 40+
13 Unknown Yes 52 47 ? 57 AB HiRes 90K
14 Meniers Yes 71 70 5 13 MED-EL™ PULSARCI
100
standard
15 Unknown Yes 31 22 15 100 Nucleus® CI 24R(CS)
16 Unknown Yes 64 52 6 172 Nucleus® 22
17 Measles, age 5 years
Yes 66 59 25 89 MED-EL™ Combi 40+

Page 145 of 393
Table 5.1 (continued) Participants’ demographics.
Participant Aetiology
Progressive
Age in years
Age at implant in years
Duration of
Deafness in years
Implant experience in
months
Type of implant
18 Unknown Yes 75 70 1 57 MED-EL™ PULSARCI
100
standard
19 Unknown Yes 78 64 53 168 Nucleus® 22
20 Hereditary Yes 62 57 6 62 AB HiRes 90K
21 Unknown Yes 63 57 5 60 MED-EL™ PULSARCI
100
standard
22 Unknown Yes 64 51 33 153 MED-EL™ Combi 40+
23 Unknown Yes 71 69 9 25 MED-EL™ Combi 40+
24 Noise induced
and otosclerosis
Yes 83 72 40+ 123 Nucleus® CI 24M
25 Genetic started at age 20 years
Yes 77 73 7 48 AB HiRes 90K
26 Measles, age 5.5 years
Yes 62 57 6 62 Nucleus® CI 24R(CS)
27 Typhoid Yes 27 15 5 144 AB CI
28 Unknown Yes 67 66 ? 12 Nucleus® CI 512
29 Genetic started at age 40 years
Yes 59 60 7 72 Nucleus® CI 24R(CS)
30 Endolymphatic
Hydrops Yes 42 39 1 34 Nucleus®
Freedom (CA)
31 Genetic Yes 19 2 1 204? Nucleus® 22
32 Unknown Yes 60 56 ? 42 AB HiRes 90K
33 Otosclerosis Yes 69 63 7 71 Nucleus® Freedom
34 Genetic Yes 71 67 10 45 AB HiRes 90K
35 Unknown Yes 69 63 12 38 Nucleus® Freedom (CA)
36 Otosclerosis Yes 67 58 2 106 AB HiRes 90K
Page 146 of 393
5.2.2 Test battery
The PTED (described in Section 3.2.2.2) in addition to three speech
perception measures were used in testing, the CRM (described in Section
4.2.2) and the BKB sentence test in quiet and in speech-shaped noise at a
10dB SNR (signal-to-noise ratio).
BKB sentence test
The Bamford Kowal Bench (BKB) sentence test (Bench, Kowal, and
Bamford, 1979) had 20 possible lists, each containing 16 sentences and 50
key words. The sentences were presented by a male speaker at a level of
70dBA, and participants were asked to repeat the sentences and the number
of key words correct was scored. It was administered in quiet for all
participants and was also administered in speech-spectrum shaped noise at
a SNR of +10dB if the participant's BKB score in quiet was higher than 50%.
Two sentences were presented per condition and participants never received
the same list twice.
5.2.3 Procedure
Testing took place in a 3.7×3.25 m double-walled sound booth where the
participant was seated 1 metre in front of an ear level loud speaker (Plus
XS.2, Canton) from which the speech and noise were presented. The stimuli
were stored (16 bits), sampling rate (44.1 KHz) presented digitally using the
AB-York Crescent of Sound (Kitterick et al., 2011).
For CRM the participants responded using a touch screen monitor and the
software ran the test presentation and scoring in an automated fashion as
the SNR varied adaptively. During BKB testing, the tester entered the
participants’ verbal response by selecting the correct key words on the
tester’s monitor.
Page 147 of 393
All participants underwent BKB and PTED testing, CRM SRTs were
measured for 19 out of the 35 participants. CRM was added to the testing
protocol once the test-retest reliability had been established, it was
necessary to incorporate the test because some participants were achieving
scores falling within the ceiling range for BKB scores in quiet and in noise. All
testing took place in one session with the same CI program which had been
used by the participant for a minimum of two months prior to testing.
5.3 Analyses
BKB scores were converted to rationalized arcsine-transform units (RAU)
before conducting statistical analysis (Studebaker, 1985) to reduce the
impact of floor and ceiling effects. Percentage of discriminable electrode
pairs was calculated for each participant using the same pass/fail criteria
described in Chapter 3 (Section 3.2.3.2) to categorise all tested electrode
pairs via the PTED for each participant. This was done to establish the
percentage of discriminable electrode pairs for all tested frequencies (overall
percentage) and for the frequency ranges (1) frequencies ≤ 1000 H , (2)
1000 H < frequencies ≤ 2600 H (3) frequencies > 2600Hz. For each
participant AAI (see Section 2.1.1) was categorised as younger than or older
than 65 years (similar to Friedland et al., 2010) and duration of deafness
(see Section 2.1.3) was categorised to less than or equal to 15 years and
more than 15 years. The aetiology of deafness (see Section 2.1.4) was
categorised to either causing possible cochlear pathological changes such
as fibrosis or calcification (e.g., meningitis might cause ossification) or
aetiology that is not associated with such cochlear pathological changes. The
presence or absence of cochlear pathology that could be detected by
radiological evaluation (fibrosis, ossification or calcification) was also
determined based on radiological evidence (e.g. fibrosis following
explantation of a CI before re-implantation) for all participants.

Page 148 of 393
The statistical analysis was conducted to assess the following:
1. Whether there was a correlation between PTED’s overall percentage
of discriminable electrode pairs for the entire array and speech
perception (BKB in quiet and in noise and CRM SRT).
2. Whether there was a correlation between PTED’s percentage of
discriminable electrode pairs within different frequency bands
(≤1000Hz, 1000 Hz - 2600 Hz and >2600Hz) and speech perception
(BKB in quiet and in noise and CRM-SRT).
3. Whether there is a significant correlation between PTED’s percentage
of discriminable electrode pairs at all frequencies (overall percentage)
and at each frequency band and CRM-SRT (lower thresholds indicate
better results).
4. Whether the percentage of discriminable electrode pairs for the entire
array and within different frequency bands (≤1000H , 1000 H - 2600
Hz and >2600Hz), AAI, duration of deafness, aetiology of deafness or
presence of confirmed cochlear pathology can be used to predict
speech perception (BKB in quiet and in noise and CRM-SRT).
IBM SPSS STATISTICS 21 for windows was used to carry out the analyses.
Shapiro Wilk’s test revealed that BKB (RAU) scores in quiet and noise and
CRM SRT were normally distributed. It also revealed that PTED scores were
normally distributed for the group of 20 participants tested with CRM and for
the groups of 29 and 36 tested with BKB (RAU) scores in quiet and noise
respectively. Hence Pearson’s correlation coefficient was used to determine
the relationship between speech perception measures [BKB (RAU) scores in
quiet and noise and CRM-SRT] and PTED.
Stepwise multiple regression was used with each of the speech perception
measures separately [BKB (RAU) scores in quiet and in noise and CRM] as
the dependent variable and the percentage of discriminable electrode pairs
for the entire array and within different frequency bands, the AAI, the
duration of deafness, the aetiology of deafness and the presence of
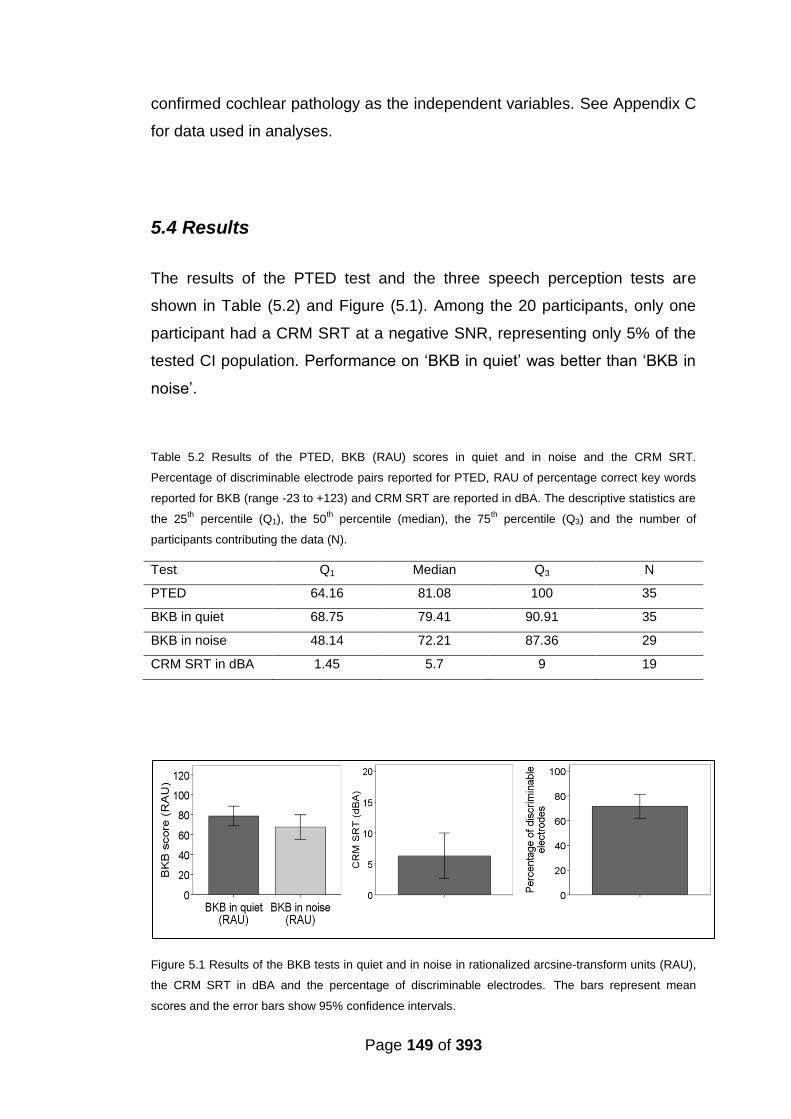
Page 149 of 393
confirmed cochlear pathology as the independent variables. See Appendix C
for data used in analyses.
5.4 Results
The results of the PTED test and the three speech perception tests are
shown in Table (5.2) and Figure (5.1). Among the 20 participants, only one
participant had a CRM SRT at a negative SNR, representing only 5% of the
tested CI population. Performance on ‘BKB in quiet’ was better than ‘BKB in
noise’.
Table 5.2 Results of the PTED, BKB (RAU) scores in quiet and in noise and the CRM SRT.
Percentage of discriminable electrode pairs reported for PTED, RAU of percentage correct key words
reported for BKB (range -23 to +123) and CRM SRT are reported in dBA. The descriptive statistics are
the 25th percentile (Q1), the 50
th percentile (median), the 75
th percentile (Q3) and the number of
participants contributing the data (N).
Test Q1 Median Q3 N
PTED 64.16 81.08 100 35
BKB in quiet 68.75 79.41 90.91 35
BKB in noise 48.14 72.21 87.36 29
CRM SRT in dBA 1.45 5.7 9 19
Figure 5.1 Results of the BKB tests in quiet and in noise in rationalized arcsine-transform units (RAU),
the CRM SRT in dBA and the percentage of discriminable electrodes. The bars represent mean
scores and the error bars show 95% confidence intervals.
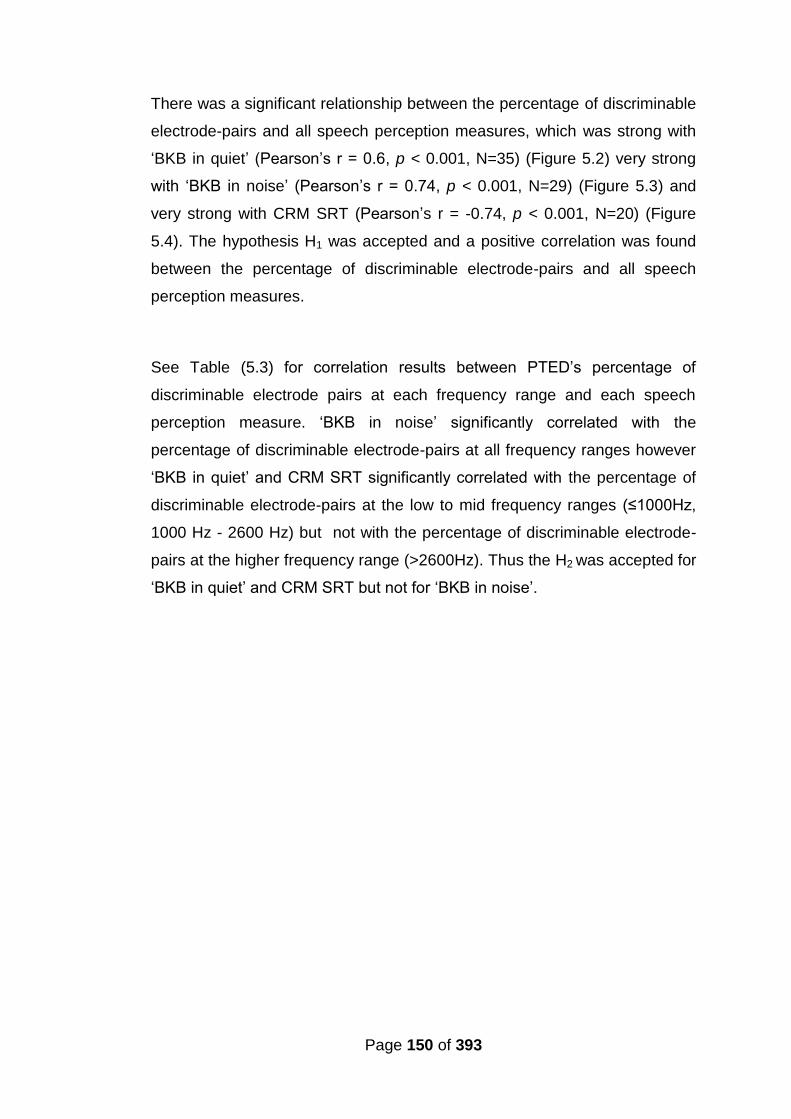
Page 150 of 393
There was a significant relationship between the percentage of discriminable
electrode-pairs and all speech perception measures, which was strong with
‘BKB in quiet’ (Pearson’s r = 0.6, p < 0.001, N=35) (Figure 5.2) very strong
with ‘BKB in noise’ (Pearson’s r = 0.74, p < 0.001, N=29) (Figure 5.3) and
very strong with CRM SRT (Pearson’s r = -0.74, p < 0.001, N=20) (Figure
5.4). The hypothesis H1 was accepted and a positive correlation was found
between the percentage of discriminable electrode-pairs and all speech
perception measures.
See Table (5.3) for correlation results between PTED’s percentage of
discriminable electrode pairs at each frequency range and each speech
perception measure. ‘BKB in noise’ significantly correlated with the
percentage of discriminable electrode-pairs at all frequency ranges however
‘BKB in quiet’ and CRM SRT significantly correlated with the percentage of
discriminable electrode-pairs at the low to mid frequency ranges (≤1000H ,
1000 Hz - 2600 Hz) but not with the percentage of discriminable electrode-
pairs at the higher frequency range (>2600Hz). Thus the H2 was accepted for
‘BKB in quiet’ and CRM SRT but not for ‘BKB in noise’.

Page 151 of 393
Figure 5.2 The relationship between BKB scores in quiet (RAU) and the PTED’s percentage of
discriminable electrodes. BKB scores in quiet (RAU) on the y axis versus PTED’s percentage of
discriminable electrode pairs on the x axis showing a moderate positive relationship. Without the
outliers, the Pearson’s r = 0.6 p < 0.001, N=33.
Figure 5.3 The relationship between BKB scores in noise (RAU) and the PTED’s percentage of
discriminable. BKB scores in noise (RAU) on the y axis versus PTED’s percentage of discriminable
electrode pairs on the x axis showing a strong positive relationship. Outliers are shown in grey. Without
the outliers, the Pearson’s r = 0.74 p < 0.001, N=27.

Page 152 of 393
Figure 5.4 The relationship between CRM SRT and the PTED’s percentage of discriminable. CRM
SRT on the y axis versus PTED’s percentage of discriminable electrode pairs on the x axis showing a
strong negative relationship between the CRM SRTs across sessions.
Table 5.3 Correlation results between PTED’s percentage of discriminable electrode pairs at each
frequency range [(1) frequencies ≤ 1000 H , (2) 1000 H < frequencies ≤ 2600 H (3) frequencies >
2600Hz and (4) all frequencies] and each speech perception measure (BKB in quiet and in noise and
CRM).
Percentage discriminable electrodes at
BKB in quiet Pearson’s
BKB in noise Pearson’s
CRM SRT Pearson’s
r p r p r p
Frequencies≤1000H 0.6** < 0.001 0.65** < 0.001 -0.67** < 0.005
1000 Hz < frequencies ≤ 2600 H
0.58** < 0.001 0.61** < 0.001 -0.51* < 0.05
Frequencies >2600Hz 0.12 0.5 0.49** < 0.005 -0.28 0.25
All frequencies 0.6** < 0.001 0.74** < 0.001 -0.74** < 0.001

Page 153 of 393
5.4.1 Results of multiple regression models
5.4.1.1 Results of multiple regression models using overall percentage
of discriminable electrode pairs as a potential predictor
Stepwise multiple regression analyses were carried out to determine the
predictors for ‘BKB in quiet’ (RAU), ‘BKB in noise’ (RAU) and CRM SRT.
Factors were added to each model one at a time starting with the best
predictor followed by the second best predictor and so on. The emphasis
was on finding the best predictors at each stage and the model was tested
for significance at each stage. Factors were added to maximize the Pearson
r coefficient and the goodness of fit of the model (ANOVA analysis). If two
predictors were highly correlated with each other and with the dependent
variable, often only one variable was chosen as a predictor in the model and
the other variable was not. This indicated that the latter variable did not
provide additional contribution to the model.
For ‘BKB in quiet’ (RAU), the independent variables entered were: the
percentage of discriminable electrodes for the full electrode array, the
presence of pathology, the AAI, the duration of deafness (as a categorical
and as a continuous variable) and the aetiology of deafness (as a categorical
and as a continuous variable). The only predictors reaching significance level
were the percentage of discriminable electrodes and the presence of
pathology. The prediction model contained these two predictors and was
reached in two steps. The model was statistically significant, F(2, 28) =
15.03, p < .01, and accounted for approximately 48% of the variance of ‘BKB
in quiet’ (RAU) (R2 = 0.52, Adjusted R2 = 0.48). ‘BKB in quiet’ (RAU) was
primarily predicted by the percentage of discriminable electrodes and to a
lesser extent by the presence of pathology. The raw and standardized
regression coefficients of the predictors are shown in Table (5.4). All other
variables (the AAI, the duration of deafness and the aetiology of deafness)
were non-significant predictors. The AAI and the duration of deafness were
non-significant when included as continuous or categorical variables.
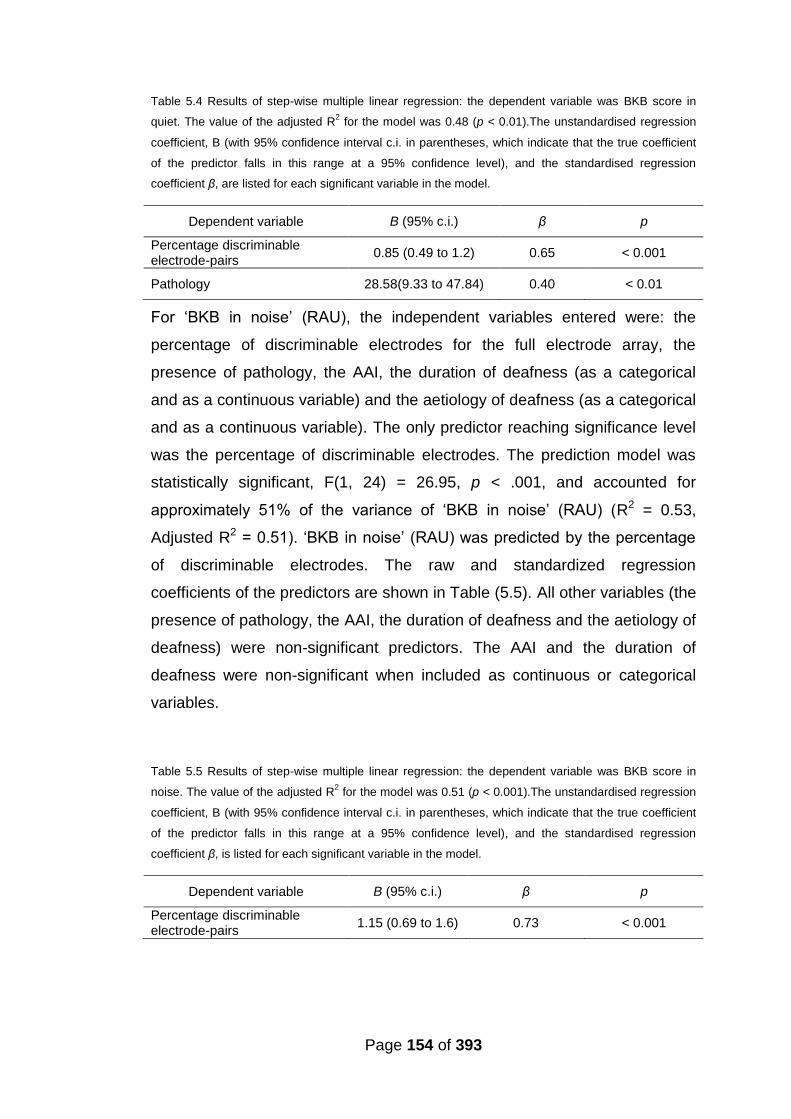
Page 154 of 393
Table 5.4 Results of step-wise multiple linear regression: the dependent variable was BKB score in
quiet. The value of the adjusted R2 for the model was 0.48 (p < 0.01).The unstandardised regression
coefficient, B (with 95% confidence interval c.i. in parentheses, which indicate that the true coefficient
of the predictor falls in this range at a 95% confidence level), and the standardised regression
coefficient β, are listed for each significant variable in the model.
Dependent variable B (95% c.i.) β p
Percentage discriminable electrode-pairs
0.85 (0.49 to 1.2) 0.65 < 0.001
Pathology 28.58(9.33 to 47.84) 0.40 < 0.01
For ‘BKB in noise’ (RAU), the independent variables entered were: the
percentage of discriminable electrodes for the full electrode array, the
presence of pathology, the AAI, the duration of deafness (as a categorical
and as a continuous variable) and the aetiology of deafness (as a categorical
and as a continuous variable). The only predictor reaching significance level
was the percentage of discriminable electrodes. The prediction model was
statistically significant, F(1, 24) = 26.95, p < .001, and accounted for
approximately 51% of the variance of ‘BKB in noise’ (RAU) (R2 = 0.53,
Adjusted R2 = 0.51). ‘BKB in noise’ (RAU) was predicted by the percentage
of discriminable electrodes. The raw and standardized regression
coefficients of the predictors are shown in Table (5.5). All other variables (the
presence of pathology, the AAI, the duration of deafness and the aetiology of
deafness) were non-significant predictors. The AAI and the duration of
deafness were non-significant when included as continuous or categorical
variables.
Table 5.5 Results of step-wise multiple linear regression: the dependent variable was BKB score in
noise. The value of the adjusted R2 for the model was 0.51 (p < 0.001).The unstandardised regression
coefficient, B (with 95% confidence interval c.i. in parentheses, which indicate that the true coefficient
of the predictor falls in this range at a 95% confidence level), and the standardised regression
coefficient β, is listed for each significant variable in the model.
Dependent variable B (95% c.i.) β p
Percentage discriminable electrode-pairs
1.15 (0.69 to 1.6) 0.73 < 0.001
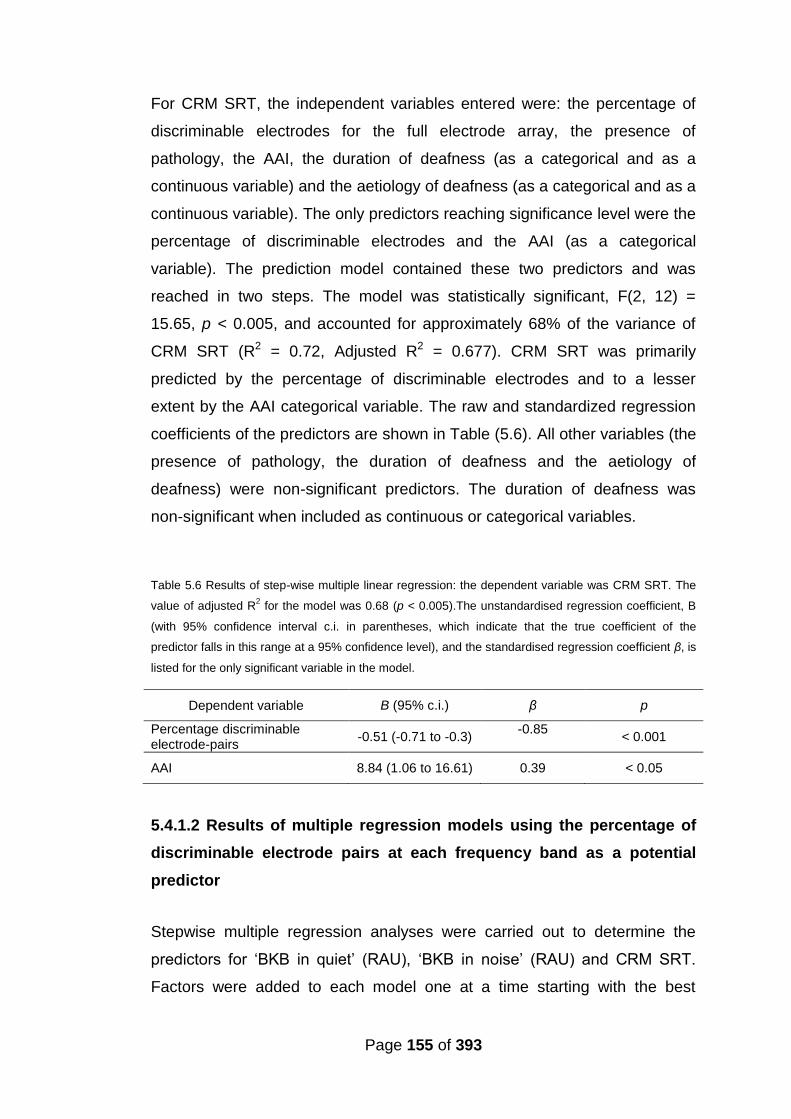
Page 155 of 393
For CRM SRT, the independent variables entered were: the percentage of
discriminable electrodes for the full electrode array, the presence of
pathology, the AAI, the duration of deafness (as a categorical and as a
continuous variable) and the aetiology of deafness (as a categorical and as a
continuous variable). The only predictors reaching significance level were the
percentage of discriminable electrodes and the AAI (as a categorical
variable). The prediction model contained these two predictors and was
reached in two steps. The model was statistically significant, F(2, 12) =
15.65, p < 0.005, and accounted for approximately 68% of the variance of
CRM SRT (R2 = 0.72, Adjusted R2 = 0.677). CRM SRT was primarily
predicted by the percentage of discriminable electrodes and to a lesser
extent by the AAI categorical variable. The raw and standardized regression
coefficients of the predictors are shown in Table (5.6). All other variables (the
presence of pathology, the duration of deafness and the aetiology of
deafness) were non-significant predictors. The duration of deafness was
non-significant when included as continuous or categorical variables.
Table 5.6 Results of step-wise multiple linear regression: the dependent variable was CRM SRT. The
value of adjusted R2 for the model was 0.68 (p < 0.005).The unstandardised regression coefficient, B
(with 95% confidence interval c.i. in parentheses, which indicate that the true coefficient of the
predictor falls in this range at a 95% confidence level), and the standardised regression coefficient β, is
listed for the only significant variable in the model.
Dependent variable B (95% c.i.) β p
Percentage discriminable electrode-pairs
-0.51 (-0.71 to -0.3) -0.85
< 0.001
AAI 8.84 (1.06 to 16.61) 0.39 < 0.05
5.4.1.2 Results of multiple regression models using the percentage of
discriminable electrode pairs at each frequency band as a potential
predictor
Stepwise multiple regression analyses were carried out to determine the
predictors for ‘BKB in quiet’ (RAU), ‘BKB in noise’ (RAU) and CRM SRT.
Factors were added to each model one at a time starting with the best
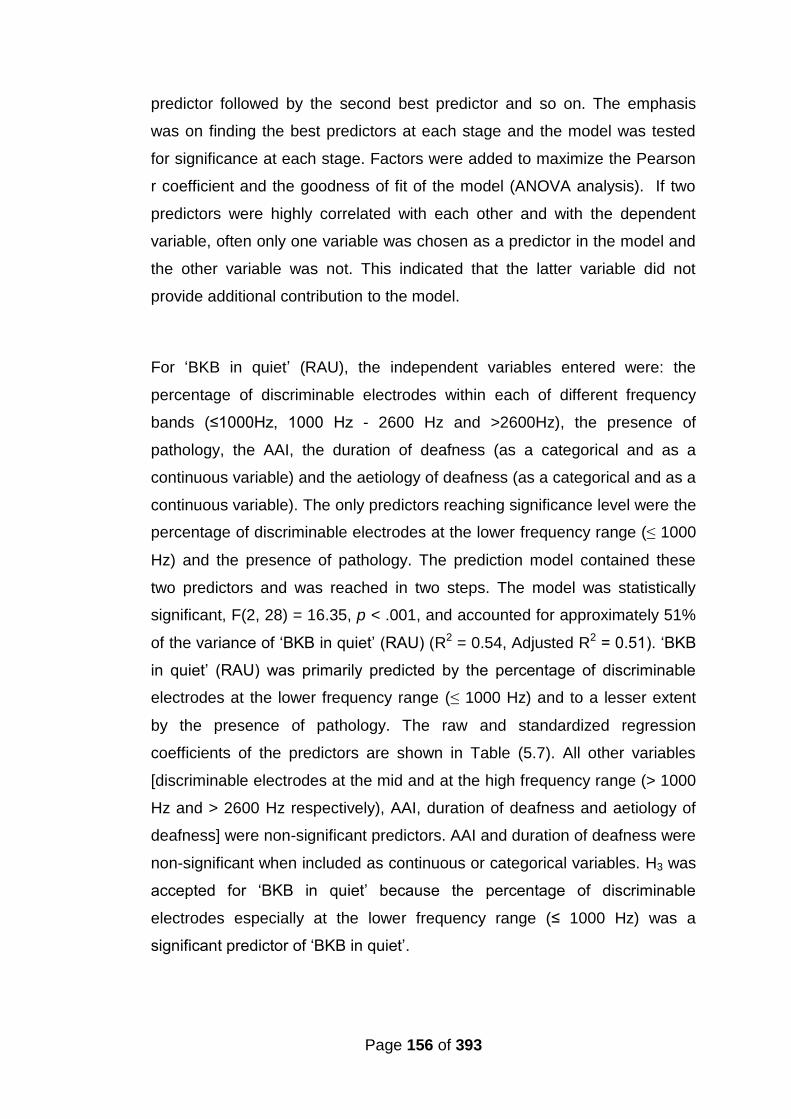
Page 156 of 393
predictor followed by the second best predictor and so on. The emphasis
was on finding the best predictors at each stage and the model was tested
for significance at each stage. Factors were added to maximize the Pearson
r coefficient and the goodness of fit of the model (ANOVA analysis). If two
predictors were highly correlated with each other and with the dependent
variable, often only one variable was chosen as a predictor in the model and
the other variable was not. This indicated that the latter variable did not
provide additional contribution to the model.
For ‘BKB in quiet’ (RAU), the independent variables entered were: the
percentage of discriminable electrodes within each of different frequency
bands (≤1000H , 1000 H - 2600 Hz and >2600Hz), the presence of
pathology, the AAI, the duration of deafness (as a categorical and as a
continuous variable) and the aetiology of deafness (as a categorical and as a
continuous variable). The only predictors reaching significance level were the
percentage of discriminable electrodes at the lower frequency range (≤ 1000
Hz) and the presence of pathology. The prediction model contained these
two predictors and was reached in two steps. The model was statistically
significant, F(2, 28) = 16.35, p < .001, and accounted for approximately 51%
of the variance of ‘BKB in quiet’ (RAU) (R2 = 0.54, Adjusted R2 = 0.51). ‘BKB
in quiet’ (RAU) was primarily predicted by the percentage of discriminable
electrodes at the lower frequency range (≤ 1000 Hz) and to a lesser extent
by the presence of pathology. The raw and standardized regression
coefficients of the predictors are shown in Table (5.7). All other variables
[discriminable electrodes at the mid and at the high frequency range (> 1000
Hz and > 2600 Hz respectively), AAI, duration of deafness and aetiology of
deafness] were non-significant predictors. AAI and duration of deafness were
non-significant when included as continuous or categorical variables. H3 was
accepted for ‘BKB in quiet’ because the percentage of discriminable
electrodes especially at the lower frequency range (≤ 1000 Hz) was a
significant predictor of ‘BKB in quiet’.
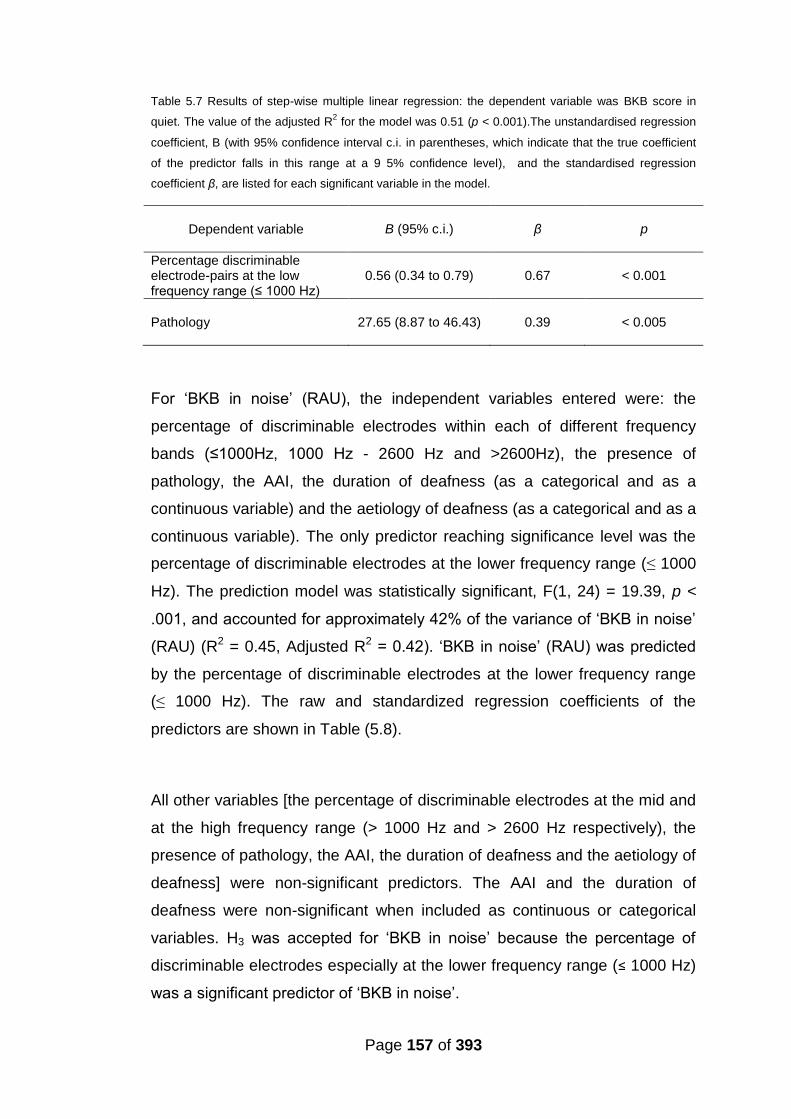
Page 157 of 393
Table 5.7 Results of step-wise multiple linear regression: the dependent variable was BKB score in
quiet. The value of the adjusted R2 for the model was 0.51 (p < 0.001).The unstandardised regression
coefficient, B (with 95% confidence interval c.i. in parentheses, which indicate that the true coefficient
of the predictor falls in this range at a 9 5% confidence level), and the standardised regression
coefficient β, are listed for each significant variable in the model.
Dependent variable B (95% c.i.) β p
Percentage discriminable electrode-pairs at the low frequency range (≤ 1000 H )
0.56 (0.34 to 0.79) 0.67 < 0.001
Pathology 27.65 (8.87 to 46.43) 0.39 < 0.005
For ‘BKB in noise’ (RAU), the independent variables entered were: the
percentage of discriminable electrodes within each of different frequency
bands (≤1000H , 1000 H - 2600 Hz and >2600Hz), the presence of
pathology, the AAI, the duration of deafness (as a categorical and as a
continuous variable) and the aetiology of deafness (as a categorical and as a
continuous variable). The only predictor reaching significance level was the
percentage of discriminable electrodes at the lower frequency range (≤ 1000
Hz). The prediction model was statistically significant, F(1, 24) = 19.39, p <
.001, and accounted for approximately 42% of the variance of ‘BKB in noise’
(RAU) (R2 = 0.45, Adjusted R2 = 0.42). ‘BKB in noise’ (RAU) was predicted
by the percentage of discriminable electrodes at the lower frequency range
(≤ 1000 Hz). The raw and standardized regression coefficients of the
predictors are shown in Table (5.8).
All other variables [the percentage of discriminable electrodes at the mid and
at the high frequency range (> 1000 Hz and > 2600 Hz respectively), the
presence of pathology, the AAI, the duration of deafness and the aetiology of
deafness] were non-significant predictors. The AAI and the duration of
deafness were non-significant when included as continuous or categorical
variables. H3 was accepted for ‘BKB in noise’ because the percentage of
discriminable electrodes especially at the lower frequency range (≤ 1000 Hz)
was a significant predictor of ‘BKB in noise’.
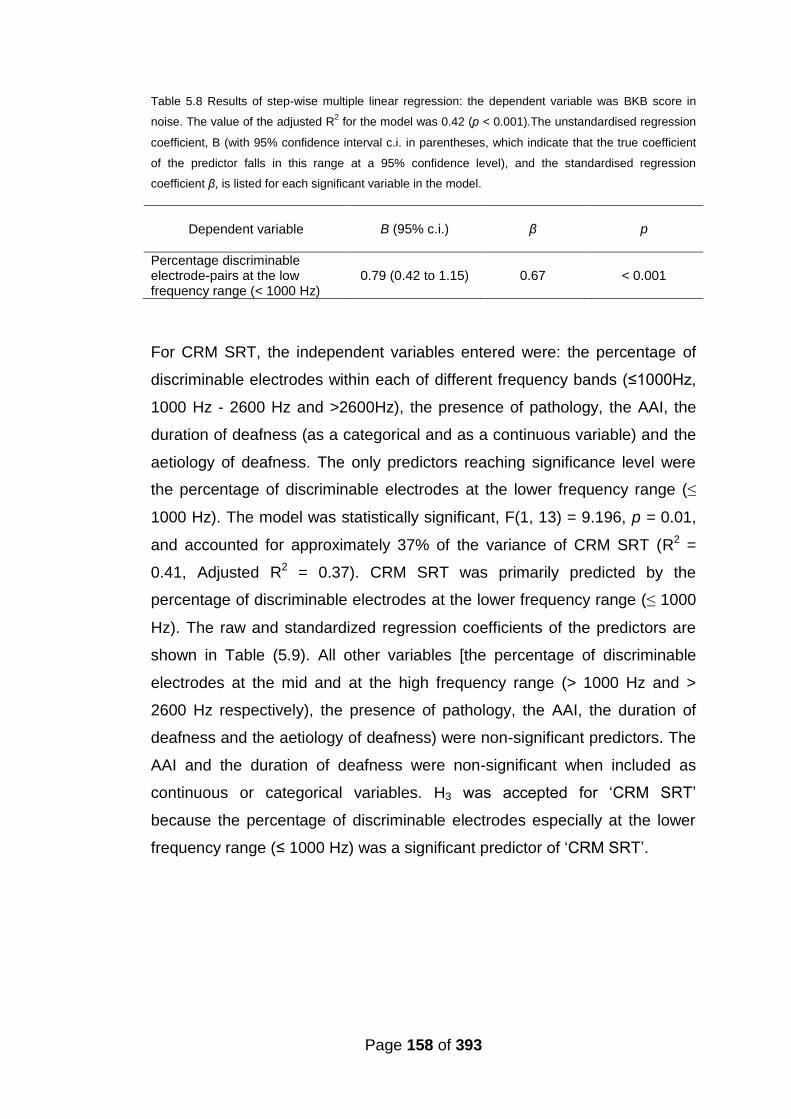
Page 158 of 393
Table 5.8 Results of step-wise multiple linear regression: the dependent variable was BKB score in
noise. The value of the adjusted R2 for the model was 0.42 (p < 0.001).The unstandardised regression
coefficient, B (with 95% confidence interval c.i. in parentheses, which indicate that the true coefficient
of the predictor falls in this range at a 95% confidence level), and the standardised regression
coefficient β, is listed for each significant variable in the model.
Dependent variable B (95% c.i.) β p
Percentage discriminable electrode-pairs at the low frequency range (< 1000 Hz)
0.79 (0.42 to 1.15) 0.67 < 0.001
For CRM SRT, the independent variables entered were: the percentage of
discriminable electrodes within each of different frequency bands (≤1000H ,
1000 Hz - 2600 Hz and >2600Hz), the presence of pathology, the AAI, the
duration of deafness (as a categorical and as a continuous variable) and the
aetiology of deafness. The only predictors reaching significance level were
the percentage of discriminable electrodes at the lower frequency range (≤
1000 Hz). The model was statistically significant, F(1, 13) = 9.196, p = 0.01,
and accounted for approximately 37% of the variance of CRM SRT (R2 =
0.41, Adjusted R2 = 0.37). CRM SRT was primarily predicted by the
percentage of discriminable electrodes at the lower frequency range (≤ 1000
Hz). The raw and standardized regression coefficients of the predictors are
shown in Table (5.9). All other variables [the percentage of discriminable
electrodes at the mid and at the high frequency range (> 1000 Hz and >
2600 Hz respectively), the presence of pathology, the AAI, the duration of
deafness and the aetiology of deafness) were non-significant predictors. The
AAI and the duration of deafness were non-significant when included as
continuous or categorical variables. H3 was accepted for ‘CRM SRT’
because the percentage of discriminable electrodes especially at the lower
frequency range (≤ 1000 Hz) was a significant predictor of ‘CRM SRT’.
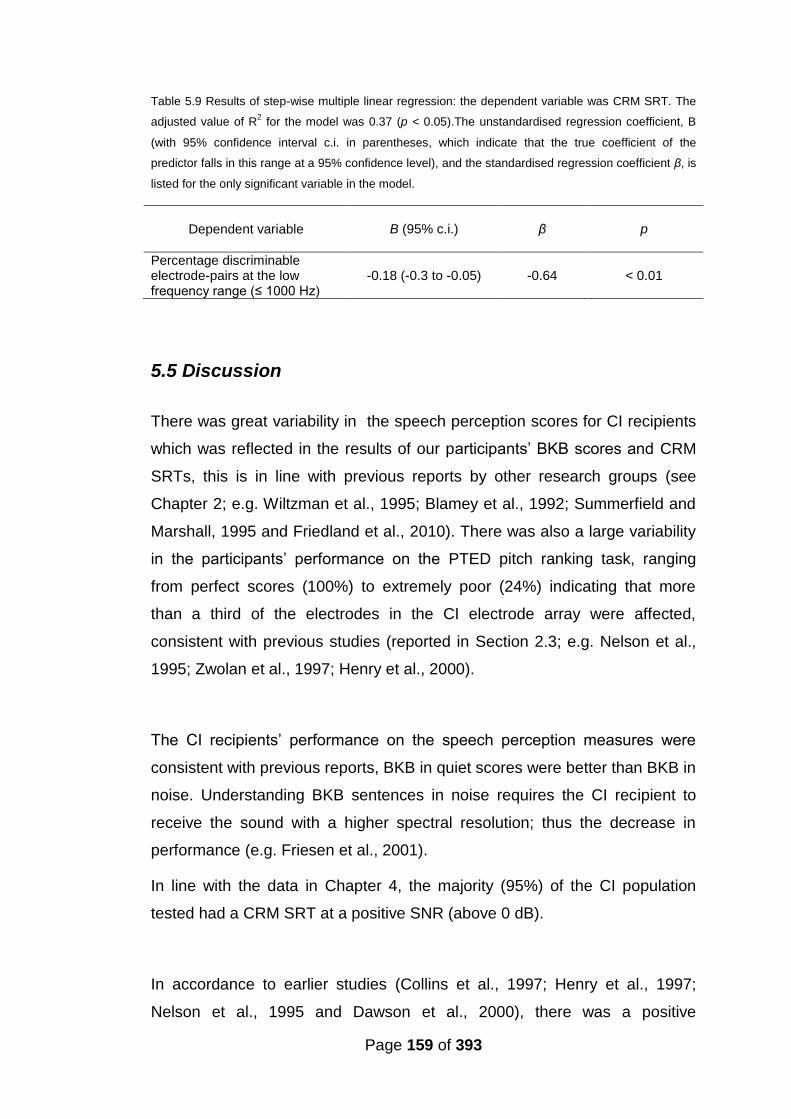
Page 159 of 393
Table 5.9 Results of step-wise multiple linear regression: the dependent variable was CRM SRT. The
adjusted value of R2 for the model was 0.37 (p < 0.05).The unstandardised regression coefficient, B
(with 95% confidence interval c.i. in parentheses, which indicate that the true coefficient of the
predictor falls in this range at a 95% confidence level), and the standardised regression coefficient β, is
listed for the only significant variable in the model.
Dependent variable B (95% c.i.) β p
Percentage discriminable electrode-pairs at the low frequency range (≤ 1000 H )
-0.18 (-0.3 to -0.05) -0.64 < 0.01
5.5 Discussion
There was great variability in the speech perception scores for CI recipients
which was reflected in the results of our participants’ BKB scores and CRM
SRTs, this is in line with previous reports by other research groups (see
Chapter 2; e.g. Wiltzman et al., 1995; Blamey et al., 1992; Summerfield and
Marshall, 1995 and Friedland et al., 2010). There was also a large variability
in the participants’ performance on the PTED pitch ranking task, ranging
from perfect scores (100%) to extremely poor (24%) indicating that more
than a third of the electrodes in the CI electrode array were affected,
consistent with previous studies (reported in Section 2.3; e.g. Nelson et al.,
1995; Zwolan et al., 1997; Henry et al., 2000).
The CI recipients’ performance on the speech perception measures were
consistent with previous reports, BKB in quiet scores were better than BKB in
noise. Understanding BKB sentences in noise requires the CI recipient to
receive the sound with a higher spectral resolution; thus the decrease in
performance (e.g. Friesen et al., 2001).
In line with the data in Chapter 4, the majority (95%) of the CI population
tested had a CRM SRT at a positive SNR (above 0 dB).
In accordance to earlier studies (Collins et al., 1997; Henry et al., 1997;
Nelson et al., 1995 and Dawson et al., 2000), there was a positive

Page 160 of 393
relationship between speech perception and the number of perceptually
distinct channels stimulated by the CI (H1 was accepted). The PTED
procedure was able to define pitches that could not be discriminated which
more likely corresponded to channels that were indistinguishable; hence
there was a positive relationship between the number of discriminable
electrode pairs and speech recognition scores. This is also in line with
Friesen et al. (2001) who reported that CI performers with good speech
perception were able to utilise more channels of spectral resolution than poor
CI performers, although there might be some dispute on what the limit of
channels that the CI recipient can utilise (discussed in Section 2.3.1).
When evaluating the relationship between PTED results at the different
frequency ranges (low, mid and high) and speech perception, results were in
accordance to previous studies (e.g. Miller and Nicely, 1955 and Shannon et
al., 2001; Skinner et al., 1995; Henry et al., 2000; Fourakis et al., 2004 and
Fourakis et al., 2007). The association between speech perception as
measured via BKB in quiet and CRM and the proportion of discriminable
electrodes was significant at low and mid frequency range (≤ 2600 H ) but
not at the higher frequency range (> 2600 Hz). This reflects the importance
of the lower frequency range (≤ 2600 H ) to speech perception in
comparison to the higher frequency range (e.g. Miller and Nicely, 1955 and
Shannon et al., 2001). It’s also in line with (Skinner et al., 1995; Henry et al.,
2000; Fourakis et al., 2004 and Fourakis et al., 2007) who found that the CI
recipient requires a larger number of electrodes in the lower frequency
region; hence a larger proportion of discriminable electrodes in that region (≤
2600 Hz) was associated with better BKB in quiet and CRM. This concurs
with Henry et al. (2000) where a significant association between the ability to
discriminate electrodes and the amount of speech information perceived was
found in the frequency range in frequencies 170Hz – 2680 Hz but not in the
higher frequency range > 2680 Hz.
Page 161 of 393
For good speech perception a larger number of discriminable electrodes is
required in the lower frequency range (≤ 2600 H ) in comparison to higher
frequencies (>2600 Hz). This region requires higher spectral resolution not
only because it provides vowel formant information but also because it
provides information of phonemic voicing, nasal and place of articulation
features (e.g. Miller and Nicely, 1955). The region of the first formant (≤ 1000
Hz) is also particularly important for nasal and voicing cues (e.g. Miller and
Nicely, 1955). The region (≤ 2600 H ) is critical for detecting formant
transitions, which are acoustic cues involving rapidly changing spectral
patterns (Munson and Nelson, 2005). Formant transitions were found to be
the most vulnerable speech feature to degradation in noise among CI users
(Munson and Nelson, 2005). Additionally the perception of place of
articulation for plosives, fricatives and affricates and of the voicing feature is
also at least in part dependent on vowel formant transitions (e.g. Cooper et
al., 1952; Benki, 2001 and Hedrick and Carney, 1997). Frication (manner of
articulation feature) is the only phonemic feature that relies on information
usually solely provided by the higher frequency region (> 1000 Hz) spreading
up to 8 to 10 kHz. But the detection of “random noise” above 1 kH is
sufficient to perceive this phonemic feature and unlike other phonemic
features does not require high spectral resolution (Wright, 1997).
The association between the proportion of discriminable CI electrode pairs
and speech perception was stronger for BKB in noise than in quiet, which is
most likely due to BKB in noise test’s increased demand for spectral
resolution (e.g. Qin and Oxenham and Fu and Nogaki, 2004). This higher
demand for spectral resolution was also reflected in the association between
BKB in noise and the proportion of discriminable electrodes at different
frequency ranges (low, mid and high). Again, this supports the idea that the
percentage of discriminable electrodes reflects the degree of spectral
resolution that a CI recipient has. This could be related to neuronal survival,
electrode placement issues or other device related issues (see Section 2.3).

Page 162 of 393
Results of the multiple regressions showed a similar picture; the PTED’s
percentage of discriminable electrodes not only correlated with all speech
perception measures used, it was the main significant predictor in all models
(H3 was accepted). With the use of the overall discriminable electrodes at all
frequencies, the models predicted over 50 % and reaching up to 66 % of the
variance in the speech perception measures used (BKB in quiet, in noise and
CRM). With the use of the percentage of discriminable electrode pairs at
each frequency band in step-wise multiple regression, the models predicted
over 41 % and reaching up to 53 % of the variance in the speech perception
measures used (BKB in quiet, in noise and CRM). Results showed that the
percentage of discriminable electrodes at the low frequency range (≤ 1000
Hz) was the only significant predictor for CRM and BKB in noise and was the
main significant predictor for BKB in quiet. Findings of multiple regression
testing emphasize the expected importance of low frequency range
contribution to speech perception (e.g. Miller and Nicely, 1955; Shannon et
al., 2001; Skinner et al., 1995; Henry et al., 2000; Fourakis et al., 2004 and
Foukaris et al., 2007). Other contributing variables to the models included the
presence of pathology for predicting BKB in quiet, which is consistent with
studies evaluating the effect of aetiology on CI performance and found that
pathological changes such as calcification led to decreased performance
(Cohen and Waltzman, 1993; Hartrampf et al., 1995; Rotteveel et al., 2005
and Rotteveel et al., 2010). This finding is also in agreement with Nadol and
Hsu (1991) who reported a negative correlation between calcification and
spiral ganglion cell count. The interesting finding here is that pathology (as
defined in Section 5.3) did not only include cases of pathological changes
(ossification, calcification and fibrosis) to the cochlea secondary to aetiology
of the hearing loss but also included cases of confirmed fibrosis following
device failure and infection. Despite reports of comparable results for CI
performance before and after explantation and reimplantation (e.g. Saeed et
al., 1995; Alexiades et al., 2001; Parisier et al., 2001 and Cote et al., 2007)
pathological changes such as fibrosis may have a negative impact on
performance. In our test population, the presence of fibrosis was confirmed
for two participants who had an infection that prevented re-implantation at
the time of explantation and caused partial insertion of the CI array for one of
Page 163 of 393
them. Evidence suggests that the presence of pathology is a more important
factor affecting performance than either aetiology or explantation-
reimplantation on its own.
When the percentage of discriminable electrodes in each frequency range
was considered as an independent potential predictor, the AAI was a
significant predicting factor for CRM SRT, this is in line with previous findings
(Waltzman et al.,1995; Gantz et al., 1993; Blamey et al., 2013; Chatelin et
al., 2004; Friedland et al., 2010 and Lenarz et al., 2012) who found an AAI
effect on CI performance. The presence of an AAI effect on CRM SRT only
and not BKB scores could be due to the relative small number of participants
and the nature of speech-on-speech masking in CRM. Speech-on-speech
masking was reported to be more detrimental for older listeners (over 60
years) as compared to younger listeners making the effect for the AAI larger
in CRM than BKB in quiet or in noise (e.g. Helfer et al., 2010 and Helfer and
Freyman, 2008).
These findings indicated that having indiscriminable electrodes can affect
speech perception with CIs. This in return provided further support to the
potential importance of research actively searching for problematic
electrodes in CIs with the goal of improving performance (e.g. Zwolan et al.,
2007 and Zhou and Pfingst, 2012).
5.6 Conclusion
Results of this present study are in concordance with previous studies. CI
recipients showed better performance in quiet than in noise. A relationship
was found between PTED’s results especially in the lower frequency range
(≤ 2600 Hz) and the various measures of speech perception and the
percentage of discriminable electrodes especially at lower frequencies (≤
1000 Hz) was a significant predictor of speech perception. It also indicated
Page 164 of 393
that PTED -being a clinically viable test- potentially has a clinically relevant
function to speech perception with CI.
5.7 Summary
CI recipients showed better performance in quiet than noise.
The majority of CI recipients had CRM SRTs at positive SNR.
There was a positive association between percentage of discriminable
electrode pairs as identified via PTED and all speech perception
measures used (BKB in quiet and in noise and CRM).
The strongest association between PTED and speech perception was
found when speech testing took place in noise; test requirement for
higher spectral resolution might be the reason.
Having a larger proportion of discriminable electrodes at the lower
frequency range (≤ 2600 Hz) was more important for speech
perception than it was at the higher frequency range.
Results provide further evidence validating the PTED as a clinical tool
with functional potential that relates to speech perception with CI.
165
Chapter 6
The relationship between CI electrode array
placement, electrode differentiation and speech
perception
Abstract
This chapter describes a study that evaluates the association between scalar
electrode array placement, the angular depth of array insertion, pure-tone
electrode differentiation (PTED) results and speech perception. The outcome
measures were BKB in quiet, BKB in noise and CRM. 16 individuals were
evaluated for angular depth of insertion. Statistically significant correlations
were found for BKB in quiet (Pearson’s r = 0.57*, p < 0.05) and BKB in noise
(Pearson’s r = 0.71**, p < 0.01). No correlation was found with ED in the
most apical electrodes. In addition the characteristic frequency of the most
apical electrode was estimated and the “frequency shift” was calculated as
the difference between the characteristic frequency and the centre frequency
of the filter assigned to the corresponding electrode. Strong correlations were
found for BKB in noise (Pearson’s r = -0.63*, p < 0.05) but not for BKB in
quiet. These results indicate the positive effect of increased angular depth of
insertion may at least be in part due to the frequency shift. Cone beam
computed tomography (CBCT) provides high quality images that in this study
allowed two highly experienced physicians to identify in-vivo scalar-
placement of electrode arrays in nine implanted individuals. A significant
correlation was not found between scalar placement in the scala tympani
(ST) versus scala vestibuli (SV) with speech perception or between scalar-
placement of each electrode with ED for the corresponding electrodes.
However PTED results of electrodes at inter-scalar cross-over points
between ST and SV showed pitch confusion. This indicated that PTED
identified dead regions at points of inter-scalar cross-over. The lack of
166
correlation between PTED results and scalar-placement in this study
population may also indicate the absence of trauma associated with SV
placement.
6.1 Introduction
As discussed in the literature review in Chapter 2 (Section 2.2), the CI
electrode design and the surgical insertion of the electrode array may affect
post-implantation outcome (e.g. Aschendorff et al., 2007 and Finley and
Skinner, 2008). Depth of insertion and scalar placement of the CI array might
be factors that affect speech perception with CI. Although some researchers
reported adverse effects of deeper insertions (Gani et al., 2007 and Finley
and Skinner, 2008), it was also associated with poor ED of the apical
electrode. Only two studies investigated the effect of scalar placement of the
individual electrodes into the scala vestibuli (SV) versus the scala tympani
(ST) (Aschendorff et al., 2007 and Finley and Skinner, 2008), but they did not
investigate the relationship between scalar placement and ED. PTED results
along with radiological imaging can shed some light on the effect of array
placement (depth of insertion and scalar placement) on ED and speech
perception with CI.
Deep insertion had been advocated by some researchers in order to widen
the range of stimulated frequencies in the cochlea (e.g. Hochmair et al.,
2003) and to match the stimulated frequency of the electrical signal and the
normal tonotopic organisation of the cochlea (e.g. Baskent and Shannon,
2003 and 2005). However, associated with this is an increased possibility of
insertion trauma (e.g. Finley and Skinner, 2008; Adunka et al., 2006 and
Wardrop et al., 2005a) and the loss of frequency specificity due cross-turn
stimulation as demonstrated by poor ED of the apical electrodes (Gani et al.,
2007 and Finley and Skinner, 2008) may indicate the need to accomplish a
balance between a sufficient depth of insertion and the avoidance of trauma.
Another issue that has been evaluated was the scalar positioning of the array
167
(Skinner et al., 2007 and Finley and Skinner, 2008). Since the deliberate
insertion into the SV in certain cases has been reported to produce
comparable results to insertion into the ST (Barrettini et al., 2002; Kiefer et
al., 2000 and Lin, 2009) it is stipulated that underlying mechanical damage to
the spiral ganglion in cases of inter-scalar cross over (from ST to SV) may be
the reason for the decreased performance reported by Finley and Skinner
(2008) when the electrodes were placed in SV. Aschendorff et al., (2007)
reported a significant difference in speech perception between intentional ST
and unintentional SV array placement which they attributed to the difference
not only in scalar placement but due to the trauma associated with insertion.
Finley and Skinner (2008) also reported poor ED at the apical electrodes
associated with positioning them in SV. Thus the evaluation of CI array
positioning in the cochlea and its effect on performance may further inform
surgical techniques and future CI electrode array design (e.g. Aschendorff et
al., 2007). This is one of the drivers behind the development of imaging
techniques that provide high quality images to allow adequate evaluation
without artefacts while maintaining safety (relatively low radiation) and
controlling for cost. CBCT has been suggested as an alternative to multiple
slice CT (MSCT) in the field of otorhinolaryngology for the management of
the hearing impaired (Gupta et al., 2004; Bartling et al., 2006; Rafferty et al.,
2006; Faccioli et al., 2009; Hodez et al., 2011). It also has been evaluated for
pre-cochlear implantation assessment (Barker et al., 2009) and for post-
implantation assessment of the CI electrode array position in the cochlea
(Gupta et al., 2004; Bartling et al., 2006; Ruivo et al., 2009; Trieger et al.,
2010; Cushing et al., 2012 and Güldner et al., 2012).
This study examines the use of imaging to look at electrode placement and
correlate this with the ED results obtained from PTED procedure in adults
with CIs.
168
6.1.1 CBCT use with CI
CBCT is an “x-ray based volume acquisition method” (Hode et al., 2011)
that utilises a motorised rotating x-ray emitting tube and a parallel flat panel
detector turning around the participant’s head. The computer then processes
the images captured by the panel detector to construct a cylindrical volume,
within this cylindrical volume each unit “voxel” is cubic and the cylindrical
volume is considered “isotropic” which ensures constant spatial resolution
regardless of slice orientation. Similar to MSCT it allows 3D multi-planar
(axial, coronal, sagittal) reconstruction in addition to oblique reconstruction. It
was initially intended for dental use but due to technological advances and
improvement in imaging quality it has been suggested as a low-radiation
alternative for MSCT to capture images of the bony structures especially in
the head and neck region (e.g. Gupta et al., 2004; Bartling et al., 2006;
Rafferty et al., 2006; Faccioli et al., 2009; Hodez et al., 2011; Ruivo et al.,
2009; Cushing et al., 2012 and Güldner et al., 2012). The Advantages of
using CBCT with CI include that it has:
(1) Lower-radiation exposure in comparison to MSCT; Ruivo et al., (2009)
reported an effective dose of 80 Sv with the use of CBCT in
comparison to an effective dose of 3,600 Sv for the 16-slice MSCT
and 4,800 Sv for the 4-slice MSCT in an in vivo post-CI imaging.
(2) Reduced sensitivity to metallic artefacts in comparison to MSCT
allowing for placement assessment for each individual CI electrode
(Ruivo et al., 2009).
(3) Higher spatial resolution, which is determined by the “voxel” si e, with
smaller voxels the spatial resolution of bony structures can be as good
as that of MSCT (Hodez et al., 2011). In addition to that, isotropicity
ensures high resolution in all directions.
(4) Lower cost (e.g. Ruivo et al., 2009; Hodez et al., 2011 and Cushing et
al., 2012), shorter testing time (Rafferty et al., 2006) and a more
comfortable open testing environment than MSCT (Ruivo et al., 2009).
169
While CBCT has several advantages over MSCT, it has some disadvantages
due to reduced radiation intensity; in addition to the increased noise levels,
evaluation of fine soft tissue details cannot be conducted (e.g. Miracle and
Mukherji, 2009; Hodez et al., 2011 and Cushing et al., 2012). Another
disadvantage is the lack of unified terminology and settings across the
different CBCT devices; this makes it difficult to draw generalised
conclusions and comparisons in addition to the absence of standardised
protocols to evaluate the CI array position for example. Despite these
disadvantages, CI placement examination in temporal bones and cadaveric
human heads (Bartling et al., 2006; Cushing et al., 2012 and Güldner et al.,
2012) and in vivo studies such as (Ruivo et al., 2009 and Tieger et al., 2010)
have demonstrated the potential of using CBCT for the evaluation of CI
electrode placement within the cochlea.
It has been reported that CBCT can provide high quality images of CIs that
allow the distinct identification of single CI electrodes (Gupta et al., 2004;
Bartling et al., 2006; Ruivo et al., 2009; Tieger et al., 2010; Cushing et al.,
2012 and Güldner et al., 2012). CBCT was also used to (1) measure precise
in vivo anglular depth of insertion for 15 implanted individuals (Tieger et al.,
2010), (2) detect kinking and number of intra-cochlear contacts (Ruivo et al.,
2009 and Cushing et al., 2012) and (3) determine scalar position (Cushing et
al., 2012). However Güldner et al. (2012) reported up to 51% artefact exist
on the measurement of the electrode diameter particularly with the apical
electrodes. This has raised doubts about CBCT for determining scalar
position of electrodes in deep insertions beyond the basal medial turn of the
cochlea. In Güldner et al.’s study (2012) 3 cadaveric human heads and one
specific CT scanner was used. The authors did not attempt to evaluate
scalar position of the individual electrodes. In contrast Cushing et al., (2012)
used CBCT to evaluate the individual electrodes scalar position and showed
similar results to those obtained via histopathological analyses with the use
of 11 human temporal bones implanted with a straight research array (SRA)
from Cochlear®.

170
CBCT application with regards to CI may potentially have surgical, clinical
and research uses. Further evaluations of CBCT use with CI and future
optimisation of CBCT testing protocol may be warranted.
6.1.2 Aims and hypotheses
This chapter describes a study that addresses the use of imaging with CI.
The first part evaluates the effect of angular depth of insertion of the CI array
-as measured via plain x-rays and/or CBCT- on CI performance and the
relationship between the angular depth of insertion and PTED at the apical
electrodes. The relationship between the frequency shift of the most apical
electrode and speech perception was also evaluated to investigate the
contribution of the frequency shift to speech perception with CI. The second
part evaluated the use of CBCT to determine the scalar placement of each
CI electrode and the relationship between scalar placement, speech
perception and PTED results.
Main research hypotheses were that:
H1: There is a correlation between depth of insertion of the CI electrode array
and post CI speech perception.
H2: There is a correlation between depth of insertion of the CI electrode array
and the percentage of discriminable electrodes as identified by the PTED
with particular reference to the apical electrodes.
H3: There is a correlation between the frequency shift (of the most apical
electrode) and post CI speech perception.
H4: There is a correlation between scalar positioning of the CI electrodes in
the cochlea (in ST versus SV) and post CI speech perception.
H5: There is a correlation between scalar positioning of the CI electrodes in
the cochlea and the ED.

171
H6: There is a correlation between the number of interscalar cross-overs
(between ST and SV) of the CI electrode array as identified with CBCT and
post CI speech perception.
H7: There is a relationship between the interscalar cross-overs (between ST
and SV) of the CI electrode array as identified via CBCT and the ED in that
region.
6.2 Method
6.2.1 Participants
Out of the 36 participants that were recruited for the study described in
Chapter 5, participants from the RNTNEH who had their post-implantation
plain x-ray films available were included in this study. Additionally 9 out of the
36 participants who were recruited had also undergone CBCT scanning. 17
adult CI recipients with acquired deafness in total were recruited for this
study.
The same inclusion criteria described in 5.2.1 were used.
Participants’ demographics:
(1) Duration of deafness was calculated for each participant from the date of
diagnosis of a bilateral profound sensorineural hearing loss. (2) Age at
testing ranged between 24 to 80 years with a mean of 58 years (±14.44). (3)
The aetiology of the hearing loss was unknown in 6 out of the 17
participants. (4) CI experience was calculated from date of switch on of the
currently used implant; it ranged from 8 to 172 months, with a mean of 47
months (±42) and a median of 45 months. (5) The hearing loss was
progressive for all of the participants. (6) Among the participants there were
7 AB CI recipients, 5 MED-El™ CI recipients and 5 Cochlea® CI recipients.
Three participants had a pre or peri-lingual onset (before 5 years old) hearing
loss (participants 3, 4 and 8). Two participants (2) had a history of cochlear
explantation and re-implantation and participant 5 had a rolled over electrode
172
tip at insertion. Participant 17 was subsequently diagnosed with dementia
which may have affected the speech perception assessments and the PTED
procedure at the time of recruitment, thus her speech perception measures
and PTED results were excluded from analysis. Table 6.1 details
participants’ demographics.
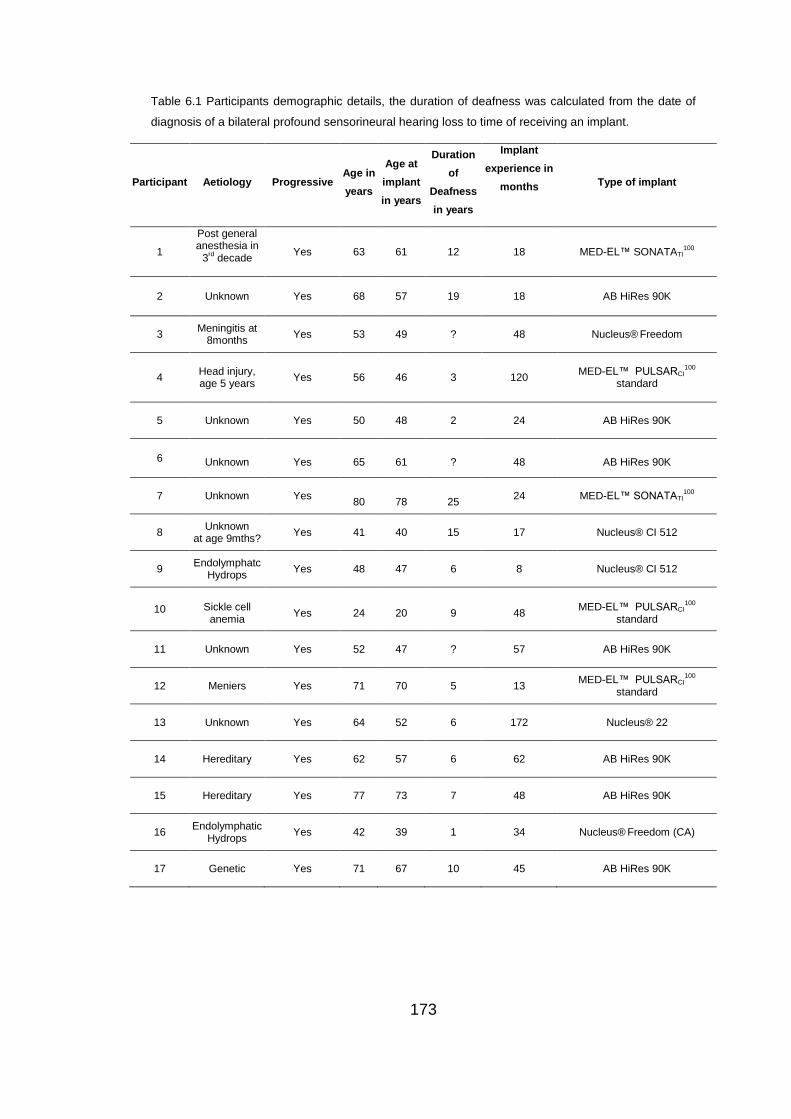
173
Table 6.1 Participants demographic details, the duration of deafness was calculated from the date of
diagnosis of a bilateral profound sensorineural hearing loss to time of receiving an implant.
Participant Aetiology Progressive Age in
years
Age at
implant
in years
Duration
of
Deafness
in years
Implant
experience in
months
Type of implant
1
Post general anesthesia in
3rd decade
Yes 63 61 12 18 MED-EL™ SONATATI100
2 Unknown Yes 68 57 19 18 AB HiRes 90K
3 Meningitis at
8months Yes 53 49 ? 48 Nucleus®
Freedom
4
Head injury, age 5 years
Yes 56 46 3 120 MED-EL™ PULSARCI
100
standard
5 Unknown Yes 50 48 2 24 AB HiRes 90K
6 Unknown Yes 65 61 ? 48 AB HiRes 90K
7 Unknown Yes
80
78
25 24 MED-EL™ SONATATI
100
8 Unknown
at age 9mths? Yes 41 40 15 17 Nucleus® CI 512
9 Endolymphatc
Hydrops Yes 48 47 6 8 Nucleus® CI 512
10 Sickle cell anemia
Yes 24 20 9 48 MED-EL™ PULSARCI
100
standard
11 Unknown Yes 52 47 ? 57 AB HiRes 90K
12 Meniers Yes 71 70 5 13 MED-EL™ PULSARCI
100
standard
13 Unknown Yes 64 52 6 172 Nucleus® 22
14 Hereditary Yes 62 57 6 62 AB HiRes 90K
15 Hereditary Yes 77 73 7 48 AB HiRes 90K
16 Endolymphatic
Hydrops Yes 42 39 1 34 Nucleus®
Freedom (CA)
17 Genetic Yes 71 67 10 45 AB HiRes 90K
174
6.2.2 Test battery
The PTED (described in Section 3.2.2.2) in addition to three speech
perception measures were used in testing, the CRM (described in Section
4.2.2) and the BKB sentence test in quiet and in speech-spectrum shaped
noise at a 10dB (described in Section 5.2.2).
6.2.2.1 Plain x-ray
Post CI plain x-rays of CI placement (a modified Stenver’s view) are
undertaken routinely at the RNTNEH; these films were used in this study. A
modified Stenver’s view provided a direct image of the intra-cochlear
electrode array.
6.2.2.2 CBCT
The CBCT assessment of CI electrode array placement was performed with
the use of 3D Accuitomo (J. Morita MFG. Corp., Kyoto, Japan) at Cavendish
Imaging. Imaging protocol applied: tube current 6mA, tube voltage 90kV,
acquisition time of 17.4sec, rotation of 360 ° tomography, field of view (FOV)
was small cylindrical (6 x 6 X 6 cm) with 3D isotropic 0.125 x 0.125 x 0.125
mm voxels.
The images were analysed with bespoke software (idixel One Volume
Viewer, V 1.6.0.20, J. Morita MFG. Corp., Kyoto, Japan) which enabled a
360-degree 3-D visualisation of the CI electrode array in the cochlea.
Submillimeter multiplanar reconstructions with a slice thickness of 0.25 mm
were undertaken.
6.2.3 Procedure
Testing for speech perception took place in a 3.7×3.25 m double-walled
sound booth where the participant was seated 1 metre in front of an ear level
175
loud speaker (Plus XS.2, Canton) from which the speech and noise were
presented. The stimuli were stored (16 bits), sampling rate (44.1 KHz)
presented digitally using the AB-York Crescent of Sound (Kitterick et al.,
2011). Testing for PTED took place in a double-walled sound booth.
For CRM the participants used a touch screen monitor to respond and the
software ran the test presentation and scoring in an automated fashion.
During BKB testing, the tester recoded the participants’ verbal response by
selecting the correct key words in each sentence presented.
All participants underwent BKB and PTED testing, CRM SRTs were
determined for 6 out of the 17 participants.
The angular depth of insertion of the CI electrode array was judged by a
highly experienced consultant ENT and CI surgeon for all 17 participants.
The angular insertion depth of the electrode array tip was estimated relative
to rotation about the mid-modiolar axis starting at the cochlear canal basal
end. (See Figure 6.1 for example demonstrating the angular depth of
insertion).
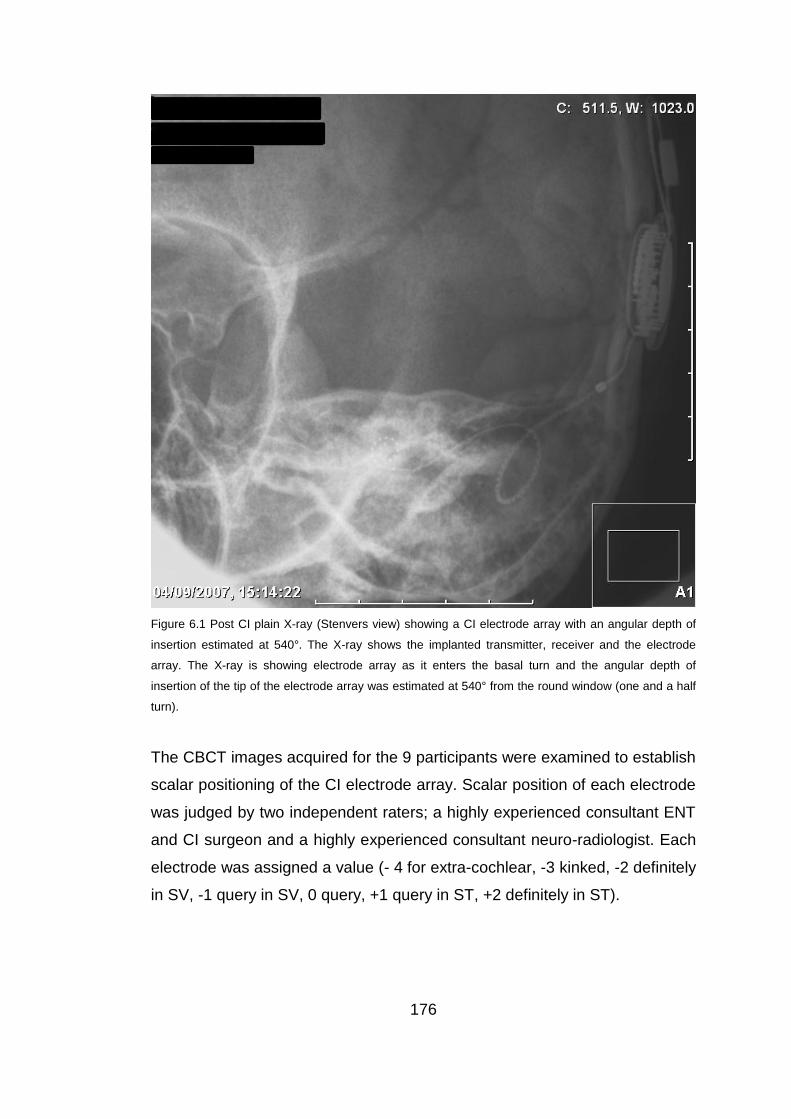
176
Figure 6.1 Post CI plain X-ray (Stenvers view) showing a CI electrode array with an angular depth of
insertion estimated at 540°. The X-ray shows the implanted transmitter, receiver and the electrode
array. The X-ray is showing electrode array as it enters the basal turn and the angular depth of
insertion of the tip of the electrode array was estimated at 540° from the round window (one and a half
turn).
The CBCT images acquired for the 9 participants were examined to establish
scalar positioning of the CI electrode array. Scalar position of each electrode
was judged by two independent raters; a highly experienced consultant ENT
and CI surgeon and a highly experienced consultant neuro-radiologist. Each
electrode was assigned a value (- 4 for extra-cochlear, -3 kinked, -2 definitely
in SV, -1 query in SV, 0 query, +1 query in ST, +2 definitely in ST).

177
6.3 Analyses
BKB scores were converted to rationalized arcsine-transform units (RAU)
before conducting statistical analysis (Studebaker, 1985) to reduce the
impact of floor and ceiling effects.
The same pass/fail criteria described in Chapter 3 (Section 3.2.3.2) was used
to categorise all tested electrode pairs via the PTED for each participant. In
addition to that an ED score was calculated for each electrode which was the
mean ED for each electrode and the adjacent electrodes on either side
(except for the most apical and most basal electrode where only the ED
score with the adjacent electrode was used). These scores were also
categorised according to the same pass/fail criteria.
The CI devices were categorised according to make (1 for AB, 2 for Cochlear
and 3 for Med-El).
The two expert image reviewers analysed the CBCT images using a scale
for establishing accuracy of placement. They were asked to estimate which
scalar the electrodes fell within and the confidence with which they made the
estimate, the categories used were: -2 definitely in SV, -1 possibly in SV, 0
not sure which scala, +1 possibly in ST, +2 definitely in ST).
For the final analyses the -2 and -1 responses were combined into one
category (-1 for SV) and the +1 and +2 were grouped into one category (+1
for ST). For inter-rater agreement on scalar position, responses of 0 were
removed to evaluate if the two raters agreed on assignment of electrodes to
ST versus SV. In addition to that, the categories - 3 for extra-cochlear and -2
kinked were also used in analysis.

178
6.3.1 Angular depth of insertion
The frequency-position map of the spiral ganglion proposed by Sridhar et al.
(2006) and Stakhovskaya et al. (2007) was used to estimate the
characteristic frequency associated with the most apical active electrode for
each participant based on the angular depth of insertion. The difference
between the characteristic frequency and the centre frequency of the filter
assigned to the corresponding (most apical) electrode was calculated, this
difference will be called the “frequency shift” of the most apical electrode. Fu
and Shannon (1999a) have indicated that the frequency shift at the apical
electrodes had a greater effect on speech perception than the more basal
electrodes. The estimated angular depth of insertion for the most apical
active electrode was categorised into one of the three ranges (similar to
Lazard et al., 2012): < 370°, 370°- 539° and > 540°. Both the estimated
angular depth of insertion values and categories were used in analyses.
The statistical analysis was conducted to assess the following:
1. Whether there is a significant relationship between the angular depth
of insertion in degrees and the percentage of discriminable electrode
pairs at all frequencies and at the two and four most apical electrode-
pairs.
2. Whether there is a significant relationship between angular depth of
insertion in degrees and speech perception (BKB in quiet, BKB in
noise and CRM).
3. Whether there is a significant relationship between angular depth of
insertion (as categorical data) and PTED’s percentage of
discriminable electrode pairs at all frequencies and at the two and four
most apical electrode-pairs.
4. Whether there is a significant relationship between angular depth of
insertion (as categorical data) and speech perception (BKB in quiet,
BKB in noise and CRM).
5. Whether there is a CI manufacturer effect on the angular depth of
insertion.
179
6. Whether there is a significant relationship between the frequency shift
and speech perception (BKB in quiet, BKB in noise and CRM).
7. Whether there is a CI manufacturer effect on the frequency shift.
The Shapiro Wilk’s test revealed that BKB (in quiet and in noise) in RAU, the
angular depth of insertion (for the 16 participants) and the frequency shift
were normally distributed. Hence Pearson’s correlation coefficient was
applied to establish the relationship between the angular depth of insertion
and BKB and between the frequency shift and BKB. While Spearman’s rho
was applied to establish the relationship between the angular depth of
insertion and (PTED and CRM) results and between the frequency shift and
(PTED and CRM) results. Spearman’s rho was also applied to establish the
relationship between the angular depth of insertion (categorical ordinal data)
and (PTED, BKB in quiet, BKB in noise and CRM) results. One way ANOVA
was conducted to evaluate whether there is a difference in the angular depth
of insertion between the different CI manufacturers (AB, MED-El, Cochlear)
and to evaluate whether there was a difference in the frequency shift
between the different manufacturers.
6.3.2 Scalar placement of the CI electrodes (CBCT results)
For scalar placement cases of discrepancy between raters or cases where
an electrode was assigned the category (0) by both raters were excluded
from analyses. The number of electrodes placed in the ST and SV were
counted and proportions were calculated for each subject. Inter-scalar cross-
overs of the CI electrode array were also identified. Inter-scalar cross-overs
were defined as the point between two adjacent electrodes when one
electrode was judged to be placed in ST and the other electrode in SV.
Finley and Skinner (2008) defined the “scalar pattern” as the region “where
the array first enters SV” and labelled them as Basal (B), Middle (M) and
Apical (A). A scalar pattern was determined for each participant based on
dividing the intra-cochlear portion of the array into three parts basal, middle
and apical.
180
The statistical analysis was conducted to assess the following:
1. Whether there would be a significant inter-rater agreement on scalar
positions of the CI electrodes.
2. Whether there would be a significant and positive relationship
between the proportion of CI electrodes inserted in ST as identified
using CBCT and speech perception (BKB in quiet, BKB in noise and
CRM SRT).
3. Whether there would be a significant and positive relationship
between the number of interscalar cross-overs (between ST and SV)
of the CI electrode array as identified via CBCT and speech
perception (BKB in quiet, BKB in noise and CRM).
4. Whether there would be a significant and positive relationship
between the scalar positioning of the CI electrodes as identified using
CBCT and ED of corresponding electrodes using PTED.
For CBCT results, percentage inter-rater agreement was calculated and
Cohen’s Kappa was also used to assess the inter-rater agreement on scalar
positioning of the CI electrodes. The Shapiro Wilk’s test revealed that only
BKB (in quiet and in noise) in RAU and the angular depth of insertion were
normally distributed. Hence Spearman’s rho was applied to establish the
relationship between the percent electrodes placed in ST and BKB (in quiet
and in noise in RAU), the angular depth of insertion and PTED) results.
Spearman’s rho was also applied to establish the relationship between the
scalar positions of each electrode (ST versus SV) and the ED for the
corresponding electrode and between the number of number of inter-scalar
cross-overs and (BKB (in quiet and in noise) and the angular depth of
insertion).
Since the electrodes’ ED scores were not normally distributed, the Mann-
Whitney was used. It was applied to determine if scalar placement of the
electrodes has an effect on ED scores (percentage) or ED score category
181
(pass versus fail). The Lambda test was applied to evaluate whether there is
a relationship between make and scalar pattern, since they were both
categorical nominal variables.
At points of inter-scalar cross-overs the ED score for the electrode pairs in
those regions was evaluated (pass versus fail) to establish whether inter-
scalar cross-overs affected ED.
IBM SPSS STATISTICS 21 for windows was used to carry out the analyses
except for Cohen’s Kappa which was carried out with the use of STATA 12
because SPSS doesn’t run Kappa if one rater used a category that was not
used by the other rater. p values are two tailed and significance is reported
when p<0.05.
6.4 Results
6.4.1 Angular depth of insertion
The angular depth of insertion ranged from 270°- 720° with a mean of 425°
(± 125°). The MED-EL array with the deepest insertion ranging from 360°-
720°, AB ranging from 270°- 540° and Cochlear 270°- 450°. Table 6.2 details
correlation results between angular depth of insertion and other variables
(BKB in quiet, BKB in noise, CRM, the percentage of discriminable electrode-
pairs and percentage discriminable electrode-pairs of the two most apical
two and four most apical electrode-pairs). Table 6.3 details correlation results
between angular depth of insertion (categorical data) and other variables
(BKB in quiet, BKB in noise, CRM, the percentage of discriminable electrode-
pairs and percentage discriminable electrode-pairs of the two most apical
two and four most apical electrode-pairs). See Figures (6.2 and 6.3) for
correlations between angular depth of insertion and BKB in quiet and in
noise respectively. There was a significant positive moderate to strong
correlation between the angular depth of insertion and BKB in quiet and in
182
noise, thus the hypothesis H1 was accepted. Considering that only six
participants had CRM SRTs being underpowered might explain why such a
correlation was not found between CRM SRT and the angular depth of
insertion. There was not a statistically significant correlation between the
angular depth of insertion and the percentage of discriminable electrodes
(across the array and at the most apical electrode-pairs).
The one-way ANOVA with angular depth of insertion as the dependant and
the make as the factor revealed a statistically significant difference between
manufacturers (F (2, 13) = 4.58, p = 0.03). A Tukey post-hoc test revealed
that the angular depth of insertion was statistically significantly higher for
MED-EL implants (540°± 127°, p = .04) compared to AB implants (360°±
110°). There were no statistically significant differences between the MED-
EL and Cochlear devices (360°± 75°, p = .98) or between the AB and
Cochlear devices (p = .07). Although there was a significant difference
between the angular depth of insertion across the CI manufacturers, a one-
way ANOVA revealed no significant difference between BKB scores in quiet
across the different manufacturers (F(2,13) = 0.41, p = 0.67) nor was there a
significant difference between BKB scores in noise across the different
manufacturers (F(2,13) = 2.03, p = 0.18).
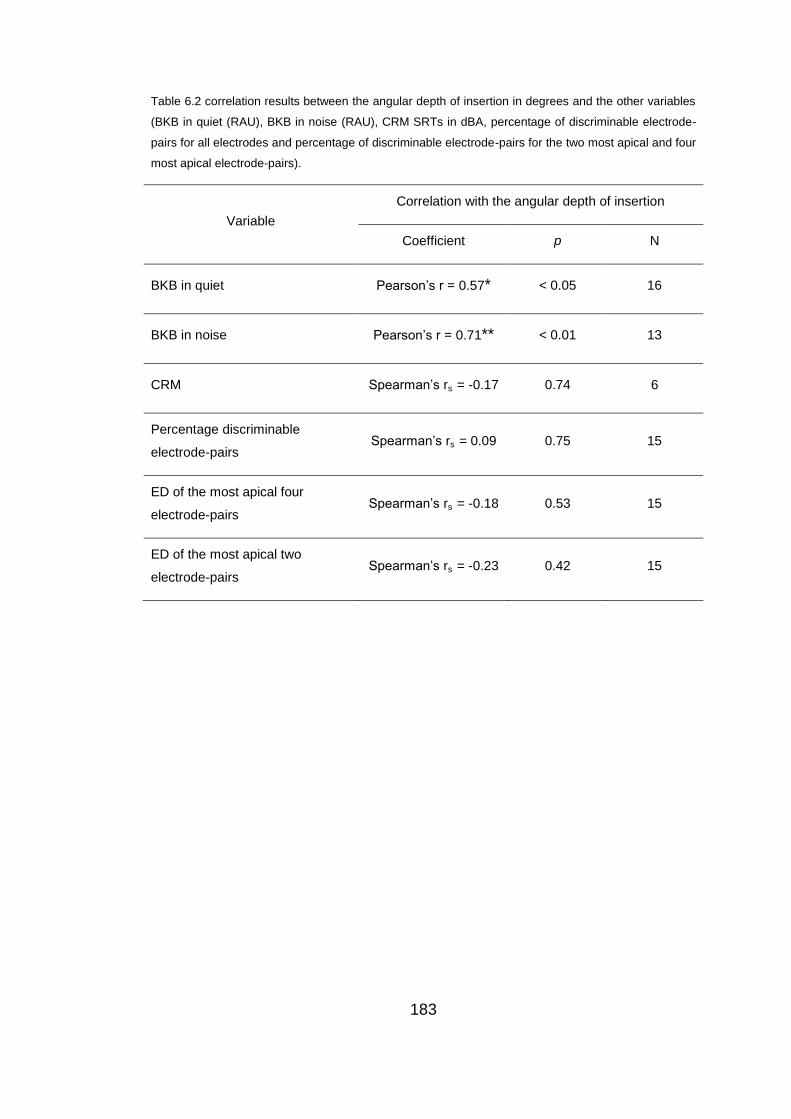
183
Table 6.2 correlation results between the angular depth of insertion in degrees and the other variables
(BKB in quiet (RAU), BKB in noise (RAU), CRM SRTs in dBA, percentage of discriminable electrode-
pairs for all electrodes and percentage of discriminable electrode-pairs for the two most apical and four
most apical electrode-pairs).
Variable
Correlation with the angular depth of insertion
Coefficient p N
BKB in quiet Pearson’s r = 0.57* < 0.05 16
BKB in noise Pearson’s r = 0.71** < 0.01 13
CRM Spearman’s rs = -0.17 0.74 6
Percentage discriminable
electrode-pairs Spearman’s rs
= 0.09 0.75 15
ED of the most apical four
electrode-pairs Spearman’s rs
= -0.18 0.53 15
ED of the most apical two
electrode-pairs Spearman’s rs
= -0.23 0.42 15
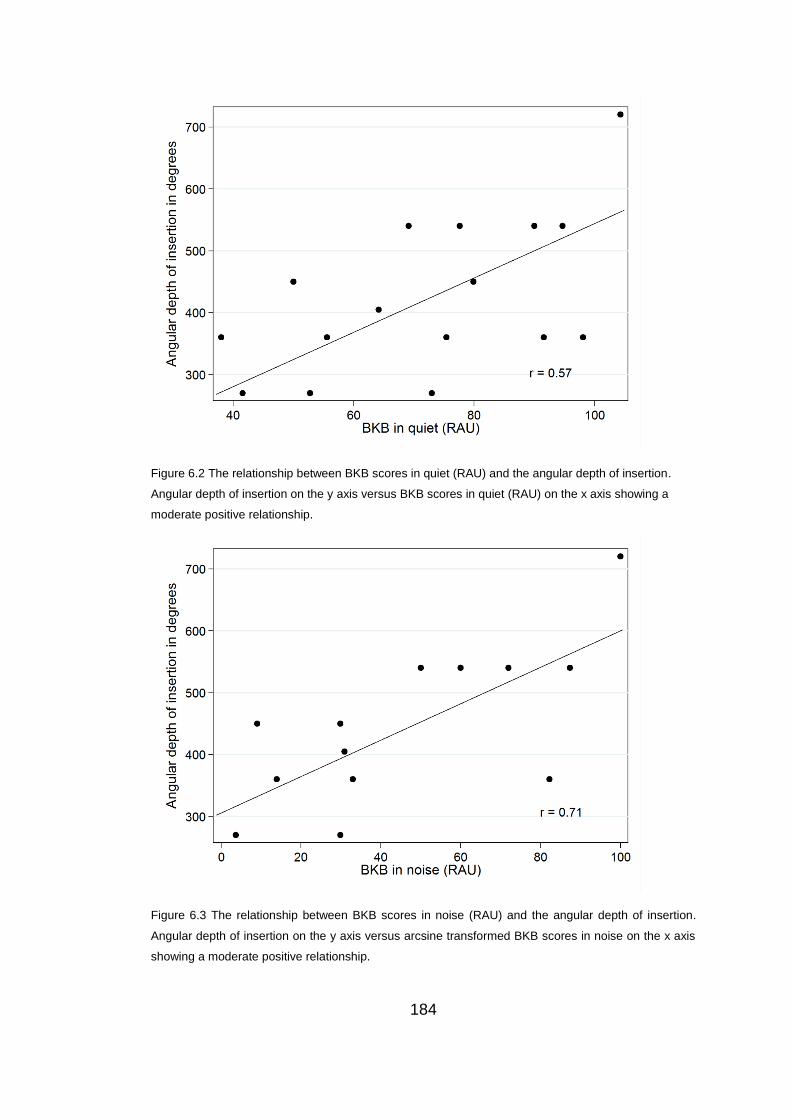
184
Figure 6.2 The relationship between BKB scores in quiet (RAU) and the angular depth of insertion.
Angular depth of insertion on the y axis versus BKB scores in quiet (RAU) on the x axis showing a
moderate positive relationship.
Figure 6.3 The relationship between BKB scores in noise (RAU) and the angular depth of insertion.
Angular depth of insertion on the y axis versus arcsine transformed BKB scores in noise on the x axis
showing a moderate positive relationship.

185
Table 6.3 correlation results between the angular depth of insertion category and the other variables
(BKB in quiet, BKB in noise, CRM SRTs in dB, percentage of discriminable electrode-pairs for all
electrodes and percentage of discriminable electrode-pairs for the two and four most apical electrode-
pairs).
Variable
Correlation with the angular depth of insertion category
Coefficient p N
BKB in quiet Spearman’s rs = -0.05 0.87 15
BKB in noise Spearman’s rs = 0.73** < 0.01 13
CRM Spearman’s rs = -0.17 0.75 6
Percentage discriminable
electrode-pairs Spearman’s rs
= 0.19 0.51 15
ED of the most apical four
electrode-pairs Spearman’s rs
= -0.02 0.94 15
ED of the most apical two
electrode-pairs Spearman’s rs
= -0.3 0.28 15
6.4.1.1 The frequency shift
The frequency shift ranged from -91 Hz – 1296 Hz with a mean of 524 Hz (±
116 Hz). Table 6.4 details correlation results between the frequency shift and
other variables ‘BKB in quiet’, ‘BKB in noise’, CRM and the percentage of
discriminable electrode-pairs. There was significant correlation between the
frequency shift and ‘BKB in noise’ but not with ‘BKB in quiet’ and H3 was
accepted for ‘BKB in noise’ but not for ‘BKB in quiet’. Again being
underpowered might explain correlation was not found between CRM SRT
and the frequency shift.
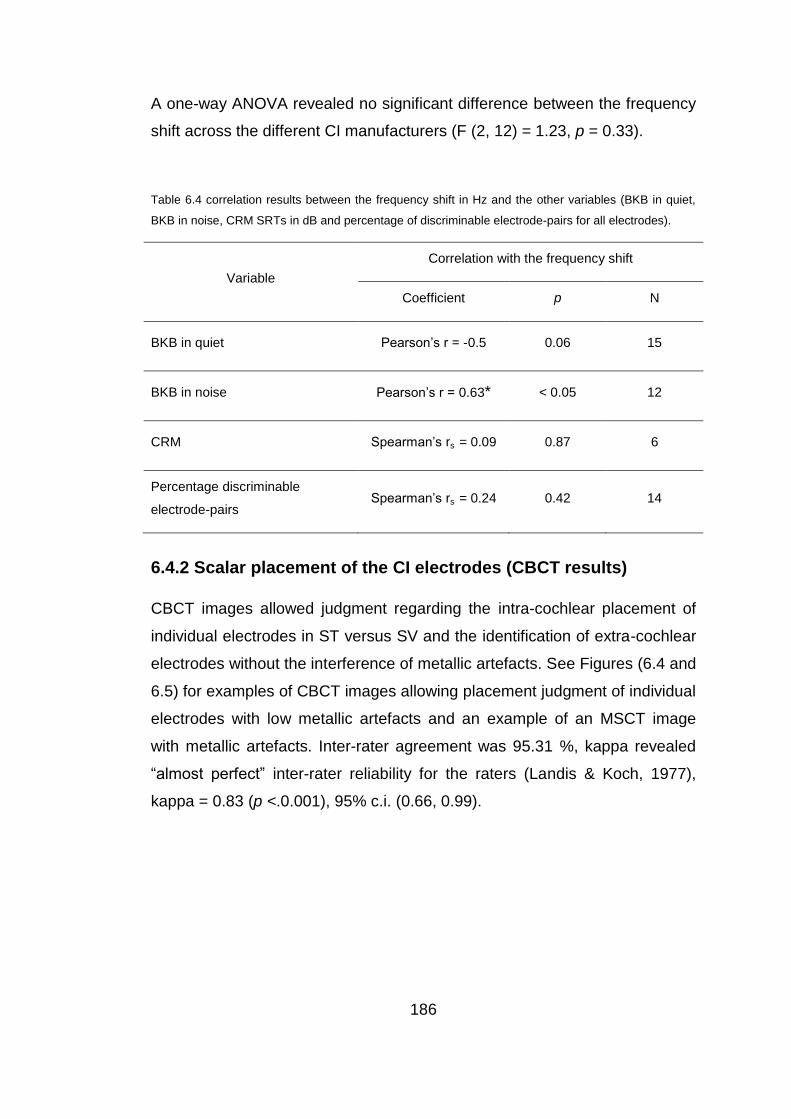
186
A one-way ANOVA revealed no significant difference between the frequency
shift across the different CI manufacturers (F (2, 12) = 1.23, p = 0.33).
Table 6.4 correlation results between the frequency shift in Hz and the other variables (BKB in quiet,
BKB in noise, CRM SRTs in dB and percentage of discriminable electrode-pairs for all electrodes).
Variable
Correlation with the frequency shift
Coefficient p N
BKB in quiet Pearson’s r = -0.5 0.06 15
BKB in noise Pearson’s r = 0.63* < 0.05 12
CRM Spearman’s rs = 0.09 0.87 6
Percentage discriminable
electrode-pairs Spearman’s rs
= 0.24 0.42 14
6.4.2 Scalar placement of the CI electrodes (CBCT results)
CBCT images allowed judgment regarding the intra-cochlear placement of
individual electrodes in ST versus SV and the identification of extra-cochlear
electrodes without the interference of metallic artefacts. See Figures (6.4 and
6.5) for examples of CBCT images allowing placement judgment of individual
electrodes with low metallic artefacts and an example of an MSCT image
with metallic artefacts. Inter-rater agreement was 95.31 %, kappa revealed
“almost perfect” inter-rater reliability for the raters (Landis & Koch, 1977),
kappa = 0.83 (p <.0.001), 95% c.i. (0.66, 0.99).
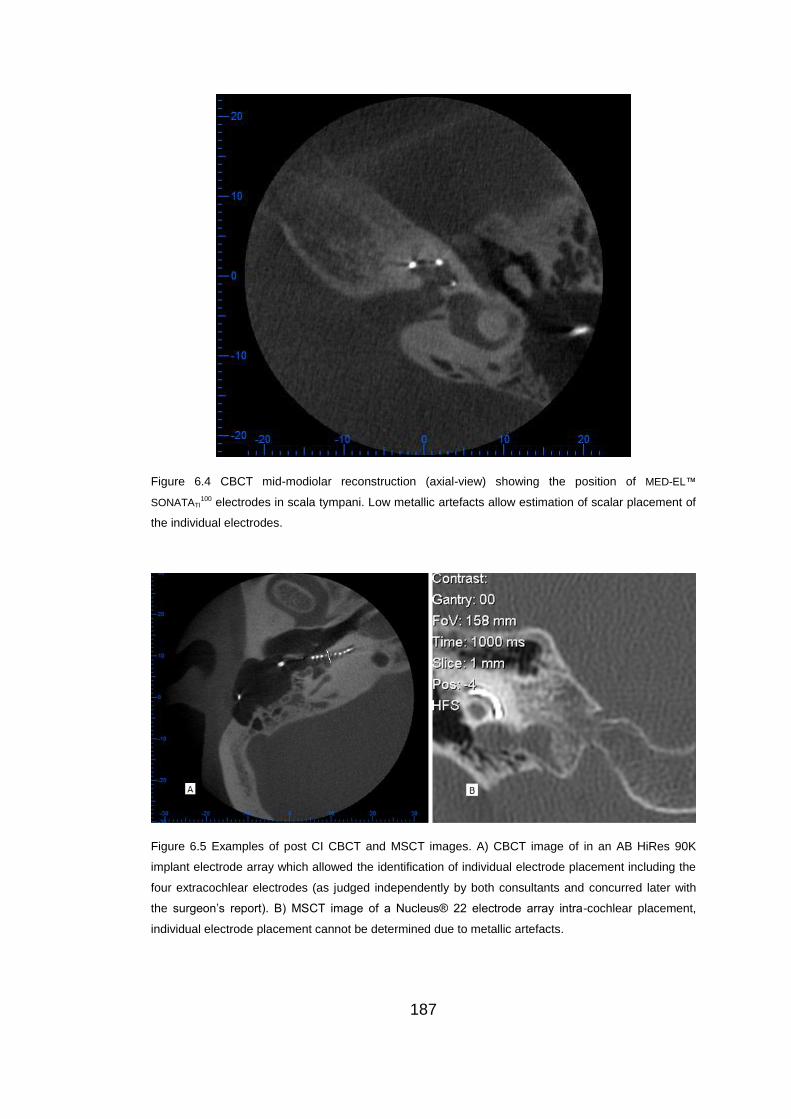
187
Figure 6.4 CBCT mid-modiolar reconstruction (axial-view) showing the position of MED-EL™
SONATATI100 electrodes in scala tympani. Low metallic artefacts allow estimation of scalar placement of
the individual electrodes.
Figure 6.5 Examples of post CI CBCT and MSCT images. A) CBCT image of in an AB HiRes 90K
implant electrode array which allowed the identification of individual electrode placement including the
four extracochlear electrodes (as judged independently by both consultants and concurred later with
the surgeon’s report). B) MSCT image of a Nucleus® 22 electrode array intra-cochlear placement,
individual electrode placement cannot be determined due to metallic artefacts.
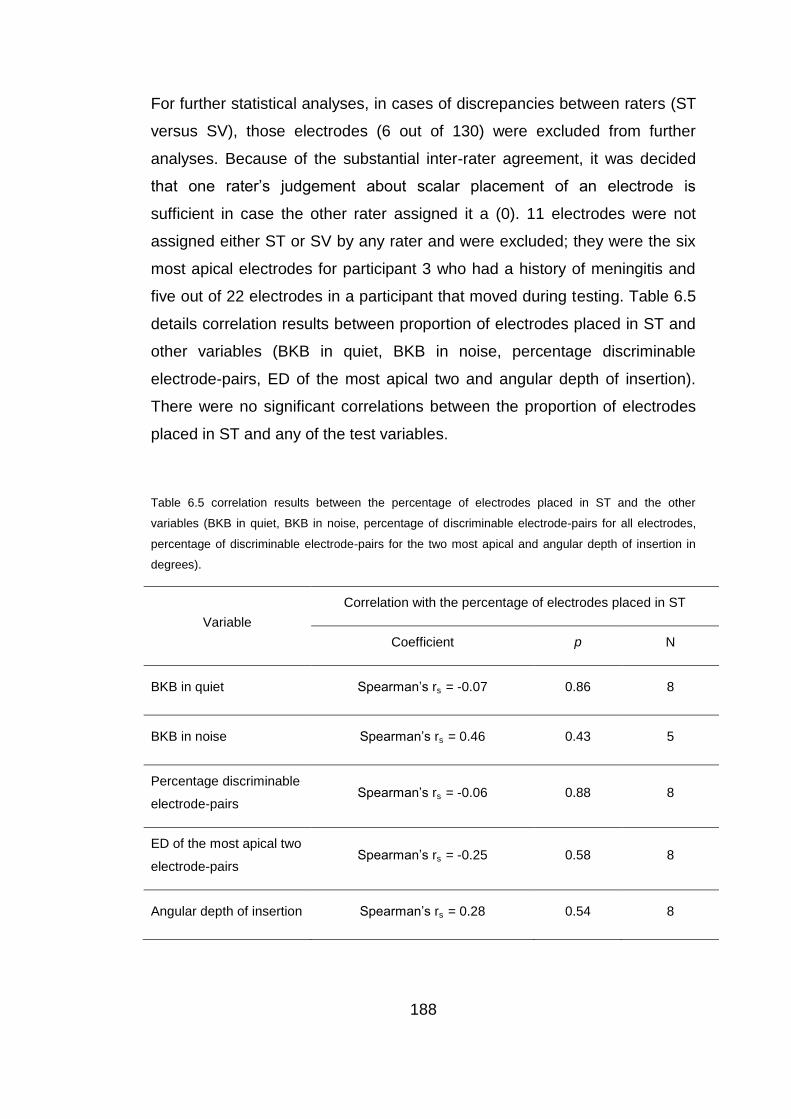
188
For further statistical analyses, in cases of discrepancies between raters (ST
versus SV), those electrodes (6 out of 130) were excluded from further
analyses. Because of the substantial inter-rater agreement, it was decided
that one rater’s judgement about scalar placement of an electrode is
sufficient in case the other rater assigned it a (0). 11 electrodes were not
assigned either ST or SV by any rater and were excluded; they were the six
most apical electrodes for participant 3 who had a history of meningitis and
five out of 22 electrodes in a participant that moved during testing. Table 6.5
details correlation results between proportion of electrodes placed in ST and
other variables (BKB in quiet, BKB in noise, percentage discriminable
electrode-pairs, ED of the most apical two and angular depth of insertion).
There were no significant correlations between the proportion of electrodes
placed in ST and any of the test variables.
Table 6.5 correlation results between the percentage of electrodes placed in ST and the other
variables (BKB in quiet, BKB in noise, percentage of discriminable electrode-pairs for all electrodes,
percentage of discriminable electrode-pairs for the two most apical and angular depth of insertion in
degrees).
Variable
Correlation with the percentage of electrodes placed in ST
Coefficient p N
BKB in quiet Spearman’s rs = -0.07 0.86 8
BKB in noise Spearman’s rs = 0.46 0.43 5
Percentage discriminable
electrode-pairs Spearman’s rs
= -0.06 0.88 8
ED of the most apical two
electrode-pairs Spearman’s rs
= -0.25 0.58 8
Angular depth of insertion Spearman’s rs = 0.28 0.54 8
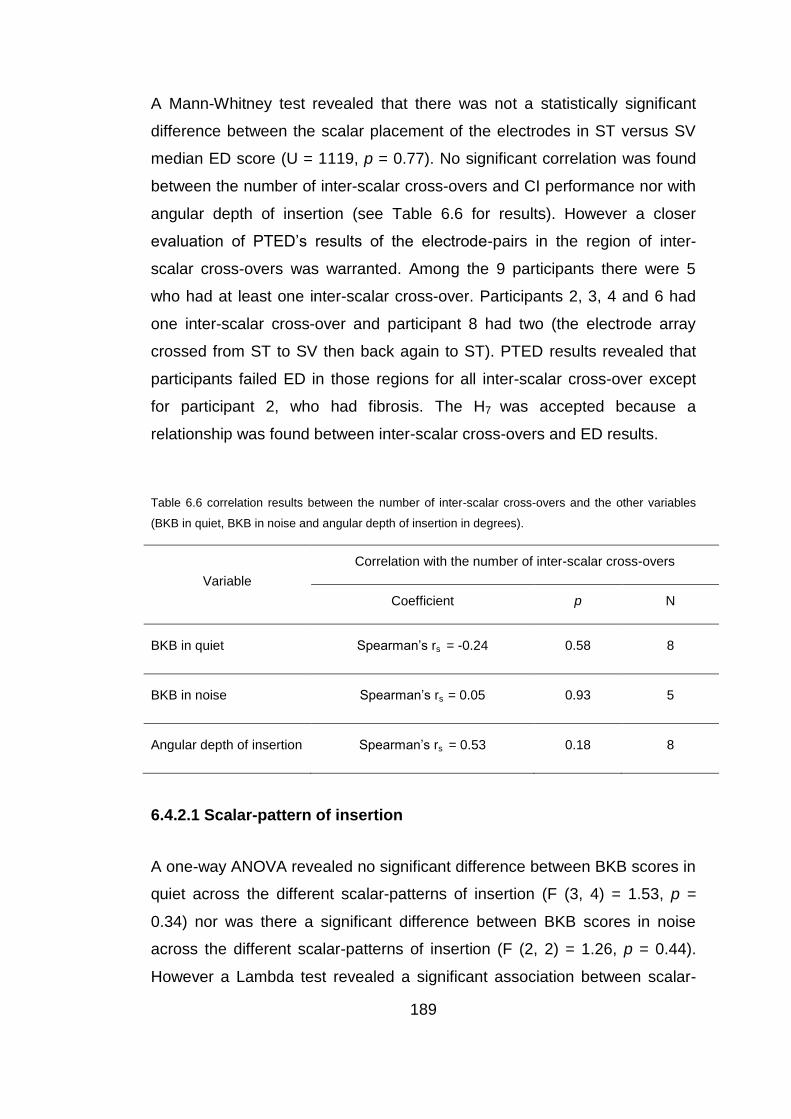
189
A Mann-Whitney test revealed that there was not a statistically significant
difference between the scalar placement of the electrodes in ST versus SV
median ED score (U = 1119, p = 0.77). No significant correlation was found
between the number of inter-scalar cross-overs and CI performance nor with
angular depth of insertion (see Table 6.6 for results). However a closer
evaluation of PTED’s results of the electrode-pairs in the region of inter-
scalar cross-overs was warranted. Among the 9 participants there were 5
who had at least one inter-scalar cross-over. Participants 2, 3, 4 and 6 had
one inter-scalar cross-over and participant 8 had two (the electrode array
crossed from ST to SV then back again to ST). PTED results revealed that
participants failed ED in those regions for all inter-scalar cross-over except
for participant 2, who had fibrosis. The H7 was accepted because a
relationship was found between inter-scalar cross-overs and ED results.
Table 6.6 correlation results between the number of inter-scalar cross-overs and the other variables
(BKB in quiet, BKB in noise and angular depth of insertion in degrees).
Variable
Correlation with the number of inter-scalar cross-overs
Coefficient p N
BKB in quiet Spearman’s rs = -0.24 0.58 8
BKB in noise Spearman’s rs = 0.05 0.93 5
Angular depth of insertion Spearman’s rs = 0.53 0.18 8
6.4.2.1 Scalar-pattern of insertion
A one-way ANOVA revealed no significant difference between BKB scores in
quiet across the different scalar-patterns of insertion (F (3, 4) = 1.53, p =
0.34) nor was there a significant difference between BKB scores in noise
across the different scalar-patterns of insertion (F (2, 2) = 1.26, p = 0.44).
However a Lambda test revealed a significant association between scalar-
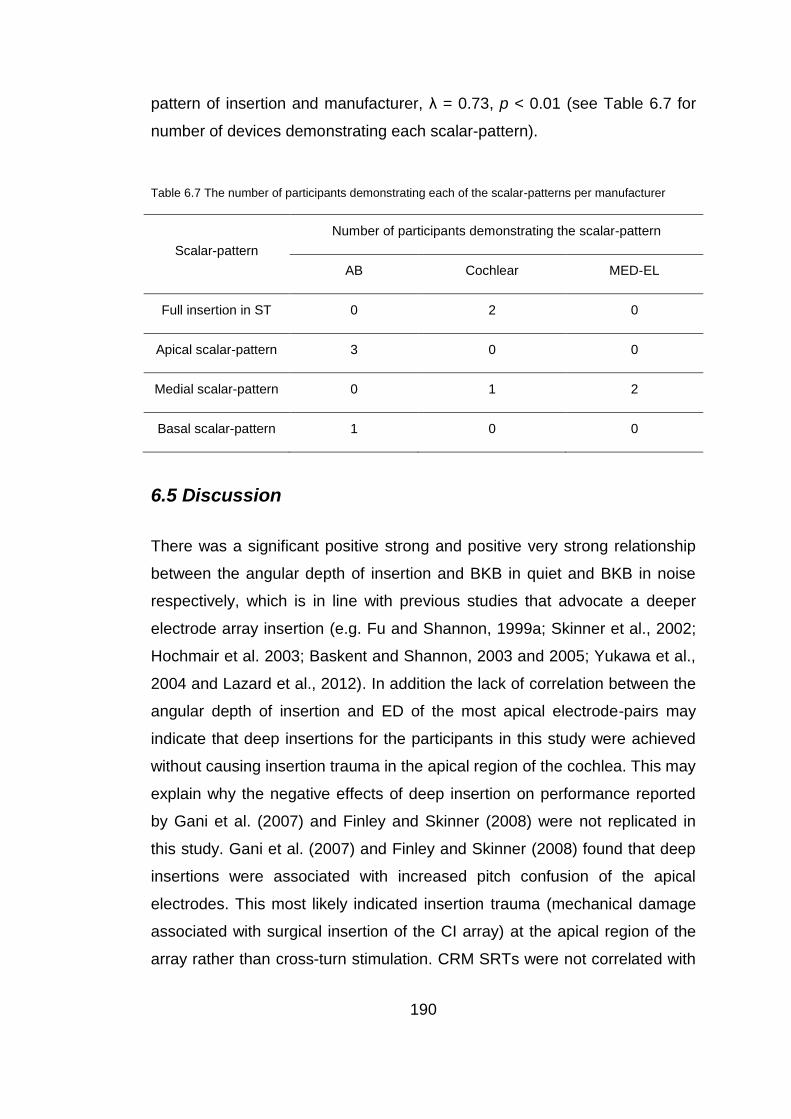
190
pattern of insertion and manufacturer, λ = 0.73, p < 0.01 (see Table 6.7 for
number of devices demonstrating each scalar-pattern).
Table 6.7 The number of participants demonstrating each of the scalar-patterns per manufacturer
Scalar-pattern
Number of participants demonstrating the scalar-pattern
AB Cochlear MED-EL
Full insertion in ST 0 2 0
Apical scalar-pattern 3 0 0
Medial scalar-pattern 0 1 2
Basal scalar-pattern 1 0 0
6.5 Discussion
There was a significant positive strong and positive very strong relationship
between the angular depth of insertion and BKB in quiet and BKB in noise
respectively, which is in line with previous studies that advocate a deeper
electrode array insertion (e.g. Fu and Shannon, 1999a; Skinner et al., 2002;
Hochmair et al. 2003; Baskent and Shannon, 2003 and 2005; Yukawa et al.,
2004 and Lazard et al., 2012). In addition the lack of correlation between the
angular depth of insertion and ED of the most apical electrode-pairs may
indicate that deep insertions for the participants in this study were achieved
without causing insertion trauma in the apical region of the cochlea. This may
explain why the negative effects of deep insertion on performance reported
by Gani et al. (2007) and Finley and Skinner (2008) were not replicated in
this study. Gani et al. (2007) and Finley and Skinner (2008) found that deep
insertions were associated with increased pitch confusion of the apical
electrodes. This most likely indicated insertion trauma (mechanical damage
associated with surgical insertion of the CI array) at the apical region of the
array rather than cross-turn stimulation. CRM SRTs were not correlated with
191
the angular depth of insertion; this could be due to the small number of
participants who had CRM SRTs (underpowered).
There was a manufacturers’ effect on angular depth of insertion, a significant
difference was found between MED-EL and AB devices’ angular depth of
insertion which could mainly be attributed to the longer MED-EL array and
thicker AB array. However, there was no manufacturers’ effect on
performance which concurred with previous findings (e.g. Friesen et al., 2001
and Green et al., 2007). A possible explanation for a manufacturers’ effect on
angular depth of insertion but lack of a manufacturers’ effect on performance
could be provided by the frequency shift results. There was a strong
significant negative relationship between the frequency shift and BKB in
noise which is in line with previous findings (e.g. Baskent and Shannon, 2003
and 2005). The absence of a statistically significant relationship between the
frequency shift and BKB in quiet may indicate that other factors may
contribute to CI performance (e.g. dead regions or ED). This pattern of
results may reflect the BKB in noise requirement for better spectral
representation than BKB in quiet and concurs with Whitford et al. (1993) who
found an effect of better frequency alignment (between the characteristic and
stimulated frequencies) on speech perception in noise but not in quiet.
There was no manufacturers’ effect on frequency shift, the lack of difference
between the different manufacturers could be caused by the lower centre
frequency stimulated by the most apical electrode in MED-EL (with the
deepest angular depth of insertion) in comparison to the higher centre
frequency stimulated in AB devices (with the most shallow angular depth of
insertion in the study). This was supported by the lack of a manufacturers’
effect on the frequency shift.
The combined results of the angular depth of insertion and frequency shift
indicated that the main effect of angular depth of insertion on performance
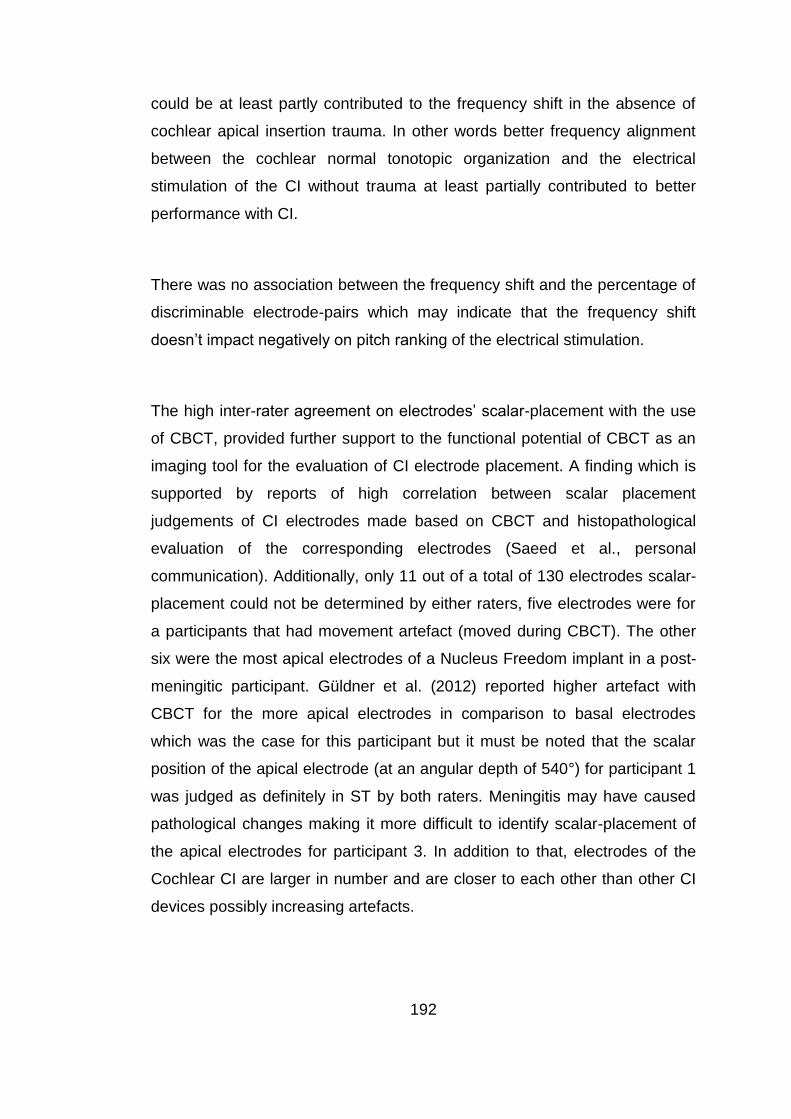
192
could be at least partly contributed to the frequency shift in the absence of
cochlear apical insertion trauma. In other words better frequency alignment
between the cochlear normal tonotopic organization and the electrical
stimulation of the CI without trauma at least partially contributed to better
performance with CI.
There was no association between the frequency shift and the percentage of
discriminable electrode-pairs which may indicate that the frequency shift
doesn’t impact negatively on pitch ranking of the electrical stimulation.
The high inter-rater agreement on electrodes’ scalar-placement with the use
of CBCT, provided further support to the functional potential of CBCT as an
imaging tool for the evaluation of CI electrode placement. A finding which is
supported by reports of high correlation between scalar placement
judgements of CI electrodes made based on CBCT and histopathological
evaluation of the corresponding electrodes (Saeed et al., personal
communication). Additionally, only 11 out of a total of 130 electrodes scalar-
placement could not be determined by either raters, five electrodes were for
a participants that had movement artefact (moved during CBCT). The other
six were the most apical electrodes of a Nucleus Freedom implant in a post-
meningitic participant. Güldner et al. (2012) reported higher artefact with
CBCT for the more apical electrodes in comparison to basal electrodes
which was the case for this participant but it must be noted that the scalar
position of the apical electrode (at an angular depth of 540°) for participant 1
was judged as definitely in ST by both raters. Meningitis may have caused
pathological changes making it more difficult to identify scalar-placement of
the apical electrodes for participant 3. In addition to that, electrodes of the
Cochlear CI are larger in number and are closer to each other than other CI
devices possibly increasing artefacts.
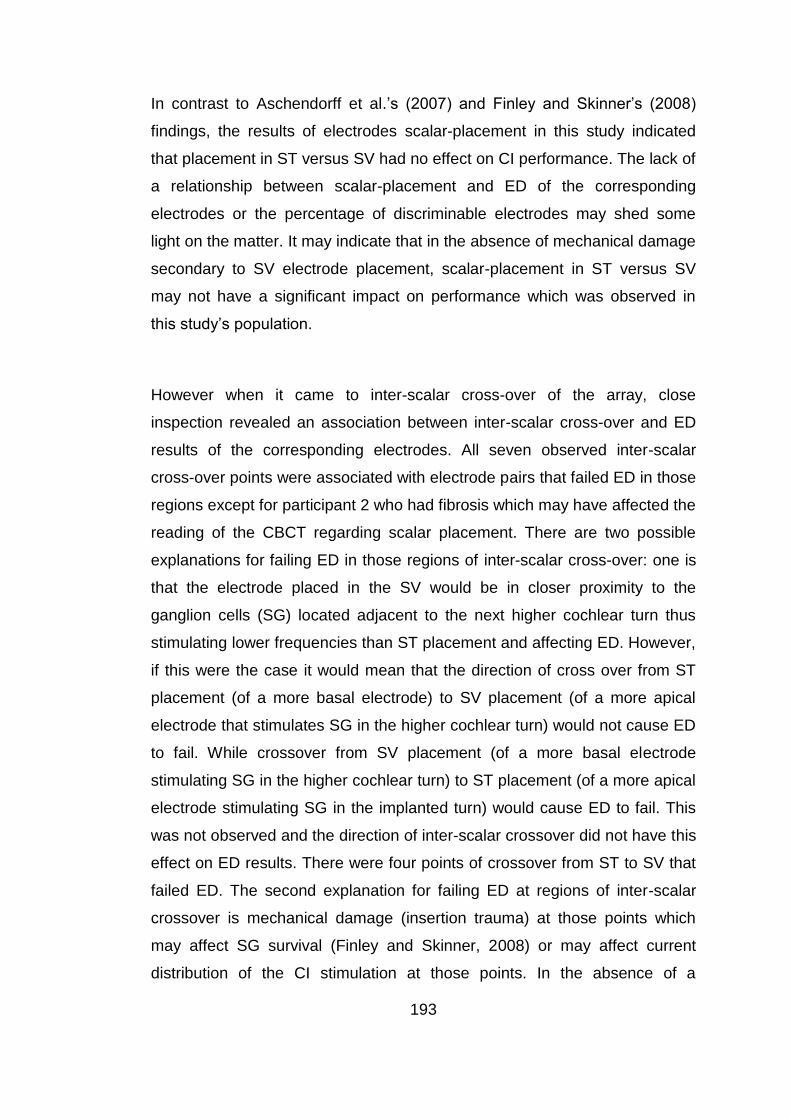
193
In contrast to Aschendorff et al.’s (2007) and Finley and Skinner’s (2008)
findings, the results of electrodes scalar-placement in this study indicated
that placement in ST versus SV had no effect on CI performance. The lack of
a relationship between scalar-placement and ED of the corresponding
electrodes or the percentage of discriminable electrodes may shed some
light on the matter. It may indicate that in the absence of mechanical damage
secondary to SV electrode placement, scalar-placement in ST versus SV
may not have a significant impact on performance which was observed in
this study’s population.
However when it came to inter-scalar cross-over of the array, close
inspection revealed an association between inter-scalar cross-over and ED
results of the corresponding electrodes. All seven observed inter-scalar
cross-over points were associated with electrode pairs that failed ED in those
regions except for participant 2 who had fibrosis which may have affected the
reading of the CBCT regarding scalar placement. There are two possible
explanations for failing ED in those regions of inter-scalar cross-over: one is
that the electrode placed in the SV would be in closer proximity to the
ganglion cells (SG) located adjacent to the next higher cochlear turn thus
stimulating lower frequencies than ST placement and affecting ED. However,
if this were the case it would mean that the direction of cross over from ST
placement (of a more basal electrode) to SV placement (of a more apical
electrode that stimulates SG in the higher cochlear turn) would not cause ED
to fail. While crossover from SV placement (of a more basal electrode
stimulating SG in the higher cochlear turn) to ST placement (of a more apical
electrode stimulating SG in the implanted turn) would cause ED to fail. This
was not observed and the direction of inter-scalar crossover did not have this
effect on ED results. There were four points of crossover from ST to SV that
failed ED. The second explanation for failing ED at regions of inter-scalar
crossover is mechanical damage (insertion trauma) at those points which
may affect SG survival (Finley and Skinner, 2008) or may affect current
distribution of the CI stimulation at those points. In the absence of a
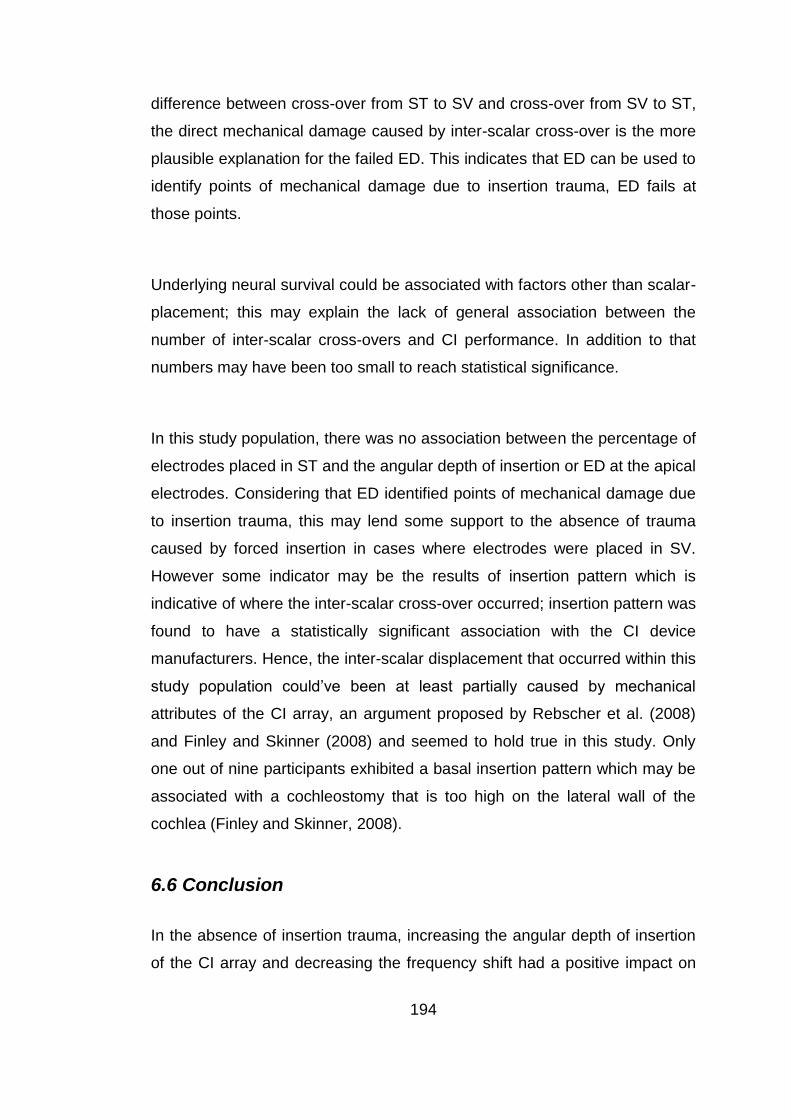
194
difference between cross-over from ST to SV and cross-over from SV to ST,
the direct mechanical damage caused by inter-scalar cross-over is the more
plausible explanation for the failed ED. This indicates that ED can be used to
identify points of mechanical damage due to insertion trauma, ED fails at
those points.
Underlying neural survival could be associated with factors other than scalar-
placement; this may explain the lack of general association between the
number of inter-scalar cross-overs and CI performance. In addition to that
numbers may have been too small to reach statistical significance.
In this study population, there was no association between the percentage of
electrodes placed in ST and the angular depth of insertion or ED at the apical
electrodes. Considering that ED identified points of mechanical damage due
to insertion trauma, this may lend some support to the absence of trauma
caused by forced insertion in cases where electrodes were placed in SV.
However some indicator may be the results of insertion pattern which is
indicative of where the inter-scalar cross-over occurred; insertion pattern was
found to have a statistically significant association with the CI device
manufacturers. Hence, the inter-scalar displacement that occurred within this
study population could’ve been at least partially caused by mechanical
attributes of the CI array, an argument proposed by Rebscher et al. (2008)
and Finley and Skinner (2008) and seemed to hold true in this study. Only
one out of nine participants exhibited a basal insertion pattern which may be
associated with a cochleostomy that is too high on the lateral wall of the
cochlea (Finley and Skinner, 2008).
6.6 Conclusion
In the absence of insertion trauma, increasing the angular depth of insertion
of the CI array and decreasing the frequency shift had a positive impact on

195
CI performance. However in the absence of trauma, scalar placement in ST
versus SV did not affect performance. ED was affected at inter-scalar cross-
over indicating trauma and loss of spiral ganglion which was identified via
PTED. There was no correlation between scalar placement in ST versus SV
and ED, this may indicate that there might be dead regions or poorly
differentiated electrodes that cannot be explained by surgical placement
only, identifying those regions and addressing those regions in
reprogramming might be beneficial. Given the considerably lower radiation
exposure of CBCT in comparison to MSCT and the high definition of CBCT,
it seems to be an imaging tool with great potential for clinical and research
use.
6.7 Summary
Evidence suggests that insertion trauma (mechanical damage
associated with surgical insertion of the CI array) is a major factor with
a negative impact on CI performance.
In the absence of insertion trauma, increased angular depth of
insertion has a positive effect on CI performance.
In the absence of insertion trauma, there was no effect of scalar
placement in ST versus SV.
CBCT seems to be an imaging tool that provides high quality images
with relatively low radiation exposure.
PTED identified “dead” regions at inter-scalar cross-over; therefore
PTED might be used to identify other dead regions across the CI
electrode array which could further guide programming of the CI to
enhance performance. A study evaluating the use of PTED to guide
programming of CI is described in Chapter 7.

196
Chapter 7
Programming of CIs based on PTED results in
unilaterally implanted recipients
Abstract
The effect of deactivating indiscriminable CI electrodes was evaluated using
speech perception tests in quiet and noise for unilaterally implanted adults.
The CI recipients underwent testing with PTED, BKB sentences test in quiet
and in noise (whenever possible) and the adaptive CRM test. Each CI
recipient who failed PTED in at least one electrode-pair received two
research programs to try out in a cross-over study design. Research
programs either employed discriminable electrodes only or the most
discriminable two-thirds of the electrodes in the electrode array for CI
recipients failing PTED for more than a third of the electrodes. The
participants were also asked to subjectively report improvement of or decline
in sound quality in everyday listening situations. There was significant
improvement in CRM SRT, and BKB sentence scores in quiet and in noise
after deactivating indiscriminable electrodes. Individually, 20 out of 25
participants who received the research programs reported and/or showed
significant improvement with at least one research program. Only the five
participants who had cochlear calcification or fibrosis or had placement
issues showed no improvement, or reported no improvement, with the
research programs. The findings show that the identification of discriminable
electrodes in a clinically-viable procedure such as the PTED can potentially
be used to enhance speech perception with CI.

197
7.1 Introduction
A priority for all CI manufacturers is to achieve maximal speech
understanding for the CI recipients. One approach that manufacturers have
adopted to attempt to enhance post-cochlear implantation performance is to
increase the number of distinct pitch percepts (see Chapter 2), either by
increasing the number of physical contacts, extending to 22 active
electrodes, or by using “current steering” (described in Section 1.4.3.3) to
focus stimulation and create a larger number of pitch percepts via virtual
channels (Donaldson et al., 2005; Firszt et al., 2007; Koch et al., 2007;
Bonham and Litvak, 2008; Wilson and Dorman, 2008). This approach may
not always be effective if we consider that the number of perceptual channels
is often less than the number of active CI channels (Blamey et al., 1992;
Zwolan et al., 1997; Fu et al., 1998 and Friesen et al., 2001). Explanations
for this discrepancy include the possibility that CI channels stimulate
overlapping neuronal populations (Fu and Nogaki, 2004; Dorman and Spahr,
2006), which could be the result of neural “dead regions”, or due to
electrodes being placed relatively far from the spiral ganglion neurons
(Wilson and Dorman, 2008).
A second approach to producing distinct pitch percepts is the use of bipolar
and tripolar CI stimulation (described in Section 1.2.5) to create more
focused stimulation and reduce the spread of current (Bierer et al., 2005;
Bonham et al., 2005; Litvak et al., 2007; Zhu et al., 2012). Because bipolar
and tripolar coupling provides more focused stimulation, they could be more
sensitive to the presence of dead regions (with little or no functioning spiral
ganglion cells), making them useful stimulation modes for identifying such
regions (Bierer and Faulkner, 2010 and Bierer et al., 2011). In Chapter 3,
PTED a new, clinically-viable method for the identification of problematic
electrodes was proposed, described and evaluated for reliability and validity.
Further validation was offered to the PTED in Chapter 5, where a positive
association was found between the percentage of discriminable electrodes
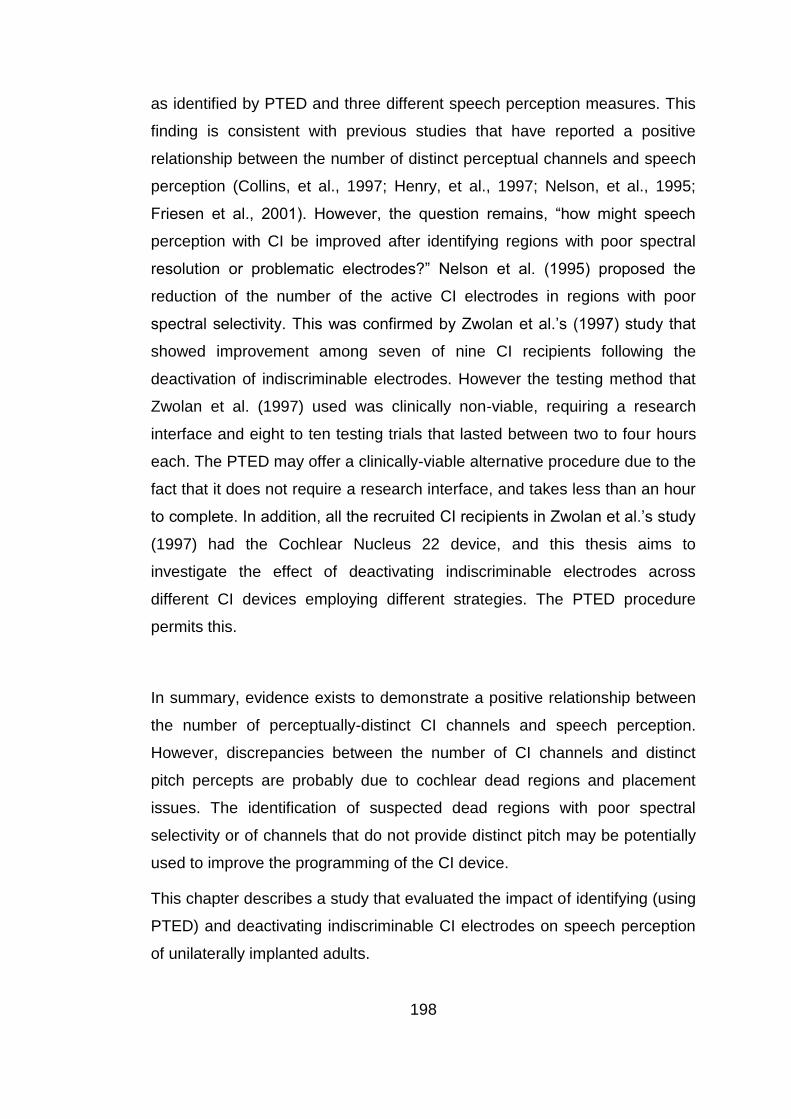
198
as identified by PTED and three different speech perception measures. This
finding is consistent with previous studies that have reported a positive
relationship between the number of distinct perceptual channels and speech
perception (Collins, et al., 1997; Henry, et al., 1997; Nelson, et al., 1995;
Friesen et al., 2001). However, the question remains, “how might speech
perception with CI be improved after identifying regions with poor spectral
resolution or problematic electrodes?” Nelson et al. (1995) proposed the
reduction of the number of the active CI electrodes in regions with poor
spectral selectivity. This was confirmed by Zwolan et al.’s (1997) study that
showed improvement among seven of nine CI recipients following the
deactivation of indiscriminable electrodes. However the testing method that
Zwolan et al. (1997) used was clinically non-viable, requiring a research
interface and eight to ten testing trials that lasted between two to four hours
each. The PTED may offer a clinically-viable alternative procedure due to the
fact that it does not require a research interface, and takes less than an hour
to complete. In addition, all the recruited CI recipients in Zwolan et al.’s study
(1997) had the Cochlear Nucleus 22 device, and this thesis aims to
investigate the effect of deactivating indiscriminable electrodes across
different CI devices employing different strategies. The PTED procedure
permits this.
In summary, evidence exists to demonstrate a positive relationship between
the number of perceptually-distinct CI channels and speech perception.
However, discrepancies between the number of CI channels and distinct
pitch percepts are probably due to cochlear dead regions and placement
issues. The identification of suspected dead regions with poor spectral
selectivity or of channels that do not provide distinct pitch may be potentially
used to improve the programming of the CI device.
This chapter describes a study that evaluated the impact of identifying (using
PTED) and deactivating indiscriminable CI electrodes on speech perception
of unilaterally implanted adults.
199
7.1.1 Aims and hypotheses
This study evaluated the use of CI recipients’ ability to differentiate between
the different CI electrodes in the identification of regions of poor ED by
finding indiscriminable electrodes. The PTED procedure was used to assess
ED and the effect of deactivating the indiscriminable electrodes was
evaluated. A cross-over study design was used to compare speech
perception with the everyday clinical program to speech perception with the
two research CI programs.
In line with previous studies (Zwolan et al., 1997), it was predicted that
deactivating indiscriminable electrodes (that stimulate suspected dead
regions with poor spectral selectivity or of channels that do not provide
distinct pitch) in the CI research program would improve speech perception
with CIs. Delivery of information, that would otherwise be lost due to the
distortions caused by dead regions, can improve speech perception with CIs
as demonstrated in simulation studies (Smith and Faulkner, 2006). The
clinical programme would be assessed at the beginning and end of the study
to ensure that learning effects are accounted for. Main research hypotheses:
H1: The CI recipients will have significantly different BKB scores (in quiet and
in noise) with at least one research program (with deactivated indiscriminable
electrodes) as compared to the clinical program (at the beginning and end of
the study).
H2: The CI recipients will have significantly different CRM SRTs with at least
one research program (with deactivated indiscriminable electrodes) as
compared to the clinical program (at the beginning and end of the study).
H3: The CI recipients will report objective improvement in the sound quality
delivered by the CI with at least one research program (with deactivated
indiscriminable electrodes) as compared to the clinical program.
200
7.2 Method
7.2.1 Participants
Participants were recruited from the RNTNEH and through the NCIUA.
35 adult CI recipients with acquired deafness were recruited.
The inclusion criteria were that the participants had:
1. A minimum of six months CI experience.
2. An aural-oral mode of communication.
3. English as a first language.
Participants’ demographics:
(1) Duration of deafness was calculated for each participant from the date of
diagnosis of a bilateral profound sensorineural hearing loss, it ranged from 1
to 53 years. (2) Age at testing ranged between 19 to 83 years with a mean of
59 years (± 16). (3) The aetiology of the hearing loss was unknown in 15 out
of the 35 participants. (4) CI experience was calculated from date of switch
on of the present implant; it ranged from 8 to 204 months, with a mean of 68
months (± 48) and a median of 57 months. (5) The hearing loss was
progressive for all of the participants. (6) Among the participants there were
10 AB CI recipients, 12 Med-El™ CI recipients and 13 Cochlear® CI
recipients.
Five participants had a prelingual or perilingual onset (before 5 years old)
hearing loss (participants 3, 4, 9, 26 and 31). Two participants (2 and 7) had
a history of cochlear explantation and re-implantation and participant 5 had a
folded over electrode tip at insertion. Table (7.1) details participants’
demographics. Participant 34 was excluded due to being diagnosed with
dementia and participant 15 retracted from the research because she had to
travel after first session.
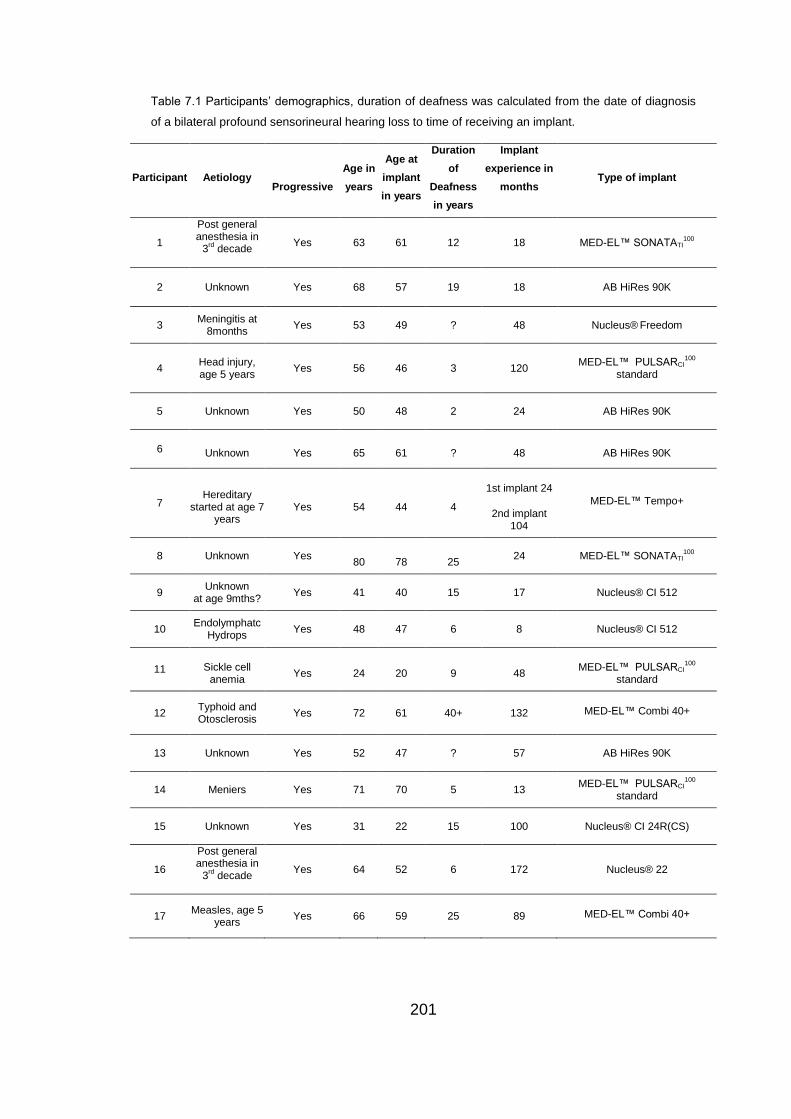
201
Table 7.1 Participants’ demographics, duration of deafness was calculated from the date of diagnosis
of a bilateral profound sensorineural hearing loss to time of receiving an implant.
Participant Aetiology
Progressive
Age in
years
Age at
implant
in years
Duration
of
Deafness
in years
Implant
experience in
months
Type of implant
1
Post general anesthesia in
3rd decade
Yes 63 61 12 18 MED-EL™ SONATATI100
2 Unknown Yes 68 57 19 18 AB HiRes 90K
3 Meningitis at
8months Yes 53 49 ? 48 Nucleus®
Freedom
4
Head injury, age 5 years
Yes 56 46 3 120 MED-EL™ PULSARCI
100
standard
5 Unknown Yes 50 48 2 24 AB HiRes 90K
6 Unknown Yes 65 61 ? 48 AB HiRes 90K
7 Hereditary
started at age 7 years
Yes 54 44 4
1st implant 24
2nd implant 104
MED-EL™ Tempo+
8 Unknown Yes
80
78
25 24 MED-EL™ SONATATI
100
9 Unknown
at age 9mths? Yes 41 40 15 17 Nucleus® CI 512
10 Endolymphatc
Hydrops Yes 48 47 6 8 Nucleus® CI 512
11 Sickle cell anemia
Yes 24 20 9 48 MED-EL™ PULSARCI
100
standard
12 Typhoid and Otosclerosis
Yes 72 61 40+ 132 MED-EL™ Combi 40+
13 Unknown Yes 52 47 ? 57 AB HiRes 90K
14 Meniers Yes 71 70 5 13 MED-EL™ PULSARCI
100
standard
15 Unknown Yes 31 22 15 100 Nucleus® CI 24R(CS)
16
Post general anesthesia in
3rd decade
Yes 64 52 6 172 Nucleus® 22
17 Measles, age 5
years Yes 66 59 25 89 MED-EL™ Combi 40+
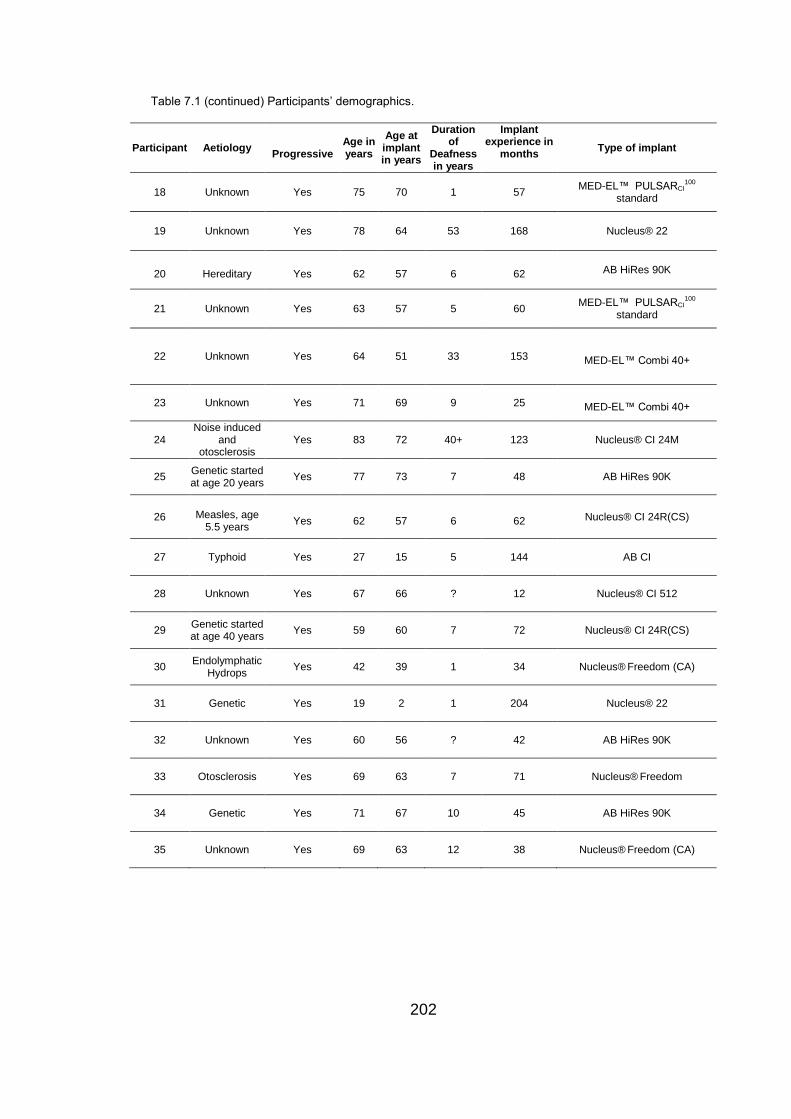
202
Table 7.1 (continued) Participants’ demographics.
Participant Aetiology
Progressive Age in years
Age at implant in years
Duration of
Deafness in years
Implant experience in
months
Type of implant
18 Unknown Yes 75 70 1 57 MED-EL™ PULSARCI
100
standard
19 Unknown Yes 78 64 53 168 Nucleus® 22
20 Hereditary Yes 62 57 6 62 AB HiRes 90K
21 Unknown Yes 63 57 5 60 MED-EL™ PULSARCI
100
standard
22 Unknown Yes 64 51 33 153 MED-EL™ Combi 40+
23 Unknown Yes 71 69 9 25 MED-EL™ Combi 40+
24 Noise induced
and otosclerosis
Yes 83 72 40+ 123 Nucleus® CI 24M
25 Genetic started at age 20 years
Yes 77 73 7 48 AB HiRes 90K
26 Measles, age 5.5 years
Yes 62 57 6 62 Nucleus® CI 24R(CS)
27 Typhoid Yes 27 15 5 144 AB CI
28 Unknown Yes 67 66 ? 12 Nucleus® CI 512
29 Genetic started at age 40 years
Yes 59 60 7 72 Nucleus® CI 24R(CS)
30 Endolymphatic
Hydrops Yes 42 39 1 34 Nucleus®
Freedom (CA)
31 Genetic Yes 19 2 1 204 Nucleus® 22
32 Unknown Yes 60 56 ? 42 AB HiRes 90K
33 Otosclerosis Yes 69 63 7 71 Nucleus® Freedom
34 Genetic Yes 71 67 10 45 AB HiRes 90K
35 Unknown Yes 69 63 12 38 Nucleus® Freedom (CA)
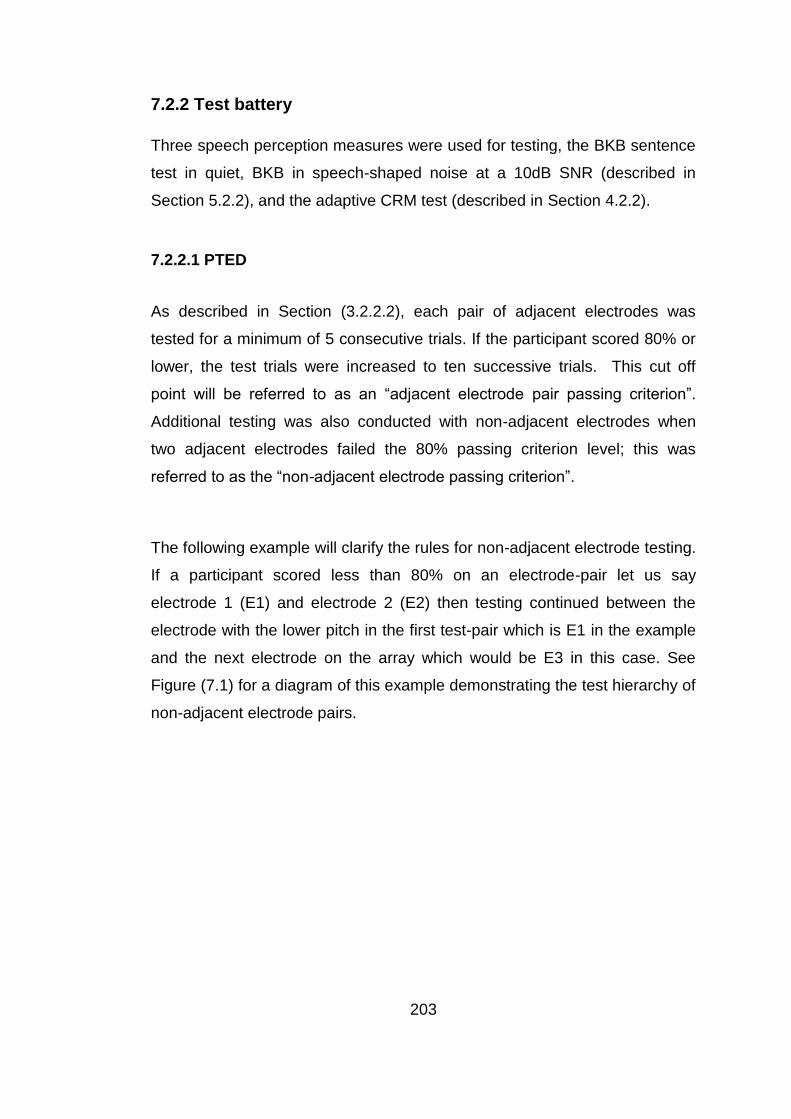
203
7.2.2 Test battery
Three speech perception measures were used for testing, the BKB sentence
test in quiet, BKB in speech-shaped noise at a 10dB SNR (described in
Section 5.2.2), and the adaptive CRM test (described in Section 4.2.2).
7.2.2.1 PTED
As described in Section (3.2.2.2), each pair of adjacent electrodes was
tested for a minimum of 5 consecutive trials. If the participant scored 80% or
lower, the test trials were increased to ten successive trials. This cut off
point will be referred to as an “adjacent electrode pair passing criterion”.
Additional testing was also conducted with non-adjacent electrodes when
two adjacent electrodes failed the 80% passing criterion level; this was
referred to as the “non-adjacent electrode passing criterion”.
The following example will clarify the rules for non-adjacent electrode testing.
If a participant scored less than 80% on an electrode-pair let us say
electrode 1 (E1) and electrode 2 (E2) then testing continued between the
electrode with the lower pitch in the first test-pair which is E1 in the example
and the next electrode on the array which would be E3 in this case. See
Figure (7.1) for a diagram of this example demonstrating the test hierarchy of
non-adjacent electrode pairs.
204
Figure 7.1 Example of rule hierarchy for testing electrode-pairs.
7.2.3 Procedure
Testing for PTED took place in a 2 x 2.5 m double-walled sound booth while
testing for speech perception took place in a 3.7×3.25 m double-walled
sound booth where the participant was seated 1 m in front of an ear level
loud speaker (Plus XS.2, Canton) from which the speech and noise were
presented. The stimuli were stored (16 bits), sampling rate (44.1 kHz)
presented using the AB-York Crescent of Sound (Kitterick et al., 2011).
For CRM the participants used a touch screen monitor to respond and the
software ran the test presentation and scoring in an automated fashion.
During BKB testing, the tester recoded the participants’ verbal response by
selecting the correct key words in each sentence presented.
Test electrode pair E1 and E2
Score < 80% Test E1 with next non-adjacent electrode pair
E1 and E3
Score ≥80% Test next adjacent
electrode pair E2 and E3
Score < 80% Test E1 with next non-adjacent electrode pair
E1 and E4
Score ≥80% Test next adjacent
electrode pair E2 and E3
205
All participants underwent BKB and PTED testing, CRM SRTs were
determined for 15 out of the 25 participants who received research
programs. CRM was not used for participant testing at the beginning of the
study but was introduced because some participants were performing at
ceiling level of the BKB sentence test in quiet and in noise. Additionally, test-
retest reliability had to be determined prior to initiating testing.
If a participant failed PTED for at least one electrode pair then they were
included in the cross-over section of the study in which indiscriminable
electrodes were deactivated. The rules for the deactivation of indiscriminable
electrodes were:
1. If a participant failed pitch ranking for an electrode pair, scores of
adjacent electrode pairs were reviewed. The more basal electrode or
the electrode at the end of the electrode array (the most apical or
most basal) in a single adjacent electrode pair was deactivated. If two
adjacent pairs failed then the electrode common to both failed pairs
was deactivated.
2. No more than one third of the total electrodes of the electrode array
was deactivated for any participant at any time; this maintained a
minimum of eight active electrodes for any participant which fits with
the number of contacts required for good speech perception
recommended by Friesen et al. (2001).
3. If a participant failed pitch ranking in electrode pairs that involved
more than a third of the total number of electrodes then regions of
failed pairs were identified. Then electrodes that failed ranking with a
larger number of non-adjacent electrodes were deactivated in each
region.
A cross-over study design was used (see Figure 7.2 for outline of the
procedure). In the first session speech perception was assessed with the
participant’s clinical program and the participant was provided with the first
206
research program; either program A or program B (details given in Section
7.2.4) based on the PTED task. After one month trial use the participant
returned for speech perception testing with the first research program; the
participant was then provided with the second research program. The
participant returned after a one month trial use for the final session. Speech
perception testing was carried out with the original clinical program and the
second research program. Final programming of the participant's speech
processor was conducted, based on both performance and preference. The
participant was also asked for feedback on each research program after
each one-month trial; this provided valuable information on sound quality in
different day-to-day listening situations. All participants were tested with BKB
in quiet with the clinical program at the first and third sessions and once with
each research program after the one month trial period. Participants who
scored higher than 50% in their BKB test in quiet were tested for BKB in
noise with the clinical program at the first and third sessions and once with
each research program after the one month trial period. CRM SRTs were
obtained twice in each session with the clinical program and with each
research program at the end of the one-month trial period.
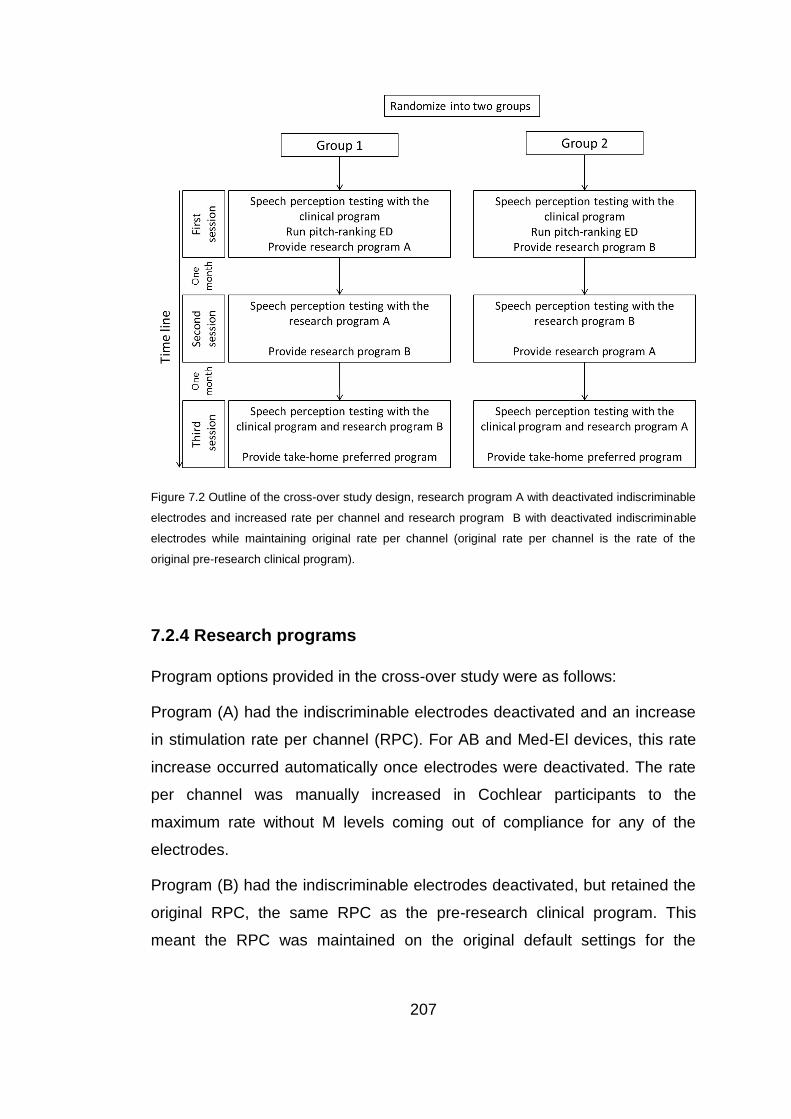
207
Figure 7.2 Outline of the cross-over study design, research program A with deactivated indiscriminable
electrodes and increased rate per channel and research program B with deactivated indiscriminable
electrodes while maintaining original rate per channel (original rate per channel is the rate of the
original pre-research clinical program).
7.2.4 Research programs
Program options provided in the cross-over study were as follows:
Program (A) had the indiscriminable electrodes deactivated and an increase
in stimulation rate per channel (RPC). For AB and Med-El devices, this rate
increase occurred automatically once electrodes were deactivated. The rate
per channel was manually increased in Cochlear participants to the
maximum rate without M levels coming out of compliance for any of the
electrodes.
Program (B) had the indiscriminable electrodes deactivated, but retained the
original RPC, the same RPC as the pre-research clinical program. This
meant the RPC was maintained on the original default settings for the
208
Cochlear devices and was manually decreased in AB and Med-El devices by
increasing the pulse width.
7.2.4.1 Participants with different research programs
There were three participants with Cochlear® devices where program (A)
had a lower Maxima (keeping same proportion of Maxima to number of
active electrodes after deactivating indiscriminable electrodes) because we
could not increase RPC due to technical reasons or because the participant
refused to listen with an increased RPC.
7.3 Analyses
As mentioned, above, each participant was tested with the clinical program
both at the beginning and end of the study to control for learning effects, and
once with each research program following a one-month trial. The best
speech perception results (BKB score in quiet and noise and CRM SRT
average) achieved with the clinical program were compared with the speech
perception results (BKB score in quiet and noise and CRM SRT average)
obtained with the best research program for each participant.
Statistical analysis was conducted to assess the following:
1. Whether there was a significant change in BKB in quiet after
deactivating indiscriminable electrodes.
2. Whether there was a significant change in BKB in noise after
deactivating indiscriminable electrodes.
3. Whether there was significant change in CRM after deactivating
indiscriminable electrodes.
4. Whether participants reported changes in sound quality after
deactivating indiscriminable electrodes.
209
5. Whether there was a significant difference between research
programs A and B.
7.3.1 Analyses of group results
BKB scores were converted to rationalized arcsine-transform units (RAU)
before conducting statistical analysis (Studebaker, 1985) in order to include
scores that were reaching ceiling. See Appendix D for raw BKB scores in
quiet and in noise and figures.
All 25 participants who took part in the cross-over study received two
research programs with the exception of participants 18 and 27. For these
two participants it was not possible to apply any changes to pulse width,
RPC or Maxima so they received program B only. Of those 25, participants
26, 29 and 30 received program A with the reduced Maxima. Group results
were analysed for two sub-groups:
Group I included all 25 participants, group II was exclusively for the 20
participants who received both programs A (with increased RPC) and B.
According to the Shapiro Wilk’s test, BKB scores in quiet and in noise were
normally distributed for all three groups; hence t-tests were conducted to
compare the clinical and research programs. While the Wilcoxon signed
ranks test was used to analyse the CRM SRTs because they were not
normally distributed.
7.3.2 Analyses of individual results
Each participant’s results were analysed and comparisons were made on an
individual basis comparing clinical and research programs to investigate any
underlying patterns. Exploration of the frequency region of the deactivated
electrodes was also evaluated.
210
7.3.2.1 Participant’s report
Each participant that received a research program was asked to report on
the sound quality with the research programs in day-to-day listening
situations. If the participant reported improvement in quality and reported
better hearing/speech understanding in everyday listening situations that was
considered as a positive report. If the participant either reported that they did
not like the sound quality or reported a decline in hearing/speech
understanding in everyday listening situations that was considered as a
negative report. If the participant reported that there was no difference
between the different programs they were recorded as equal.
7.3.2.2 CRM SRTs
Test-retest reliability of CRM SRTs was evaluated in Chapter 4 to calculate
the minimum significant difference. As indicated in Chapter 4, the minimum
significant change (at p< 0.05) in CRM SRTs among CI users is > 4dB.
7.3.2.3 BKB
For BKB scores, a 10% difference was considered significant. This value
was based on calculations of the minimum significant difference (Skinner et
al., 1995) which was >8.89% and an estimate of test-retest reliability of 7.6%
(Sarant et al., 2001). In Sarant et al.’s study the estimate was based on (1)
an inter-list variability of 10.1% across 126 pairs of BKB Sentences and (2)
an inter-transcriber standard deviation across 160 lists of 5.7%. Based on the
above, it was decided to consider a 10% difference as significantly different.
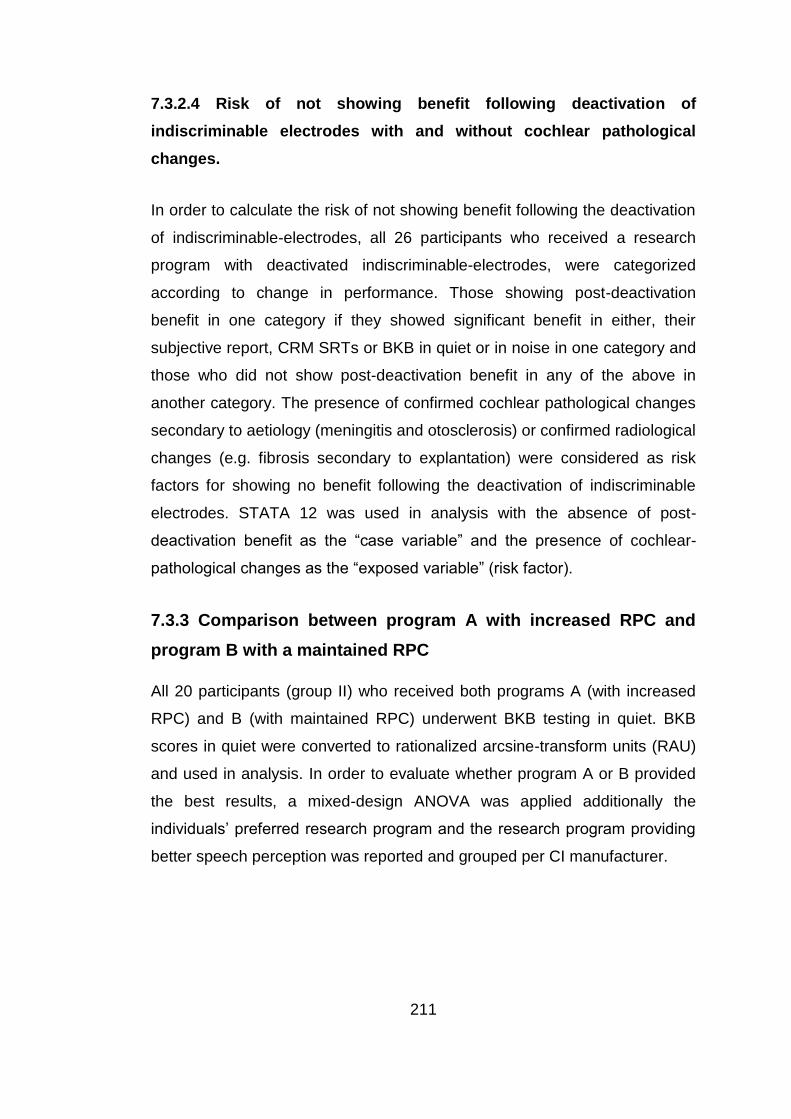
211
7.3.2.4 Risk of not showing benefit following deactivation of
indiscriminable electrodes with and without cochlear pathological
changes.
In order to calculate the risk of not showing benefit following the deactivation
of indiscriminable-electrodes, all 26 participants who received a research
program with deactivated indiscriminable-electrodes, were categorized
according to change in performance. Those showing post-deactivation
benefit in one category if they showed significant benefit in either, their
subjective report, CRM SRTs or BKB in quiet or in noise in one category and
those who did not show post-deactivation benefit in any of the above in
another category. The presence of confirmed cochlear pathological changes
secondary to aetiology (meningitis and otosclerosis) or confirmed radiological
changes (e.g. fibrosis secondary to explantation) were considered as risk
factors for showing no benefit following the deactivation of indiscriminable
electrodes. STATA 12 was used in analysis with the absence of post-
deactivation benefit as the “case variable” and the presence of cochlear-
pathological changes as the “exposed variable” (risk factor).
7.3.3 Comparison between program A with increased RPC and
program B with a maintained RPC
All 20 participants (group II) who received both programs A (with increased
RPC) and B (with maintained RPC) underwent BKB testing in quiet. BKB
scores in quiet were converted to rationalized arcsine-transform units (RAU)
and used in analysis. In order to evaluate whether program A or B provided
the best results, a mixed-design ANOVA was applied additionally the
individuals’ preferred research program and the research program providing
better speech perception was reported and grouped per CI manufacturer.

212
7.4 Results
7.4.1 Group results
The t-test was conducted on the BKB scores in quiet (RAU) for the two
groups; group I with all participants, group II which exclusively included the
participants who received both programs A (with increased RPC) and B. The
t -tests showed significant improvements with the best research program
compared to the best BKB score (RAU) with the clinical program for group I
(t = -3.47, df = 24, p < 0.005 with p = 0.002). This was also significant for
group II (t = -2.88, df = 19, p < 0.05 with p = 0.01) (See Figure 7.3 for
results). Thus the hypothesis H1 was accepted for all groups.
Figure 7.3 Mean BKB Sentence Test in quiet (RAU) for the two sub-groups with the use of the clinical
program (dark grey bars) and the best research program (light grey bars).The bars show mean scores,
error bars show ± 2SE.
The t-tests conducted on BKB scores in noise (RAU) revealed a significant
improvement with the best research program compared to the best BKB
score with the clinical program in group I (t = -2.91, df = 19, p < 0.01 with p =

213
0.009). This was also significant in group II (t = -2.64, df = 16, p < 0.05 with p
= 0.018) (See Figure 7.4 for results). Thus the hypothesis H2 was accepted
for all groups.
Figure 7.4 Mean BKB Sentence Test in noise (RAU) for the two sub-groups with the use of the clinical
program (dark grey bars) and the best research program (light grey bars).The bars show mean scores,
error bars show ± 2SE.
For CRM SRT results see Table (7.2). The Wilcoxon signed ranks test was
used to analyse CRM SRTs and showed significant improvement with the
best research program compared to the best CRM SRT with the clinical
program in group I (Z = -3.17, N = 15, p < 0.005 with p = 0.002). This was
also significant in group II (Z = -2.81, N = 10, p < 0.01 with p = 0.005) (See
Figure 7.5 for results). Thus the hypothesis H3 was accepted for all groups.
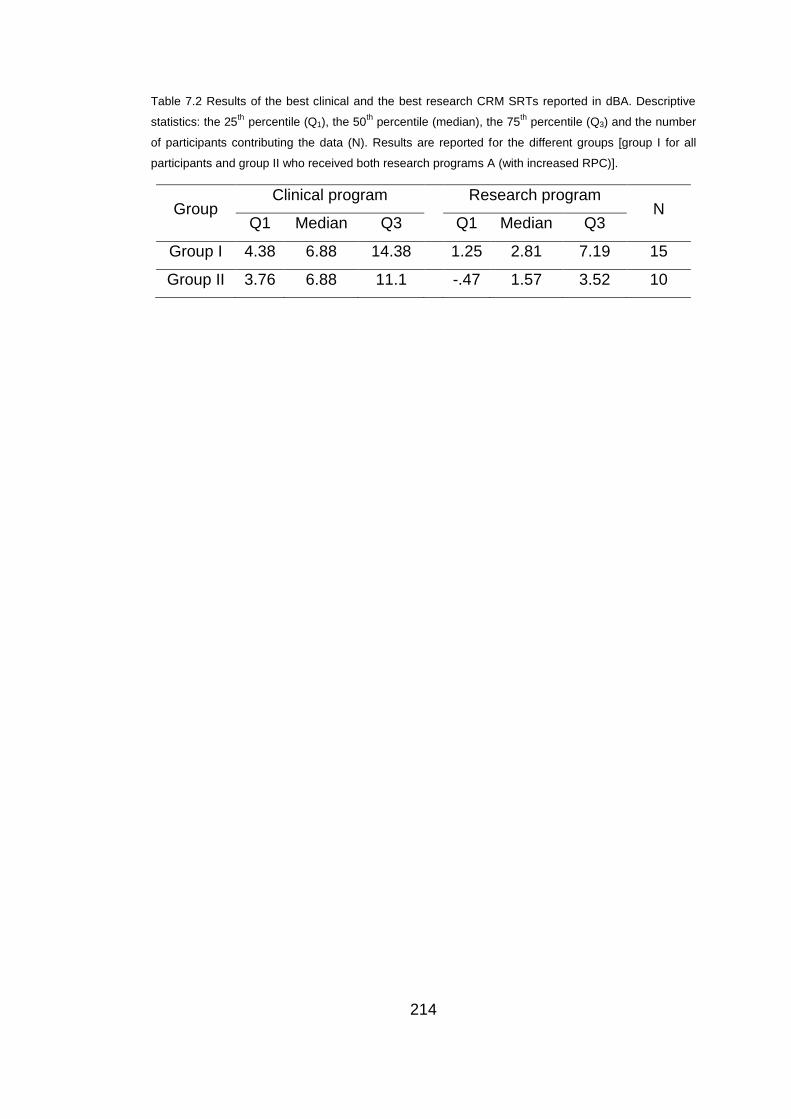
214
Table 7.2 Results of the best clinical and the best research CRM SRTs reported in dBA. Descriptive
statistics: the 25th
percentile (Q1), the 50th
percentile (median), the 75th
percentile (Q3) and the number
of participants contributing the data (N). Results are reported for the different groups [group I for all
participants and group II who received both research programs A (with increased RPC)].
Group Clinical program Research program
N Q1 Median Q3 Q1 Median Q3
Group I 4.38 6.88 14.38 1.25 2.81 7.19 15
Group II 3.76 6.88 11.1 -.47 1.57 3.52 10

215
Figure 7.5 Results of the CRM SRTs in dBA for the two sub-groups with the clinical program (dark grey
boxes) and the research program (light grey boxes), the boxes represent the range between the 25th
and 75th
percentiles and the line in the box represents the median. The whiskers show the 10th
and the
90th
percentiles.
7.4.2 Individual results
Participants were divided according to CI manufacturer to investigate
patterns relating to electrode array design, such as the number of electrodes
and the frequency to electrode assignment. Participants’ data were
organized according to change in performance, starting with participants
showing the greatest benefit down to participants showing no benefit from
the research program. Individual speech perception results and subjective
reports (improvement versus decline versus no significant difference), the
deactivated electrodes (DE) in the research programs, the number of DE at
low frequencies < 2600Hz (DELF) and the number of DE at high frequencies

216
> 2600 Hz (DEHF) can be seen in Tables (7.3, 7.4 and 7.5) for Cochlear,
MED-EL and AB respectively.
Eight out of the nine Cochlear participants either reported improvement,
and/or showed significant improvement in at least one speech perception
measure, and none showed significant decline. Five of those eight
participants received significant benefit in speech perception. The two
Cochlear participants who received significant benefit in both BKB tests in
quiet and in noise had the majority of the indiscriminable electrodes in the
frequency range below 2600 Hz and they both had adjacent electrodes
deactivated at certain regions.
Table 7.3 Individual results for Cochlear® devices (BKB in quiet and noise, CRM SRTs and subjective
report) and DE region, symbols used are: (=) for no significant difference, (+) for significant
improvement which is a higher BKB score and a lower CRM SRT followed by change in score if any,
(-) for significant decline, ceiling indicates BKB scores were at ceiling level for clinical and research
programs and N/A indicates scores not available. Adjacent DE are shown in red to highlight when a
region of electrodes were deactivated.
Participant BKB in quiet
BKB in noise
CRM SRT in
dBA Report DE DELF DEHF
10 (+) 20 (+) 26 N/A (+) 1,2,5,11,16,17
& 20 4 3
9 (+)18 (+)12 N/A (+) 1,6,10,14, 15
& 20 4 2
30 (+) 14 (=) (+) 5.48 (+) 1,4 &9 1 2
28 (=) (=) (+) 5.31 (+) 1,2,6&17 1 3
29 (=) N/A (+) 15.93 (+) 7,14,16,17&19 1 4
26 Ceiling (=) (=) (+) 4,8,19 & 21 2 2
35 Ceiling Ceiling (=) (+) 2,6,8&16 2 2
16 (=) (=) (=) (+) 1,14,17& 20 3 1
3 (=) (=) N/A (=) 1,2,5,11,16, 17
& 20 3 4
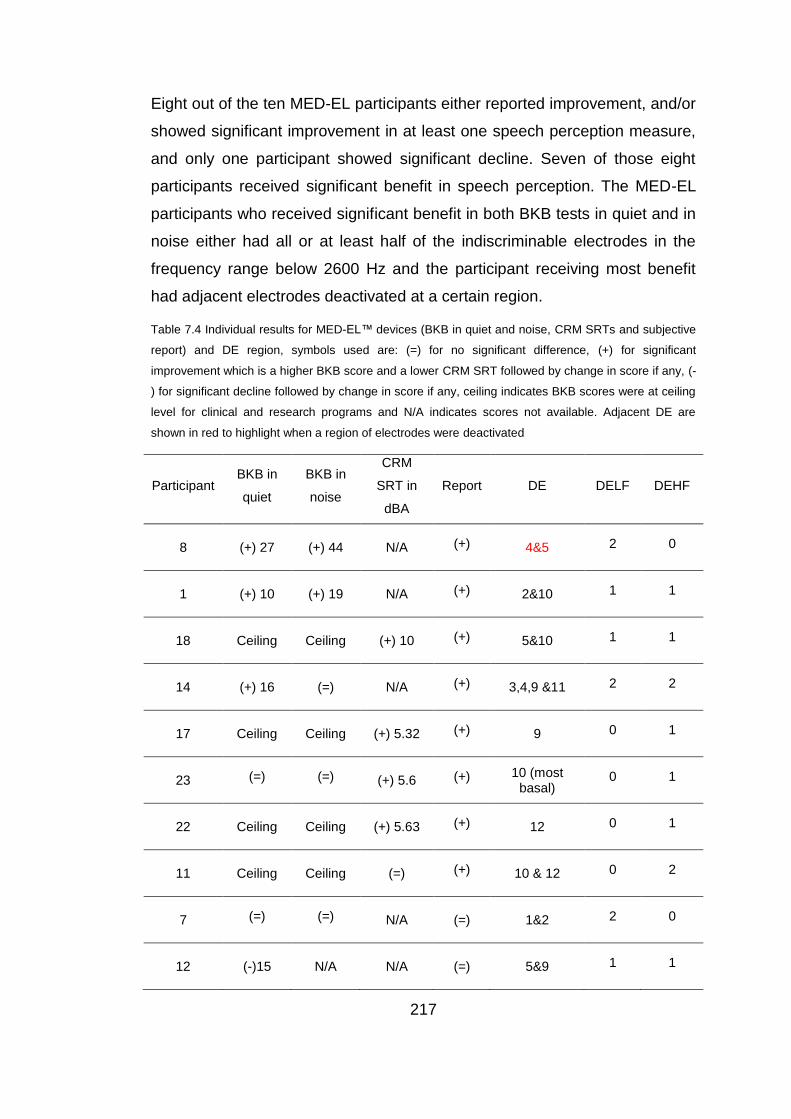
217
Eight out of the ten MED-EL participants either reported improvement, and/or
showed significant improvement in at least one speech perception measure,
and only one participant showed significant decline. Seven of those eight
participants received significant benefit in speech perception. The MED-EL
participants who received significant benefit in both BKB tests in quiet and in
noise either had all or at least half of the indiscriminable electrodes in the
frequency range below 2600 Hz and the participant receiving most benefit
had adjacent electrodes deactivated at a certain region.
Table 7.4 Individual results for MED-EL™ devices (BKB in quiet and noise, CRM SRTs and subjective
report) and DE region, symbols used are: (=) for no significant difference, (+) for significant
improvement which is a higher BKB score and a lower CRM SRT followed by change in score if any, (-
) for significant decline followed by change in score if any, ceiling indicates BKB scores were at ceiling
level for clinical and research programs and N/A indicates scores not available. Adjacent DE are
shown in red to highlight when a region of electrodes were deactivated
Participant BKB in
quiet
BKB in
noise
CRM
SRT in
dBA
Report DE DELF DEHF
8 (+) 27 (+) 44 N/A (+) 4&5 2 0
1 (+) 10 (+) 19 N/A (+) 2&10 1 1
18 Ceiling Ceiling (+) 10 (+) 5&10 1 1
14 (+) 16 (=) N/A (+) 3,4,9 &11 2 2
17 Ceiling Ceiling (+) 5.32 (+) 9 0 1
23 (=) (=) (+) 5.6 (+) 10 (most basal)
0 1
22 Ceiling Ceiling (+) 5.63 (+) 12 0 1
11 Ceiling Ceiling (=) (+) 10 & 12 0 2
7 (=) (=) N/A (=) 1&2 2 0
12 (-)15 N/A N/A (=) 5&9 1 1
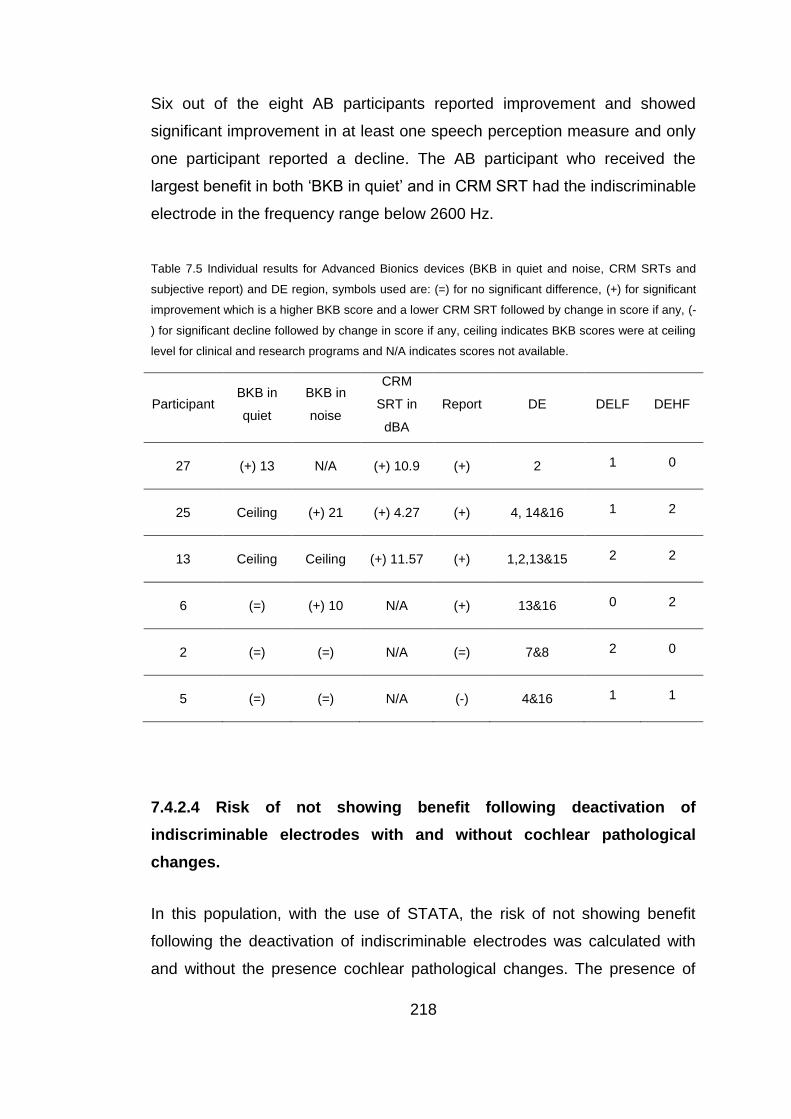
218
Six out of the eight AB participants reported improvement and showed
significant improvement in at least one speech perception measure and only
one participant reported a decline. The AB participant who received the
largest benefit in both ‘BKB in quiet’ and in CRM SRT had the indiscriminable
electrode in the frequency range below 2600 Hz.
Table 7.5 Individual results for Advanced Bionics devices (BKB in quiet and noise, CRM SRTs and
subjective report) and DE region, symbols used are: (=) for no significant difference, (+) for significant
improvement which is a higher BKB score and a lower CRM SRT followed by change in score if any, (-
) for significant decline followed by change in score if any, ceiling indicates BKB scores were at ceiling
level for clinical and research programs and N/A indicates scores not available.
Participant BKB in
quiet
BKB in
noise
CRM
SRT in
dBA
Report DE DELF DEHF
27 (+) 13 N/A (+) 10.9 (+) 2 1 0
25 Ceiling (+) 21 (+) 4.27 (+) 4, 14&16 1 2
13 Ceiling Ceiling (+) 11.57 (+) 1,2,13&15 2 2
6 (=) (+) 10 N/A (+) 13&16 0 2
2 (=) (=) N/A (=) 7&8 2 0
5 (=) (=) N/A (-) 4&16 1 1
7.4.2.4 Risk of not showing benefit following deactivation of
indiscriminable electrodes with and without cochlear pathological
changes.
In this population, with the use of STATA, the risk of not showing benefit
following the deactivation of indiscriminable electrodes was calculated with
and without the presence cochlear pathological changes. The presence of

219
cochlear pathological changes was entered as a risk factor. Results indicated
that the risk (probability) of not showing benefit if pathological changes are
present is 1 (i.e. 100%) and is 0.047 (i.e. 4.7%) in the absence of
pathological changes.
7.4.3 Comparison between program A (increased RPC) and
program B (maintained RPC)
A mixed-design ANOVA with the research program (program A- with
increased RPC- and program B) as a within-participants factor and order
(program A first or program B first) as a between-subjects factor was applied
on BKB scores in quiet. It revealed no main effect of research program, F (1,
18) = 0.025, p = 0.88 and no significant order effect F (1, 18) = 3.08, p =
0.09. This indicated that there was no general pattern indicating that one
research program was consistently better than the other. Therefore,
individual results of the research program that provided the better outcome
for participants who have received benefit were grouped by manufacturer.
Table (7.5) summari es each participant’s manufacturer, the preferred
research program and the program that provided better speech perception in
at least one measure (only significant differences are reported) for the 15
participants that received benefit and received program A (increased RPC
ranging from 1653 to 4000 pps) the preferred program also gave better
speech perception, except for participants 1 and 23 who both chose
programs with RPC around 2000 pps. Individual results and results per
manufacturer will be discussed later.
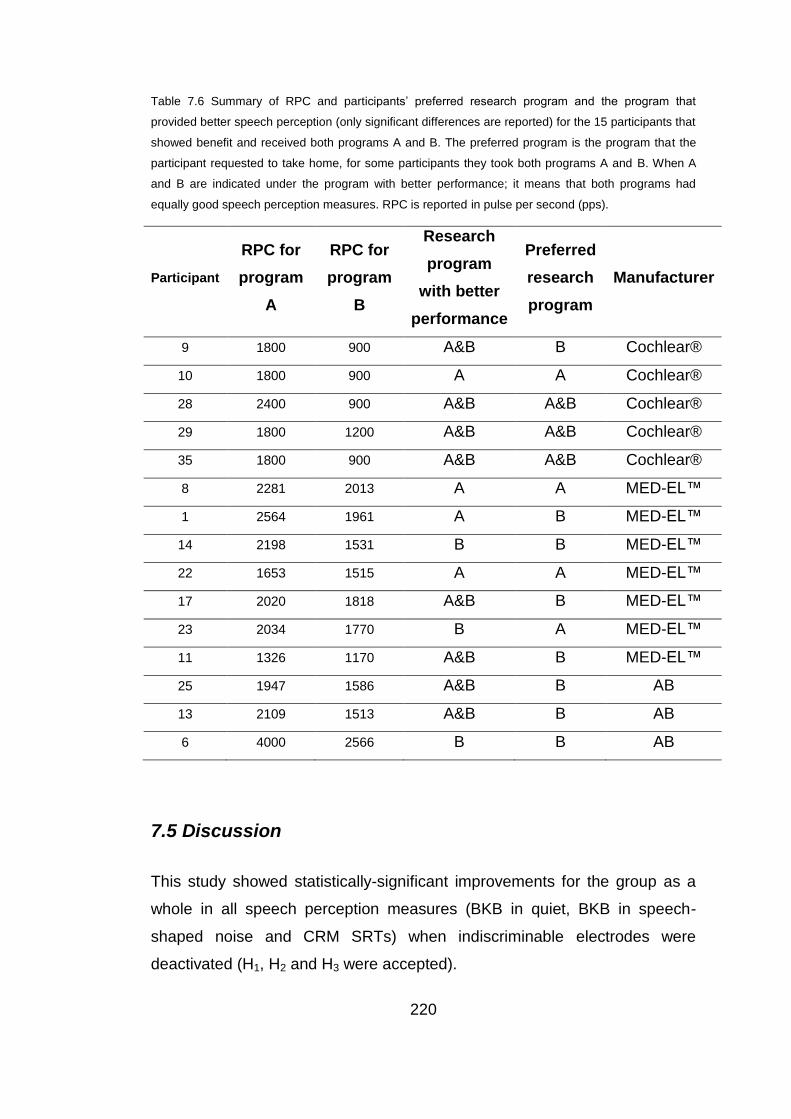
220
Table 7.6 Summary of RPC and participants’ preferred research program and the program that
provided better speech perception (only significant differences are reported) for the 15 participants that
showed benefit and received both programs A and B. The preferred program is the program that the
participant requested to take home, for some participants they took both programs A and B. When A
and B are indicated under the program with better performance; it means that both programs had
equally good speech perception measures. RPC is reported in pulse per second (pps).
Participant
RPC for
program
A
RPC for
program
B
Research
program
with better
performance
Preferred
research
program
Manufacturer
9 1800 900 A&B B Cochlear®
10 1800 900 A A Cochlear®
28 2400 900 A&B A&B Cochlear®
29 1800 1200 A&B A&B Cochlear®
35 1800 900 A&B A&B Cochlear®
8 2281 2013 A A MED-EL™
1 2564 1961 A B MED-EL™
14 2198 1531 B B MED-EL™
22 1653 1515 A A MED-EL™
17 2020 1818 A&B B MED-EL™
23 2034 1770 B A MED-EL™
11 1326 1170 A&B B MED-EL™
25 1947 1586 A&B B AB
13 2109 1513 A&B B AB
6 4000 2566 B B AB
7.5 Discussion
This study showed statistically-significant improvements for the group as a
whole in all speech perception measures (BKB in quiet, BKB in speech-
shaped noise and CRM SRTs) when indiscriminable electrodes were
deactivated (H1, H2 and H3 were accepted).
221
These results indicated that ED assessment might be a useful aide to guide
programming of CIs in order to maximize performance.
Group results for the 25 participants who received at least one research
program with indiscriminable electrodes deactivated showed a significant
improvement with the best research program compared to the best score
with a clinical program. This improvement was reflected in both BKB scores
in quiet and in speech-shaped noise and for CRM SRTs, this was consistent
with findings reported by Zwolan et al. (1997) when they deactivated
indiscriminable electrodes.
A closer evaluation of each individual participant’s results provided more
information. In our study 20 out of the 25 participants receiving research
programs reported improvement in hearing or improved sound quality
perception when indiscriminable electrodes were deactivated. Sixteen of the
25 (64%) showed significant improvements in at least one speech perception
measure (BKB in quiet, BKB in noise and/or CRM). Four of the participants
who did not show a statistically-significant change in performance reported
better sound quality that included (1) reduced noise, (2) improved
environmental sounds perception, (3) less reliance on their induction loop
system, (4) better speech understanding in noisy environments or public
places such as church or (5) more refined hearing e.g. one participant
reported hearing the hoarseness in their own voice for the first time. Three
out of those four participants (participants 11, 26 and 35) had at least one
BKB score at ceiling and two of them (participants 11 and 35) had BKB
scores at ceiling with their clinical programs in both quiet and noise. This
may have indicated that the speech perception tests were not sensitive
enough to detect the differences between the clinical and research programs
or that some of the incorrectly ranked electrodes may have affected sound
quality without significantly affecting speech perception. For one of these four
participants (participant 11) the indiscriminable electrodes fell in the
frequency range higher than 2600Hz and for two of these participants (26
and 35) half of the indiscriminable electrodes fell in the region above
222
2600Hz. This frequency region was reported to be of less importance to
speech perception than the lower frequency range (Shannon et al., 2001;
McKay and Henshall, 2001) and thus is less likely to have an impact on
speech compared with the lower frequency region. For the fourth participant
(16), it might have been that the speech perception tests used were not
sufficiently sensitive to highlight differences, this participant also suffered
from a strange change in the quality of sound after continuous CI use for
several hours which might have influenced her speech perception results.
A closer inspection of the individual participant’s frequency region for
indiscriminable (deactivated) electrodes and the associated speech
perception scores in Tables (7.3, 7.4 and 7.5) revealed consistent patterns.
The eight participants who showed BKB scores at ceiling with their clinical
programs (participants 11, 17, 18, 22, 23, 25, 26 and 35) had at least half of
their indiscriminable electrodes in the frequency range higher than 2600Hz.
Three out of those eight participants (11, 17 and 22) showed indiscriminable
electrodes only in the high frequency range (>2600Hz), and no participant
showed more than two indiscriminable electrodes for frequencies lower than
2600Hz. On the other hand, participants who had indiscriminable electrodes
in the low frequency range only (< 2600 Hz), or who had the majority of the
indiscriminable electrodes involving the low frequency range, were poorer
performers and none of them reached ceiling BKB scores with their clinical
programs. The biggest improvements in speech perception scores were
observed after deactivating indiscriminable electrodes either only in the low
frequency range (participant 27 with AB and participant 8 with Med-El) or
when more than half of the deactivated electrodes were in the low frequency
range (participants 9 and 10 with Cochlear® and participant 2 with Med-El).
This again is consistent with previous research highlighting the importance of
the low frequency range (< 2600 Hz) for speech perception (Shannon et al.,
2001; McKay and Henshall, 2001).

223
In order to evaluate the difference between the higher RPC and the lower
RPC a closer evaluation of the 15 participants who showed a significant
improvement in at least one speech perception measure and have received
both programs (A and B) with program A having a higher RPC was
warranted. A closer inspection of the preferred program and the better
program in terms of performance on the speech perception measures with
each of the different manufacturers might shed some light on the matter.
Three out of the seven participants implanted with MED-EL™ devices
(participants 1, 8 and 22) performed better with program A where the default
increase in RPC that occurred when the indiscriminable electrodes were
deactivated was allowed. While two out of seven (participants 14 and 23)
performed better with program B where RPC was maintained and two
participants (participants 11 and 17) did just as well with either program. Out
of those seven, four (participants 1, 11, 14 and 17) preferred program B
(maintaining the original clinical RPC) even when the participant did better
with program A as seen in participant (1) or equally as well with program B
(participant 17). Three participants preferred program A (participants 8, 22
and 23), two of them did better with program A (participants 8 and 22) and
one (participant 23) did better with program B. So out of the seven Med-El
participants, only two of them selected the program that was not necessarily
the best program (participant 1 and 23) in terms of speech perception. This
highlights two issues (1) the implanted individual preference may not always
be reflected in speech perception measures and that sound quality should be
considered as well (participant 1 thought program A with higher rate was
squeaky), (2) the RPC that both of these participants preferred was around
2000 pps, participant 1 preferred the original RPC of 1961 pps over the
faster rate of 2564 pps and participant 23 preferred the faster rate of 2094
pps over the original rate of 1770 pps. For the other participants (8, 11, 14,
17 and 22) their choice concurred with the speech perception measure, none
of them chose an RPC >2300 and the participant who did equally well with
programs A and B (participant 17) chose program B with RPC of 1531 over
program A with RPC 2198. For participant 17 it could have been an
224
adaptation issue but it must be noted that she thought program A was
squeaky; the same remark that participant 1 had about program A with the
faster RPC, again this highlighted the importance of quality and may have
indicated that the preferred RPC could be subject-dependent; each
participant has an upper limit for what is an acceptable RPC. However, no
adjustments were applied to T or MCL levels to following the deactivation of
the indiscriminable electrodes to ensure that other factors were not
confounding the results. It is possible that adjusting these levels may have
improved sound quality.
There was not any clear pattern of results observed with Cochlear®
participants however it must be noted that RPC never exceeded 1800 pps
except for participant 28. In participants with AB participants always
preferred program B (6, 13 and 25) with the lower RPC over program A with
the faster RPC, however we must point out (1) that we cannot generalize
results on such a small number, (2) that their preferred program was either
the program that they performed best with or did just as equally as well with;
there was no disagreement between the preferred research program and the
better program in terms of speech performance and (3) better performers
may benefit from higher rates.
Out of the twenty five participants who have received at least one research
program only five did not report or show significant improvement in the
speech perception measure. Four out of the five participants who did not
show improvement after deactivating indiscriminable electrodes reported no
difference between the research programs and the clinical program and one
participant showed significant decline in at least one speech perception
measure. Among those five; participant 3 had a history of meningitis,
participant 12 had otosclerosis, participants 2 and 7 had a history of
explantation and re-implantation with radiologically confirmed fibrosis in
participant 2 and participant 5 had radiologically confirmed CI placement
issues including a fold over electrode array tip. In participants (3, 12, 2 and 7)
etiology, history and in some cases radiology suggested the possibility for
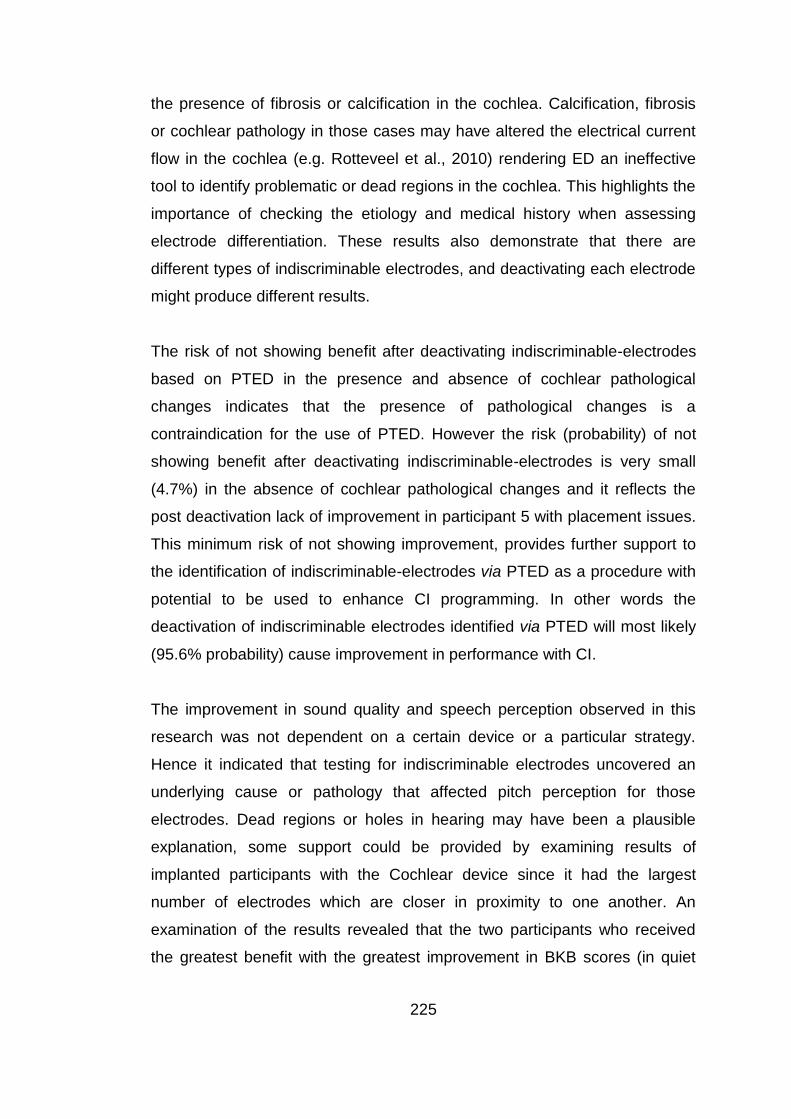
225
the presence of fibrosis or calcification in the cochlea. Calcification, fibrosis
or cochlear pathology in those cases may have altered the electrical current
flow in the cochlea (e.g. Rotteveel et al., 2010) rendering ED an ineffective
tool to identify problematic or dead regions in the cochlea. This highlights the
importance of checking the etiology and medical history when assessing
electrode differentiation. These results also demonstrate that there are
different types of indiscriminable electrodes, and deactivating each electrode
might produce different results.
The risk of not showing benefit after deactivating indiscriminable-electrodes
based on PTED in the presence and absence of cochlear pathological
changes indicates that the presence of pathological changes is a
contraindication for the use of PTED. However the risk (probability) of not
showing benefit after deactivating indiscriminable-electrodes is very small
(4.7%) in the absence of cochlear pathological changes and it reflects the
post deactivation lack of improvement in participant 5 with placement issues.
This minimum risk of not showing improvement, provides further support to
the identification of indiscriminable-electrodes via PTED as a procedure with
potential to be used to enhance CI programming. In other words the
deactivation of indiscriminable electrodes identified via PTED will most likely
(95.6% probability) cause improvement in performance with CI.
The improvement in sound quality and speech perception observed in this
research was not dependent on a certain device or a particular strategy.
Hence it indicated that testing for indiscriminable electrodes uncovered an
underlying cause or pathology that affected pitch perception for those
electrodes. Dead regions or holes in hearing may have been a plausible
explanation, some support could be provided by examining results of
implanted participants with the Cochlear device since it had the largest
number of electrodes which are closer in proximity to one another. An
examination of the results revealed that the two participants who received
the greatest benefit with the greatest improvement in BKB scores (in quiet
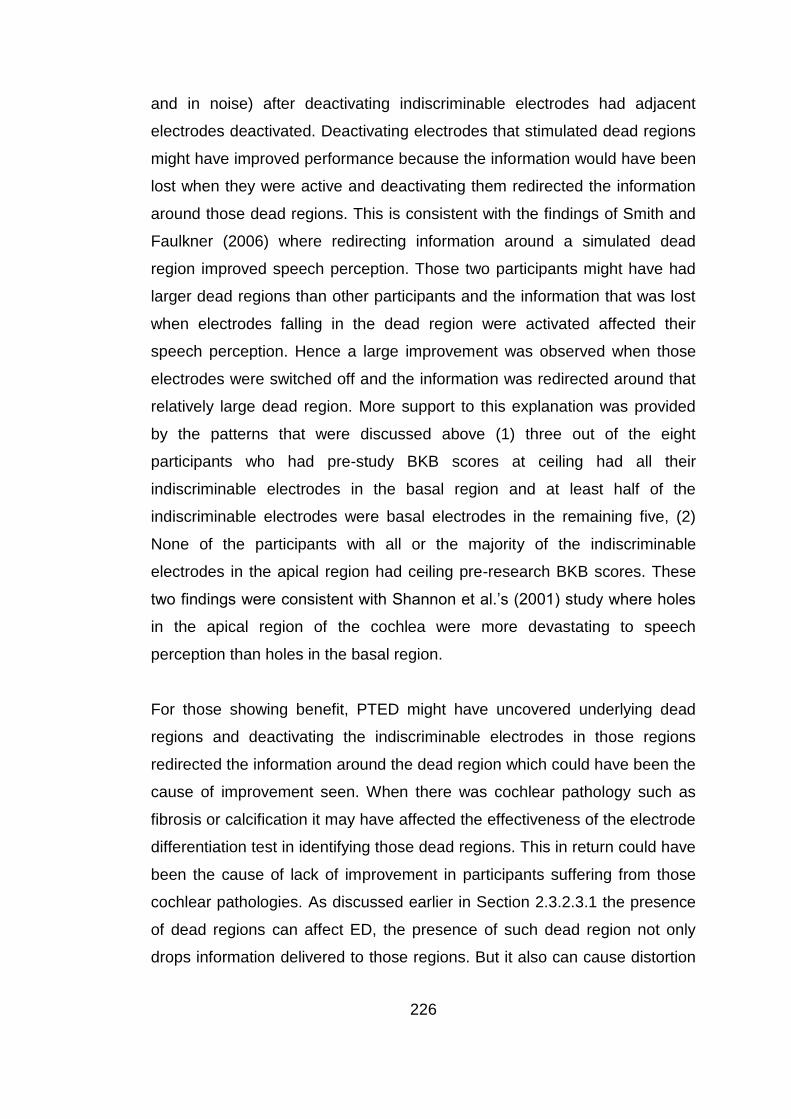
226
and in noise) after deactivating indiscriminable electrodes had adjacent
electrodes deactivated. Deactivating electrodes that stimulated dead regions
might have improved performance because the information would have been
lost when they were active and deactivating them redirected the information
around those dead regions. This is consistent with the findings of Smith and
Faulkner (2006) where redirecting information around a simulated dead
region improved speech perception. Those two participants might have had
larger dead regions than other participants and the information that was lost
when electrodes falling in the dead region were activated affected their
speech perception. Hence a large improvement was observed when those
electrodes were switched off and the information was redirected around that
relatively large dead region. More support to this explanation was provided
by the patterns that were discussed above (1) three out of the eight
participants who had pre-study BKB scores at ceiling had all their
indiscriminable electrodes in the basal region and at least half of the
indiscriminable electrodes were basal electrodes in the remaining five, (2)
None of the participants with all or the majority of the indiscriminable
electrodes in the apical region had ceiling pre-research BKB scores. These
two findings were consistent with Shannon et al.’s (2001) study where holes
in the apical region of the cochlea were more devastating to speech
perception than holes in the basal region.
For those showing benefit, PTED might have uncovered underlying dead
regions and deactivating the indiscriminable electrodes in those regions
redirected the information around the dead region which could have been the
cause of improvement seen. When there was cochlear pathology such as
fibrosis or calcification it may have affected the effectiveness of the electrode
differentiation test in identifying those dead regions. This in return could have
been the cause of lack of improvement in participants suffering from those
cochlear pathologies. As discussed earlier in Section 2.3.2.3.1 the presence
of dead regions can affect ED, the presence of such dead region not only
drops information delivered to those regions. But it also can cause distortion
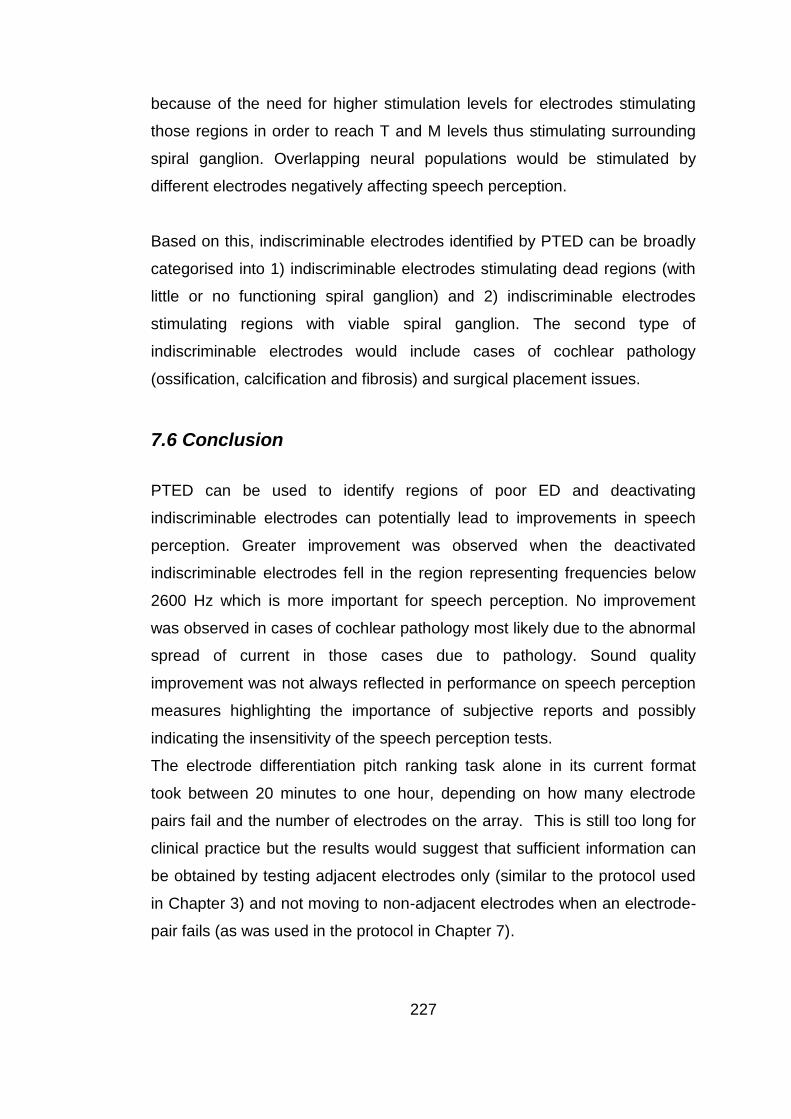
227
because of the need for higher stimulation levels for electrodes stimulating
those regions in order to reach T and M levels thus stimulating surrounding
spiral ganglion. Overlapping neural populations would be stimulated by
different electrodes negatively affecting speech perception.
Based on this, indiscriminable electrodes identified by PTED can be broadly
categorised into 1) indiscriminable electrodes stimulating dead regions (with
little or no functioning spiral ganglion) and 2) indiscriminable electrodes
stimulating regions with viable spiral ganglion. The second type of
indiscriminable electrodes would include cases of cochlear pathology
(ossification, calcification and fibrosis) and surgical placement issues.
7.6 Conclusion
PTED can be used to identify regions of poor ED and deactivating
indiscriminable electrodes can potentially lead to improvements in speech
perception. Greater improvement was observed when the deactivated
indiscriminable electrodes fell in the region representing frequencies below
2600 Hz which is more important for speech perception. No improvement
was observed in cases of cochlear pathology most likely due to the abnormal
spread of current in those cases due to pathology. Sound quality
improvement was not always reflected in performance on speech perception
measures highlighting the importance of subjective reports and possibly
indicating the insensitivity of the speech perception tests.
The electrode differentiation pitch ranking task alone in its current format
took between 20 minutes to one hour, depending on how many electrode
pairs fail and the number of electrodes on the array. This is still too long for
clinical practice but the results would suggest that sufficient information can
be obtained by testing adjacent electrodes only (similar to the protocol used
in Chapter 3) and not moving to non-adjacent electrodes when an electrode-
pair fails (as was used in the protocol in Chapter 7).

228
7.7 Summary
Deactivating indiscriminable electrodes can lead to improvements
in speech perception
Indiscriminable electrodes in the apical region were more
detrimental to speech perception than those in the basal region.
Deactivating indiscriminable electrodes improved speech
perception to a greater extent when all or the majority of
deactivated electrodes (more than 50%) fell in the frequency range
lower than 2600 Hz, i.e. mostly apical electrodes.
Deactivating indiscriminable electrodes can sometimes improve
perceived sound quality even if it was not reflected in the speech
perception scores, possibly due to the region of deactivation being
higher than 2600 Hz. Even though the higher frequency region is
less critical for speech it does have importance for sound quality
and also music perception, which we did not test here. It may also
be an indication that the speech perception measures that we
used were not sufficiently sensitive to demonstrate changes.
Aetiology, medical history and electrode placement could be
contributing factors in the success of deactivating indiscriminable
electrodes (e.g. calcification and fibrosis can affect the spread of
electrical current).
The improvements seen after deactivating indiscriminable
electrodes were not device or strategy related which may have
indicated a common underlying cause for the indiscriminable
electrodes; dead regions might be a plausible explanation. The
difference between indiscriminable electrodes falling in the apical
versus the basal region provided further support to this
explanation.
The PTED test has the potential to become a clinically viable tool
to improve performance with CIs.
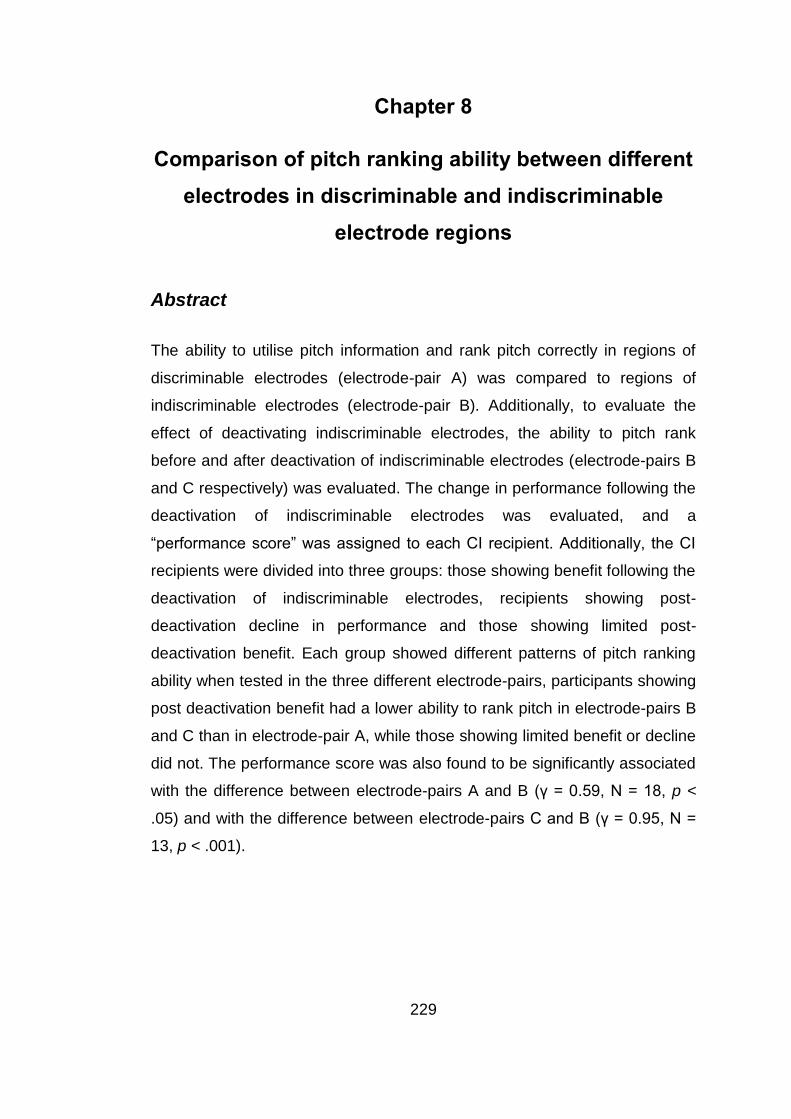
229
Chapter 8
Comparison of pitch ranking ability between different
electrodes in discriminable and indiscriminable
electrode regions
Abstract
The ability to utilise pitch information and rank pitch correctly in regions of
discriminable electrodes (electrode-pair A) was compared to regions of
indiscriminable electrodes (electrode-pair B). Additionally, to evaluate the
effect of deactivating indiscriminable electrodes, the ability to pitch rank
before and after deactivation of indiscriminable electrodes (electrode-pairs B
and C respectively) was evaluated. The change in performance following the
deactivation of indiscriminable electrodes was evaluated, and a
“performance score” was assigned to each CI recipient. Additionally, the CI
recipients were divided into three groups: those showing benefit following the
deactivation of indiscriminable electrodes, recipients showing post-
deactivation decline in performance and those showing limited post-
deactivation benefit. Each group showed different patterns of pitch ranking
ability when tested in the three different electrode-pairs, participants showing
post deactivation benefit had a lower ability to rank pitch in electrode-pairs B
and C than in electrode-pair A, while those showing limited benefit or decline
did not. The performance score was also found to be significantly associated
with the difference between electrode-pairs A and B (γ = 0.59, N = 18, p <
.05) and with the difference between electrode-pairs C and B (γ = 0.95, N =
13, p < .001).
230
8.1 Introduction
In Chapter 7, following deactivation of indiscriminable electrodes, the CI
participants showed different patterns of results with respect to those gaining
or not gaining benefit from de-activation. Some participants achieved big
improvements in performance while others, such as those with pathological
changes secondary to meningitis or otosclerosis received no benefit. A
possible explanation for those obtaining benefit was that the identification of
indiscriminable electrodes helped identify underlying dead regions (Moore,
2004). Reprogramming by deactivating those electrodes allowed the speech
information to be redirected to functional neural regions, giving rise to
improvement in speech performance. This is in line with studies that
simulated “dead regions” and found that redirecting the information that
would have been otherwise dropped (lost) around those spectral holes (dead
regions) provided better performance (Smith and Faulkner, 2006 and
Faulkner, 2006). To explore this hypothesis it was predicted that CI
participants showing benefit from deactivating indiscriminable electrodes
would be poorer at discriminating pitch information delivered in between
electrodes identified as indiscriminable with the PTED procedure compared
to regions of discriminable electrodes. Additionally, those recipients should
be better able to process pitch information when indiscriminable electrodes
are deactivated in contrast to when those electrodes are active, while CI
recipients showing no benefit or a decline in performance from deactivating
indiscriminable electrodes would be equally able to discriminate pitch
information delivered to regions of electrode-pairs identified as
indiscriminable with the PTED procedure compared to regions of
discriminable electrode-pairs. It was also predicted that those recipients
(showing no benefit or a decline) would not be able to process pitch
information when indiscriminable electrodes are deactivated, in contrast to
when those electrodes are active.

231
There is a body of evidence to suggest that for all implant systems
intermediate pitch percepts should be perceived between the physical
contacts of the CI. For the AB system, intermediate pitches should be
perceived due to current steering, but it has also been demonstrated that
stimulation of electrode pairs produced perceptions of intermediate pitches
for the Cochlear and MEDEL CIs (McDermott and McKay, 1994; Donaldson
et al., 2005; Kwon and van den Honert, 2006 and Nobbe et al., 2007).
These intermediate pitches were produced with simultaneous stimulation of
electrode-pairs (Donaldson et al., 2005 and Nobbe et al., 2007) and with
sequential stimulation of electrode-pairs as well (McDermott and McKay,
1994; Kwon and van den Honert, 2006 and Nobbe et al., 2007). There was
no significant difference between simultaneous and sequential stimulation of
electrode-pairs in terms of the frequency difference limen or the number of
intermediate pitch percepts elicited (Donaldson et al., 2005 and Nobbe et al.,
2007). The difference limen and number of intermediate pitch percepts
varied between CI recipients and, within participants, between the different
electrode-pairs at different points on the array (McDermott and McKay, 1994;
Donaldson et al., 2005; Kwon and van den Honert, 2006 and Nobbe et al.,
2007). Hence, the CI recipient ability to utilise pitch information at specific
regions of specific electrode-pairs could be evaluated by testing for
discriminable intermediate frequencies.
This chapter describes two studies; the first study compared the ability to
rank pitch in regions of indiscriminable electrodes versus regions of
discriminable electrodes for CI users with different patterns of post-
deactivation results (showing benefit versus showing little or no benefit). The
second study evaluated the difference between the CI recipients’ ability to
utilise pitch information delivered to regions of indiscriminable electrodes
both before and after electrode deactivation for CI users with different
patterns of post-deactivation results (showing benefit versus showing little or
no benefit).
232
8.2 Experiment I: Comparison between discriminable and
indiscriminable electrode-pair regions (A and B)
8.2.1 Introduction aims and hypotheses
This study evaluated the CI recipients’ ability to utilise pitch information in
regions of both discriminable and indiscriminable electrode-pairs in a pitch
ranking (direction) task of pure-tone presentations, using the PTED
procedure described in Chapter 3. The change in performance and sound
quality for those participants following the deactivation of indiscriminable
electrodes was categorised according to the type of change (positive versus
negative) and degree of change. The first objective of this study was to
compare between the CI recipients’ ability to utilise pitch information in
regions of discriminable versus indiscriminable electrode-pairs. This was
evaluated with the use of a pitch ranking task of pure-tones presented at the
centre frequencies of the tested electrode-pair and three frequencies
intermediate to them. The second objective was to categorise the change in
CI performance of participants following the deactivation of indiscriminable
electrodes (in Chapter 7). Then evaluate if the change in performance
(degree of benefit; ranging from deterioration in more than one measure to
achieving significant improvement in more than one measure) was
associated with the difference between their ability to rank pitch in regions of
discriminable versus regions of indiscriminable electrode-pairs. The third
objective was to evaluate whether pitch ranking of intermediate frequencies
(IF) can potentially be used to improve CI programming, especially in cases
of discrepancy between indications of the PTED and the IF testing. It was
hypothesised that participants showing benefit following the deactivation of
indiscriminable electrodes would not be able to rank intermediate
frequencies in regions of indiscriminable electrodes in comparison to regions
of discriminable electrodes because indiscriminable electrodes uncovered
dead regions. While participants showing no or little benefit will be able to
rank intermediate frequencies equally well in both regions because
indiscriminable electrodes did not uncover dead regions.
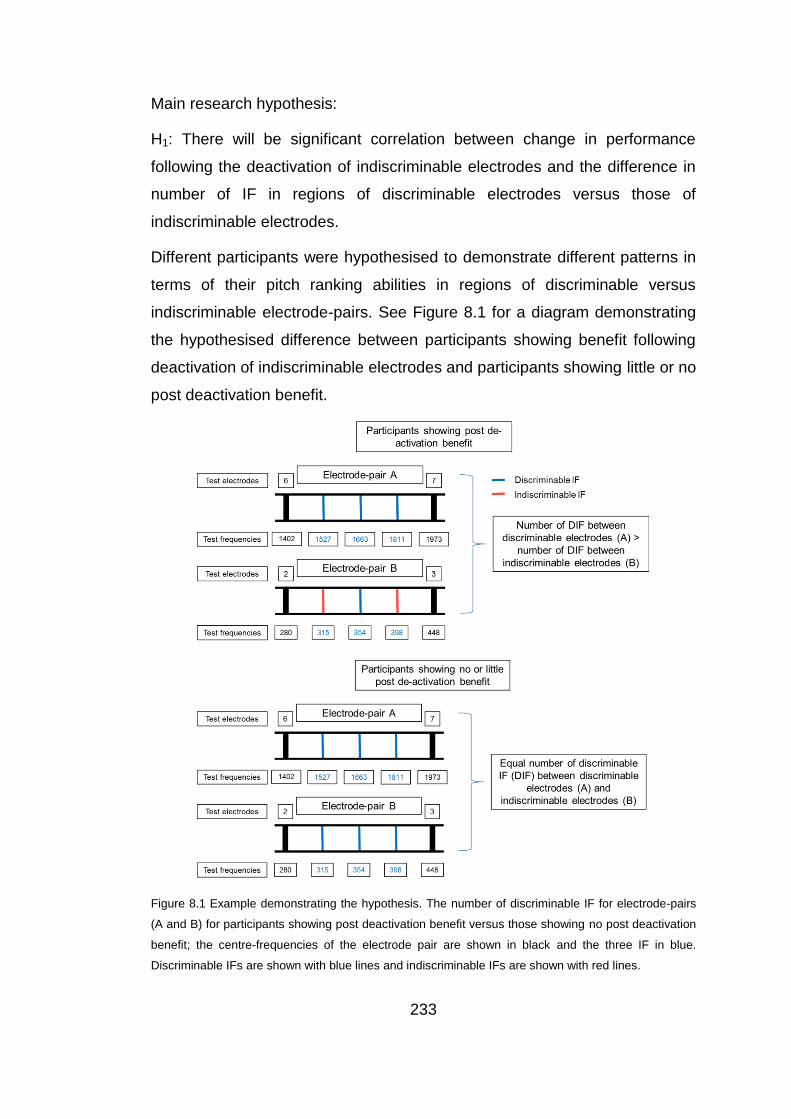
233
Main research hypothesis:
H1: There will be significant correlation between change in performance
following the deactivation of indiscriminable electrodes and the difference in
number of IF in regions of discriminable electrodes versus those of
indiscriminable electrodes.
Different participants were hypothesised to demonstrate different patterns in
terms of their pitch ranking abilities in regions of discriminable versus
indiscriminable electrode-pairs. See Figure 8.1 for a diagram demonstrating
the hypothesised difference between participants showing benefit following
deactivation of indiscriminable electrodes and participants showing little or no
post deactivation benefit.
Figure 8.1 Example demonstrating the hypothesis. The number of discriminable IF for electrode-pairs
(A and B) for participants showing post deactivation benefit versus those showing no post deactivation
benefit; the centre-frequencies of the electrode pair are shown in black and the three IF in blue.
Discriminable IFs are shown with blue lines and indiscriminable IFs are shown with red lines.
234
8.2.2 Method
8.2.2.1 Participants
The participants for this study were recruited for the study described in
Chapter 7, in addition to two additional participants that were recruited from
the RNTNEH and through the NCIUA. Participants 9 and 13 could not come
for the two follow up appointments (required for the study described in
Chapter 7) but were particularly recruited for this study because they had
otosclerosis and meningitis, respectively, as their aetiology of deafness;
these aetiologies of deafness were associated with limited benefit following
the deactivation of indiscriminable electrodes (Chapter 7) and were of special
interest.
22 adult CI recipients with acquired deafness were recruited. The same
inclusion criteria for participants in the studies reported in Chapters 5 and 7
were used, with the addition of having a clear concept of pitch without the
need for training and/or are musically trained. To ensure that all participants
had a clear understanding of pitch, the three participants (5, 7 and 19) who
had a prelingual or perilingual onset of hearing loss were recruited because
they were previously musically trained. Participants 1-18 received at least
one research program with the indiscriminable electrodes deactivated, and
participants 19-22 were star performers who passed PTED for all electrode-
pairs and had BKB scores in noise approaching ceiling at a SNR of 10dB
and 5dB one. The star performers had CI devices from the three different CI
manufacturers, one had an AB device, one had a MED-El™ device and two
had Cochlear® devices. The participants for this study were recruited for the
study described in Chapter 7, in addition to two additional participants.
Participants 9 and 13 could not come for the two follow up appointments
(required for the study described in Chapter 7) but were particularly recruited
for this study because they had otosclerosis and meningitis, respectively, as
their aetiology of deafness; these aetiologies of deafness were associated
235
with limited benefit, following the deactivation of indiscriminable electrodes
(Chapter 7) and were of special interest.
Participants’ demographics:
(1) Duration of deafness was calculated for each participant from the date of
diagnosis of a bilateral profound sensorineural hearing loss; it ranged from 2
to 53 years. (2) Age at testing ranged between 19 to 77 years, with a mean
of 59.5 years (± 15) and a median of 63.5 years. (3) The aetiology of the
hearing loss was unknown in 9 out of the 22 participants. (4) CI experience
was calculated from date of switch on of the present implant; it ranged from
12 to 204 months, with a mean of 63 months (± 48) and a median of 52.5
months. (5) The hearing loss was progressive for all of the participants
except participant 13. (6) Among the participants, there were 5 AB CI
recipients, 9 MED-EL™ CI recipients and 8 Cochlear® CI recipients. Table
(8.1) details participants’ demographics.
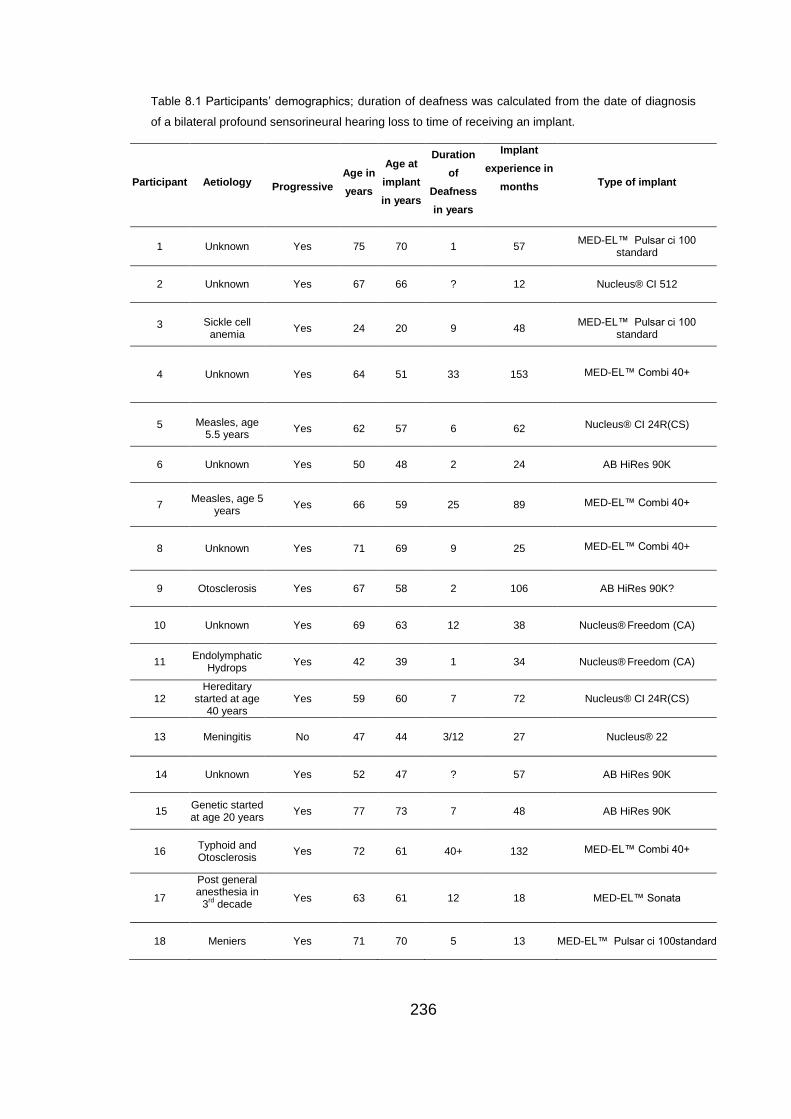
236
Table 8.1 Participants’ demographics; duration of deafness was calculated from the date of diagnosis
of a bilateral profound sensorineural hearing loss to time of receiving an implant.
Participant Aetiology
Progressive
Age in
years
Age at
implant
in years
Duration
of
Deafness
in years
Implant
experience in
months
Type of implant
1 Unknown Yes 75 70 1 57 MED-EL™ Pulsar ci 100
standard
2 Unknown Yes 67 66 ? 12 Nucleus® CI 512
3 Sickle cell anemia
Yes 24 20 9 48 MED-EL™ Pulsar ci 100
standard
4 Unknown Yes 64 51 33 153 MED-EL™ Combi 40+
5 Measles, age 5.5 years
Yes 62 57 6 62 Nucleus® CI 24R(CS)
6 Unknown Yes 50 48 2 24 AB HiRes 90K
7 Measles, age 5 years
Yes 66 59 25 89 MED-EL™ Combi 40+
8 Unknown Yes 71 69 9 25 MED-EL™ Combi 40+
9 Otosclerosis Yes 67 58 2 106 AB HiRes 90K?
10 Unknown Yes 69 63 12 38 Nucleus® Freedom (CA)
11 Endolymphatic
Hydrops Yes 42 39 1 34 Nucleus®
Freedom (CA)
12 Hereditary
started at age 40 years
Yes 59 60 7 72 Nucleus® CI 24R(CS)
13 Meningitis No 47 44 3/12 27 Nucleus® 22
14 Unknown Yes 52 47 ? 57 AB HiRes 90K
15 Genetic started at age 20 years
Yes 77 73 7 48 AB HiRes 90K
16 Typhoid and Otosclerosis
Yes 72 61 40+ 132 MED-EL™ Combi 40+
17
Post general anesthesia in
3rd decade
Yes 63 61 12 18 MED-EL™ Sonata
18 Meniers Yes 71 70 5 13 MED-EL™ Pulsar ci 100standard
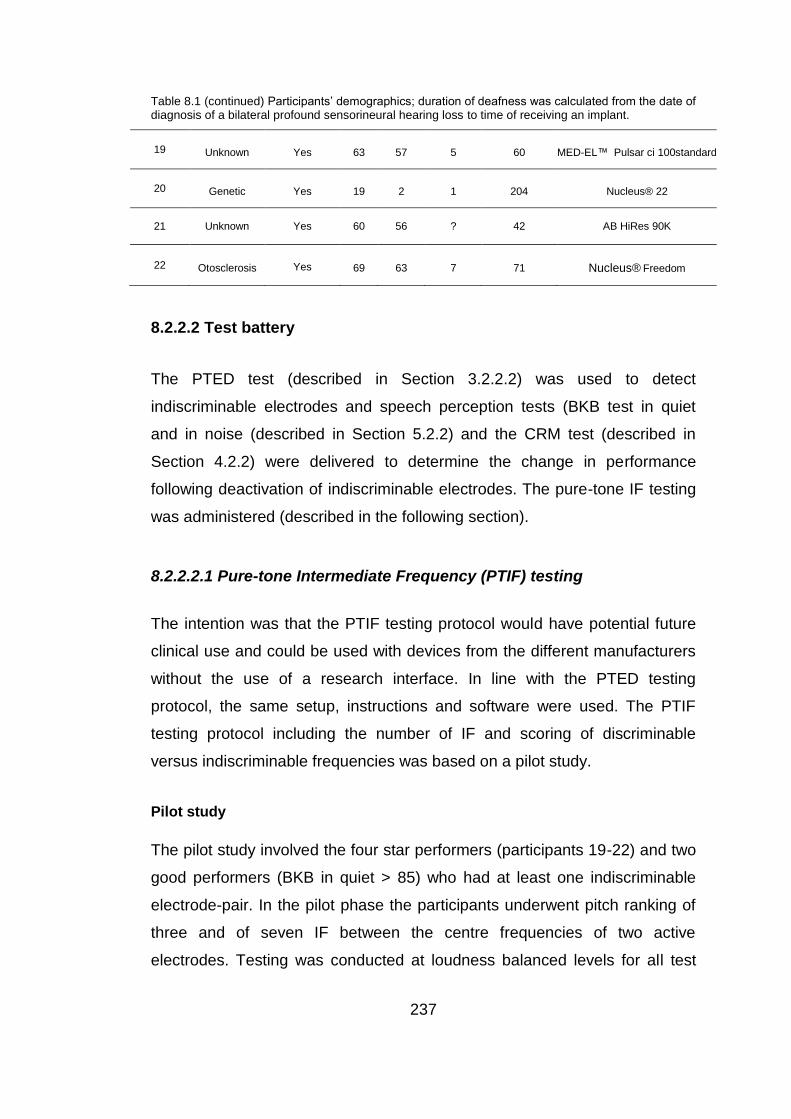
237
Table 8.1 (continued) Participants’ demographics; duration of deafness was calculated from the date of diagnosis of a bilateral profound sensorineural hearing loss to time of receiving an implant.
19 Unknown Yes 63 57 5 60 MED-EL™ Pulsar ci 100standard
20 Genetic Yes 19 2 1 204 Nucleus® 22
21 Unknown Yes 60 56 ? 42 AB HiRes 90K
22 Otosclerosis Yes 69 63 7 71 Nucleus® Freedom
8.2.2.2 Test battery
The PTED test (described in Section 3.2.2.2) was used to detect
indiscriminable electrodes and speech perception tests (BKB test in quiet
and in noise (described in Section 5.2.2) and the CRM test (described in
Section 4.2.2) were delivered to determine the change in performance
following deactivation of indiscriminable electrodes. The pure-tone IF testing
was administered (described in the following section).
8.2.2.2.1 Pure-tone Intermediate Frequency (PTIF) testing
The intention was that the PTIF testing protocol would have potential future
clinical use and could be used with devices from the different manufacturers
without the use of a research interface. In line with the PTED testing
protocol, the same setup, instructions and software were used. The PTIF
testing protocol including the number of IF and scoring of discriminable
versus indiscriminable frequencies was based on a pilot study.
Pilot study
The pilot study involved the four star performers (participants 19-22) and two
good performers (BKB in quiet > 85) who had at least one indiscriminable
electrode-pair. In the pilot phase the participants underwent pitch ranking of
three and of seven IF between the centre frequencies of two active
electrodes. Testing was conducted at loudness balanced levels for all test
238
frequencies and was applied with electrode-pairs in the apical, mid and basal
regions of the electrode array. An IF which was correctly ranked with at least
two other test frequencies (PTIF ≥ 80%) and did not show reversal (PTIF ≤
20%) with any IF was considered discriminable. The four star performers
(with no indiscriminable electrodes) had up to 7 discriminable IF (DIF) in
each of the three regions except for participant 19 (a telephone user) who
had 3 DIF only in the basal region. The two good performers (with at least
one indiscriminable electrode) did not have more than three DIF at any
region (average of 2 DIFs) and found testing with seven IF very difficult.
Based on these findings it was determined that three IF will be sufficient for
testing, especially since a star performer who was a telephone user had
three DIFs only at one of the tested regions and none of the good performers
had more than three DIFs.
PTIF testing protocol
Pure tones that corresponded to the centre frequencies of the processing
filters of the test electrode-pair and three frequencies intermediate to those
two centre frequencies were presented through the same STAR software
and sound box used in Chapters 5-7 (Medical Research Council Institute of
Hearing Research (MRC IHR), Nottingham – ‘STAR box’). The three
intermediate frequencies were determined by equally dividing the frequency
range between the centre-frequencies of the test electrode-pair by
calculating the geometric mean, giving a total of five test-frequencies, the two
centre-frequencies of the test electrode-pair and three IF (see Figure 8.2 for
example).
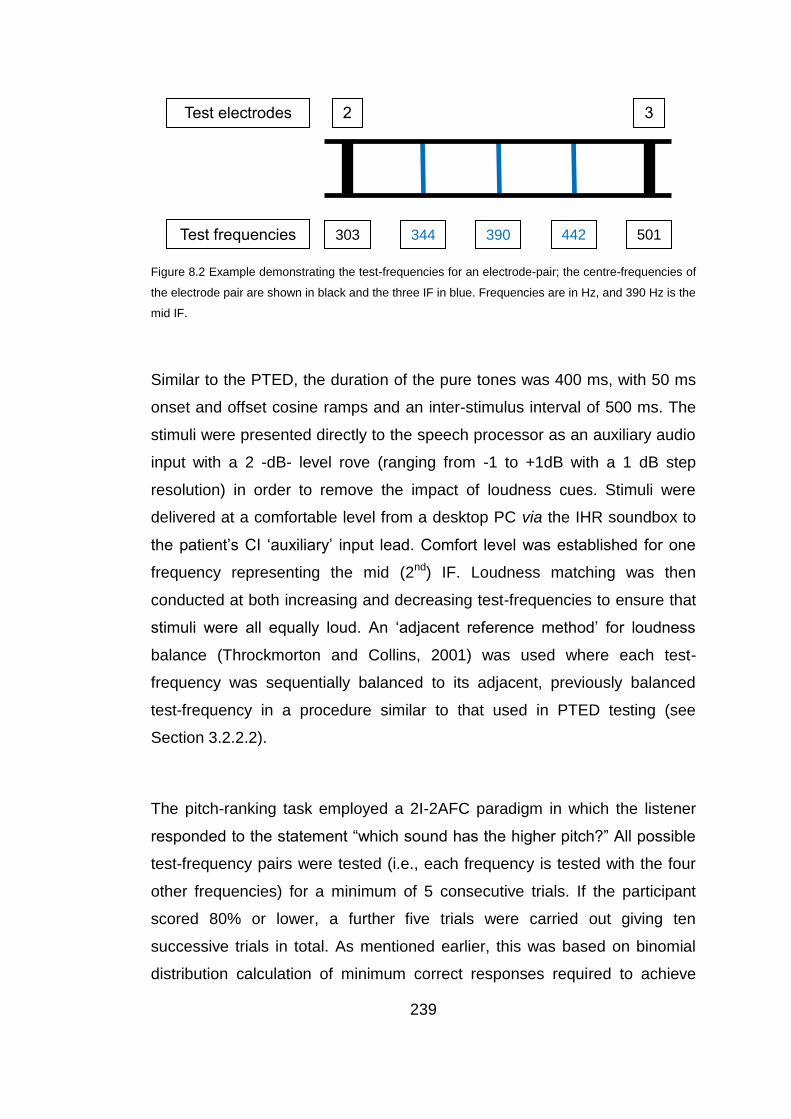
239
Figure 8.2 Example demonstrating the test-frequencies for an electrode-pair; the centre-frequencies of
the electrode pair are shown in black and the three IF in blue. Frequencies are in Hz, and 390 Hz is the
mid IF.
Similar to the PTED, the duration of the pure tones was 400 ms, with 50 ms
onset and offset cosine ramps and an inter-stimulus interval of 500 ms. The
stimuli were presented directly to the speech processor as an auxiliary audio
input with a 2 -dB- level rove (ranging from -1 to +1dB with a 1 dB step
resolution) in order to remove the impact of loudness cues. Stimuli were
delivered at a comfortable level from a desktop PC via the IHR soundbox to
the patient’s CI ‘auxiliary’ input lead. Comfort level was established for one
frequency representing the mid (2nd) IF. Loudness matching was then
conducted at both increasing and decreasing test-frequencies to ensure that
stimuli were all equally loud. An ‘adjacent reference method’ for loudness
balance (Throckmorton and Collins, 2001) was used where each test-
frequency was sequentially balanced to its adjacent, previously balanced
test-frequency in a procedure similar to that used in PTED testing (see
Section 3.2.2.2).
The pitch-ranking task employed a 2I-2AFC paradigm in which the listener
responded to the statement “which sound has the higher pitch?” All possible
test-frequency pairs were tested (i.e., each frequency is tested with the four
other frequencies) for a minimum of 5 consecutive trials. If the participant
scored 80% or lower, a further five trials were carried out giving ten
successive trials in total. As mentioned earlier, this was based on binomial
distribution calculation of minimum correct responses required to achieve
2 3
501 442 390 344 303
Test electrodes
Test frequencies

240
significance at the p<0.05 level (Skellam, 1948). The STAR software
provided automated delivery and scoring (percent correct and pass or fail
categorization) for each test-frequency pair, thus avoiding bias.
8.2.2.3 Procedure
The testing protocol for PTED, BKB (in quiet and in noise) and CRM testing
described in Section (7.2.3) was applied, and the same rules for deactivating
indiscriminable electrodes were used in the research program. Data
previously collected in Chapter 7 was used with the addition of PTED, BKB
(in quiet and in noise) and CRM pre and post-deactivation results for
participants 9 and 13 who weren’t participants in the study described in
Chapter 7. Participants 9 and 13 were each provided with one research
program with deactivated indiscriminable electrodes while maintaining the
clinical rate of stimulation (similar to program B described in Section 7.2.4)
and were tested for speech perception (BKB in quiet and in noise and CRM),
following a one-month trial period to evaluate post-deactivation change in CI
performance.
Testing for PTIF took place in a 2 metre by 2.5 metre double-walled sound
booth. Certain adjustments to the speech processor’s programming (see
Section (8.2.2.3.1) below for speech processor programming) had to be
applied before administering the PTIF test. For each participant PTIF was
conducted for:
(1) For at least one control discriminable electrode-pair (electrode-pair A),
which was in the mid-section of the electrode array to avoid placement
issues. In this control electrode-pair, both electrodes must have passed
PTED with the adjacent electrodes on both sides at a level > 90%.
(2) For at least one indiscriminable electrode-pair (electrode-pair B).
241
8.2.2.3.1 Research program based on PTIF results in electrode-pair B
Participants who had some indiscriminable electrode-pairs with a number of
IF equal to the number of IF for the discriminable electrode-pairs received a
new research program where those indiscriminable electrodes were re-
activated. In the extra research program based on PTIF results not all
indiscriminable electrodes in the PTED were deactivated; i.e. only
indiscriminable electrode-pairs with a number of DIF < number of DIF in
electrode-pair A were deactivated. The participants were tested for speech
perception (BKB in quiet and in noise and CRM) after a one month trial
period. Testing was conducted in noise if BKB in quiet > 50.
8.2.2.3.1 Adjusting the speech processor for testing PTIF
The program used when running the PTIF tasks was the participant’s original
clinical program. Testing program settings were similar to those used for
PTED testing (see Section 3.2.3.1) except for maxima settings in Cochlear®
implantees. For participants with Cochlear® devices, the number of maxima
(see Section1.3.2.3) was adjusted and set to the value of 2 to ensure that the
two test electrodes were successively stimulated/stimulation cycle to produce
the IF (McDermott and McKay (1994) and Kwon and van den Honert (2006)
found that intermediate pitch percepts can be elicited by successive
stimulation of two adjacent electrodes in Cochlear® devices).
8.2.3 Analyses
All participants with at least one indiscriminable electrode-pair and have
received at least one research program with deactivated indiscriminable
electrodes (participants 1-18) were scored for post-deactivation change in CI
performance. Each electrode-pair tested for PTIF in electrode-pairs A and B
was assigned a score. Statistical analysis was conducted to assess whether
there is a significant relationship between post-deactivation change in
242
performance and the difference between number of IF in electrode-pairs A
and B.
The post-deactivation change in performance score and the number of IF in
the different electrode-pairs were used in group and individual analyses.
8.2.3.1 Post-deactivation change in performance scores
To establish the scoring system of post-deactivation change in CI
performance, the change in performance for the 25 participants who received
a research program (in Chapter 7) was analysed.
Based on results of those 25 CI participants following the deactivation of
indiscriminable electrodes and according to the protocol described in Section
(7.3.2) for analysis of individual results, it was found that participants could
be categorised into one of the following:
Reported improvement and (a) showed significant improvement in all
measures of speech perception or (b) showed significant improvement in two
speech perception measures or (c) showed significant improvement in one
speech perception measure or (d) did not show significant improvement in
any measure of speech perception.
Reported that they did not like the research program’s sound quality and (a)
did not show significant difference in any measure of speech perception or
(b) showed significant decrement in at least one measure of speech
perception or (c) showed significant decrement in two measures of speech
perception or (d) showed significant decrement in all measures of speech
perception.
A positive point was given for each of the following: (a) reporting
improvement, (b) significant improvement in BKB in quiet, (c) significant
improvement in BKB in quiet and noise (>10%) and (d) significant
improvement in CRM (decreased) threshold (<4dBA). And a negative point
was given for each of the following: (a) reporting dislike or decreased
performance, (b) significant decrement in BKB in quiet, (c) significant
243
decrement in BKB in noise and (d) significant decrement in CRM (increased)
threshold. This would give rise to a “performance score” ranging from -4 up
to +4.
8.2.3.2 IF score
The number of IF for each tested electrode-pair was obtained according to
the following criteria:
An IF which was correctly ranked with at least two other test frequencies,
and did not show reversal (PTIF ≤ 20%) with any IF, was considered
discriminable (DIF) and was given a positive point.
An IF that showed reversal with at least two IFs and was not correctly ranked
with any other IF (PTIF ≥ 80%) was considered a reversal and was given a
negative point. In line with Nelson et al. (1995) who reported that they found
pitch-reversals and because all participants had and demonstrated a clear
understanding of pitch, it was decided to assign a negative point to reversals.
The points are added, giving a score “number of IF” ranging between -3 and
+3 IF for each electrode-pair.
For analysis purposes the median number of IFs in electrode-pairs B was
subtracted from the median number of IFs in electrode-pair(s) A to obtain the
difference between both electrode-pairs for each participant (A - B). The
median was used in case more than one electrode-pair was tested in any
electrode-pair.
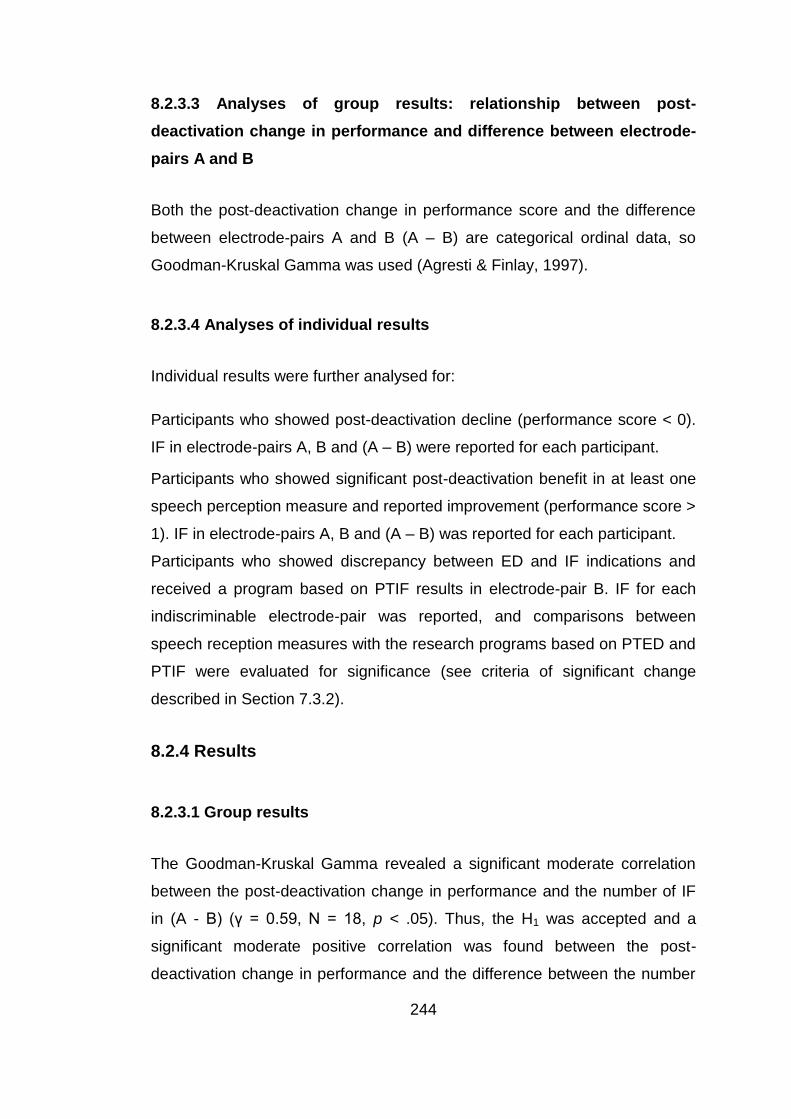
244
8.2.3.3 Analyses of group results: relationship between post-
deactivation change in performance and difference between electrode-
pairs A and B
Both the post-deactivation change in performance score and the difference
between electrode-pairs A and B (A – B) are categorical ordinal data, so
Goodman-Kruskal Gamma was used (Agresti & Finlay, 1997).
8.2.3.4 Analyses of individual results
Individual results were further analysed for:
Participants who showed post-deactivation decline (performance score < 0).
IF in electrode-pairs A, B and (A – B) were reported for each participant.
Participants who showed significant post-deactivation benefit in at least one
speech perception measure and reported improvement (performance score >
1). IF in electrode-pairs A, B and (A – B) was reported for each participant.
Participants who showed discrepancy between ED and IF indications and
received a program based on PTIF results in electrode-pair B. IF for each
indiscriminable electrode-pair was reported, and comparisons between
speech reception measures with the research programs based on PTED and
PTIF were evaluated for significance (see criteria of significant change
described in Section 7.3.2).
8.2.4 Results
8.2.3.1 Group results
The Goodman-Kruskal Gamma revealed a significant moderate correlation
between the post-deactivation change in performance and the number of IF
in (A - B) (γ = 0.59, N = 18, p < .05). Thus, the H1 was accepted and a
significant moderate positive correlation was found between the post-
deactivation change in performance and the difference between the number
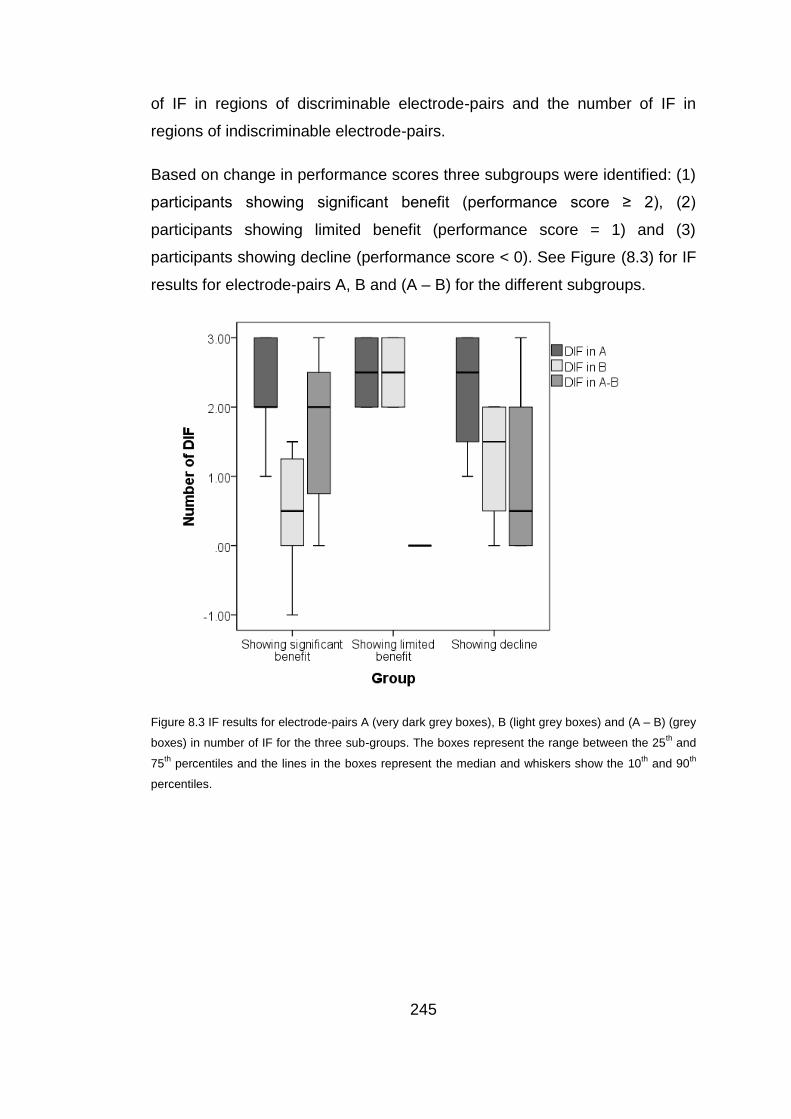
245
of IF in regions of discriminable electrode-pairs and the number of IF in
regions of indiscriminable electrode-pairs.
Based on change in performance scores three subgroups were identified: (1)
participants showing significant benefit (performance score ≥ 2), (2)
participants showing limited benefit (performance score = 1) and (3)
participants showing decline (performance score < 0). See Figure (8.3) for IF
results for electrode-pairs A, B and (A – B) for the different subgroups.
Figure 8.3 IF results for electrode-pairs A (very dark grey boxes), B (light grey boxes) and (A – B) (grey
boxes) in number of IF for the three sub-groups. The boxes represent the range between the 25th
and
75th
percentiles and the lines in the boxes represent the median and whiskers show the 10th
and 90th
percentiles.
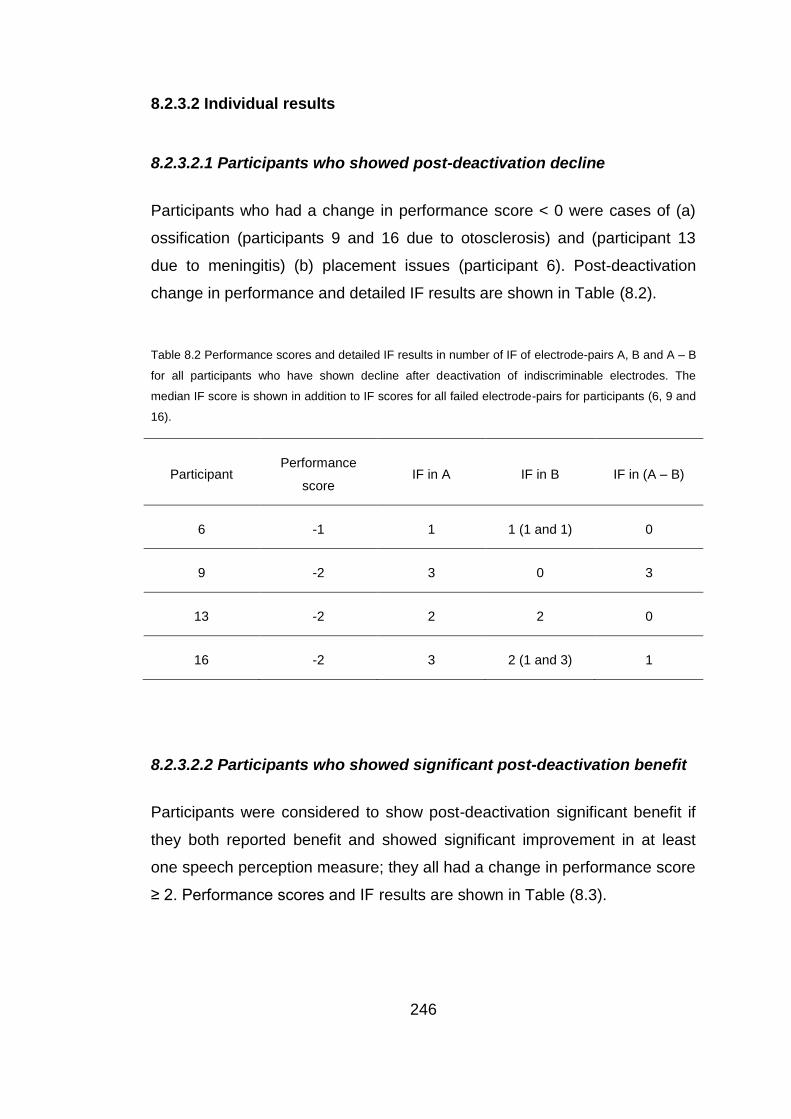
246
8.2.3.2 Individual results
8.2.3.2.1 Participants who showed post-deactivation decline
Participants who had a change in performance score < 0 were cases of (a)
ossification (participants 9 and 16 due to otosclerosis) and (participant 13
due to meningitis) (b) placement issues (participant 6). Post-deactivation
change in performance and detailed IF results are shown in Table (8.2).
Table 8.2 Performance scores and detailed IF results in number of IF of electrode-pairs A, B and A – B
for all participants who have shown decline after deactivation of indiscriminable electrodes. The
median IF score is shown in addition to IF scores for all failed electrode-pairs for participants (6, 9 and
16).
Participant Performance
score IF in A IF in B IF in (A – B)
6 -1 1 1 (1 and 1) 0
9 -2 3 0 3
13 -2 2 2 0
16 -2 3 2 (1 and 3) 1
8.2.3.2.2 Participants who showed significant post-deactivation benefit
Participants were considered to show post-deactivation significant benefit if
they both reported benefit and showed significant improvement in at least
one speech perception measure; they all had a change in performance score
≥ 2. Performance scores and IF results are shown in Table (8.3).
247
Table 8.3 Performance scores and IF results in number of IF of electrode-pairs A, B and A – B for all
participants who have shown significant benefit after deactivation of indiscriminable electrodes
Participant Performance
score IF in A IF in B IF in (A – B)
1 2 3 1.5 (0 and 3) 1.5
2 2 3 1 2
4 2 3 1 2
5 2 1 -1 2
7 2 3 0 3
10 2 3 1.5 1.5
11 3 2 1 1
12 2 2 1.5 .5
14 2 2 0 2
15 3 2 -1 3
17 2 2 1 1
18 2 2 0 2
8.2.3.2.3 Participants who showed discrepancy between PTED and PTIF
indications and received a program based on PTIF in electrode-pair B
Three participants (1, 16 and 18) were provided with a program based on
PTIF results in electrode-pair(s) B. They received the extra program because
discrepancy was found between PTED and PTIF indications for problematic
regions; i.e., the electrode-pair failed PTED but it had a number of IF = IF in
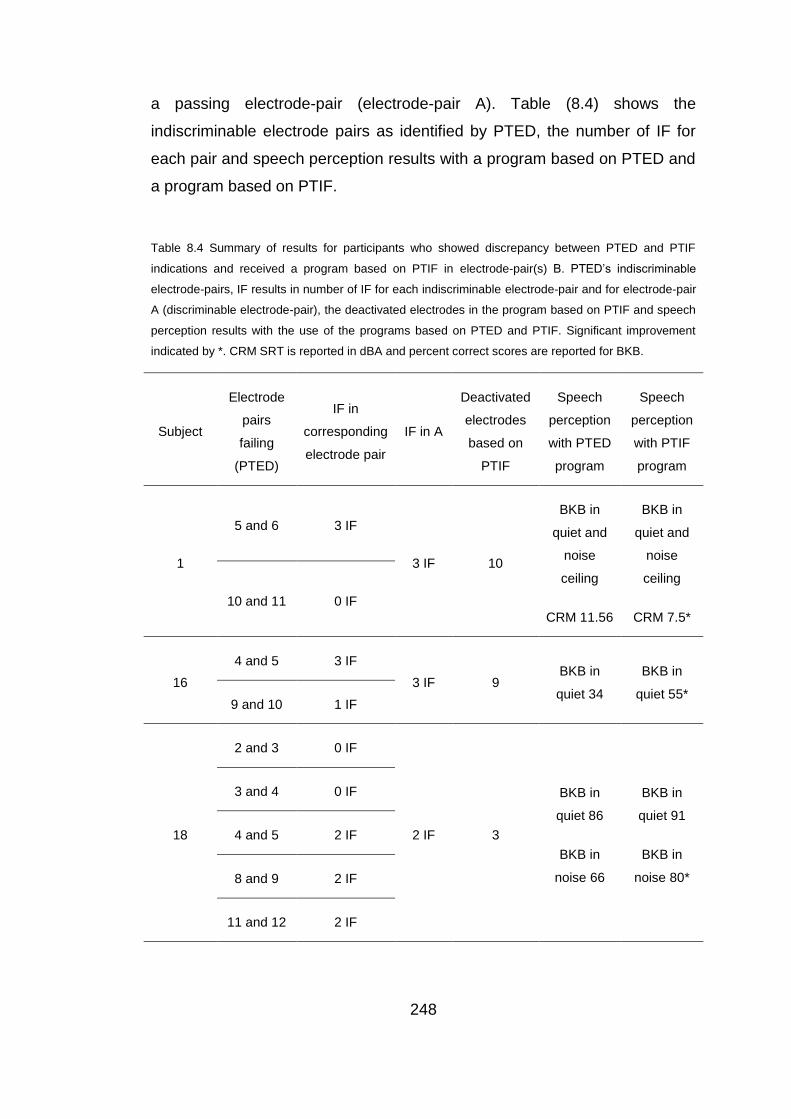
248
a passing electrode-pair (electrode-pair A). Table (8.4) shows the
indiscriminable electrode pairs as identified by PTED, the number of IF for
each pair and speech perception results with a program based on PTED and
a program based on PTIF.
Table 8.4 Summary of results for participants who showed discrepancy between PTED and PTIF
indications and received a program based on PTIF in electrode-pair(s) B. PTED’s indiscriminable
electrode-pairs, IF results in number of IF for each indiscriminable electrode-pair and for electrode-pair
A (discriminable electrode-pair), the deactivated electrodes in the program based on PTIF and speech
perception results with the use of the programs based on PTED and PTIF. Significant improvement
indicated by *. CRM SRT is reported in dBA and percent correct scores are reported for BKB.
Subject
Electrode
pairs
failing
(PTED)
IF in
corresponding
electrode pair
IF in A
Deactivated
electrodes
based on
PTIF
Speech
perception
with PTED
program
Speech
perception
with PTIF
program
1
5 and 6 3 IF
3 IF 10
BKB in
quiet and
noise
ceiling
CRM 11.56
BKB in
quiet and
noise
ceiling
CRM 7.5*
10 and 11 0 IF
16
4 and 5 3 IF
3 IF 9 BKB in
quiet 34
BKB in
quiet 55* 9 and 10 1 IF
18
2 and 3 0 IF
2 IF 3
BKB in
quiet 86
BKB in
noise 66
BKB in
quiet 91
BKB in
noise 80*
3 and 4 0 IF
4 and 5 2 IF
8 and 9 2 IF
11 and 12 2 IF
249
8.2.5 Summary of experiment I
There was a significant association between the change in performance after
deactivating indiscriminable electrodes and the difference between IF in
regions of discriminable electrodes versus those of indiscriminable
electrodes (IF in A – B). The individuals who showed significant improvement
had a median IF in (A – B) of 2, while those showing limited benefit or
declined benefit had a median IF in (A – B) of 0. Three participants received
research programs based on PTIF; they performed significantly better with
that program than they did with the best PTED program. Participant 9 did not
follow the same pattern and experiment II may help explain why.
8.2.6 Discussion of experiment I
8.2.6.1 Group results
In line with previous studies, intermediate pitches were elicited by the
stimulation of electrode-pairs which varied across the participants and across
the different electrode pairs (McDermott and McKay, 1994; Donaldson et al.,
2005; Kwon and van den Honert, 2006 and Nobbe et al., 2007). As
hypothesised there was a statistically significant relationship between post-
deactivation change in CI performance and the difference between the
number of IF in regions of discriminable versus indiscriminable electrode-
pairs regions. Subjects showing benefit following deactivation of
indiscriminable electrodes had a larger number of IF in areas of discriminable
electrode-pairs in comparison to areas of indiscriminable electrode-pairs.
When the CI recipient cannot make use of spectral information delivered to a
certain region in the cochlea, that is consistent with the presence of “holes in
hearing” (Shannon et al., 2001) or dead regions. Dead regions are “regions
in the cochlea with no (or very few) functioning inner hair cells and/or
neurons are called dead region” (Moore, 2004). For participants showing
benefit, PTED’s indiscriminable electrodes may have identified dead regions
and the information delivered to those areas when those electrodes were
250
active may have been lost or at least not fully utilised by the CI recipient.
Hence, deactivating those indiscriminable electrodes allowed redirection of
an otherwise lost information, which is line with findings of Faulkner (2006)
and Smith and Faulkner (2006). While those showing decline did not show
signs of dead regions, so deactivating electrodes in regions of good spectral
selectivity for those participants may have decreased the CI signal’s spectral
resolution and negatively affected their performance. This is in concordance
with studies indicating reduced performance with decreased spectral
resolution (e.g. Shannon et al., 2001; Henry et al., 2000 and McKay and
Henshall, 2002). There was a lack of difference between the participant’s
ability to utilise pitch in areas of discriminable versus indiscriminable
electrode-pairs for cases suffering from cochlear pathological changes
secondary to their cause of deafness, including meningitis and otosclerosis
(participants 13 and 16) or electrode placement problems (participant 6).
This provides further support to findings in Chapter 7 where PTED’s
indiscriminable electrodes most likely have identified underlying dead regions
but not when the spread of current may have been compromised, e.g., due
to ossification ( Rotteveel et al., 2010).
8.2.6.2 Individual results
For those showing post-deactivation significant benefit, there was a
difference between the participant’s ability to utilise pitch information
delivered to regions identified as indiscriminable and those identified as
discriminable by the PTED. Individual results were consistent with group
results and in line with previous findings as well of studies investigating dead
regions (e.g., Shannon et al., 2001). This was not the case for those who
weren’t showing benefit, with the exception of participant (9) who showed the
pattern demonstrated by those who were showing benefit; this may warrant
further investigation. Besides, a closer inspection of individual IF results
showed that participants (1, 16 and 18) had electrode-pairs that were
deemed indiscriminable by the PTED but had an IF equal to electrode-pairs
251
deemed discriminable. Reactivating those electrodes produced significant
benefit in comparison to when they were deactivated. It must be noted that
this meant additional benefit for participants (1 and 18). The finding again is
consistent with enhanced spectral resolution when electrodes that stimulated
non-dead regions were reactivated and only electrodes normally stimulating
dead regions were deactivated (e.g. Shannon et al., 2001; Henry et al., 2000
and McKay and Henshall, 2002). Participants (1 and 18) have previously
shown significant benefit in at least one speech perception measure
following the deactivation of all indiscriminable electrodes based on PTED.
This meant that gain in performance due to the deactivation of
indiscriminable electrodes according to PTED (including those with IF = IF in
A and those with IF < IF in A) outweighed the possible decline due to the
deactivation of electrodes in regions with good spectral selectivity (IF = IF in
A). In other words, stopping stimulation delivered to dead regions for those
two participants produced benefit that outweighed the spectral loss due to
stopping stimulation to regions that were not dead regions. Based on studies
associating improved performance with better spectral resolution (Shannon
et al., 2001; Henry et al., 2000 and McKay and Henshall, 2002), it might be
assumed that deactivation of electrodes otherwise stimulated dead regions
enhanced spectral representation of the signal.
For participant 16 there was not any added gain; the benefit shown in speech
perception did not exceed his performance with the original clinical program,
but in his case it again highlighted that PTED did not identify regions with
poor spectral selectivity in cases of cochlear pathology (fibrosis, calcification
or ossification). Results of those participants (1, 16 and 18) most likely
indicated that testing for IF has identified dead regions (Shannon et al.,
2001) with possibly greater specificity than the PTED. Participant (9)’s IF
pattern highlighted the need to investigate the effect of deactivating the
indiscriminable electrodes.
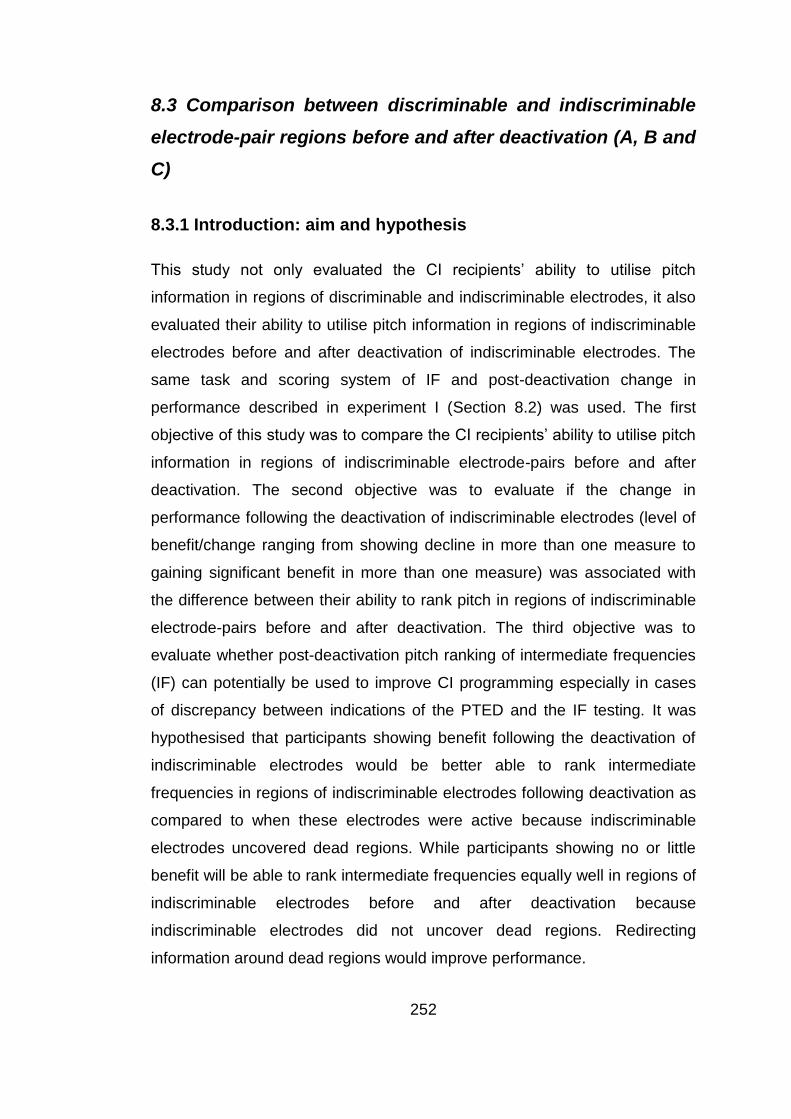
252
8.3 Comparison between discriminable and indiscriminable
electrode-pair regions before and after deactivation (A, B and
C)
8.3.1 Introduction: aim and hypothesis
This study not only evaluated the CI recipients’ ability to utilise pitch
information in regions of discriminable and indiscriminable electrodes, it also
evaluated their ability to utilise pitch information in regions of indiscriminable
electrodes before and after deactivation of indiscriminable electrodes. The
same task and scoring system of IF and post-deactivation change in
performance described in experiment I (Section 8.2) was used. The first
objective of this study was to compare the CI recipients’ ability to utilise pitch
information in regions of indiscriminable electrode-pairs before and after
deactivation. The second objective was to evaluate if the change in
performance following the deactivation of indiscriminable electrodes (level of
benefit/change ranging from showing decline in more than one measure to
gaining significant benefit in more than one measure) was associated with
the difference between their ability to rank pitch in regions of indiscriminable
electrode-pairs before and after deactivation. The third objective was to
evaluate whether post-deactivation pitch ranking of intermediate frequencies
(IF) can potentially be used to improve CI programming especially in cases
of discrepancy between indications of the PTED and the IF testing. It was
hypothesised that participants showing benefit following the deactivation of
indiscriminable electrodes would be better able to rank intermediate
frequencies in regions of indiscriminable electrodes following deactivation as
compared to when these electrodes were active because indiscriminable
electrodes uncovered dead regions. While participants showing no or little
benefit will be able to rank intermediate frequencies equally well in regions of
indiscriminable electrodes before and after deactivation because
indiscriminable electrodes did not uncover dead regions. Redirecting
information around dead regions would improve performance.
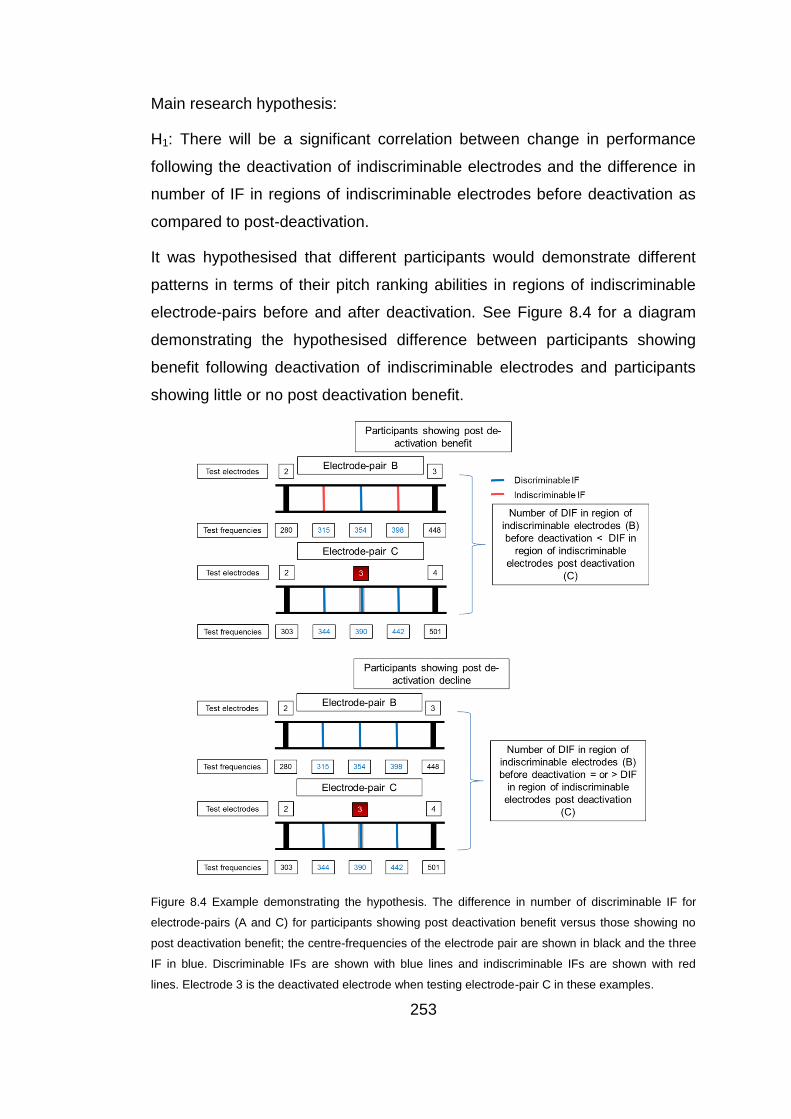
253
Main research hypothesis:
H1: There will be a significant correlation between change in performance
following the deactivation of indiscriminable electrodes and the difference in
number of IF in regions of indiscriminable electrodes before deactivation as
compared to post-deactivation.
It was hypothesised that different participants would demonstrate different
patterns in terms of their pitch ranking abilities in regions of indiscriminable
electrode-pairs before and after deactivation. See Figure 8.4 for a diagram
demonstrating the hypothesised difference between participants showing
benefit following deactivation of indiscriminable electrodes and participants
showing little or no post deactivation benefit.
Figure 8.4 Example demonstrating the hypothesis. The difference in number of discriminable IF for
electrode-pairs (A and C) for participants showing post deactivation benefit versus those showing no
post deactivation benefit; the centre-frequencies of the electrode pair are shown in black and the three
IF in blue. Discriminable IFs are shown with blue lines and indiscriminable IFs are shown with red
lines. Electrode 3 is the deactivated electrode when testing electrode-pair C in these examples.
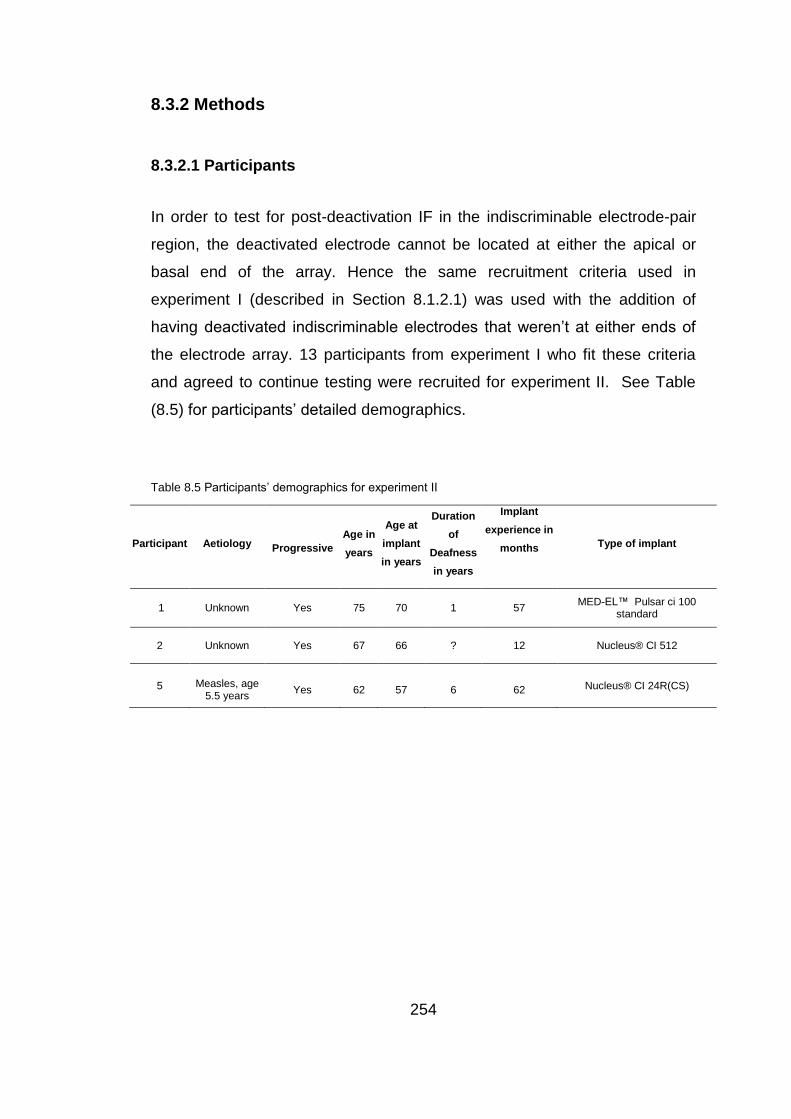
254
8.3.2 Methods
8.3.2.1 Participants
In order to test for post-deactivation IF in the indiscriminable electrode-pair
region, the deactivated electrode cannot be located at either the apical or
basal end of the array. Hence the same recruitment criteria used in
experiment I (described in Section 8.1.2.1) was used with the addition of
having deactivated indiscriminable electrodes that weren’t at either ends of
the electrode array. 13 participants from experiment I who fit these criteria
and agreed to continue testing were recruited for experiment II. See Table
(8.5) for participants’ detailed demographics.
Table 8.5 Participants’ demographics for experiment II
Participant Aetiology
Progressive
Age in
years
Age at
implant
in years
Duration
of
Deafness
in years
Implant
experience in
months
Type of implant
1 Unknown Yes 75 70 1 57 MED-EL™ Pulsar ci 100
standard
2 Unknown Yes 67 66 ? 12 Nucleus® CI 512
5 Measles, age 5.5 years
Yes 62 57 6 62 Nucleus® CI 24R(CS)
255
Table 8.5 (continued) Participants’ demographics
7 Measles, age 5 years
Yes 66 59 25 89 MED-EL™ Combi 40+
9 Otosclerosis Yes 67 58 2 106 AB HiRes 90K?
10 Unknown Yes 69 63 12 38 Nucleus® Freedom (CA)
11 Endolymphatic
Hydrops Yes 42 39 1 34 Nucleus®
Freedom (CA)
12 Genetic started at age 40 years
Yes 59 60 7 72 Nucleus® CI 24R(CS)
13 Meningitis No 47 44 3/12 27 Nucleus® 22
14 Unknown Yes 52 47 ? 57 AB HiRes 90K
15 Genetic started at age 20 years
Yes 77 73 7 48 AB HiRes 90K
16 Typhoid and Otosclerosis
Yes 72 61 40+ 132 MED-EL™ Combi 40+
17
Post general anesthesia in
3rd decade
Yes 63 61 12 18 MED-EL™ Sonata
8.3.2.2 Test battery
The same test battery used in experiment I was used.
8.3.2.3 Procedure
Data used and collected in experiment I for the participants of experiments II
was used, which included change in performance scores and IF of
discriminable and indiscriminable electrode-pair regions (electrode-pairs A
and B). Additionally, PTIF was applied to test the region of indiscriminable
electrode-pairs following deactivation, which was called electrode-pair(s) C
(see Figure (8.5) for diagram demonstrating electrode-pairs B and C). IF
testing for electrode-pair(s) C was applied with research programs based on
PTED (in Chapter 7) and PTIF (in experiment I). Testing for PTIF took place

256
in a 2×2.5 m double-walled sound booth with the use of adjustments to the
speech processor’s programming described in Section (8.2.2.3).
Figure 8.5 Example demonstrating the test-frequencies for an indiscriminable electrode-pair in
electrode-pair B and for the corresponding electrode pair in electrode-pair C. The electrode pair is
electrodes 2 and 3 in electrode-pair B with electrode 3 active and the electrode pair in electrode-pair C
with electrode 3 deactivated (shown in red), the centre-frequencies of the electrode pair are shown in
black and the three intermediate frequencies in blue.
8.3.2.3.1 Research program based on PTIF results in electrode-pair C
One participant (12) who had IF = 0 in electrode-pair type C for one post-
deactivation electrode-pair (electrodes 6 and 8), but not the other three
electrode-pairs tested for electrode-pair type C, was provided with an
additional research program. In line with Nelson et al.’s (1995)
recommendation regarding regions of poor electrode-pitch-ranking, the extra
research program increased the spatial separation in that region (electrodes
6 and 8); an additional electrode (6) was deactivated. The participant was
tested for IF (electrode-pair type C between electrodes 5 and 8) and speech
perception (BKB in quiet which was lower than 50 and CRM) after a one
month trial period.
257
8.3.3 Analyses
Scores for post-deactivation change in CI performance (described in 8.2.3.1)
and IF scores (described in 8.2.3.2) for each electrode-pair tested for PTIF in
electrode-pairs B and C were obtained. Statistical analysis was conducted to
assess whether there is a significant relationship between post-deactivation
change in performance and the difference between number of IF in
electrode-pairs B and C.
The post-deactivation change in performance score and the number of IF in
the different electrode-pairs were used in group and individual analyses. For
analysis purposes the median number of IF in electrode-pair(s) B was
subtracted from the median number of IF in electrode-pair(s) C to obtain the
difference between both types of electrode-pairs for each participant (C - B).
The median was used in case more than one electrode-pair was tested in
any electrode-pair.
8.3.3.1 Analyses of group results: relationship between post-
deactivation change in performance and difference between electrode-
pairs B and C
Both the post-deactivation change in performance score and the difference
between electrode-pairs C and B (C – B) are categorical ordinal data, so
Goodman-Kruskal Gamma was used (Agresti & Finlay, 1997).
8.2.3.2 Analyses of individual results
Individual results were further analysed for:
Participants who showed post-deactivation decline (performance score < 0).
IF in electrode-pairs B, C and (C – B) were reported for each participant.
Participants who showed significant post-deactivation benefit in at least one
speech perception measure and reported improvement (performance score >
1). IF in electrode-pairs B, C and (C – B) were reported for each participant.
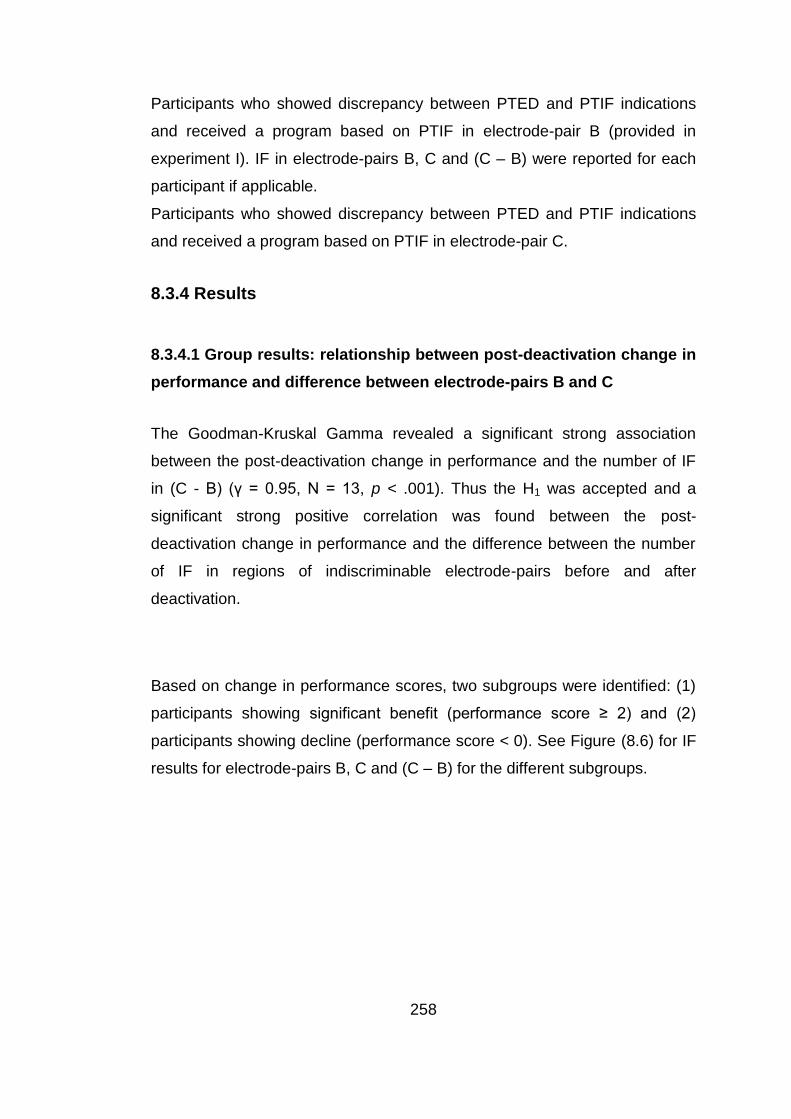
258
Participants who showed discrepancy between PTED and PTIF indications
and received a program based on PTIF in electrode-pair B (provided in
experiment I). IF in electrode-pairs B, C and (C – B) were reported for each
participant if applicable.
Participants who showed discrepancy between PTED and PTIF indications
and received a program based on PTIF in electrode-pair C.
8.3.4 Results
8.3.4.1 Group results: relationship between post-deactivation change in
performance and difference between electrode-pairs B and C
The Goodman-Kruskal Gamma revealed a significant strong association
between the post-deactivation change in performance and the number of IF
in (C - B) (γ = 0.95, N = 13, p < .001). Thus the H1 was accepted and a
significant strong positive correlation was found between the post-
deactivation change in performance and the difference between the number
of IF in regions of indiscriminable electrode-pairs before and after
deactivation.
Based on change in performance scores, two subgroups were identified: (1)
participants showing significant benefit (performance score ≥ 2) and (2)
participants showing decline (performance score < 0). See Figure (8.6) for IF
results for electrode-pairs B, C and (C – B) for the different subgroups.

259
Figure 8.6 IF results for electrode-pairs B (very dark grey boxes), C (light grey boxes) and (C – B)
(grey boxes) in number of IF for the three sub-groups. The boxes represent the range between the 25th
and 75th percentiles and the lines in the boxes represent the median and whiskers show the 10
th and
90th
percentiles.
8.2.3.2 Individual results
8.2.3.2.1 Participants who showed post-deactivation decline
As previously reported, some participants who had a change in performance
score < 0 were cases of ossification due to Otosclerosis (participants 9 and
16) or secondary to meningitis (participant 13). Only these participants had
indiscriminable electrodes in the middle of the array allowing testing for IF in
electrode-pair C. Since participant (16) received an additional research
program based on PTIF in experiment I, results reported here are with the
PTED research program only. Change in performance and IF results are
shown in Table (8.6).
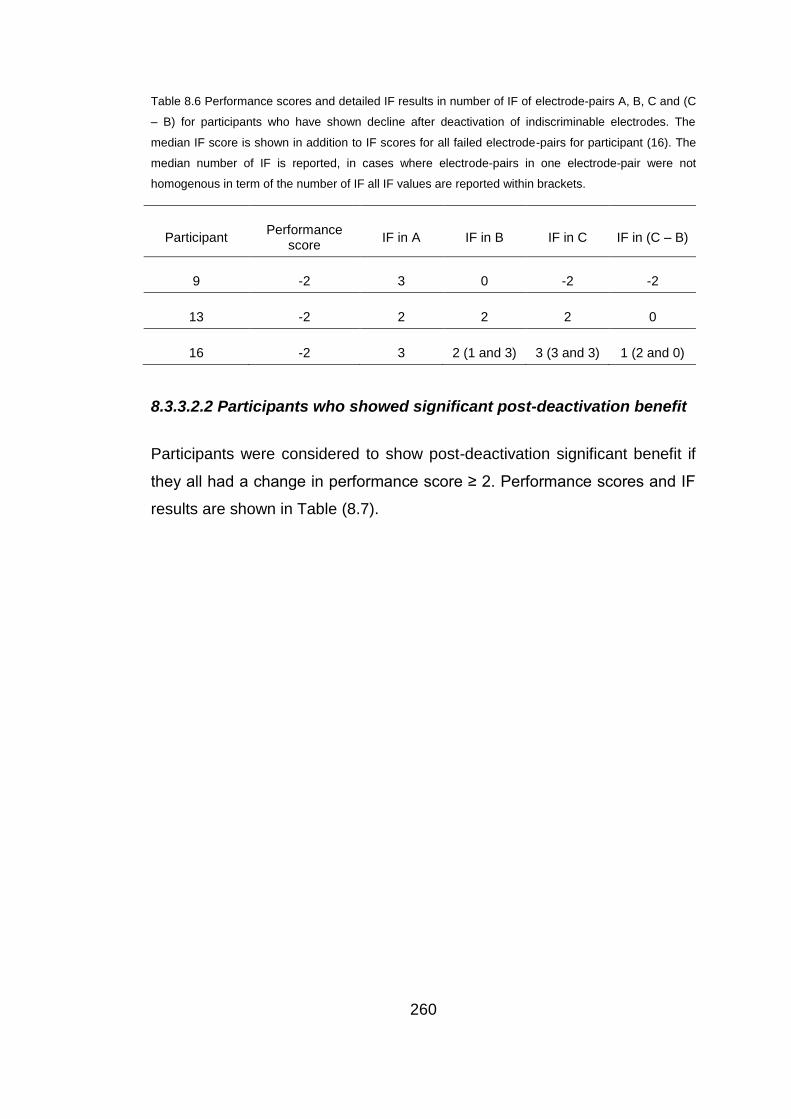
260
Table 8.6 Performance scores and detailed IF results in number of IF of electrode-pairs A, B, C and (C
– B) for participants who have shown decline after deactivation of indiscriminable electrodes. The
median IF score is shown in addition to IF scores for all failed electrode-pairs for participant (16). The
median number of IF is reported, in cases where electrode-pairs in one electrode-pair were not
homogenous in term of the number of IF all IF values are reported within brackets.
Participant Performance
score IF in A IF in B IF in C IF in (C – B)
9 -2 3 0 -2 -2
13 -2 2 2 2 0
16 -2 3 2 (1 and 3) 3 (3 and 3) 1 (2 and 0)
8.3.3.2.2 Participants who showed significant post-deactivation benefit
Participants were considered to show post-deactivation significant benefit if
they all had a change in performance score ≥ 2. Performance scores and IF
results are shown in Table (8.7).
261
Table 8.7 Performance scores and IF results in number of IF of electrode-pairs A, B, C and (C – B) for
all participants who have shown significant benefit after deactivation of indiscriminable electrodes. The
median number of IF is reported, in cases where electrode-pairs in one electrode-pair were not
homogenous in term of the number of IF all IF values are reported within brackets.
Participant Performance
score IF in A IF in B IF in C IF in (C – B)
1 2 3 1.5 (0 and 3) 3 (3 and 3) 2.25 (1.5 and 3)
2 2 3 1 2 1
5 2 1 -1 2 4
7 2 3 0 2 2
10 2 3 1.5 3 1.5
11 3 2 1 2 1
12 2 2 1.5 2 (2,2,3 and 0) .5
14 2 2 0 2 2
15 3 2 -1 2 3
17 2 2 1 3 2
8.3.3.2.4 Participants who showed discrepancy between PTED and PTIF
indications and received a program based on PTIF in electrode-pair B
The speech perception and IF (in electrode-pair B and C) results for the
three participants (1, 16 and 18) who received research programs based on
PTIF in experiment I are shown in Table (8.8).

262
Table 8.8 Results of Participants who showed discrepancy between PTED and PTIF indications and
received a program based on PTIF in electrode-pair B. IF results for participants (1, 16 and 18) who
received a program in experiment 1 based on IF in electrode-pair B, IF results in number of IF for each
indiscriminable electrode-pair (electrode-pair B) involving a deactivated electrode and for electrode-
pair C (corresponding region for each electrode-pair B), and speech perception results with the use of
the programs based on PTED and PTIF. Ceiling scores were not reported and significant improvement
is indicated by *. CRM SRT is reported in dBA and percent correct scores are reported for BKB.
Subject
PTED program PTIF program
IF in
B IF in C
IF in
(C – B)
Speech
testing
IF in B IF in C
IF in
(C – B)
Speech
testing
1
3 3 0 CRM
11.6dBA 0 2 2
CRM
7.5*dBA 0 2 2
16
3 3 0 BKB in
quiet 34 1 3 2
BKB in
quiet
55*dBA 1 3 2
18
0 2 2
BKB in
quiet 86
BKB in
noise 66
0 2 2
BKB in
quiet 91
BKB in
noise 80*
2 2 0
2 2 0
2 2 0
8.3.3.2.4 Participants who showed a peculiar pattern in performance
and received an extra program based on results of IF in electrode-pair
C
As mentioned in Section (8.3.2.3) only participant (12) showed a peculiar
pattern in performance after deactivating the indiscriminable electrodes
provided in the study described in Chapter 7. She showed significant
improvement with CRM and reported improvement in understanding men’s
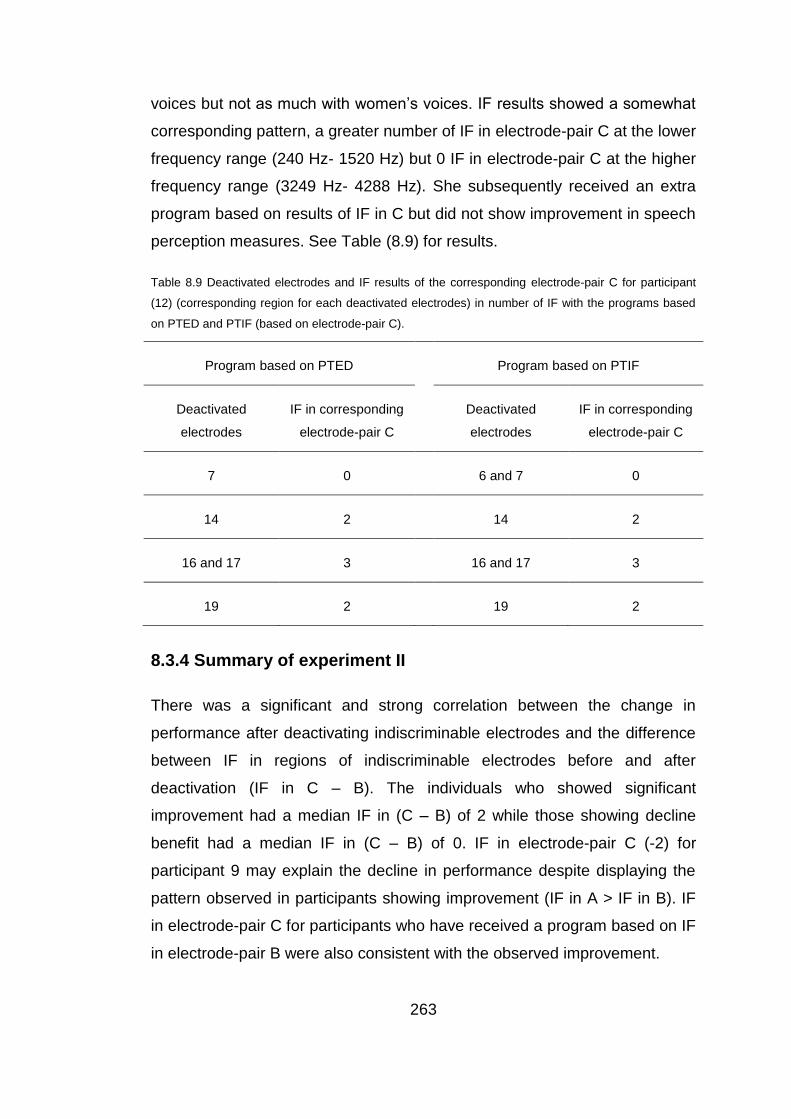
263
voices but not as much with women’s voices. IF results showed a somewhat
corresponding pattern, a greater number of IF in electrode-pair C at the lower
frequency range (240 Hz- 1520 Hz) but 0 IF in electrode-pair C at the higher
frequency range (3249 Hz- 4288 Hz). She subsequently received an extra
program based on results of IF in C but did not show improvement in speech
perception measures. See Table (8.9) for results.
Table 8.9 Deactivated electrodes and IF results of the corresponding electrode-pair C for participant
(12) (corresponding region for each deactivated electrodes) in number of IF with the programs based
on PTED and PTIF (based on electrode-pair C).
Program based on PTED Program based on PTIF
Deactivated
electrodes
IF in corresponding
electrode-pair C
Deactivated
electrodes
IF in corresponding
electrode-pair C
7 0 6 and 7 0
14 2 14 2
16 and 17 3 16 and 17 3
19 2 19 2
8.3.4 Summary of experiment II
There was a significant and strong correlation between the change in
performance after deactivating indiscriminable electrodes and the difference
between IF in regions of indiscriminable electrodes before and after
deactivation (IF in C – B). The individuals who showed significant
improvement had a median IF in (C – B) of 2 while those showing decline
benefit had a median IF in (C – B) of 0. IF in electrode-pair C (-2) for
participant 9 may explain the decline in performance despite displaying the
pattern observed in participants showing improvement (IF in A > IF in B). IF
in electrode-pair C for participants who have received a program based on IF
in electrode-pair B were also consistent with the observed improvement.

264
8.3.5 Discussion of experiment II
8.3.5.1 Group results
As hypothesised there was a statistically significant positive relationship
between post-deactivation change in CI performance and the difference
between the number of IF in regions of indiscriminable electrode-pairs
regions before and after deactivation. The participants who showed
significant benefit following deactivation of indiscriminable electrodes (in the
study described in Chapter 7) had a larger number of IF in areas of
indiscriminable electrode-pairs post-deactivation in comparison to IF in
regions of indiscriminable electrode-pairs when they were active. These
findings were consistent with improved spectral representation following the
deactivation of indiscriminable electrodes (Shannon et al., 2001; Henry et al.,
2000 and McKay and Henshall, 2002). This pattern also supported Nelson’s
(1995) proposal to increase spatial separation in areas of spectral resolution
in order to enhance performance. This is also in line with studies that
improved performance by deactivating problematic electrode/ sites (Zwolan
et al., 1997 and Zhou and Pfingst, 2012). While participants showing decline
did not have a larger number of IF in areas of indiscriminable electrode-pairs
post-deactivation in comparison to IF in the pre-deactivation regions of
indiscriminable electrode-pairs, consistent with decreased spectral resolution
(e.g. Shannon et al., 2001). This again provides further support to the
presence of underlying dead regions “holes in hearing” that were detected by
PTED’s indiscriminable electrodes in participants showing benefit. And
redirecting information around those regions by deactivating those electrodes
provided the observed benefit. An explanation which is in line with findings
by Faulkner (2006) and Smith and Faulkner (2006) where they reported that
redirecting information around a simulated spectral hole improved speech
perception in comparison to dropping that information.
265
8.3.5.2 Individual results
Participants’ showing post-deactivation significant benefit, were better able to
utilise pitch information delivered to regions of indiscriminable electrodes
post-deactivation, in comparison to pre-deactivation (as proposed by Nelson
et al., 1995). Participants who received programs based on PTIF in
experiment I and received benefit showed the same pattern. Examining IF in
electrode-pair C helped shed light on why participant (9) demonstrated the IF
(in A and B) pattern of participants showing post-deactivation improvement
but suffered from a decline in post-deactivation performance. The
participant’s IF testing in electrode-pair C showed that he suffered from
reversals after deactivating the indiscriminable electrode, so his ability to
utilise pitch information did not improve, which is probably why he did not like
the sound quality. Reversals could be due to several reasons, including
cross-turn stimulation, or calcification negatively affecting the spread of
current (Rotteveel et al., 2010). However, since the participant did not show
reversals in electrode-pair B and considering that the deactivated electrode
is in a more basal position, cross-turn stimulation is an unlikely reason. A
more likely reason would be a combination of an underlying dead region and
calcification affecting the spread of current, which became worse with
increased spatial separation between the active electrodes (post-deactivation
of the electrode). In such cases of calcification deactivating electrodes in
most likely dead regions may not be ideal; filter frequency-range
manipulation to limit the information delivered to that region might provide a
solution. Another solution could be the use of a more focussed stimulation
such as partial-tripolar (Bierer et al., 2005; Bonham et al., 2005; Litvak et al.,
2007; Zhu et al., 2012) (described in Section 1.2.5) in combination with filter-
frequency-range adjustment to minimise the negative effect of abnormal
spread of current. Participant (12) IF results in electrode-pair C for the
different regions of deactivated electrodes reflected to an extent post-
deactivation change in performance. She showed limited ability to utilise
pitch information in the region of the deactivated indiscriminable-electrode at
high frequencies as opposed to better pitch perception in the region of the
266
deactivated indiscriminable-electrode at lows frequencies. These IF results
corresponded with the participant’s report of better perception of men’s
voices but not that of women, which is in concordance with men’s voices
having lower fundamental frequencies (e.g. Saxman and Burk, 1967).
Increasing spatial separation between active electrodes in the high frequency
range did not improve her speech perception nor did it increase the number
of IF in that region. Again, performance reflected the pattern observed in IF
testing. This lack of improvement may reflect poor neuronal survival (dead
regions as shown by Shannon et al., 2001) in that frequency range or
placement issues (e.g. relative distance from spiral ganglion as proposed by
Wilson and Dorman, 2008) so no matter how much spatial separation there
is between active electrodes it did not enhance her ability to rank pitch in that
range. The deactivation of indiscriminable electrodes in that region for such a
case may not be the best option, limiting information presented to that region
by manipulating the filter-frequency-range and/or by using focussed
stimulation might be better options and may be explored in future research.
8.4 Discussion for experiments I and II
In line with previous findings, the stimulation of electrode-pairs produced
intermediate pitches and the number of discriminable IF varied both within
and between subjects (McDermott and McKay, 1994; Donaldson et al., 2005;
Kwon and van den Honert, 2006 and Nobbe et al., 2007). The studies
reported in this chapter showed that the number of IF in the different regions
and electrode-pairs (A, B and C) can reflect the change in performance
observed, following the deactivation of indiscriminable electrodes as
identified via PTED. These results may shed some light on results of the
study described in Chapter 7. Deactivation of indiscriminable electrodes as
identified by PTED provided benefit when those electrodes uncovered
underlying dead regions (Shannon et al., 2001). Redirecting information
around those regions gave rise to improvement, which is in concurrence with
findings of simulation studies (Faulkner, 2006 and Smith and Faulkner,
267
2006). PTIF also sheds some light on the lack of post-deactivation
improvement in performance in some participants (cases of Otosclerosis or
meningitis). PTIF also identified some indiscriminable electrodes that did not
stimulate dead regions either due to placement issues or in the absence of
pathological changes (e.g. fibrosis or calcification) or placement problems.
Deactivating electrodes for those participants did not improve their ability to
utilise pitch information in regions of deactivated electrodes, and deactivation
may have caused decreased spectral resolution (Henry et al., 2000 and
McKay and Henshall, 2002). PTIF may potentially be used to further guide
programming of CI to improve performance or identify dead regions, and
results from these two studies provide some validation to the PTIF test.
Further research in this area could be fruitful.
These results further support the presence of different types of
indiscriminable electrodes (1) those stimulating dead regions, (2) those
stimulating regions with functioning spiral ganglion cells (non-dead regions)
due to cochlear pathological changes such as fibrosis, calcification or
ossification, (3) those stimulating regions with functioning spiral ganglion
cells (non-dead regions) due to surgical placement issues and (4) those
stimulating regions with functioning spiral ganglion cells (non-dead regions)
in the absence of cochlear pathological changes such as fibrosis,
calcification or ossification. In contrast to the latter three types (2, 3 and 4)
the deactivation of the first type provides improvement in speech perception.
8.5 Conclusion
This Chapter provided an explanation of change in CI performance following
the deactivation of CI electrodes, including the patterns observed in Chapter
7. Participants showing benefit post deactivation (of indiscriminable
electrodes) had a larger number of discriminable IF in regions of
discriminable electrodes, compared to regions of indiscriminable electrodes;
however, those showing limited benefit or decline post deactivation did not.
Furthermore, those showing post deactivation benefit had a larger number of
268
DIF in regions of indiscriminable electrodes post deactivation of
indiscriminable electrodes, compared to those regions when those
electrodes were active, but those showing limited benefit or decline post
deactivation did not. It also demonstrated the potential of using the PTED
and PTIF tests as possibly clinically applicable tools to help guide optimise
programming, with the additional potential for PTIF to be used to identify
dead regions and possibly predict the effect of deactivating electrodes;
however, further research is required. This chapter also highlighted the need
to explore other options besides deactivating electrodes deemed
indiscriminable or have possible underlying dead regions.
8.6 Summary
PTIF demonstrated that electrodes identified as indiscriminable via the
PTED have most likely uncovered underlying dead regions and the
benefit observed reflects the redirection of information that would have
otherwise been lost.
In cases where cochlear pathological changes are suspected the PTIF
may provide a test for underlying dead regions.
PTIF can potentially be used as a clinical tool to guide programming of
CI.
269
Chapter 9
Electrode differentiation with bilateral cochlear
implants
Abstract
This study examined the efficacy of two different CI research programs
based on matching pitch and loudness across the two CI devices for six
bilaterally-implanted adults. One research program was based on direct-
stimulation (DS) matching with the use of two clinical programming
interfaces, and the other research program based on pure-tone (PT) auditory
matching. Evaluation measures included spatial release from masking (SRM)
with the use of BKB sentences in speech-spectrum shaped noise, with
speech presented from the front (at 0°azimuth) and noise presented to the
right (at +90°) or to the left (at -90°), a localisation test (for 30° and 15° of
separation) and, finally, an across-ears pitch comparison test . Statistically
significant improvements were found in localisation at 30° of separation with
the research program based on DS only (t = -3.03*, df = 5, p < 0.05) and in
localisation at 15° of separation with the use of DS and PT respectively (t = -
2.62*, df = 5, p < 0.05 and t = -6.95**, df = 5, p < 0.005). Statistically
significant improvements were also observed for the ‘BKB in noise’ with the
use of the best research program, compared to the best clinical BKB score
with speech-spectrum shaped noise presented on the right and on the left,
respectively (t = -3.179*, df = 4, p < 0.05 and t = -3.22*, df = 4, p < 0.05) after
the exclusion of the participant with unilateral, severe cochlear ossification in
the weaker side. Although three out of six participants showed statistically
significant improvements in ‘BKB in noise’ with speech presented from the
front (at 0°azimuth), no overall statistically significant improvement was
observed as a group. A ‘pitch comparison test’ was applied across-ears (to
evaluate how well matched the two bilateral implants are in terms of
270
frequency) and revealed statistically significant improvement with the use of
DS (t = -5.22**, df = 5, p < 0.005).
9.1 Introduction
Bilateral implantation has been considered one of the advances that
produced significant improvement in performance with CI (Wilson and
Dorman, 2008). Having both ears implanted ensures that the better ear will
be implanted and provides the hearing impaired with a “back-up” device if
one should fail (e.g. Verschuur et al., 2005). It is essential in cases of
meningitis urgently to provide bilateral implants due to the speed at which
ossification can occur, leading to a poorer hearing and speech perception
outcome following implantation. In addition to allowing listeners to detect and
locate potential sources of danger (e.g. traffic) bilateral implantation has the
potential to improve localisation performance the perception of speech in
noise, leading to improved communication abilities. Many researchers have
demonstrated improvements in localisation with bilateral, compared to
unilateral, implantation (Schleich et al., 2004; Seeber et al., 2004 ; Laszig et
al., 2004; Verschuur et al., 2005; Tyler et al., 2007; Neuman et al., 2007;
Mosnier et al., 2009; Kerger and Seeber, 2012) and also improved speech
perception in noise, especially when speech and noise are spatially
separated (Laszig et al., 2004; Schleich et al.,2004; Eapen et al., 2009;
Litovsky et al., 2006 and Ricketts et al., 2006). However, some studies that
evaluated bilateral CI benefit in speech perception in quiet and in noise when
both speech and noise were presented only from in front of the listener (at
0°azimuth) report conflicting results. Some found a bilateral advantage for
speech perception in quiet (e.g. Mosnier et al., 2009; Tyler et al., 2007;
Eapen et al., 2009; Dunn et al., 2010 and Litovsky et al., 2006), whilst others
did not (Ramsden et al., 2005 and Laszig et al., 2004). For speech in noise
at 0° azimuth, some report an improvement (Schleich et al.,2004; Ramsden
et al., 2005; Eapen et al., 2009 and Wackym et al., 2007) but others do not
(Laszig et al.,2004; Litovsky et al., 2006). One potential reason for this
271
discrepancy could be that the observed benefits stem predominantly from the
head-shadow effect, which cannot be utilised when signal and noise are both
presented from the front. Different degrees of performance might arise as a
result of the variable amount of bilateral summation between subjects,
possible due to the degree of mismatch in frequencies between ears.
Supporting evidence for the mismatch effect was shown in a simulation study
(Siciliano et al., 2010), in which six-channel noise vocoders were used with
normally-hearing adults, three out of six channels were binaurally
mismatched with an upward frequency shift in one ear only. These authors
demonstrated that participants did not show any speech perception benefit
from the three mismatched channels when performance was compared to a
condition which used three binaurally matched channels only. They also
found that program frequency mismatch between ears could not be
accommodated for by training. In line with these findings, Zhou and Pfingst
(2012) found that dichotic programs employing the best stimulation sites
(electrodes) only, as identified by the modulation detection threshold,
provided better speech perception than programs employing the same
electrodes but with frequency redistribution permitted. In dichotic programs,
the program in each device contained ‘spectral holes’ that were
complemented by the corresponding contralateral site, thus avoiding pitch-
mismatches between ears. However, localisation performance was not
evaluated with any of their programs. Considering that Dunn et al. (2004)
found that splitting frequencies between ears significantly reduced
localisation, localisation could have been affected in the dichotic programs.
In Chapter 7, deactivating indiscriminable electrodes based on a pitch
ranking task (were non-tonotopic) provided benefit for 20 out of 25
unilaterally implanted recipients. In this chapter a study that evaluates the
effect of deactivating electrodes which are indiscriminable or non-tonotopic in
relation to the contralateral ear by providing programs which matches the two
implants for pitch.

272
9.1.1 Interaural differences
The ability to exploit information arriving at both ears underlies binaural
hearing. This entails the perception of interaural differences in time of arrival
(to each ear) and sound level when entering each ear (e.g. McAlpine, 2005).
When a sound source lies to the front of a listener (at 0°azimuth), it arrives at
both ears at the same time and at an equal loudness level. However moving
the sound even slightly to the left, for example, has two consequences. (1)
The sound will arrive at the left ear first creating an interaural time difference
(ITD) between the ears and (2) the sound will enter the left ear at higher
loudness level than the right ear giving rise to an interaural level difference
(ILD).
The duplex theory of binaural hearing (Rayleigh, 1907) stipulates that ITD
cues mainly operate at frequencies lower than about 1500 Hz whilst ILD
cues operate at higher frequencies, where the wavelength of sound relative
to the source generates sufficient ‘shadowing’ by the head. This was also
supported by findings of Stevens and Newman (1936) where the ability to
localise pure-tones varied according to frequency; localisation of frequencies
lower than 1000 Hz was based on ITD and localisation of frequencies above
4000 Hz was based on ILD.
9.1.2 Spatial release from masking (SRM)
Spatial release from masking (SRM) refers to improved speech perception in
noise when the speech and noise are spatially separated (Plomp and
Mimpen, 1981; Bronkhorst and Plomp, 1992; Nilsson et al., 1994; Koehnke
and Besing, 1996; Peissig and Kollmeier, 1997; Hawley et al., 1999; Shinn-
Cunningham et al., 2001; Litovsky et al., 2002). It is usually assessed by
comparing speech perception in noise (either the speech perception
threshold in an adaptive test or the percentage correct response in a fixed
level test) at two different conditions, with both speech and noise presented
from the front (at 0°azimuth) and with speech presented from the front (at

273
0°azimuth) and noise presented to the right (at +90°) or to the left (at -90°) -
see Figure (9.1). Speech perception is usually better (lower thresholds or
higher percentage correct scores) when noise is presented to the side (either
at +90°or at -90°). This occurs because of two underlying reasons (Durlach,
1963; Zurek, 1992; Bronkhorst, 2000): (1) one ear is shielded by the head
when the noise is presented at the contralateral side of the head (head
shadow), providing an improved SNR at frequencies greater than 500-1000
Hz and (2) the difference in ITD between the speech and the noise. SRM
provides a measure of binaural benefit in speech perception that does not
require the deactivation of either of the two CI devices during testing.
9.1.3 Aims and hypotheses
This chapter describes a study aimed at improving frequency matching
between the two implants in bilaterally-implanted individuals via DS and via
PT auditory stimulation. The implanted participants were evaluated with the
use of SRM, BKB in speech-spectrum shaped noise, a “number localisation”
task and CRM. To evaluate how well matched the two devices were, a test
applying an across-ears pitch-comparison task with a fixed set of nine
frequencies was administered with each program. It was hypothesised that
matching the bilateral CIs for pitch will binaural hearing and consequentially
will affect speech perception [CRM and BKB in noise when speech is
presented from the front (at 0°azimuth) and noise is presented from one of
the front (at 0°azimuth), right (at +90°) or left (at -90°)]. It was also
hypothesised that it will therefore affect SRM, localisation and performance
on the across-ears pitch-comparison test. If the degree of pitch matching
between the two implants (as measured by performance on the across-ears
pitch comparison test) is correlated to localisation and/or speech perception
then this could be indicative of better/degree of matching between the two
implants affecting localisation and use of binaural hearing.

274
Main research hypotheses:
H1: Matching electrodes’ pitch and frequency tables (see Section 1.3.2)
between the bilateral CI devices based on pitch perception via direct
stimulation will affect CI performance.
H2: Matching electrodes’ pitch and frequency tables (see Section 1.3.2)
between the bilateral CI devices based on pitch perception via pure-tone
auditory stimulation will affect CI performance.
H3: There will be a significant correlation between localisation with the use of
five speakers at 30° and 15° of separation and performance on the across-
ears pitch-comparison test.
H4: There will be a significant correlation between speech perception and
performance on the across-ears pitch-comparison test.
Sub-hypotheses are:
1- Matching electrodes’ pitch and frequency tables between the bilateral
CI devices based on pitch perception either via direct stimulation or
via pure-tone auditory stimulation will affect speech perception [CRM
and BKB in noise when speech is presented from the front (at
0°azimuth) and noise is presented from one of the front (at
0°azimuth), right (at +90°) or left (at -90°)].
2- Matching electrodes’ pitch and frequency tables between the bilateral
CI devices based on pitch perception either via direct stimulation or
via pure-tone auditory stimulation will affect SRM.
3- Matching electrodes’ pitch and frequency tables between the bilateral
CI devices via DS will affect localisation in a number-localisation task
with the use of five speakers at 30° and 15° of separation.
4- Matching electrodes’ pitch and frequency tables between the bilateral
CI devices via PT auditory stimulation will affect localisation in a
number localisation task with the use of five speakers at 30° and 15°
of separation.

275
5- Matching electrodes’ pitch and frequency tables between the bilateral
CI devices via DS will affect performance on the across-ears pitch-
ranking screening test.
6- Matching electrodes’ pitch and frequency tables between the bilateral
CI devices via PT auditory stimulation will affect performance on the
across-ears pitch-ranking screening test.
7- There will be a significant correlation between performance on the
across-ears pitch-comparison test and localisation in a number-
localisation task with the use of five speakers at 30° and at 15° of
separation.
8- There will be a significant correlation between performance on the
across-ears pitch-comparison test and speech perception [CRM and
BKB in noise when speech is presented from the front (at 0°azimuth)
and noise is presented from one of the front (at 0°azimuth), right (at
+90°) or left (at -90°)].
9.2 Methods
9.2.1 Participants
Participants were recruited from the Royal National Throat Nose and Ear
Hospital (RNTNEH) and through the National Cochlear Implant Users
Association (NCIUA).
Six adults with bilateral CIs and acquired deafness were recruited.
The inclusion criteria were:
1- A minimum of six months bilateral CI experience.
2- An aural-oral mode of communication.
3- Have English as a first language.
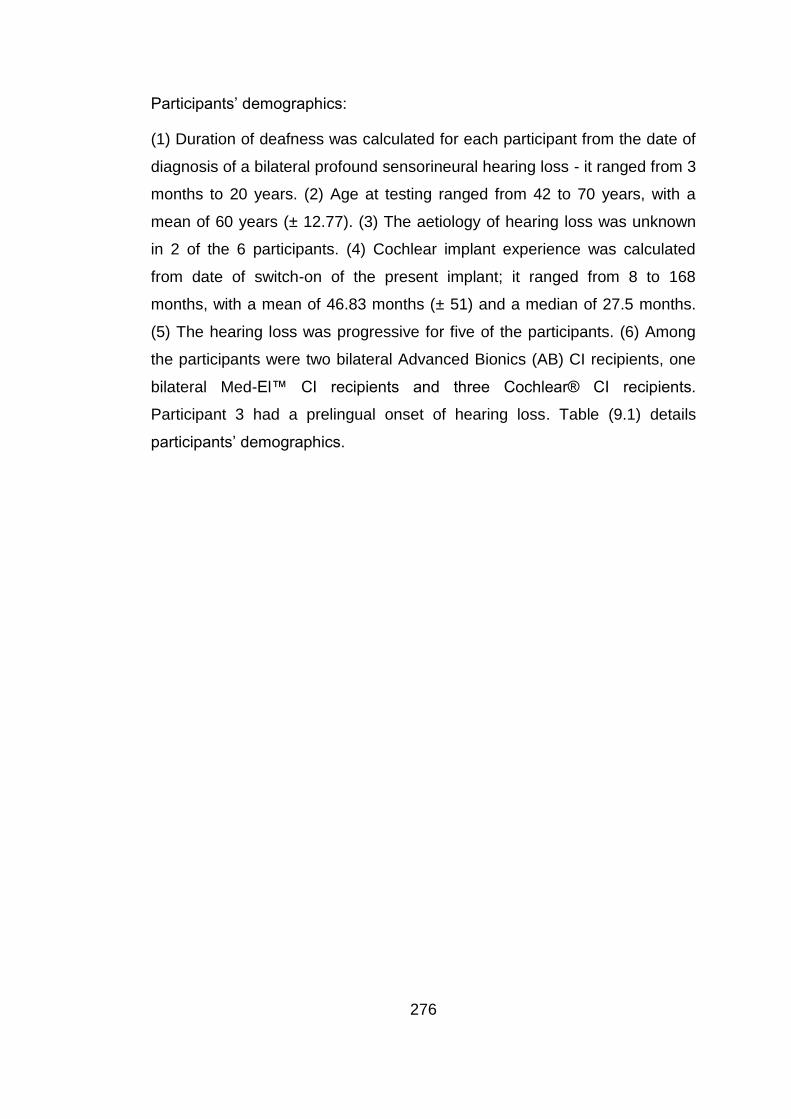
276
Participants’ demographics:
(1) Duration of deafness was calculated for each participant from the date of
diagnosis of a bilateral profound sensorineural hearing loss - it ranged from 3
months to 20 years. (2) Age at testing ranged from 42 to 70 years, with a
mean of 60 years (± 12.77). (3) The aetiology of hearing loss was unknown
in 2 of the 6 participants. (4) Cochlear implant experience was calculated
from date of switch-on of the present implant; it ranged from 8 to 168
months, with a mean of 46.83 months (± 51) and a median of 27.5 months.
(5) The hearing loss was progressive for five of the participants. (6) Among
the participants were two bilateral Advanced Bionics (AB) CI recipients, one
bilateral Med-El™ CI recipients and three Cochlear® CI recipients.
Participant 3 had a prelingual onset of hearing loss. Table (9.1) details
participants’ demographics.
277
Table 9.1 Participants’ demographics, duration of deafness was calculated from the date of diagnosis of a bilateral profound sensorineural hearing loss to time of
receiving an implant, age at implant and duration of deafness are in years and implant experience is in months.
Participant Age
Aetiology Age at
implant
Duration of
deafness
Implant
experience
Type of implant
Right (R) Left (L)
R L
R L
R L
R L
1 67 Unknown
progressive
Unknown
progressive
63 63
20 20
39 39
MED-EL™
Sonata
MED-EL™
Sonata
2 69 Usher’s
syndrome
Usher’s
syndrome
68 66
4 2
8 33
Advanced
Bionics HiRes
90K
Advanced Bionics
HiRes 90K
3 42 Progressive
genetic
Progressive
genetic
41 40
15+ 15+
8 24
Advanced
Bionics HiRes
90K
Advanced Bionics
HiRes 90K
4 66 Meniers Meniers
63 50
16 3
28 36
Nucleus® CI
512 Nucleus® 22
5 45 Meningitis Meningitis
42 42
3/12 3/12
27 27
Nucleus® CI
512 Nucleus® CI 512
6 70 Unknown
progressive
Unknown
progressive
57 59
8 1
168 138
Nucleus®
CI24M Nucleus® CI24M
Page 278 of 393
9.2.2 Test battery
Two speech perception tests were used, the BKB sentence test in noise at a
10dB SNR or 5 dB SNR if the participant reached ceiling at a 10dB SNR
(described in Section 5.2.2) and the CRM (described in Section 4.2.2).
9.2.2.1 SRM
BKB in speech-spectrum shaped noise was conducted with speech
presented from the front (at 0°azimuth) and noise presented from the front
(at 0°azimuth), from the right (at +90°) and from the left (at -90°). Percentage
correct responses scores were used rather than thresholds because
sentences are not equally difficult, and because pilot testing revealed that
test-retest difference in thresholds with the use of BKB in noise was equal to,
or greater than, the estimated SRM.
9.2.2.2 Number “digit” Localisation test
Two number localization tests were administered, with the use of five audio-
visual stands (a speaker and a monitor beneath it) separated by 30° (at 0°, ±
30°, and ± 60°) and five audio-visual stands separated by 15° (at 0°, ± 15°,
and ± 30°). In each stand, the monitor displayed a number between 1 and 5,
and the touch screen monitor which the participant used to respond
displayed five rectangles, each with a digit from 1 to 5. The speech stimulus
“Hello, what’s this?” was presented at 70dBA by a female talker with a
random, roving level of ±5 dB at 1dB steps from a randomly-selected
speaker at each of the 30 trials. The task of the participant was to localize
the source of the stimulus and choose the number displayed on that stand
with the use of the touch screen in a five alternative-forced choice task. The
output score was the percentage of correct responses excluding the
responses of the five training trials administered before testing. See Figure
(9.1) for schematic representation of the testing setup.
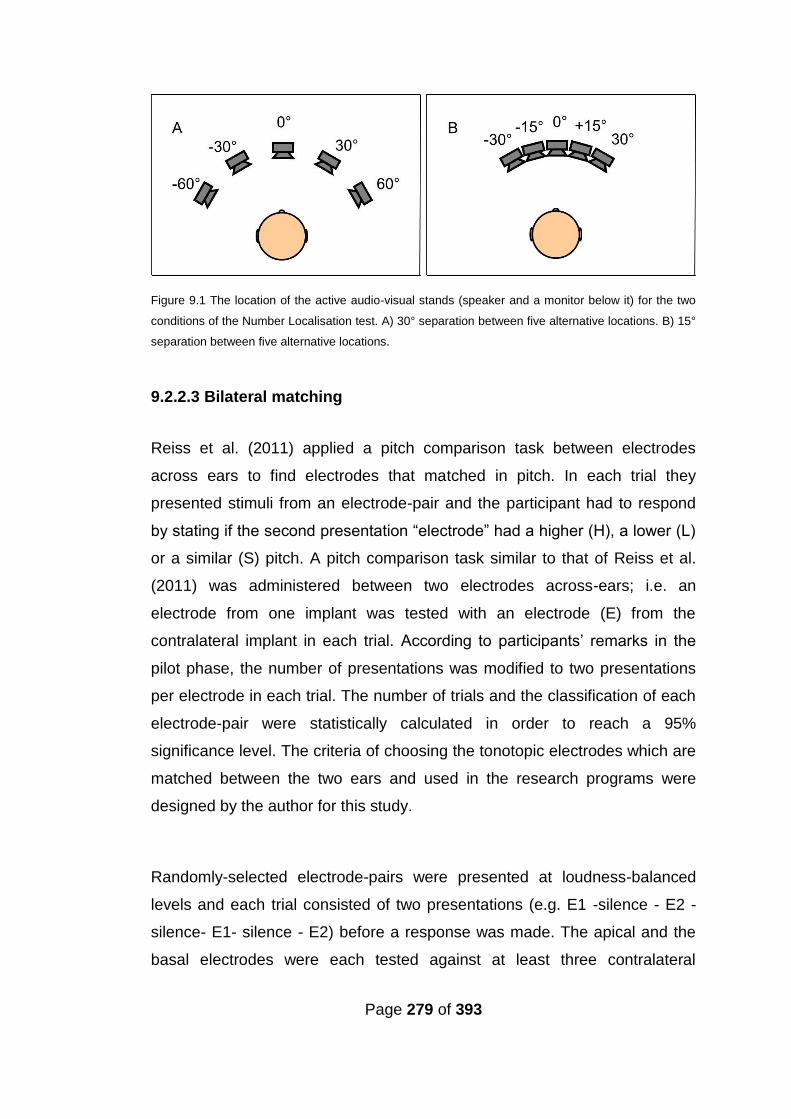
Page 279 of 393
Figure 9.1 The location of the active audio-visual stands (speaker and a monitor below it) for the two
conditions of the Number Localisation test. A) 30° separation between five alternative locations. B) 15°
separation between five alternative locations.
9.2.2.3 Bilateral matching
Reiss et al. (2011) applied a pitch comparison task between electrodes
across ears to find electrodes that matched in pitch. In each trial they
presented stimuli from an electrode-pair and the participant had to respond
by stating if the second presentation “electrode” had a higher (H), a lower (L)
or a similar (S) pitch. A pitch comparison task similar to that of Reiss et al.
(2011) was administered between two electrodes across-ears; i.e. an
electrode from one implant was tested with an electrode (E) from the
contralateral implant in each trial. According to participants’ remarks in the
pilot phase, the number of presentations was modified to two presentations
per electrode in each trial. The number of trials and the classification of each
electrode-pair were statistically calculated in order to reach a 95%
significance level. The criteria of choosing the tonotopic electrodes which are
matched between the two ears and used in the research programs were
designed by the author for this study.
Randomly-selected electrode-pairs were presented at loudness-balanced
levels and each trial consisted of two presentations (e.g. E1 -silence - E2 -
silence- E1- silence - E2) before a response was made. The apical and the
basal electrodes were each tested against at least three contralateral
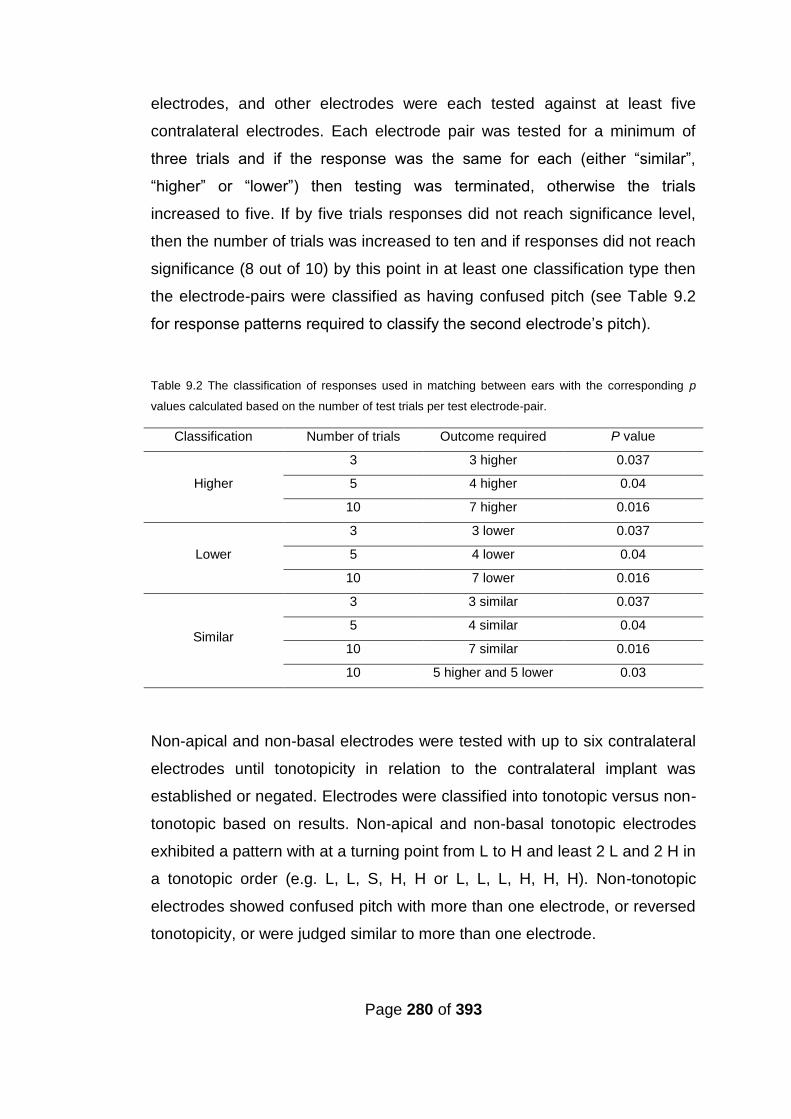
Page 280 of 393
electrodes, and other electrodes were each tested against at least five
contralateral electrodes. Each electrode pair was tested for a minimum of
three trials and if the response was the same for each (either “similar”,
“higher” or “lower”) then testing was terminated, otherwise the trials
increased to five. If by five trials responses did not reach significance level,
then the number of trials was increased to ten and if responses did not reach
significance (8 out of 10) by this point in at least one classification type then
the electrode-pairs were classified as having confused pitch (see Table 9.2
for response patterns required to classify the second electrode’s pitch).
Table 9.2 The classification of responses used in matching between ears with the corresponding p
values calculated based on the number of test trials per test electrode-pair.
Classification Number of trials Outcome required P value
Higher
3 3 higher 0.037
5 4 higher 0.04
10 7 higher 0.016
Lower
3 3 lower 0.037
5 4 lower 0.04
10 7 lower 0.016
Similar
3 3 similar 0.037
5 4 similar 0.04
10 7 similar 0.016
10 5 higher and 5 lower 0.03
Non-apical and non-basal electrodes were tested with up to six contralateral
electrodes until tonotopicity in relation to the contralateral implant was
established or negated. Electrodes were classified into tonotopic versus non-
tonotopic based on results. Non-apical and non-basal tonotopic electrodes
exhibited a pattern with at a turning point from L to H and least 2 L and 2 H in
a tonotopic order (e.g. L, L, S, H, H or L, L, L, H, H, H). Non-tonotopic
electrodes showed confused pitch with more than one electrode, or reversed
tonotopicity, or were judged similar to more than one electrode.
Page 281 of 393
Only tonotopic electrodes were included in the matching process. In cases
where some tonotopic electrodes were not judged as similar to any
contralateral electrode the best match was determined between the two
electrodes around the turning point (from L to H). The two electrode-pairs
representing the two possible matches were presented at loudness-balanced
levels (test E- silence - E1 -silence - test E - silence - E2) and the participant
was asked to choose the pair that sounded the closest in pitch. The order of
presenting E1 and E2 was alternated in a minimum of six trials. The best
matches were established between equal numbers of electrodes in each
implant. This matching process was administered via direct stimulation using
a clinical fitting station and software, and via pure-tone presentations.
For loudness balancing, a two interval alternative-forced-choice task was
applied, whereby the participant was presented with two pure-tones
representing the two test electrodes and had to respond as to whether the
second tone had a higher, quieter or the same loudness level as the first
tone. A simple up-down staircase adaptive procedure was followed. Step
size started at 5 dB for PT auditory testing and at 2 clinical units for DS
testing. The step size was halved after the second reversal, and testing was
terminated after the participant indicated that the second tone has same
loudness level as the first tone on three occasions. The average loudness
level of the three responses judged as having the same loudness was
considered to be the loudness-balanced level.
9.2.2.3.1 Bilateral direct-stimulation matching
In the bilateral direct-stimulation matching, a standard fitting station with two
programming interfaces (see Appendix A) was used to deliver the stimuli.
The default settings used in programming the AB and MEDEL CI devices
were used in the direct stimulation matching process because not all CI
programming software allows for manipulation of the pulse duration, and
because participants reported that default setting provided stimuli sufficient
Page 282 of 393
for them to make judgments concerning pitch comparisons. However, for
Cochlear devices during pilot testing, participants (5 and 6) reported that the
pulse duration had to be increased to 500 ms before the participant was able
to make pitch comparison judgments. Hence 500 ms pulse duration was
used with Cochlear participants. For each tested electrode-pair the
presentation order of test electrodes alternated between trials.
9.2.2.3.1 Bilateral pure-tone auditory matching
In the bilateral pure-tone matching, pure tone presentations at the centre
frequencies (either provided in the frequency table or calculated as the
geometric mean) of the tested electrodes were used after applying
adjustments to the speech processor see Section (9.2.3.1).
To conduct matching between the bilateral CIs without direct stimulation,
pure tones that corresponded to the centre frequencies of the processing
filters within a participant’s individual CI program were presented through a
Creative Labs Sound Blaster X-Fi Surround 5.1 PRO sound card. The
purpose of this USB-connected sound card was to present high-fidelity
sounds that bypassed the host computer’s sound card. All filter centre
frequencies associated with switched-on electrodes were used. The audio
presentation was controlled through bespoke software that was developed
by Dr Ray Glover for testing under conditions of ‘bimodal’ stimulation, further
modifications were incorporated (to allow more manipulation of intensity,
duration of stimuli, ISI and frequency settings of presentations) to allow
matching between both CIs in this study. Verification of the accuracy of
frequency, duration of stimulation and level of presentation was determined
with an oscilloscope. Pure-tones were presented to participants at a
comfortable level from a laptop PC via the Sound Blaster X-Fi Surround 5.1
PRO Sound Card, using high-fidelity headphones (Sennheiser 580). Stimuli
consisted of 600-ms tones and an inter-stimulus-interval (ISI) of 400 ms. The
stimuli and ISI settings were reached after pilot testing with three bilaterally-
implanted individuals (with different devices) who reported that these settings
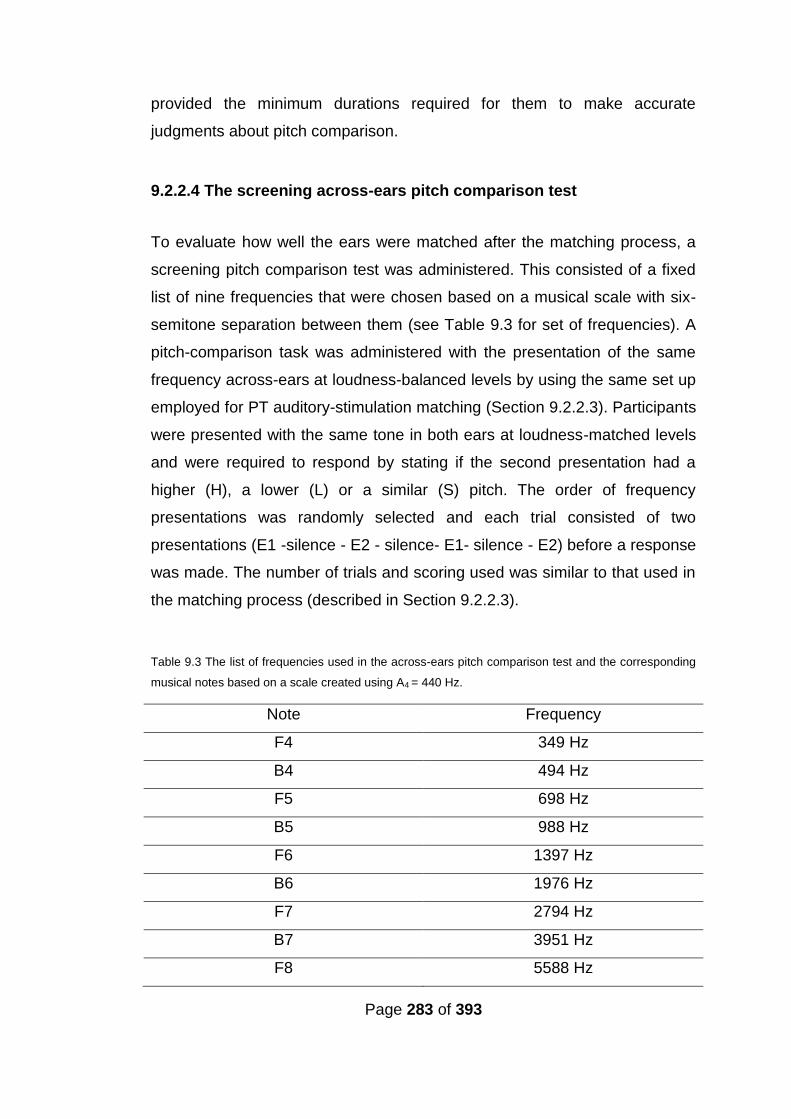
Page 283 of 393
provided the minimum durations required for them to make accurate
judgments about pitch comparison.
9.2.2.4 The screening across-ears pitch comparison test
To evaluate how well the ears were matched after the matching process, a
screening pitch comparison test was administered. This consisted of a fixed
list of nine frequencies that were chosen based on a musical scale with six-
semitone separation between them (see Table 9.3 for set of frequencies). A
pitch-comparison task was administered with the presentation of the same
frequency across-ears at loudness-balanced levels by using the same set up
employed for PT auditory-stimulation matching (Section 9.2.2.3). Participants
were presented with the same tone in both ears at loudness-matched levels
and were required to respond by stating if the second presentation had a
higher (H), a lower (L) or a similar (S) pitch. The order of frequency
presentations was randomly selected and each trial consisted of two
presentations (E1 -silence - E2 - silence- E1- silence - E2) before a response
was made. The number of trials and scoring used was similar to that used in
the matching process (described in Section 9.2.2.3).
Table 9.3 The list of frequencies used in the across-ears pitch comparison test and the corresponding
musical notes based on a scale created using A4 = 440 Hz.
Note Frequency
F4 349 Hz
B4 494 Hz
F5 698 Hz
B5 988 Hz
F6 1397 Hz
B6 1976 Hz
F7 2794 Hz
B7 3951 Hz
F8 5588 Hz
Page 284 of 393
9.2.3 Procedures
Bilateral matching took place in a 2×2.5 m double-walled sound booth while
testing for speech perception took place in a 3.7×3.25 m double-walled
sound booth where the participant was seated 1 m in front of an ear-level
loud speaker (Plus XS.2, Canton) from which the speech and noise were
presented. The stimuli were stored (16 bits), using the AB-York Crescent of
Sound (Kitterick et al., 2011).
As previously described, for CRM, the participants used a touch screen
monitor to respond, and the software ran the test presentation and scoring in
an automated fashion. During BKB testing, the tester recoded the
participants’ verbal response by selecting the correct key words in each
sentence presented.
A cross-over study design was used. (See Figure 9.3 for outline of the
procedure.) In the first session, speech perception was assessed with the
participant’s clinical program and the participant was provided with the first
research program, either program A or program B (details provided in
Section 9.2.4) based on the bilateral-matching task. After one month trial
use, the participant returned and speech perception was assessed with the
first research program; the participant was then provided with the second
research program. The participant returned once more, following one
month’s trial use, for a final session. Speech perception and localisation
testing was performed with the original clinical program and the second
research program. Final programming of the participant's speech processor
was provided, based on both performance and preference. The participant
was also asked to provide feedback on each research program after each
one-month trial; this provided valuable information on sound quality in
different day-to-day listening situations. All participants were tested for ‘BKB
in noise’ with the clinical program at the first and third sessions, and once
with each research program after the one-month trial period. ‘BKB in noise’
was conducted with speech presented from the front (at 0°azimuth) and
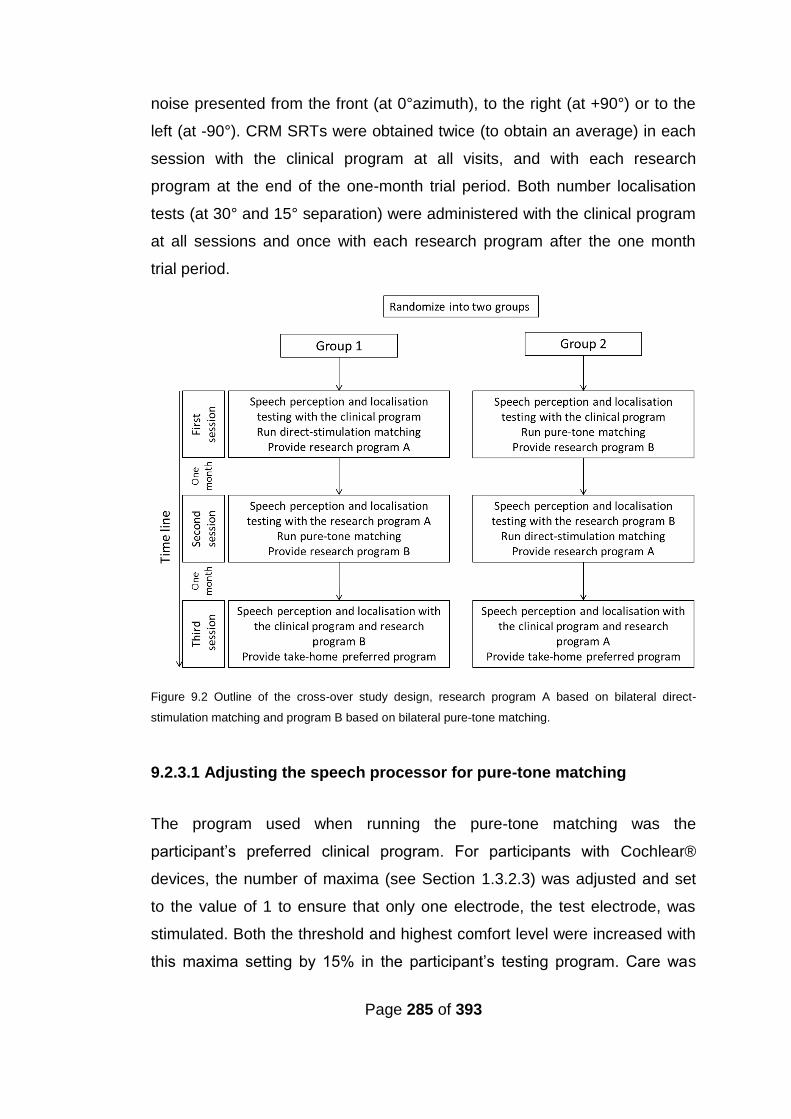
Page 285 of 393
noise presented from the front (at 0°azimuth), to the right (at +90°) or to the
left (at -90°). CRM SRTs were obtained twice (to obtain an average) in each
session with the clinical program at all visits, and with each research
program at the end of the one-month trial period. Both number localisation
tests (at 30° and 15° separation) were administered with the clinical program
at all sessions and once with each research program after the one month
trial period.
Figure 9.2 Outline of the cross-over study design, research program A based on bilateral direct-
stimulation matching and program B based on bilateral pure-tone matching.
9.2.3.1 Adjusting the speech processor for pure-tone matching
The program used when running the pure-tone matching was the
participant’s preferred clinical program. For participants with Cochlear®
devices, the number of maxima (see Section 1.3.2.3) was adjusted and set
to the value of 1 to ensure that only one electrode, the test electrode, was
stimulated. Both the threshold and highest comfort level were increased with
this maxima setting by 15% in the participant’s testing program. Care was

Page 286 of 393
taken that levels did not cause non-auditory stimulation and were
comfortable before conducting loudness balancing and pitch comparison.
Adaptive Dynamic Range Optimization (ADRO) was deactivated.
9.2.4 Research programs
Research programming options were as follows:
Program (A) Based on direct-stimulation matching, non-tonotopic electrodes
were deactivated and only the matched electrodes were active. The same
frequency table (see Section 1.3.3) was used in both CIs to ensure that each
electrode in the matched electrode-pair was allocated the same frequency
range and centre frequency. No changes were applied to the rate of
stimulation, processing strategy or T levels (see Section 1.3.3). However,
because the matching process used loudness-balanced levels, the M/C
levels (see Section 1.3.3) were balanced across ears. Both devices were
activated to make sure they were at a comfortable level of loudness and did
not result in any discomfort or non-auditory stimulation.
Program (B) Based on pure-tone matching, non-tonotopic electrodes were
deactivated and only the matched electrodes were active. The same
frequency table (see Section 1.3.2) was used in both CIs to ensure that each
electrode in the matched electrode-pair was allocated the same frequency
range and centre frequency. No changes were applied to the rate of
stimulation, processing strategy or T levels (see Section 1.3). However
because the matching process used loudness balanced levels in the direct-
stimulation matching process, the M/C levels (see Section 1.3) were
balanced across ears for the pure-tone matched programs as well. Both
devices were activated to make sure they were at a comfortable level of
loudness and did not cause any discomfort or non-auditory stimulation.
Page 287 of 393
9.3 Analyses
As described above, each participant was tested with the clinical program
both at the beginning and end of the study, and once with each research
program following a one-month trial. Group analysis compared the best
speech perception results acquired for each participant with the clinical
program, with the speech perception results acquired with the better of the
two research programs. Group analysis was also performed to compare the
best BKB score in noise for each condition [noise presented from the front (at
0°azimuth), right (at +90°) and left (at -90°)] with the best research program
for each participant, with the best BKB score in noise for each condition with
the clinical program. The best CRM SRT average with the clinical program
and the CRM SRT average with each research program were assessed in
the analyses. The best localisation score with the clinical program in each
condition (at 30° and 15° separation) was compared with the best research
program (at 30° and 15° separation) and with each research program (at 30°
and 15° separation).
SRM was calculated by subtracting the BKB score in noise when both
speech and noise were presented from the front, from the BKB score in
noise when the noise was presented from one or other of the sides. SRM
was calculated for each research program and with the use of the best
clinical BKB scores (acquired in one session).
The responses of the across-ears pitch-comparison test were categorised
into ‘same’ or ‘different’ for each test frequency. The percentage of
frequencies judged as the same was calculated for each program for all
frequencies, and separately for frequencies below 1500 Hz and frequencies
above 1500 Hz.
Page 288 of 393
Similar to the study described in Chapter 7, participants were also asked to
provide subjective feedback and report the sound quality, in addition to the
localisation task performed with each program. For purposes of analysis, the
same criteria for improvement described in Section (7.3.2.1) were used.
Statistical analysis was conducted to assess the existence of:
1) a significant change in ‘BKB in noise’ in any condition [noise
presented from the front (at 0°azimuth), right (at +90°) and left (at -
90°)] with the best research program.
2) a significant change in ‘CRM’ with the best research program.
3) Whether there is significant change in SRM with the best research
program.
4) a significant change in the across-ears pitch comparison test with
either research programs (based on DS matching and PT auditory
matching).
5) a significant relationship between the across-ears pitch comparison
AEPC test results and localization (at 30° and 15° separation).
6) a significant relationship between AEPC test results and ‘BKB in
noise’ at any condition [noise presented from the front (at 0°azimuth),
right (at +90°) and left (at -90°)].
7) a significant difference between research programs A and B.
9.3.1 Analyses of group results
Similar to Chapters 4-7, for statistical purposes BKB scores were
transformed to arcsine distribution (Studebaker, 1985), in order to include
scores that reached either the test floor or the ceiling. Since it has been
observed with cochlear pathology such as ossification affected participants’
performance on ED tasks (see Chapter 7), it was decided to conduct speech
perception analyses both including and excluding participant (5), who had a
history of meningitis and severe ossification in the left ear.
The Shapiro Wilk’s test was applied on all variables. Statistical tests were
determined accordingly.
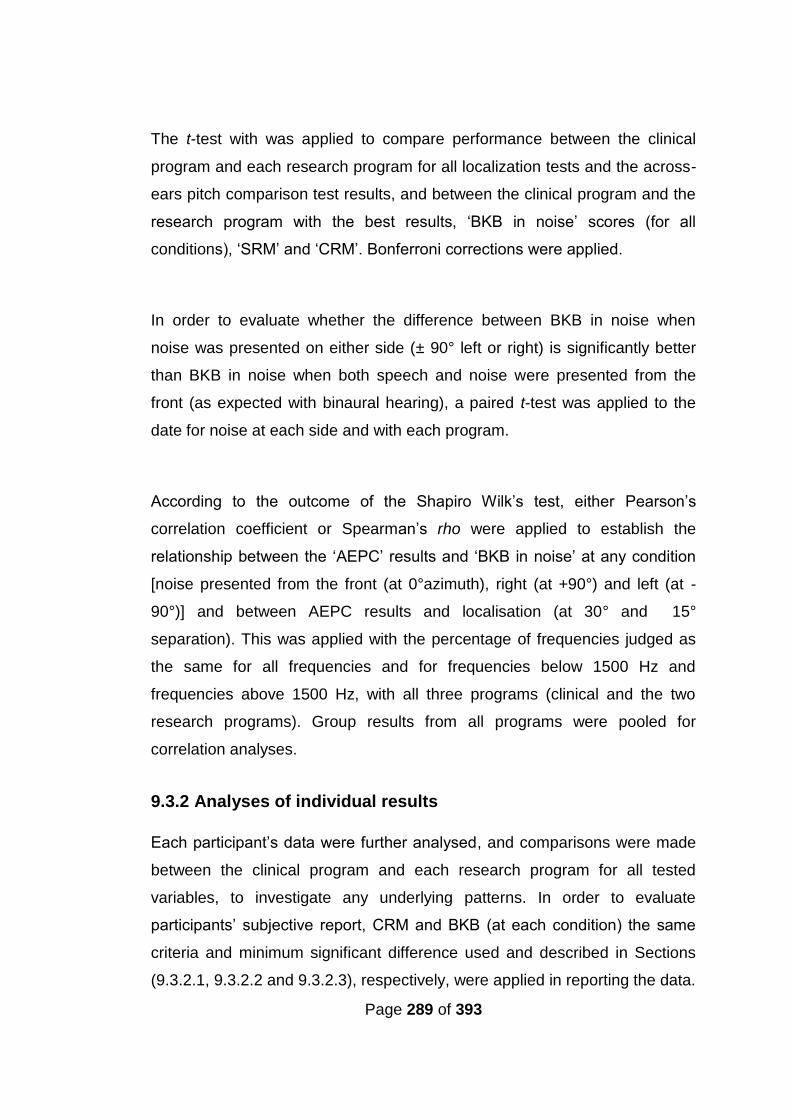
Page 289 of 393
The t-test with was applied to compare performance between the clinical
program and each research program for all localization tests and the across-
ears pitch comparison test results, and between the clinical program and the
research program with the best results, ‘BKB in noise’ scores (for all
conditions), ‘SRM’ and ‘CRM’. Bonferroni corrections were applied.
In order to evaluate whether the difference between BKB in noise when
noise was presented on either side (± 90° left or right) is significantly better
than BKB in noise when both speech and noise were presented from the
front (as expected with binaural hearing), a paired t-test was applied to the
date for noise at each side and with each program.
According to the outcome of the Shapiro Wilk’s test, either Pearson’s
correlation coefficient or Spearman’s rho were applied to establish the
relationship between the ‘AEPC’ results and ‘BKB in noise’ at any condition
[noise presented from the front (at 0°azimuth), right (at +90°) and left (at -
90°)] and between AEPC results and localisation (at 30° and 15°
separation). This was applied with the percentage of frequencies judged as
the same for all frequencies and for frequencies below 1500 Hz and
frequencies above 1500 Hz, with all three programs (clinical and the two
research programs). Group results from all programs were pooled for
correlation analyses.
9.3.2 Analyses of individual results
Each participant’s data were further analysed, and comparisons were made
between the clinical program and each research program for all tested
variables, to investigate any underlying patterns. In order to evaluate
participants’ subjective report, CRM and BKB (at each condition) the same
criteria and minimum significant difference used and described in Sections
(9.3.2.1, 9.3.2.2 and 9.3.2.3), respectively, were applied in reporting the data.
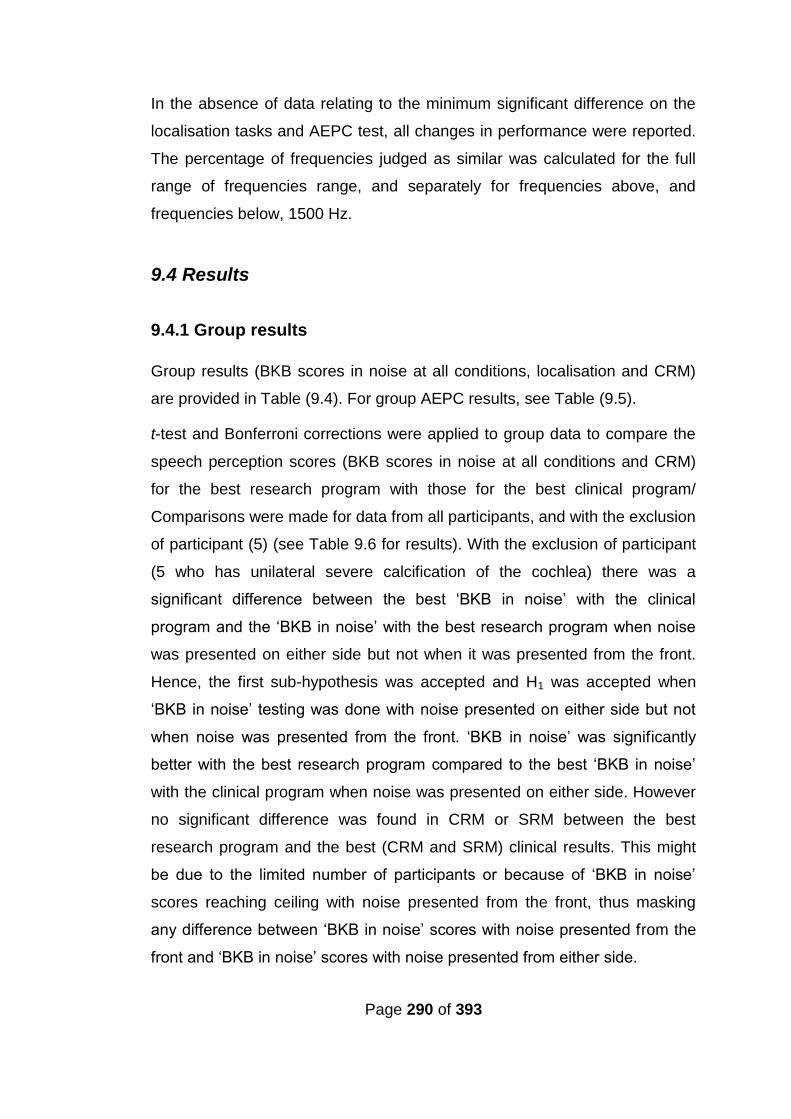
Page 290 of 393
In the absence of data relating to the minimum significant difference on the
localisation tasks and AEPC test, all changes in performance were reported.
The percentage of frequencies judged as similar was calculated for the full
range of frequencies range, and separately for frequencies above, and
frequencies below, 1500 Hz.
9.4 Results
9.4.1 Group results
Group results (BKB scores in noise at all conditions, localisation and CRM)
are provided in Table (9.4). For group AEPC results, see Table (9.5).
t-test and Bonferroni corrections were applied to group data to compare the
speech perception scores (BKB scores in noise at all conditions and CRM)
for the best research program with those for the best clinical program/
Comparisons were made for data from all participants, and with the exclusion
of participant (5) (see Table 9.6 for results). With the exclusion of participant
(5 who has unilateral severe calcification of the cochlea) there was a
significant difference between the best ‘BKB in noise’ with the clinical
program and the ‘BKB in noise’ with the best research program when noise
was presented on either side but not when it was presented from the front.
Hence, the first sub-hypothesis was accepted and H1 was accepted when
‘BKB in noise’ testing was done with noise presented on either side but not
when noise was presented from the front. ‘BKB in noise’ was significantly
better with the best research program compared to the best ‘BKB in noise’
with the clinical program when noise was presented on either side. However
no significant difference was found in CRM or SRM between the best
research program and the best (CRM and SRM) clinical results. This might
be due to the limited number of participants or because of ‘BKB in noise’
scores reaching ceiling with noise presented from the front, thus masking
any difference between ‘BKB in noise’ scores with noise presented from the
front and ‘BKB in noise’ scores with noise presented from either side.
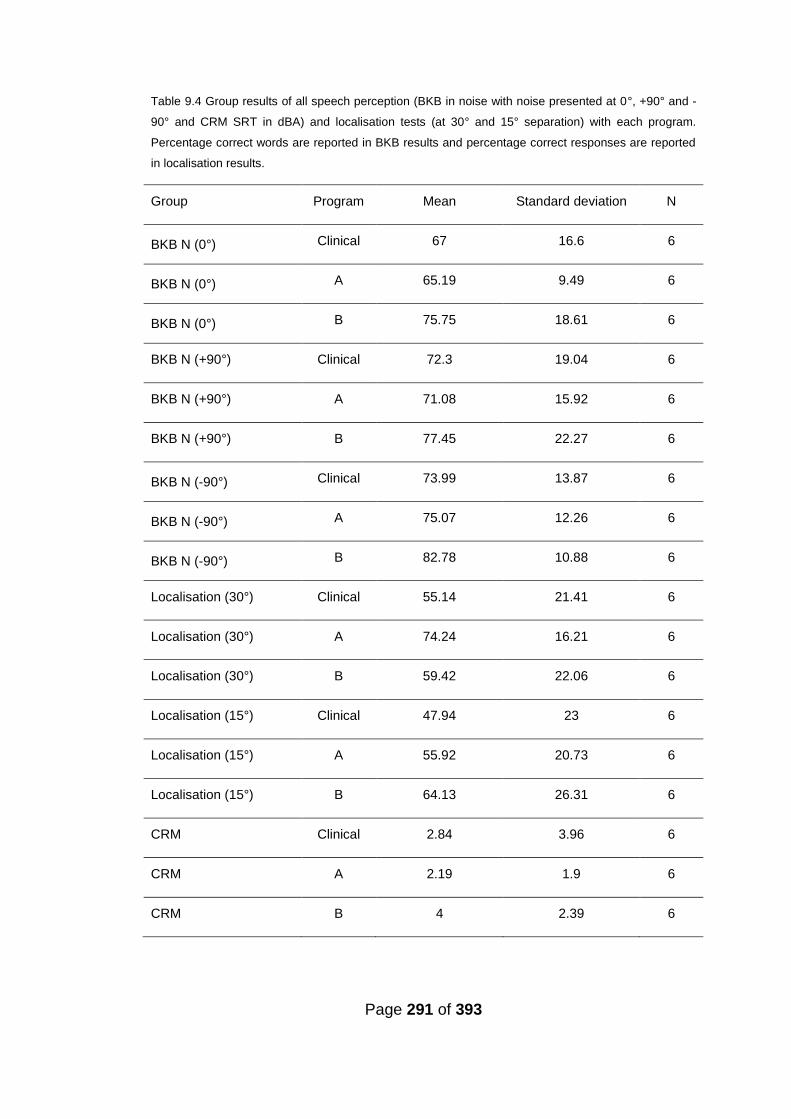
Page 291 of 393
Table 9.4 Group results of all speech perception (BKB in noise with noise presented at 0°, +90° and -
90° and CRM SRT in dBA) and localisation tests (at 30° and 15° separation) with each program.
Percentage correct words are reported in BKB results and percentage correct responses are reported
in localisation results.
Group Program Mean Standard deviation N
BKB N (0°) Clinical 67 16.6 6
BKB N (0°) A 65.19 9.49 6
BKB N (0°) B 75.75 18.61 6
BKB N (+90°) Clinical 72.3 19.04 6
BKB N (+90°) A 71.08 15.92 6
BKB N (+90°) B 77.45 22.27 6
BKB N (-90°) Clinical 73.99 13.87 6
BKB N (-90°) A 75.07 12.26 6
BKB N (-90°) B 82.78 10.88 6
Localisation (30°) Clinical 55.14 21.41 6
Localisation (30°) A 74.24 16.21 6
Localisation (30°) B 59.42 22.06 6
Localisation (15°) Clinical 47.94 23 6
Localisation (15°) A 55.92 20.73 6
Localisation (15°) B 64.13 26.31 6
CRM Clinical 2.84 3.96 6
CRM A 2.19 1.9 6
CRM B 4 2.39 6
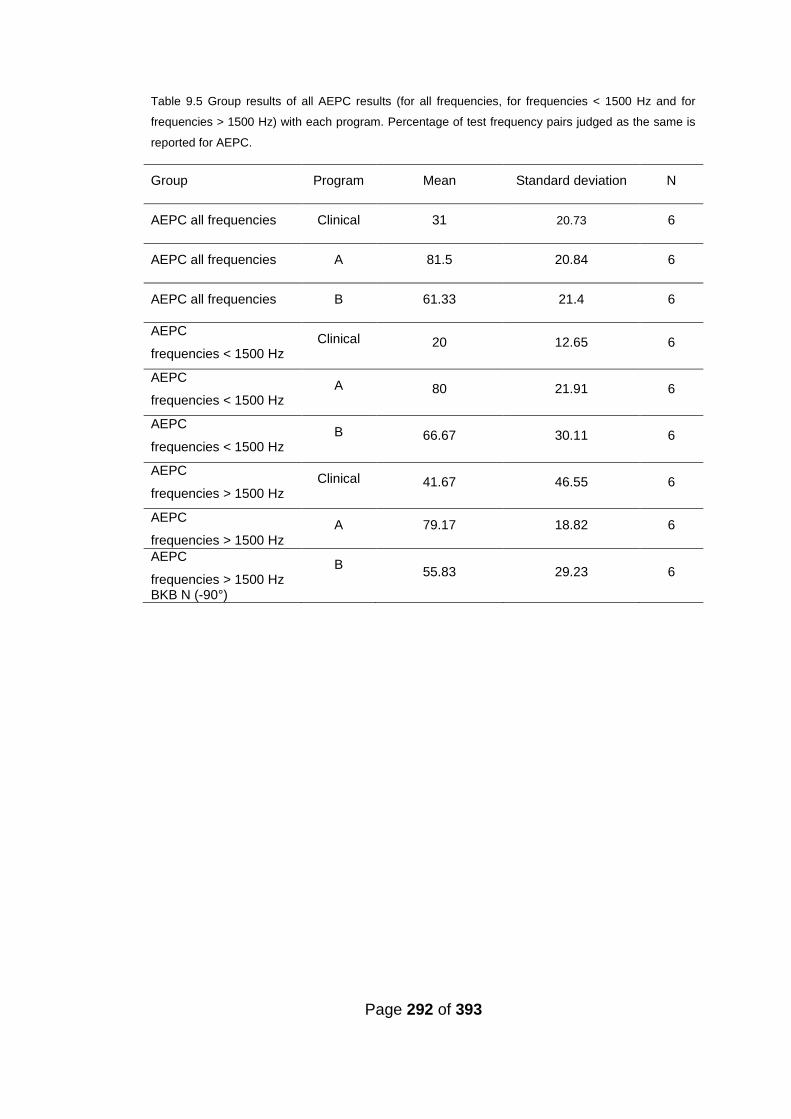
Page 292 of 393
Table 9.5 Group results of all AEPC results (for all frequencies, for frequencies < 1500 Hz and for
frequencies > 1500 Hz) with each program. Percentage of test frequency pairs judged as the same is
reported for AEPC.
Group Program Mean Standard deviation N
AEPC all frequencies Clinical 31 20.73 6
AEPC all frequencies A 81.5 20.84 6
AEPC all frequencies B 61.33 21.4 6
AEPC
frequencies < 1500 Hz Clinical 20 12.65 6
AEPC
frequencies < 1500 Hz A 80 21.91 6
AEPC
frequencies < 1500 Hz B 66.67 30.11 6
AEPC
frequencies > 1500 Hz Clinical 41.67 46.55 6
AEPC
frequencies > 1500 Hz A 79.17 18.82 6
AEPC
frequencies > 1500 Hz BKB N (-90°)
B 55.83 29.23 6
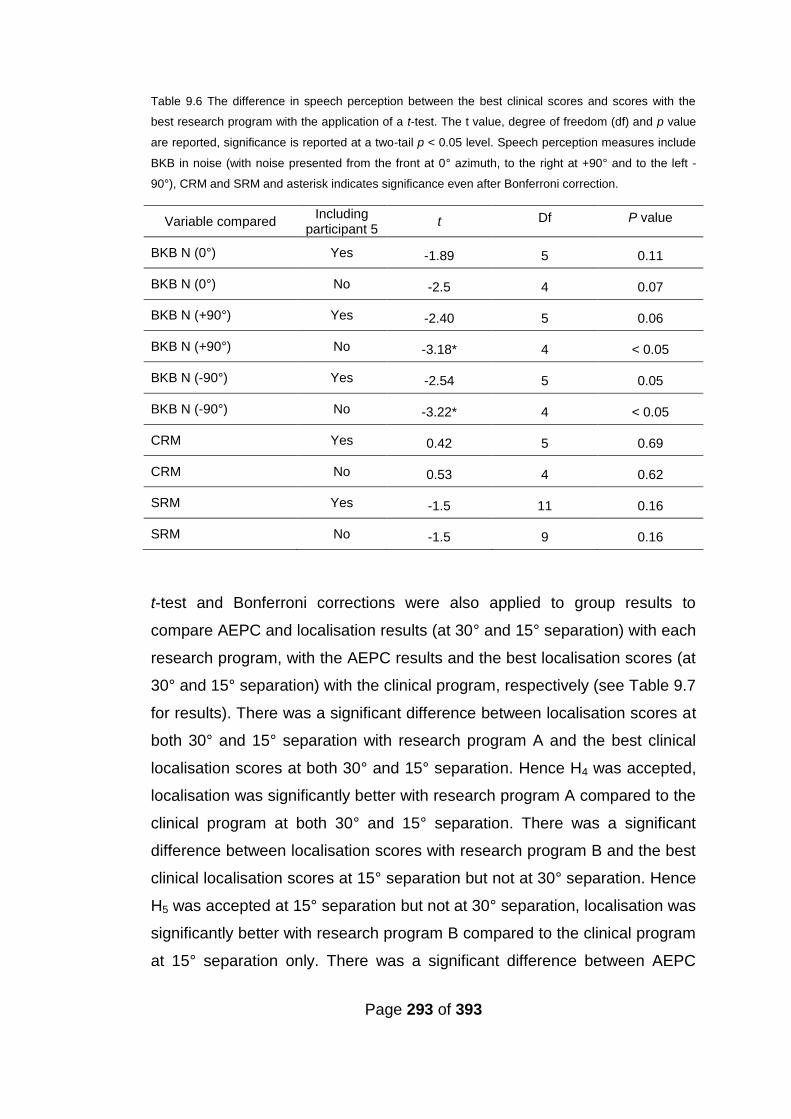
Page 293 of 393
Table 9.6 The difference in speech perception between the best clinical scores and scores with the
best research program with the application of a t-test. The t value, degree of freedom (df) and p value
are reported, significance is reported at a two-tail p < 0.05 level. Speech perception measures include
BKB in noise (with noise presented from the front at 0° azimuth, to the right at +90° and to the left -
90°), CRM and SRM and asterisk indicates significance even after Bonferroni correction.
Variable compared Including
participant 5 t Df P value
BKB N (0°) Yes -1.89 5 0.11
BKB N (0°) No -2.5 4 0.07
BKB N (+90°) Yes -2.40 5 0.06
BKB N (+90°) No -3.18* 4 < 0.05
BKB N (-90°) Yes -2.54 5 0.05
BKB N (-90°) No -3.22* 4 < 0.05
CRM Yes 0.42 5 0.69
CRM No 0.53 4 0.62
SRM Yes -1.5 11 0.16
SRM No -1.5 9 0.16
t-test and Bonferroni corrections were also applied to group results to
compare AEPC and localisation results (at 30° and 15° separation) with each
research program, with the AEPC results and the best localisation scores (at
30° and 15° separation) with the clinical program, respectively (see Table 9.7
for results). There was a significant difference between localisation scores at
both 30° and 15° separation with research program A and the best clinical
localisation scores at both 30° and 15° separation. Hence H4 was accepted,
localisation was significantly better with research program A compared to the
clinical program at both 30° and 15° separation. There was a significant
difference between localisation scores with research program B and the best
clinical localisation scores at 15° separation but not at 30° separation. Hence
H5 was accepted at 15° separation but not at 30° separation, localisation was
significantly better with research program B compared to the clinical program
at 15° separation only. There was a significant difference between AEPC
Page 294 of 393
results with research program A and the clinical AEPC results for all
frequencies and for frequencies below 1500Hz. Hence H6 was accepted for
AEPC result for all frequencies and for frequencies below 1500 Hz but not for
frequencies above 1500 Hz, AEPC results with research program A were
significantly better than the clinical AEPC results for all frequencies and for
frequencies below 1500 Hz as well. There was a significant difference
between AEPC results with research program B and the clinical AEPC
results for frequencies below 1500 Hz only. Hence H7 was accepted for
frequencies below 1500 Hz but not for all frequencies nor for frequencies
above 1500 Hz, AEPC results with research program B were significantly
better than the clinical AEPC results for frequencies below 1500 Hz only.
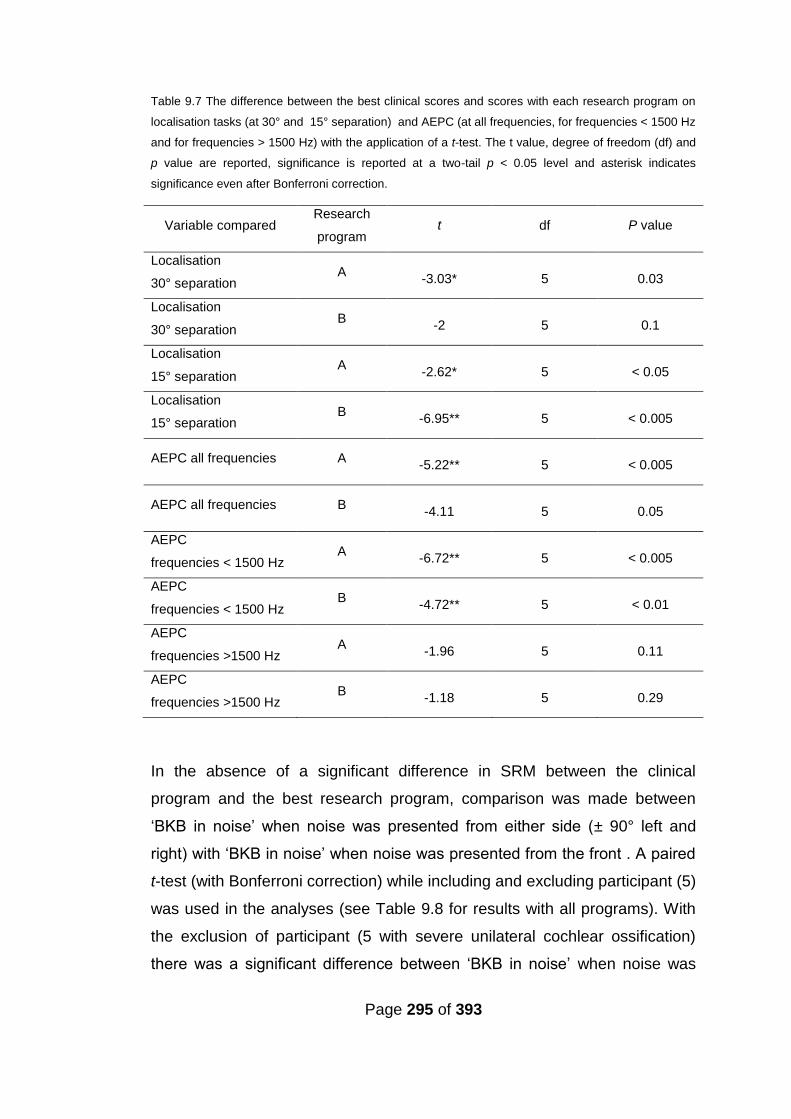
Page 295 of 393
Table 9.7 The difference between the best clinical scores and scores with each research program on
localisation tasks (at 30° and 15° separation) and AEPC (at all frequencies, for frequencies < 1500 Hz
and for frequencies > 1500 Hz) with the application of a t-test. The t value, degree of freedom (df) and
p value are reported, significance is reported at a two-tail p < 0.05 level and asterisk indicates
significance even after Bonferroni correction.
Variable compared Research
program t df P value
Localisation
30° separation A
-3.03* 5 0.03
Localisation
30° separation B
-2 5 0.1
Localisation
15° separation A
-2.62* 5 < 0.05
Localisation
15° separation B
-6.95** 5 < 0.005
AEPC all frequencies A -5.22** 5 < 0.005
AEPC all frequencies B -4.11 5 0.05
AEPC
frequencies < 1500 Hz A
-6.72** 5 < 0.005
AEPC
frequencies < 1500 Hz B
-4.72** 5 < 0.01
AEPC
frequencies >1500 Hz A
-1.96 5 0.11
AEPC
frequencies >1500 Hz B
-1.18 5 0.29
In the absence of a significant difference in SRM between the clinical
program and the best research program, comparison was made between
‘BKB in noise’ when noise was presented from either side (± 90° left and
right) with ‘BKB in noise’ when noise was presented from the front . A paired
t-test (with Bonferroni correction) while including and excluding participant (5)
was used in the analyses (see Table 9.8 for results with all programs). With
the exclusion of participant (5 with severe unilateral cochlear ossification)
there was a significant difference between ‘BKB in noise’ when noise was
Page 296 of 393
presented from front and ‘BKB in noise’ when noise was presented from
either side (± 90° left and right) with research program A. This was also true
with the inclusion of participant (5) with noise presented from the left. Results
with the clinical program were slightly inconsistent; there was a significant
difference between ‘BKB in noise’ when noise was presented from the right
only compared with ‘BKB in noise’ when noise was presented from the front
with the exclusion of participant (5). There was also a significant difference
between ‘BKB in noise’ when noise was presented from the left only
compared with ‘BKB in noise’ when noise was presented from the front with
the inclusion of participant (5). Among all three programs spatial separation
between speech and noise consistently (for the same participants) improved
speech perception with research program A only.
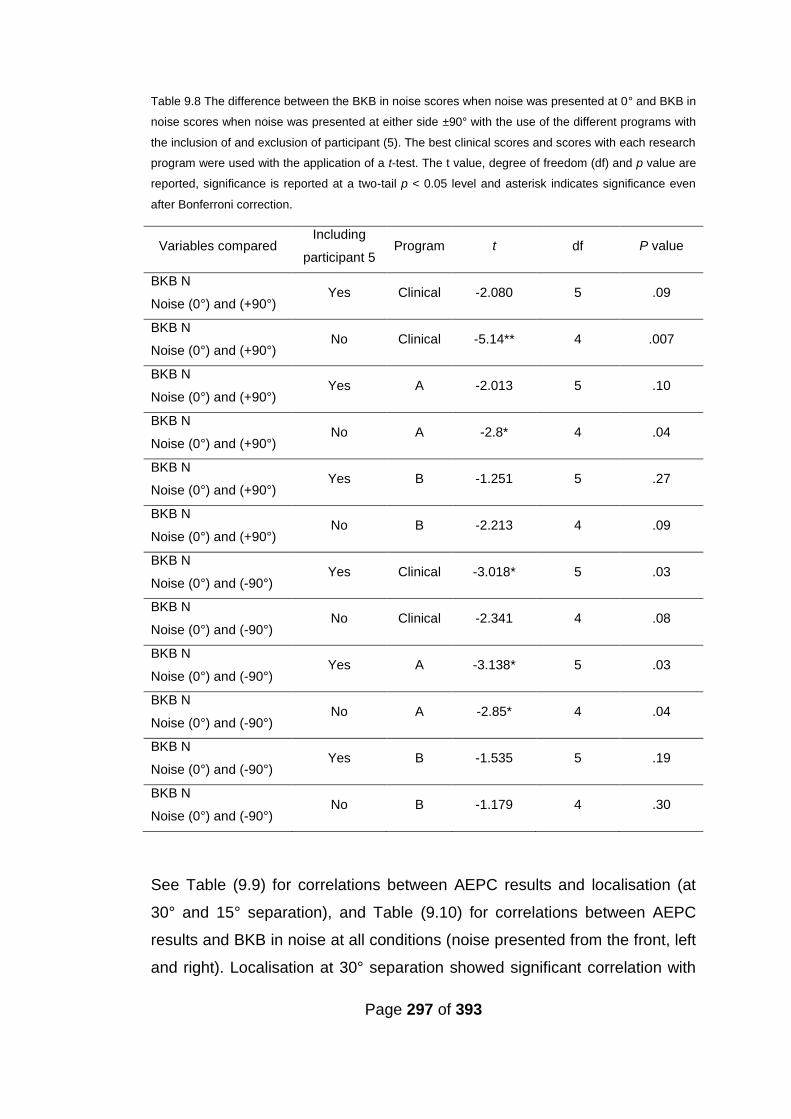
Page 297 of 393
Table 9.8 The difference between the BKB in noise scores when noise was presented at 0° and BKB in
noise scores when noise was presented at either side ±90° with the use of the different programs with
the inclusion of and exclusion of participant (5). The best clinical scores and scores with each research
program were used with the application of a t-test. The t value, degree of freedom (df) and p value are
reported, significance is reported at a two-tail p < 0.05 level and asterisk indicates significance even
after Bonferroni correction.
Variables compared Including
participant 5 Program t df P value
BKB N
Noise (0°) and (+90°) Yes Clinical -2.080 5 .09
BKB N
Noise (0°) and (+90°) No Clinical -5.14** 4 .007
BKB N
Noise (0°) and (+90°) Yes A -2.013 5 .10
BKB N
Noise (0°) and (+90°) No A -2.8* 4 .04
BKB N
Noise (0°) and (+90°) Yes B -1.251 5 .27
BKB N
Noise (0°) and (+90°) No B -2.213 4 .09
BKB N
Noise (0°) and (-90°) Yes Clinical -3.018* 5 .03
BKB N
Noise (0°) and (-90°) No Clinical -2.341 4 .08
BKB N
Noise (0°) and (-90°) Yes A -3.138* 5 .03
BKB N
Noise (0°) and (-90°) No A -2.85* 4 .04
BKB N
Noise (0°) and (-90°) Yes B -1.535 5 .19
BKB N
Noise (0°) and (-90°) No B -1.179 4 .30
See Table (9.9) for correlations between AEPC results and localisation (at
30° and 15° separation), and Table (9.10) for correlations between AEPC
results and BKB in noise at all conditions (noise presented from the front, left
and right). Localisation at 30° separation showed significant correlation with
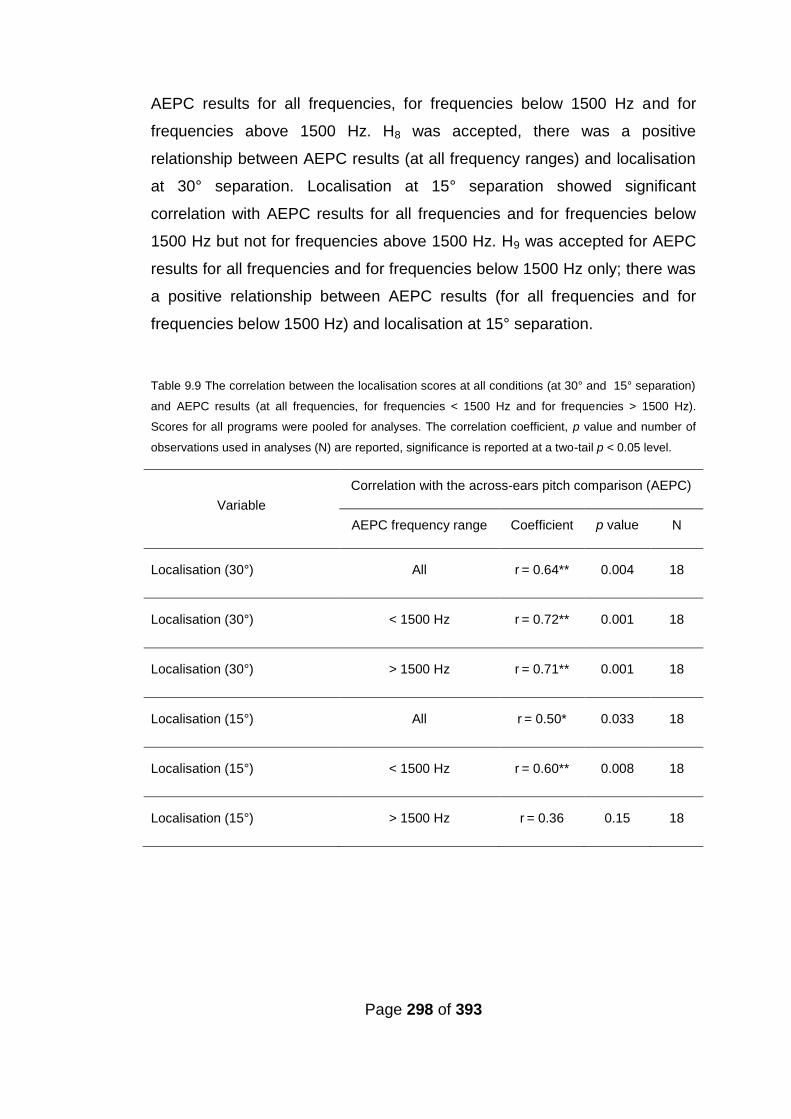
Page 298 of 393
AEPC results for all frequencies, for frequencies below 1500 Hz and for
frequencies above 1500 Hz. H8 was accepted, there was a positive
relationship between AEPC results (at all frequency ranges) and localisation
at 30° separation. Localisation at 15° separation showed significant
correlation with AEPC results for all frequencies and for frequencies below
1500 Hz but not for frequencies above 1500 Hz. H9 was accepted for AEPC
results for all frequencies and for frequencies below 1500 Hz only; there was
a positive relationship between AEPC results (for all frequencies and for
frequencies below 1500 Hz) and localisation at 15° separation.
Table 9.9 The correlation between the localisation scores at all conditions (at 30° and 15° separation)
and AEPC results (at all frequencies, for frequencies < 1500 Hz and for frequencies > 1500 Hz).
Scores for all programs were pooled for analyses. The correlation coefficient, p value and number of
observations used in analyses (N) are reported, significance is reported at a two-tail p < 0.05 level.
Variable
Correlation with the across-ears pitch comparison (AEPC)
AEPC frequency range Coefficient p value N
Localisation (30°) All r = 0.64** 0.004 18
Localisation (30°) < 1500 Hz r = 0.72** 0.001 18
Localisation (30°) > 1500 Hz r = 0.71** 0.001 18
Localisation (15°) All r = 0.50* 0.033 18
Localisation (15°) < 1500 Hz r = 0.60** 0.008 18
Localisation (15°) > 1500 Hz r = 0.36 0.15 18

Page 299 of 393
Table 9.10 The correlation between the BKB in noise scores at all conditions (when noise was
presented at 0° and when noise was presented at either side ±90°) and AEPC results (at all
frequencies, for frequencies < 1500 Hz and for frequencies > 1500 Hz). Scores for all programs were
pooled for analyses. The correlation coefficient, p value and number of observations used in analyses
(N) are reported, significance is reported at a two-tail p < 0.05 level.
Variable
Correlation with the across-ears pitch comparison (AEPC)
AEPC frequency range Coefficient p value N
BKB N (0°) All R2 = 0.16 0.52 18
BKB N (0°) < 1500 Hz R2 = 0.33 0.19 18
BKB N (0°) > 1500 Hz R2 = -0.01 0.96 18
BKB N (+90°) All R2 = 0.18 0.48 18
BKB N (+90°) < 1500 Hz R2 = 0.25 0.32 18
BKB N (+90°) > 1500 Hz R2 = 0.16 0.51 18
BKB N (-90°) All R2 = 0.11 0.66 18
BKB N (-90°) < 1500 Hz R2 = 0.19 0.45 18
BKB N (-90°) > 1500 Hz R2 = -0.01 0.97 18
Both research programs results (CRM, SRM, BKB in noise at all conditions,
localisation (at 30° and 15° separation) and AEPC) were compared, see
Table (9.11) for results. There was no significant difference between
research programs A and B except in AEPC and CRM.
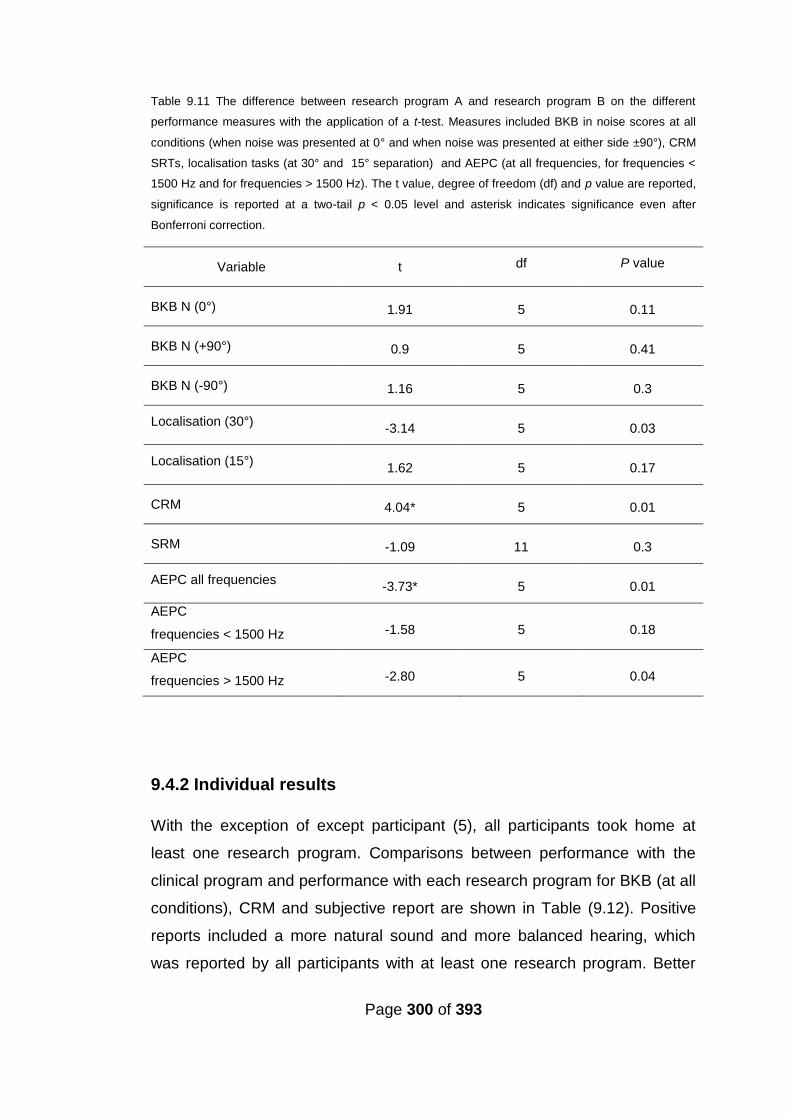
Page 300 of 393
Table 9.11 The difference between research program A and research program B on the different
performance measures with the application of a t-test. Measures included BKB in noise scores at all
conditions (when noise was presented at 0° and when noise was presented at either side ±90°), CRM
SRTs, localisation tasks (at 30° and 15° separation) and AEPC (at all frequencies, for frequencies <
1500 Hz and for frequencies > 1500 Hz). The t value, degree of freedom (df) and p value are reported,
significance is reported at a two-tail p < 0.05 level and asterisk indicates significance even after
Bonferroni correction.
Variable t df P value
BKB N (0°) 1.91 5 0.11
BKB N (+90°) 0.9 5 0.41
BKB N (-90°) 1.16 5 0.3
Localisation (30°) -3.14 5 0.03
Localisation (15°) 1.62 5 0.17
CRM 4.04* 5 0.01
SRM -1.09 11 0.3
AEPC all frequencies -3.73* 5 0.01
AEPC
frequencies < 1500 Hz -1.58 5 0.18
AEPC
frequencies > 1500 Hz -2.80 5 0.04
9.4.2 Individual results
With the exception of except participant (5), all participants took home at
least one research program. Comparisons between performance with the
clinical program and performance with each research program for BKB (at all
conditions), CRM and subjective report are shown in Table (9.12). Positive
reports included a more natural sound and more balanced hearing, which
was reported by all participants with at least one research program. Better
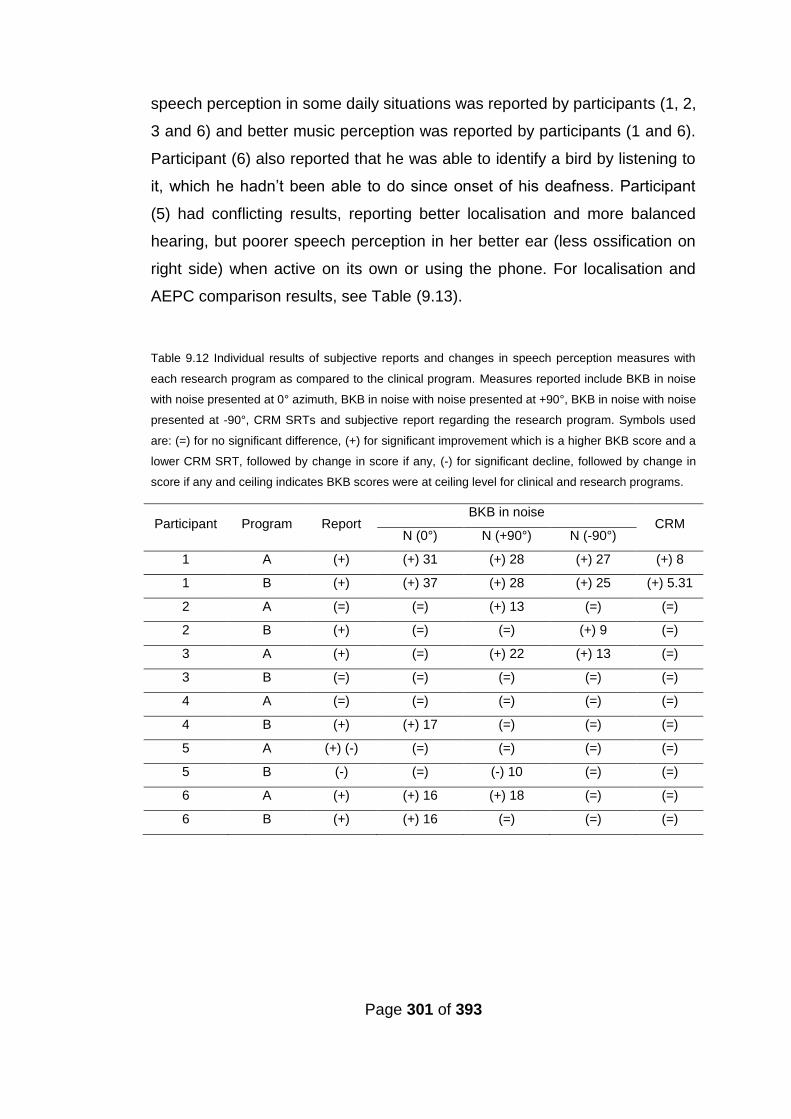
Page 301 of 393
speech perception in some daily situations was reported by participants (1, 2,
3 and 6) and better music perception was reported by participants (1 and 6).
Participant (6) also reported that he was able to identify a bird by listening to
it, which he hadn’t been able to do since onset of his deafness. Participant
(5) had conflicting results, reporting better localisation and more balanced
hearing, but poorer speech perception in her better ear (less ossification on
right side) when active on its own or using the phone. For localisation and
AEPC comparison results, see Table (9.13).
Table 9.12 Individual results of subjective reports and changes in speech perception measures with
each research program as compared to the clinical program. Measures reported include BKB in noise
with noise presented at 0° azimuth, BKB in noise with noise presented at +90°, BKB in noise with noise
presented at -90°, CRM SRTs and subjective report regarding the research program. Symbols used
are: (=) for no significant difference, (+) for significant improvement which is a higher BKB score and a
lower CRM SRT, followed by change in score if any, (-) for significant decline, followed by change in
score if any and ceiling indicates BKB scores were at ceiling level for clinical and research programs.
Participant Program Report BKB in noise
CRM N (0°) N (+90°) N (-90°)
1 A (+) (+) 31 (+) 28 (+) 27 (+) 8
1 B (+) (+) 37 (+) 28 (+) 25 (+) 5.31
2 A (=) (=) (+) 13 (=) (=)
2 B (+) (=) (=) (+) 9 (=)
3 A (+) (=) (+) 22 (+) 13 (=)
3 B (=) (=) (=) (=) (=)
4 A (=) (=) (=) (=) (=)
4 B (+) (+) 17 (=) (=) (=)
5 A (+) (-) (=) (=) (=) (=)
5 B (-) (=) (-) 10 (=) (=)
6 A (+) (+) 16 (+) 18 (=) (=)
6 B (+) (+) 16 (=) (=) (=)

Page 302 of 393
Table 9.13 Individual results of localisation tasks (at 30° and 15° separation) and AEPC (at all
frequencies, for frequencies < 1500 Hz and for frequencies > 1500 Hz). Symbols used are: (=) for no
difference, (+) for improvement followed by change in score if any, (-) for decline followed by change in
score and ceiling indicates scores were at ceiling level for the clinical and research programs.
Participant Program Localisation AEPC
30° 15° All frequencies < 1500 Hz > 1500 Hz
1 A (+) 31.67 (+) 3.33 (+) 67 (+) 60 (+) 75
1 B (+) 18.33 (+) 16.67 (+) 44 (+) 60 (+) 25
2 A (+) 6.67 (+) 3.33 (+) 33 (+) 60 (+) 40
2 B (+) 3.33 (+) 6.67 (+) 22 (+) 60 (=) 0
3 A (+) 46.82 (+) 6.67 (+) 34 (+) 80 (+) 35
3 B (+) 13.49 (+) 6.67 (+) 23 (+) 40 (=) 0
4 A (+) 6.66 (+) 20 (+) 22 (+) 20 (+) 30
4 B (-) 6.67 (+) 20 (+) 11 (+) 20 (=) 0
5 A (+) 18.33 (+) 23.33 (+) 67 (+) 60 (+) 55
5 B (+) 15 (+) 16.67 (+) 22 (+) 20 (=) 0
6 A (+) 10
Ceiling (+) 23.33 (+) 80 (+) 80 (+) 20
6 B (+) 3.33
Ceiling (+) 20 (+) 60 (+) 80 (=) 0
Page 303 of 393
9.5 Discussion
The group data revealed that improvements in BKB in noise did not reach
significance when both speech and noise were presented from the front (at
0°azimuth) with any research program. However individual results showed
significant improvements in BKB in noise when both speech and noise were
presented from the front (at 0°azimuth) for three participants (1, 4 and 6) with
at least one research program. Research programs may have particularly
improved matching between their devices. Two of those participants (1 and
6) not only improved in the AEPC at frequencies lower than 1500 Hz, but
also improved in the AEPC at higher frequencies (ranging from 1500 Hz -
5588 Hz) from a score of 0% with their clinical programs, possibly indicating
that those two subjects had particularly non-matched clinical programs.
Participant (4) was the only participant with two different devices, with a
different frequency table in each of his original clinical programs, but was
provided with identical frequency tables in both devices in his research
programs. These results are also consistent with previous studies reporting
inconsistent improvement in bilateral CIs versus unilateral CI when both
speech and noise were presented from the front (at 0°azimuth) (Schleich et
al., 2004; Ramsden et al., 2005; Eapen et al., 2009 and Wackym et al., 2007;
Laszig et al.,2004; Litovsky et al., 2006) which could be due to various
degrees of binaural summation. The “binaural summation” effect usually
occurs in NH due to redundant information from both ears and it causes
improvement in speech perception in quiet and in noise even when both
(speech and noise) are presented from the same direction. Binaural
summation requires the integration of the input from both ears (e.g. Wilson et
al., 2003). If the signal from both implants is greatly mismatched, this may
impede binaural summation because of the lack of redundant information
and the lack of integration between information across ears.
Improvement in BKB scores when both speech and noise were presented
from the front is usually associated with improved binaural summation (e.g.
Page 304 of 393
Wilson et al., 2003). To this end, the improvement in these three participants
was especially encouraging because it may provide evidence for the
possibility of improving binaural summation by improving pitch-matching
across implants. Further support to improved binaural summation, rather
than simply a general improvement in speech perception, is provided by the
absence of improved BKB in noise when noise was presented to either side,
with some programs providing benefit with noise presented to the front
[participants (4 and 6)]. It should be noted that one of those participants
underwent pitch matching tests, although he had different devices and
different strategies. This may indicate that pitch-matching is still beneficial
even with different CI devices. Significant change which was improvement
occurred in BKB scores with noise presented from the front for 50% of the
test population with the use of at least one research program. Group results
also demonstrated that significant change which was improvement occurred
in BKB scores with noise presented from either side with the use of at least
one research program. Group BKB results showed significant improvements
with the best research program in comparison to the best BKB score with the
clinical program when noise was presented on either side with the exclusion
of participant (5). Participant (5) had meningitis and unilateral severe
ossification in the cochlea. This may also explain the conflicting reports of
improved balanced hearing and localization, which were verified in her
localisation results, but negative report of worst speech perception with her
better ear (alone) after matching it with the weaker ear. The weaker ear had
a larger number of non-tonotopic electrodes than the stronger ear, possibly
due to altered current spread or cross-turn stimulation secondary to
ossification. However, in order to match the frequency table between her
devices, an equal number of electrodes were deactivated in both devices. In
addition, in Chapters 7 and 8 it was demonstrated that ED may not always
indicate problematic electrodes in cases of cochlear ossification. The
improvement with the research program when noise was presented from
either side may indicate improved speech perception because of better
selection of active electrodes, as demonstrated by (Zhou and Pfingst, 2012).
Page 305 of 393
Another reason could be due to better frequency-matching between ears,
which might have improved the use of ITD cues, when noise is presented
from the side speech and noise have different ITDs. Localisation and AEPC
results may shed some light on the matter; significant improvement was
found in localisation and AEPC especially at frequencies below 1500 Hz with
the use of the research programs. Localisation was significantly better with
the research program (A) based on direct-stimulation than with the clinical
program, for both 30° and 15° separation. There was also significant
improvement in localisation at 15°, but not at 30°, separation with research
program B compared to the clinical program. The significantly better AEPC
scores (across the frequency range) observed with the use of program A in
comparison to program B suggest that better frequency-matching provided
by the research programs is a plausible explanation for the observed
improvement in localisation skills, hence the significantly better localisation
results provided by program A as compared to program B. In addition to that,
when compared to the clinical program, AEPC was significantly better across
the frequency range with program A and not with program B (after applying
Bonferroni correction) as was localisation at 30° separation. So better
frequency matching and better localisation were accomplished with program
A compared to program B.
Supporting evidence for better frequency-matching giving rise to better
localisation is also provided by the correlation results between localisation
and AEPC results. There was significant strong to very strong positive
correlation between localisation (at 30° and 15 ° separation) and AEPC
results across the frequency range and at frequencies below 1500Hz and
between localisation (at 30° separation) and AEPC results at frequencies
higher than 1500Hz. These findings highlight that matching the bilateral CIs
for pitch in the research programs especially based on direct stimulation has
improved matching between CIs as measured via AEPC especially at
frequencies below 1500 Hz. This consequentially improved localisation and
speech perception in noise (especially with noise presented on either side).
Page 306 of 393
There was also a significant improvement in AEPC results with both research
programs compared to the clinical program at frequencies below 1500 Hz,
but not at the higher frequency range. This may indicate that CI users find
matching electrodes at higher frequencies more difficult than lower
frequencies, which corresponds to reports of difficulty in matching pitch
arising from different sound quality across their ears – the latter is more-often
reported for high-frequency sounds. In addition to that, this finding has to be
considered in the light of improved localisation skills with the research
programs, and the association pattern between localisation (at 30° and 15°
separation) and the AEPC results. Where association was found between
localisation (at 30° and 15° separation) and the AEPC at all frequency
ranges except between localisation (15° separation) and AEPC at higher
frequencies, these findings may further suggest that improving frequency
matching at lower frequencies for this population provided the better
localisation skills.
The detection and utilisation of interaural differences (ILDs and ITDs)
requires that signals delivered to both ears should have similar frequencies;
different frequencies would negatively impact ILDs and ITDs (Colburn et al.,
2006; Francart and Wouters, 2007; Nuetzel and Hafter, 1981). Improving
frequency matching between the ears might therefore lead to improved
interaural perception, improving localisation and speech perception with
noise presented to either side. Relatively-high sensitivity for ILDs amongst CI
recipients’ has been reported (e.g. Lawson et al., 1998 and 2000; van Hoesel
and Tyler, 2003; van Hoesel, 2004; Laback et al., 2004 and Seeber and
Fastl, 2007), whilst sensitivity for ITDs is often reported to be highly variable
(van Hoesel et al., 1993; van Hoesel and Clark, 1997; Lawson et al., 2000;
van Hoesel and Tayler 2003 and van Hoesel, 2004). Lawson et al., (2000)
demonstrated that the detection of ITDs and ILDs can be improved with the
use of three electrode-pairs that were matched across-ears.

Page 307 of 393
According to the duplex theory of binaural hearing (Rayleigh, 1907; Stevens
and Newman, 1936), ITD cues are mainly used for localisation at frequencies
lower than 1500 Hz while ILD cues are used at higher frequencies. Evidence
from the current study suggests that better matching of frequencies lower
than 1500 Hz might provide for the improvement observed in localisation,
possibly indicating improved detection of ITDs. Nevertheless, despite the
limited ILD cues available at frequencies lower than 1 kHz (e.g. Shaw, 1974),
it has to be noted that ILD cues were found to be dominant over ITD cues
among CI users (e.g. Poon, 2006; Grantham et al., 2008; van Hoesel et al.,
2008 and Seeber and Fastl, 2008). A possible explanation for the observed
improvement in localisation performance is provided by van Hoesel (2007),
who proposed that electrode interactions affect sensitivity to ITDs and.
consistent with this idea, the reduction of unwanted channel-interaction by
employing electrodes with high differentiation only in the research programs
may have positively affected ITD sensitivity.
The presence of a significant relationship between the AEPC and localisation
performance, which was not found between BKB in noise scores and AEPC,
might arise because the AEPC test (at the nine test frequencies) was not
sensitive enough to reflect ‘BKB in noise’ demand for frequency matching at
a higher resolution. It may also indicate that some processes underlying
binaural hearing for localisation and speech perception might be different.
This is line with Kerber and Seeber (2012), who reported no correlation
between localisation and speech perception amongst bilateral CI users.
However, the significant improvement in speech perception when noise was
presented from either side, along with the significant improvement for three
participants when both speech and noise were presented from the front, may
indicate a positive effect of improved frequency-matching across ears. This
finding is consistent with simulation studies evaluating the effect of
frequency-mismatch between ears (Siciliano et al., 2010).
Page 308 of 393
There was no statistically-significant difference in SRM between either
research programs and the clinical program, but this could be due to the
limited number of participants, or because BKB scores reached ceiling and
thus masked any SRM effect. However, there was a statistically-significant
difference between BKB scores when noise was presented on either side in
comparison to BKB in noise when noise was presented from the front with
program A when participant (5) was excluded from the analyses. In contrast,
there was a significant difference between BKB scores when noise was
presented on the right side only, compared to BKB in noise when noise was
presented from the front with the use of the clinical program, again with the
exclusion of participant (5). This may reflect better SRM when using program
A as compared to the clinical program, and is in concordance with subjective
reports of a more balanced sound provided by the research program. It
should be noted, however, that the relatively, small number of participants
could also be the reason that no significant improvement was found in CRM.
Individual results revealed that all participants with the exclusion of
participant (5) showed improvement in at least one performance measure
with the use of the research programs, and none demonstrated a decline in
performance. Although program A provided significantly better CRM,
localisation (at 30° separation), and AEPC scores across the frequency
range, and at frequencies greater than 1500 Hz, the pattern of improvements
was not identical across participants. Program B provided participant (4) with
better performance than program A. Additionally, participant (4) – the only
participant with a different device in each ear - preferred program B,
suggesting that auditory pure-tone matching might be more suitable for
bilaterally-implanted participants with different devices.
With the exception of participant (5) – who had severe post-meningitic
ossification in the worst ear – no subject showed a decline in performance on
any metric with either of the research programs. Matching between devices
with a significantly weaker ear might be contra-indicated but another
Page 309 of 393
possibility could be that ossification in this subject has impacted on electrode
testing, due to abnormal spread of current in the affected ear.
The main findings of this study are in line with simulation studies
emphasizing the importance of frequency-matching across the ears (Siciliano
et al., 2010). It may also explain why some studies (e.g. Mosnier et al., 2008)
found that no pre-implantation factors can predict performance with
simultaneous bilateral CI. In the absence of direct measures of ITD and ILD
sensitivity, it is difficult to reach conclusions about the effect of matching
frequencies on either binaural cue. However, it is most likely that matching
frequencies across ears has improved use of inter-aural differences.
Considering the effect that limited temporal fine structures provided by the
implants on ITD (e.g. van Hoesel and Tyler, 2002) and that ITDs can be
conveyed by temporal envelopes instead (e.g. Grantham et al., 2008). If
improving frequency-matching across ears can within the limitation of sound
processing improve the detection of ITD, this may have future clinical
implications.
The lack of any measures of SRM due to ceiling BKB scores with some
participants (who showed improvement), could not be avoided since the BKB
scores with the initial SNR levels had to be available for comparison, and
because extra testing with different SNR levels would have meant having to
use repeated BKB sentences, potentially compromising results of the study.
9.6 Conclusion
Results from this study are encouraging; frequency matching across the two
devices might be utilised to improve performance with bilateral CI.
Determining the best method for matching and programming based on the
matching process requires further investigation. Improvements in localisation
with all research programs were more evident than were improvements in

Page 310 of 393
speech perception, suggesting that some processes underlying binaural
hearing for localisation and speech perception might be different.
Additionally, the strong to very strong correlation between localisation results
(at both 30° and 15°) and the screening AEPC results, which was not
replicated between BKB scores and AEPC, may indicate that binaural
speech perception requires frequency matching at a higher resolution than
that required for localisation. Nonetheless a statistically-significant
improvement in speech perception was evident in this study with the use of
the research programs.
9.7 Summary
Frequency-matching between CI devices improved localisation and
speech perception among bilaterally implanted individuals.
Although preliminary results indicated that using direct stimulation in
matching produced better results except in the case of mismatched
devices, it is still not clear which is the best method for matching.
Deactivation of the non-tonotopic electrodes as identified by the two
methods described in the study did not produce any decline in
performance except for participant (5) with program B. A significantly
worst ear might be a contra-indication for matching between devices.
Page 311 of 393
Chapter 10
Summary and General Discussion
The thesis aimed to improve fitting of the CI device in order to improve
performance with CI among both the unilaterally and bilaterally implanted.
Great variability in the performance level is demonstrated by the CI
recipients, highlighting the need to find possible underlying causes for poorer
performance and to address those causes. Pitch perception was used to
guide re-programming of the CI device. Among the unilateral CI recipients,
ED was evaluated with the clinically-viable pure-tone pitch ranking task
(PTED) to uncover problematic indiscriminable electrodes and
reprogramming of the CI was provided accordingly. Indiscriminable
electrodes were deactivated and the effect of the research programs was
evaluated. Further pitch ranking testing (PTIF) was conducted at different
regions of good and poor ED before and after the deactivation of electrodes
with poor ED. Results were correlated with the change in performance
following the deactivation of electrodes with poor ED. Pitch matching
between the two CI devices was conducted based on two methods, direct
stimulation and auditory pure-tone stimulation. Results from each method
were used to provide the bilaterally implanted with a research program. The
efficacy of each research program was evaluated with the use of speech
perception, localisation and the AEPC test. Findings not only provided
information regarding the effectiveness of the research programs but they
may also be used to provide information regarding factors affecting
performance with CI. Imaging of the placement of the CI array in the cochlea
provided further insight into factors affecting performance. This chapter
provides a summary of the main findings followed by discussion of the key
findings and their implications.

Page 312 of 393
10.1 Summary of main findings
10.1.1 Findings reported in Chapter 3
PTED and DED results were highly correlated indicating good validity.
The PTED procedure had good test-retest reliability.
Time and equipment requirements for PTED deemed it clinically
viable
10.1.2 Findings reported in Chapter 4
CRM SRTs showed good test-retest reliability.
CRM SRTs were lower and showed a higher within-subject variability
for NH compared to CI participants.
The minimum significant change (at p< 0.05) for testing an individual
in two conditions for CRM SRTs, was > 4dB, and > 6 dB for CI and
NH participants respectively.
10.1.3 Findings reported in Chapter 5
CI performance on speech perception measures was better in quiet
than in noise.
The percentage of discriminable electrodes was strongly correlated
with speech perception measures (BKB in quiet, BKB in noise and
CRM) especially in noise.
Speech perception with CI required a larger proportion of
discriminable electrodes at frequencies lower than 2600 Hz than at
higher frequencies.
The percentage of discriminable electrodes especially at frequencies
below 1000Hz was the main predictor of CI performance as measured
by BKB in quiet and in noise and CRM.
Page 313 of 393
10.1.4 Findings reported in Chapter 6
The angular depth of insertion of the electrode array was strongly
correlated with speech perception measures in quiet and in noise and
PTED revealed no signs of increased insertion trauma with deeper
insertion of CI electrode array.
There was a statistically significant relationship between the frequency
shift (difference between the estimated characteristic frequency and
assigned frequency in the CI program) of the most apical active
electrode and BKB in noise but not BKB in quiet.
The CBCT provided high quality images that allowed judgement
regarding scalar placement of the individual electrodes of the CI
electrode array. There was no relationship between scalar placement
in scala tympani versus scala vestibuli and speech perception and
PTED identified dead regions at interscalar cross-over points.
10.1.5 Findings reported in Chapter 7
The deactivation of indiscriminable electrodes can improve
performance with CI especially if the indiscriminable electrodes fell in
the frequency region below 2600 Hz. However this was not true for CI
recipients with cochlear pathology (such as fibrosis, ossification and
calcification) or electrode array placement issues.
Some participants reported improvement in sound quality after the
deactivation of indiscriminable electrodes without evidence of change
in performance, most of which had ceiling BKB scores in both quiet
and noise.
The positive impact of the deactivation of indiscriminable electrodes
was not device specific nor was it specific to certain strategies, most
likely indicating a common underlying cause for those electrodes
being indiscriminable.
Page 314 of 393
10.1.6 Findings reported in Chapter 8
Pure-tone intermediate frequency (PTIF) testing revealed that
participants showing improvement following the deactivation of
indiscriminable electrodes (in Chapter 7) had reduced ability to rank
pitch correctly in regions of indiscriminable electrodes as compared to
regions of discriminable electrodes. This pattern was not replicated in
participants who did not show improvement following the deactivation
of indiscriminable electrodes.
PTIF of regions of indiscriminable electrodes following deactivation
revealed that participants showing benefit had improved pitch ranking
in those regions following deactivation as compared to before
deactivation.
Using PTIF results for re-programming improved performance when
PTED and PTIF had conflicting results; i.e. an indiscriminable
electrode-pair had an equal number of intermediate frequencies (IF) to
the control discriminable electrode-pair. When only indiscriminable
electrodes with a smaller number of IF were deactivated, performance
was better than when all indiscriminable electrodes were deactivated
and better than the clinical pre-deactivation program.
PTIF results of regions of indiscriminable electrodes following
deactivation correlated with post-deactivation change in performance.
10.1.7 Findings reported in Chapter 9
Matching the two devices for pitch and loudness in bilaterally
implanted individuals had a statistically significant positive impact on
localisation (at 30° and at 15° of separation) and speech perception
with noise presented at either side (± 90°). Only three out of six
participants showed improvement in speech perception with both
speech and noise presented at the front (at 0°).
Page 315 of 393
The AEPC test revealed that devices were significantly better
matched across the frequency range especially at frequencies below
1500 Hz.
Localisation at 30° and at 15° of separation was statistically
significantly associated with AEPC results. However, no significant
association was found between AEPC and BKB in noise.
10.2 Summary of new findings
The newly described PTED test is a valid, reliable and clinically viable
test.
The minimum significant change for testing an individual in two
conditions for CRM SRTs, was > 4dBA, and > 6 dBA for CI and NH
participants respectively.
The percentage of discriminable electrodes especially at frequencies
below 1000Hz was the main predictor of CI performance as measured
by BKB in quiet and in noise and CRM. The presence of radiologically
confirmed pathology was also a predictor of CI performance.
There was a positive significant relationship between the frequency
shift of the most apical active electrode and scores for BKB in noise
but not BKB in quiet.
The CBCT provided high quality images that allowed judgement
regarding scalar placement of the individual electrodes of the CI
electrode array in the majority of instances. Scalar placement in scala
tympani versus scala vestibuli did not affect speech perception or ED.
PTED identified regions at interscalar cross-over points.
The deactivation of indiscriminable electrodes identified by PTED
improved performance (speech perception and/or sound quality) for CI
recipients excluding those with cochlear pathology (such as fibrosis,
ossification and calcification) or electrode array placement issues.
This was not specific to a certain manufacturer or processing strategy.
Page 316 of 393
The apical indiscriminable electrodes were more detrimental to
speech perception than basal electrodes.
PTIF testing revealed that participants showing post deactivation (of
indiscriminable electrodes) improvement had less discriminable
intermediate frequencies (DIF) in regions of indiscriminable electrodes
as compared to regions of discriminable electrodes. This pattern was
not replicated in participants who did not show post deactivation
improvement.
PTIF revealed that participants showing benefit had a larger number
of DIF regions of indiscriminable electrodes following deactivation as
compared to before deactivation.
PTIF results can guide CI re-programming which improved
performance when PTED and PTIF had conflicting results.
PTIF results of regions of indiscriminable electrodes following
deactivation correlated with post-deactivation change in performance.
Based on results from the CBCT, PTED and PTIF, indiscriminable
electrodes can be categorised to 1) indiscriminable electrodes
stimulating dead regions, 2) indiscriminable electrodes at interscalar
crossover points and 3) indiscriminable electrodes stimulating non-
dead regions either due to cochlear pathology altering the current
spread, obvious placement issues or sub-optimally functioning
electrodes.
Matching the two devices for pitch and loudness in bilateral CI
recipients, had a statistically significant positive impact on localisation
(at 30° and at 15° of separation) and speech perception with noise
presented at either side (± 90°). Three out of six participants showed
significant improvement in speech perception with both speech and
noise presented at the front (at 0°).
The AEPC test revealed that devices were significantly better
matched across the frequency range especially at frequencies below
1500 Hz.

Page 317 of 393
Localisation at 30° and at 15° of separation was statistically
significantly associated with AEPC results. However, no significant
association was found between AEPC and BKB in noise.
10.3 General discussion
10.3.1 Identification of problematic electrodes or dead regions
The PTED was found to be a valid test for measuring ED when compared to
the direct stimulation ED test (DED) with strong correlation between the
results of the two methods (PTED and DED). It also showed high reliability
and the potential to be used as a clinical tool due to the ease of testing and
the short time required to conduct the test. Further validation for the PTED
was sought in the experiments presented in Chapter 5, where a strong
association was found between the number of discriminable electrodes as
identified by PTED and the different speech perception measures (BKB in
quiet and in speech-shaped noise and CRM). This finding concurred with
studies that reported better speech perception as the number of perceptually
distinct channels increased (Collins, et al., 1997; Henry et al., 2000; Nelson,
et al., 1995; Friesen et al., 2001). This relationship was stronger with speech
perception measures in noise (rather than quiet), which may have reflected
the increased demand for a higher spectral resolution in order to understand
speech in noise because of the need to pick out the signal from the noise
(e.g. Qin and Oxenham, 2003 and Fu and Nogaki, 2005).
Stronger associations were found between speech perception and the
percentage of discriminable electrodes in the lower frequency range (≤ 2600
Hz) than was observed when correlating higher frequency ED. This pattern
of results was in-keeping with previous studies with CI recipients where a
higher spectral resolution or a larger proportion of channels was necessary in
the lower frequency range for maximal speech perception (Skinner, Holden
and Holden 1995; Henry et al., 2000; Fourakis et al., 2004 and Fourakis et
Page 318 of 393
al., 2007). This strong association between the percentage of discriminable
electrodes at low frequencies and speech perception proved to be the main
significant predictor of various speech perception measures. This provided
further support for the potential future use of PTED as a test for identifying
problematic electrodes and/or dead regions.
In Chapter 6 the PTED was used to identify the inter-scalar cross-over
points, when the electrode array crossed over from scala tympani to scala
vestibuli causing mechanical damage and loss of spiral ganglion (Finley and
Skinner, 2008). The deactivation of problematic electrodes identified with the
PTED led to different levels of improvement for the participants, and the
extent of improvement was found to be associated with the frequency region
in which the electrodes were deactivated. There was a greater impact on
performance when a larger proportion of deactivated electrodes were in the
frequency range < 2600 Hz. This provided further support for the importance
of exploring electrode differentiation in this frequency region and it was
consistent with findings of studies highlighting the importance of that
frequency region for speech perception (e.g. Miller and Nicely, 1955;
Shannon et al., 2001; Skinner et al., 1995; Henry et al., 2000; Fourakis et al.,
2004 and Foukaris et al., 2007).
The pure-tone “intermediate frequencies” (PTIF) pitch ranking test for
specific regions was an adaptation of the PTED procedure intended to
explore the pitch perception between physical electrode contacts. The PTIF
test was conducted between electrodes that were discriminable as well as
those that were not. The participants who showed significant improvement in
at least one speech perception test when electrodes were deactivated were
not able to utilise pitch information in regions of the deactivated
indiscriminable electrodes but were able to utilise pitch information in regions
of discriminable electrodes. Results potentially indicated that PTED identified
underlying dead regions (Moore, 2004 and Shannon et al., 2001) in those
Page 319 of 393
participants that showed benefit following the deactivation of indiscriminable
electrodes. This was not true with those who reported better sound quality
but without significant benefit in speech perception, they were equally able to
utilise pitch information in regions of discriminable and indiscriminable
electrodes (equal number of correctly ranked IF). Indicating the possibility
that PTED may have identified problematic electrodes rather than underlying
dead regions in those participants. For the participants that showed a decline
in performance following the deactivation of indiscriminable electrodes, no
difference was found between their pitch ranking ability in regions of
discriminable versus indiscriminable electrodes. The deactivation of
electrodes stimulating a region with good pitch perception, caused a decline
in performance which is consistent with the idea that de-activating those
electrodes led to decreased spectral resolution (e.g. Shannon et al., 2001;
Henry et al., 2000 and McKay and Henshall, 2002). The only exception was
participant 9 (in Chapter 8) who was able to utilise pitch information in
regions of discriminable electrodes but not in regions of indiscriminable
electrodes and reported that he did not like the sound quality following the
deactivation of indiscriminable electrodes. However PTIF for participant 9
demonstrated perceived pitch reversals following the deactivation of
indiscriminable electrodes, hence giving rise to a distorted spectral
representation which may have been the cause of perceived loss in sound
quality and deterioration in performance. Participant 9 had cochlear
ossification which may have altered the current pathways and increased the
overall spread of current (Rotteveel et al., 2010), increasing spatial
separation between electrodes in that region did not help. PTIF results of
participant showing improvement in Chapter 7, showed that deactivating
indiscriminable electrodes has increased spatial separation in regions of poor
differentiation. Increasing spatial separation between electrodes in those
regions improved their ability to utilise pitch information, which is in line with
previous recommendations of Nelson et al., (1995) and studies (Zwolan et
al., 2007 and Zhou and Pfingst, 2012). Those participants had a larger
number of correctly ranked IF in the regions of indiscriminable electrodes
Page 320 of 393
following their deactivation as compared to before deactivation. Combining
these results with the reduced number of correctly ranked IF in regions of
indiscriminable electrodes is in concordance with studies that indicated that
redirecting the information around dead regions (with reduced number of
DIF) would improve performance (Faulkner, 2006 and Smith and Faulkner,
2006).
PTIF was useful as a tool for identifying electrodes that would potentially lead
to improvements in performance once deactivated potentially because it
aided in the identification of dead regions. It was useful for explaining
different patterns and changes in performance following the deactivation of
indiscriminable electrodes. In addition to that programs based on PTIF’s
identification of dead regions (with reduced ability to utilise pitch information
and a smaller number of correctly ranked IF) when different from PTED’s
nomination of problematic electrodes provided further improvement over
programs based on PTED.
The combined results of the studies described in Chapters 3, 5, 6, 7 and 8
provide evidence that the PTED’s identification of discriminable versus
indiscriminable electrodes provided a picture of the spectral resolution
provided by the CI device. There was evidence that CI provided spectral
resolution of the signal that varied across CI recipients partly because of
underlying dead regions. In some cases PTED’s identified indiscriminable
electrodes that did not uncover dead regions but could be related to the
electrodes’ function however PTIF testing differentiated between electrodes
with versus those without underlying dead regions. PTIF may have a higher
specificity than PTED for the identification of dead regions, however PTIF
requires more testing time if it were to be applied with all electrode-pairs
unless only suspected regions are targeted for testing.
Page 321 of 393
10.3.2 Types of indiscriminable electrodes
Based on results from chapter 6, 7 and 8, it was found that indiscriminable
electrodes fell under one of the following categories:
1. Indiscriminable electrodes that stimulated a neuronal dead region with
few or no functioning spiral ganglion cells.
2. Indiscriminable electrodes around interscalar cross over points which
might be associated with insertion trauma causing mechanical damage.
3. Indiscriminable electrodes secondary to underlying cochlear pathology
(fibrosis, ossification and calcification) that may affect the spread of
current in the cochlea.
4. Indiscriminable electrodes due to surgical placement issues.
5. Indiscriminable electrodes that do not stimulate a dead region without
the presence of obvious cochlear pathological changes that affect the
spread of electrical current stimulation or obvious placement issues.
The deactivation of electrodes that fell under the first category provided CI
recipients with the greatest benefit. Some of the participants showing benefit
following the deactivation of indiscriminable electrodes, had some
indiscriminable electrodes falling under the second category. However due to
the more restricted recruitment criteria (must be musically trained and/or
have a clear concept of pitch) for the PTIF study, those electrode sites were
not evaluated for IFs. The deactivation of indiscriminable electrodes falling
under the third and fourth category did not provide any benefit. Probably
since they do not stimulate a dead region and the participants are able to use
spectral information delivered to those regions, thus deactivating them can
reduce spectral resolution. Electrodes falling under the third category could
be indiscriminable due to the cochlear pathology changing characteristics of
the tissue surrounding the electrodes. These changes affect the electrical
characteristic of that tissue thus affecting the neural excitation patterns
(broader spread of excitation). This in turn may affect the results of ED (i.e.
the electrode fails without an underlying dead region) and the altered spread
Page 322 of 393
of current (of neighbouring electrodes) may produce the negative impact of
deactivating electrodes at those sites. Deactivating electrodes falling under
the fifth category does not provide benefit in speech perception but might
improve subjective sound quality. Possible explanations could include that
these electrodes have increased electrode-neuron distance or are
performing sub-optimally but still provide useful information because the
regions they stimulate are not dead regions.
The deactivation of indiscriminable electrodes stimulating dead regions (with
no or few functioning spiral ganglion cells) provided the greatest
improvement. The most likely explanation is that information delivered to
those regions is lost and redirecting that information to other electrodes
stimulating more viable region improves the delivered signal. The larger the
dead region the greater the benefit, which is line with findings in Chapter 7
where participants who had adjacent electrodes (both failed) deactivated.
Additionally stimulating electrodes in those regions requires that the level of
stimulation be increased so neighbouring more viable regions can be
stimulated, however this might cause distortion due to the unwanted
electrode interaction and overlap of the stimulated neural population by
different electrodes representing different frequency ranges.
10.3.3 Implications regarding performance with unilateral CI
Performance measures such as CRM have highlighted the discrepancy
between speech perception among the NH and CI recipients in Chapter 4,
where the average SRT among NH was -22.91 dBA and was 4.44 dB among
CI recipients. In Chapter 5 the majority (19/20 = 95%) of the CI population
tested had a CRM SRT at a positive SNR (the level of the speech was higher
than the noise). The negative SNR was associated with the introduction of a
loudness cue (Brungart, 2001b) which was not an issue with CI recipient
because CRM SRT most likely fell at a positive SNR, making CRM a
potential testing tool for speech perception with CI.
Page 323 of 393
As described in Section (1.3) and appendix 1, programming the CI speech
processor determines which electrodes are active and which frequency table
will be used. The frequency table determines the frequency range stimulated
by CI and assigns the electrodes to specific frequency ranges. Stimulation
levels, rate of stimulation and other settings optimisation have been explored
(e.g. Vandali et al., 2000, Dawson et al., 1997; Skinner et al., 1995 and
Skinner et al., 1999). However, only a few studies have been conducted to
investigate programming options following the identification of indiscriminable
electrodes or cochlear dead regions in unilaterally and bilaterally implanted
adults (Zwolan et al., 2007 and Zhou and Pfingst, 2012).
In Chapter 7, a study where indiscriminable electrodes (all types of
indiscriminable electrodes in Section 10.3.2) were deactivated was
described. 16 out of the 25 participants showed significant improvement in at
least one speech perception measure and reported better sound quality
following the deactivation of indiscriminable electrodes (type 1 and possibly
type 2 in Section 10.3.2). An additional four participants reported better
sound quality without any significant change in the speech perception
scores. One possible reason for the fact that some people reported
improvements that were not reflected in the speech perception testing scores
could have been due to the materials not being sufficiently sensitive to detect
changes in performance. It could have also been due to the fact that for three
of the four participants the larger proportion of the deactivated electrodes fell
in the high frequency range (>2600Hz), which has been demonstrated to be
less critical for speech perception. Another explanation could be that those
deactivated indiscriminable electrodes type 5 (in Section 10.3.2), where
stimulated regions were not dead regions but rather stimulated by either sub-
optimally functioning electrodes or electrodes with increased electrode-
neuron distance. Participant with indiscriminable electrodes (types 3 and 4 in
Section 10.3.2) did not show benefit or showed decline following the
deactivation of the indiscriminable electrodes.

Page 324 of 393
In Chapter 8, an additional research program was provided for three of the
participants recruited for the PTED study described in Chapter 7. This
program was based on the PTIF results because there was a discrepancy
between the PTED and the PTIF results with respect to the regions indicated
as having poor pitch differentiation for those participants. For the PTIF based
program, only indiscriminable electrodes in regions with a smaller number of
correctly ranked intermediate frequencies, as compared to the control
discriminable electrode-pair, (indiscriminable electrode type 1 in Section
10.3.2) were deactivated. The three participants showed significant
improvement in speech perception even as compared to their performance
with the research programs based on PTED. They all showed significant
improvements in speech perception with the research program based on
PTED compared to the clinical program, this suggested that the PTIF
procedure was a useful enhancement of the PTED to refine the selection of
electrodes to deactivate (indiscriminable electrode type 1 in Section 10.3.2).
The two procedures together highlighted the different types of indiscriminable
electrodes and provided sufficient information to be able to identify regions
for de-activation that would lead to improvements in speech perception. It is
most likely that these were dead regions and were not providing useful
discriminable information or were causing distortion (indiscriminable
electrode type 1 in Section 10.3.2). When these electrodes are deactivated,
the speech information gets re-distributed to other regions with good
discrimination, the benefit obtained was consistent with the findings relating
to Shannon et al.’s (2001) work on the “holes in hearing” (dead regions) and
the simulation studies of Faulkner (2006) and Faulkner and Smith (2006).
Holes in hearing were found to negatively affect speech perception (Shannon
et al., 2001), later Faulkner (2006) and Faulkner and Smith (2006) proposed
that re-distributing speech information around (dead regions) is the optimal
approach for preserving speech information. By deactivating indiscriminable
electrodes that stimulate dead regions (type 1 in Section 10.3.2), information
–otherwise lost- is being redirected around the dead region as recommended
Page 325 of 393
by Faulkner (2006) and Faulkner and Smith (2006). For electrodes that were
indiscriminable but were not stimulating dead regions (types 3 and 5 in
Section 10.3.2) it was proposed that deactivation may not be the best
programming solution, however full exploration of alternative approaches has
not been conducted.
Since the three CI manufacturers allocate the majority of the electrodes to
the lower frequency region with the higher contribution to intelligibility
(indicate in Chapter 5) even after redistribution of the frequency filters
following the deactivation of indiscriminable electrodes, the redistribution of
frequency filters was left on default (in Chapters 7, 8 and 9). When exploring
other programming options for electrodes type (3, 4 and 5 in Section 10.3.2),
the importance of the low frequency region has to be taken in consideration.
The angular depth of insertion was found to be positively associated with
better speech perception (BKB in speech-shaped noise and in quiet) in
Chapter 6. This concurred with previous studies recommending deeper
insertion of the CI electrode array (Blamey et al., 1992, Fu and Shannon,
1999a; Skinner et al., 2002; Hochmair et al., 2003; Baskent and Shannon,
2003 and 2005; Yukawa et al., 2004 and Lazard et al., 2012). Deeper
insertion may lead to better alignment between the electrical stimulation and
the characteristic frequency of the stimulated auditory fibre which could
potentially lead to better speech perception (Fu and Shannon, 1999a and
Rosen et al., 1999). The frequency shift (difference between the
characteristic frequency and the centre frequency allocated) of the apical
electrode was statistically associated with BKB in noise but not with BKB in
quiet. This finding was in line with findings by Whitford et al. (1993) who
provided programs to eliminate the frequency shift and found an effect on
speech perception in noise only. Combined results of the correlation results
of the depth of insertion and that of the frequency shift with speech
perception, indicated that the decreased frequency shift with deeper insertion
Page 326 of 393
of the electrode array is at least partly the reason for better speech
perception with deeper insertion. It must be noted that some research groups
have reported partial adaptation to severe frequency shifts (e.g. Fu and
Shannon, 1999b; McKay and Henshall, 2002 and Sagi et al., 2009). Another
explanation can be offered by examining the results of the two participants
with the lowest speech perception scores (in Chapter 6) who did not have the
largest frequency shift coupled with the results from Chapter 5. ED in
Chapter 5 was found to be a significant predictor of all speech perception
measures. Deep insertions of the CI electrode array are not only associated
with smaller frequency shifts, but also suggest that stimulation will be spread
across a wider neural population covering different spectral regions including
the apical region where spiral ganglion cells are more likely to be preserved
(Blamey et al., 1992). Unlike Gani et al. (2007) and Finley and Skinner
(2008) who reported a negative impact of increased depth of insertion on
speech perception, deeper insertions were not associated with decreased
electrode differentiation of the apical electrodes in the study reported in
Chapter 6. These results along with findings from Chapter 5 (ED a predictor
of speech perception) may indicate that the advantage provided by deeper
insertion might also be due in part to the stimulation of a wider spectral range
down to lower frequencies at the apical part of the cochlea (Hochmair et al.,
2003). In addition to that deeper insertions increase the possibility of
stimulating regions with good neuronal survival which consequentially
improves chances for having regions with good electrode differentiation
which was a significant predictor of speech perception in Chapter 5. It must
be emphasised that the positive effect of deeper insertion on speech
perception reported was in the absence of increased pitch confusion at the
apical electrodes providing evidence for deeper insertion being achieved
without causing insertion trauma. Finley and Skinner (2008) also suggested
that the negative impact of deeper insertion was possibly associated with
over-insertion of shorter electrode arrays leaving the basal turn void of
electrodes.
Page 327 of 393
Another factor to be considered with respect to depth of insertion of the CI
electrode array is the range of stimulated characteristic frequencies covered
by the CI electrodes. The most commonly used human frequency position
map is Greenwood’s frequency position function (Greenwood, 1990). It uses
an equation to estimate the characteristic frequencies along the organ of
Corti (OC) based on percentage length. However there are a few issues
when using Greenwood’s function with CIs, first the path of insertion of the CI
array (e.g. in ST versus SV or presence of kinks) can affect position of the
electrode and the characteristic frequencies stimulated by that electrode,
which may render using length of the electrode array inaccurate (Yukawa et
al., 2004). A second issue is the CI design and nature of the CI stimulation,
Greenwood’s function relies on the use of the length of OC, however CIs
stimulate spiral ganglion cells since the spiral ganglion is shorter than OC,
the estimated characteristic frequencies especially of the more apical
electrodes will be different. An alternative frequency-position map of the
spiral ganglion was proposed by Sridhar et al. (2006) and Stakhovskaya et
al. (2007) which was used in Chapter 6. In this chapter, the angular depth of
insertion was used to estimate the characteristic frequency rather than the
length of the inserted array to avoid the effect of path of insertion influences.
Only the most apical electrode was used to calculate the frequency shift but
there was still an association between the frequency shift estimated in this
way and the BKB in noise score. This might highlight the effect of matching
the stimulated frequency and the characteristic frequency which necessitates
the use of an accurate human frequency position map. Since the results of
the frequency shift reported were based only on the frequency-position map
of the spiral ganglion, no direct comparison with other frequency-position
maps was reported. However the frequency shift would have been larger for
the most apical electrode had the Greenwood map been used as compared
to the spiral ganglion map. Matching stimulated frequencies to the
characteristic frequencies estimated by Greenwood’s map would necessitate
a deeper insertion of the CI electrode array with the increased risk of causing
trauma (e.g. Gani et al., 2007) in comparison to the spiral ganglion map.
Page 328 of 393
Based on the results reported in Chapter 6 to match frequencies (stimulated
and characteristic), it is not advisable to reach an angular depth of insertion
(ADI) > 720° even with the use of the MED-EL CIs with the lowest centre
frequency assigned to the most apical electrode. The participant with an ADI
= 720° and a MED-EL device had a frequency shift of -90 Hz, so based on
the spiral ganglion map it would not have been advisable to have a deeper
insertion unless the filters were allocated to the lower frequencies. While
based on an OC map (such as Greenwood’s map) the angular depth of
insertion of 810° would be the maximum recommended ADI (even for
participants with MED-EL devices) in contrast to 720°. This not only might
increase risk for trauma without benefit but it also may cause stimulation of a
cochlear region without spiral ganglion cells. This would necessitate
increasing the level of stimulation until electric current reaches neighbouring
regions or causes cross-turn stimulation to reach T and M levels. This might
cause confusion and have a negative impact on speech perception.
CBCT was shown to be a radiological tool that provided high quality images
that can be used to evaluate insertion of the CI electrode array with relatively
low radiation exposure. In contrast to Aschendorff et al. (2007) and Finley
and Skinner (2008) scalar placement in ST versus SV did not affect speech
perception. But in the electrode placement study described in Chapter 6
scalar placement was not associated with electrode differentiation, which
may point to insertion trauma associated with SV as the underlying cause of
the reduced speech perception in those studies (Aschendorff et al., 2007 and
Finley and Skinner, 2008). This explanation is supported by the comparable
outcomes in speech perception for both cases of intentional surgical insertion
of the CI array in SV and those of intentional insertion in SV (Berrettini et al.,
2002; Kiefer et al., 2000 and Lin, 2009). However, at points of inter-scalar
cross-overs, evidence of dead regions most probably secondary to insertion
trauma was seen with increased pitch confusion of electrodes in those
regions (electrode pairs failed ED around those regions). The implications of
the radiological evidence concerning CI performance indicate that deeper
Page 329 of 393
insertions of the electrode array in the absence of insertion trauma are
associated with better performance and that scalar placement in the absence
of trauma does not affect CI performance.
10.3.4 Implications regarding performance with bilateral CI
The frequency mismatch between ears has been found to affect speech
perception and cannot be overcome through training and only channels that
were matched provided benefit (Siciliano et al., 2010). A finding which
concurs with reports that some bilaterally implanted individuals could not
integrate between the signals of both implants because of the severe pitch
mismatch and learned to ignore the weaker ear (Ramsden et al., 2005).
Improving matching between the two cochlear implants was attempted in
Chapter 9. The AEPC test revealed that improving matching between ears
for pitch might be possible. AEPC scores (a screening test of how well
matched the two devices were for a fixed set of frequencies that were
independent of the devices’ frequency table) significantly improved following
matching both CIs for pitch with both research programs. There was also
significant improvement in localisation at both 30° and 15° of separation with
at least one research program (that matched the CI devices for pitch).
Further support comes from the correlation results, localisation at both 30°
and 15° of separation were strongly associated to the AEPC results. This
provides a greater plausibility to the explanation that pitch matching between
ears has improved with the use of the research programs, hence giving rise
to the enhanced localisation exhibited.
Significant improvement was also found in ‘BKB in noise’ with noise
presented at either side. Additionally three out of six participants showed
significant improvement in ‘BKB in noise’ with noise presented from the front.
This may indicate that matching CIs for pitch has improved binaural
summation, which occurs due to redundant information provided by both
ears (e.g. Wilson et al., 2003). The improvement in speech perception after
matching both devices suggests that mismatched devices may impede
binaural summation because of the lack of integration between information
Page 330 of 393
provided to both ears. A finding which is in line with findings of Siciliano et
al.’s simulation study (2010) who found that only the channels that were
matched across ears provided benefit in speech perception. Another
interesting finding was the significant correlation between localisation (at
both 15° and 30° separation) and AEPC across the frequency range and at
frequencies lower than 1500 Hz but not between localisation at 15°
separation and AEPC at higher frequencies. Additionally after dividing AEPC
into two frequency ranges, AEPC was significantly better with both research
programs at frequencies lower than 1500 Hz only. Evidence suggests that
improvement in localisation was most likely caused by improvement in
matching between the CI devices at frequencies lower than 1500 Hz which is
interesting considering that ITD cues are mainly used at that frequency
range.
According to the duplex theory (Rayleigh, 1907; Stevens and Newman,
1936), ITD cues are mainly used for localisation at frequencies lower than
1500 Hz while ILD cues are used at higher frequencies. It has also been
found that for the detection and utilisation of interaural differences (ILDs and
ITDs), the signals delivered to both ears must have similar frequencies
(Colburn et al., 2006; Francart and Wouters, 2007; Nuetzel and Hafter,
1981). Among CI users, sensitivity to ILDs is relatively high while sensitivity
to ITDs has been found to be greatly variable (van Hoesel et al., 1993; van
Hoesel and Clark, 1997; Lawson et al., 2000; van Hoesel and Tayler 2003
and Van Hoesel, 2004). Findings of improvement in localisation, ‘BKB in
noise’ and AEPC especially at frequencies lower than 1500H with the
research programs are consistent with Lawson et al., (2000) who
demonstrated that the detection of both ITDs and ILDs improved with the use
of three electrode-pairs that were matched across-ears. It is possible that
improvement could be due to better use of ITD cues that can be conveyed by
temporal envelopes instead of temporal fine structure (e.g. Grantham et al.,
2008). It is also possible that the observed improvement is due to better
utilisation of ILDs since ILD cues can be dominate ITD cues in CI users (e.g.
Page 331 of 393
Poon, 2006; Grantham et al., 2008; van Hoesel et al., 2008 and Seeber and
Fastl, 2008).
There was no significant correlation between BKB results and the results of
the screening AEPC test. The AEPC test (at nine test frequencies only) may
not be sensitive enough to detect the pitch matching at the resolution
required for speech perception in noise. Another explanation is that some of
the processes underlying binaural speech perception with CI may be
different from those underlying binaural localisation. This is consistent with
studies reporting no correlation between speech perception and localisation
among the bilaterally implanted (Kerber and Seeber, 2012).
Matching between CIs did not improve performance for the CI recipient with
unilaterally severe ossification which was the weaker ear. It is not clear
whether this was due to abnormal current spread affecting the electrode
matching process because of ossification or due to matching a significantly
stronger ear with the weaker one and consequently reducing the number of
active electrodes in the better ear. Further investigation is required.
Matching between ears with the use of direct stimulation was reported to be
easier and provided significantly better results than auditory-stimulation. This
was possibly attributed to increased difficulty in matching between tones
across ears because of the different quality of sound each CI device
provides. Differences between the two devices in processing, the varying
degrees of neuronal survival for each ear and the frequency shift (between
the characteristic frequency and stimulated frequency) difference across ears
might have caused this difference in sound quality between ears.
Matching bilateral CIs for pitch can provide benefit in localisation and speech
perception. However it is too early to determine which method of matching
Page 332 of 393
(direct stimulation versus pure-tone) is the best method and to what extent
matching can be accomplished within the boundaries of the current CI
designs. The effect of matching the level of stimulation and that of matching
the pitch of stimulation between the two ears on performance and how they
both may interact is also still not clear.
10.3.4 CI design implications
In view of the positive effects of deeper insertion of the CI electrode array in
the absence of insertion trauma, the evidence provided by the analysis of the
frequency shift and PTED may shed more light on possible specifications of
a favourable electrode array design.
The extent of the effects of the frequency shift (between the characteristic
and stimulated frequencies) for the entire array on speech perception was
not evaluated and only the effects of the frequency shift at the apical
electrode was evaluated. However, results reported in Chapter 6 concurred
with previous results reported by Whitford et al. (1993) who provided
programs with the intention of eliminating the frequency shift at all active
electrodes and only speech perception in noise was improved. This was in
line with the correlation found between the frequency shift of the most apical
active electrode and BKB in noise but not with BKB in quiet (in Chapter 6)
and is supported by Fu and Shannon (1999a) who reported a greater effect
of the frequency shift at the apical electrodes than that at the more basal
electrodes.
The combined evidence provided throughout Chapters 5-8 does not
implicate the frequency shift as the main contributor to the variance observed
in post-implantation performance or as the only reason for the positive
impact of deeper insertion. Another reason for the positive effect of deep
insertion of the CI array discussed in Section 10.2.1 is the wider region
stimulated by the CI from the basal to the apical region, hence increasing the
Page 333 of 393
possibility of stimulating different regions by the CI including those with good
neuronal survival. Since the percentage of discriminable electrodes has been
found as the main significant predictor of CI performance and in light of the
fact that indiscriminable electrodes might be associated with dead regions
increasing the stimulated region along the cochlea might enhance
performance.
It has been demonstrated that redirecting stimulation around dead regions by
the deactivation of electrodes produced benefit in speech perception which
was in line with findings of Faulkner (2006) and Smith and Faulkner (2006).
However this was the only approach that was explored and other
programming or design options may lead to even greater improvements in
performance. Among those possible options that have not been yet explored
include increasing points or sources of stimulation across the array, thus
providing more flexibility and control in programming CIs around dead
regions.
The matching between the two CI devices for pitch might produce
improvement among the bilaterally implanted but is inherently limited by CI
design and stimulation restrictions; i.e. physical contacts of the two devices
might not stimulate similar pitches across ears and cannot be matched.
Although current steering (see Section 1.4.3.3) might in theory increase
possible stimulation sites, programming options available do not allow control
over specific stimulation sites; i.e. matching between virtual channels across
ears is not possible.
In light of the above, an electrode array that allows atraumatic deeper
insertion, is long enough to cover a wider range of cochlear regions and has
a larger number of possible stimulation sites might improve CI performance.
It is outside the scope of this thesis to discuss CI design issues however it is
the opinion of the author that a new CI design which allows a new mode of
Page 334 of 393
stimulation delivery that is not restricted by physical contacts (electrodes)
might have an impact on performance with CI in both the unilaterally and
bilaterally implanted. A new more flexible mode of stimulation may also
support better processing strategies that better represents the sound.
10.4 Limitations of the studies described
One of the limitations of studies involving multiple visits is the time
commitments that cannot be met by young professionals, hence the age
range and average age of the CI recipients was somewhat limited and older
adults dominated the studies’ populations in Chapters 3-9.
Only 13 CI users were recruited for the CRM test-retest study described in
Chapter 4, however the inclusion criteria and testing restrictions (they had to
have been using the program used in testing for a minimum of two months)
increased difficulty for recruiting participants. There were also more females
than males due to the restrictions described above. The NH group were
younger than the CI group this was partially because the younger CI
recipients did not volunteer for testing while the NH were younger in order to
avoid hearing losses secondary to presbycusis, in addition to that the NH
were volunteers from the UCL staff and students.
There were no corresponding objective measures because of time
constraints, especially since non adjacent electrode pairs were tested for ED
in the procedure followed, in addition to that several performance measures
were administered with each program. However this is considered in future
research. Long-term follow up including the effect of adaptation to the new
programs and program use were not included in the studies but is being
considered in the future.
Page 335 of 393
The focus of the work with bilateral implantees was not specifically to look at
the measurement of ITD or ILD however the results indicated that measuring
the effect of matching pitch between ears on ITD and ILD can further
improve our understanding of the underlying processes involved in
localisation and speech perception with bilateral CI. Especially since greater
improvement in AEPC was found at low frequencies (below 1500 Hz) which
is usually associated with the use of ITD cues rather than ILD cues. Only 6
participants were recruited for the bilateral testing due to the limited number
of bilaterally implanted adults available for testing in the UK. The current
NICE (the National Institute for Health and Clinical Excellence) guidance
does not recommend bilateral implantation for adults unless they have visual
impairment or other disabilities so the numbers of potential participants was
very low and most of them were sequentially implanted so the results may be
different to what would be expected with simultaneous implantation.
The BKB sentences were used for testing (2 lists in each condition), because
it was considered to be the most well established test for speech perception
used within the UK. This limited testing options; in order to avoid the
learning effect the same list was never used twice. However since there were
only ten sets (of two lists each), this could not be avoided and the clinical
program was retested in the final session with two sentence lists that were
used in the first session. Additionally the ceiling effect could not be avoided
when improvement occurred; i.e. in order to allow comparison, the same
initial SNR was used across all testing sessions even when scores were
ceiling and additional testing was not possible due to the limited number of
sentence lists. The CRM test was introduced in an attempt to introduce an
additional speech perception measure and minimise the effect of a relatively
small number of BKB lists. But limitations faced in these studies highlighted
the need for different testing material with varying degrees of difficulty in
order to detect differences especially with the use of bilateral CI (e.g.
Wackym et al., 2007).
Page 336 of 393
The characteristic frequency was estimated and the frequency shift was
calculated for the most apical electrode only and not for all electrodes.
Although the effect of the frequency shift on speech perception was not
the main objective, it must be noted that the frequency shift for the other
electrodes is not uniform (non-linear in nature). Other factors that
would’ve been considered include the interaction between the effect of
the frequency shift and effect of stimulating the low frequency range
which is important for speech perception. In Whitford et al.’s study (1993)
only participants with a certain minimum depth of insertion were recruited
to reduce the frequency shift without cutting off the low frequencies vital
for good speech perception.
10.5 Future research
10.5.1 The identification of dead regions and the applied
intervention to improve performance with CI
Future investigation with the use of PTED and PTIF, in addition to other
objective measures and radiological evaluation of the CI array placement in
the cochlea, can help in pinpointing problematic regions or electrodes that
may affect CI performance. Having corresponding objective measures, such
as ECAPs and measures of SOE, can help enhance our understanding of
the underlying processes. It can also allow including populations which are
more difficult to test, such as young children or individuals who may not be
able to rank pitch.
Some of the participants that took part in the research of this thesis have
continued to use at least one of the research programs that they tried in the
study. It would be informative to follow up with these participants and
determine if they liked the programme after a longer period of time. It would
be interesting to assess if their improvements continue to grow or whether
they had stabilised in performance.
Page 337 of 393
Deactivation of electrodes stimulating potential “dead regions” produced
positive results for speech perception. However, other options for
programming around the indiscriminable electrodes should be explored.
These may include adjusting the band-pass cut off frequencies of the filters
to send less information to the dead regions and greater information to
regions with good discrimination or altering frequency to electrode allocation
to better match the electrodes with the appropriate characteristic frequency.
Perhaps with the use of more recent speech processing strategies and more
focussed stimulation, such as partial tripolar stimulation, the impact of the
dead regions could be reduced (e.g. Bierer et al., 2005; Bonham et al., 2005;
Litvak et al., 2007; Zhu et al., 2012). The partial tripolar stimulation can allow
more control over stimulation when reprogramming around dead regions,
especially if coupled with manipulation of the frequency filters in order to
minimise stimulation to dead regions.
The use and development of more sensitive performance measures for
speech perception, questionnaires for the evaluation of objective reports
regarding sound quality and music perception may also be warranted. This
will allow the detection of changes in performance which are not picked up
by measures of speech perception regularly used. Speech perception
measures that use speech in speech masking, for instance, can add an extra
level of difficulty. Long-term evaluations may also provide more insight about
the success of interventions taken.
Other testing options that could evaluate CI recipients with cochlear
pathology must be investigated, since ossification and cochlear pathology
have been observed to affect testing with the PTED for problematic regions.
Possible options might include the use of the more focussed partial tripolar
stimulation, for instance; the PTIF has also been shown to be more effective
than the PTED in identifying dead regions. However, more research is
required.
Page 338 of 393
10.5.2 Improving performance with bilateral CIs
During testing for the study reported in Chapter 9, an unexpected adaptation
process that has not been reported in previous studies was observed by the
author for some of the participants. After which a pilot study was carried out
with five participants, all of whom exhibited the same adaptation with the use
of four different stimuli and settings. The adaptation process was not found in
the NH and seemed to be specific to CI recipients. Further investigation in
order to understand this adaptation process and its’ impact on balancing
across the ears and performance will be explored in depth.
The optimum approach to program bilateral CI requires further research into
the selection of the best electrodes/sites and possibly the best matching
process between the two CI devices, more participants are to be recruited.
Investigation can also address the effect of both pitch and loudness cues on
binaural perception. Greater improvement in AEPC was found at low
frequencies (below 1500 Hz) in addition to that, correlation between
localisation and AEPC was found at that region and not the higher
frequencies. Localisation of frequencies in this region is usually associated
with the use of ITD cues rather than ILD cues, this warrants further
investigation. Future research could also investigate psychophysical
measures that might aid in determining the optimal matching between CIs.
Comparison can be made between individuals with simultaneous implants
versus those with sequential CIs.
Different programming options for matching including strategy selection,
frequency tables used and perhaps even specially designed speech
processors might improve performance in the bilaterally implanted.

Page 339 of 393
10.6 Conclusion
CI recipients demonstrate varying degrees of post-implantation performance.
Some exhibit very limited benefit and have little or no open set speech
perception without the aid of lip reading while others can use the telephone.
Understanding the underlying factors that might explain this disparity in
performance can provide guidance when it comes to providing management
with the intention of improving speech perception.
Problematic electrodes were evaluated as a possible cause of poor speech
perception. The PTED procedure was found to be the main significant
predictor of speech perception indicating that problematic electrodes have a
detrimental effect on speech perception. PTED was used to identify
indiscriminable electrodes based on pitch perception. Research programs
were created by deactivating indiscriminable electrodes. The deactivation of
indiscriminable electrodes improved performance for 20 out of 25 CI
recipients. Further testing with the PTIF procedure revealed that the
deactivation of indiscriminable electrodes that stimulated underlying “dead
regions” led to improvements in performance. Additionally PTIF showed that
deactivating indiscriminable electrodes and increasing spatial separation in
those regions, improved pitch perception. Programming based on PTIF
provided additional benefit over the initial PTED programs when there were
cases of discrepancy between PTED and PTIF. Both PTED and PTIF are
potentially valuable tools that can help to enhance performance with CI
within clinical practice.
The CBCT was demonstrated to be a useful imaging tool for evaluating CI
electrode array placement within the cochlea, providing high resolution
images with less metallic artefacts and reduced radiation exposure
compared to MSCT. Such a tool could be valuable for identifying contacts
that have ruptured the basilar membrane and will most likely lead to dead

Page 340 of 393
regions. It is also useful for looking at insertion depth and the positioning of
the electrode array. It will not pick up dead regions that already existed prior
to implantation but may highlight ones that may have occurred due to
insertion trauma. It is most likely that these would occur nearer to the apical
end which would be the most important region for having an impact on
speech perception. The evaluation tools (PTED, PTIF and CBCT) can be
used together to help investigate and provide potential solutions for CI
recipients with suboptimal performance. They can be used to identify dead
regions, placement issues or non-functional electrodes. Finding the cause of
poor performance can guide management and programming of CIs.
With the increasing number of children receiving bilateral implants
nowadays, investigation of methods for the optimisation of the fitting of
bilaterally implanted individuals has become a necessity. Matching between
the bilateral CI devices for pitch in six adults, produced improvement in both
localisation and speech perception, it also highlighted the need for the
development of specialised protocols specifically for the programming of
bilateral CIs in order to achieve better binaural benefit.
This thesis has provided evidence to show that the performance of adults
with CIs should be evaluated and monitored and in cases of sub-optimal
performance, attempts should be made to re-program the sound processors
with the intention of improving outcomes. PTED, PTIF and matching bilateral
implants for pitch perception can be used to improve speech perception with
CIs. Additionally, this thesis has uncovered for the first time different types of
indiscriminable/problematic electrodes. The effect of deactivating each type
is different, with benefit most likely occurring following the deactivation of
indiscriminable electrodes stimulating neuronal dead regions. In contrast, no
benefit was observed following the deactivation of indiscriminable electrodes
that do not stimulate dead regions when active. PTIF can be used to

Page 341 of 393
differentiate between indiscriminable electrodes that stimulate dead regions
and those that do not.
Re-programming the sound processors based on pitch perception can help
select optimum sites of stimulation (electrodes) and help to match ears when
there are implants fitted on both sides to achieve better performance with
CIs.
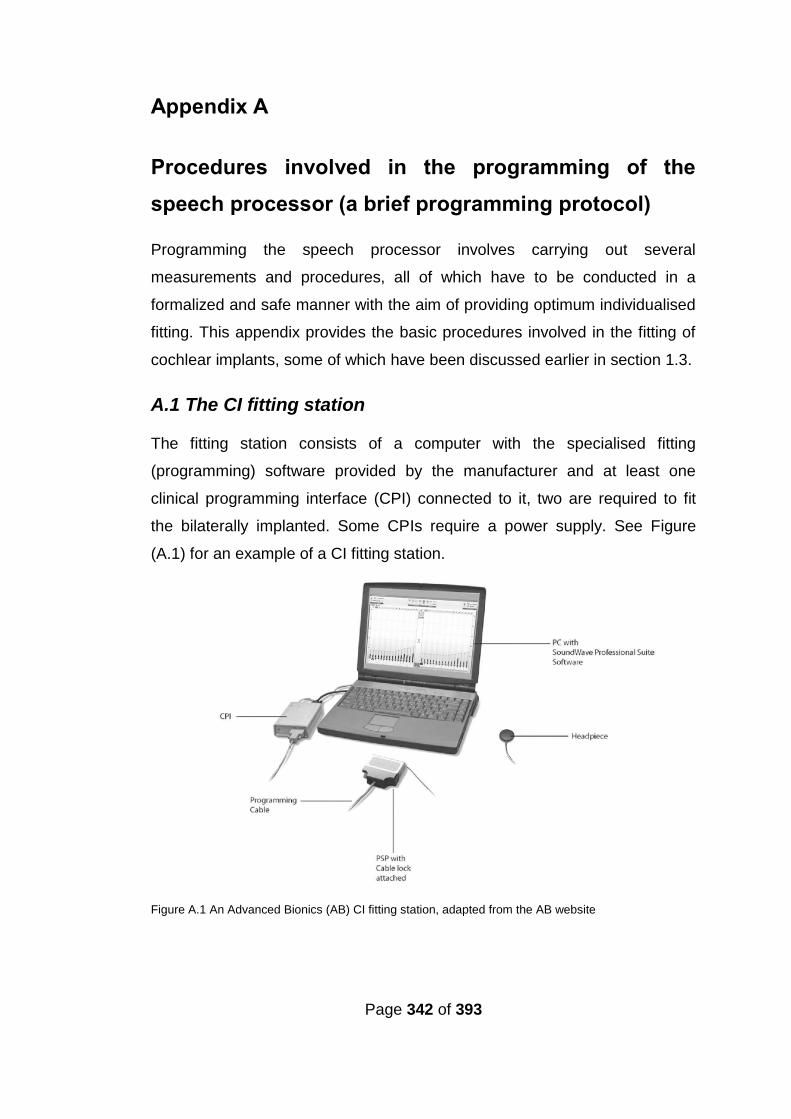
Page 342 of 393
Appendix A
Procedures involved in the programming of the
speech processor (a brief programming protocol)
Programming the speech processor involves carrying out several
measurements and procedures, all of which have to be conducted in a
formalized and safe manner with the aim of providing optimum individualised
fitting. This appendix provides the basic procedures involved in the fitting of
cochlear implants, some of which have been discussed earlier in section 1.3.
A.1 The CI fitting station
The fitting station consists of a computer with the specialised fitting
(programming) software provided by the manufacturer and at least one
clinical programming interface (CPI) connected to it, two are required to fit
the bilaterally implanted. Some CPIs require a power supply. See Figure
(A.1) for an example of a CI fitting station.
Figure A.1 An Advanced Bionics (AB) CI fitting station, adapted from the AB website
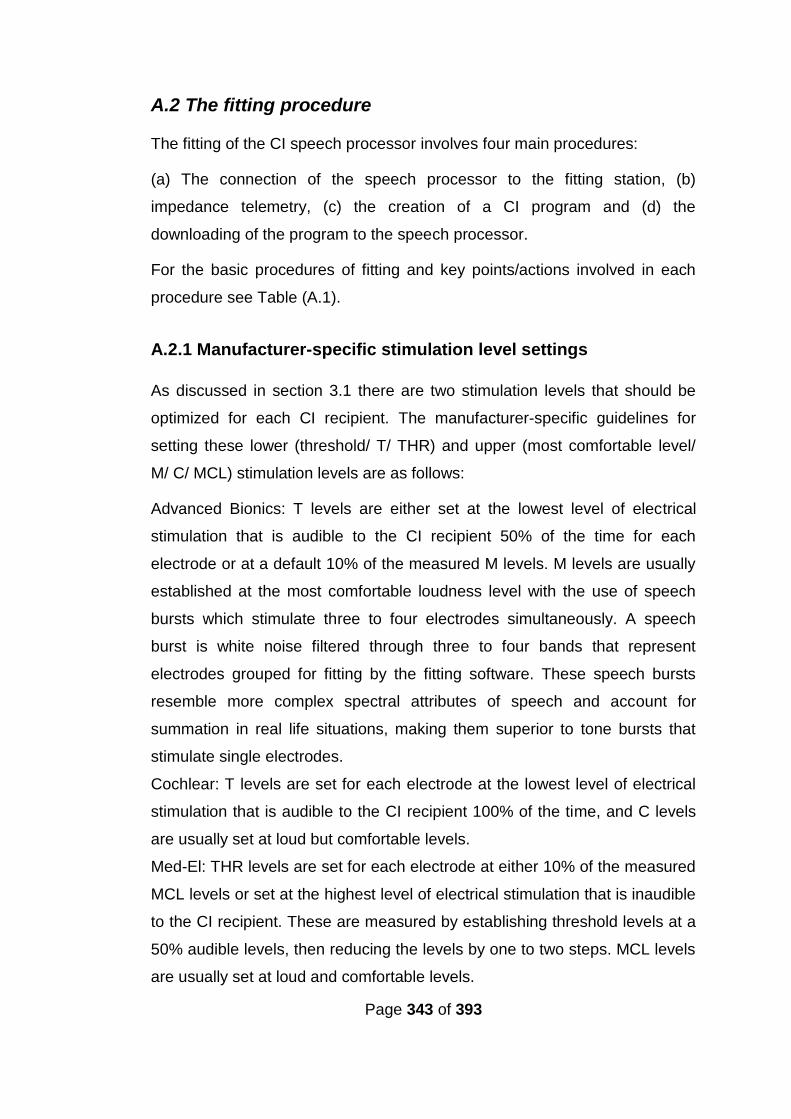
Page 343 of 393
A.2 The fitting procedure
The fitting of the CI speech processor involves four main procedures:
(a) The connection of the speech processor to the fitting station, (b)
impedance telemetry, (c) the creation of a CI program and (d) the
downloading of the program to the speech processor.
For the basic procedures of fitting and key points/actions involved in each
procedure see Table (A.1).
A.2.1 Manufacturer-specific stimulation level settings
As discussed in section 3.1 there are two stimulation levels that should be
optimized for each CI recipient. The manufacturer-specific guidelines for
setting these lower (threshold/ T/ THR) and upper (most comfortable level/
M/ C/ MCL) stimulation levels are as follows:
Advanced Bionics: T levels are either set at the lowest level of electrical
stimulation that is audible to the CI recipient 50% of the time for each
electrode or at a default 10% of the measured M levels. M levels are usually
established at the most comfortable loudness level with the use of speech
bursts which stimulate three to four electrodes simultaneously. A speech
burst is white noise filtered through three to four bands that represent
electrodes grouped for fitting by the fitting software. These speech bursts
resemble more complex spectral attributes of speech and account for
summation in real life situations, making them superior to tone bursts that
stimulate single electrodes.
Cochlear: T levels are set for each electrode at the lowest level of electrical
stimulation that is audible to the CI recipient 100% of the time, and C levels
are usually set at loud but comfortable levels.
Med-El: THR levels are set for each electrode at either 10% of the measured
MCL levels or set at the highest level of electrical stimulation that is inaudible
to the CI recipient. These are measured by establishing threshold levels at a
50% audible levels, then reducing the levels by one to two steps. MCL levels
are usually set at loud and comfortable levels.
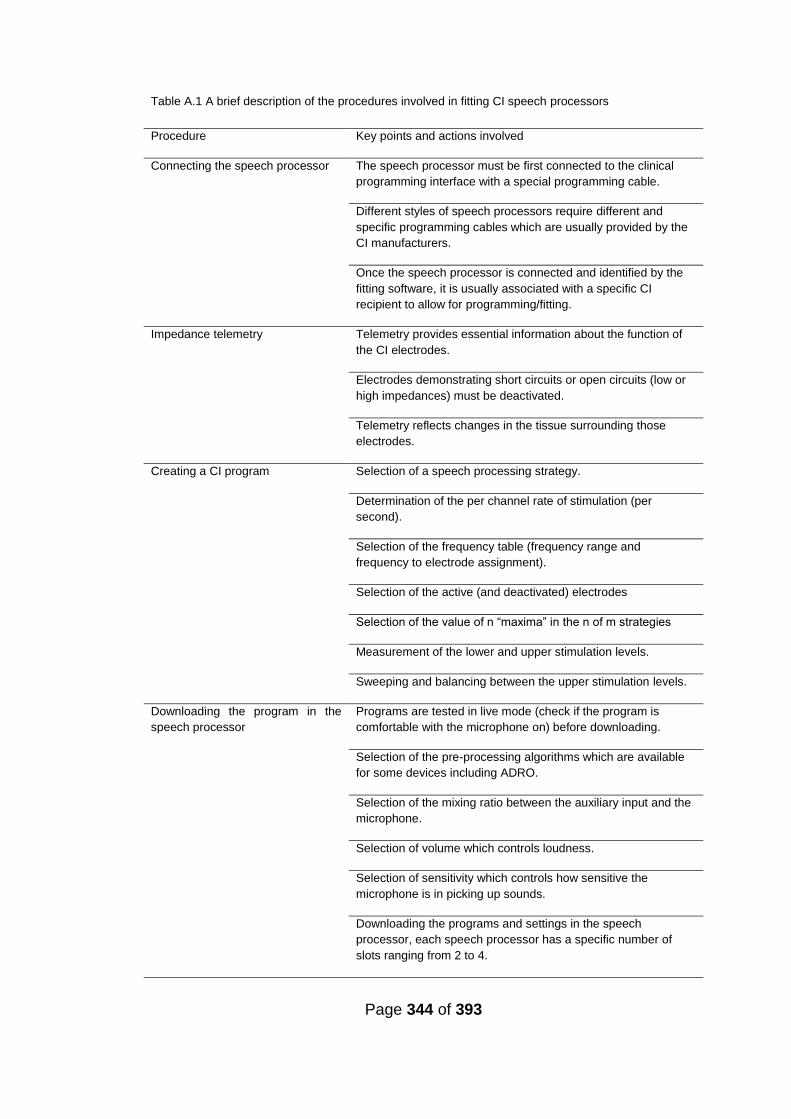
Page 344 of 393
Table A.1 A brief description of the procedures involved in fitting CI speech processors
Procedure Key points and actions involved
Connecting the speech processor The speech processor must be first connected to the clinical
programming interface with a special programming cable.
Different styles of speech processors require different and
specific programming cables which are usually provided by the
CI manufacturers.
Once the speech processor is connected and identified by the
fitting software, it is usually associated with a specific CI
recipient to allow for programming/fitting.
Impedance telemetry Telemetry provides essential information about the function of
the CI electrodes.
Electrodes demonstrating short circuits or open circuits (low or
high impedances) must be deactivated.
Telemetry reflects changes in the tissue surrounding those
electrodes.
Creating a CI program Selection of a speech processing strategy.
Determination of the per channel rate of stimulation (per
second).
Selection of the frequency table (frequency range and
frequency to electrode assignment).
Selection of the active (and deactivated) electrodes
Selection of the value of n “maxima” in the n of m strategies
Measurement of the lower and upper stimulation levels.
Sweeping and balancing between the upper stimulation levels.
Downloading the program in the
speech processor
Programs are tested in live mode (check if the program is
comfortable with the microphone on) before downloading.
Selection of the pre-processing algorithms which are available
for some devices including ADRO.
Selection of the mixing ratio between the auxiliary input and the
microphone.
Selection of volume which controls loudness.
Selection of sensitivity which controls how sensitive the
microphone is in picking up sounds.
Downloading the programs and settings in the speech
processor, each speech processor has a specific number of
slots ranging from 2 to 4.
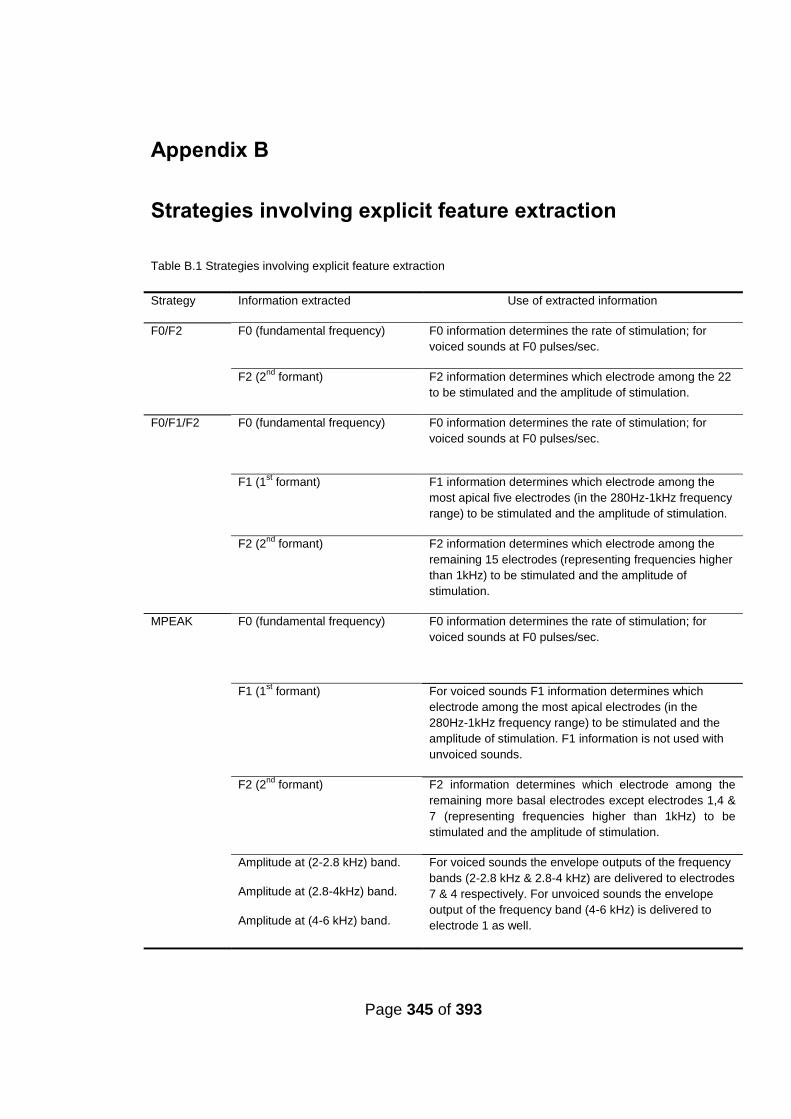
Page 345 of 393
Appendix B
Strategies involving explicit feature extraction
Table B.1 Strategies involving explicit feature extraction
Strategy Information extracted Use of extracted information
F0/F2 F0 (fundamental frequency) F0 information determines the rate of stimulation; for
voiced sounds at F0 pulses/sec.
F2 (2nd
formant) F2 information determines which electrode among the 22
to be stimulated and the amplitude of stimulation.
F0/F1/F2 F0 (fundamental frequency)
F0 information determines the rate of stimulation; for
voiced sounds at F0 pulses/sec.
F1 (1st formant)
F1 information determines which electrode among the
most apical five electrodes (in the 280Hz-1kHz frequency
range) to be stimulated and the amplitude of stimulation.
F2 (2nd
formant) F2 information determines which electrode among the
remaining 15 electrodes (representing frequencies higher
than 1kHz) to be stimulated and the amplitude of
stimulation.
MPEAK F0 (fundamental frequency) F0 information determines the rate of stimulation; for
voiced sounds at F0 pulses/sec.
F1 (1st formant)
For voiced sounds F1 information determines which
electrode among the most apical electrodes (in the
280Hz-1kHz frequency range) to be stimulated and the
amplitude of stimulation. F1 information is not used with
unvoiced sounds.
F2 (2nd
formant)
F2 information determines which electrode among the
remaining more basal electrodes except electrodes 1,4 &
7 (representing frequencies higher than 1kHz) to be
stimulated and the amplitude of stimulation.
Amplitude at (2-2.8 kHz) band.
Amplitude at (2.8-4kHz) band.
Amplitude at (4-6 kHz) band.
For voiced sounds the envelope outputs of the frequency
bands (2-2.8 kHz & 2.8-4 kHz) are delivered to electrodes
7 & 4 respectively. For unvoiced sounds the envelope
output of the frequency band (4-6 kHz) is delivered to
electrode 1 as well.

Page 346 of 393
Appendix C
Data used in analyses in Chapter 5
Table C.1 BKB in quiet (RAU) and data used in analyses for correlations and multiple regression. Pathology as defined by the presence of radiologically confirmed pathology was given the value 2, aetiology associated with fibrosis, calcification or ossification was given the value 2, DD and DDY for duration of deafness categorical data and years respectively, AAI and AAIY for age at implant categorical data and in years respectively, percentage of discriminable electrodes (DEL) for the full CI array, DELA, DELM and DELB for the percentage of discriminable electrodes at frequencies ≤ 1000 Hz, 1000 Hz < frequencies ≤ 2600 Hz and at frequencies > 2600 Hz respectively.
Pathology Aetiology DD AAI DDY AAIY DEL BKBQ DELA DELM DELB
2.00 2.00 2.00 1.00 40.00 61.00 80.00 49.07 75.00 50.00 75.00
1.00 1.00 2.00 1.00 12.00 61.00 72.73 77.62 60.00 100.00 75.00
2.00 2.00 2.00 1.00 49.00 73.08 75.41 85.71 57.14 50.00
1.00 1.00 2.00 1.00 15.00 40.00 78.95 64.16 83.33 83.33 75.00
1.00 1.00 2.00 2.00 25.00 78.00 68.75 55.59 60.00 100.00 100.00
2.00 1.00 2.00 1.00 19.00 57.00 84.62 41.59 100.00 50.00 14.29
2.00 1.00 1.00 1.00 4.00 44.00 87.50 48.14 50.00 100.00 100.00
1.00 1.00 1.00 1.00 6.00 47.00 42.22 38.74 42.86 .00 100.00
1.00 1.00 1.00 2.00 5.00 70.00 78.57 69.12 40.00 66.67 50.00
1.00 1.00 1.00 1.00 6.00 52.00 75.68 91.58 71.43 71.43 100.00
1.00 1.00 1.00 2.00 9.00 69.00 88.89 66.12 100.00 100.00 83.33
1.00 1.00 1.00 2.00 1.00 70.00 82.00 81.08 80.00 100.00 66.67
1.00 1.00 1.00 1.00 7.00 60.00 88.00 79.91 85.71 66.67 75.00
1.00 1.00 1.00 1.00 5.00 15.00 55.56 23.49 .00 50.00 57.14
1.00 1.00 2.00 1.00 33.00 51.00 90.91 90.12 100.00 100.00 100.00
1.00 1.00 1.00 1.00 7.00 60.00 44.12 48.14 16.67 16.67 75.00
1.00 1.00 2.00 66.00 62.50 90.12 71.43 80.00 33.33
2.00 2.00 1.00 1.00 2.00 58.00 93.33 91.58 100.00 100.00 50.00
1.00 1.00 1.00 2.00 7.00 73.00 73.33 94.68 83.33 100.00 75.00
1.00 1.00 2.00 1.00 25.00 59.00 82.00 94.68 100.00 100.00 25.00
1.00 1.00 1.00 47.00 79.41 98.11 50.00 83.33 33.33
1.00 1.00 1.00 1.00 6.00 57.00 73.08 96.35 28.57 50.00 25.00
1.00 1.00 2.00 1.00 12.00 63.00 86.67 104.28 85.71 83.33 42.86
1.00 1.00 1.00 1.00 9.00 20.00 86.67 104.28 100.00 66.67 62.50
1.00 1.00 1.00 1.00 2.00 48.00 100.00 100.00 80.00 100.00 75.00
1.00 1.00 2.00 2.00 40.00 72.00 100.00 123.00 100.00 100.00 75.00
1.00 1.00 1.00 2.00 7.00 71.00 100.00 109.81 100.00 100.00 100.00
1.00 1.00 1.00 1.00 5.00 57.00 100.00 123.00 100.00 100.00 100.00
1.00 1.00 1.00 1.00 6.00 57.00 100.00 73.27 100.00 100.00 28.57
1.00 1.00 1.00 1.00 1.00 2.00 100.00 123.00 100.00 100.00 100.00
1.00 1.00 1.00 56.00 100.00 123.00 100.00 100.00 100.00
1.00 1.00 2.00 1.00 53.00 64.00 73.08 104.28 100.00 100.00 100.00
2.00 1.00 1.00 1.00 3.00 46.00 73.08 71.17 75.00 100.00 100.00
1.00 1.00 2.00 1.00 15.00 40.00 14.13 52.79 .00 .00 14.29
1.00 1.00 2.00 1.00 15.00 22.00 40.00 69.12 33.33 28.57 28.57
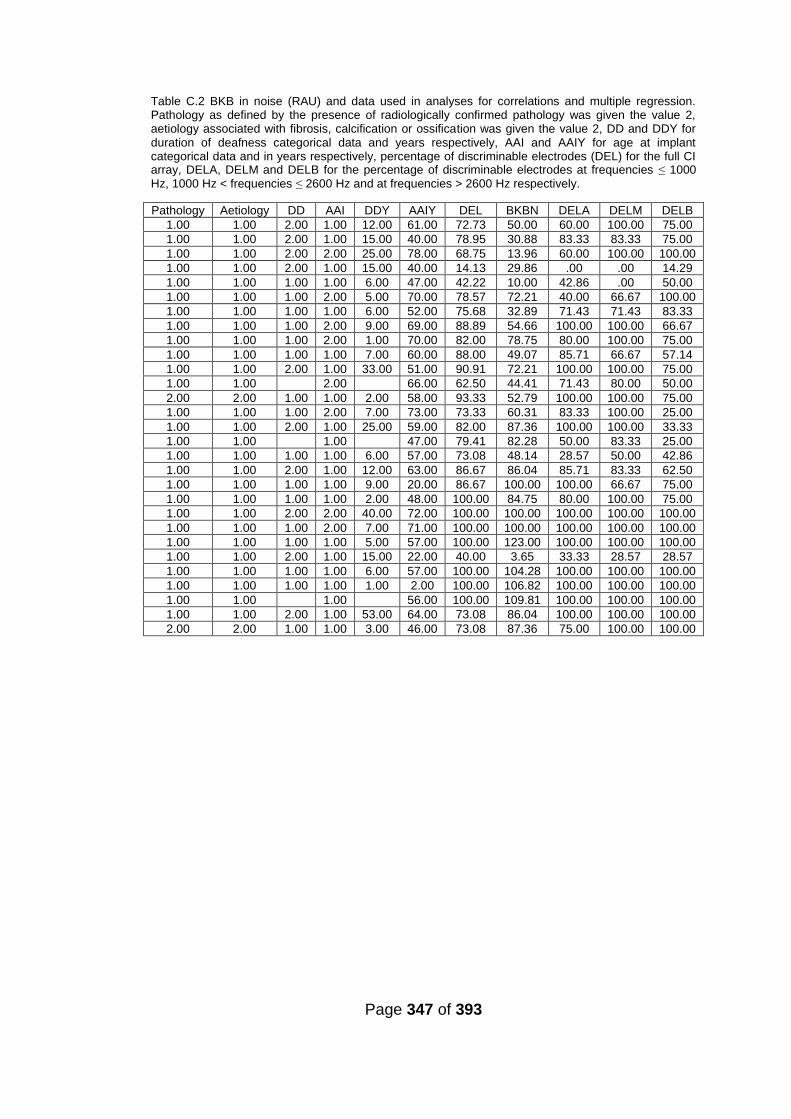
Page 347 of 393
Table C.2 BKB in noise (RAU) and data used in analyses for correlations and multiple regression. Pathology as defined by the presence of radiologically confirmed pathology was given the value 2, aetiology associated with fibrosis, calcification or ossification was given the value 2, DD and DDY for duration of deafness categorical data and years respectively, AAI and AAIY for age at implant categorical data and in years respectively, percentage of discriminable electrodes (DEL) for the full CI array, DELA, DELM and DELB for the percentage of discriminable electrodes at frequencies ≤ 1000 Hz, 1000 Hz < frequencies ≤ 2600 Hz and at frequencies > 2600 Hz respectively.
Pathology Aetiology DD AAI DDY AAIY DEL BKBN DELA DELM DELB
1.00 1.00 2.00 1.00 12.00 61.00 72.73 50.00 60.00 100.00 75.00
1.00 1.00 2.00 1.00 15.00 40.00 78.95 30.88 83.33 83.33 75.00
1.00 1.00 2.00 2.00 25.00 78.00 68.75 13.96 60.00 100.00 100.00
1.00 1.00 2.00 1.00 15.00 40.00 14.13 29.86 .00 .00 14.29
1.00 1.00 1.00 1.00 6.00 47.00 42.22 10.00 42.86 .00 50.00
1.00 1.00 1.00 2.00 5.00 70.00 78.57 72.21 40.00 66.67 100.00
1.00 1.00 1.00 1.00 6.00 52.00 75.68 32.89 71.43 71.43 83.33
1.00 1.00 1.00 2.00 9.00 69.00 88.89 54.66 100.00 100.00 66.67
1.00 1.00 1.00 2.00 1.00 70.00 82.00 78.75 80.00 100.00 75.00
1.00 1.00 1.00 1.00 7.00 60.00 88.00 49.07 85.71 66.67 57.14
1.00 1.00 2.00 1.00 33.00 51.00 90.91 72.21 100.00 100.00 75.00
1.00 1.00 2.00 66.00 62.50 44.41 71.43 80.00 50.00
2.00 2.00 1.00 1.00 2.00 58.00 93.33 52.79 100.00 100.00 75.00
1.00 1.00 1.00 2.00 7.00 73.00 73.33 60.31 83.33 100.00 25.00
1.00 1.00 2.00 1.00 25.00 59.00 82.00 87.36 100.00 100.00 33.33
1.00 1.00 1.00 47.00 79.41 82.28 50.00 83.33 25.00
1.00 1.00 1.00 1.00 6.00 57.00 73.08 48.14 28.57 50.00 42.86
1.00 1.00 2.00 1.00 12.00 63.00 86.67 86.04 85.71 83.33 62.50
1.00 1.00 1.00 1.00 9.00 20.00 86.67 100.00 100.00 66.67 75.00
1.00 1.00 1.00 1.00 2.00 48.00 100.00 84.75 80.00 100.00 75.00
1.00 1.00 2.00 2.00 40.00 72.00 100.00 100.00 100.00 100.00 100.00
1.00 1.00 1.00 2.00 7.00 71.00 100.00 100.00 100.00 100.00 100.00
1.00 1.00 1.00 1.00 5.00 57.00 100.00 123.00 100.00 100.00 100.00
1.00 1.00 2.00 1.00 15.00 22.00 40.00 3.65 33.33 28.57 28.57
1.00 1.00 1.00 1.00 6.00 57.00 100.00 104.28 100.00 100.00 100.00
1.00 1.00 1.00 1.00 1.00 2.00 100.00 106.82 100.00 100.00 100.00
1.00 1.00 1.00 56.00 100.00 109.81 100.00 100.00 100.00
1.00 1.00 2.00 1.00 53.00 64.00 73.08 86.04 100.00 100.00 100.00
2.00 2.00 1.00 1.00 3.00 46.00 73.08 87.36 75.00 100.00 100.00
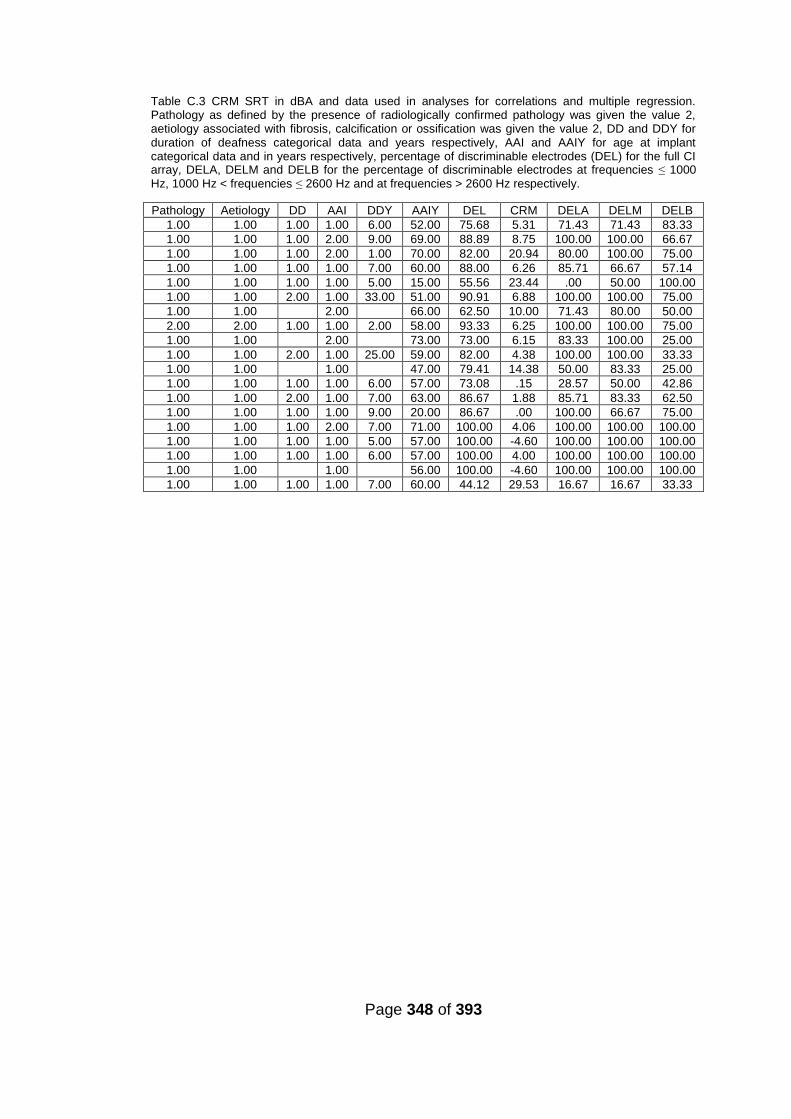
Page 348 of 393
Table C.3 CRM SRT in dBA and data used in analyses for correlations and multiple regression. Pathology as defined by the presence of radiologically confirmed pathology was given the value 2, aetiology associated with fibrosis, calcification or ossification was given the value 2, DD and DDY for duration of deafness categorical data and years respectively, AAI and AAIY for age at implant categorical data and in years respectively, percentage of discriminable electrodes (DEL) for the full CI array, DELA, DELM and DELB for the percentage of discriminable electrodes at frequencies ≤ 1000 Hz, 1000 Hz < frequencies ≤ 2600 Hz and at frequencies > 2600 Hz respectively.
Pathology Aetiology DD AAI DDY AAIY DEL CRM DELA DELM DELB
1.00 1.00 1.00 1.00 6.00 52.00 75.68 5.31 71.43 71.43 83.33
1.00 1.00 1.00 2.00 9.00 69.00 88.89 8.75 100.00 100.00 66.67
1.00 1.00 1.00 2.00 1.00 70.00 82.00 20.94 80.00 100.00 75.00
1.00 1.00 1.00 1.00 7.00 60.00 88.00 6.26 85.71 66.67 57.14
1.00 1.00 1.00 1.00 5.00 15.00 55.56 23.44 .00 50.00 100.00
1.00 1.00 2.00 1.00 33.00 51.00 90.91 6.88 100.00 100.00 75.00
1.00 1.00 2.00 66.00 62.50 10.00 71.43 80.00 50.00
2.00 2.00 1.00 1.00 2.00 58.00 93.33 6.25 100.00 100.00 75.00
1.00 1.00 2.00 73.00 73.00 6.15 83.33 100.00 25.00
1.00 1.00 2.00 1.00 25.00 59.00 82.00 4.38 100.00 100.00 33.33
1.00 1.00 1.00 47.00 79.41 14.38 50.00 83.33 25.00
1.00 1.00 1.00 1.00 6.00 57.00 73.08 .15 28.57 50.00 42.86
1.00 1.00 2.00 1.00 7.00 63.00 86.67 1.88 85.71 83.33 62.50
1.00 1.00 1.00 1.00 9.00 20.00 86.67 .00 100.00 66.67 75.00
1.00 1.00 1.00 2.00 7.00 71.00 100.00 4.06 100.00 100.00 100.00
1.00 1.00 1.00 1.00 5.00 57.00 100.00 -4.60 100.00 100.00 100.00
1.00 1.00 1.00 1.00 6.00 57.00 100.00 4.00 100.00 100.00 100.00
1.00 1.00 1.00 56.00 100.00 -4.60 100.00 100.00 100.00
1.00 1.00 1.00 1.00 7.00 60.00 44.12 29.53 16.67 16.67 33.33

Page 349 of 393
Appendix D
Raw data used in analyses in Chapter 7 and figures
Table D.1 BKB in quiet (raw scores) with the best research program compared to the best BKB score
with the clinical program in group I.
BKB (best clinical) BKB (best research program
49.00 35.00
78.00 88.00
76.00 68.00
65.00 73.00
56.00 83.00
53.00 71.00
41.00 39.00
48.00 55.00
38.00 64.00
70.00 91.00
89.00 85.00
67.00 76.00
81.00 89.00
80.00 94.00
23.00 35.00
88.00 94.00
48.00 54.00
88.00 92.00
91.00 91.00
91.00 94.00
92.00 94.00
96.00 99.00
96.00 90.00
94.00 97.00
93.00 94.00
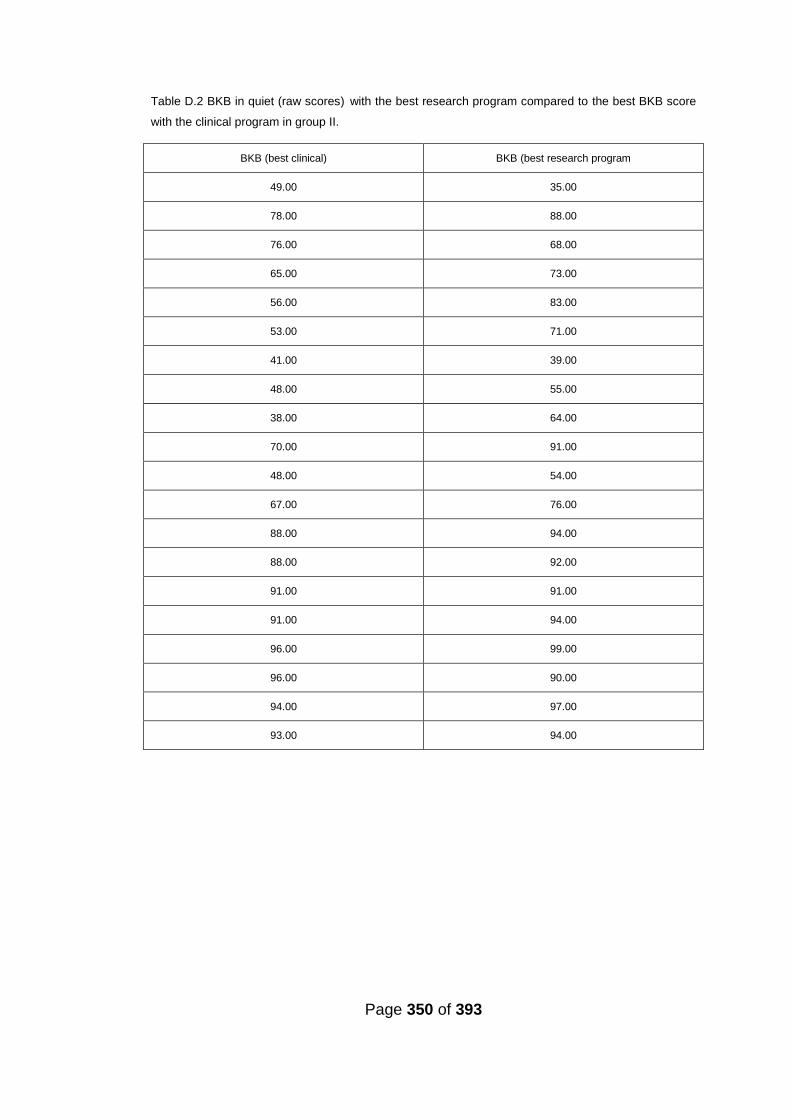
Page 350 of 393
Table D.2 BKB in quiet (raw scores) with the best research program compared to the best BKB score
with the clinical program in group II.
BKB (best clinical) BKB (best research program
49.00 35.00
78.00 88.00
76.00 68.00
65.00 73.00
56.00 83.00
53.00 71.00
41.00 39.00
48.00 55.00
38.00 64.00
70.00 91.00
48.00 54.00
67.00 76.00
88.00 94.00
88.00 92.00
91.00 91.00
91.00 94.00
96.00 99.00
96.00 90.00
94.00 97.00
93.00 94.00
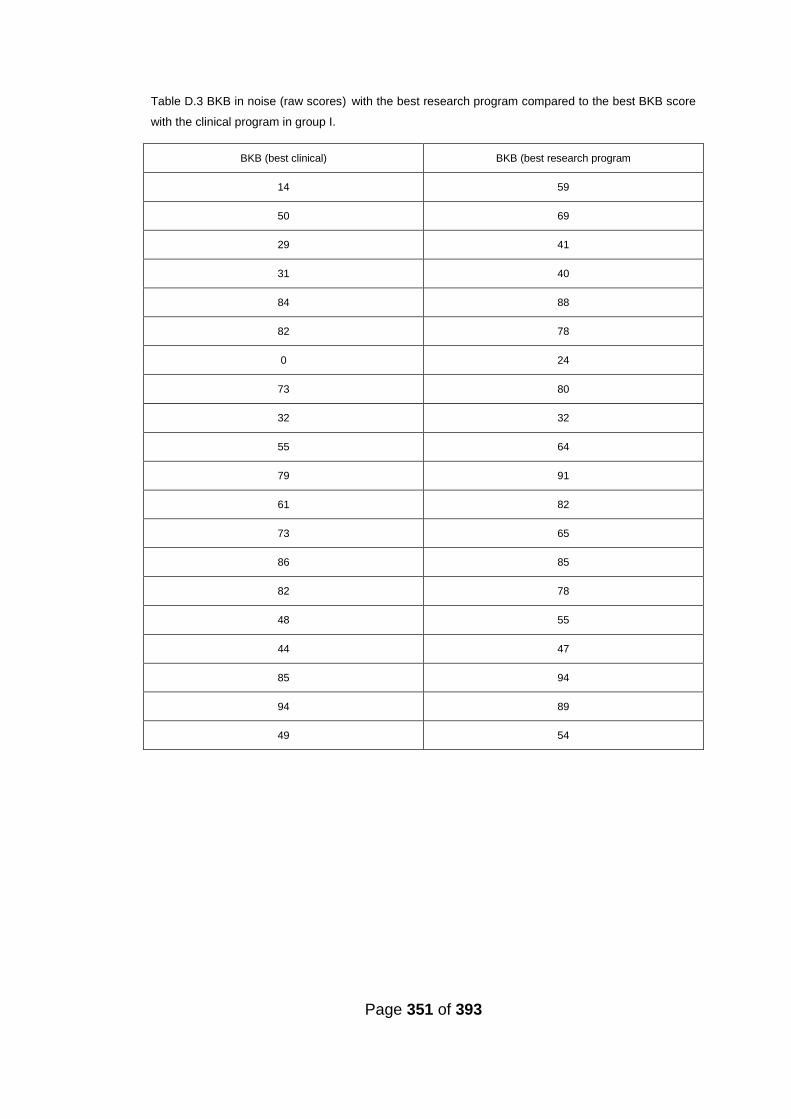
Page 351 of 393
Table D.3 BKB in noise (raw scores) with the best research program compared to the best BKB score
with the clinical program in group I.
BKB (best clinical) BKB (best research program
14 59
50 69
29 41
31 40
84 88
82 78
0 24
73 80
32 32
55 64
79 91
61 82
73 65
86 85
82 78
48 55
44 47
85 94
94 89
49 54

Page 352 of 393
Table D.4 BKB in noise (raw scores) with the best research program compared to the best BKB score
with the clinical program in group II.
BKB (best clinical) BKB (best research program
14 59
50 69
29 41
31 40
84 88
82 78
0 24
73 80
55 64
61 82
73 65
86 85
82 78
48 55
44 47
85 94
94 89
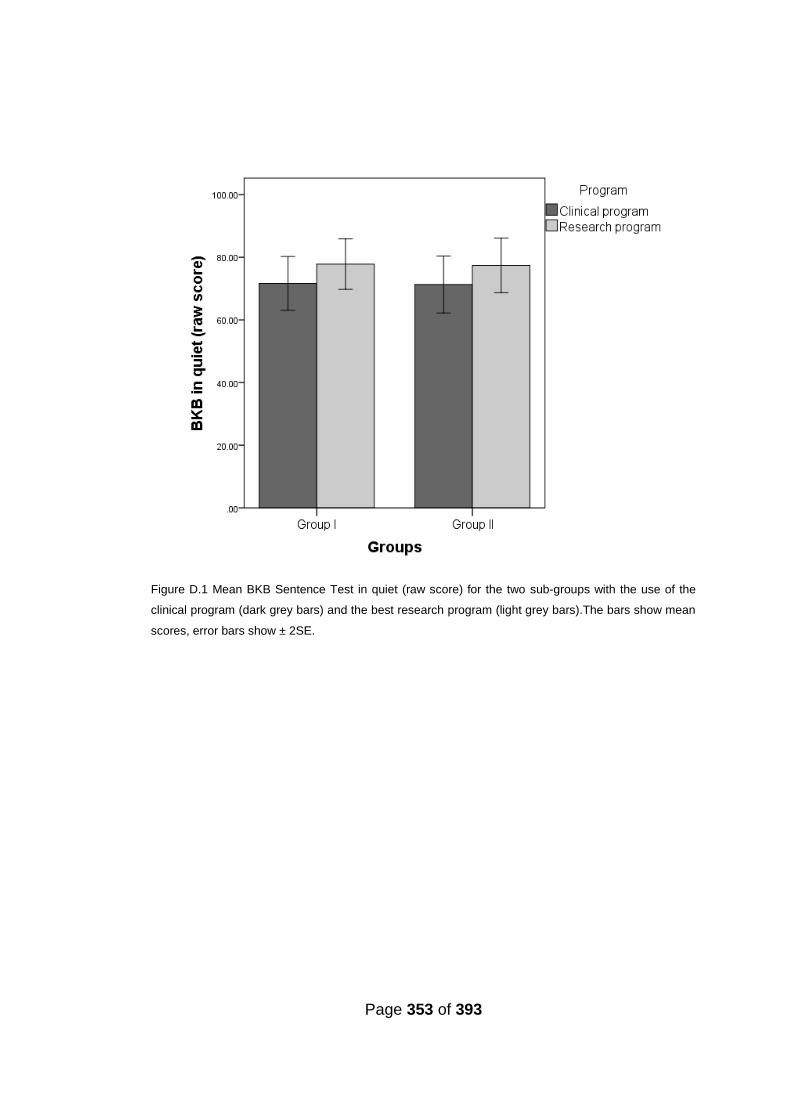
Page 353 of 393
Figure D.1 Mean BKB Sentence Test in quiet (raw score) for the two sub-groups with the use of the
clinical program (dark grey bars) and the best research program (light grey bars).The bars show mean
scores, error bars show ± 2SE.
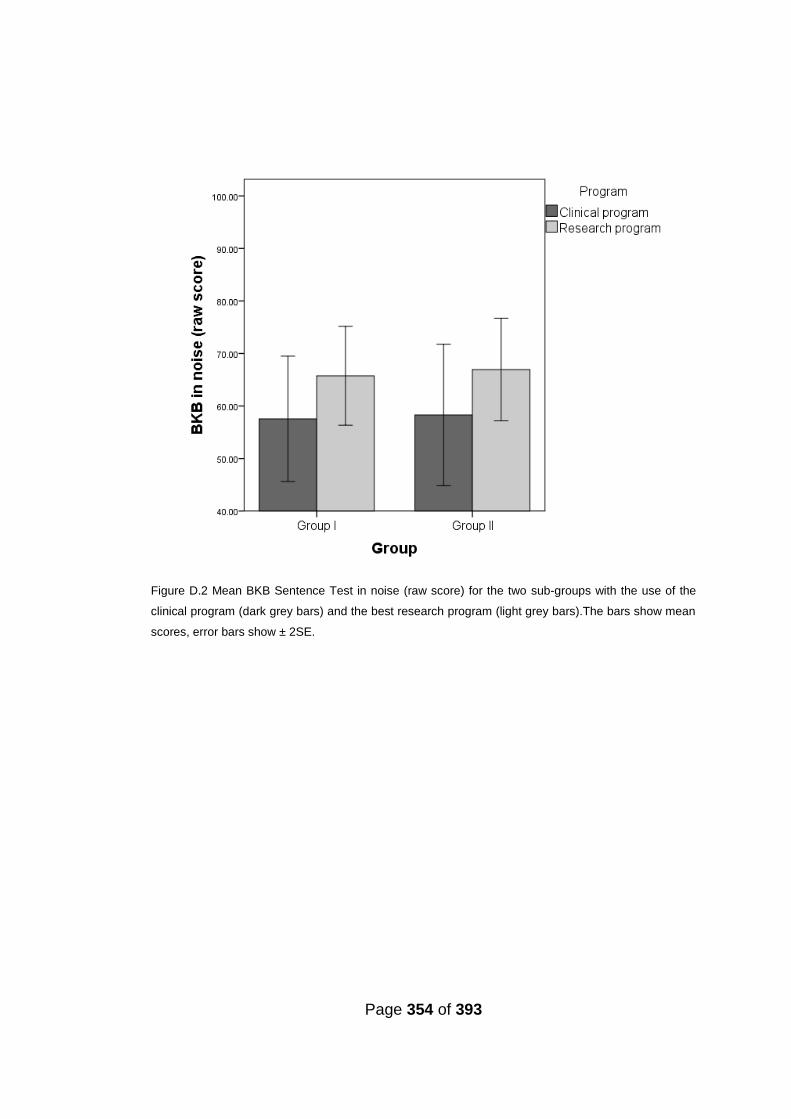
Page 354 of 393
Figure D.2 Mean BKB Sentence Test in noise (raw score) for the two sub-groups with the use of the
clinical program (dark grey bars) and the best research program (light grey bars).The bars show mean
scores, error bars show ± 2SE.

Page 355 of 393
References
2005, "European consensus statement on cochlear implant failures and explantations", Otol.Neurotol., vol. 26, no. 6, pp. 1097-1099.
Abbas, P. J., Hughes, M. L., Brown, C. J., Miller, C. A., & South, H. 2004, "Channel interaction in cochlear implant users evaluated using the electrically evoked compound action potential", Audiology and Neuro-Otology, vol. 9, no. 4, pp. 203-213.
Adunka, O., Unkelbach, M. H., Mack, M., Hambek, M., Gstoettner, W., & Kiefer, J. 2004, "Cochlear implantation via the round window membrane minimizes trauma to cochlear structures: a histologically controlled insertion study", Acta Otolaryngol., vol. 124, no. 7, pp. 807-812.
Adunka, O. F., Pillsbury, H. C., & Kiefer, J. 2006, "Combining perimodiolar electrode placement and atraumatic insertion properties in cochlear implantation -- fact or fantasy?", Acta Otolaryngol., vol. 126, no. 5, pp. 475-482.
Agresti A., and Finlay B. 1997, "Statistical Methods for the Social Sciences", New Jerse: Prentice Hall.
Alexiades, G., Roland, J. T., Fishman, A. J., Shapiro, W., Waltzman, S. B., & Cohen, N. L. 2001, "Cochlear reimplantation: Surgical techniques and functional results", Laryngoscope, vol. 111, no. 9, pp. 1608-1613.
Alexander, A. J., Bartel, L., Friesen, L., Shipp, D., & Chen, J. 2011, "From Fragments to the Whole: A Comparison between Cochlear Implant Users and Normal-Hearing Listeners in Music Perception and Enjoyment", Journal of Otolaryngology-Head & Neck Surgery, vol. 40, no. 1, pp. 1-7.
Amoodi, H. A., Mick, P. T., Shipp, D. B., Friesen, L. M., Nedzelski, J. M., Chen, J. M., & Lin, V. Y. W. 2011, "The Effects of Unilateral Cochlear Implantation on the Tinnitus Handicap Inventory and the Influence on Quality of Life", Laryngoscope, vol. 121, no. 7, pp. 1536-1540.
Arbogast, T. L., Mason, C. R., & Kidd, G. 2002, "The effect of spatial separation on informational and energetic masking of speech", Journal of the Acoustical Society of America, vol. 112, no. 5, pp. 2086-2098.
Arbogast, T. L., Mason, C. R., & Kidd, G. 2005, "The effect of spatial separation on informational masking of speech in normal-hearing and hearing-impaired listeners", Journal of the Acoustical Society of America, vol. 117, no. 4, pp. 2169-2180.

Page 356 of 393
Arlinger, S., Lunner, T., Lyxell, B., & Pichora-Fuller, M. K. 2009, "The emergence of Cognitive Hearing Science", Scandinavian Journal of Psychology, vol. 50, no. 5, pp. 371-384.
Arnoldner, C., Riss, D., Brunner, M., Durisin, M., Baumgartner, W. D., & Hamzavi, J. S. 2007, "Speech and music perception with the new fine structure speech coding strategy: preliminary results", Acta Oto-Laryngologica, vol. 127, no. 12, pp. 1298-1303.
Arora, K., Dawson, P., Dowell, R., & Vandali, A. 2009, "Electrical stimulation rate effects on speech perception in cochlear implants", Int.J.Audiol., vol. 48, no. 8, pp. 561-567.
Aschendorff, A., Klenzner, T., Richter, B., Kubalek, R., Nagursky, H., & Laszig, R. 2003, "Evaluation of the HiFocus (R) electrode array with positioner in human temporal bones", Journal of Laryngology and Otology, vol. 117, no. 7, pp. 527-531.
Aschendorff, A., Kromeier, J., Klenzner, T., & Laszig, R. 2007, "Quality control after insertion of the nucleus contour and contour advance electrode in adults", Ear and Hearing, vol. 28, no. 2, pp. 75S-79S.
Aschendorff, A., Kubalek, R., Hochmuth, A., Bink, A., Kurtz, C., Lohnstein, P., Klenzner, T., & Laszig, R. 2004, "Imaging procedures in cochlear implant patients - Evaluation of different radiological techniques", Acta Oto-Laryngologica, vol. 124, pp. 46-49.
Aschendorff, A., Kubalek, T., Turowski, B., Zanella, T., Hochmuth, T., Schumacher, T., Klenzner, T., & Laszig, R. 2005, "Quality control after cochlear implant surgery by means of rotational tomography", Otology & Neurotology, vol. 26, no. 1, pp. 34-37.
Balkany, T. J., Hodges, A. V., Buchman, C. A., Luxford, W. M., Pillsbury, C. H., Roland, P. S., Shallop, J. K., Backous, D. D., Franz, D., Graham, J. M., Hirsch, B., Luntz, M., Niparko, J. K., Patrick, J., Payne, S. L., Staller, S., Telischi, F. F., Tobey, E. A., & Truy, E. 2005, "Cochlear implant soft failures consensus development conference statement", Cochlear.Implants.Int., vol. 6, no. 3, pp. 105-122.
Barretto, R. L. & Pfingst, B. E. 1992, "Electrical-Stimulation of the Auditory-Nerve - Effects of Pulse Width on Frequency Discrimination", Hearing Research, vol. 62, no. 2, pp. 245-249.
Barry, J. G., Ferguson, M. A., Moore, D. R. 2010, "Making Sense of Listening: The IMAP Test Battery", Journal of Visualized Experiments, 44, e2139, DOI: 10.3791/2139.
Bartling, S. H., Gupta, R., Torkos, A., Dullin, C., Eckhardt, G., Lenarz, T., Becker, H., & Stover, T. 2006, "Flat-panel volume computed tomography for

Page 357 of 393
cochlear implant electrode array examination in isolated temporal bone specimens", Otology & Neurotology, vol. 27, no. 4, pp. 491-498.
Barton, G., Summerfield, A., Marshall, D., and Bloor, K. (2001). Choice of instrument for measuring the gain in utility from cochlear implantation. Paper prepared for The Health Economics Study Group, Oxford.
Bas, E., Dinh, C. T., Garnham, C., Polak, M., & Van De Water, T. R. 2012, "Conservation of hearing and protection of hair cells in cochlear implant patients' with residual hearing", Anatomical Record-Advances in Integrative Anatomy and Evolutionary Biology, vol. 295, no. 11, pp. 1909-1927.
Baskent, D. & Shannon, R. V. 2003, "Speech recognition under conditions of frequency-place compression and expansion", J.Acoust.Soc.Am., vol. 113, no. 4 Pt 1, pp. 2064-2076.
Baskent, D. & Shannon, R. V. 2005, "Interactions between cochlear implant electrode insertion depth and frequency-place mapping", J.Acoust.Soc.Am., vol. 117, no. 3 Pt 1, pp. 1405-1416.
Baskent, D. & Shannon, R. V. 2006, " Frequency transposition around dead regions simulated with a noiseband vocoder ", J.Acoust.Soc.Am., vol. 119, no. 2, pp. 1156-1163.
Battmer, R. D., Gupta, S. P., Allum-Mecklenburg, D. J., & Lenarz, T. 1995, "Factors influencing cochlear implant perceptual performance in 132 adults", Ann.Otol.Rhinol.Laryngol.Suppl, vol. 166, pp. 185-187.
Battmer, R. D., Zilberman, Y., Haake, P., & Lenarz, T. 1999, "Simultaneous Analog Stimulation (SAS)--Continuous Interleaved Sampler (CIS) pilot comparison study in Europe", Ann.Otol.Rhinol.Laryngol.Suppl, vol. 177, pp. 69-73.
Baumgartner, W. D., Jappel, A., Morera, C., Gstottner, W., Muller, J., Kiefer, J., Van De, H. P., Anderson, I., & Nielsen, S. B. 2007, "Outcomes in adults implanted with the FLEXsoft electrode", Acta Otolaryngol., vol. 127, no. 6, pp. 579-586.
Bench, J., Kowal, A., & Bamford, J. (1979). The BKB (Bamford-Kowal-Bench) sentence lists for partially-hearing children. British Journal of Audiology, vol. 13, no. 3, pp.108-12.
Berrettini, S., Forli, F., Neri, E., Segnini, G., & Franceschini, S. S. 2002, "Scala vestibuli cochlear implantation in patients with partially ossified cochleas", Journal of Laryngology and Otology, vol. 116, no. 11, pp. 946-950.
Berrettini, S., Forli, F., & Passetti, S. 2008, "Preservation of residual hearing following cochlear implantation: comparison between three surgical techniques", J.Laryngol.Otol., vol. 122, no. 3, pp. 246-252.

Page 358 of 393
Bhatt, Y. M., Green, K. M., Mawman, D. J., Aplin, Y., O'Driscoll, M. P., Saeed, S. R., & Ramsden, R. T. 2005, "Device nonuse among adult cochlear implant recipients", Otol.Neurotol., vol. 26, no. 2, pp. 183-187.
Benki, J. R. 2001, "Place of articulation and first formant transition pattern both affect perception of voicing in English", Journal of Phonetics, vol. 29, no. 1, pp. 1-22.
Bierer, J. A. 2007, "Threshold and channel interaction in cochlear implant users: Evaluation of the tripolar electrode configuration", Journal of the Acoustical Society of America, vol. 121, no. 3, pp. 1642-1653.
Bierer, J. A., Bierer, S. M., & Middlebrooks, J. C. 2010, "Partial tripolar cochlear implant stimulation: Spread of excitation and forward masking in the inferior colliculus", Hearing Research, vol. 270, no. 1-2, pp. 134-142.
Bierer, S., Bonham, B., Snyder, R. 2005, "Inferior colliculus responses to two channel cochlear implant stimulation", Twenty-Eighth Annual Midwinter Research Meeting Association for Research in Otolaryngology. New Orleans, Louisiana 19-24 February. Assoc Res Otolaryngol Abst, New Jersey: Association for Research in Otolaryngology pp. 356. Retrieved 27 October 2012 from http://www.aro.org/mwm/05_Abstract_Book.pdf.
Bierer, J. A. & Faulkner, K. F. 2010, "Identifying Cochlear Implant Channels with Poor Electrode-Neuron Interface: Partial Tripolar, Single-Channel Thresholds and Psychophysical Tuning Curves", Ear and Hearing, vol. 31, no. 2, pp. 247-258.
Bierer, J. A. & Faulkner, K. F. 2011, "Identifying Cochlear Implant Channels with Poor Electrode-Neuron Interface: Partial Tripolar, Single-Channel Thresholds and Psychophysical Tuning Curves (vol 31, pg 247, 2010)", Ear and Hearing, vol. 32, no. 5, p. 633.
Bierer, J. A., Faulkner, K. F., & Tremblay, K. L. 2011, "Identifying Cochlear Implant Channels With Poor Electrode-Neuron Interfaces: Electrically Evoked Auditory Brain Stem Responses Measured With the Partial Tripolar Configuration", Ear and Hearing, vol. 32, no. 4, pp. 436-444.
Bierer, J. A. & Middlebrooks, J. C. 2002, "Auditory cortical images of cochlear-implant stimuli: Dependence on electrode configuration", Journal of Neurophysiology, vol. 87, no. 1, pp. 478-492.
Bierer, J. A. & Middlebrooks, J. C. 2004, "Cortical responses to cochlear implant stimulation: Channel interactions", Jaro-Journal of the Association for Research in Otolaryngology, vol. 5, no. 1, pp. 32-48.
Blamey P., Arndt P., Bergeron F., Bredberg G., Brimacombe J., Facer G, Larky J., Lindstrom B., Nedzelski J., Peterson A., Shipp D., Staller S., Whitford L. 1996, “Factors affecting auditor performance of postlinguistically
Page 359 of 393
deaf adults using cochlear implants”. Audiol Neurootol. vol. 1, no. 5, pp. 293-306.
Blamey P., Artieres F., Başkent D., Bergeron F., Beynon A. et al. 2013, “Factors Affecting Auditory Performance of Postlinguistically Deaf Adults Using Cochlear Implants: An Update with 2251 Patients”, Audiol Neurotol., vol. 18, pp. 36-47.
Blamey, P. J., Pyman, B. C., Gordon, M., Clark, G. M., Brown, A. M., Dowell, R. C., & Hollow, R. D. 1992, "Factors predicting postoperative sentence scores in postlinguistically deaf adult cochlear implant patients", Ann.Otol.Rhinol.Laryngol., vol. 101, no. 4, pp. 342-348.
Boisvert, I., Lyxell, B., Maki-Torkko, E., McMahon, C. M., & Dowell, R. C. 2012, "Choice of Ear for Cochlear Implantation in Adults With Monaural Sound-Deprivation and Unilateral Hearing Aid", Otology & Neurotology, vol. 33, no. 4, pp. 572-579.
Boisvert, I., McMahon, C. M., Tremblay, G., & Lyxell, B. 2011, "Relative Importance of Monaural Sound Deprivation and Bilateral Significant Hearing Loss in Predicting Cochlear Implantation Outcomes", Ear and Hearing, vol. 32, no. 6, pp. 758-766.
Bonham, B. H. & Litvak, L. M. 2008, "Current focusing and steering: Modeling, physiology, and psychophysics", Hearing Research, vol. 242, no. 1-2, pp. 141-153.
Bonham, B., Snyder, S., Corbett, S., Johnson, T., Rebscher, S. 2005, Physiological Measures of Auditory Nerve Activation by Current Steering. Twenty-Eighth Annual Midwinter Research Meeting Association for Research in Otolaryngology. New Orleans, Louisiana 19-24 February. Assoc Res Otolaryngol Abst, New Jersey: Association for Research in Otolaryngology. Pp. 359. Retrieved 27 October 2012from http://www.aro.org/mwm/05_Abstract_Book.pdf.
Bovo, R., Ciorba, A., Trevisi, P., Aimoni, C., Cappiello, L., Castiglione, A., Govoni, M., & Martini, A. 2011, "Cochlear implant in Cogan syndrome", Acta Oto-Laryngologica, vol. 131, no. 5, pp. 494-497.
Briaire, J. J. & Frijns, J. H. M. 2006, "The consequences of neural degeneration regarding optimal cochlear implant position in scala tympani: A model approach", Hearing Research, vol. 214, no. 1-2, pp. 17-27.
Briggs, R. J., Tykocinski, M., Stidham, K., & Roberson, J. B. 2005, "Cochleostomy site: implications for electrode placement and hearing preservation", Acta Otolaryngol., vol. 125, no. 8, pp. 870-876.
Bronkhorst, A. W. 2000, "The cocktail party phenomenon: A review of research on speech intelligibility in multiple-talker conditions", Acustica, vol. 86, no. 1, pp. 117-128.
Page 360 of 393
Bronkhorst, A. W. & Plomp, R. 1992, "Effect of Multiple Speech-Like Maskers on Binaural Speech Recognition in Normal and Impaired Hearing", Journal of the Acoustical Society of America, vol. 92, no. 6, pp. 3132-3139.
Brown, A. M., Clark, G. M., Dowell, R. C., Martin, L. F., & Seligman, P. M. 1985, "Telephone use by a multi-channel cochlear implant patient. An evaluation using open-set CID sentences", J.Laryngol.Otol., vol. 99, no. 3, pp. 231-238.
Brown, K. D., Connell, S. S., Balkany, T. J., Eshraghi, A. E., Telischi, F. F., & Angeli, S. A. 2009, "Incidence and indications for revision cochlear implant surgery in adults and children", Laryngoscope, vol. 119, no. 1, pp. 152-157.
Bruce, I. A., Bates, J. E. H. M., Melling, C., Mawman, D., & Green, K. M. J. 2011, "Hearing Preservation Via a Cochleostomy Approach and Deep Insertion of a Standard Length Cochlear Implant Electrode", Otology & Neurotology, vol. 32, no. 9, pp. 1444-1447.
Brungart, D. S. 2001a, "Evaluation of speech intelligibility with the coordinate response measure", Journal of the Acoustical Society of America, vol. 109, no. 5, pp. 2276-2279.
Brungart, D. S. 2001b, "Informational and energetic masking effects in the perception of two simultaneous talkers", Journal of the Acoustical Society of America, vol. 109, no. 3, pp. 1101-1109.
Brungart, D. S., Simpson, B. D., Ericson, M. A., & Scott, K. R. 2001, "Informational and energetic masking effects in the perception of multiple simultaneous talkers", Journal of the Acoustical Society of America, vol. 110, no. 5, pp. 2527-2538.
Burian, K., Hochmair, E., Hochmairdesoyer, I., & Lessel, M. R. 1979, "Designing of and Experience with Multichannel Cochlear Implants", Acta Oto-Laryngologica, vol. 87, no. 3-4, pp. 190-195.
Carlyon, R. P., Long, C. J., Deeks, J. M., & McKay, C. M. 2007, "Concurrent sound segregation in electric and acoustic hearing", Jaro-Journal of the Association for Research in Otolaryngology, vol. 8, no. 1, pp. 119-133.
Chan, V., Tong, M., Yue, V., Wong, T., Leung, E., Yuen, K., & van Hasselt, A. 2007, "Performance of older adult cochlear implant users in Hong Kong", Ear Hear., vol. 28, no. 2 Suppl, pp. 52S-55S.
Chatelin, V., Kim, E. J., Driscoll, C., Larky, J., Polite, C., Price, L., & Lalwani, A. K. 2004, "Cochlear implant outcomes in the elderly", Otol.Neurotol., vol. 25, no. 3, pp. 298-301.
Chatterjee, M. & Yu, J. 2010, "A relation between electrode discrimination and amplitude modulation detection by cochlear implant listeners", Journal of the Acoustical Society of America, vol. 127, no. 1, pp. 415-426.
Page 361 of 393
Chikar, J. A., Batts, S. A., Pfingst, B. E., & Raphael, Y. 2009, "Visualization of spiral ganglion neurites within the Scala tympani with a cochlear implant in situ", Journal of Neuroscience Methods, vol. 179, no. 2, pp. 201-207.
Chikar, J. A., Colesa, D. J., Swiderski, D. L., Di Polo, A., Raphael, Y., & Pfingst, B. E. 2008, "Over-expression of BDNF by adenovirus with concurrent electrical stimulation improves cochlear implant thresholds and survival of auditory neurons", Hearing Research, vol. 245, no. 1-2, pp. 24-34.
Chouard, C. H., Macleod, P., Meyer, B., & Pialoux, P. 1977, "Electronic Device for Multichannel Cochlear Implant", Annales D Oto-Laryngologie et de Chirurgie Cervico-Faciale, vol. 94, no. 7-8, pp. 353-363.
Clark, G. M. 2008, "Personal reflections on the multichannel cochlear implant and a view of the future", Journal of Rehabilitation Research and Development, vol. 45, no. 5, pp. 651-693.
Clark, G. M., Hallworth, R. J., & Zdanius, K. 1975, "Cochlear Implant Electrode", Journal of Laryngology and Otology, vol. 89, no. 8, pp. 787-792.
Clark, G. M., Tong, Y. C., & Dowell, R. C. 1984, "Comparison of 2 Cochlear Implant Speech-Processing Strategies", Annals of Otology Rhinology and Laryngology, vol. 93, no. 2, pp. 127-131.
Clark, G. M., Tong, Y. C., & Martin, L. F. A. 1981, "A Multiple-Channel Cochlear Implant - An Evaluation Using Open-Set Cid Sentences", Laryngoscope, vol. 91, no. 4, pp. 628-634.
Cohen, L. T., Xu, J., Xu, S. A., & Clark, G. M. 1996, "Improved and simplified methods for specifying positions of the electrode bands of a cochlear implant array", American Journal of Otology, vol. 17, no. 6, pp. 859-865.
Cohen, N. L. & Waltzman, S. B. 1993, "Partial Insertion of the Nucleus Multichannel Cochlear Implant - Technique and Results", American Journal of Otology, vol. 14, no. 4, pp. 357-361.
Colburn, H. S., Shinn-Cunningham, B., Kidd, G., & Durlach, N. 2006, "The perceptual consequences of binaural hearing", International Journal of Audiology, vol. 45, p. S34-S44.
Collins, L. M. & Throckmorton, C. S. 2000, "Investigating perceptual features of electrode stimulation via a multidimensional scaling paradigm", Journal of the Acoustical Society of America, vol. 108, no. 5, pp. 2353-2365.
Collins, L. M., Wakefield, G. H., & Feinman, G. R. 1994, "Temporal Pattern-Discrimination and Speech Recognition Under Electrical-Stimulation", Journal of the Acoustical Society of America, vol. 96, no. 5, pp. 2731-2737.
Page 362 of 393
Collins, L. M., Zwolan, T. A., & Wakefield, G. H. 1997, "Comparison of electrode discrimination, pitch ranking, and pitch scaling data in postlingually deafened adult cochlear implant subjects", Journal of the Acoustical Society of America, vol. 101, no. 1, pp. 440-455.
Collins, M. M., Hawthorne, M. H., & Elhmd, K. 1997, "Cochlear implantation in a district general hospital: Problems and complications in the first five years", Journal of Laryngology and Otology, vol. 111, no. 4, pp. 325-332.
Cords, S. M., Reuter, G., Issing, P. R., Sommer, A., Kuzma, J., & Lenarz, T. 2000, "A silastic positioner for a modiolus-hugging position of intracochlear electrodes: Electrophysiologic effects", American Journal of Otology, vol. 21, no. 2, pp. 212-217.
Cote, M., Ferron, P., Bergeron, F., & Bussieres, R. 2007, "Cochlear reimplantation: causes of failure, outcomes, and audiologic performance", Laryngoscope, vol. 117, no. 7, pp. 1225-1235.
Cooper, F. S., Delattre, P. C., Liberman, A. M., Borst, J. M., & Gerstman, L. J. 1952, "Some Experiments on the Perception of Synthetic Speech Sounds", Journal of the Acoustical Society of America, vol. 24, no. 6, pp. 597-606.
Cushing, S. L., Daly, M. J., Treaba, C. G., Chan, H., Irish, J. C., Blaser, S., Gordon, K. A., & Papsin, B. C. 2012, "High-resolution cone-beam computed tomography: a potential tool to improve atraumatic electrode design and position", Acta Oto-Laryngologica, vol. 132, no. 4, pp. 361-368.
Dawson, P. W., Busby, P. A., McKay, C. M., & Clark, G. M. 2002, "Short-term auditory memory in children using cochlear implants and its relevance to receptive language", Journal of Speech Language and Hearing Research, vol. 45, no. 4.
Dawson, P. W., McKay, C. M., Busby, P. A., Grayden, D. B., & Clark, G. M. 2000, "Electrode discrimination and speech perception in young children using cochlear implants", Ear and Hearing, vol. 21, no. 6, pp. 597-607.
Dawson, P. W., Vandali, A. E., Knight, M. R., & Heasman, J. M. 2007, "Clinical evaluation of expanded input dynamic range in nucleus cochlear implants", Ear and Hearing, vol. 28, no. 2, pp. 163-176.
Djourno, A. & EYRIES, C. 1957, "[Auditory prosthesis by means of a distant electrical stimulation of the sensory nerve with the use of an indwelt coiling.]", Presse Med., vol. 65, no. 63, p. 1417.
Doll, T. J. & Hanna, T. E. 1995, "Spatial and Spectral Release from Masking in 3-Dimensional Auditory Displays", Human Factors, vol. 37, no. 2, pp. 341-355.

Page 363 of 393
Donaldson, G. S., Kreft, H. A., & Litvak, L. 2005, "Place-pitch discrimination of single- versus dual-electrode stimuli by cochlear implant users (L)", J.Acoust.Soc.Am., vol. 118, no. 2, pp. 623-626.
Donaldson, G. S. & Nelson, D. A. 2000, "Place-pitch sensitivity and its relation to consonant recognition by cochlear implant listeners using the MPEAK and SPEAK speech processing strategies", Journal of the Acoustical Society of America, vol. 107, no. 3, pp. 1645-1658.
Dorman M.F., Spahr A.J., 2006, "Speech perception by adults with multichannel cochlear implants". In: Waltzman SB, Roland JT Jr, editors. Cochlear implants. 2nd ed. New York (NY): Thieme. pp. 193–204.
Douek, E. 1985, "Cochlear implants", Br.Med.J.(Clin.Res.Ed), vol. 290, no. 6466, pp. 415-416.
Drennan, W. R. & Pfingst, B. E. 2005, "Current-level discrimination using bipolar and monopolar electrode configurations in cochlear implants", Hearing Research, vol. 202, no. 1-2, pp. 170-179.
Dunn, C. C., Noble, W., Tyler, R. S., Kordus, M., Gantz, B. J., & Ji, H. H. 2010, "Bilateral and Unilateral Cochlear Implant Users Compared on Speech Perception in Noise", Ear and Hearing, vol. 31, no. 2, pp. 296-298.
Dunn, C. C., Tyler, R. S., Witt, S. A., & Gantz, B. J. 2006, "Effects of converting bilateral cochlear implant subjects to a strategy with increased rate and number of channels", Annals of Otology Rhinology and Laryngology, vol. 115, no. 6, pp. 425-432.
Durisin, M., Bartling, S., Arnoldner, C., Ende, M., Prokein, J., Lesinski-Schiedat, A., Lanfermann, H., Lenarz, T., & Stover, T. 2010, "Cochlear Osteoneogenesis After Meningitis in Cochlear Implant Patients: A Retrospective Analysis", Otology & Neurotology, vol. 31, no. 7, pp. 1072-1078.
Durlach, N. I. 1963, "Equalization and Cancellation Theory of Binaural Masking-Level Differences", Journal of the Acoustical Society of America, vol. 35, no. 8, p. 1206-&.
Eapen, R. J., Buss, E., Adunka, M. C., Pillsbury, H. C., & Buchman, C. A. 2009, "Hearing-in-Noise Benefits After Bilateral Simultaneous Cochlear Implantation Continue to Improve 4 Years After Implantation", Otology & Neurotology, vol. 30, no. 2, pp. 153-159.
Erixon, E., Kobler, S., & Rask-Andersen, H. 2012, "Cochlear implantation and hearing preservation: Results in 21 consecutively operated patients using the round window approach", Acta Oto-Laryngologica, vol. 132, no. 9, pp. 923-931.
Page 364 of 393
Eshraghi, A. A., Yang, N. W., & Balkany, T. J. 2003, "Comparative study of cochlear damage with three perimodiolar electrode designs", Laryngoscope, vol. 113, no. 3, pp. 415-419.
Faccioli, N., Barillari, M., Guariglia, S., Zivelonghi, E., Rizzotti, A., Cerini, R., & Mucelli, R. P. 2009, "Radiation dose saving through the use of cone-beam CT in hearing-impaired patients", Radiologia Medica, vol. 114, no. 8, pp. 1308-1318.
Faulkner, A. 2006, "Adaptation to distorted frequency-to-place maps: implications of simulations in normal listeners for cochlear implants and electroacoustic stimulation", Audiol.Neurootol., vol. 11 Suppl 1, pp. 21-26.
Faulkner, A., Rosen, S., & Norman, C. 2006, "The right information may matter more than frequency-place alignment: simulations of frequency-aligned and upward shifting cochlear implant processors for a shallow electrode array insertion", Ear Hear., vol. 27, no. 2, pp. 139-152.
Ferguson, W. D., Collins, L. M., & Smith, D. W. 2003, "Psychophysical threshold variability in cochlear implant subjects", Hearing Research, vol. 180, no. 1-2, pp. 101-113.
Finley, C. C. & Skinner, M. W. 2008, "Role of electrode placement as a contributor to variability in cochlear implant outcomes", Otol.Neurotol., vol. 29, no. 7, pp. 920-928.
Firszt, J. B., 2003. Hiresolution sound processing retrieved from Advanced Bionics website, [online] Advanced Bionics. Available at: http://www.advancedbionics.com/content/dam/ab/Global/en_ce/documents/libraries/Professional%20Library/AB%20Technical%20Reports/Sound%20Processing/HiResolution_Sound_Processing_article.pdf. [Retrieved December 30, 2012 ]. Firszt, J. B., Holden, L. K., Reeder, R. M., & Skinner, M. W. 2009, "Speech recognition in cochlear implant recipients: comparison of standard HiRes and HiRes 120 sound processing", Otol.Neurotol., vol. 30, no. 2, pp. 146-152.
Firszt, J. B., Koch, D. B., Downing, M., & Litvak, L. 2007, "Current steering creates additional pitch percepts in adult cochlear implant recipients", Otology & Neurotology, vol. 28, no. 5, pp. 629-636.
Fourakis, M. S., Hawks, J. W., Holden, L. K., Skinner, M. W., & Holden, T. A. 2004, "Effect of frequency boundary assignment on vowel recognition with the Nucleus 24 ACE speech coding strategy", J.Am.Acad.Audiol., vol. 15, no. 4, pp. 281-299.
Fourakis, M. S., Hawks, J. W., Holden, L. K., Skinner, M. W., & Holden, T. A. 2007, "Effect of frequency boundary assignment on speech recognition with the nucleus 24 ACE speech coding strategy", Journal of the American Academy of Audiology, vol. 18, no. 8, pp. 700-717.
Page 365 of 393
Francart, T., & Wouters, J. 2007, "Perception of across-frequency interaural level differences", The Journal of the Acoustical Society of America, vol. 122, no. 5, pp. 2826-2831.
Francis, H. W., Yeagle, J. D., Brightwell, T., & Venick, H. 2004, "Central effects of residual hearing: implications for choice of ear for cochlear implantation", Laryngoscope, vol. 114, no. 10, pp. 1747-1752.
Franck, K. H., Xu, L., & Pfingst, B. E. 2003, "Effects of stimulus level on speech perception with cochlear prostheses", Jaro, vol. 4, no. 1, pp. 49-59.
Franco-Vidal, V., Songu, M., Blanchet, H., Barreau, X., & Darrouzet, V. 2007, "Intracochlear hemorrhage after gamma knife radiosurgery", Otol.Neurotol., vol. 28, no. 2, pp. 240-244.
Freyman, R. L., Helfer, K. S., Mccall, D. D., & Clifton, R. K. 1999, "The role of perceived spatial separation in the unmasking of speech", Journal of the Acoustical Society of America, vol. 106, no. 6, pp. 3578-3588.
Friedland, D. R. & Runge-Samuelson, C. 2009, "Soft cochlear implantation: rationale for the surgical approach", Trends Amplif., vol. 13, no. 2, pp. 124-138.
Friedland, D. R., Runge-Samuelson, C., Baig, H., & Jensen, J. 2010, "Case-control analysis of cochlear implant performance in elderly patients", Arch.Otolaryngol.Head Neck Surg., vol. 136, no. 5, pp. 432-438.
Friedland, D. R., Venick, H. S., & Niparko, J. K. 2003, "Choice of ear for cochlear implantation: the effect of history and residual hearing on predicted postoperative performance", Otol.Neurotol., vol. 24, no. 4, pp. 582-589.
Friesen, L. M. & Picton, T. W. 2010, "A method for removing cochlear implant artifact", Hearing Research, vol. 259, no. 1-2, pp. 95-106.
Friesen, L. M., Shannon, R. V., Baskent, D., & Wang, X. 2001, "Speech recognition in noise as a function of the number of spectral channels: Comparison of acoustic hearing and cochlear implants", Journal of the Acoustical Society of America, vol. 110, no. 2, pp. 1150-1163.
Friesen, L. M., Shannon, R. V., & Cruz, R. J. 2005, "Effects of stimulation rate on speech recognition with cochlear implants", Audiology and Neuro-Otology, vol. 10, no. 3, pp. 169-184.
Friesen, L. M., Shannon, T. V., & Slattery, W. H. 1999, "The effect of frequency allocation on phoneme recognition with the nucleus 22 cochlear implant", American Journal of Otology, vol. 20, no. 6, pp. 729-734.
Friesen, L. M. & Tremblay, K. L. 2006, "Acoustic change complexes recorded in adult cochlear implant listeners", Ear and Hearing, vol. 27, no. 6, pp. 678-685.

Page 366 of 393
Friesen, L. M., Tremblay, K. L., Rohila, N., Wright, R. A., Shannon, R. V., Baskent, D., & Rubinstein, J. T. 2009, "Evoked cortical activity and speech recognition as a function of the number of simulated cochlear implant channels", Clinical Neurophysiology, vol. 120, no. 4, pp. 776-782.
Frijns, J. H., Klop, W. M., Bonnet, R. M., & Briaire, J. J. 2003, "Optimizing the number of electrodes with high-rate stimulation of the clarion CII cochlear implant", Acta Otolaryngol., vol. 123, no. 2, pp. 138-142.
Fu, Q. J. 2002, "Temporal processing and speech recognition in cochlear implant users", Neuroreport, vol. 13, no. 13, pp. 1635-1639.
Fu, Q. J. & Nogaki, G. 2005, "Noise susceptibility of cochlear implant users: the role of spectral resolution and smearing", J.Assoc.Res.Otolaryngol., vol. 6, no. 1, pp. 19-27.
Fu, Q. J. & Shannon, R. V. 1999a, "Effects of electrode configuration and frequency allocation on vowel recognition with the Nucleus-22 cochlear implant", Ear Hear., vol. 20, no. 4, pp. 332-344.
Fu, Q. J. & Shannon, R. V. 1999b, "Recognition of spectrally degraded and frequency-shifted vowels in acoustic and electric hearing", Journal of the Acoustical Society of America, vol. 105, no. 3, pp. 1889-1900.
Fu, Q. J., Shannon, R. V., & Wang, X. 1998, "Effects of noise and spectral resolution on vowel and consonant recognition: acoustic and electric hearing", J.Acoust.Soc.Am., vol. 104, no. 6, pp. 3586-3596.
Fu, Q. J., Zeng, F. G., Shannon, R. V., & Soli, S. D. 1998, "Importance of tonal envelope cues in Chinese speech recognition", Journal of the Acoustical Society of America, vol. 104, no. 1, pp. 505-510.
Gani, M., Valentini, G., Sigrist, A., Kos, M. I., & Boex, C. 2007, "Implications of deep electrode insertion on cochlear implant fitting", J.Assoc.Res.Otolaryngol., vol. 8, no. 1, pp. 69-83.
Gantz, B. J. & Turner, C. 2004, "Combining acoustic and electrical speech processing: Iowa/Nucleus hybrid implant", Acta Otolaryngol., vol. 124, no. 4, pp. 344-347.
Gantz, B. J. & Turner, C. W. 2003, "Combining acoustic and electrical hearing", Laryngoscope, vol. 113, no. 10, pp. 1726-1730.
Gantz, B. J., Woodworth, G. G., Knutson, J. F., Abbas, P. J., & Tyler, R. S. 1993, "Multivariate predictors of audiological success with multichannel cochlear implants", Ann.Otol.Rhinol.Laryngol., vol. 102, no. 12, pp. 909-916.
Garadat, S. N. & Pfingst, B. E. 2011, "Relationship between gap detection thresholds and loudness in cochlear-implant users", Hearing Research, vol. 275, no. 1-2, pp. 130-138.
Page 367 of 393
Garadat, S. N., Zwolan, T. A., & Pfingst, B. E. 2012, "Across-site patterns of modulation detection: Relation to speech recognition", Journal of the Acoustical Society of America, vol. 131, no. 5, pp. 4030-4041.
Garcia-Ibanez, L., Macias, A. R., Morera, C., Rodriguez, M. M., Szyfter, W., Skarszynski, H., Emamdjomeh, H., & Baumgartner, W. D. 2009, "An evaluation of the preservation of residual hearing with the Nucleus Contour Advance electrode", Acta Oto-Laryngologica, vol. 129, no. 6, pp. 651-664.
Gfeller, K., Christ, A., Knutson, J., Witt, S., & Mehr, M. 2003, "The effects of familiarity and complexity on appraisal of complex songs by cochlear implant recipients and normal hearing adults", J.Music.Ther., vol. 40, no. 2, pp. 78-112.
Gfeller, K., Oleson, J., Knutson, J. F., Breheny, P., Driscoll, V., & Olszewski, C. 2008, "Multivariate predictors of music perception and appraisal by adult cochlear implant users", J.Am.Acad.Audiol., vol. 19, no. 2, pp. 120-134.
Gfeller, K., Witt, S., Adamek, M., Mehr, M., Rogers, J., Stordahl, J., & Ringgenberg, S. 2002a, "Effects of training on timbre recognition and appraisal by postlingually deafened cochlear implant recipients", J.Am.Acad.Audiol., vol. 13, no. 3, pp. 132-145.
Gfeller, K., Witt, S., Woodworth, G., Mehr, M. A., & Knutson, J. 2002b, "Effects of frequency, instrumental family, and cochlear implant type on timbre recognition and appraisal", Ann.Otol.Rhinol.Laryngol., vol. 111, no. 4, pp. 349-356.
Goldwyn, J. H., Bierer, S. M., & Bierer, J. A. 2010, "Modeling the electrode-neuron interface of cochlear implants: Effects of neural survival, electrode placement, and the partial tripolar configuration", Hearing Research, vol. 268, no. 1-2, pp. 93-104.
Gomaa, N. A., Rubinstein, J. T., Lowder, M. W., Tyler, R. S., & Gantz, B. J. 2003, "Residual speech perception and cochlear implant performance in postlingually deafened adults", Ear Hear., vol. 24, no. 6, pp. 539-544.
Gosepath, J., Lippert, K., Keilmann, A., & Mann, W. J. 2009, "Analysis of fifty-six cochlear implant device failures", ORL J.Otorhinolaryngol.Relat Spec., vol. 71, no. 3, pp. 142-147.
Grantham, D. W., Ashmead, D. H., Ricketts, T. A., Haynes, D. S., & Labadie, R. F. 2008, "Interaural time and level difference thresholds for acoustically presented signals in post-lingually deafened adults fitted with bilateral cochlear implants using CIS plus processing", Ear and Hearing, vol. 29, no. 1, pp. 33-44.
Grayden,D.B., and Graeme,M.C., 2006, "Implant design and development". In Cochlear Implants: A practical Guide, H.R. Cooper, and L.C. Craddock, eds. London: Whurr.
Page 368 of 393
Green, K. M., Bhatt, Y. M., Mawman, D. J., O'Driscoll, M. P., Saeed, S. R., Ramsden, R. T., & Green, M. W. 2007, "Predictors of audiological outcome following cochlear implantation in adults", Cochlear.Implants.Int., vol. 8, no. 1, pp. 1-11.
Gstoettner, W., Kiefer, J., Baumgartner, W. D., Pok, S., Peters, S., & Adunka, O. 2004, "Hearing preservation in cochlear implantation for electric acoustic stimulation", Acta Otolaryngol., vol. 124, no. 4, pp. 348-352.
Gstoettner, W., Plenk, H., Jr., Franz, P., Hamzavi, J., Baumgartner, W., Czerny, C., & Ehrenberger, K. 1997, "Cochlear implant deep electrode insertion: extent of insertional trauma", Acta Otolaryngol., vol. 117, no. 2, pp. 274-277.
Guldner, C., Wiegand, S., Weiss, R., Bien, S., Sesterhenn, A., Teymoortash, A., & Diogo, I. 2012, "Artifacts of the electrode in cochlea implantation and limits in analysis of deep insertion in cone beam tomography (CBT)", European Archives of Oto-Rhino-Laryngology, vol. 269, no. 3, pp. 767-772.
Gupta, R., Bartling, S. H., Basu, S. K., Ross, W. R., Becker, H., Pfoh, A., Brady, T., & Curtin, H. D. 2004, "Experimental flat-panel high-spatial-resolution volume CT of the temporal bone", American Journal of Neuroradiology, vol. 25, no. 8, pp. 1417-1424.
Halliday, L.F., Taylor, J.L., Millward, K.E. & Moore, D.R. 2012, "Lack of generalization of auditory learning in typically developing children", Journal of Speech, Language and Hearing Research, vol. 55, no. 1, pp. 168-181.
Hargunani, C. A., Kempton, J. B., DeGagne, J. M., & Trune, D. R. 2006, "Intratympanic injection of dexamethasone: time course of inner ear distribution and conversion to its active form", Otol.Neurotol., vol. 27, no. 4, pp. 564-569.
Harnack, D., Winter, C., Meissner, W., Reum, T., Kupsch, A., & Morgenstern, R. 2004, "The effects of electrode material, charge density and stimulation duration on the safety of high-frequency stimulation of the subthalamic nucleus in rats", J.Neurosci.Methods, vol. 138, no. 1-2, pp. 207-216.
Hartrampf R., Weber B., Dahm M. C., Lenar T. 1995, “Management of obliteration of the cochlea in cochlear implantation”, Ann Otol Rhinol Laryngol Suppl., vol. 166, pp. 416-418.
Hawley, M. L., Litovsky, R. Y., & Colburn, H. S. 1999, "Speech intelligibility and localization in a multi-source environment", Journal of the Acoustical Society of America, vol. 105, no. 6, pp. 3436-3448.
Hawley, M. L., Litovsky, R. Y., & Culling, J. F. 2004, "The benefit of binaural hearing in a cocktail party: Effect of location and type of interferer", Journal of the Acoustical Society of America, vol. 115, no. 2, pp. 833-843.
Page 369 of 393
Hedrick, M. S. & Carney, A. E. 1997, "Effect of relative amplitude rind formant transitions on perception of place of articulation by adult listeners with cochlear implants", Journal of Speech Language and Hearing Research, vol. 40, no. 6, pp. 1445-1457.
Helbig, S., Van de Heyning, P., Kiefer, J., Baumann, U., Kleine-Punte, A., Brockmeier, H., Anderson, I., & Gstoettner, W. 2011, "Combined electric acoustic stimulation with the PULSARCI(100) implant system using the FLEXEAS electrode array", Acta Oto-Laryngologica, vol. 131, no. 6, pp. 585-595.
Helfer, K. S., Chevalier, J., & Freyman, R. L. 2010, "Aging, spatial cues, and single- versus dual-task performance in competing speech perception", Journal of the Acoustical Society of America, vol. 128, no. 6, pp. 3625-3633.
Helfer, K. S. & Freyman, R. L. 2008, "Aging and speech-on-speech masking", Ear and Hearing, vol. 29, no. 1, pp. 87-98.
Henry, B. A., McKay, C. M., McDermott, H. J., & Clark, G. M. 2000, "The relationship between speech perception and electrode discrimination in cochlear implantees", Journal of the Acoustical Society of America, vol. 108, no. 3, pp. 1269-1280.
Hiraumi, H., Tsuji, J., Kanemaru, S., Fujino, K., & Ito, J. 2007, "Cochlear implants in post-lingually deafened patients", Acta Otolaryngol.Suppl., no. 557, pp. 17-21.
Hochmair, I., Arnold, W., Nopp, P., Jolly, C., Muller, J., & Roland, P. 2003, "Deep electrode insertion in cochlear implants: apical morphology, electrodes and speech perception results", Acta Otolaryngol., vol. 123, no. 5, pp. 612-617.
HochmairDesoyer, I. J., Hochmair, E. S., Burian, K., & Stiglbrunner, H. K. 1983, "Percepts from the Vienna Cochlear-Prosthesis", Annals of the New York Academy of Sciences, vol. 405, no. JUN, pp. 295-306.
Hodez C. Griffaton-Taillandier, C. Bensimon I. 2011, "Cone-beam imaging: Applications in ENT", European Annals of Otorhinolaryngology, Head and Neck diseases, vol. 128, no. 2, PP. 65-78.
Hodges, A. V., Dolan, A. M., Balkany, T. J., Schloffman, J. J., & Butts, S. L. 1999, "Speech perception results in children with cochlear implants: contributing factors", Otolaryngol.Head Neck Surg., vol. 121, no. 1, pp. 31-34.
Holden, L. K., Skinner, M. W., Holden, T. A., & Demorest, M. E. 2002, "Effects of stimulation rate with the nucleus 24 ACE speech coding strategy", Ear and Hearing, vol. 23, no. 5, pp. 463-476.
Hornsby, B. W. Y., Ricketts, T. A., & Johnson, E. E. 2006, "The effects of speech and speechlike maskers on unaided and aided speech recognition in
Page 370 of 393
persons with hearing loss", Journal of the American Academy of Audiology, vol. 17, no. 6, pp. 432-447.
House WF, Urban J. 1973, "Long term results of electrode implantation and electronic stimulation of the cochlea in man", Ann Otol Rhinol Laryngol, vol. 82, no. 4, pp. 504.
Huang, C. Q., Tykocinski, M., Stathopoulos, D., & Cowan, R. 2007, "Effects of steroids and lubricants on electrical impedance and tissue response following cochlear implantation", Cochlear Implants International, vol. 8, no. 3, pp. 123-147.
Hughes, M. L. 2008, "A re-evaluation of the relation between physiological channel interaction and electrode pitch ranking in cochlear implants", Journal of the Acoustical Society of America, vol. 124, no. 5, pp. 2711-2714.
Hughes, M. L. & Abbas, P. J. 2006, "The relation between electrophysiologic channel interaction and electrode pitch ranking in cochlear implant recipients", Journal of the Acoustical Society of America, vol. 119, no. 3, pp. 1527-1537.
Hughes, M. L., Werff, K. R. V., Brown, C. J., Abbas, P. J., Kelsay, D. M. R., Teagle, H. F. B., & Lowder, M. W. 2001, "A longitudinal study of electrode impedance, the electrically evoked compound action potential, and behavioral measures in Nucleus 24 cochlear implant users", Ear and Hearing, vol. 22, no. 6, pp. 471-486.
International Organization for Standardization. Implants for surgery - active implantable medical devices - part 1: General requirements for safety, marking, and for information to be provided by the manufacturer, 2000. ISO 14708-1.
James, C., Albegger, K., Battmer, R., Burdo, S., Deggouj, N., Deguine, O., Dillier, N., Gersdorff, M., Laszig, R., Lenarz, T., Rodriguez, M. M., Mondain, M., Offeciers, E., Macias, A. R., Ramsden, R., Sterkers, O., Von Wallenberg, E., Weber, B., & Fraysse, B. 2005, "Preservation of residual hearing with cochlear implantation: how and why", Acta Otolaryngol., vol. 125, no. 5, pp. 481-491.
James, C. J., Blamey, P. J., Martin, L., Swanson, B., Just, Y., & Macfarlane, D. 2002, "Adaptive dynamic range optimization for cochlear implants: A preliminary study", Ear and Hearing, vol. 23, no. 1, pp. 49S-58S.
James, C. J., Skinner, M. W., Martin, L. F. A., Holden, L. K., Galvin, K. L., Holden, T. A., & Whitford, L. 2003, "An investigation of input level range for the nucleus 24 cochlear implant system: Speech perception performance, program preference, and loudness comfort ratings", Ear and Hearing, vol. 24, no. 2, pp. 157-174.
Page 371 of 393
Jerger, J., Jerger, S., Oliver, T., & Pirozzolo, F. 1989a, "Speech understanding in the elderly", Ear Hear., vol. 10, no. 2, pp. 79-89.
Jerger, J., Stach, B., Pruitt, J., Harper, R., & Kirby, H. 1989b, "Comments on "Speech Understanding and Aging"", J.Acoust.Soc.Am., vol. 85, no. 3, pp. 1352-1354.
Kang, S. Y., Colesa, D. J., Swiderski, D. L., Su, G. L., Raphael, Y., & Pfingst, B. E. 2010, "Effects of Hearing Preservation on Psychophysical Responses to Cochlear Implant Stimulation", Jaro-Journal of the Association for Research in Otolaryngology, vol. 11, no. 2, pp. 245-265.
Kang, S. Y., Zwolan, T. A., Kileny, P. R., Niparko, J. K., Driscoll, C. L., Shelton, C., & Telian, S. A. 2009, "Incomplete electrode extraction during cochlear implant revision", Otol.Neurotol., vol. 30, no. 2, pp. 160-164.
Kerber, S. & Seeber, B. U. 2012, "Sound Localization in Noise by Normal-Hearing Listeners and Cochlear Implant Users", Ear and Hearing, vol. 33, no. 4, pp. 445-457.
Ketten, D. R., Vannier, M. W., Skinner, M. W., Gates, G. A., Wang, G., & Neely, J. G. 1998, "In vivo measures of cochlear length and insertion depth of nucleus cochlear implant electrode arrays", Annals of Otology Rhinology and Laryngology, vol. 107, no. 11, pp. 1-16.
Kidd, G., Mason, C. R., Rohtla, T. L., & Deliwala, P. S. 1998, "Release from masking due to spatial separation of sources in the identification of nonspeech auditory patterns", Journal of the Acoustical Society of America, vol. 104, no. 1, pp. 422-431.
Kidd, G., Mason, C. R., Deliwala, P. S., Woods, W. S., & Colburn, H. S. 1994, "Reducing Informational Masking by Sound Segregation", Journal of the Acoustical Society of America, vol. 95, no. 6, pp. 3475-3480.
Kidd, G., Mason, C. R., & Rohtla, T. L. 1995, "Binaural Advantage for Sound Pattern Identification", Journal of the Acoustical Society of America, vol. 98, no. 4, pp. 1977-1986.
Kiefer, J., Gstoettner, W., Baumgartner, W., Pok, S. M., Tillein, J., Ye, Q., & Von Ilberg, C. 2004, "Conservation of low-frequency hearing in cochlear implantation", Acta Oto-Laryngologica, vol. 124, no. 3, pp. 272-280.
Kiefer, J., Weber, A., Pfennigdorff, T., & Von Ilberg, C. 2000, "Scala vestibuli insertion in cochlear implantation: A valuable alternative for cases with obstructed scala tympani", Orl-Journal for Oto-Rhino-Laryngology and Its Related Specialties, vol. 62, no. 5, pp. 251-256.
Kiefer, J., Ye, Q., Tillein, J., Adunka, O., Arnold, W., & Gstottner, W. 2007, "Protecting the cochlea during stapes surgery: is there a role for corticosteroids?", Adv.Otorhinolaryngol., vol. 65, pp. 300-307.
Page 372 of 393
Kitterick, P. T., Bailey, P. J., & Summerfield, A. Q. 2010, "Benefits of knowing who, where, and when in multi-talker listening", Journal of the Acoustical Society of America, vol. 127, no. 4, pp. 2498-2508.
Kitterick P. T. , Lovett R. E.S., Goman A. M., Summerfield A. Q. 2011 "The AB-York Crescent of Sound: an apparatus for assessing spatial-listening skills in children and adults", Cochlear Implants International, vol. 12, no. 3, pp. 164-9
Knutson,J.F. (2006). Psychological aspects of cochlear implantation. In Cochlear Implants: A practical Guide, H.R. Cooper, and L.C. Craddock, eds. London: Whurr Publishing.
Knutson, J. F., Hinrichs, J. V., Tyler, R. S., Gantz, B. J., Schartz, H. A., & Woodworth, G. 1991, "Psychological predictors of audiological outcomes of multichannel cochlear implants: preliminary findings", Ann.Otol.Rhinol.Laryngol., vol. 100, no. 10, pp. 817-822.
Koch, D. B., Downing, M., Osberger, M. J., & Litvak, L. 2007, Using current steering to increase spectral resolution in CII and HiRes 90K users, Ear and Hearing, vol. 28, no. 2, pp. 38S-41S.
Koehnke, J. & Besing, J. M. 1996, "A procedure for testing speech intelligibility in a virtual listening environment", Ear and Hearing, vol. 17, no. 3, pp. 211-217.
Kontorinis, G., Giourgas, A., Neuburger, J., Lesinski-Schiedat, A., & Lenarz, T. 2010, "Long-Term Evaluation of Cochlear Implantation in Cogan Syndrome", Orl-Journal for Oto-Rhino-Laryngology and Its Related Specialties, vol. 72, no. 5, pp. 275-279.
Kontorinis, G., Scheper, V., Wissel, K., Stover, T., Lenarz, T., & Paasche, G. 2012, "In vitro modifications of the scala tympani environment and the cochlear implant array surface", Laryngoscope, vol. 122, no. 9, pp. 2057-2063.
Kreft, H. A., Donaldson, G. S., & Nelson, D. A. 2004a, "Effects of pulse rate and electrode array design on intensity discrimination in cochlear implant users", Journal of the Acoustical Society of America, vol. 116, no. 4, pp. 2258-2268.
Kreft, H. A., Donaldson, G. S., & Nelson, D. A. 2004b, "Effects of pulse rate on threshold and dynamic range in Clarion cochlear-implant users (L)", Journal of the Acoustical Society of America, vol. 115, no. 5, pp. 1885-1888.
Kwon, B. J. & van den Honert, C. 2006, "Dual-electrode pitch discrimination with sequential interleaved stimulation by cochlear implant users", Journal of the Acoustical Society of America, vol. 120, no. 1, p. EL1-EL6.
Page 373 of 393
Laback, B., Pok, S. M., Baumgartner, W. D., Deutsch, W. A., & Schmid, K. 2004, "Sensitivity to interaural level and envelope time differences of two bilateral cochlear implant listeners using clinical sound processors", Ear and Hearing, vol. 25, no. 5, pp. 488-500.
Labadie, R. F., Carrasco, V. N., Gilmer, C. H., & Pillsbury, H. C., III 2000, "Cochlear implant performance in senior citizens", Otolaryngol.Head Neck Surg., vol. 123, no. 4, pp. 419-424.
Landis, J. R. & Koch, G. G. 1977, "Measurement of Observer Agreement for Categorical Data", Biometrics, vol. 33, no. 1, pp. 159-174.
Landsberger, D. M. & McKay, C. M. 2005, "Perceptual differences between low and high rates of stimulation on single electrodes for cochlear implantees", Journal of the Acoustical Society of America, vol. 117, no. 1, pp. 319-327.
Laszig, R., Aschendorff, A., Stecker, M., Muller-Deile, J., Maune, S., Dillier, N., Weber, B., Hey, M., Begall, K., Lenarz, T., Battmer, R. D., Bohm, M., Steffens, T., Strutz, J., Linder, T., Probst, R., Allum, J., Westhofen, M., & Doering, W. 2004, "Benefits of bilateral electrical stimulation with the nucleus cochlear implant in adults: 6-month postoperative results", Otology & Neurotology, vol. 25, no. 6, pp. 958-968.
Laszig, R., Ridder, G. J., & Fradis, M. 2002, "Intracochlear insertion of electrodes using hyaluronic acid in cochlear implant surgery", J.Laryngol.Otol., vol. 116, no. 5, pp. 371-372.
Lawson, D. T., Wilson, B. S., Zerbi, M., van den Honert, C., Finley, C. C., Farmer, J. C., McElveen, J. T., & Roush, P. A. 1998, "Bilateral cochlear implants controlled by a single speech processor", American Journal of Otology, vol. 19, no. 6, pp. 758-761.
Lazard D.S., Vincent C., Venail F., Van de Heyning P., Truy E, et al. 2012, " Pre-, Per- and Postoperative Factors Affecting Performance of Postlinguistically Deaf Adults Using Cochlear Implants: A New Conceptual Model over Time", PLoS ONE vol. 7, no. 11, e48739. doi:10.1371/journal.pone.0048739
Leake P. A., Kessler D. K., and Mer enich M. M. 1990, “Application and safety of cochlear prostheses,” in Neural Prostheses: Fundamental Studies, W. F. Agnew and D. B. McCreery, Eds. Englewood Cliffs, NJ: Prentice-Hall, pp. 253-296.
Lehnhardt, E. 1993, "[Intracochlear placement of cochlear implant electrodes in soft surgery technique]", HNO, vol. 41, no. 7, pp. 356-359.
Lenarz, M., Sonmez, H., Joseph, G., Buchner, A., & Lenarz, T. 2012, "Cochlear implant performance in geriatric patients", Laryngoscope, vol. 122, no. 6, pp. 1361-1365.
Page 374 of 393
Lenarz, T., Buchner, A., Tasche, C., Cristofoli, T., Lesinski-Schiedat, A., Wallenberg, E. V., Battmer, R. D., Busby, P. A., & Frohne, C. 2002, "The results in patients implanted with the nucleus double array cochlear implant: pitch discrimination and auditory performance", Ear Hear., vol. 23, no. 1 Suppl, pp. 90S-101S.
Lenarz, T., Lesinski-Schiedat, A., Weber, B. P., Issing, P. R., Frohne, C., Buchner, A., Battmer, R. D., Parker, J., & Von Wallenberg, E. 2001, "The nucleus double array cochlear implant: a new concept for the obliterated cochlea", Otol.Neurotol., vol. 22, no. 1, pp. 24-32.
Lenarz, T., Stover, T., Buechner, A., Lesinski-Schiedat, A., Patrick, J., & Pesch, J. 2009, "Hearing Conservation Surgery Using the Hybrid-L Electrode Results from the First Clinical Trial at the Medical University of Hannover", Audiology and Neuro-Otology, vol. 14, pp. 22-31.
Lenarz, T., Stover, T., Buechner, A., Paasche, G., Briggs, R., Risi, F., Pesch, J., & Battmer, R. D. 2006, "Temporal bone results and hearing preservation with a new straight electrode", Audiol.Neurootol., vol. 11 Suppl 1, pp. 34-41.
Leung, J., Wang, N. Y., Yeagle, J. D., Chinnici, J., Bowditch, S., Francis, H. W., & Niparko, J. K. 2005, "Predictive models for cochlear implantation in elderly candidates", Arch.Otolaryngol.Head Neck Surg., vol. 131, no. 12, pp. 1049-1054.
Li, P. M. M. C., Wang, H. B., Northrop, C., Merchant, S. N., & Nadol, J. B. 2007, "Anatomy of the round window and hook region of the cochlea with implications for cochlear implantation and other endocochlear surgical procedures", Otology & Neurotology, vol. 28, no. 5, pp. 641-648.
Lin, Y. S. 2009, "Clinical outcomes of scala vestibuli cochlear implantation in children with partial labyrinthine ossification", Acta Otolaryngol., vol. 129, no. 3, pp. 273-280.
Litvak LM, Spahr AJ, Emadi G. 2007, "Loudness growth observed under partially tripolar stimulation: model and data from cochlear implant listeners", Journal of the Acoustical Society of America, vol. 122, no. 2, pp. 967-981.
Litovsky, R., Parkinson, A., Arcaroli, J., & Sammeth, C. 2006, "Simultaneous bilateral cochlear implantation in adults: A multicenter clinical study", Ear and Hearing, vol. 27, no. 6, pp. 714-731.
Loizou, P. C. 1998, "Mimicking the human ear", Ieee Signal Processing Magazine, vol. 15, no. 5, pp. 101-130.
Loizou, P. C. 1999, "Introduction to cochlear implants", Ieee Engineering in Medicine and Biology Magazine, vol. 18, no. 1, pp. 32-42.
Page 375 of 393
Loizou, P. C., Stickney, G., Mishra, L., & Assmann, P. 2003, "Comparison of speech processing strategies used in the Clarion implant processor", Ear Hear., vol. 24, no. 1, pp. 12-19.
Luo, X., Fu, Q. J., Wei, C. G., & Cao, K. L. 2008, "Speech Recognition and Temporal Amplitude Modulation Processing by Mandarin-Speaking Cochlear Implant Users", Ear and Hearing, vol. 29, no. 6, pp. 957-970.
Lustig, L. R., Yeagle, J., Niparko, J. K., & Minor, L. B. 2003, "Cochlear implantation in patients with bilateral Meniere's syndrome", Otology & Neurotology, vol. 24, no. 3, pp. 397-403.
Lyxell, B. 1996, "Cognitive predictors of speech understanding following a cochlear implant operation", International Journal of Psychology, vol. 31, no. 3-4, p. 4738.
Lyxell, B., Andersson, J., Andersson, U., Arlinger, S., Bredberg, G., & Harder, H. 1998, "Phonological representation and speech understanding with cochlear implants in deafened adults", Scandinavian Journal of Psychology, vol. 39, no. 3, pp. 175-179.
Lyxell, B., Andersson, U., Borg, E., & Ohlsson, I. S. 2003, "Working-memory capacity and phonological processing in deafened adults and individuals with a severe hearing impairment", International Journal of Audiology, vol. 42, p. S86-S89.
Lyxell, B., Ronnberg, J., & Samuelsson, S. 1994, "Internal Speech Functioning and Speechreading in Deafened and Normal-Hearing Adults", Scandinavian Audiology, vol. 23, no. 3, pp. 179-185.
Lyxell, B., Sahlen, B., Wass, M., Ibertsson, T., Larsby, B., Hallgren, M., & Maki-Torkko, E. 2008, "Cognitive development in children with cochlear implants: Relations to reading and communication", International Journal of Audiology, vol. 47, p. S47-S52.
Magnusson, L. 2011, "Comparison of the fine structure processing (FSP) strategy and the CIS strategy used in the MED-EL cochlear implant system: Speech intelligibility and music sound quality", International Journal of Audiology, vol. 50, no. 4, pp. 279-287.
McAlpine, D. 2005, "Creating a sense of auditory space", Journal of Physiology-London, vol. 566, no. 1, pp. 21-28.
McDermott, H. J. & McKay, C. M. 1994, "Pitch Ranking with Nonsimultaneous Dual-Electrode Electrical-Stimulation of the Cochlea", Journal of the Acoustical Society of America, vol. 96, no. 1, pp. 155-162.
McDermott, H. J. & McKay, C. M. 1997, "Musical pitch perception with electrical stimulation of the cochlea", Journal of the Acoustical Society of America, vol. 101, no. 3, pp. 1622-1631.
Page 376 of 393
McDermott, H. J., McKay, C. M., Richardson, L. M., & Henshall, K. R. 2003, "Application of loudness models to sound processing for cochlear implants", Journal of the Acoustical Society of America, vol. 114, no. 4, pp. 2190-2197.
McElveen, J. T., Jr., Wolford, R. D., Jr., & Miyamoto, R. T. 1995, "Implications of bone pate in cochlear implant surgery", Otolaryngol.Head Neck Surg., vol. 112, no. 3, pp. 457-460.
McKay, C. M. 2005, "Spectral processing in cochlear implants", Auditory Spectral Processing, vol. 70, pp. 473-509.
McKay, C. M. & Carlyon, R. P. 1999, "Dual temporal pitch percepts from acoustic and electric amplitude-modulated pulse trains", Journal of the Acoustical Society of America, vol. 105, no. 1, pp. 347-357.
McKay, C. M. & Henshall, K. R. 2002, "Frequency-to-electrode allocation and speech perception with cochlear implants", Journal of the Acoustical Society of America, vol. 111, no. 2, pp. 1036-1044.
McKay, C. M., Henshall, K. R., Farrell, R. J., & McDermott, H. J. 2003, "A practical method of predicting the loudness of complex electrical stimuli", Journal of the Acoustical Society of America, vol. 113, no. 4, pp. 2054-2063.
McKay, C. M., Henshall, K. R., & Hull, A. E. 2005, "The effect of rate of stimulation on perception of spectral shape by cochlear implantees", Journal of the Acoustical Society of America, vol. 118, no. 1, pp. 386-392.
McKay, C. M. & McDermott, H. J. 1993, "Perceptual Performance of Subjects with Cochlear Implants Using the Spectral Maxima Sound Processor (Smsp) and the Mini Speech Processor (Msp)", Ear and Hearing, vol. 14, no. 5, pp. 350-367.
McKay, C. M. & McDermott, H. J. 1996, "The perception of temporal patterns for electrical stimulation presented at one or two intracochlear sites", Journal of the Acoustical Society of America, vol. 100, no. 2, pp. 1081-1092.
McKay, C. M. & McDermott, H. J. 1999, "The perceptual effects of current pulse duration in electrical stimulation of the auditory nerve", Journal of the Acoustical Society of America, vol. 106, no. 2, pp. 998-1009.
McKay, C. M., McDermott, H. J., & Clark, G. M. 1996, "The perceptual dimensions of single-electrode and nonsimultaneous dual-electrode stimuli in cochlear implantees", Journal of the Acoustical Society of America, vol. 99, no. 2, pp. 1079-1090.
McKay, C. M., McDermott, H. J., Vandali, A. E., & Clark, G. M. 1992, "A Comparison of Speech-Perception of Cochlear Implantees Using the Spectral Maxima Sound Processor (Smsp) and the Msp(Multipeak) Processor", Acta Oto-Laryngologica, vol. 112, no. 5, pp. 752-761.
Page 377 of 393
McKay, C. M., O'Brien, A., & James, C. J. 1999, "Effect of current level on electrode discrimination in electrical stimulation", Hearing Research, vol. 136, no. 1-2, pp. 159-164.
McKay, C. M., Remine, M. D., & McDermott, H. J. 2001, "Loudness summation for pulsatile electrical stimulation of the cochlea: Effects of rate, electrode separation, level, and mode of stimulation", Journal of the Acoustical Society of America, vol. 110, no. 3, pp. 1514-1524.
McKay, M. C., Dworetzky, S. I., Meanwell, N. A., Olesen, S. P., Reinhart, P. H., Levitan, I. B., Adelman, J. P., & Gribkoff, V. K. 1994, "Opening of Large-Conductance Calcium-Activated Potassium Channels by the Substituted Benzimidazolone Ns004", Journal of Neurophysiology, vol. 71, no. 5, pp. 1873-1882.
McKay, N. G., Kinsella, J. M., Campbell, C. M., & Ashford, M. L. J. 2000, "Sensitivity of Kir6.2-SUR1 currents, in the absence and presence of sodium azide, to the K-ATP channel inhibitors, ciclazindol and englitazone", British Journal of Pharmacology, vol. 130, no. 4, pp. 857-866.
Michelson, R.P. 1971, "Electrical stimulation of the human cochlea: A preliminary report", Arch. Otolaryngol. vol. 93, no. 3, pp. 317-323.
Middlebrooks, J. C. & Bierer, J. A. 2002, "Auditory cortical images of cochlear-implant stimuli: Coding of stimulus channel and current level", Journal of Neurophysiology, vol. 87, no. 1, pp. 493-507.
Middlebrooks, J. C., Bierer, J. A., & Snyder, R. L. 2005, "Cochlear implants: the view from the brain", Current Opinion in Neurobiology, vol. 15, no. 4, pp. 488-493.
Miller, A. L., Arenberg, J. G., Middlebrooks, J. C., & Pfingst, B. E. 2001, "Cochlear implant thresholds: comparison of middle latency responses with psychophysical and cortical-spike-activity thresholds", Hearing Research, vol. 152, no. 1-2, pp. 55-66.
Miller, A. L., Morris, D. J., & Pfingst, B. E. 1997, "Interactions between pulse separation and pulse polarity order in cochlear implants", Hearing Research, vol. 109, no. 1-2, pp. 21-33.
Miller, A. L., Morris, D. J., & Pfingst, B. E. 2000, "Effects of time after deafening and implantation on guinea pig electrical detection thresholds", Hearing Research, vol. 144, no. 1-2, pp. 175-186.
Miller, A. L., Smith, D. W., & Pfingst, B. E. 1999a, "Across-species comparisons of psychophysical detection thresholds for electrical stimulation of the cochlea: I. Sinusoidal stimuli", Hearing Research, vol. 134, no. 1-2, pp. 89-104.
Page 378 of 393
Miller, A. L., Smith, D. W., & Pfingst, B. E. 1999b, "Across-species comparisons of psychophysical detection thresholds for electrical stimulation of the cochlea: II. Strength-duration functions for single, biphasic pulses", Hearing Research, vol. 135, no. 1-2, pp. 47-55.
Miller, C. A., Faulkner, M. J., & Pfingst, B. E. 1995, "Functional responses from guinea pigs with cochlear implants .2. Changes in electrophysiological and psychophysical measures over time", Hearing Research, vol. 92, no. 1-2, pp. 100-111.
Miller, G. A. & Nicely, P. E. 1955, "An Analysis of Perceptual Confusions Among Some English Consonants", Journal of the Acoustical Society of America, vol. 27, no. 2, pp. 338-352.
Miller, C. A., Woodruff, K. E., & Pfingst, B. E. 1995, "Functional responses from guinea pigs with cochlear implants .1. Electrophysiological and psychophysical measures", Hearing Research, vol. 92, no. 1-2, pp. 85-99.
Miracle, A. C. & Mukherji, S. K. 2009, "Conebeam CT of the Head and Neck, Part 2: Clinical Applications", American Journal of Neuroradiology, vol. 30, no. 7, pp. 1285-1292.
Mishra, L. N. 2000, “Analysis of Speech Processing Strategies for the Clarion Implant Processor,” M.Sc. thesis, The University of Texas, Dallas.
Moon, A. K., Zwolan, T. A., & Pfingst, B. E. 1993, "Effects of Phase Duration on Detection of Electrical-Stimulation of the Human Cochlea", Hearing Research, vol. 67, no. 1-2, pp. 166-178.
Moore, B. C. J. 2004, "Dead regions in the cochlea: Conceptual foundations, diagnosis, and clinical applications", Ear and Hearing, vol. 25, no. 2, pp. 98-116.
Morton, K. D., Torrione, P. A., Throckmorton, C. S., & Collins, L. M. 2008, "Mandarin Chinese tone identification in cochlear implants: Predictions from acoustic models", Hearing Research, vol. 244, no. 1-2, pp. 66-76.
Mosnier, I., Sterkers, O., Bebear, J. P., Godey, B., Robier, A., Deguine, O., Fraysse, B., Bordure, P., Mondain, M., Bouccara, D., Bozorg-Grayeli, A., Borel, S., Ambert-Dahan, E., & Ferrary, E. 2009, "Speech Performance and Sound Localization in a Complex Noisy Environment in Bilaterally Implanted Adult Patients", Audiology and Neuro-Otology, vol. 14, no. 2, pp. 106-114.
Munson, B., Donaldson, G. S., Allen, S. L., Collison, E. A., & Nelson, D. A. 2003, "Patterns of phoneme perception errors by listeners with cochlear implants as a function of overall speech perception ability", Journal of the Acoustical Society of America, vol. 113, no. 2, pp. 925-935.
Page 379 of 393
Munson, B. & Nelson, P. B. 2005, "Phonetic identification in quiet and in noise by listeners with cochlear implants", Journal of the Acoustical Society of America, vol. 118, no. 4, pp. 2607-2617.
Nadol, J. B. & Hsu, W. C. 1991, "Histopathologic Correlation of Spiral Ganglion-Cell Count and New Bone-Formation in the Cochlea Following Meningogenic Labyrinthitis and Deafness", Annals of Otology Rhinology and Laryngology, vol. 100, no. 9, pp. 712-716.
Nadol, J. B., Jr., Young, Y. S., & Glynn, R. J. 1989, "Survival of spiral ganglion cells in profound sensorineural hearing loss: implications for cochlear implantation", Ann.Otol.Rhinol.Laryngol., vol. 98, no. 6, pp. 411-416.
National Institute on Deafness and Other Communication Disorders . 2012, "Cochlear implants". Retrieved December 22, 2012, from http://www.nidcd.nih.gov/health/hearing/pages/coch.aspx
Nelson, D. A., Donaldson, G. S., & Kreft, H. 2008, "Forward-masked spatial tuning curves in cochlear implant users", Journal of the Acoustical Society of America, vol. 123, no. 3, pp. 1522-1543.
Nelson, D. A., Vantasell, D. J., Schroder, A. C., Soli, S., & Levine, S. 1995, "Electrode Ranking of Place Pitch and Speech Recognition in Electrical Hearing", Journal of the Acoustical Society of America, vol. 98, no. 4, pp. 1987-1999.
Nelson, P. B. & Jin, S. H. 2004, "Factors affecting speech understanding in gated interference: Cochlear implant users and normal-hearing listeners", Journal of the Acoustical Society of America, vol. 115, no. 5, pp. 2286-2294.
Nelson, P. B., Jin, S. H., Carney, A. E., & Nelson, D. A. 2003, "Understanding speech in modulated interference: Cochlear implant users and normal-hearing listeners", Journal of the Acoustical Society of America, vol. 113, no. 2, pp. 961-968.
Nelson, P. C., Ewert, S. D., Carney, L. H., & Dau, T. 2007, "Comparison of level discrimination, increment detection, and comodulation masking release in the audio- and envelope-frequency domains", Journal of the Acoustical Society of America, vol. 121, no. 4, pp. 2168-2181.
Neuman, A. C., Haravon, A., Sislian, N., & Waltzman, S. B. 2007, "Sound-direction identification with bilateral cochlear implants", Ear and Hearing, vol. 28, no. 1, pp. 73-82.
Nie, K. B., Bierer, S. M., Ling, L., Oxford, T., Rubinstein, J. T., & Phillips, J. O. 2011, "Characterization of the Electrically Evoked Compound Action Potential of the Vestibular Nerve", Otology & Neurotology, vol. 32, no. 1, pp. 88-97.
Page 380 of 393
Nikolopoulos, T. P., Archbold, S. M., & O'Donoghue, G. M. 2006, "Does cause of deafness influence outcome after cochlear implantation in children?", Pediatrics, vol. 118, no. 4, pp. 1350-1356.
Nilsson, M., Soli, S. D., & Sullivan, J. A. 1994, "Development of the Hearing in Noise Test for the Measurement of Speech Reception Thresholds in Quiet and in Noise", Journal of the Acoustical Society of America, vol. 95, no. 2, pp. 1085-1099.
Niparko, J. K., Kileny, P. R., Pfingst, B. E., Kemink, J. L., Johansson, C., & Tjellstrom, A. 1993, "Cochlear Wall Titanium Implants for Auditory-Nerve Stimulation", Annals of Otology Rhinology and Laryngology, vol. 102, no. 6, pp. 447-454.
Nobbe, A., Schleich, P., Zierhofer, C., & Nopp, P. 2007, "Frequency discrimination with sequential or simultaneous stimulation in MED-EL cochlear implants", Acta Oto-Laryngologica, vol. 127, no. 12, pp. 1266-1272.
Nogueira, W., Litvak, L., Edler, B., Ostermann, J., & Buchner, A. 2009, "Signal Processing Strategies for Cochlear Implants Using Current Steering", Eurasip Journal on Advances in Signal Processing.
Nopp, P., Schleich, P., & D'Haese, P. 2004, "Sound localization in bilateral users of MED-EL COMBI 40/40+cochlear implants", Ear and Hearing, vol. 25, no. 3, pp. 205-214.
Nuetzel, J. M., & Hafter, E. R. 1981, "Discrimination of interaural delays in complex waveforms: Spectral effects", The Journal of the Acoustical Society of America, vol. 69, no. 4, pp.1112-1118.
Orabi, A. A., Mawman, D., Al Zoubi, F., Saeed, S. R., & Ramsden, R. T. 2006, "Cochlear implant outcomes and quality of life in the elderly: Manchester experience over 13 years", Clinical Otolaryngology, vol. 31, no. 2, pp. 116-122.
Otake, H., Sugiura, M., Naganawa, S., & Nakashima, T. 2006, "3D-FLAIR magnetic resonance imaging in the evaluation of mumps deafness", Int.J.Pediatr.Otorhinolaryngol., vol. 70, no. 12, pp. 2115-2117.
Papsin, B. C. & Gordon, K. A. 2007, "Cochlear implants for children with severe-to-profound hearing loss", N.Engl.J.Med., vol. 357, no. 23, pp. 2380-2387.
Parisier, S. C., Chute, P. M., Popp, A. L., & Suh, G. D. 2001, "Outcome analysis of cochlear implant reimplantation in children", Laryngoscope, vol. 111, no. 1, pp. 26-32.
Parkinson, A. J., Arcaroli, J., Staller, S. J., Arndt, P. L., Cosgriff, A., & Ebinger, K. 2002, "The nucleus 24 contour cochlear implant system: adult clinical trial results", Ear Hear., vol. 23, no. 1 Suppl, pp. 41S-48S.
Page 381 of 393
Pasanisi, E., Bacciu, A., Vincenti, V., Guida, M., Barbot, A., Berghenti, M. T., & Bacciu, S. 2003, "Speech recognition in elderly cochlear implant recipients", Clin.Otolaryngol.Allied Sci., vol. 28, no. 2, pp. 154-157.
Pasanisi, E., Vincenti, V., Bacciu, A., Guida, M., & Bacciu, S. 2002, "The nucleus contour electrode array: an electrophysiological study", Laryngoscope, vol. 112, no. 9, pp. 1653-1656.
Peissig, J. & Kollmeier, B. 1997, "Directivity of binaural noise reduction in spatial multiple noise-source arrangements for normal and impaired listeners", Journal of the Acoustical Society of America, vol. 101, no. 3, pp. 1660-1670.
Pfingst, B. E. 2011, "Effects of electrode configuration on cochlear implant modulation detection thresholds", Journal of the Acoustical Society of America, vol. 129, no. 6, pp. 3908-3915.
Pfingst, B. E., Burkholder-Juhasz, R. A., Zwolan, T. A., & Xu, L. 2008, "Psychophysical assessment of stimulation sites in auditory prosthesis electrode arrays", Hearing Research, vol. 242, no. 1-2, pp. 172-183.
Pfingst, B. E., Franck, K. H., Xu, L., Bauer, E. M., & Zwolan, T. A. 2001, "Effects of electrode configuration and place of stimulation on speech perception with cochlear prostheses", Jaro, vol. 2, no. 2, pp. 87-103.
Pfingst, B. E., Holloway, L. A., Poopat, N., Subramanya, A. R., Warren, M. F., & Zwolan, T. A. 1994, "Effects of Stimulus Level on Nonspectral Frequency Discrimination by Human-Subjects", Hearing Research, vol. 78, no. 2, pp. 197-209.
Pfingst, B. E., Holloway, L. A., & Razzaque, S. A. 1996, "Effects of pulse separation on detection thresholds for electrical stimulation of the human cochlea", Hearing Research, vol. 98, no. 1-2, pp. 77-92.
Pfingst, B. E., Holloway, L. A., Zwolan, T. A., & Collins, L. M. 1999, "Effects of stimulus level on electrode-place discrimination in human subjects with cochlear implants", Hearing Research, vol. 134, no. 1-2, pp. 105-115.
Pfingst, B. E., Morris, D. J., & Miller, A. L. 1995, "Effects of Electrode Configuration on Threshold Functions for Electrical-Stimulation of the Cochlea", Hearing Research, vol. 85, no. 1-2, pp. 76-84.
Pfingst, B. E. & Rai, D. T. 1990, "Effects of Level on Nonspectral Frequency Difference Limens for Electrical and Acoustic Stimuli", Hearing Research, vol. 50, no. 1-2, pp. 43-56.
Pfingst, B. E. & Sutton, D. 1983, "Relation of Cochlear-Implant Function to Histopathology in Monkeys", Annals of the New York Academy of Sciences, vol. 405, no. JUN, pp. 224-239.
Page 382 of 393
Pfingst, B. E. & Xu, L. 2004, "Across-site variation in detection thresholds and maximum comfortable loudness levels for cochlear implants", Jaro-Journal of the Association for Research in Otolaryngology, vol. 5, no. 1, pp. 11-24.
Pfingst, B. E. & Xu, L. 2005, "Psychophysical metrics and speech recognition in cochlear implant users", Audiology and Neuro-Otology, vol. 10, no. 6, pp. 331-341.
Pfingst, B. E., Xu, L., & Thompson, C. S. 2004, "Across-site threshold variation in cochlear implants: Relation to speech recognition", Audiology and Neuro-Otology, vol. 9, no. 6, pp. 341-352.
Pfingst, B. E., Xu, L., & Thompson, C. S. 2007, "Effects of carrier pulse rate and stimulation site on modulation detection by subjects with cochlear implants", Journal of the Acoustical Society of America, vol. 121, no. 4, pp. 2236-2246.
Pfingst, B. E., Zwolan, T. A., & Holloway, L. A. 1997, "Effects of stimulus configuration on psychophysical operating levels and on speech recognition with cochlear implants", Hearing Research, vol. 112, no. 1-2, pp. 247-260.
Philippon, D., Bergeron, F., Ferron, P., & Bussieres, R. 2010, "Cochlear Implantation in Postmeningitic Deafness", Otology & Neurotology, vol. 31, no. 1, pp. 83-87.
Pialoux, P., Chouard, C. H., & Macleod, P. 1976, "Physiological and Clinical Aspects of Rehabilitation of Total Deafness by Implantation of Multiple Intracochlear Electrodes", Acta Oto-Laryngologica, vol. 81, no. 5-6, pp. 436-441.
Pialoux, P., Chouard, C. H., Meyer, B., & Fugain, C. 1979, "Indications and Results of the Multichannel Cochlear Implant", Acta Oto-Laryngologica, vol. 87, no. 3-4, pp. 185-189.
Plomp, R. & Mimpen, A. M. 1981, "Effect of the Orientation of the Speakers Head and the Azimuth of A Noise Source on the Speech-Reception Threshold for Sentences", Acustica, vol. 48, no. 5, pp. 325-328.
Plontke, S. K., Biegner, T., Kammerer, B., Delabar, U., & Salt, A. N. 2008, "Dexamethasone concentration gradients along scala tympani after application to the round window membrane", Otol.Neurotol., vol. 29, no. 3, pp. 401-406.
Poon, B. B. 2006, “Sound locali ation and interaural time sensitivity with bilateral cochlear implants,” Ph.D. thesis, Massachusetts Institute of Technology, Cambridge.
Page 383 of 393
Prentiss, S., Sykes, K., & Staecker, H. 2010, "Partial Deafness Cochlear Implantation at the University of Kansas: Techniques and Outcomes", Journal of the American Academy of Audiology, vol. 21, no. 3, pp. 197-203.
Qin, M. K. & Oxenham, A. J. 2003, "Effects of simulated cochlear-implant processing on speech reception in fluctuating maskers", Journal of the Acoustical Society of America, vol. 114, no. 1, pp. 446-454.
Rafferty, M. A., Siewerdsen, J. H., Chan, Y., Daly, M. J., Moseley, D. J., Jaff, D. A., & Irish, J. C. 2006, "Intraoperative cone-beam CT for guidance of temporal bone surgery", Otolaryngology-Head and Neck Surgery, vol. 134, no. 5, pp. 801-808.
Ramsden, R., Greenham, P., O'Driscoll, M., Mawman, D., Proops, D., Craddock, L., Fielden, C., Graham, J., Meerton, L., Verschuur, C., Toner, J., McAnallen, T., Osborne, J., Doran, M., Gray, R., & Pickerill, M. 2005, "Evaluation of bilaterally implanted adult subjects with the nucleus 24 cochlear implant systems", Otology & Neurotology, vol. 26, no. 5, pp. 988-998.
Rayleigh 1907, "On our perception of sound direction", Philosophical Magazine, vol. 13, no. 73-78, pp. 214-232.
Rebscher, S. J., Hetherington, A., Bonham, B., Wardrop, P., Whinney, D., & Leake, P. A. 2008, "Considerations for design of future cochlear implant electrode arrays: electrode array stiffness, size, and depth of insertion", J.Rehabil.Res.Dev., vol. 45, no. 5, pp. 731-747.
Reiss, L. A., Gantz, B. J., & Turner, C. W. 2008, "Cochlear implant speech processor frequency allocations may influence pitch perception", Otol.Neurotol., vol. 29, no. 2, pp. 160-167.
Reiss, L. A., Turner, C. W., Erenberg, S. R., & Gantz, B. J. 2007, "Changes in pitch with a cochlear implant over time", J.Assoc.Res.Otolaryngol., vol. 8, no. 2, pp. 241-257.
Reiss, L. A. J., Lowder, M. W., Karsten, S. A., Turner, C. W., & Gantz, B. J. 2011, "Effects of Extreme Tonotopic Mismatches Between Bilateral Cochlear Implants on Electric Pitch Perception: A Case Study", Ear and Hearing, vol. 32, no. 4, pp. 536-540.
Remus, J. J. & Collins, L. M. 2005, "The effects of noise on speech recognition in cochlear implant subjects: Predictions and analysis using acoustic models", Eurasip Journal on Applied Signal Processing, vol. 2005, no. 18, pp. 2979-2990.
Remus, J. J., Throckmorton, C. S., & Collins, L. M. 2007, "Expediting the identification of impaired channels in cochlear implants via analysis of speech-based confusion matrices", Ieee Transactions on Biomedical Engineering, vol. 54, no. 12, pp. 2193-2204.
Page 384 of 393
Richter, B., Aschendorff, A., Lohnstein, P., Husstedt, H., Nagursky, H., & Laszig, R. 2001, "The Nucleus Contour electrode array: a radiological and histological study", Laryngoscope, vol. 111, no. 3, pp. 508-514.
Ricketts, T. A., Grantham, D. W., Ashmead, D. H., Haynes, D. S., & Labadie, R. F. 2006, "Speech recognition for unilateral and bilateral cochlear implant modes in the presence of uncorrelated noise sources", Ear and Hearing, vol. 27, no. 6, pp. 763-773.
Rinia, A. B., Olphen, A. F., & Dunnebier, E. A. 2006, "Cochlear implantation in obstructed cochleas: the effect of the degree of obstruction on the number of activated electrodes and the amount of postoperative speech perception", Clin.Otolaryngol., vol. 31, no. 4, pp. 280-286.
Roditi, R. E., Poissant, S. F., Bero, E. M., & Lee, D. J. 2009, "A predictive model of cochlear implant performance in postlingually deafened adults", Otol.Neurotol., vol. 30, no. 4, pp. 449-454.
Roland, J. T., Jr., Coelho, D. H., Pantelides, H., & Waltzman, S. B. 2008, "Partial and double-array implantation of the ossified cochlea", Otol.Neurotol., vol. 29, no. 8, pp. 1068-1075.
Ronnberg, J. 1993, "Cognitive Characteristics of Skilled Tactiling - the Case of Gs", European Journal of Cognitive Psychology, vol. 5, no. 1, pp. 19-33.
Rosen, S., Faulkner, A., & Wilkinson, L. 1999, "Adaptation by normal listeners to upward spectral shifts of speech: implications for cochlear implants", J.Acoust.Soc.Am., vol. 106, no. 6, pp. 3629-3636.
Rotteveel, L. J. C., Snik, A. F. M., Cooper, H., Mawman, D. J., van Olphen, A. F., & Mylanus, E. A. M. 2010, "Speech Perception after Cochlear Implantation in 53 Patients with Otosclerosis: Multicentre Results", Audiology and Neuro-Otology, vol. 15, no. 2, pp. 128-136.
Rotteveel, L. J. C., Snik, A. F. M., Vermeulen, A. M., & Mylanus, E. A. M. 2005, "Three-year follow-up of children with postmeningitic deafness and partial cochlear implant insertion", Clinical Otolaryngology, vol. 30, no. 3, pp. 242-248.
Rubinstein, J. T., Parkinson, W. S., Tyler, R. S., & Gantz, B. J. 1999, "Residual speech recognition and cochlear implant performance: Effects of implantation criteria", American Journal of Otology, vol. 20, no. 4, pp. 445-452.
Ruivo, J., Mermuys, K., Bacher, K., Kuhweide, R., Offeciers, E., & Casselman, J. W. 2009, "Cone Beam Computed Tomography, A Low-Dose Imaging Technique in the Postoperative Assessment of Cochlear Implantation", Otology & Neurotology, vol. 30, no. 3, pp. 299-303.
Page 385 of 393
Saeed, S. R., Ramsden, R. T., Hartley, C., Woolford, T. J., & Boyd, P. 1995, "Cochlear Reimplantation", Journal of Laryngology and Otology, vol. 109, no. 10, pp. 980-985.
Sagi, E., Fu, Q. J., Galvin, J. J., & Svirsky, M. A. 2010, "A Model of Incomplete Adaptation to a Severely Shifted Frequency-to-Electrode Mapping by Cochlear Implant Users", Jaro-Journal of the Association for Research in Otolaryngology, vol. 11, no. 1, pp. 69-78.
Sarant, J. Z., Blamey, P. J., Dowell, R. C., Clark, G. M., & Gibson, W. P. R. 2001, "Variation in speech perception scores among children with cochlear implants", Ear and Hearing, vol. 22, no. 1, pp. 18-28.
Saunders, E., Cohen, L., Aschendorff, A., Shapiro, W., Knight, M., Stecker, M., Richter, B., Waltzman, S., Tykocinski, M., Roland, T., Laszig, R., & Cowan, R. 2002, "Threshold, comfortable level and impedance changes as a function of electrode-modiolar distance", Ear Hear., vol. 23, no. 1 Suppl, pp. 28S-40S.
Saxman, J. H. & Burk, K. W. 1967, "Speaking Fundamental Frequency Characteristics of Middle-Aged Females", Folia Phoniatrica, vol. 19, no. 3, pp. 167-172.
Schindle.R.A & Merzenic M. M. 1974, "Chronic Intracochlear Electrode Implantation - Cochlear Pathology and Acoustic Nerve Survival", Annals of Otology Rhinology and Laryngology, vol. 83, no. 2, pp. 202-215.
Schleich, P., Nopp, P., & D'Haese, P. 2004, "Head shadow, squelch, and summation effects in bilateral users of the MED-EL COMBI 40/40+cochlear implant", Ear and Hearing, vol. 25, no. 3, pp. 197-204.
Shannon, R. V., Galvin, J. J., & Baskent, D. 2001, "Holes in hearing", Jaro, vol. 3, no. 2, pp. 185-199.
Sherbecoe, R. L. & Studebaker, G. A. 2004, "Supplementary formulas and tables for calculating and interconverting speech recognition scores in transformed arcsine units (vol 43, pg 442, 2004)", International Journal of Audiology, vol. 43, no. 9, p. 554.
Shibata, S. B., Cortez, S. R., Beyer, L. A., Wiler, J. A., Di Polo, A., Pfingst, B. E., & Raphael, Y. 2010, "Transgenic BDNF induces nerve fiber regrowth into the auditory epithelium in deaf cochleae", Experimental Neurology, vol. 223, no. 2, pp. 464-472.
Shin, Y. J., Fraysse, B., Deguine, O., Vales, O., Laborde, M. L., Bouccara, D., Sterkers, O., & Uziel, A. 2000, "Benefits of cochlear implantation in elderly patients", Otolaryngol.Head Neck Surg., vol. 122, no. 4, pp. 602-606.
Shinn-Cunningham, B. G., Schickler, J., Kopco, N., & Litovsky, R. 2001, "Spatial unmasking of nearby speech sources in a simulated anechoic
Page 386 of 393
environment", Journal of the Acoustical Society of America, vol. 110, no. 2, pp. 1118-1129.
Shuttleworth, M. 2009, "Types of Validity". Retrieved 08 August 2012 from Experiment Resources: http://www.experiment-resources.com/types-of-validity.html.
Siciliano, C. M., Faulkner, A., Rosen, S., & Mair, K. 2010, "Resistance to learning binaurally mismatched frequency-to-place maps: Implications for bilateral stimulation with cochlear implants", Journal of the Acoustical Society of America, vol. 127, no. 3, pp. 1645-1660.
Simmons, F. B. 1966, "Electrical stimulation of the auditory nerve in man", Arch Otolaryngology, vol 84, no. 1, pp. 2-54.
Simon, H. A. & Kotovsky, K. 1963, "Human Acquisition of Concepts For Sequential Patterns", Psychol.Rev., vol. 70, pp. 534-546.
Skarzynski, H., Lorens, A., D'Haese, P., Walkowiak, A., Piotrowska, A., Sliwa, L., & Anderson, I. 2002, "Preservation of residual hearing in children and post-lingually deafened adults after cochlear implantation: An initial study", Orl-Journal for Oto-Rhino-Laryngology and Its Related Specialties, vol. 64, no. 4, pp. 247-253.
Skarzynski, H., Lorens, A., Piotrowska, A., & Anderson, I. 2007, "Preservation of low frequency hearing in partial deafness cochlear implantation (PDCI) using the round window surgical approach", Acta Oto-Laryngologica, vol. 127, no. 1, pp. 41-48.
Skellam, J. G. 1948, "A Probability Distribution Derived from the Binomial Distribution by Regarding the Probability of Success As Variable Between the Sets of Trials", Journal of the Royal Statistical Society Series B-Statistical Methodology, vol. 10, no. 2, pp. 257-261.
Skinner, M. W., Clark, G. M., Whitford, L. A., Seligman, P. M., Staller, S. J., Shipp, D. B., Shallop, J. K., Everingham, C., Menapace, C. M., Arndt, P. L., & . 1994, "Evaluation of a new spectral peak coding strategy for the Nucleus 22 Channel Cochlear Implant System", Am.J.Otol., vol. 15 Suppl 2, pp. 15-27.
Skinner, M. W., Fourakis, M. S., Holden, T. A., Holden, L. K., & Demorest, M. E. 1996, "Identification of speech by cochlear implant recipients with the multipeak (MPEAK) and spectral peak (SPEAK) speech coding strategies .1. Vowels", Ear and Hearing, vol. 17, no. 3, pp. 182-197.
Skinner, M. W., Holden, L. K., Demorest, M. E., & Holden, T. A. 1995, "Use of test-retest measures to evaluate performance stability in adults with cochlear implants", Ear Hear., vol. 16, no. 2, pp. 187-197.
Page 387 of 393
Skinner, M. W., Holden, L. K., & Holden, T. A. 1995, "Effect of frequency boundary assignment on speech recognition with the SPEAK speech-coding strategy", Ann.Otol.Rhinol.Laryngol.Suppl, vol. 166, pp. 307-311.
Skinner, M. W., Holden, L. K., & Holden, T. A. 1997, "Parameter selection to optimize speech recognition with the Nucleus implant", Otolaryngology-Head and Neck Surgery, vol. 117, no. 3, pp. 188-195.
Skinner, M. W., Holden, L. K., Holden, T. A., & Demorest, M. E. 1999, "Comparison of two methods for selecting minimum stimulation levels used in programming the nucleus 22 cochlear implant", Journal of Speech Language and Hearing Research, vol. 42, no. 4, pp. 814-828.
Skinner, M. W., Holden, L. K., Holden, T. A., Dowell, R. C., Seligman, P. M., Brimacombe, J. A., & Beiter, A. L. 1991, "Performance of postlinguistically deaf adults with the Wearable Speech Processor (WSP III) and Mini Speech Processor (MSP) of the Nucleus Multi-Electrode Cochlear Implant", Ear Hear., vol. 12, no. 1, pp. 3-22.
Skinner, M. W., Holden, T. A., Whiting, B. R., Voie, A. H., Brunsden, B., Neely, J. G., Saxon, E. A., Hullar, T. E., & Finley, C. C. 2007, "In vivo estimates of the position of advanced bionics electrode arrays in the human cochlea", Ann.Otol.Rhinol.Laryngol.Suppl, vol. 197, pp. 2-24.
Skinner, M. W., Ketten, D. R., Holden, L. K., Harding, G. W., Smith, P. G., Gates, G. A., Neely, J. G., Kletzker, G. R., Brunsden, B., & Blocker, B. 2002, "CT-derived estimation of cochlear morphology and electrode array position in relation to word recognition in nucleus-22 recipients", Jaro-Journal of the Association for Research in Otolaryngology, vol. 3, no. 3, pp. 332-350.
Sly, D. J., Heffer, L. F., White, M. W., Shepherd, R. K., Birch, M. G. J., Minter, R. L., Nelson, N. E., Wise, A. K., & O'Leary, S. J. 2007, "Deafness alters auditory nerve fibre responses to cochlear implant stimulation", European Journal of Neuroscience, vol. 26, no. 2, pp. 510-522.
Smith, M. W. & Faulkner, A. 2006, "Perceptual adaptation by normally hearing listeners to a simulated "hole" in hearing", Journal of the Acoustical Society of America, vol. 120, no. 6, pp. 4019-4030.
Snyder, R. L., Bierer, J. A., & Middlebrooks, J. C. 2004, "Topographic spread of inferior colliculus activation in response to acoustic and intracochlear electric stimulation", Jaro-Journal of the Association for Research in Otolaryngology, vol. 5, no. 3, pp. 305-322.
Sridhar D., Stakhovskaya O., Leake P. 2006, "A frequency–position function
for the human cochlear spiral ganglion", Audiol. Neurootol Suppl, vol. 11, pp. 16–20, 2006.
Page 388 of 393
Spahr, A. J., Dorman, M. F., & Loiselle, L. H. 2007, "Performance of patients using different cochlear implant systems: Effects of input dynamic range", Ear and Hearing, vol. 28, no. 2, pp. 260-275.
Staecker, H., Chow, H., & Nadol, J. B. 1999, "Osteomyelitis, lateral sinus thrombosis, and temporal lobe infarction caused by infection of a percutaneous cochlear implant", American Journal of Otology, vol. 20, no. 6, pp. 726-728.
Stakhovskaya, O., Sridhar, D., Bonham, B. H., & Leake, P. A. 2007, "Frequency map for the human cochlear spiral ganglion: Implications for cochlear implants", Jaro-Journal of the Association for Research in Otolaryngology, vol. 8, no. 2, pp. 220-233.
Stevens, S. S. & Newman, E. B. 1936, "The localization of actual sources of sound", American Journal of Psychology, vol. 48, pp. 297-306.
Stickney, G. S., Zeng, F. G., Litovsky, R., & Assmann, P. 2004, "Cochlear implant speech recognition with speech maskers", Journal of the Acoustical Society of America, vol. 116, no. 2, pp. 1081-1091.
Stoddart, R. L. & Cooper, H. R. 1999, "Electrode complications in 100 adults with multichannel cochlear implants", Journal of Laryngology and Otology, vol. 113, pp. 18-20.
Stohl, J. S., Throckmorton, C. S., & Collins, L. M. 2008, "Assessing the pitch structure associated with multiple rates and places for cochlear implant users", Journal of the Acoustical Society of America, vol. 123, no. 2, pp. 1043-1053.
Stohl, J. S., Throckmorton, C. S., & Collins, L. M. 2009, "Investigating the effects of stimulus duration and context on pitch perception by cochlear implant users", Journal of the Acoustical Society of America, vol. 126, no. 1, pp. 318-326.
Studebaker, G. A. 1985, "A Rationalized Arcsine Transform", Journal of Speech and Hearing Research, vol. 28, no. 3, pp. 455-462.
Su, G. L., Colesa, D. J., & Pfingst, B. E. 2008, "Effects of deafening and cochlear implantation procedures on postimplantation psychophysical electrical detection thresholds", Hearing Research, vol. 241, no. 1-2, pp. 64-72.
Summerfield, A. Q. & Marshall, D. H. 1995, "Preoperative predictors of outcomes from cochlear implantation in adults: performance and quality of life", Ann.Otol.Rhinol.Laryngol.Suppl, vol. 166, pp. 105-108.
Summerfield, Q., Palmer, A. R., Foster, J. R., Marshall, D. H., & Twomey, T. 1994, "Clinical-Evaluation and Test-Retest Reliability of the Ihr-Mccormick
Page 389 of 393
Automated Toy Discrimination Test", British Journal of Audiology, vol. 28, no. 3, pp. 165-179.
Sutton, D., Miller, J. M., & Pfingst, B. E. 1980, "Comparison of Cochlear Histopathology Following 2 Implant Designs for Use in Scala Tympani", Annals of Otology Rhinology and Laryngology, vol. 89, no. 2, pp. 11-14.
Throckmorton, C. S. & Collins, L. M. 1999, "Investigation of the effects of temporal and spatial interactions on speech-recognition skills in cochlear implant subjects", Journal of the Acoustical Society of America, vol. 105, no. 2, pp. 861-873.
Throckmorton, C. S. & Collins, L. M. 2001, "A comparison of two loudness balancing tasks in cochlear implant subjects using bipolar stimulation", Ear and Hearing, vol. 22, no. 5, pp. 439-448.
Throckmorton, C. S. & Collins, L. M. 2002, "The effect of channel interactions on speech recognition in cochlear implant subjects: Predictions from an acoustic model", Journal of the Acoustical Society of America, vol. 112, no. 1, pp. 285-296.
Throckmorton, C. S., Kucukoglu, M. S., Remus, J. J., & Collins, L. M. 2006, "Acoustic model investigation of a multiple carrier frequency algorithm for encoding fine frequency structure: Implications for cochlear implants", Hearing Research, vol. 218, no. 1-2, pp. 30-42.
Throckmorton, C. S., Kucukoglu, M. S., Remus, J. J., & Collins, L. M. 2007, "The effect of frequency estimation on speech recognition using an acoustic model of a cochlear implant", Hearing Research, vol. 228, no. 1-2, pp. 230-231.
Trieger, A., Schulze, A., Schneider, M., Zahnert, T., & Murbe, D. 2011, "In Vivo Measurements of the Insertion Depth of Cochlear Implant Arrays Using Flat-Panel Volume Computed Tomography", Otology & Neurotology, vol. 32, no. 1, pp. 152-157.
Turner, C. W., Gantz, B. J., Vidal, C., Behrens, A., & Henry, B. A. 2004, "Speech recognition in noise for cochlear implant listeners: benefits of residual acoustic hearing", J.Acoust.Soc.Am., vol. 115, no. 4, pp. 1729-1735.
Tykocinski, M., Saunders, E., Cohen, L. T., Treaba, C., Briggs, R. J., Gibson, P., Clark, G. M., & Cowan, R. S. 2001, "The contour electrode array: safety study and initial patient trials of a new perimodiolar design", Otol.Neurotol., vol. 22, no. 1, pp. 33-41.
Tyler, R. S., Dunn, C. C., Witt, S. A., & Noble, W. G. 2007, "Speech perception and localization with adults with bilateral sequential cochlear implants", Ear and Hearing, vol. 28, no. 2, pp. 86S-90S.

Page 390 of 393
U.S. Food and Drug Administration. 1984. Approval of first cochlear implant 3M brand cochlear implant system/House design. Retrieved December 30, 2012,from http://www.accessdata.fda.gov/scripts/cdrh/devicesatfda/index.cfm?db=pma&id=2512
Van de Heyning, P. H., Vermeire, K., Cochet, E., Hofkens, A., & De Bodt, M. 2004, "Cochlear implantation: a bionic system to restore hearing in severely hearing impaired patients", Verh.K.Acad.Geneeskd.Belg., vol. 66, no. 4, pp. 253-267.
van Hoesel, R. J. M. 2004, "Exploring the benefits of bilateral cochlear implants", Audiology and Neuro-Otology, vol. 9, no. 4, pp. 234-246.
van Hoesel, R. J. M. 2007, "Sensitivity to binaural timing in bilateral cochlear implant users", Journal of the Acoustical Society of America, vol. 121, no. 4, pp. 2192-2206.
van Hoesel, R. J. M. 2008, "Observer weighting of level and timing cues in bilateral cochlear implant users", Journal of the Acoustical Society of America, vol. 124, no. 6, pp. 3861-3872.
van Hoesel, R. J. M. & Clark, G. M. 1997, "Psychophysical studies with two binaural cochlear implant subjects", Journal of the Acoustical Society of America, vol. 102, no. 1, pp. 495-507.
van Hoesel, R., Ramsden, R., & O'Driscoll, M. 2002, "Sound-direction identification, interaural time delay discrimination, and speech intelligibility advantages in noise for a bilateral cochlear implant user", Ear and Hearing, vol. 23, no. 2, pp. 137-149.
van Hoesel, R. J. M. & Tyler, R. S. 2003, "Speech perception, localization, and lateralization with bilateral cochlear implants", Journal of the Acoustical Society of America, vol. 113, no. 3, pp. 1617-1630.
Vandali, A. E., Whitford, L. A., Plant, K. L., & Clarke, G. M. 2000, "Speech perception as a function of electrical stimulation rate: Using the nucleus 24 cochlear implant system", Ear and Hearing, vol. 21, no. 6, pp. 608-624.
Verschuur, C. A., Lutman, M. E., Ramsden, R., Greenham, P., & O'Driscoll, M. 2005, "Auditory localization abilities in bilateral cochlear implant recipients", Otology & Neurotology, vol. 26, no. 5, pp. 965-971.
Wackym, P. A., Runge-Samuelson, C. L., Firszt, J. B., Alkaf, F. M., & Burg, L. S. 2007, "More challenging speech-perception tasks demonstrate binaural benefit in bilateral cochlear implant users", Ear and Hearing, vol. 28, no. 2, pp. 80S-85S.
Page 391 of 393
Waltzman, S. B., Fisher, S. G., Niparko, J. K., & Cohen, N. L. 1995, "Predictors of postoperative performance with cochlear implants", Ann.Otol.Rhinol.Laryngol.Suppl, vol. 165, pp. 15-18.
Wang, J. R., Yuen, H. W., Shipp, D. B., Stewart, S., Lin, V. Y. W., Chen, J. M., & Nedzelski, J. M. 2010, "Cochlear Implantation in Patients With Autoimmune Inner Ear Disease Including Cogan Syndrome: A Comparison With Age- and Sex-Matched Controls", Laryngoscope, vol. 120, no. 12, pp. 2478-2483.
Wardrop, P., Whinney, D., Rebscher, S. J., Luxford, W., & Leake, P. 2005a, "A temporal bone study of insertion trauma and intracochlear position of cochlear implant electrodes. II: Comparison of Spiral Clarion (TM) and HiFocus II (TM) electrodes", Hearing Research, vol. 203, no. 1-2, pp. 68-79.
Wardrop, P., Whinney, D., Rebscher, S. J., Roland, J. T., Luxford, W., & Leake, P. A. 2005b, "A temporal bone study of insertion trauma and intracochlear position of cochlear implant electrodes. 1: comparison of Nucleus banded and Nucleus Contour (TM) electrodes", Hearing Research, vol. 203, no. 1-2, pp. 54-67.
Watson, C. S., Kelly, W. J., & Wroton, H. W. 1976, "Factors in the discrimination of tonal patterns II. Selective attention and learning under various levels of stimulus uncertainty", Journal of the Acoustical Society of America, vol. 60, no. 5, pp. 1176-1186. Whitford, L. A., Seligman, P. M., Blamey, P. J., McDermott, H. J., & Patrick, J. F. 1993, "Comparison of current speech coding strategies", Advances in Otorhinolaryngology, vol. 48, pp. 85–90.
Wilson, B. S. & Dorman, M. F. 2008, "Cochlear implants: Current designs and future possibilities", Journal of Rehabilitation Research and Development, vol. 45, no. 5, pp. 695-730.
Wilson, B. S., Finley, C. C., Lawson, D. T., Wolford, R. D., & Zerbi, M. 1993, "Design and evaluation of a continuous interleaved sampling (CIS) processing strategy for multichannel cochlear implants", J.Rehabil.Res.Dev., vol. 30, no. 1, pp. 110-116.
Wilson, B. S., Lawson, D. T., Finley, C. C., & Wolford, R. D. 1991, "Coding strategies for multichannel cochlear prostheses", Am.J.Otol., vol. 12 Suppl, pp. 56-61.
Wilson, B. S., Lawson, D. T., Muller, J. M., Tyler, R. S., & Kiefer, J. 2003, "Cochlear implants: Some likely next steps", Annual Review of Biomedical Engineering, vol. 5, pp. 207-249.
Wolfe, J and Schafer, E. 2010, " Programming Cochlear Implants". San Diego: Plural Publishing Inc.

Page 392 of 393
Wright, R. (1997). Basic properties of speech. In Speech Audiometry, M. Martin, ed. London: Whurr Publishing.
Xu, L. & Pfingst, B. E. 2003, "Relative importance of temporal envelope and fine structure in lexical-tone perception", Journal of the Acoustical Society of America, vol. 114, no. 6, pp. 3024-3027.
Xu, L. & Pfingst, B. E. 2008, "Spectral and temporal cues for speech recognition: Implications for auditory prostheses", Hearing Research, vol. 242, no. 1-2, pp. 132-140.
Xu, L., Thompson, C. S., & Pfingst, B. E. 2005, "Relative contributions of spectral and temporal cues for phoneme recognition", Journal of the Acoustical Society of America, vol. 117, no. 5, pp. 3255-3267.
Xu, L., Tsai, Y. J., & Pfingst, B. E. 2002, "Features of stimulation affecting tonal-speech perception: Implications for cochlear prostheses", Journal of the Acoustical Society of America, vol. 112, no. 1, pp. 247-258.
Xu, L., Zwolan, T. A., Thompson, C. S., & Pfingst, B. E. 2005, "Efficacy of a cochlear implant Simultaneous Analog Stimulation strategy coupled with a monopolar electrode configuration", Annals of Otology Rhinology and Laryngology, vol. 114, no. 11, pp. 886-893.
Xu, Y. F. & Collins, L. M. 2005, "Predicting dynamic range and intensity discrimination for electrical pulse-train stimuli using a stochastic auditory nerve model: The effects of stimulus noise", Ieee Transactions on Biomedical Engineering, vol. 52, no. 6, pp. 1040-1049.
Ye, Q., Tillein, J., Hartmann, R., Gstoettner, W., & Kiefer, J. 2007, "Application of a corticosteroid (Triamcinolon) protects inner ear function after surgical intervention", Ear Hear., vol. 28, no. 3, pp. 361-369.
Yoshida, T., Sugiura, M., Naganawa, S., Teranishi, M., Nakata, S., & Nakashima, T. 2008, "Three-dimensional fluid-attenuated inversion recovery magnetic resonance imaging findings and prognosis in sudden sensorineural hearing loss", Laryngoscope, vol. 118, no. 8, pp. 1433-1437.
Yukawa, K., Cohen, L., Blamey, P., Pyman, B., Tungvachirakul, V., & O'Leary, S. 2004, "Effects of insertion depth of cochlear implant electrodes upon speech perception", Audiol.Neurootol., vol. 9, no. 3, pp. 163-172.
Zeng, F. G. 2004, "Trends in cochlear implants", Trends Amplif., vol. 8, no. 1, pp. 1-34.
Zeng, F. G., Grant, G., Niparko, J., Galvin, J., Shannon, R., Opie, J., & Segel, P. 2002, "Speech dynamic range and its effect on cochlear implant performance", Journal of the Acoustical Society of America, vol. 111, no. 1, pp. 377-386.
Page 393 of 393
Zeng, F. G., Rebscher, S., Harrison, W. V., Sun, X., & Feng, H. 2008, "Cochlear Implants:System Design, Integration and Evaluation", IEEE Rev.Biomed.Eng, vol. 1, pp. 115-142.
Zhou, N. & Pfingst, B. E. 2012, "Psychophysically based site selection coupled with dichotic stimulation improves speech recognition in noise with bilateral cochlear implants", Journal of the Acoustical Society of America, vol. 132, no. 2, pp. 994-1008.
Zhu, Z., Tang, Q., Zeng, F.G., Guan, T & Ye, D. 2012, "Cochlear-implant spatial selectivity with monopolar, bipolar and tripolar stimulation", Journal of Hearing Research, vol. 283, no. 1-2, pp. 45-58.
Zwolan, T. A., Collins, L. M., & Wakefield, G. H. 1997, "Electrode discrimination and speech recognition in postlingually deafened adult cochlear implant subjects", J.Acoust.Soc.Am., vol. 102, no. 6, pp. 3673-3685.