the effects of positive examiner verbal comments and token
TRANSCRIPT

The Effects of Positive Examiner Verbal Comments and Token Reinforcement on the
CTONI-2 Performance of Early Elementary School Children
Laura Cimini
Submitted in partial fulfillment of the requirements for the degree of
Doctor of Philosophy under the Executive Committee
of the Graduate School of Arts and Sciences
COLUMBIA UNIVERSITY
2015

© 2015 Laura Cimini
All rights reserved
ABSTRACT
The Effects of Positive Examiner Verbal Comments and Token Reinforcement on the
CTONI-2 Performance of Early Elementary School Children
Laura Cimini
Seventy-two children were randomly assigned to one of three treatment conditions (i.e.,
verbal praise, token reinforcement, and standard administration groups) to study the effects of
different incentive conditions on the CTONI-2 performance of 6 -7 year old children. The
participants in the token reinforcement condition were rewarded with tokens that were
exchanged for reinforcers for providing CTONI-2 responses. The participants in the other
conditions were verbally praised for their effort or received neutral comments following the
same schedule. Mean scores for each group on the CTONI-2 Pictorial Scale, Geometric Scale,
and Full Scale composite scores were compared using MANOVA and ANOVA procedures,
respectively, and no significant differences were observed. The results were generally
inconsistent with the literature that supports the hypothesis that young children perform better on
an individually administered nonverbal intelligence test when given token reinforcement and/or
verbal praise in comparison to groups who receive standard administration. However, analyses
revealed potential interactions among demographic and condition variables that
may inform future directions in the research of standardized testing.

i
Table of Contents
List of Tables and Figures……………………………………………………………..............…iii
Acknowledgements…………………………………………………………………................….iv
Dedication.…………………………………………………………………………...............…...vi
Introduction.………..……………………………………………………………...............………1
Chapter 1: A Review of the Effects of Examiner Verbal Praise…………………………………..4
Chapter Summary…….……….........………………………………………………...…….……14
Chapter 2: Effects of Token Reinforcement on Test Performance………………………………20
Chapter Summary………..…….….….....……...………………………………………..………36
Chapter 3: A Review of the Effects of Incentive Conditions on Cognitive Test Performance.....41
Chapter Summary…………….……….………………………………………….………..…61
Summary of Effects of Incentive Conditions in Testing…………………...…..…………….64
Chapter 4: Methodology………………………………………………………..………………..66
Statement of the Problem…………..……...….………………………………………………66
Hypotheses………….………...…………..…………………………………………………..68
Method………….……………...……………………………………….…………………….70
Experimental Procedure………………………………………..……………………………..79
Research Design……………...…...…………………………………………………………..84
Chapter 5: Results………………………………..………………………………………………86
Sample Characteristics…………...………………………………………..………………….86
Pretest and Posttest Results…………………...……………..………………………………..85
Chapter 6: Summary and Conclusions……………………………………...……………………88
Discussion…………….….………...…………………………………………………………89

ii
Limitations……………………………………………………………………………………94
Directions for Future Research…………….……….……...…………………………………95
References………………...…………………………………………………………………….97
Appendix Listing……………..……………………………………………………………….106
Appendices…………………………………………………………………………….......…..107

iii
List of Tables
Table 1 Summary of the Effects of Verbal Praise on Test Performance .......................17
Table 2 Summary of the Effects of Token Reinforcement on Test Performance ..........34
Table 3 Summary of the Effects of Verbal Praise and Token Reinforcement on Test
Performance ......................................................................................................58
Table 4 Correlation Between CTONI-2 and Criterion Intelligence Tests .....................77
Table 5 Standard Score Means, Standard Deviations and Statistical Results of t-tests for
Differences Between the CTONI-2 and Selected Criterion Tests ....................78
Table 6 Distribution of Sample by Race/Ethnicity ........................................................82
Table 7 Distribution of Sample by Gender ....................................................................83
Table 8 Means and Standard Deviations of the overall CTONI-2 Full Scale Composite
Scores of Male and Female Participants Tested by Each Examiner .................84
Table 9 Distribution of the Sample by Study Site .........................................................84
Table 10 Group Means and Standard Deviations for the PTONI Nonverbal Index, and the
CTONI-2 Pictorial Scale, Geometric Scale, and Full Scale Composite Scores and the
six CTONI-2 Subtest Scaled Scores .................................................................85
List of Figures
Figure 1 Research Design ..............................................................................................85

iv
Acknowledgements
I would like to express my appreciation for the many people who supported me through
this process and my time in graduate school. Dr. Saigh provided invaluable direction, guidance,
and motivation on this project. I am grateful to the School Psychology faculty for their guidance
through every facet of this experience—especially to Dr. Brassard and Dr. Peverly, for their
extraordinary support and kindness. I would also like to thank Dr. Smith for her time and
thoughtful feedback throughout my dissertation process, as well as Monica, Allie, Caitlin,
Colleen, and Debra for their assistance as examiners and raters for this project.
This dissertation would not have been possible without its enthusiastic participants. Sister
Patrice Owens, Mrs. K, Principal Darren Raymar (D-Ray), Cathie Britt, Principal Michael
Febbraro, Cathy Grecco, the dedicated teachers, and the students and families from the school
study sites all contributed immensely to the completion of this project.
I would also like to thank my clinical supervisors, who showed me what waited on the
other side of graduate training. Dr. Stephen Sands provided me with formative clinical and
research experiences while helping me to discover the kind of psychologist I hope to be. Dr.
Joyce Vastola showed me how to have fun and be myself in this profession.
Finding my path to psychology and making it through graduate school was possible only
with the tremendous support of my family and friends. I am so grateful for the friendships
formed in this process, and could not have gotten to this point without Lauren, Christie, Michael,
and Steve. Thank you to Kate and Nick for the countless times you’ve had my back and
encouraged me over the years. And to Dylan and Jules, who have taught me more about
childhood than any graduate school course ever could. Joan’s strength, encouragement, and
Christmas cookies helped me through the most trying times. I would also like to thank my

v
Grandma for making it absolutely clear from the very beginning that I had to finish my
dissertation.
I cannot begin to express my gratitude to my mother and Dave. It has been their
unwavering support that has allowed me to pursue my goals. My mother launched my journey in
this field by signing me up to volunteer at Camp ANCHOR when I was 14 years old, and she has
believed in me through every step of the way ever since. That is a rare gift for which I am
eternally grateful.

vi
Dedication
To my Dad, who always seemed to know what I was capable of long before I did.

1
Introduction
In consideration of the uses and applications of intellectual functioning assessments, it is
imperative for scores to reflect an examinee’s best efforts (Anastasi, 1982). Early in the history
of standardized ability tests, Lewis Terman (1916) observed that good testing technique involved
“maintaining both high motivation and optimal performance level throughout the testing session”
(as cited in Cronbach, 1990, p.69). The literature recognizes that variables such as personality,
attentiveness, anxiety, and motivational factors are reflected in scores from intelligence tests in
addition to aptitude and cognitive ability (Snyderman & Rothman, 1987). Wechsler (1940) added
that the degree of variance in intelligence scores that is unaccounted for is “largely contributed
by such factors as drive, energy, impulsiveness, etc…” (p.444). Even before the research
identified these variables, Thorndike (1904) lamented that it is rare to know what constitutes any
examinee’s best effort. Moreover, a recent review of intelligence testing asserted that test
motivation, particularly on low-stakes intelligence tests, can potentially confound an IQ score
and render its predictive validity less meaningful (Duckworth, Quinn, Lynam, Loeber, &
Stouthamer-Loeber, 2011). It follows that authors have universally stressed the necessity for
examiners to obtain the examinee’s maximum effort in order to more accurately reflect an
individual’s true ability (Anastasi, 1982; Cronbach, 1990; Sattler, 2008).
Valid estimates of a child’s true abilities depend on the multiple influences from the
testing environment, including motivation for testing (Reschly,1979). The traditional approach to
motivating examinees and eliciting effort embedded in most, if not all, standardized testing
manuals is to establish and maintain rapport. In Terman’s (1916) view, “nothing contributes
more to satisfactory rapport than praise of a child’s efforts… Statements like ‘Fine!,’ ‘Splendid!’

2
etc. should be used lavishly” (p.125). While the importance of building rapport is widely
accepted, Fish (1988) observed that
there is no true standard approach that remains constant across examiners and examinees in regard to how rapport is established and maintained, or what kind of praise or encouragement is administered and how frequently (p.206).
Although Terman and Merrill (1972) recommended rapport and encouragement, the authors
noted that “the means by which these ends are accomplished are so varied as to defy specific
formulation”(p.51). Wechsler (1991) advised examiners to “convey your enthusiasm and interest
in what the child is doing. Praise and encourage the child for the effort made except when
specified otherwise” (p.37). However, Cronbach (1990) cautioned that if praise is “done in too
lavish and stilted a fashion it is likely to defeat its own purpose”(p.69). More recently, Hammill
et al. (2009) directed examiners of nonverbal intelligence tests to “keep the examinee at ease and
‘on task’” and “encourage [examinees] to work steadily” (p.14) with no further instructions.
The specifications for building and maintaining rapport across administration guidelines
are murky at best in their descriptions of timeliness, intensity, quantity, and especially with
regard to the distinction between building rapport and praising a child. Due to the inherent
confusion, it follows that dedicated research has examined the effects of direct and deliberate
reinforcement on performance during standardized testing (Duckworth et al., 2011; Fish, 1988).
Fish (1988) reported that a reinforcement approach to testing “may be a useful way to determine
the functional skills of students…(p.216)” over and above standard rapport building. In light of
the importance of finding standard and consistent approaches to eliciting maximum effort from
examinees, and the lack of a decisive and cohesive conclusion on the topic, a selected review of
the literature is provided.

3
A detailed literature search was conducted in order to evaluate the effects of incentive
conditions on test performance. Computer searches using the following databases was
completed: The Educational Resources Information Center (ERIC) from 1968 to the present,
PsycINFO from 1981 to the present, APA Psycnet from 1964 to the present, and Education Full
Text from 1987 to the present. Search criteria included the following terms in isolation and in
combination: reinforcement conditions, incentive conditions, verbal praise, rewards, token
reinforcement AND cognitive functioning, intelligence, intelligence test, nonverbal intelligence,
and test performance. References appearing in Fish (1988), Duckworth et al. (2011), and Pollock
(1989) were also consulted. The process resulted in the identification of 41 experimental studies
on the topic of incentive conditions during cognitive testing. Reviews of article titles, abstracts
and full text led to the exclusion of 1,087 publications for the following reasons: prior inclusion
in the review, irrelevance to the topic, unavailability of the manuscript, use of un-standardized
measures (e.g., foot races, affect), and publication beyond a 40 year range that were not
referenced by Fish (1988), Pollack (1989) and Duckworth et al. (2011).

4
Chapter 1
A Review of the Effects of Examiner Verbal Praise
Psychologists beginning in the late 19th century sought to develop an instrument that
would accurately measure intelligence. By the introduction of the Stanford-Binet (Terman,
1916), the concept of building rapport and eliciting effort was already and forever to be included
in test administration instructions. By 1924, researchers turned their attention to the influence of
external factors on the reliability and constancy of the intelligence score, including emotional
reactions, sleep deprivation, and motivation (Hurlock, 1924). Hurlock subsequently conducted
the earliest experimental study introducing incentives as a variable on test performance. Hurlock
tested 408 third, fourth, and fifth grade students matched on gender, age, race, and intelligence as
measured on either the Otis Intelligence Scale Primary Examination, Form A (Otis, 1924) or the
National Group Intelligence Test, Scale B, Form 1 (no reference). She administered alternate
forms of the tests one week later to all students who were randomly assigned to praise, reproof,
or standard administration conditions; the praise and reproof groups received either encouraging
comments or discouraging comments preceding the test, respectively. She concluded that the
participants in the verbal praise and reproof conditions made significantly greater gains in scores
compared to the participants in the control group.
Hurlock replicated her 1924 study in 1925 with 273 fifth and eighth grade students in
New York City public schools. In the treatment conditions, she informed the praised group of
students that they had been “chosen from the whole group because of their very excellent work”
(p.429) on the pre-test and urged them to perform even better this time. Students in the reproof
condition were told they had failed the pretest and “that they were a disgrace to the class, etc.”
(p.429). The control group received standard administration procedures on both pre- and post-

5
tests. Once again, gain scores from participants in the praise and reproof conditions were
superior to the control group but not statistically different from each other.
Benton (1936) similarly matched two groups of 25 students in seventh and eighth grades
based on age, sex, grade, and pre-test score on the Otis Self-Administering Test, Intermediate
Examination (no date reported). The test was re-administered 28 days later to the control group
in the standard manner, and to the “incentive group” with additional encouragement; these
students were told what their relative standing on the pretest had been and were offered prizes if
they improved their standings. Additionally, the school principal praised the “incentive group”
for their work and urged them to do better on the second test. Benton did not find significant
differences between groups. However, the design decision to include praise combined with
performance feedback constitutes a possible drawback to the validity of the study, as it
introduces pressure to perform that was not otherwise present.
Klugman (1944) was by most accounts the first researcher to investigate the effects of
incentive conditions on individually administered intelligence tests. In a departure from earlier
studies, his experiment served to contrast praise and monetary rewards that were contingent on
correctness of responses. He administered both of the equivalent forms of the Revised Stanford-
Binet (1937) to 72 students in grades two through seven matched by sex (37 males and 35
females), race (38 white and 34 black), and grade, and randomly assigned students to one of four
conditions: (1) praise during both administrations; (2) money during both administrations; (3)
praise during the first and money during the second administration; or (4) money during the first
and praise during the second administration. The praise condition was not clearly described but it
was reported that the monetary reward condition enabled students to earn between 5 and 15

6
pennies per testing period for answering certain items correctly. No group received standard
administration procedures.
Klugman did not observe significant differences between the groups that received praise
and monetary incentives. He did, however, find interaction effects in that Black children who
received money incentives outperformed those rewarded with praise. He also reported that Black
and White children performed similarly under the money incentive conditions, and White
children outperformed Black children when praise was the incentive. It is important to note that
failure to include a control group preclude making conclusions regarding the effectiveness of
incentive conditions compared to standard administration. Subsequent studies contrasting
different types of incentive conditions will be addressed later in the review.
Bornstein (1968) assessed the differential effects of verbal approval, disapproval, and
neutral (standard administration) conditions on intelligence test scores. The investigator pre-
experimentally matched 90 third, fourth, and fifth grade students and randomly assigned equal
numbers of male and female students to one of the three conditions. He administered the
California Test of Mental Maturity (Clark, 1942) and subsequently administered the Picture
Completion, Picture Arrangement, Block Design, Object Assembly, and Coding subtests from
the Wechsler Intelligence Scale for Children (WISC; Wechsler, 1949). Children in the verbal
approval group were told “good,” “fine,” and “that was fine” after each response to the first item
in each subtest and between subtests. Children in the disapproval group were told “I thought you
could do better than that” or “that wasn’t too good” on the same schedule. The neutral condition
did not receive feedback.
Scores from the California Test of Mental Maturity were used as a covariate in statistical
analysis. Bornstein reported that the Picture Completion, Picture Arrangement, Block Design,

7
and Object Assembly scores and the total performance mean scaled scores of the verbal approval
group were significantly greater than the scores of the disapproval group. Mean scaled scores of
the verbal approval group also exceeded those of the control group on all measures except the
Picture Arrangement and Coding subtests. Gender by treatment interactions were also reported in
that boys in the verbal approval condition overall scored higher than boys in the disapproval
group whereas girls in the verbal approval condition outperformed girls in both disapproval and
neutral conditions. Bornstein advocated for a change in the administration procedures of
intelligence tests to include verbal praise in order to optimize performance. He further advised
these changes would necessitate re-norming the test.
Witmer, Bornstein, and Dunham (1971) replicated the verbal approval, disapproval, and
neutral treatment protocol used by Bornstein (1968) with 90 third and fourth grade students (48
male and 42 female) on two verbal (Arithmetic and Digit Span) and two performance (Picture
Arrangement and Block Design) subtests of the WISC (Wechsler, 1949). Procedures were
identical to Bornstein’s (1968) procedure. However, the experimenters also said, “Now let’s try
these” to all three groups between subtests. Consistent with Bornstein’s (1968) study, the authors
observed significantly higher performance on the Arithmetic, Digit Span, Picture Arrangement,
and Block Design subtests for students in the verbal approval group compared to disapproval and
neutral groups. They concluded that verbal approval is an effective means to improve the
performance of third and fourth grade students. However, they also noted that the amount,
frequency, and intensity of approval may not be consistent across testing situations and “thus
needs to be recognized as an examiner-examinee variable that can influence test results”(p.355).
In a similar vein, Feldman and Sullivan (1971) investigated the effect of “enhanced
rapport” as it differed from standard rapport insofar as “friendly conversation prior to and during

8
the WISC testing and the inclusion of verbal reinforcement for the first correct response in each
WISC subtest”(p.302). Either odd, even, or every third item, plus all Digit Span and Coding
items, constituted the WISC Short Form that served as the dependent variable (Fish, 1988). The
authors compared 72 elementary school children matched by grade, sex and score on the Otis
School Ability Test (1979) in either a standard or enhanced rapport condition. Both conditions
were believed to remain within the limits of typical examiner behavior. The authors observed
significantly higher WISC IQ scores from the enhanced rapport condition, and the effect of
enhanced rapport was found to be more significant for older elementary children. Children in the
enhanced rapport condition also evidenced higher levels of verbal productivity compared to the
neutral condition, which the authors claimed to be reinforced and promoted by the examiner’s
behavior. Failure to provide an operational definition of the dependent variable (i.e., “verbal
productiveness”), precludes drawing conclusions about the treatment’s exact effect, aside from
an association between “verbal productivity” and generally higher scores on the WISC Short
Form.
Galdieri, Barcikowski and Witmer (1972) compared the performance of 72 rural White
third graders from middle and low socioeconomic homes on the core battery of verbal and
performance scales of the WISC (less Mazes and Digit Span). Participants were assigned to
either verbal praise or neutral (standard administration) conditions. Verbal praise was
administered on both non-contingent and contingent bases and consisted of saying “good” after
the first response of each subtest, “that was hard, wasn’t it? But you are doing good” after the
first incorrect response per subtest, and either “let’s go onto something else” or “now let’s try
these” between subtests. The neutral statements between subtests were the only prompts given to

9
the group in the neutral condition. Further, in both conditions the examiners inhibited nonverbal
approval like smiling or nodding.
The authors did not observe significant differences between groups or interaction effects.
They noted, however, that significant differences were found based on socioeconomic status and,
thus, asserted that, while cultural differences do play an important role in the performance on
intelligence tests, children of different social classes do not evidence differential responsiveness
to verbal incentives. This observation stands in contrast to earlier research purporting that middle
class subjects are more responsive to verbal incentives (Havighurst, 1970). Galdieri et al.
concluded that “it would be unfortunate if we had to worry about test results because of the
loquaciousness of the examiner” (p.408). It is important to note that no information regarding the
equivalence of the two groups, the use of random assignment, or pre-testing was provided and,
thus, concerns regarding the experiment’s internal validity remain unanswered.
Saigh and Payne (1976) also attempted to determine the effects of verbal approval versus
neutral comments on a group of 40 educably mentally retarded (EMR) students whose IQs
ranged from 52-82. Participants consisted of approximately equal number Black and White
students of both sexes, aged seven to 16. The Arithmetic, Block Design, Picture Completion, and
Digit Span subtests from the WISC served as the dependent variables. Students were randomly
assigned to a verbal praise condition or a neutral condition. The students in the verbal praise
condition received examiner comments such as “very good,” “keep it up,” “that’s the stuff,” and
“I like the way you’re working” (p.343). The students in the neutral condition received
nonevaluative comments such as, “let’s try this,” “how about this,” and “here is the next” (p.343)
after their responses. The authors reported that the Block Design and Digit Span subtest scaled
scores of the verbal praise group significantly exceeded the scores of the nonevaluative comment

10
group. On the other hand, performance on Arithmetic and Picture Completion subtests did not
significantly differ between groups.
Saigh (1981) repeated the procedure from his earlier work using the full WISC-R
(Wechsler, 1974) with 40 EMR students in a large state-supported mental hospital. The students’
pretreatment mean IQ was 72 and their mean chronological age was 11.5. Gender was evenly
distributed between groups. Participants were randomly selected from a larger pool of
institutionalized EMR students and randomly assigned to one of two conditions: a control group
that received neutral comments, and a verbal praise group that received praise statements
identical to those that were used in Saigh and Payne’s (1976) procedure. In contrast to the
previous work, neutral or praise statements were delivered to participants after the initial four
items of each subtest, after every other response thereafter, and between subtests.
Analyses revealed that verbal praise had a significant effect on verbal and performance
composite scores as well as Full Scale IQ scores, which was found to be ten IQ points higher
overall for students in the praise condition compared to the group that received nonevaluative
comments. Analyzed individually, significant differences were observed on the Vocabulary,
Arithmetic, Picture Completion, Digit Span, and Coding subtests for students in the verbal praise
condition relative to controls. These findings are contrary to Saigh and Payne’s (1976) findings
that the Arithmetic and Picture Completion subtests were not affected by verbal reinforcement.
However, the author suggested that both tests were more similar to the curriculum the students in
the current study experienced, and students’ recall for this material may have been facilitated
more easily in this study. Saigh attributed the increase in performance to the positive verbal
comments in that they represented an increase in individual attention, and were effective in
alleviating examinee anxiety and facilitating attention and concentration.

11
In a related study, Goh and Lund (1977) randomly assigned 90 preschool children to one
of three conditions. All participants were considered to be typically developing children. Groups
were balanced by gender and socioeconomic status (based on enrollment in either a private
nursery school or Headstart program). Students received administrations of the Peabody Picture
Vocabulary Test (PPVT; Dunn, 1965) followed by the Wechsler Preschool and Primary Scale of
Intelligence (WPPSI; Wechsler, 1967), which served as the dependent variable. Students in the
noncontingent praise condition received comments such as “good,” “very good,” or “you’re
pretty smart” whether responses were correct or incorrect. Students in the contingent praise
group were told that their correct answers were “right,” “correct,” or “that’s a good answer”
(p.1012). Responses of “I don’t know,” irrelevant responses, or no response did not receive
reinforcement.
PPVT scores served as covariates in the analysis. The authors did not observe significant
main or interaction effects (for treatment by socioeconomic status) between groups. Although the
reinforcement schedule was not specified, the authors concluded that excessive amounts of
examiner verbal feedback may have been detrimental to concentration. Further, students from
this age group may have been too young to be influenced by statements such as “good” or
“right” (Havighurst, 1970). While the authors acknowledged that praising a child’s efforts may
contribute to building and maintaining rapport, they cautioned not to assume an “unqualified
positive linear relationship between kind of verbal reinforcement and IQ” (p.1013).
In an attempt to further clarify the situation factors that affect motivation for testing,
Piersel, Brody and Kratochwill (1977) examined the differential effects of performance
feedback, vicarious verbal praise experience, and standard administration procedures on WISC-R
(Wechsler, 1974) performance. Sixty-three children from a low-income, inner-city

12
neighborhood, aged 8 to 10 years, were randomly assigned to one of three conditions in which
racial and ethnic composition was balanced between groups. The subjects were administered all
of the subtests on the WISC-R except the Digit Span and Coding subtests which is in keeping
with procedure from Sattler (1974) that shortens subtests by administering only odd, even, or
every third item (as cited in Piersel et al., 1977). The authors explained that WISC-R norms were
used to convert participant raw scores to scaled scores.
Feedback conditions involved verbally informing students of whether their response was
completely correct, partially correct, mostly correct, or incorrect, as well as how many points
were earned for a particular response (e.g., zero, one, or two points for vocabulary items).
Subjects in this condition recorded their own scores on a record form designed so they could
view the total number of points earned relative to the maximum on each subtest. Students in the
pretest vicarious experience group viewed a seven-minute video of a minority student from
another school being administered a series of questions similar to those on the WISC-R. In the
video, a white female examiner made noncontingent statements such as “very good!” and
“you’re doing great!” after responses so that the student achieved approximately 60% success
(i.e., the student provided incorrect responses but was not penalized in any way). Standardized
procedures for WISC-R administration were followed for both the pretest vicarious experience
and standard administration groups.
The authors found that the mean scaled scores of the group who viewed the vicarious
pretest video before test administration were significantly greater than the scores from the
standard administration group. The mean scaled scores from the feedback condition group did
not differ significantly from the standard administration group. According to the authors,
“exposing children to an affectively warm and rewarding pretest vicarious experience” appears

13
to reduce any evaluation apprehension and its associated anxiety, which serves to improve test
scores (p.1144). Further, results suggest that increasing the evaluative aspect of test-taking in the
feedback condition has the potential to be detrimental to performance.
In an effort to examine the effects of different types of verbal feedback on intrinsic
motivation, Butler (1987) conducted a study with 200 Jewish Israeli fifth and sixth grade
students with low or high academic achievement. The sample included 106 boys and 94 girls
with a mean age of 11.10 years. He used divergent thinking tasks (Torrance & Templeton, 1963
as cited in Butler, 1987) as the performance task. Students received different verbal feedback at
the end of each of 3 sessions depending on condition. Students in the “comments” condition
received one sentence with both a reinforcing and goal-setting component (e.g., “you thought of
quite a few ideas, maybe it is possible to think of more unusual, original ideas”) (p.476).
Students in the “grades” condition were informed of their final performance scores. The “praise”
group received feedback comments of “very good,” and the “no feedback” group did not receive
any statements.
All participants were then asked to complete interest and attributions questionnaires on
which they rated how interesting they found the tasks, what factors influenced the effort they put
forth, and what factors influenced their successes or failures on the tasks. Performance on tasks,
observations of test-taking behavior, and data from the questionnaires served as dependent
variables. The authors observed greater engagement and higher ratings of interest and perceived
success from students in the “comments” and “praise” groups compared to students in the
“grades” or “no feedback” groups. Students in the reinforcing and goal-setting “comments”
group further demonstrated higher task performance, task involvement (including enjoyment,
effort and assessment/improvement of past performance), and they requested more tasks

14
compared to the “praise,” “grades,” and “no feedback” groups. In contrast, the “praise” group
reported greater focus on normative ability and the desire to achieve successful outcomes/ avoid
unsuccessful outcomes, which was interpreted to be less associated with long-term intrinsic
motivation, compared to the “comments” group. Overall, the combination of both reinforcing
and goal-settings comments had the greatest positive effect on performance of divergent thinking
tasks.
Chapter Summary
Table 1 presents a description of the 12 research studies that were reviewed. As may be
noted, of the 12 experimental studies of the effects of verbal praise on test performance reviewed
herein, nine observed that praise generally facilitated performance, and three reported no
significant differences between scores obtained by groups that received praise and standard
administrations. Of the nine studies with positive outcomes, six demonstrated higher scores for
verbal praise groups compared to standard administration groups. Two of those observed reproof
conditions to be equivalent to praise conditions (Hurlock, 1924, 1925); in contrast, two other
studies observed higher performances from groups that received verbal praise compared to
verbal disapproval (Bornstein, 1968; Witmer et al., 1971). One study demonstrated better
performance in an enhanced rapport condition over a standard administration (Feldman &
Sullivan, 1971). Another substituted a vicarious pretest verbal praise experience for actual verbal
praise and demonstrated the efficacy of a vicarious praise experience in increasing performance
compared to feedback and standard administration conditions. Lastly, one study demonstrated
that both praise and goal-setting comments increase engagement, interest, and perceived success
in divergent thinking tasks; the combination of reinforcing and goal-setting comments further
increased performance, investment in, and requests for more tasks. Of note, two studies reviewed

15
herein included participants similar in age to the present study sample, and both studies showed
that the groups who received enhanced rapport (Feldman & Sullivan, 1971) and verbal praise
(Saigh & Payne, 1976) performed better than groups who received standard administration on at
least one measure (it is important to note that these study samples differed in important ways
diagnostically and in the range of ages included in the study). Overall, this result is consistent
with a 1964 review of 33 experimental studies (prior to 1964) on the effects of praise that found
that verbal praise had a “facilitating effect on the performance of school children” (Kennedy &
Wilcutt, p. 331).
However, some methodological pitfalls included failing to provide information on the
equivalence of groups (Galdieri et al., 1971), utilizing group administration procedures (Benton,
1936; Hurlock, 1924, 1925), not using an intelligence test (Butler, 1987), or contradicting the
standardization procedure by providing feedback contingent on correctness (Galdieri et al., 1972;
Goh & Lund, 1977; Piersel et al., 1977). Hurlock (1924, 1925), Benton (1936), and Feldman and
Sullivan (1971) also did not provide operational definitions of what constituted praise and/or
how it differed from rapport.
It is important to present the view that verbal praise has the potential to be detrimental.
Goh & Lund (1977) suggested that excessive feedback negatively impacted examinee’s
concentration. Piersel (1977) proposed that emphasizing the evaluative aspects of an assessment
may increase test anxiety and apprehension. Some critics of using systematic praise caution that
haphazard or unfettered praise can potentially have other detrimental effects, particularly by
creating a system in which a child seeks extrinsic rewards rather than internalizing motivation for
the task. The authors of a review on the enhancing and undermining effects of praise concede
that, “of course, extrinsic motivation is also affected by praise, particularly when there is a

16
continued expectation of reward or praise in the future” (Henderlong & Lepper, p.775). Also,
particularly for older children, research suggests “praise may be damaging because it conveys a
message of low ability” (Henderlong & Lepper, p.780). This is especially salient if praise is
delivered in a highly effusive or overly general way that can be interpreted as insincere.

17
Table 1
Summary of the Effects of Verbal Praise on Test Performance
Study Participants
Test Measure Treatment Results
Hurlock (1924) 408, Grades 3 – 5 Otisa or NGITb (group
administration)
Praise, reproof or standard
Praise and reproof > standard
Hurlock (1925) 273, Grades 5 - 8 Otisa or NGITb (group
administration)
Praise, reproof or standard
Praise and reproof > standard
Benton (1936) 50, Grades 7 – 8 Otisc (group administration)
VP or standard No significant differences
Bornstein (1968) 90 (gender equal), Grades 3 - 5
WISC (1949) VP, DP, or STD VP > DP and STD (DP = STD)
Witmer et al. (1971)
90 (48 M, 42 F), Grades 3 – 4
WISC (1949)d VP, DP, or STD VP > DP and STD (DP = STD)
Feldman & Sullivan (1971)
72, Grades 1 – 7 WISC (1949)e Enhanced or standard rapport
Enhanced rapport > standard
Galdieri et al. (1972)
72 rural white low – middle SES,
Grade 3
WISC (1949), less Mazes and
Digit Span
VP (contingent) or STD
No significant differences
Saigh & Payne (1976)
40 EMR (IQ 52 – 82), age 7 – 16,
Black and White equal
WISC (1949)f VP or STD VP > STD (BD, DS); VP = STD
(AR, PCm)
Saigh (1981) 40 institutionalized EMR (mean IQ =
72, age = 11.5; gender equal)
WISC-R (1974)g Full
Scale IQ
VP or STD VP > STD (all composites and
subtests)
Goh & Lund (1977)
90 preschool, mixed gender and
SES
WPPSI (1967) Contingent VP, noncontingent
VP or STD
No significant differences
Piersel et al. (1977)
63 low SES, age 8 – 10, mixed racial/ethnic
WISC-R (1974)e
Feedback (fully or partially
correct, incorrect), pretest
vicarious experience, or
STD
Pretest vicarious experience >
Feedback or STD
Butler (1987) 200 (106 M, 94 F) grades 5-6
Divergent Thinking Uses
Testh
Reinforcing and goal-setting
“comments”, VP, grades for
performance or
“Comments” and VP > grades and
STD in engagement, interest and

18
STD perceived success;
“Comments” > VP in
performance, involvement and requests for more
tasks Notes. VP = verbal praise, STD = neutral/nonevaluative, DP= disapproval. EMR = Educably Mentally Retarded. SES = socioeconomic status. aOtis Intelligence Scale Primary Examination, Form A. bNational Group Intelligence Test, Scale B, Form 1. cOtis Self-Administering Test, Intermediate Examination. dWISC: Arithmetic (AR), Digit Span (DS), Picture Arrangement, and Block Design (BD). eShort Form: odd or even items or every third item and all Digit Span and Coding (CD) items. fWISC Arithmetic, Block Design, Picture Completion (PCm) and Digit Span. gWISC-R: Vocabulary, Arithemtic, Picture Completion, Digit Span and Coding. hDivergent Thinking Uses Test (Torrance & Templeton, 1963).
A review by Fish (1988) surveyed the effects of several types of incentive conditions
(including praise, candy, tokens, toys, and knowledge of test results) on intelligence test
performance of 34 research studies published between 1967 and 1982. Fish concluded that “a
motivational component is part of the test process” (p.214). The reviewer included six of the 12
verbal praise studies included in the review herein. Three of the six studies included in both
reviews (Bornstein, 1968; Feldman & Sullivan, 1971; Galdieri et al., 1972) were deemed to have
“inadequate” study quality by Fish (1988) because of “confounded” and “negative treatments,”
respectively (p.213). The three inadequate studies, two of which observed the positive effects of
verbal praise, were subsequently excluded from his conclusions. Due to the methodological
limitations and the subsequent exclusion of those studies from his review, he concluded the
available literature was not adequate to make a conclusion about “whether rewards influence
performance, under what conditions, and for whom” (p.214).
Limitations in methodology as well as a paucity of replication studies with different
populations preclude a definitive conclusion to be drawn about the effect of verbal praise in and
of itself on test performance. However, the present review presents evidence that praise (in
different forms) has been effective in increasing performance in nine of the 12 studies that were

19
reviewed. The authors of the three remaining studies failed to find an effect. While overall verbal
praise has been found to enhance motivation during testing by alleviating anxiety, increasing
verbal output, increasing attention and concentration, and simply increasing individual attention,
three authors have suggested that praise also has the potential to be detrimental to achievement
(Goh & Lund, 1977; Henderlong & Lepper, 2002; Piersel et al., 1977).

20
Chapter 2
Effects of Token Reinforcement on Test Performance
Research has also examined the use of material reinforcement as a means to elicit better
test performance. Using a behavioral paradigm, it is expected that if a response is followed by a
satisfying consequence, the probability of performing that response will increase (Thorndike,
1911, 1965). B. F. Skinner later refined Thorndike’s formulation and labeled it “reinforcement”
(Skinner, 1971). According to Skinner (1971), “when a bit of behavior is followed by a certain
kind of consequence, it is more likely to occur again, and a consequence having this effect is
called a reinforcer” (p.27). Reinforcement, by definition, always increases the frequency of the
behavior that is reinforced and, thus, not all rewards necessarily function as reinforcers
(Henderlong & Lepper, 2002). Positive reinforcement can be administered in the form of
tangible, social, and/or token reinforcers (Martin & Pear, 1988).
The application of reinforcement procedures in clinical settings was championed by
Theodore Ayllon and Nathan Azrin, who developed the token economy system (Ayllon & Azrin,
1968). A token economy “provides clients with token reinforcers to motivate them to perform
desired behaviors” (Spiegler & Guevremont, 2010, p.22). There are many advantages to using
token reinforcers over other tangible or generalized reinforcers, including durability, immediate
delivery upon performance of a target behavior, the ability to exchange them at a later time for a
desired reward, and there being no limit to the number of tokens that can be provided (Kazdin &
Bootzin, 1972). The basic elements of a token economy include selecting and objectively
defining a target behavior to reinforce; selecting back-up reinforcers; choosing tokens and
establishing their relation to the back-up reinforcer (usually verbal explanation is enough); and
determining specific procedures for the operation of the token economy (Ayllon & Azrin, 1968;

21
Spiegler & Guevremont, 2010). Token economy programs also commonly include a store where
tokens can be exchanged for back-up reinforcers (Hackenberg, 2009). Martin and Pear (1988)
describe additional procedures for recording data, identifying the reinforcement agent or
administrator, deciding on the amount and frequency of tokens to pay, and managing
accessibility of the back-up reinforcers. Strategies for handling potential problems, such as when
clients express confusion about the procedure, attempt to manipulate the system, or fail to
purchase the back-up reinforcers, are also described (Martin & Pear, 1988).
An important factor involving the efficacy of a token economy involves the appropriate
identification of back-up reinforcers (Martin & Pear, 1988). Establishing the reinforcement
preference of an individual is a means to providing the right incentive for engaging in the target
behavior (Ayllon & Azrin, 1968). Back-up reinforcers can fall into four categories: consumable
(e.g., candy), activity (e.g., watching TV), manipulative (e.g., playing with a favorite toy), or
possessional (e.g., possessing an enjoyable item) (Martin & Pear, 1988). Choosing an
appropriate reinforcer for an individual can be accomplished by consulting lists other researchers
have used, observing children’s preference in natural environments, and/or by conducting an
interview or administering a survey (Martin & Pear, 1988; Spiegler & Guevremont, 2010). It can
also be effective to provide an individual with a choice or menu of available reinforcers as there
is a strong probability that at least one item from the list of choices will be reinforcing (Martin &
Pear, 1988).
The efficacy of token economies can be evaluated by collecting data on a target behavior
at baseline and throughout the administration of the program (Martin & Pear, 1988). For
example, Birnbruauer, Wolf, Kidder, and Tague (1965) conducted one of the earliest effective
administrations in a school setting. The authors implemented a token reinforcement program

22
with 17 pupils between the ages of 8 and 14 who were all diagnosed as mildly or moderately
mentally retarded. Pupils were enrolled in a “Programmed Learning Classroom” (Birnbrauer et
al., 1965, p.221), which they attended for one to two hours a day. During this time they
completed assignments in various academic subjects (e.g., reading comprehension, phonics,
cursive writing, etc). The teachers gave a check mark in each student’s “mark book” for every
correct response to an item. They provided another ten marks if an assignment was error-free and
additional extra marks for being “especially cooperative” (Birnbrauer, Wolf, Kidder & Tague,
1965, p.223). Extremely disruptive behavior resulted in a ten-minute time-out from the
experimental classroom, during which time the participants could not receive check marks.
Check marks were tallied at the end of each day and could be exchanged for an assortment of
back-up reinforcers, including a choice of edibles, bubble gum, balloons, stationary and pencils,
and trinkets.
During the experiment, systematic token reinforcement was implemented, followed by a
21-day period of no token reinforcement, and then by token reinforcement again. The amount of
social approval provided to pupils was held constant throughout the experiment. During the no-
token period, the following changes were observed: (1) five pupils showed no measurable
change in performance, (2) six pupils significantly increased their overall percentage of errors,
and (3) four pupils exhibited a significant increase in percentage of errors, a significant decrease
in the amount of work completed, and a significant increase in disruptive behavior. The ten
pupils whose performance declined in the no-token period resumed their previous levels of
performance when token reinforcement was reinstated (Birnbrauer et al., 1965). According to
Kazdin and Bootzin (1972), the results of this study “confirmed the importance of token

23
reinforcement because the majority of subjects showed decreased performance on at least one of
the three criteria when tokens were not given” (p.351).
Since their inception in the 1960s, token economies and other types of behavior therapy
have been effectively used in psychiatry, social work, and education (Epstein & Skinner, 1982).
Token reinforcement has also been shown to be effective in vastly different settings with a
diverse range of patients, including cases with substance abuse, severe anxiety, autism, and
disruptive disorders (Kazdin, 1982; Spiegler & Guevremont, 2010).
As in the case of Chapter 1, electronic searches were performed involving the following
databases: The Educational Resources Information Center (ERIC), PsycINFO, APA Psycnet and
Education Full Text from 1964 to the present. Search criteria included the following terms in
isolation and in combination: reinforcement conditions, incentive conditions, verbal praise,
rewards, token reinforcement AND cognitive functioning, intelligence, intelligence test,
nonverbal intelligence, and test performance. References from 1972 to 1994 appearing in Fish
(1988), Pollock (1989) and Duckworth et al. (2011) were also consulted. The process resulted in
the identification of 41 experimental studies on the topic of incentive conditions during cognitive
testing. Reviews of article titles, abstracts, and full text led to the exclusion of 1,087 publications
for the following reasons: prior inclusion in the review, irrelevance to the topic, unavailability of
the manuscript, use of un-standardized measures (e.g., foot races, affect), and articles published
beyond a 40 year range that were not referenced by Fish (1988), Pollack (1989) and Duckworth
et al. (2011). This chapter examines the effects of token reinforcement compared to standard
administration procedures and Chapter 3 subsequently considers studies that investigated
comparisons between incentive types.

24
In 1972, Edlund matched 22 5 to 7 year old children from lower and lower-middle
socioeconomic status (SES) backgrounds based on reported preference for candy, age, sex, and
initial IQ score on a revised Stanford-Binet Scale, Form L (Terman & Merrill, 1960). Seven
weeks later, the control and treatment groups received administrations of an alternate form of the
Stanford-Binet (i.e., Form M) with one departure from the test manual instructions. The
departure involved telling the experimental subjects “I’m going to give you an M&M candy for
each right answer you give to the questions I ask and each thing you do right that I ask you to
do” (p.318). No information regarding establishing reinforcement preference was reported. The
author observed that the Stanford-Binet Scale, Form L scores of the children in the treatment
(candy) condition was significantly higher than that of the comparison group. He concluded the
improvement was due to the “carefully chosen consequence, candy” (p.319) as well as the
contingent basis on which the reward was provided.
In a similar vein, Moran (1979) investigated the effects of tangible rewards on the
performance of 44 gender-balanced 4 to 5 year olds (Group 1) and 46 gender-balanced 9 to 10
year olds (Group 2). The Wechsler Preschool and Primary Scale of Intelligence (WPPSI;
Wechsler, 1967) and the Wechsler Intelligence Scale for Children – Revised (WISC-R;
Wechsler, 1974) served as dependent variables. Students were matched on initial IQ and age and
then randomly assigned to a reward or nonreward condition. In the reward condition, the
elementary-school children had a choice of 12 alternatives (e.g., jump rope, toy car, a slinky,
etc.) while the “nursery school” children chose from three alternatives (e.g., bubble blowing set,
coloring book, etc.). While the students had a choice of rewards, no information was provided
regarding establishing the students’ reinforcement preferences. Students in the Group 2 reward
condition were told that if they performed well enough, their choice of reward would be sent to

25
them in approximately 2 weeks. Students in the nonreward condition were urged to do their best.
The only deviation for nursery school students in the reward condition was that they were shown
their choices of prizes in order to pick the one they wanted and then the rewards were placed out
of sight.
Moran did not observe significant differences between the reward and nonreward
conditions in Group 2 (elementary school age). In contrast, Group 1 (nursery school age)
children in the reward condition earned higher scores on tasks considered “heuristic,” or require
discovery and insight for a solution (e.g., Block Design, Similarities, Object Assembly subtests
of the WISC-R and Geometric Design subtest of the WPPSI) compared to the scores from
students in the nonreward condition. However, the rewarded nursery school children had
significantly lower scores on tasks considered to be “algorithmic,” that had straightforward and
well-known solutions (e.g., Arithmetic, Information and Digit Symbol subtests of the WISC-R
and the Coding and Animal House subtests of the WPPSI) relative to the scores of the
nonrewarded children. The author concluded that the systematic use of incentives to increase
motivation on tests of intelligence may not be advisable as this relationship appears to depend on
type of task as well as developmental age.
With a different population, Breuning and Davis (1981) investigated the effects of
individually selected consumable reinforcers among 40 institutionalized individuals diagnosed
with mental retardation between the ages of 13 and 72. Participants were randomly assigned to
one of four groups. Within each group, differing numbers of participants received
administrations of the Wechsler Adult Intelligence Scale (WAIS; Wechsler, 1955), the Leiter
International Performance Scale (Leiter & Porteus, 1936), or the Stanford-Binet Intelligence
Scale (Form L-M) (Terman & Merrill, 1960). The research design consisted of three testing

26
sessions (first separated by one week and then by 18 weeks) and was counterbalanced to reduce
any order effects. All participants were tested at least once under standardized (i.e., no
reinforcement) conditions, which served as control data.
Group 1 received the first and second test administrations without reinforcement.
Following this, a randomly selected half of the participants received a third test administration
under the reinforcement condition. For these cases, participants were given a choice of rewards
that were selected by researchers, including a “drink of pop,” a cracker, or a jellybean. No
information on the reinforcement preference of the participants was provided. Rewards were
presented immediately after each correct response. The remaining half of the participants
received a third standardized test administration without reinforcement. Participants in Group 1
received reinforcers contingent on a correct response and were informed of the contingency.
Participants in Group 2 received the first test administration without incentives. Their
second tests administration occurred under reinforcement conditions (contingent on correctness).
The group was subsequently divided and randomly assigned to standard (no reinforcement) or
reinforcement conditions for the third set of test administrations. Participants in Group 3
experienced a similar administration pattern to Group 1 with the exception that reinforcement
was presented contingent upon correct and incorrect responses (no reinforcement was given for
no response). Group 4 received the same procedure as Group 2 but reinforcement was also
presented contingent upon correct and incorrect responses.
The authors observed significantly higher scores for the groups that were reinforced for
correct responses. Specifically, data analyses revealed improvements in scores between test
administrations when groups were reinforced compared to scores at baseline (no reinforcement).
They also reported a significant increase in the number of correct responses as tests progressed

27
under reinforcement conditions relative to baseline. In contrast, declines in scores from baseline
were observed for the groups that were reinforced contingent on incorrect responding. The
authors concluded that “IQs are due to an interaction between a mentally retarded individual’s
ability to respond correctly and adequate stimulus control for the correct responses to be evoked”
(p.318).
Bradley-Johnson, Johnson, Shanahan, Rickert, and Tardona (1984) conducted two
experiments with urban, Black and White, low socioeconomic second grade students (gender
ratio not reported). Socioeconomic status was measured using the Hollingshead’s Two Factor
Index of Social Position (1965) and participants fell in the range considered to be low SES. In
the first experiment, 33 Black students were pretested using the Slosson Intelligence Test
(Slosson, 1963). Participants were randomly assigned to one of three treatment conditions for
administration of the core subtests of the WISC-R (1974). Students in the control group received
the standard administration without verbal praise or material reward. Students in the immediate
treatment condition were shown the back-up reinforcers prior to the test administration and
earned tokens throughout testing that could be exchanged for prizes at a later time. Students in
the delayed reinforcement condition were given tokens at the end of each subtest that could be
exchanged for prizes such as raisins, crayons, and coloring books. Reinforcement preference was
established, and prizes were selected, based on the children’s suggestions of items that cost less
than $2.00. Reinforcement was provided to both groups on a contingent basis for correct
responding. Both reinforcement groups exchanged their tokens for rewards at the end of the test
administrations. Students in the immediate reinforcement group evidenced significantly higher
mean scores on the WISC-R Verbal, Performance, and Full Scale IQ composites compared to
28
students in the delayed reinforcement and control groups. Mean composite scores did not
significantly differ for the delayed reinforcement and control groups.
A second study was conducted with 33 White second grade students under the same
conditions. In contrast to the previous experiment, the investigators did not observe significant
differences in mean scores between treatment conditions. The authors’ conclusions were thus
limited by this result and they proposed that token reinforcement contingent on correctness of
responses would differentially influence children from different cultural and socioeconomic
backgrounds.
In a related study, Johnson, Bradley-Johnson, McCarthy and Jamie (1984) administered
the WISC-R to children who were classified at the low end of the socioeconomic continuum as
denoted by the Hollingshead Index of Social Position (Hollingshead, 1965). In the first
experiment, 20 elementary-age children participated. These children were aged between 6 and 12
years and were classified as educable mentally impaired (EMI). Subjects were randomly
assigned to either a token reinforcement or a standard test administration (i.e., no token
reinforcement) group and were administered the WISC-R. Children in the reinforcement
condition were told they would receive tokens for each correct answer that could be exchanged
at the end of the test for prizes. Prizes were selected to reflect the reinforcement preference based
on suggestions from surveys of all children in participating schools, regardless of their
participation in the study. Children in the standardized test administration group did not receive
token reinforcement. On the other hand, an equal number of praise statements were presented to
the participants in both conditions to approximate the amount of verbal reinforcement generally
given by examiners. The results indicated that the token reinforcement group evidenced

29
significantly higher WISC-R Verbal and Full Scale IQs. On the other hand, nonsignificant
differences were evident on the Performance IQ.
In the second part of the study, 22 Black junior-high age children between the ages of 12
to 14 years (gender not reported) received the same testing procedure with the exception of
different back-up reinforcers. Again, the participants in the reinforcement condition were told
they would receive tokens for each correct answer that could be exchanged at the end of the test
for prizes. These reinforcers were expressly selected to reflect the observed reinforcement
preference of the junior high school participants and involved items such as hair picks, restaurant
coupons, and records. Also, the examiner in this study was a White female rather than the White
male. In contrast to the same study with elementary age children, statistical analyses did not
reveal significant group differences. Therefore, the authors concluded that token reinforcement is
more of an effective element for young, low-income Black students classified as EMI than for
Black, low-income students who were older and non-classified. Further, the authors asserted that
token rewards did not appear to influence the performance of older students as much as they
influenced the performance of younger students. The authors added that statistical analyses did
not reveal that the different examiners or geographical regions of the country accounted for the
differences in outcome.
In a related work, Yeager (1983) investigated the effects of tangible rewards on the
performance of Black low-income sixth grade children. Thirty participants, 17 boys and 13 girls
aged 11 to 13 years, completed the Slosson Intelligence Test as a pretest before receiving
administrations of the 10 core subtests of the WISC-R. Students were randomly assigned to one
of three conditions: standard procedures, immediate reinforcement wherein tokens were given
after every correct answer, or delayed reinforcement wherein tokens were presented at the end of

30
each subtest. The participants in both reinforcement conditions were told prior to the test
administrations that they could earn tokens for every correct answer, which could be traded in as
soon as testing was completed for items such as pencils, notebooks, erasers, toys, candy, and
money. Reinforcement preference was established for these rewards based on the suggestions
from the sixth grade students. Similar to Bradley-Johnson et al. (1984), participants also received
an equal number of praise statements for effort across conditions. Race, social status, age, and IQ
were covaried to reduce the potential effects of these factors in the analyses.
Yeager did not observe significant differences between groups and concluded that token
rewards did not enhance the WISC-R performance of the participating sixth grade, low-income
Black students. While the sample size of this study was not large enough to draw reliable
conclusions, the author attributed the lack of significant differences to the age of the subjects as
previous studies (Bradley-Johnson et al., 1984) observed significant differences among younger
children with similar demographic characteristics.
Bradley-Johnson, Graham, and Johnson (1986) performed a similar experiment with 40
White children from regular education elementary classrooms in a low-income rural area. All
participants represented the two lowest categories of the Hollingshead Index of Social Position
(Hollingshead, 1965). The sample included 19 boys and 21 girls in both the first and second
grades and the fourth and fifth grades. Participants received administrations of the Slosson
Intelligence Test for Children (1975) to ensure the equivalency of the experimental groups.
Participants were randomly assigned to a standard administration or an immediate reinforcement
(token) group during administrations of the WISC-R. Similar to the procedure used in the Yeager
(1983) paper, participants in the token reinforcement group were told they would receive tokens
for each correct answer that could be exchanged at the end of the test for prizes. Prizes were

31
selected to reflect the reinforcement preference of children who had been previously surveyed
about their preference for rewards. These rewards included candy bars, a squirt gun, or a record.
Here again, 29 praise statements for effort were presented to the participants across conditions.
Bradley-Johnson et al. (1986) reported significantly higher scores on the WISC–R
Verbal, Performance, and Full Scale IQs for students from both age groups in the token
reinforcement condition compared to their same age peers in the standard administration groups.
The students’ scores also followed age-related trends in that the early elementary students who
received token reinforcement scored significantly higher on the WISC-R Verbal and Full Scale
IQ composites relative to the upper elementary students who received token reinforcement. This
result suggests that token reinforcement may have been more effective for younger children in
this sample as a whole. On the other hand, the upper elementary school students who received
token reinforcement outperformed their upper elementary school counterparts in the standard
condition. The authors recommended further research to determine the developmental and
procedural characteristics that produced the mixed outcomes.
More recently, Devers, Bradley-Johnson, and Johnson (1994) examined the effects of
contingent token reinforcement on the WISC-R performance of Chippewa Indian junior high
school students. Thirty-one regular-education students enrolled in the fifth through ninth grades
received administrations of the Slosson Intelligence Test (1981) and two subtests of the Detroit
Test of Learning Aptitude (DTLA; Hammill, 1985) to determine the equivalence of the
experimental groups. Students were subsequently randomly assigned to a control or token
reinforcement condition and received administrations of the WISC-R (Wechsler, 1974). Tokens
were dispensed following each correct response and were exchangeable at the end of the testing
sessions for cash or items such as tape players, curling irons, frisbees, or consumable food items.

32
Reinforcement preference for these rewards was established based on suggestions from
participants in the control condition of the study. The resultant list of back-up reinforcers were
shown to the participants in the token reinforcement condition before testing began. As in earlier
studies, 29 noncontingent praise statements were given in both conditions.
Data analyses revealed significantly higher mean Verbal, Performance, and Full Scale IQ
scores for the token reinforcement group compared to controls, with a mean score for the token
reinforcement group of 12 IQ points higher than controls. The authors concluded that token
reinforcement was an effective method of enhancing the performance among the selected junior-
high age American Indian students.
In a study that investigated the effects of token reinforcement on a non-cognitive
measure, Honeywell, Dickinson, and Poling (1997) explored possible differences in performance
when participants expected to receive incentives based on either individual or group
performance. The participants included 20 undergraduate college students at a large midwestern
university (no further demographic information reported). They were randomly assigned to
groups to either receive individual or group incentives on a data card sorting task. In the card
sorting task (Farr, 1976 as cited in Honeywell et al., 1997), subjects sorted cards according to 12
varying patterns of punched holes that corresponded with wooden dowels. Quality of
performance could not vary as there was only one correct way to sort each card. The subjects
were informed before testing whether they would earn monetary rewards contingent on how
many cards were sorted individually or by their assigned group. Thus, the number of cards sorted
by each individual was the dependent variable, and the monetary incentive was contingent on
that number. Subjects were not consulted on the selection of money as the reward; however,
inclusion in the study was “based on understanding of the study’s pay conditions” (p.264). At the

33
end of the study, subjects exchanged their private tally (of the number of cards sorted) for
money. Subjects also received feedback on their performance at the conclusion of each session.
Lastly, subjects rated their enjoyment of each condition at the conclusion of the study on a five-
point Likert scale and responded to a question about which incentive condition they would prefer
to work under.
The authors did not observe significant group differences in performance between the
individual or group incentive conditions. On the other hand, high performers reported higher
preferences for the individual incentive condition. The opposite preference was reported for low
performers. While this study is not comparable to other studies that examined the effects of
reinforcement conditions on test performance in terms of method, dependent variable, or
subjects, it provides valuable evidence for enhancing motivation based on an individual’s history
of performance. Specifically, high performers preferred individually administered incentives and,
thus may have been more motivated under that condition.
Lastly, Callahan (2005) utilized components of intelligence and neuropsychological
measures to evaluate the effects of reinforcement conditions on the executive functioning of
children diagnosed with Attention Deficit-Hyperactivity Disorder (ADHD). The subjects were
16 girls and one boy between the ages of 7 and 12 who met criteria for an ADHD diagnosis
using the Child Behavior Checklist (CBCL; Achenbach, 1991) and the ADHD Rating Scale- IV
(ADHDRS; Dupaul, Power, Anastopoulos & Reid, 1998). They were included in the study if
their Full Scale IQs on the Wechsler Abbreviated Scale of Intelligence (WASI; Wechsler, 1999)
was 80 or more. The participants were administered the Stroop Color and Word Test (SCWT;
Golden, 1978), the Digit Span task from the WISC-IV (Wechsler, 2003) and the Tower of
London task (TOL; Culbertson & Zillmer, 2001) during both testing sessions.

34
Subjects were initially tested under standardized conditions and re-tested one week later
under a continuous token reinforcement condition. More specifically, tokens were dispensed on a
continuous basis throughout testing for having responded regardless of correctness, though
participants were told they were receiving rewards contingent on correct responses. Tokens
totaling $10.00 in value were exchangeable for gift certificates after testing to either a fast food
restaurant or a local movie theatre. Participants were not consulted on the choices of gift
certificates available.
Multivariate analyses revealed that the overall performance of children with ADHD
across all of the measures of executive functioning (i.e., measuring short-term auditory memory,
response inhibition, concentration, and planning) was significantly higher when they received
reinforcement compared to their performance on the same tasks without reinforcement. When
test measures were considered individually, only performance on the SCWT was found to be
significantly higher for participants when they received reinforcement compared to their
performance on the same test without reinforcement. Although performance on the other tests
was not significantly different between reinforcement conditions, the “average performance on
all measures improved under the reinforcement condition” (p.42). Therefore, the authors
concluded that a continuous token rewards system was associated with improved performance on
measures of executive functioning among the participating children with ADHD.
Table 2 presents a summary of the token reinforcement studies that were reviewed in this
chapter with reference to authors, participants, measures, treatment, and outcomes.
Table 2
Summary of the Effects of Token Reinforcement on Test Performance
Study Participants
Measure Treatment Reinforcement
Preference Results

35
Established? Edlund (1972)
22 low – mid SES, age 5 – 7
Revised SB – Form M
(1960)
M&Ms (contingent)
and STD
No Candy > STD
Moran (1979)
Group 1: 44, age 4 – 6; Group 2: 46, age 9 – 10
WPPSI (1967) or WISC-R (1974)
TR and STD No Group 1: TR > STD on
BD, SI, OA and GD and STD>BD on AR, IN, DS, CD and AH; Group 2: no significant differences
Breuning & Davis (1981)
40 institutionalized MR, age 13 – 72
WAISa, Leiterb or SB L-M
Correct TR, incorrect TR
or STD
No Correct TR > STD >
Incorrect TR Bradley-
Johnson et al. (1984)
Study 1: 33 Black low SES, grade 2; Study
2: 33 White low SES, grade 2
WISC-R (1974)
Immediate TR (contingent), Delayed TR (contingent)
or STD
Yes Study 1: Immediate
TR > Delayed TR and STD;
Study 2: no significant differences
Johnson et al. (1984)
Group 1: 20 mild MR, age 6 – 12; Group 2:
22 Black, age 12 – 14
WISC-R (1974)
TR (contingent)
or STD
Yes Group 1: TR > CTRL on Verbal and
FSIQ; Group 2: no
significant differences
Yeager (1983)
30 Black (17 M, 13 F) low SES, grade 6, age 11
– 13
WISC-R (1974)
TR (contingent)
or STD
Yes No significant differences
Bradley-Johnson et al. (1986)
40 White (19 M, 21 F) low SES, grades 2 – 3 and
4 – 5
WISC-R (1974)
TR (contingent)
or STD
Yes TR > STD; TR Grades 2-
3 > TR Grades 4- 5
Devers et al. (1994)
31 Chippewa, grade 5- 9
WISC-R (1974)
TR (contingent)
or STD
Yes TR > STD
Callahan (2005)
17 ADHD (16 F, 1 M), age 7 –
12, WASI
SCWTc, WISC-IV (2003) DS
TR and STD No TR > STD

36
IQ>80 & TOLd
Note. TR = token reinforcement, STD = standard administration. EMR = Educably Mentally Retarded, MR= Mentally Retarded. SES = socioeconomic status. SB: Stanford-Binet. WISC-R Subtest BD: Block Design, SI: Similarities, OA: Object Assembly, AR: Arithmetic, IN: Information, DS: Digit Span. WPPSI Subtest GD: Geometric Designs, CD: Coding, AH: Animal House. aWAIS: Wechsler Adult Intelligence Scale. bLeiter International Performance Scale. cSCWT: Stroop Color and Word Test. dTOL: Tower of London task.
Chapter Summary
Of the nine studies that were reviewed, five reported that token reinforcement facilitated
performance (Bradley-Johnson et al., 1986; Breuning & Davis, 1981; Callahan, 2005; Devers et
al., 1994; Edlund, 1972). All of these studies rewarded participants with tokens on a contingent
basis or, at least, participants were told they were being rewarded on a contingent basis
(Callahan, 2005). One study (Yeager, 1983) did not observe differences between treatment
groups. The remaining three investigations (Bradley-Johnson et al., 1984; Johnson et al., 1984;
Moran, 1979) observed significant results and nonsignificant differences for children with
different ages, racial/ethnic characteristics, and the type of tasks that were presented. For
example, Moran (1979) did not observe significant differences between reinforcement and
standard administration groups for 9 to 10 year olds. On the other hand, he reported that 4 to 5
year olds had significantly higher scores on the WISC-R and WPPSI subtests considered
“heuristic” (e.g., Block Design, Similarities, Object Assembly, and Geometric Designs) but not
on the “algorithmic” subtests (e.g., Arithmetic, Digit Span, and Information). Additionally,
Bradley-Johnson et al. (1984) observed immediate reinforcement effects with Black second
grade students. On the other hand, she also reported nonsignificant differences among their
White counterparts. Lastly, Johnson et al. (1984) observed significant group differences in
WISC-R Verbal and FSIQ scores of elementary school students with mild MR who received
token reinforcement. Johnson et al. (1984) also reported nonsignificant effects among Black
junior high school students.

37
It follows that developmental levels may influence the effects of reinforcement on test
performance. For example, reinforcement conditions were demonstrated to be more effective for
younger samples of children compared to older children (Johnson et al., 1984; Moran, 1979).
Two studies failed to observe reinforcement effects among Black junior high school students,
who were among the oldest children tested, on the WISC-R (Johnson et al., 1984; Yeager, 1983).
However, three studies observed reinforcement effects for children of similar ages from different
racial, ethnic, and diagnostic categories (Breuning & Davis, 1981; Callahan, 2005; Devers et al.,
1994). Of note, all of the studies that included children similar in age to the present study sample,
at least to some extent regardless of demographic or diagnostic differences, observed
reinforcement effects for at least one group of subjects on at least one portion of the test measure
with either candy or token reinforcement (Bradley-Johnson et al., 1984, 1986; Callahan, 2005;
Edlund, 1972; Johnson et al., 1984; Moran, 1979).
Establishing reinforcement preference was also examined as a possible contributor to the
efficacy of the experiments. Of the nine studies reviewed, experimenters established
reinforcement preference in five studies (Bradley-Johnson et al. 1984, 1986; Devers et al., 1994;
Johnson et al., 1984; Yeager, 1983). Of the five investigations that established reinforcement
preference, two observed that token reinforcement significantly facilitated performance (Bradley
Johnson et al., 1986; Devers et al., 1994). Two additional studies that established reinforcement
preference observed significant differences for one group of the participants but not the other:
Bradley-Johnson et al. (1984) observed reinforcement effects for Black second grade students
but not White second grade students, and Johnson et al. (1984) observed reinforcement effects
for elementary students with mild MR but not for Black junior high school students. On the other

38
hand, Yeager (1983) established reinforcement preference for her subjects but did not observe
reinforcement effects.
Of the four studies that did not establish reinforcement preference, the experimenters
reportedly offered their participants choices of back-up reinforcers in three (Breuning & Davis,
1981; Callahan, 2005; Moran, 1979). Both Breuning and Davis (1981) and Callahan (2005)
observed significant reinforcement effects. Before testing began, Moran (1979) showed
participants a choice of back-up reinforcers, and he observed reinforcement effects for nursery
school students on tasks considered “heuristic.”
Thus, establishing reinforcement preference appears to be a factor that contributed to the
effectiveness of token reinforcement. Reinforcement preference was established in four of the
studies that observed reinforcement effects in at least one group of participants (Bradley-Johnson
et al., 1984, 1986; Devers et al., 1994; Johnson et al., 1984). Short of establishing reinforcement
preference, providing participants with choices of back-up reinforcers also appears to be
associated with the effectiveness of token reinforcement. A choice of back-up reinforcer was
provided in three of the studies that observed reinforcement effects in at least one group of
participants (Breuning & Davis, 1981; Callahan, 2005; Moran, 1979).
Methodological limitations and study characteristics preclude making a conclusion about
the generalizability of token reinforcement among different cultural, ethnic, and ability groups.
Issues limiting external validity include small sample size of several studies (Callahan, 2005;
Devers et al., 1994; Yeager, 1983). Eight studies contradicted standardization procedures by
providing feedback contingent on correctness (Bradley-Johnson et al. 1984, 1986; Breuning &
Davis, 1981; Callahan, 2005; Devers et al., 1994; Edlund, 1972; Johnson et al., 1984; Yeager,
1983). Additionally, aspects of the Callahan (2005) experiment, including the effect of practice,

39
gender imbalance, and a failure to operationalize the amount of social reinforcement provided
may have served to significantly limit the generalizability of his results.
It should also be noted that eight different tests were used in the nine studies that were
reviewed. However, all but one study utilized one of the Wechsler scales of intelligence in some
capacity. Six of the studies used the WISC-R (1974). One of the six studies used the WPPSI
(1967). Two studies used the WAIS (1955) or WISC-IV (2003), respectively, in concert with
other measures (e.g., Leiter, Stanford-Binet Form L-M, Stroop and TOL tests, see above). One
study used the Stanford-Binet (1960) exclusively. There does not appear to be any difference in
reinforcement effects based on the instrument used, as token reinforcement had a positive impact
on test performance using all of the different tests in different contexts. This finding lends
credibility to the comparability between studies in spite of using different measures.
A recent meta-analysis (Duckworth et al., 2011) of 46 independent samples of random-
assignment experiments testing the effects of material incentives on intelligence test performance
concluded that “incentives increased IQ scores by an average of 0.64 SD, suggesting that test
motivation can deviate substantially from maximal under low stakes research conditions”
(p.7718). Duckworth et al. (2011) included four of the studies included herein (Bradley-Johnson
et al., 1984, 1986; Devers et al., 1994; Edlund, 1972) plus three studies that will be reviewed in
Chapter 3 (Bergan et al., 1971; Saigh & Antoun, 1983; Terrell et al., 1980). The author described
the relationship as a “systematic dose-response” between incentive size and gain in performance
(Duckworth et al., 2011, p.7717). The analysis further revealed that incentives increased IQ
scores more so for subjects with below average IQ scores at baseline than for subjects with above
average IQ scores. The author suggested that individuals who earned lower IQ scores may have
been hindered by either lower intelligence or a lack of motivation. It was also reported that this

40
threat to the validity of IQ score may be less pertinent for examinees who perform in the above
average ranges as their test motivation appears to be higher and less variable in identical
situations.
In spite of methodological drawbacks of some of the studies that were reviewed in this
chapter, token reinforcement has been shown to have a positive effect on standardized test
performance among a variety of populations, including low socioeconomic populations, Black,
White, and American Indian racial/ethnic groups, across ages and grades from nursery school
through junior high school and children who are in institutional settings, or are
classified/diagnosed as educable mentally impaired or ADHD.
41
Chapter 3
A Review of the Effects of Incentive Conditions on Cognitive Test Performance
The use of verbal praise and token reinforcement has been shown to positively influence
performance on a variety of intelligence tests for more 40 years (e.g., Bornstein, 1968; Edlund,
1972; Hurlock 1924, 1925; Witmer et al., 1971). This chapter examines the differential effects of
different forms of reinforcement on the performance of examinees during standardized testing.
Consistent with the literature that was presented in Chapters 1 and 2, electronic searches
were performed involving the following databases: The Educational Resources Information
Center (ERIC), PsycINFO, APA PsycNET, and Education Full Text from 1964 to the present.
Search criteria included the following terms in isolation and in combination: reinforcement
conditions, incentive conditions, verbal praise, rewards, token reinforcement AND cognitive
functioning, intelligence, intelligence test, nonverbal intelligence, and test performance.
References from 1972 to 1994 appearing in Fish (1988), Pollock (1989), and Duckworth et al.
(2011) were also consulted. The process resulted in the identification of 41 experimental studies
that utilized incentive conditions during cognitive testing. Reviews of article titles, abstracts, and
full texts led to the exclusion of 1,087 publications for the following reasons: prior inclusion in
the review, irrelevance to the topic, unavailability of the manuscript, use of un-standardized
measures (e.g., foot races, affect), and articles published beyond a 40 year range that were not
referenced by Fish (1988), Pollack (1989) and Duckworth et al. (2011).
Examined chronologically, Klugman (1944) compared verbal praise to monetary
reinforcement that was contingent on the test performance of elementary school students on the
Revised Stanford-Binet (1937). He did not observe significant differences between groups.
Somewhat later, Tiber and Kennedy (1964) matched 480 second and third grade students on the

42
basis of race and socioeconomic status (SES). They achieved equal numbers of middle SES
White, lower SES White, and lower SES Black students. The Stanford-Binet Form L-M (Terman
& Merrill, 1960) served as the dependent variable. Matched participants were randomly assigned
to verbal praise, verbal reproof (exact comments not described), candy reward, or no
reinforcement groups. The respective incentives were presented at the end of each subtest.
Specific details regarding the actual procedures were not reported. Likewise, information
regarding the assessment of reinforcement preference was not reported. These authors did not
observe significant differences between the Stanford-Binet Form L-M groups’ scores.
Bergan, McManis, and Melchert (1971) investigated the differential effects of verbal
praise, token reinforcement, and standard testing procedures on children’s WISC Block Design
subtest (Wechsler, 1949) performance. Participants initially completed the WISC Block Design
as a pre-test. The authors subsequently matched 48 White fourth grade students with IQ scores
between 80 and 120 by gender and pre-test performance speed. Matched pairs were assigned to
one of three groups. The verbal praise group received examiner statements (i.e., “good,” “fine,”
“right,” “very good,” “okay,” “excellent,” and “correct”). Statements were delivered when each
block had been correctly placed and released as well as at the end of each item. The token
reinforcement group received a white chip for every correctly placed block and a more valuable
red chip for every correct full design. Tokens were delivered according to the same schedule as
the verbal praise statements. Subjects were informed that chips could be traded in for money at
the end of the test. No information regarding reinforcement preference was reported. The
standard procedure group did not receive reinforcement.
The authors examined accuracy (total items correctly solved) and speed (absolute time
score, or percentage of allowed time used on successfully completed designs) of responses. They

43
did not observe overall significant differences by treatment group or gender. They did, however,
identify differential effects based on the interaction of treatment group and gender with respect to
speed and accuracy. Boys evidenced greater gains in mean accuracy scores with token
reinforcement as compared to verbal praise or control conditions. In contrast, boys evidenced
faster speed in the verbal praise condition as compared to the other conditions. Neither overall
speed nor overall accuracy were influenced by the reinforcement conditions. However, girls in
the verbal praise condition showed significantly greater gains in accuracy mean scores relative to
their pre-test scores as compared to boys. In contrast, boys who received verbal praise made
significantly greater gains in speed between pre- and post-tests than girls. The authors concluded
that extrinsic reinforcement effectively influenced performance on the participants on the WISC
Block Design subtest and that verbal praise impacted the performance of boys and girls
differently. In conclusion, the authors advised that the use of praise be avoided given “its
variable effect on children” (p. 879).
In an investigation involving cultural and linguistic variables, Quay (1971) compared the
effects of verbal praise and token reinforcement on test performance. Participants included 100 3
and 4 year old Black Head Start students. Form L-M of the Stanford-Binet (1937) served as the
dependent variable and was administered by Black examiners. Participants were randomly
assigned to one of four treatment conditions: (1) standard English praise; (2) standard English
praise and candy; (3) “Negro dialect” praise or (4) “Negro dialect” praise and candy. In the
candy conditions, a piece of candy was distributed after children passed the first item on a
subtest and after each correct answer thereafter. Reinforcement preference for the candy was not
established prior to testing, and participants in the candy conditions were not informed about
why they received or did not receive candy. Quay did not include a no-reinforcement condition.

44
Praise was provided in the form of “warm, outgoing individuals who expressed praise
genuinely” (p. 9). Statements such as “that’s good” characterized praise in the standard English
conditions; exact phrasing was not provided for comparable praise given in the “Negro dialect”
conditions. Instructions were also changed in the protocol for the “Negro dialect” condition. For
example, to introduce the Pictorial Similarities and Differences subtests, examiners presented a
card and said, “see all dese crosses? See how mos’ of ‘em de same? Here go on [pointing] what
ain’t like de uvvers. Put your finger on de one what ain’t de same like de uvvers” (p. 8).
Quay did not observe significant differences between the mean Stanford-Binet IQ scores
of the comparison groups. She concluded that the introduction of a material incentive had no
effect on lower SES children. She also suggested that, as the mean IQs for the subjects closely
approximated those of children who attended nursery school programs, the subjects’ motivation
was already relatively high. As such, it was suggested that their performance was representative
of functioning that was close to their intellectual limits.
In 1975, Quay conducted a second study that closely approximated the methodology of
her earlier work, including the decision not to use a comparison (i.e., no reinforcement) group. In
this later effort, 96 Black (low SES) fourth graders were randomly selected from two schools that
were deemed “high impact schools” (p. 133) as the schools were located in an area of an
American city with the highest poverty. The methodology only differed from her earlier study in
that examiners informed subjects of the contingent basis on which they could receive a material
incentive, which was a nickel if subjects achieved “enough correct answers” (p. 133).
Reinforcement preference for receiving money was not established prior to testing.
Once again, Quay did not observe significant differences between the Stanford-Binet IQ
scores of the comparison groups. This result failed to support earlier claims that children from

45
low-income homes are more highly influenced by material rewards than more privileged children
(Havighurst, 1970). However, the lack of a control group constitutes a limitation of the study.
In a departure from investigations that considered the influence of cultural variables and
testing procedures, Miller (1974) investigated the effects of incentive conditions on the
performance of 60 “institutionalized retardates.” Subjects ranged in age from 9 to 21 years and
were matched by sex (equal numbers of male and female), etiology of retardation (organic or
familial according to American Association of Mental Deficiency criteria), age, and IQ. Subjects
were further categorized on an environmental variable as relatively deprived or relatively
undeprived socially. The extent of each participant’s social deprivation was determined through
ratings on the Social Interaction Inventory (Miller, 1974). The investigator administered both
forms of the Peabody Picture Vocabulary Test (PPVT; Dunn, 1965) to examine gain scores.
After the initial administration of the PPVT under standardized conditions, subjects were
randomly assigned to one of three groups: contingent verbal praise, contingent token
reinforcement, or standard administration procedures (i.e., no reinforcement) during test
administrations of the alternate form of the PPVT.
Verbal praise consisted of statements such as “that’s very good,” “hey, another one
right,” and “right again; you must do very well in school” after each correct response. In
addition, the examiner spent 15 to 30 seconds in conversation with examinees after every third
response. Token reinforcement consisted of presenting a penny after each correct response.
Pennies were exchangeable for candy at a later time. Thus, reinforcement preference was not
established. The standard administration procedure involved noncontingent approval statements
that were not described.

46
The author did not observe significant differences between groups on the PPVT relative
to the first administration raw scores or estimated mental age scores. However, the author did
report an interaction wherein subjects that were considered to be relatively undeprived who were
in the verbal praise condition had significantly higher raw scores compared to the scores of the
relatively deprived subjects in the same condition. Of note, the noncontingent approval
statements used in the control conditions were not described and, thus, their influence cannot be
measured.
Masters, Furman, and Barden (1977) designed a study to investigate the effect of self-
administered praise and token reinforcement on the performance of nursery school children.
They also examined different standards of achievement as an additional variable. The authors
presented 48 children aged 4 to 5 years with 12 color-discrimination problems involving three
different color shapes. Participants were randomly assigned to one of four different standards of
performance: low (4 correct out of 12), medium (8 correct out of 12), high (all 12 correct), or
accelerating (one more correct than on previous trial). In the first experiment, an examiner
praised children and a light was turned on after each correct response. If participants reached the
standard, they were given a token. Children were informed that tokens could be exchanged for
prizes, and that “the more tokens they earned the better a prize they would get” (p. 219). No
information about the type of reward or the establishment of reinforcement preference was
provided. In the second experiment, children were randomly assigned to groups and informed if
they had met the performance standard that was set forth by the condition. They were then
instructed to announce their number of correct responses and either say “I did very good!” or “I
didn’t do very good!” depending on whether or not they met the achievement standard given. At
the end of each trial, examiners counted the number of correct responses and presented children

47
with a chip if the target number of items were correct depending on the achievement standard
condition.
The investigators analyzed the number of correct responses during each trial for the
respective achievement standard conditions (low, medium, high, or accelerating). Analysis of
both experiments (i.e., token reinforcement and self-evaluative praise) revealed that learning
across trials was significantly greater in the high and accelerating standard conditions, regardless
of the amount of token or self-evaluative reinforcement, suggesting that meeting or surpassing a
more challenging standard has “intrinsically rewarding properties” (p. 222). However, all
children in the self-evaluative praise condition performed with near perfect accuracy by the end
of the trials regardless of their achievement standard. The authors concluded that self-evaluative
praise exerted a more powerful influence on nursery school children’s performance under all
achievement conditions compared to when they received token reinforcement.
Saigh and Payne (1979) investigated the influence of reinforcement schedules and the
effects of verbal praise and token reinforcement on intelligence test performance. On a fixed-
ratio reinforcement schedule (FR), reinforcement is given for a set number of responses of a
particular type. In contrast, on a continuous reinforcement schedule (CR), reinforcement is given
every time a particular response is emitted (Martin & Pear, 1988). Saigh and Payne’s sample
consisted of 120 (gender-balanced) children and adolescents who were institutionalized and
considered to be educably mentally retarded (EMR). The mean IQ of the subjects was 65.25,
their mean age was 11.8, and approximately two-thirds of the sample was White. Subjects
received administrations of the Arithmetic, Digit Span, Picture Completion, and Block Design
subtests of the WISC-R (Wechsler, 1974). They were then randomly assigned to one of six
conditions: Subjects in the fixed-ratio verbal praise (FR-VP) condition were told “that was very

48
good, keep it up” after the first, second and third items in the subtest, regardless of their
response, and “that’s the stuff” or “you’re doing well, keep it up” between subtests. In the fixed-
ratio token reinforcement (FR-TR) condition, subjects received a token on the same fixed
schedule. Tokens were exchangeable for candy at the end of testing. No information on
reinforcement preference was reported.
In contrast, subjects in the continuous-ratio verbal praise (CR-VP) condition were praised
after every response regardless of correctness and between subtests by reporting the same verbal
comments. In the continuous-ratio token reinforcement (CR-TR) condition, subjects received one
token for each response and between subtests. Lastly, subjects in both the fixed- and continuous-
ratio neutral conditions (FR-VN and CR-VN, respectively) were told “let’s try this,” “here is the
next,” and “let’s try these” on the same fixed or continuous schedules as treatment groups.
Analyses revealed that the mean scaled scores of the subjects in the verbal praise and
token reinforcement conditions exceeded the scores of the control group on the WISC-R
Arithmetic, Digit Span, and Picture Completion subtests. Differences in mean scaled scores
between the verbal praise and token reinforcement conditions on the three subtests were not
significant. Nonsignificant differences were observed across groups on the Block Design subtest.
Moreover, nonsignificant differences were reported relative to the type of reinforcement
schedule. Overall, the authors found that reinforcement (both verbal praise and token
reinforcement, on both reinforcement schedules) effectively increased the number of items
attempted and resulted in significantly higher scores. The authors concluded that the application
of noncontingent reinforcement of either type, on either schedule, may effectively increase the
performance of institutionalized EMR students.

49
Terrell, Taylor, and Terrell (1978) and Terrell, Terrell, and Taylor (1980, 1981) built on
Quay’s (1971) earlier work by conducting three experiments that compared the effects of
culturally relevant verbal praise, tangible reinforcement, and standardized administration (i.e., no
reinforcement) on the cognitive test performance of Black elementary school students. The
authors’ first study (1978) investigated the WISC-R (1974) performance of 80 low SES Black
second graders in the Southern United States (no gender information was reported). Participants
received administrations of a short form of the WISC-R (subtests were not reported) by a Black
doctoral-level psychologist under one of four conditions: a non-reinforcement condition, a candy
reward condition (one M&M after each correct response), a traditional verbal praise condition
(“good” or “fine” after each correct response) or a culturally relevant reinforcement condition, in
which the examiner would state “good job, blood” and “nice job, little brother” after each correct
response. No information on establishing subjects’ reinforcement preference was reported.
Data analyses revealed that the mean WISC-R IQ scores of children in the culturally
relevant and tangible reinforcement conditions significantly exceeded those of the control and
verbal praise groups. No significant differences were observed between the scores of the
culturally relevant and tangible reinforcement groups or between the scores of the traditional
verbal praise and the standard procedure groups. The results supported the idea that culturally
appropriate verbal reinforcement is indicated for cognitive testing with Black children as an
alternative to traditional verbal praise.
Terrell et al. (1980) conducted a second investigation involving 120 Black male students
between the ages of 9 and 11 years in Southeastern elementary schools. Subjects were randomly
assigned to the same non-reinforcement, candy reward, traditional verbal praise, and culturally
relevant reinforcement groups as in the Terrell et al. (1978) investigation. Reward conditions

50
were contingent on correct responses and candy was offered as a reward. Information about the
establishment of reinforcement preference was not reported. The race of the examiner was added
as an additional independent variable and subjects were assigned to either a Black or White male
masters-level examiner.
Data analysis revealed that the subjects who received candy rewards achieved
significantly higher mean WISC-R scores relative to the subjects who were given traditional
verbal praise and the subjects that were not reinforced. Mean scores of subjects given traditional
verbal praise were slightly higher but not significantly different than scores obtained in the non-
reinforcement condition. No significant differences were observed between the WISC-R scores
as a function of examiner race. However, interaction effects were noted. The subjects who
received culturally relevant reinforcement by a Black examiner had significantly higher WISC-R
scores relative to subjects in the same condition who were examined by a White examiner.
Receiving culturally relevant reinforcement by a Black examiner was not significantly different
from receiving candy rewards from a Black examiner. In addition, the subjects who received
candy rewards from White examiners had significantly higher WISC-R scores relative to the
subjects in the other experimental conditions who were tested by White examiners. In sum,
candy rewards were the most effective type of reinforcement for White examiners to administer
to lower SES Black elementary school children. However, candy rewards and culturally relevant
reinforcement were equally effective when administered to lower SES Black subjects by Black
examiners.
Terrell et al. (1981) conducted a similar study with a sample of 100 Black male students
aged 9 to 11 who were classified as mildly mentally retarded (based in part on their WISC-R or
Stanford-Binet test scores). Children were randomly assigned to one of four treatment groups

51
(identical to those described in Terrell et al., 1978) and randomly assigned one of three Black
examiners.
No significant differences were observed between the WISC-R scores of the tangible and
culturally relevant reinforcement groups. On the other hand, the mean WISC-R IQ scores of both
groups significantly exceeded the mean IQ scores of the verbal praise and control groups.
Further, children in the tangible and culturally relevant reinforcement groups had significantly
higher scores on the WISC-R than they had previously achieved without reinforcement on
measures that contributed to their placement in special education. Their scores were also higher
than the threshold scores that were used to establish their mental retardation diagnoses. The three
studies by these authors present important implications for the use of tangible and culturally
relevant reinforcement on the cognitive test performance of Black elementary school children
who were either diagnosed as mentally retarded or were from low SES backgrounds. Overall, it
may be said that culturally relevant reinforcement from Black examiners and tangible
reinforcement in general, enhanced the WISC-R performance of the selected subjects.
Kieffer and Goh (1981) introduced an alternative to traditional verbal praise during
cognitive assessment when they compared the effects of social rewards to tangible
reinforcement. Tangible rewards included money ($0.25), candy, and gum. Social rewards at
home included playing a game with a parent, riding a horse or bicycle with a parent, or staying
overnight at a friend’s house. Subjects included 96 third and fourth graders from two public
elementary schools in central Michigan. Subjects were categorized as being from low (50%) or
middle (50%) SES backgrounds based on their enrollment in a federally-financed hot lunch
program. No information regarding gender was provided. Subjects were screened with the Quick
Test (Ammons & Ammons, 1962), which is a picture-vocabulary test that measures intelligence.

52
Cases were excluded if their scores fell outside the average range. Equal numbers of subjects
from low and middle SES backgrounds were then randomly assigned to groups that received
social rewards, token reinforcement, or no reinforcement (control). A short form of the WISC-R
(1974) that included the Information, Similarities, Picture Completion, and Block Design
subtests served as the dependent variable.
Participants also completed the revised Mediator-Reinforcement Incomplete Blank
(MRB; Tharp & Wetzel, 1971) in order to determine reinforcement preference and relative
strength of potential tangible and social reinforcers. Based on the MRB, preferences for tangible
or social rewards were approximately equal among participants and preferences did not differ
based on socioeconomic background. Before testing, children were reminded of their reported
reward preference and were told “if you try to do your best for the next ten minutes on this game,
I can see that you receive the reward you want most after school” (p.178).
The authors did not observe significant WISC-R subtest differences between the groups.
Overall, children from middle SES backgrounds achieved significantly higher scores than
children from low SES backgrounds. On the other hand, the authors detected a significant
interaction between SES and reward condition, in that the IQs of children from the middle and
low SES groups were significantly less disparate in the reinforcement conditions than in the
control condition. This suggests that either type of reinforcement had a greater effect for children
from low SES backgrounds than for children from middle SES backgrounds.
Continuing in the pursuit of understanding the effects of token reinforcement and verbal
praise on understudied populations, Saigh and Antoun (1983) provided different incentives to a
sample of adolescent females who were diagnosed with Conduct Disorder as denoted by the
DSM-III (American Psychiatric Association, 1980). Participants were 51 adolescents (48 White,

53
3 Black) in the seventh through 12th grades at a state-supported residential facility. Subjects’
histories were significant for aggressive behavior (63%), alcohol abuse (35%), truancy from
home (70%), sexual promiscuity (48%), charges related to shoplifting (22%), and symptoms of
anxiety and social withdrawal (16%). Participants received administrations of a short form of the
WISC-R (1974) Information, Arithmetic, Digit Span, Picture Completion, and Block Design
subtests. The subtests were administered under one of three conditions: examiner praise (i.e.,
“that was very good” contingent on number of items attempted), token reinforcement (tokens and
back-up reinforcers were not described), and neutral examiner feedback (i.e., “now try this”). No
information was provided on the type of token, type of reward available, or reinforcement
preference.
The authors observed significantly higher scores for subjects in the token reinforcement
condition compared to control subjects on the Digit Span, Picture Completion, and Block Design
subtests. Nonsignificant differences were reported on the Information and Arithmetic subtests.
Scores for subjects in token reinforcement conditions were consistently higher than scores for
subjects in the verbal praise condition, but differences were not significant. Lastly, although
mean scores for subjects in the verbal praise condition were consistently higher than subjects in
the standard administration condition, differences were not significant.
Given the variations that were observed, it was suggested that performance on the
selected verbal subtests may not be appropriate for making educational placement decisions for
adolescent girls with comparable symptoms.
Miller and Eller (1985) examined the effects of incentive conditions on different racial
and cultural groups. Participants included 135 middle school students of equal proportions of
both genders. Subjects belonged to one of the following three groups based on the Hollingshead

54
Two-Factor Index of Social Position (1965): low SES White, low SES Black, or middle SES
White. Both forms of the Otis-Lennon Mental Ability Test (Otis & Lennon, 1967) were used as
the dependent variables.
The authors compared participants across a counterbalanced design so that all
participants were tested three times. One group completed a pretest under standard conditions,
received verbal praise in a second test administration, and this was followed by the provision of
monetary reinforcement during the third test administration. A second group took a pretest under
standard administration procedures and subsequently received monetary reinforcement and then
verbal praise during the second and third administrations, respectively. A third group was only
tested under control conditions. The monetary reinforcement condition involved a promise of
$2.00 for each improved test score relative to the pretest. No information regarding
reinforcement preference was reported. Verbal praise statements (not described) were read from
a script prior to testing.
Significant differences were observed for the experimental groups with respect to
baseline testing compared to the control group. No significant differences were observed overall
between verbal praise and monetary reward conditions. However, several interactions were
observed for different subgroups within the sample. The most significant increases in scores
from baseline were observed for the subgroup of lower SES Black children when they received
monetary incentives compared to the rest of the sample. In contrast, the most significant
increases in scores relative to baseline were observed for the subgroups of lower and middle SES
White children when they received praise compared to the following subgroups: all White
participants, all males, all White females, all White males, White middle SES females, White
low SES males and all low SES males. The combination of receiving money followed by praise

55
was particularly effective for improving the scores of both middle SES White males and for
White females from both socioeconomic groups compared to all subjects and all other
subgroups.
Seligson (1995) undertook a study of the effects of test incentives with a more clinical
population. His subjects included 60 adult chronic undifferentiated schizophrenic patients from a
state psychiatric clinic. Scores on the Wechsler Adult Intelligence Scale – Revised (WAIS-R;
Wechsler, 1981) Picture Arrangement, Vocabulary, Block Design, Arithmetic, and Similarities
subtests served as the pre-test measures and dependent variables. Seligson administered the
subtests under one of three conditions: verbal praise, token reinforcement, and control (no
reinforcement) conditions. Examiners in the verbal praise condition told participants “very
good,” “fine,” “keep it up,” and “you are doing a very good job” in random order after every
response. In the token reinforcement condition, subjects were told that tokens would be
dispensed based on effort and tokens were exchangeable for chocolate, money, or McDonalds
gift certificates. No information on establishment of reinforcement preference was provided.
Tokens were dispensed after every response regardless of correctness.
Pre-test WAIS-R subtest scores served as covariates in the statistical analysis. Seligson
(1995) did not observe significant differences between groups. Of note, the present study served
to corroborate earlier findings that older subjects may be less influenced by incentive conditions
on standardized tests as compared to younger populations. Alternatively, the results may have
been more reflective of the psychopathology that is associated with schizophrenia.
In a related study, Fallon (2002) investigated incentive conditions on a sample of youths
with Conduct Disorder (CD). Participants were 28 male and 35 female students between the ages
of 12 and 16 at residential/day treatment programs. They identified their race/ethnicity to be

56
either Black (70%), Hispanic (29%) or mixed (1%). All participants were diagnosed with CD.
Full Scale IQ scores from the WISC-III (Wechsler, 1991) served as the dependent variable.
Participants were randomly assigned to one of three conditions: verbal praise, token
reinforcement, or standard administration (no reinforcement). During the standard
administration, the examiner told participants “now try this,” “how about this,” and “here is the
next one” after each of the first three responses in a subtest, and “let’s try something different”
between subtests. Examiners in the verbal praise condition told participants “very good,” “fine,”
and “you are doing a very good job” on the first three items in a subtest, “good job, keep it up”
for every other response after the first three items, and “that was good, let’s try some more”
between subtests. Lastly, in the token reinforcement condition, pennies were awarded for effort
on the same non-contingent, fixed reinforcement ratio. Pennies were exchanged after testing for
a reward that was previously chosen from a reward menu, thus establishing participants’
reinforcement preference prior to testing.
Fallon did not observe significant differences between treatment groups on WISC-III
Verbal, Performance, or Full Scale IQs or on the subtest scores. Of note, post-hoc analysis
determined that subjects in the verbal praise and token reinforcement conditions reported
significantly more positive thoughts about the testing experience relative to controls as rated on a
follow-up questionnaire.
Continuing research with distinctive clinical populations, Kohls, Herpertz-Dahlmann and
Konrad (2009) investigated the effects of social or monetary reinforcement on the
neuropsychological test performance of boys with ADHD. Participants included 32 boys
between 8 and 13 years old with a mean IQ of 85. Half of the participants were previously
diagnosed with ADHD and the other half served as controls. Contrary to the majority of
57
experiments reviewed herein that utilized intelligence tests, the participants were administered a
computer-based go/no-go task similar to the Conners Continuous Performance Test-II (Conners,
2004). This task required participants to press a button when a certain stimuli was presented and
inhibit that action (i.e., not press the button) under a different set of stimuli. Individual testing
sessions included all three of the following conditions: a non-reward baseline administration, an
administration that presented social rewards (symbolized on the computer by images of “happy
and exuberant facial expressions”), and an administration that presented monetary rewards
(symbolized on the computer by images of different colored wallets each filled with 50 eurocent
coins). Rewards were provided for successful response inhibition. In the monetary condition,
participants were informed that better performance would result in being awarded more money
after the testing sessions. Reinforcement preference was not established prior to testing, but post-
hoc analysis of reward value indicated that both conditions (social rewards and monetary
rewards) were rated as more rewarding than the baseline condition. Although the dependent
variable used in the present study cannot be considered to be comparable to any cognitive
measures that were previously discussed, scores (i.e., false alarm rates) on the go/no-go task are
good indicators of cognitive control (inhibition), which has been proposed as the main deficit for
children with ADHD (Barkley, 1997).
Data analyses revealed that all participants significantly improved their overall scores
(i.e., reduced their false alarm rates) in both social and monetary reward conditions compared to
their baseline scores. This result indicated that all participants exercised greater cognitive control
when reinforcement was given. Although nonsignificant differences were observed overall
between social and monetary reward groups, participants’ lowest false alarm rates were observed
during the monetary reward condition compared to the social reward and baseline conditions.

58
Specifically, false alarm rates were lower in the social reward condition than in the baseline
condition but were not as low as in the monetary reward condition. However, an interaction
occurred between groups (healthy control or ADHD) and type of reward wherein the participants
with ADHD evidenced significantly lower false alarm rates with respect to baseline scores when
they received social rewards compared to healthy controls. The authors concluded that
adolescent boys with ADHD may be more responsive to social rewards because of the
experience these children tend to have with social disapproval due their condition. Of note, given
this study’s dissimilarity with other studies on incentive conditions, including the abilities
measured, the contingent basis of the enhanced monetary reward condition, and the use of
computers to dispense reinforcement, it can only be compared to the reviewed studies
qualitatively.
Table 3 presents a description of the 15 experimental studies comparing the effects of
token reinforcement and verbal praise on test performance plus two relevant studies that cannot
be compared directly to other studies included herein as a result of not using cognitive
assessments.
Table 3
Summary of the Effects of Verbal Praise and Token Reinforcement on Test Performance
Study Participants
Test Measure Treatment Reinforcement Preference
Established?
Results
Klugman (1944)
72 (38 White, 34 Black),
grade 2 – 7; gender approx.
equivalent
SB (1937) VP, monetary
reward
No No significant differences
Tiber & Kennedy
480 low SES Black and
SB (1937) Candy, VP, reproof or
No No significant differences

59
(1964) White and mid SES White, age
7 – 9
STD
Bergan et al. (1971)
48 White 4th grade, IQ 80 -
120
WISC (1949) Block Design
subtest (accuracy and
speed)
Contingent VP, TR or
STD
No Boys TR > VP/STD
accuracy, VP > TR/STD
Speed; Girls VP > TR/STD
Accuracy Quay
(1971) 100 low SES
Black, age 3 – 4 SB (1937) VP,
culturally relevant
praise, or TR (all
contingent)
No No significant differences
Quay (1975)
92 low SES Black, age 8 –
10
SB (1937) VP, culturally relevant
praise (CRP), or TR (all
contingent)
No No significant differences
Miller (1974)
60 institutionalized MR, age 9 – 21
PPVT (1965) VP, TR or STD
No VP > TR/STD for socially
undeprived sjs (no significant differences for
socially deprived sjs)
Masters et al.
(1977)
48 White mid SES, age 4 – 5
Color Discrimination
Task
Self-administered praise (SAP) or TR (both contingent)
No SAP > TR
Saigh & Payne (1979)
120 Educably MR, mean age 11.8, mean IQ
62.25 (2/3 White)
WISC-R (1974) AR, DS, PCm &
BD
VP, TR or STD
No VP and TR (no significant differences) > STD on AR, DS & PCm
Terrell et al. (1978)
80 low SES Black boys, 2nd
Grade
WISC-R Short Forma
VP, CRP, TR or STD
No CRP and TR (no significant differences) > VP and STD
Terrell et al. (1980)
120 low SES Black boys, age
9 - 11
WISC-R Short Forma
VP, CRP, TR or STD
No CRP and TR (no significant differences) >

60
VP and STD (no significant differences);
Black examiner CRP
> White examiner CRP
and White examiner TR
> White examiner CRP
Terrell et al. (1981)
100 Black mild MR, age 9 – 11
WISC-R Short Forma
VP, CRP, TR or STD
No CRP and TR (no significant differences) > VP and STD
Kieffer & Goh
(1981)
96 low to mid SES, grade 3 –
4
WISC-R (1974) IN, SI, PCm & BD
Contingent VP, TR or
STD
Yes No significant differences
Saigh & Antoun (1983)
51 Conduct Disorder girls (48 White, 3
Black), grades 7 – 12
WISC-R (1974) IN, SI, PCm, BD &
AR
TR, VP or STD
No TR > STD on BD, DS, PCm (no significant
differences between TR, VP and STD
across measures)
Miller & Eller
(1985)
135 low SES White/ Black and mid SES
White, middle school age
Otis Lennon Mental Ability
Test (1967) (group
administration)
Contingent TR, VP or
STD
No TR > VP/STD for black sjs,
VP > TR/STD for white sjs
Seligson (1995)
60 chronic undifferentiated psychotic adults
WAIS – R (1981) PA,
VC, BD, AR & SI
VP, TR or STD
No (Choice of Rewards)
No significant differences
Fallon (2002)
63 (28 M, 35 F) Conduct
Disorder, age 12 – 16 (70%
Black)
WISC-III (1991)
TR, VP or STD
Yes No significant differences
Kohls (2009)
32 boys, age 8 – 13, mean IQ 85,
50% ADHD
Computer-based go/no-go task (i.e., false
alarm rates)
Contingent social
reward, monetary reward, or
STD
No Social Reward and Monetary Reward (no significant
differences) > STD; Social

61
Rewards = sjs with ADHD >
healthy controls
Notes. TR = token reinforcement, VP = verbal praise, STD = standard administration. MR = Mentally Retarded. SES = socioeconomic status. SB: Stanford-Binet. PPVT: Peabody Picture Vocabulary Test. WISC-R Subtest BD: Block Design, SI: Similarities, OA: Object Assembly, AR: Arithmetic, IN: Information, DS: Digit Span, PCm: Picture Completion. aWISC Short Form: subtests could not be determined. WAIS: Wechsler Adult Intelligence Scale. WAIS Subtest PA: Picture Arrangement.
Chapter Summary
Reinforcement condition vs. control group. Of the 15 studies that were reviewed, 12
studies utilized a control group. Six investigations observed significantly higher scores for
groups under reinforcement conditions compared to standard administrations that did not involve
incentives (Miller & Eller, 1985; Saigh & Antoun, 1983; Saigh & Payne, 1979; Terrell et al.,
1978; Terrell et al., 1980, 1981). Four studies did not observe significant differences between
reinforcement and control groups (Fallon, 2002; Kieffer & Goh, 1981; Seligson, 1995; Tiber &
Kennedy, 1964). The remaining two studies (Bergan et al., 1971; Miller, 1974) did not observe
significant differences between groups and will be discussed further in relation to important
interactions that were observed.
Comparisons between types of incentive conditions. Despite inconsistent use of
control groups, the 15 studies that were reviewed compared different incentive conditions. Three
studies that did not use control groups observed equivalent effects for token reinforcement and
verbal praise (Klugman, 1944; Quay 1971, 1975). Saigh and Payne (1979) observed equivalent
effects of verbal praise and token reinforcement conditions on children and adolescents
diagnosed with mental retardation, particularly on subtests that the authors concluded required
increased attention and concentration. Despite nonsignificant differences between groups,
Kieffer and Goh (1981) observed that the IQ scores of low and middle SES children were less
62
disparate when they received either type of reinforcement compared to no reinforcement. The
remaining five studies did not observe significant differences between either incentive conditions
or between no reinforcement conditions (Bergen, 1971; Fallon, 2002; Miller, 1974; Seligson,
1995; Tiber & Kennedy, 1964), though both Bergen (1971) and Miller (1974) observed
interaction effects discussed below.
Seven studies observed differences between different types of incentive conditions
among different populations. Three studies (Terrell et al., 1978; Terrell et al., 1980, 1981)
determined that token reinforcement was superior to traditional verbal praise for Black
elementary children. Token reinforcement was also found to be equivalent to culturally relevant
verbal reinforcement presented by Black examiners (Terrell et al., 1978; Terrell et al., 1980,
1981). Miller and Eller (1985) observed that low SES Black children who received token
reinforcement performed better on group intelligence tests than those who received verbal praise
or no reinforcement whereas low to middle SES White children performed better when they
received verbal praise. Lastly, Saigh and Antoun (1983) observed significantly higher scores
during token reinforcement conditions for adolescent girls with Conduct Disorder on non-verbal
subtests of the WISC-R compared to a standard administration condition, though the scores for
subjects in token reinforcement conditions were not significantly higher than the scores of
subjects in the verbal praise condition. Mean scores for subjects in the verbal praise condition
were consistently higher than subjects in the standard administration condition, but these
differences were not significant. When using a non-cognitive assessment, Masters et al. (1997)
observed that self-administered praise for nursery school children was more effective than token
reinforcement. Kohls et al. (2009) also observed that while monetary rewards effectively
63
improved the cognitive control of an overall group of adolescent boys on a go/no-go task, social
rewards were more effective for the portion of the group diagnosed with ADHD.
Of the studies undertaken with any participants similar in age to the present study sample,
two did not observe differences in performance between experimental conditions (Klugman,
1944) or between experimental and control conditions (Tiber & Kennedy, 1964). Terrell et al.
(1978) observed that token reinforcement was more effective than traditional verbal praise and
standard administration for Black second grade boys from low SES backgrounds, but also
observed that token reinforcement was equally as effective as culturally relevant verbal praise
when delivered by a Black examiner.
Further Interactions Among Variables. Three studies observed significant interactions
wherein one or both types of reinforcement improved performance for one level of the
independent variable condition (i.e., demographic or relative social experience) (Bergan, 1971;
Miller, 1974; Terrell et al., 1980). Bergan (1971) observed that boys evidenced greater gains in
their mean accuracy scores on the WISC Block Design subtest (1949) in the token reinforcement
conditions than in the verbal praise or control conditions. In contrast, boys evidenced greater
reductions in speed when verbal praise was provided relative to the token reinforcement and
control conditions. On the other hand, girls in the verbal praise condition showed significantly
greater gains in their mean accuracy scores than boys in the verbal praise condition. However,
the boys who received verbal praise made significantly greater gains in speed between pre- and
post-test than did the girls. Miller (1974) observed a positive effect of verbal praise on relatively
undeprived institutionalized subjects’ scores on an expressive picture identification test. Terrell
et al. (1980) distinguished Black examiners for their ability to elicit better performances from
Black examinees compared to White examiners using culturally relevant verbal praise.

64
Establishing reinforcement preference, as well as offering subjects a choice of back-up
reinforcers, appears to have contributed to the effectiveness of token reinforcement in the studies
reviewed. Thus, the establishment of reinforcement preference was examined as a possible
contributor to the efficacy of token reinforcement in the experiments comparing different
incentive conditions. Of the 17 studies reviewed, experimenters established reinforcement
preference in only two studies (Fallon, 2002; Kieffer & Goh, 1981). While reinforcement
preference was established, it did not appear to influence the participant performance. Neither
study observed significant differences between scores obtained under token reinforcement,
verbal praise, and/or standard administration conditions. Although Seligson (1995) did not
establish reinforcement preference for the adult subjects in his study, he offered participants a
choice of candy bars, money, or a gift certificate to McDonalds. Seligson also did not observe
reinforcement effects. In contrast to the previous chapter, establishing reinforcement preference
does not appear to be a factor that contributed to the effectiveness of token reinforcement in
studies that compared different incentive conditions.
Similar to earlier chapters, the studies that were reviewed herein were also limited due to
different factors. Two studies were excluded from the final analysis because they did not use
cognitive ability tests (Kohls et al, 2009; Masters et al, 1977). Miller and Eller (1985) used a
group intelligence test and its comparability is limited. Lastly, eight of the studies reviewed
provided reinforcement on a contingent basis for correct responses on intelligence tests, which
may have violated recommended administration procedures.
Summary of Effects of Incentive Conditions in Testing
Examined in toto 41 studies were reviewed. Due to the lack of comparability between
experimental procedures and outcomes and the mixed findings in the literature, conclusions

65
regarding the unambiguous effects of incentive conditions on the test performance of different
populations cannot be made. Nevertheless, reinforcement effects were observed for participants
similar in age to the present study sample regardless of demographic or diagnostic differences in
nine of the 11 studies that included 6 or 7 year old participants, at least to some extent.
Establishing reinforcement preference and/or offering a choice of back-up reinforcers in token
reinforcement systems appears to be associated with the effectiveness of token reinforcement as
reinforcement effects were observed for seven of the 11 studies in which preference was
established or choices were available. Overall, verbal praise and token reinforcement were
associated with significantly higher test scores on a variety of outcome measures and a wide
range of subjects (i.e., elementary school children, nursery school children, junior high school
children, students in special education, students in mental health institutions, and students from
diverse racial and socioeconomic backgrounds).

66
Chapter 4
Methodology
Statement of the Problem
There is a general accord in the literature of psychological assessment regarding the need
to secure examinee effort during the administration of standardized tests (Anastasi, 1982;
Anastasi & Urbina, 1997; Cronbach, 1990; Saigh & Payne, 1979; Sattler, 2008). The literature is
also consistent with respect to the significance of the need to establish rapport (Reschly, 1979;
Terman, 1916; Terman & Merrill, 1972; Wechsler, 1991) and the importance of motivating
examinees during standardized testing (Anastasi, 1982; Cronbach, 1990; Sattler, 2008). On the
other hand, the literature is somewhat vague regarding the best way to motivate children and
maintain effort during the administration of standardized tests. Several studies have investigated
the use of operant procedures to bring out a child’s best performance, including verbal praise and
token reinforcement (Fallon, 2002; Pollock, 1989; Saigh & Payne, 1976, 1978, 1979; Saigh,
1981). Verbal praise and/or token reinforcement have been offered in studies on a predetermined
and non-contingent basis (Saigh & Payne, 1976, 1978, 1979; Saigh, 1981) and contingent on
effort or performance (Pollock, 1989). Other studies have gone further to include reproof
conditions to elicit maximum effort from examinees (Hurlock, 1924; Tiber & Kennedy, 1964;
Witmer et al., 1971). Within this context, examiner verbal praise for examinee effort has been
associated with significantly higher intelligence test scores relative to the scores of controls
(Bornstein, 1968; Witmer et al., 1971; Saigh & Payne, 1976; Saigh, 1981). In a similar vein, the
use of token reinforcement to reward test taking effort has been associated with improved test
scores among a number of populations (Bradley-Johnson et al., 1986; Breuning & Davis, 1981;
Callahan, 2005; Devers et al., 1994; Edlund, 1972). Other studies have failed to demonstrate

67
significant differences between test scores of control and treatment groups receiving verbal
praise and/or token reinforcement and found differential and interaction effects related to
demographics, such as age (Johnson et al., 1984; Moran, 1979; Pollock, 1989), gender (Quay,
1975), race/ethnicity (Bradley-Johnson et al., 1984), or design characteristics such as providing
reinforcement on continuous or fixed-interval schedules (Saigh & Payne, 1978).
Need for the study
Given the long-term implications and placement decisions that are based, at least in part,
on the results of standardized testing, it is a crucial goal of school psychologists to obtain the best
performance of an examinee during standardized testing (Anastasi, 1982; Anastasi & Urbina,
1997; Cronbach, 1990; Sattler, 2008). Anastasi and Urbina (1997) assert that there is a “growing
consensus that aptitudes can no longer be investigated independently of affective variables” (p.
301) and, thus, school psychologists must consider motivation and effort as important
contributors to performance across assessments. The authors additionally describe that
predictions of a student’s potential for intellectual development can be enhanced by including
information about their motivation during testing experiences (Anastasi & Urbina, 1997).
Although various testing procedures have been used to facilitate the performance of
young children during the administration of standardized tests (Bradley-Johnson et al., 1984;
Galbraith et al., 1986; Johnson et al., 1984; Moran, 1979; Pollock, 1989; Saigh & Payne, 1976,
1978, 1979; Saigh, 1981), information involving examiner delivered verbal praise or token
reinforcement on the nonverbal intelligence test performance of early elementary children has
not been reported. Within this context it is of interest to observe that the Comprehensive Test of
Nonverbal Intelligence, Second Edition (CTONI-2; Hammill et al., 2009) manual is vague with
respect to rapport building, maintaining motivation and providing encouragement. Specifically,

68
examiners are instructed to “keep the examinee at ease and ‘on task’” (p. 14). The CTONI-2 is
appropriate for use with individuals beginning at age 6:0, which corresponds to an age at which
many Kindergarten and first grade students begin to be referred for assessments of readiness and
progress in early elementary school (Brassard & Boehm, 2007).
Additionally, due to the growing population of culturally and linguistically diverse (CLD)
students in US schools (Jones, 2009) and the increased emphasis on multicultural sensitivity in
assessment procedures (National Association of School Psychologists [NASP], 2010), nonverbal
tests of intelligence are being increasingly utilized (Sue & Sue, 2013). According to Jones
(2009), nonverbal cognitive measures have the ability to “yield less discriminatory results for
CLD students” (p.157) because they have less cultural bias. Therefore, investigation into the
motivational factors that contribute to children’s performance on nonverbal measures of
cognitive ability was indicated.
Purpose
This investigation sought to examine the effects of verbal praise and token reinforcement
on the CTONI-2 scores of school children aged 6-7 using a pretest posttest experimental design.
Hypotheses
As research investigations have reported that examiner verbal praise for examinee effort
has been associated with significantly higher intelligence test scores relative to the scores of
controls (Bornstein, 1968; Witmer et al., 1971; Saigh & Payne, 1976), it was expected that
participants who receive examiner verbal praise for effort during the administration of the
CTONI-2 would have significantly higher scores than the control group. As such, the following
research hypothesis were made:

69
HO1: The mean scaled scores of subjects in the Verbal Praise condition will significantly exceed
the mean scaled scores of the Control group on the CTONI-2 Pictorial Scale.
HO2: The mean scaled scores of subjects in the Verbal Praise condition will significantly exceed
the mean scaled scores of the Control group on the CTONI-2 Geometric Scale.
HO3: The mean scaled scores of subjects in the Verbal Praise condition will significantly exceed
the mean scaled scores of the Control group on the CTONI-2 Full Scale.
In a similar vein, as the use of token reinforcement to reward test taking effort has been
associated with improved test scores among a number of populations (Bradley-Johnson et al.,
1986; Breuning & Davis, 1981; Devers et al., 1994; Edlund, 1972), it was expected that the
participants in the token reinforcement condition would obtain significantly higher scores than
the control group. As such, the following research hypothesis were made:
HO4: The mean scaled scores of subjects in the Token Reinforcement condition will significantly
exceed the mean scaled scores of the Control group on the CTONI-2 Pictorial Scale.
HO5: The mean scaled scores of subjects in the Token Reinforcement condition will significantly
exceed the mean scaled scores of the Control group on the CTONI-2 Geometric Scale.
HO6: The mean scaled scores of subjects in the Token Reinforcement condition will significantly
exceed the mean scaled scores of the Control group on the CTONI-2 Full Scale.

70
Lastly, while evidence suggests that token reinforcement and verbal praise positively
influenced performance on standardized tests (Kohls et al., 2009; Miller & Ehler, 1985; Saigh &
Antoun, 1983; Saigh & Payne, 1978; Terrell et al., 1980; 1981), there is a paucity of comparative
efficacy information involving the effects of these procedures on the standardized test
achievement of children aged 6-7 years. Given the lack of comparative information, the
following research hypothesis were made:
HO7: The mean scaled scores of subjects in the Verbal Praise condition will not significantly
differ from subjects in the Token Reinforcement condition on the CTONI-2 Pictorial Scale.
HO8: The mean scaled scores of subjects in the Verbal Praise condition will not significantly
differ from subjects in the Token Reinforcement condition on the CTONI-2 Geometric Scale.
HO9: The mean scaled scores of subjects in the Verbal Praise condition will not significantly
differ from subjects in the Token Reinforcement condition on the CTONI-2 Full Scale.
Method
Examiners
One Ph.D. and two Ed.M. level school psychology students who were trained to
administer and score the Primary Test of Nonverbal Intelligence (PTONI; Ehrler & McGhee,
2008) and the Comprehensive Test of Nonverbal Intelligence – Second Edition (CTONI-2;
Hammill et al., 2009) administered the measures. All examiners were White female graduate
students between the ages of 23 and 31. The examiners were required to follow a standardized
protocol of regular administration procedures plus experimental procedures in both experimental

71
conditions. The researcher provided the examiners with a Procedure Manual (See Appendix D)
for the study that included specific procedures for each of the three testing conditions. Examiners
were also required to carry out a pilot administration of the experimental protocol under careful
supervision by the researcher (or, in the case of the researcher, under the supervision of a trained
neutral observer) before the formal experiment was conducted (Barber, 1973). Examiners were
further required to audio record both pre-test and post-test administrations. All protocols were
also validated for compliance (double scored) by a trained neutral observer who was blind to
condition.
Because of the distance to the sites, the researcher tested all participants at two of the
(suburban) sites, while all three examiners tested approximately equal numbers of participants at
the parochial school site. Participants at the parochial school site were assigned to examiners for
testing based on examiner availability at the time when a participant became eligible and
available for the study. If more than one examiner was available to work with a participant, the
participant was randomly assigned to an examiner. Both Masters level examiners administered
an approximately equal number of tests in the study.
Informed Consent and Confidentiality. Parents of school children were advised about
the study through a Parent/Guardian Letter (See Appendix A) and asked to enroll their children
in the investigation. Parents/guardians completed the Parent/Guardian Informed Consent form
(Appendix A) with written details of the purpose and procedure of the study.
Students whose parents/guardians signed and returned the consent forms were picked up
from their classroom by the researcher or other examiners. Students were tested at the schools
during activities and class periods that teachers and school administration deemed appropriate
(typically, non-academic subjects were preferred). Before beginning the testing procedure, the

72
examiner read the Child Assent Script (Appendix B) to each student and the students were given
the opportunity to ask questions. They were then asked if they wanted to participate or if they do
not want to participate. The researcher or examiner subsequently completed the Investigator’s
Verification of Explanation form attached as Appendix B. All data was confidential and stored in
a locked file by the researcher. Furthermore, after each test administration, the researcher
transformed scores to a research spreadsheet that did not include the participants’ names.
Measures
Pretest. The Primary Test of Nonverbal Intelligence (PTONI; Ehrler & McGhee, 2008)
served as the pretest. This test reflects a research-based method of assessing intellectual abilities
in young children (ages 3:0 through 9:11) (Ehrler & McGhee, 2008). The PTONI measures a
“variety of reasoning abilities” (Ehrler & McGhee, 2008, p. 2) by asking examines to point to a
plate from of a set of pictures or geometric designs, which does not belong with the other plates.
The PTONI contains 32 items, increasing in complexity from visualization ability and perception
of spatial relations to “analogical thinking, sequential reasoning, and categorical formulation”
(Ehrler &McGhee, 2008, p.1). The PTONI provides one standard Nonverbal Index score.
The PTONI was standardized with a sample of 1,010 children, including over 100
children from each of seven age groups ranging from three to nine years (Ehrler & McGhee,
2008). The sample included at least 50 males and 50 females for each age group, and was
proportionate for factors such as race, ethnicity, educational attainment of parents, and
exceptionality status according to The Statistical Abstract of the United States (U.S. Bureau of
the Census, 2007, as cited in Ehrler & McGhee, 2008). The PTONI has internal consistency
reliability coefficients of .90 or above across age groups. Test-retest reliability was assessed
using 94 children from six age groups, with an interval between testing of two weeks (Ehrler &

73
McGhee, 2008). Stability coefficients for the PTONI ranged from .96 to .97. Inter-scorer
agreement on the PTONI ranged from .99 to 1.0.
Construct validity, as determined by a factor analysis, determined that the PTONI score
represents three broad factors from the Cattell-Horn-Carroll (CHC) theory of cognitive abilities,
including fluid reasoning (Gf), Comprehension-Knowledge (Gc), and Visual Processing (Gv).
Criterion- predictive validity studies reported in Ehrler & McGhee (2008) report the PTONI to
be highly correlated with other measures of intellectual functioning, including the
Comprehensive Test of Nonverbal Intelligence – Second Edition (CTONI-2; Hammill et al.,
2009), the Universal Nonverbal Intelligence Test-Abbreviated (UNIT; Bracken & McCallum,
1998), the Detroit Tests of Learning Aptitude-Primary: Third Edition (DTLA-P:3; Hammill &
Bryant, 2005), and the Bracken Basic Concept Scale-Revised (BBCS-R; Bracken, 1998).
Correlation coefficients between measures ranged from .81 (DTLA-P:3) to .92 (UNIT).
Dependent Variable. The Comprehensive Test of Nonverbal Intelligence, Second
Edition (CTONI-2; Hammill et al., 2009), is a norm-referenced test that uses nonverbal formats
to measure general intelligence of children and adults (ages 6:0 through 89:11), particularly those
whose performance on traditional tests might be adversely affected by subtle or overt
impairments involving language or motor abilities. The CTONI-2 measures analogical reasoning,
categorical classification, and sequential reasoning, using six subtests in two different contexts:
Pictures of familiar objects (e.g., people, toys, animals) and geometric designs (unfamiliar
sketches and drawings). The six subtest scores provided are: (1) Pictorial Analogies, (2)
Geometric Analogies, (3) Pictorial Categories, (4) Geometric Categories, (5) Pictorial
Sequences, and (6) Geometric Sequences. Scaled scores for each subtest as well as the (Full
Scale/ Pictorial Scale/ Geometric Scale) composite scores will be used as dependent variables.

74
According to the authors, the Full Scale is the best measure of intelligence and “reflects status on
a wide array of cognitive abilities” (Hammill, et al., 2009, p. 5).
The CTONI-2 was standardized on a sample of 2,827 persons aged 6:0 – 89:11 years in
ten American states. A comparison done by the authors of the CTONI-2 of the normative sample
and the characteristics of the current population reported by the U.S. Census Bureau reveal that
the normative sample was representative with regard to gender, geographic region, race,
Hispanic status, exceptionality status, family income, and educational level of parents (Hammill
et al., 2009).
The individual subtests have internal consistency reliability coefficients of .75 to .90 for
6-7 year olds and .71 to .92 overall. The composite scales have coefficients that range from .87
to .92 for 6-7 year olds and .84 to .95 overall. The average coefficient for the Full Scale
Composite was .95 and ranged from .92 to .97 overall (Hammill et al., 2009). The Standard Error
of Measurement (SEM) equals one for all subtests, three for the Full Scale index and five for the
other two composites (Hammill et al., 2009). Test-retest reliability of the CTONI was assessed
with 63 students enrolled in third or eleventh grade with a time interval between testing of one
month. The test publishers subsequently administered the CTONI-2 to 38 individuals (26 adults,
9 were either 8 or 9 years old, and 3 were between the ages of 10 and 16 years), with an interval
of two weeks. Stability coefficients for all age groups ranged from .79 to .92 (Hammill et. al,
2009). The publisher reported that the “corrected reliability coefficients” for all six subtests
exceed .80, the coefficients for the composites exceed .80 and the coefficient for the Full Scale
composite is .90 (Hammill et al., 2009, p.43). Inter-scorer agreement on all subtests exceeded .90
in magnitude on average and ranged from .95 to .99.

75
The publishers demonstrated that the abilities measured by the CTONI-2 are qualitatively
consistent with current knowledge about nonverbal intelligence in the type of test (language
reduced or nonlanguage), abilities measured (i.e., analogies, categories and/or sequences) and
context (pictured objects and/or geometric designs) (Hammill et al., 2009).
Content-description validity was investigated in terms of test item’s discriminating
power, difficulty and potential bias. CTONI-2 item discrimination was held to a minimum level
of acceptability of .30 and ranged from .27 to .58 for all age groups and subtests. Differential
item functioning analyses demonstrated an absence of bias in test items as there was no evidence
to suggest that examinees from different racial or gender groups with the same ability perform
differently on same item (evidence that one group has advantage over another) (Hammill et al.,
2009).
Criterion-predictive validity was investigated to determine the extent to which the
CTONI-2 correlates with other measures of general intelligence, especially those with nonverbal
formats (Hammill et al., 2009). Table 4 lists the correlation coefficients of selected criterion
measures of general intelligence with the CTONI-2 Full Scale Index. Overall, the test authors
reported the range of correlations between the Full Scale composite score from the CTONI-2 and
criterion tests that use both verbal and nonverbal formats that ranged from.76 and .81 (Hammill
et al., 2009). With reference to the samples that were investigated, it is relevant to note that the
CTONI-2 and the Primary Test of Nonverbal Intelligence (PTONI, Ehrler & McGhee, 2008)
were administered to 82 children aged 6 to 9 years and a correlation of .86 was observed
(Hammill et al., 2009). In a review of the CTONI-2, Delen, Kaya, and Ritter (2009) concluded
that “the results from the construct validity studies also provide evidence for criterion prediction
validity. The CTONI-2’s positive relationships with other intelligence and achievement tests

76
support that the CTONI-2 can predict scores on both other intelligence tests and achievement
tests” (p.212).

77

78
Table 5
Standard Score Means, Standard Deviations and Statistical Results of t-tests for Differences Between
the CTONI-2 and Selected Criterion Tests
CTONI-2 & Criterion Test
Sample n Mean (SD)
Descriptive Term
t Effect size
Effect size correlation
CTONI-2 & TONI-4 Nonverbal
1 72 100 (15) 101 (15)
Average Average
-0.40 .03 Trivial
CTONI-2 Full Scale & RIAS Composite Intelligence
2 197 117(09)
113 (07)
Above Average
Above
Average
4.92** .24 Small
CTONI-2 Full Scale & PTONI Nonverbal
3 82 91(18) 98 (17)
Average Average
-3.62** .29 Small
*Significant at the p>.05; **significant at the p>.001 level.
Note: TONI-4 = Test of Nonverbal Intelligence – Fourth Edition (Brown, Sherbenou & Johnson, 2009); RIAS = Reynolds
Intellectual Assessment Scale (Reynolds & Kamphaus, 2003); PTONI = Primary Test of Nonverbal Intelligence (Ehrler & McGhee, 2008). Table 5 was reprinted given the permission of PRO-ED
The data listed in Table 5 above, particularly the effect size correlations considered to be small
and/or trivial, suggests that, regardless of sample characteristics, results from the CTONI-2 will be
comparable to those obtained from the criterion tests included in the table (Hammill et al., 2009).
A description of each CTONI-2 subtest is provided below:
Pictorial Analogies. The Pictorial Analogies subtest contains 25 items for which examinees are
asked to point to one, of a set of pictures (familiar objects), that completes the lower two boxes of a
2X2 matrix with pictures that represent the same relationship as the stimulus pictures in the upper two
boxes of the matrix.
Geometric Analogies. The Geometric Analogies subtest contains 25 items for which examinees
are asked to point to one, of a set of geometric designs (unfamiliar sketches and drawings), that
completes the lower two boxes of a 2X2 matrix with designs that represent the same relationship as the
stimulus designs in the upper two boxes of the matrix.

79
Pictorial Categories. The Pictorial Categories subtest contains 25 items for which examinees
are asked to deduce the relationship between two stimulus pictures and select one, from a choice of
items, the one that shares the same relationship with the stimulus pictures
Geometric Categories. The Geometric Categories subtest contains 25 items for which
examinees are asked to deduce the relationship between two stimulus designs and select one, from a
choice of items, the one that shares the same relationship with the stimulus designs.
Pictorial Sequences. The Pictorial Sequences subtest contains 25 items for which examinees
are asked to point to one, of a set of pictures, that completes the progression in the previously
displayed set of pictures.
Geometric Sequences. The Geometric Sequences subtest contains 25 items for which
examinees are asked to point to one, of a set of pictures, that completes the progression in the
previously displayed set of designs.
Experimental Procedure
Pretest. The PTONI was administered according to standardized procedure. Nonverbal Index
scores were calculated by the researcher and double-scored by a trained neutral observer using the
PTONI Examiner’s Manual (Ehrler & McGhee, 2008).
Assignment to Experimental Groups. Cases were randomly assigned using a random number
generator to distribute participants into one of three testing groups. The testing groups are described
below.
Verbal Praise. Subjects were introduced to the experimental condition by the examiner in the
following manner: “I’m going to give you some tests to see what you’re good at and what you may
need more help with.” Examiners administered the CTONI-2 according to a standardized format with
one exception. The students in the verbal praise experimental group were verbally praised for effort by
80
their examiners. More specifically, examiners stated: “very good effort,” “keep it up,” and “that’s the
way to try,” after the first, second and third items in each subtest without regard to the correctness of
response. For every other response after the completion of the first three items, the examiner verbally
praised the student with any of the following statements: “I like the way you’re trying,” “keep it up, “
and “very good effort.” Between subtests, examiners stated: “Remember, you have to work hard and
keep on trying hard.” These procedures were consistently applied throughout the administration of the
entire test. It is important to note that examinee effort was praised and that correctness of answers did
not influence the examiner feedback.
Token Reinforcement. Prior to administration, the examiners asked the participants to indicate
which item on a Child Reward Menu (presented in Appendix C) they would like to receive as a reward
for their effort. The Child Reward Menu presents a list of rewards that cost less than $2.00 were used
as reinforcers with the participants in their school. The menu was developed by observing the material
preferences of early elementary school children and by consulting previous literature on reinforcement
procedures (Bradley-Johnson et al., 1984; 1986; Fallon, 2002; Moran, 1979). After the pretest,
participants in the token reinforcement condition were instructed to indicate the two rewards that they
preferred the most as described in the Child Reward Menu. Rewards include stickers, Squinkies (small
figurines), pencils, sports bracelets, zoo animal rings, and wristbands.
Subjects were introduced to the experimental condition by the examiner in the following
manner: “I’m going to give you some tests to see what you’re good at and what you may need more
help with. Please try your best on all the items. When you receive one of these tokens it will mean I
can tell you are working hard. You said that you are interested in receiving a [reward choice] at the end
of today. If you try hard, you should earn enough tokens to receive the reward you want. You can trade
your tokens in for your reward after the testing is completed. You have to answer all of the questions to
81
the best of your ability. Is it a deal? (5 second pause) Good, let’s begin.” (Fallon, 2002; Kieffer & Goh,
1981). Examiners then administered the CTONI-2 according to a standardized format with one
exception. Participants in the token reinforcement experimental group were given a token (similar to a
poker chip) for each of the initial three responses of each subtest without regard to correctness, a token
for every other response after completion of the first three items, and a token between subtests, and the
examiner stated, “here is a token” or “here you go” to ensure that the examinee attended to the
reinforcer. If a participant made an effort to manipulate or count his or her tokens, the participant was
reminded that the tokens would be tallied and exchanged for the reward after the testing was
completed.
Control. Subjects were introduced to the standard administration condition by the examiner in
the following manner: “I’m going to give you some tests to see what you’re good at and what you may
need more help with.” Examiners administered the CTONI-2 according to a standardized format,
including neutral nonevaluative procedural comments (e.g., “let’s try this,” “how about this,” and “here
is the next one”) after each of the first three responses in a subtest and for every other response after
completion of the first three items. Between subtests, the examiner remarked, “let’s try something
different.” These comments were in keeping with guidelines to “keep the examinee at least and ‘on
task’” in the CTONI-2 Examiner’s Manual (Hammill et al., 2009, p.14).
It is important to note that subtest instructions indicate that, after each example at the beginning
of subtests, examiners are to provide a “yes” and a smile in response to correct answers (to examples)
(Hammill et al., 2009). Therefore, an equal number of these statements (“yes” and a smile) were
presented to the participants in all three conditions to approximate the amount of verbal reinforcement
generally given by examiners (Bradley-Johnson et al., 1984; 1986; Johnson et al., 1984; Yeager, 1983).

82
Reward Presentation. After completion of administrations, the participants in all the groups
received small prizes for their effort, the value of which were all less than $2.00. Subjects who were
randomly assigned to the Token Reinforcement group were told before administration of the CTONI-2
that they could earn prizes for their effort. To avoid the distress caused by not receiving rewards during
testing, the participants in the Standard Administration and Verbal Praise groups also received small
prizes at the conclusion of testing.
Participants
All participants (n = 72) were selected from elementary schools in New York. A parochial
school (“School A”) in the Bronx, New York, serving students in grades pre-K through eighth grade,
served as one study site. According to school records, approximately 500 students are enrolled at the
school. As of the 2013-2014 academic year, the racial/ethnic composition of the school is
predominantly Hispanic of any race (68.7%), Black/African American (26.6%), two or more races
(2.6%), and Asian (1.3%). The remaining 0.74% includes students identifying as Native American or
Other Pacific Islander or White. Another study site (“School B”) was located in a suburban school
district in Nassau County, New York. According to the school district’s website, the elementary school
enrolls approximately 250 – 300 students. The demographic composition of the village is 88.7%
White, 4.6% Black, 9.0% Hispanic or Latino of any race, 0.1% American Indian and Alaska Native,
2.1% Asian, 0.0% Native Hawaiian or Pacific Islander, and 1.7% reporting two or more races (U.S.
Census Bureau, 2010). A third study site (“School C”) was located in a suburban school district in
Suffolk County, New York. The demographic composition of the hamlet (the census-designated place)
is 85.4% White, 3.1% Black, 11.3% Hispanic or Latino of any race, 0.1% American Indian and Alaska
Native, 6.2% Asian, 0.0% Native Hawaiian or Pacific Islander, and 2.0% reporting two or more races
(U.S. Census Bureau, 2010).

83
All participants (ages 6-7) were drawn from the Kindergarten, first and/or second grades of
participating schools. The investigator determined the participant’s gender, grade, special education
status, and race/ethnicity through either a chart review or by parent report on the Informed Consent
form. Information regarding the number of cases from each site that were identified, and their
demographic characteristics are reported later in the Results chapter in Tables 6, 7, 8, and 9.
The Principal of School A, and the Superintendents (via the Assistant Superintendent or the
Principal) of Schools B and C were contacted by the researcher and they agreed to allow their schools
to participate. Parents of school children were advised about the study via a letter and asked to enroll
their child in the study. Parent/Guardian Informed Consent papers were also sent to parents who agreed
to participate. Parent consent and child (verbal) assent were secured in all cases before test
administration. Appendices B and C present the Teachers College IRB approved letter to the parents,
Informed Consent for the parents, Participant’s Rights, Child Assent Script, and the Investigator’s
Verification of Explanation.
Exclusionary Conditions. Subjects were not excluded based on gender, class, or race. To
ensure similar cognitive and academic abilities among subjects, children with reported Autism
Spectrum Disorder and/or Intellectual Disability were excluded. Also, children who did not speak
English were excluded. Chart reviews were used to access this information. In addition, participants
with a standard score of less than 70 on the initial administration of the PTONI were excluded from the
study. No subjects were excluded for not meeting these criteria. However, several participants whose
parents signed consent forms were excluded from the study because they were outside of the age range
(6-7), and two students whose parents consented to the study left the school district before testing
could occur.

84
Treatment Integrity. A neutral observer independently rated the audio-recorded
administration of the CTONI-2 of 15 randomly selected participants (five from each condition) for
compliance with the experimental and control protocols, as described in the Procedure Manual
(Appendix D). The rater was provided with the Procedure Manual, Treatment Integrity Rating
Instructions (Appendix E), and Treatment Integrity Worksheets (Appendix F), which are all adapted
versions of texts created by Fallon (2002) for use in his research on the effects of incentive conditions
on clinical populations. The investigator calculated a kappa statistic to determine interrater agreement
as a measure of treatment integrity based on the raters’ responses. High agreement between the raters
was indicated by a kappa value of 1.00 (p < 001).
Research Design
A randomized pre-test post-test control group design was used (Armenian, 2009). This design
controlled for threats against internal validity (history, maturation, testing, selection, instrumentation,
statistical regression, experimental mortality, and selection by maturation interaction) (Hoyle et al.,
2002). Figure 1 presents a schematic representation of the data collection design.

85

82
Chapter 5
Results
This chapter presents the demographic characteristics of the sample, pretest results on the
PTONI as well as all of the posttest results from the CTONI-2. The chapter also tests the hypotheses
for this study. Results are presented in tables throughout the chapter.
Sample Characteristics
Three groups of 24 subjects were obtained from the sample of 72 eligible participants who
were randomly assigned to the standard administration, verbal praise, and token reinforcement
conditions. The sample was racially and ethnically diverse. Table 6 presents the distribution of the
sample by race/ethnicity.
Table 6 Distribution of Sample by Race/Ethnicity
Race/Ethnicity Condition
Overall (n=72)
Standard Administration
(n=24)
Verbal Praise
(n=24)
Token Reinforcement
(n=24) White 38 (52.8%) 13 (54.2%) 11 (45.8%) 14 (58.3%) Black or African American 6 (8.3%) 2 (8.3%) 3 (12.5%) 1 (4.2%) Hispanic or Latino 21 (29.2%) 7 (29.2%) 8 (33.3%) 6 (25%) Two or more races 7 (9.7%) 2 (8.3%) 2 (8.3%) 3 (12.5%)
A Chi-square test performed on the race/ethnicity of participants assigned to each group
showed that the race/ethnicity of participants was equally distributed across groups (χ2(6, N=72) =
1.94, p = .925). The mean CTONI-2 Full Scale Composite Scale scores of racial/ethnic groups (White,
M = 98.74 (SD = 9.51); Black or African American, M = 98.33 (SD = 12.49); Hispanic or Latino, M =
98.90 (SD = 12.60); Two or more races, M = 103.86 (SD = 13.26)) were comparable based on a one-
way ANOVA (F(3,68) = 1.657, p =.184).

83
The overall number of males in the sample (n = 29) did not differ significantly from the overall
number of females (n = 43) based on a Binomial test for equal distribution (p = .13). A Chi-square test
performed on the gender of the participants in each group revealed that gender was equally distributed
across groups (χ2(2, N=72) = .462, p = .794). Table 7 presents the distribution of the sample by gender.
Table 7
Distribution of the Sample by Gender
Condition Overall
(n=72) Standard
Administration (n=24) Verbal Praise
(n=24) Token Reinforcement
(n=24) Male 29 (40.3%) 9 (37.5%) 9 (37.5%) 11 (45.8%) Female 43 (59.7%) 15 (62.5%) 15 (62.5%) 13 (54.2%)
The mean CTONI-2 Full Scale Composite Scale scores of males (M = 97.31, SD = 12.95) did
not significantly differ from the Full Scale Composite Scale scores of females (M = 98.12, SD =
10.07), (t(49.93) = -.282, p = .78).
Differences based on assignment to examiner were also analyzed. A Chi-square test performed
on the number of participants assigned to each examiner showed that the number of participants
assigned to each examiner overall was not equally distributed (χ2(2, N=72) = 49.00, p < .001).
However, a Chi-square test performed on the gender of the participants assigned to each examiner
showed that the number of males and females assigned to each examiner was equally distributed (χ2(2,
N=72) = 2.127, p = .345).
Table 8 presents the means and standard deviations of the CTONI-2 Full Scale Composite
scores from all three conditions of the male and female participants tested by each examiner.
Table 8

84
Means and Standard Deviations of the overall CTONI-2 Full Scale Composite Scores of the Male and
Female Participants Tested by Each Examiner
Examiner Male Female Total n M SD n M SD n M SD
1 20 98.25 12.95 32 97.44 8.90 52 97.75 10.52 2 3 86.67 9.61 7 100.00 14.88 10 96.00 14.48 3 6 99.50 13.71 4 100.25 11.76 10 99.80 12.27
A one-way ANOVA revealed no significant differences between the examiners by Full Scale
Composite scores (F(5,67) = .721, p = .61). Given that this analysis was limited by significantly
different sample sizes between examiners, a Kurskal-Wallis (non-parametric) H Test was also run on
the Full Scale Composite scores between examiners and results were nonsignificant (χ2(2)= .705, p =
.703)
A Chi-square test performed on the number of participants from each study site showed that the
overall number of participants from each site were significantly different (χ2(2, N=72) = 6.083, p =
.048). Table 9 presents the distribution of the sample by study site.
Table 9
Distribution of the Sample by Study Site
Condition Overall (n=72) Standard
Administration (n=24) Verbal Praise
(n=24) Token Reinforcement
(n=24) School A 32 (44.4%) 11 (45.8%) 12 (50%) 9 (37.5%) School B 25 (34.7%) 8 (33.3%) 7 (29.2%) 10 (41.7%) School C 15 (20.8%) 5 (20.8%) 5 (20.8%) 5 (20.8%)
A Univariate ANOVA revealed no significant differences between the mean CTONI-2 Full
Scale Composite Scale scores of participants from all three sites (School A, M = 96.88 (SD = 11.74);
School B, M = 99.32 (SD = 10.30); School C, M = 97.20 (SD = 12.10)), (F(2,69) = .352, p = .70).
Pretest and Posttest Results

85
Group means, standard deviations, and the range of scores for the PTONI Nonverbal Index,
CTONI-2 Pictorial Scale, Geometric Scale, and Full Scale Composite scores as well as the six CTONI-
2 subtest scaled scores are presented in Table 10.
Table 10
Group Means, Standard Deviations, and Ranges for the PTONI Nonverbal Index, and the CTONI-2
Pictorial Scale, Geometric Scale, and Full Scale Composite Scores and the six CTONI-2 Subtest
Scaled Scores.
Variable
Standard Administration Verbal Praise Token Reinforcement
Composite Scores Mean SD Range Mean SD Range Mean SD Range
PTONI Nonverbal Index
92.62 15.78 73-134 95.13 17.99 70-134 102.17 21.39 74-139
CTONI-2 Pictorial Scale
98.67 8.76 82-115 97.96 9.22 82-113 100.75 9.66 73-120
CTONI-2 Geometric Scale
98.08 13.69 78-127 94.37 11.81 70-120 100.25 12.53 72-122
CTONI-2 Full Scale 97.79 11.72 78-118 95.25 10.96 79-117 100.33 10.89 70-120
CTONI-2 Subtest
Scores
Pictorial Analogies 9.38 1.77 4-13 9.12 1.87 6-13 9.54 1.82 5-13 Geometric Analogies 7.46 3.19 4-14 6.92 2.98 4-13 7.58 2.50 4-13 Pictorial Categories 10.42 1.69 7-14 10.29 2.31 6-15 11.00 1.72 7-14 Geometric Categories 11.38 2.58 6-15 10.96 2.46 8-16 12.54 2.96 5-18 Pictorial Sequences 9.46 2.28 5-15 9.54 1.77 6-15 9.67 2.04 6-14 Geometric Sequences 10.29 2.10 7-15 9.58 2.24 4-14 10.08 2.21 5-14
Initially the PTONI Nonverbal Index scores were analyzed using a one-way ANOVA. No
significant differences were observed between groups on the PTONI (F(2,69) = 1.71, p = .188),
indicating randomization procedures successfully obtained equivalence between groups. However,
Shapiro-Wilk Tests of Normality on the PTONI scores overall and within groups were significant,
lending evidence to suggest the assumption of normality may have been violated (Overall Shapiro-
Wilk (72) = .917, p < .001; Standard Administration Shapiro-Wilk (24) = .901, p < .05; Verbal Praise
Shapiro-Wilk (24) = .907, p < .05; Token Reinforcement Shapiro-Wilk (24) = .904, p < .05).

86
Additionally, Levene’s Test of Equality of Error Variances was conducted on the pretest scores and
was significant (F(2,69) = 3.510, p < .05), indicating a violation of the assumption of homogeneity of
variances. Given that this analysis was limited by unequal variances between groups and as the PTONI
scores were not normally distributed, a Kurskal-Wallis (non-parametric) H Test was also run on the
PTONI Index scores between groups, and results were similarly nonsignificant (χ2(2) = 2.120, p =
.347). Given the nonsignificance of pretest results between groups, and the possible limitations in the
distribution of the data, it was concluded that the PTONI scores should not be used as a covariate in
subsequent analyses.
To test the hypotheses, the CTONI-2 Pictorial Scale scores and Geometric Scale scores were
analyzed using a MANOVA procedure. The Full Scale composite was analyzed in a univariate
ANOVA procedure because of its very high correlation with the other composites, particularly the
Geometric Scale (r = .947). It is important that the dependent variables in a MANOVA are not too
highly correlated because it violates homoscedasticity (Field, 2009). The Pictorial and Geometric
Composites have a correlation of .672, which Field (2009) describes as an acceptable level to be
included in the same multivariate analysis, and were therefore used as dependent variables in the
MANOVA procedure.
In the final ANOVA (Full Scale Composite) and MANOVA (Pictorial and Geometric Scales)
procedures, differences across groups were compared, and different variables were included in the
models to investigate the importance of demographic variables on the results (e.g., race, study site, and
gender). Of note, Hispanic or Latino, Black or African American, and Two or More Races were
combined into the composite ‘Non-White’ (n = 34) in order to be comparable in number to the amount
of White participants (n = 38).

87
To investigate effects of treatment on the dependent variable, initially a univariate ANOVA
was conducted on the CTONI-2 Full Scale composite score. Overall, there were no significant
differences between any of the three groups (F(2,69) = 1.236, p = .297). Therefore, hypotheses Ho3
and Ho6 were not supported. However, Ho9 was supported in that the group means for the Verbal
Praise and Token Reinforcement groups do not significantly differ on the Full Scale Composite score
for this age group, as predicted.
In the next portion of the analyses, a MANOVA was conducted on the CTONI-2 Pictorial and
Geometric Scale composite scores. Overall, there were no significant differences observed between
any of the three group means (Wilks’ Lambda (4,136) = .737, p = .568). As such, Hypotheses Ho1,
Ho2, Ho4, and Ho5 were not supported. However, Hypotheses Ho7 and Ho8 were also supported in
that the group means for the Verbal Praise and Token Reinforcement groups did not significantly differ
on the Pictorial Scale composite (Ho7) and the Geometric Scale Composite (Ho8) scores for this age
group, as predicted. Results from the MANOVA on the six individual subtest scores were similarly not
significant (Wilks’ Lambda (12,128) = .896, p = .838). Accordingly, further tests were not conducted.
To investigate the effects of the demographic variables of the sample that were measured,
several demographic variables were entered into both the ANOVA and MANOVA models in isolation
and in combination. For example, gender, study site and race were added into the model; however,
results were similarly nonsignificant from this perspective. Given these nonsignificant outcomes, post-
hoc comparisons were not reported on any of the CTONI-2 Composite scores.

88
Chapter 6
Summary and Conclusions
Summary
This study compared the CTONI-2 performance of three groups of early elementary school
children under different incentive conditions (Standard Administration, Verbal Praise, and Token
Reinforcement). Students with Autism Spectrum Disorders and/or Intellectual Disabilities, as well as
students who did not speak English, were excluded from the study. A total of 72 students, age range 6-
7 years old, from three different elementary schools, were eligible and participated in the study.
Participants were randomly assigned to treatment conditions, which were comparable in terms of
gender and race/ethnicity.
Analysis of differences between the PTONI group means was not significant, indicating
randomization procedures successfully obtained equivalence between groups. Univariate analyses were
subsequently conducted on the mean CTONI-2 Full Scale Composite scores comparing the Verbal
Praise, Token Reinforcement, and Standard Administration group means. No significant differences
were observed, indicating the groups obtained comparable Full Scale Composite scores regardless of
the type of administration they received.
Similar analyses were performed on the Pictorial and Geometric Scale composite scores using a
multivariate analysis procedure, and there were no significant differences found between groups. It
was originally hypothesized that mean scores of the two treatment groups (Verbal Praise and Token
Reinforcement) would both exceed the mean scores of the Standard Administration group on all three
composite scores, but these differences were not observed. It was hypothesized that mean scores of the
two treatment groups would be equivalent, which was supported by the analysis, though these means
did not differ from the control group.

89
Significant examiner or examiner by gender effects were not observed. Nonsignificant
differences were observed for race/ethnicity, gender, and study site. Moreover, nonsignificant
differences were observed for the full models when these demographic variables were included in the
univariate and multivariate analyses. Because of nonsignificant results overall, posthoc tests were not
reported. A general discussion regarding the results, limitations of the study, and directions for future
research will be presented in this chapter.
Discussion
The nonsignificant differences observed in this study between the Verbal Praise, Token
Reinforcement, and Standard Administration groups on the CTONI-2 do not support the general
hypothesis that 6 to 7 year old elementary school students would have higher scores on nonverbal IQ
tests when administered under incentive conditions when compared to students who receive neutral
comments consistent with a standard administration.
Verbal praise. The nonsignificant results are not consistent with the literature on the effects of
verbal praise on test performance that observed that praise generally facilitated performance, though
samples, measures, and methods were varied, and methodological pitfalls limited generalizability
between studies (Bornstein, 1968; Butler, 1987; Feldman & Sullivan, 1971 Hurlock, 1924, 1925;
Piersel et al., 1977; Saigh, 1976; Saigh & Payne, 1976; Witmer et al., 1971). This result is also
inconsistent with a review of 33 experimental studies done prior to 1964 that found that verbal praise
had a “facilitating effect on the performance of school children” (Kennedy & Wilcutt, 1964, p.331).
Authors of similar studies reported differential responses to different praise conditions based on
racial/ethnic differences. For example, Terrell et al. (1978, 1980, 1981) observed nonsignificant
differences between groups of Black second grade students who received traditional verbal praise and
standard administrations on the WISC-R. However, when the examiners provided more culturally

90
relevant verbal praise (CRVP), the CRVP groups outperformed both the traditional verbal praise and
standard administration groups. Given the outcomes that were reported by Terrell and his coauthors, it
may be reasonable to ask if the nature of the verbal praise that was provided to participants, and in
particular participants from the more racially diverse study site, may have been especially ineffective
within the cultural context.
It is important to note once again that some authors suggested that praise has the potential to be
detrimental, as it may have been in the present study. The authors of one study suggested excessive
feedback may negatively impact examinee’s concentration (Goh & Lund, 1977). Moreover, Piersel et
al. (1977) proposed that emphasizing the evaluative aspects in a testing situation may increase test
anxiety and apprehension, which may have occurred in the present study and contributed to diminished
examinee concentration. In addition, Henderlong and Lepper (2002) suggested that praise may convey
“a message of low ability” (p.780). Particularly because the participants were being praised for “very
good effort” rather than correctness in this study, it is possible that the examinees perceived the praise
of their effort as a form of negative feedback on their performance (Pollock, 1989). These observations
may be particularly relevant to the present study as graphical trends indicated that group means were
higher under both Standard Administration and Token Reinforcement conditions compared to Verbal
Praise conditions on the CTONI-2 Full Scale, Pictorial Scale, and Geometric Scales, though these
differences were not significant. The Verbal Praise group means were also lower than both the
Standard Administration and Token Reinforcement group means on all but one of the CTONI-2
subtests. This finding suggests that the verbal praise used herein may have been somewhat detrimental
to examinee performance. Given that praise statements were presented during a nonverbal intelligence
test, excessive verbal praise was perhaps even more distracting. Alternatively, the praise statements
may have been culturally irrelevant, perceived to be disingenuous, or the praise was simply ineffective.

91
Token reinforcement. The nonsignificant results observed in the present study are also
inconsistent with the literature that observed that token reinforcement generally facilitated performance
(Bradley-Johnson, 1986; Breuning & Davis, 1981; Callahan, 2005; Devers, 1994; Edlund, 1972). This
result is particularly surprising given that numerous studies that were undertaken with younger samples
observed a positive effect for children similar in age to the present study sample who received token
reinforcement (Bradley-Johnson et al., 1984, 1986; Callahan, 2005; Edlund, 1972; Johnson et al.,
1984; Moran, 1979). Moreover, the nonsignificant result is also inconsistent with results from the
subset of studies that established reinforcement preference and observed reinforcement effects in at
least one group of participants (Bradley-Johnson et al., 1984, 1986; Devers et al., 1994; Johnson et al.,
1984).
The nonsignificant token reinforcement effects may have been a result of the participants
finding the material rewards to be not very reinforcing. Given that the rewards selected for the study
were less than $2.00 in value, the participants in the study may have had more regular access to these
particular rewards in general. Martin and Pear (1992) described this potential problem of identifying
appropriate rewards when they cautioned that “most reinforcers will not be effective unless the
individuals have been deprived of them for some period of time prior to their use” (p.36).
Unfortunately, the present study cannot estimate the perceived value of the rewards used herein and
did not attempt to quantify that with any measures.
Although findings were nonsignificant, graphical trends in the data from the study sample
suggest a possible interaction between race/ethnicity and response to incentive conditions. Specifically,
it appears that non-White participants scored higher overall compared to White participants under
Token Reinforcement conditions on the Full Scale and Geometric Scale Composites. However, White
participants scored higher overall than non-White participants under Standard Administration

92
conditions on the same composites. This finding suggests the possibility that non-White 6-7 year olds
may have been incentivized by token reinforcement more so than participating White 6-7 year olds,
though not by significant amounts. This trend bears some similarity to findings from Bradley Johnson
et al. (1984) where authors observed that Black, low SES second grade students obtained significantly
higher mean scores on the WISC-R under Token Reinforcement conditions compared to Standard
Administration groups, whereas White, low SES second grade students performed comparably under
Token Reinforcement and standard administration conditions. Miller and Eller (1985) similarly found
that Token Reinforcement was more effective with low SES Black subjects in Middle School
compared to Verbal Praise and Standard Administration procedures.
Of note, all but three of the non-White participants in the study attended the study site located
in the South Bronx, NY, and so the interaction effects observed with regards to non-White
participants’ differential responses to token reinforcement may be more related to the procedures and
customs used in their school. Specifically, the participant’s school may not use any type of
reinforcement procedures and so these students found the Token Reinforcement condition to be more
novel and, thus, more rewarding.
Another potential interaction for gender and treatment was observed through visual
examination of data plots though it was also not significant. Specifically, the group means of females
overall exceed the group means of males on the Full Scale Composite under Standard Administration
conditions, whereas the group means of males overall exceed those of females under Token
Reinforcement conditions. This potential trend is congruent with findings from Fish’s (1988) analysis
of “reinforcement-in-testing research” indicated that there the performance of elementary level boys
was enhanced by material reinforcement (i.e., candy).

93
Verbal praise vs. token reinforcement. The nonsignificant differences between the conditions
are consistent with studies that did not observe significant differences between incentive conditions,
and did not observe significant differences between the incentive conditions and standard
administrations (Bergen 1971; Fallon, 2002; Keiffer & Goh, 1981; Klugman, 1944; Quay, 1971, 1975;
Seligson, 1995; Tiber & Kennedy, 1964). Additionally, Kohls (2009) and Saigh and Payne (1979)
observed comparability between verbal praise and token/material reinforcement conditions. However,
in these studies the groups who received incentive condition outperformed groups who received
standard administrations on the measures.
Reinforcement-in-testing procedures have never been investigated for use with nonverbal
intelligence tests to this author’s knowledge. It seems possible that the nonsignificant results of the
present study are inconsistent with previous research using more traditional intelligence tests (i.e.,
verbal AND nonverbal intelligence testing measures) more so because of the nature of the test itself,
and the possibility that these reinforcement procedures are ineffective on tests that measure nonverbal
abilities. In a similar vein, nonverbal intelligence scores may be less affected by motivational factors,
and/or the sample participants’ motivation may have already been so high for the assessment that the
reinforcement procedures were not additionally motivating.
It is important to note that the recruitment rate of this study was slow, and a selection bias may
have existed for those participants whose parents/guardians returned consent forms. The selected
subjects may represent a sample of children who are accustomed to being enrolled in extra activities
and learning opportunities, and thus have more comfort with and/or more intrinsic motivation for such
tasks. It is also possible that the individual attention provided to the participants during all the test
administrations regardless of condition may have been reinforcing and, thus, influenced the test
performance of the participants in all of the groups.

94
In that same vein, it should be noted that the present sample of participants was not
representative of a special education population. It is reasonable to ask if reinforcement procedures
may have more of an effect on a special education population as was seen in a number of previous
studies on this population. These studies, specifically those conducted with participants with mild to
severe MR, observed reinforcement effects for at least one type of reinforcement (i.e., verbal praise or
token reinforcement) on the WISC-R (Johnson et al., 1984; Saigh, 1981; Saigh & Payne, 1976, 1979;
Terrell et al., 1981). Breuning & Davis (1981) similarly observed significant differences on a variety of
intelligence measures for institutionalized individuals with MR when they received “consumable
reinforcers.” In contrast, the participants used herein may have been more accustomed to performing at
an optimal level without additional reinforcement.
Limitations
There are a number of limitations in this analysis. First, the external validity of the results are
limited to populations with similar demographic and geographic characteristics, and do not include
students who are in Special Education or who identify as English Language Learners. As previously
noted, recruitment for the study was slow, and so a selection bias of participants whose motivation for
extracurricular or additional learning activities may have been present, making the study results less
generalizable to the majority of school children who do not enroll in such learning opportunities.
It is important to note that a nonverbal test of intellectual functioning was used. While the CTONI-
2’s predictive validity has a highly positive relationship with other intelligence and achievement tests
(Hammill et al., 2009), generalizations to other test instruments, particularly measures that emphasize
verbal ability such as the Wechsler scales, may be less substantiated.
There may additionally be latent factors that exerted influence on outcomes. For example,
socioeconomic status was not measured and may have a greater impact on young children’s response

95
to different behavioral techniques than was observed in this study. A number of previous studies
observed differential effects of reinforcement among participants of different socioeconomic status.
For example, Terrell et al. (1978, 1980) observed that culturally relevant verbal praise and token
reinforcement significantly improved the performance of low SES Black children on the WISC-R
compared to traditional verbal praise and standard administration procedures. Miller and Eller (1985)
observed that low SES Black children who received token reinforcement performed better on group
intelligence tests than those who received verbal praise or no reinforcement whereas low to middle
SES White children performed better when they received verbal praise. It is difficult to determine
whether these differences were due to ethnic/racial or socioeconomic differences, or both, and this
deserves further investigation.
Although 72 students participated in the study, the sample size was modest for a three group design
and a similar study with a larger sample may have been associated with significant differences.
Directions for Future Research
Although no significant differences were found, there is the potential that important
demographic differences in performance under different incentive conditions on this nonverbal
intelligence test exist. The implications of investigating this further is to be able to provide culturally
fair and appropriate assessments for all students. For example, it will be important to understand more
fully how and why students with different demographic backgrounds might be motivated by token
reinforcement and increase their effort on standardized tests under those conditions. It is also of
interest to investigate different or improved forms of verbal praise that could be used during
standardized testing.
Future researchers might also investigate other variables of interest to include in the study,
particularly including reports of socioeconomic status. Although all participants in the study were

96
English speaking, given the large Hispanic or Latino population of the geographic area where this
study was conducted, the expressive and receptive language of students may have created differences
in the exposure to the English language. As such, language background could be a variable of interest,
even on a nonverbal intelligence test.
Lastly, future researchers may wish to investigate the effects of reinforcement procedures on
nonverbal intelligence test performance with a sample that is more representative of a special
education population, including children diagnosed with Autism Spectrum Disorder, children who
have speech and language impairments, and Deaf and Hard of Hearing individuals. Extending this
research to this population in future studies would also closely align with the intended purpose of the
testing instruments.
97
Reference List
Achenbach, T. (1992). Manual for the Child Behavior Checklist/2-3 and 1992 Profile.
Burlington, VT: University of Vermont Department of Psychiatry. Anastasi, A. (1982). Psychological testing (5th ed.). New York, NY: Macmillan Publishers. Anastasi, A. & Urbina, S. (1997). Psychological Testing (7th ed.). Upper Saddle River, NJ:
Prentice Hall. Aylward, G P. & van Lingen, G. (1998). [Review of test Comprehensive Test of Nonverbal
Intelligence]. In The thirteenth mental measurements yearbook. Available from http://www. library.tc.columbia.edu/
Bandura, A. (1969). Principles of behavior modification. New York: Holt, Reinhart & Winston. Bandura, A. (1977). Social learning theory. Englewood Cliffs, NJ: Prentice Hall. Bandura, A. (1982a). In J. Suls (Ed.) Psychological Perspectives on the Self. Vol. 1. The Self and
Mechanisms of Agency (pp. 3-39). New Jersey: Lawrence Erlbaum. Bandura, A. (1982b). Self-efficacy mechanism in human agency. American Psychologist, 37,
122-147. Barber , T. X. (1973). Pitfalls in research: Nine investigator and experimenter effects. In R. M.
W. Travers (Ed.), Second handbook of research on teaching. Pp. 382-404. Chicago: Rand McNally.
Barkley, R.A. Behavioral inhibition, sustained attention, and executive functions: Constructing a
unifying theory of ADHD. Psychological Bulletin, 121(1), 65-94. doi: 10.1037/0033-2909.121.1.65
Benton, A.L. Influence of incentives upon intelligence test scores of school children.
Pedagogical Seminary and Journal of Genetic Psychology, 49, 494-497. Bergan, A., McManis, D.L. & Melchert, P.A. (1971). Effects of social and token reinforcement
on WISC Block Design performance. Perceptual and Motor Skills, 32, 871-880. doi: 10.2466/pms.1971.32.3.871
Binet, A., Simon, T. & Kite, E.S. (1916). The development of intelligence in children (The Binet
Simon Scale). Baltimore: Williams & Wilkins. Birnbrauer, J.S., Wolf, M.M., Kidder, J.D. & Tague, C.E. (1965). Classroom behavior of
retarded pupils with token reinforcement. Journal of Experimental Child Psychology, 2,
219-235. doi: 10.1016/0022-0965(65)90045-7

98
Bornstein, A.V. (1968). The effects of examiner approval and disapproval upon the performance of subjects on the performance scale of the Wechsler Intelligence Scale for Children. (Doctoral Dissertation). Retrieved from Retrieved from Proquest Dissertations and Theses. (6800339)
Bradley-Johnson, S., Johnson, C.M., Shanahan, R.H., Rickert, V., & Tardona, D. (1984). Effects
of token reinforcement on WISC performance of Black and White, low socioeconomic second graders. Behavioral Assessment, 6, 365-373.
Bradley-Johnson, S., Graham, D.P. & Johnson, C.M. (1986). Token reinforcement on WISC-R
performance for White, low-socioeconomic, upper and lower elementary-school-age students. Journal of School Psychology, 24, 73-79. doi: 10.1016/0022-4405(86)90044-0
Brassard, M.R. & Boehm, A.E. (2007). Preschool assessment: Principles and practices. New
York, NY: The Guilford Press. Breuning, S.E. & Davis, V.J. (1981). Reinforcement effects on the intelligence test performance
of institutionalized retarded adults: Behavioral analysis, directional control, and implications for habilitation. Applied Research in Mental Retardation, 2, 307-321. doi: 10.1016/0270-3092(81)90026-6
Butler, R. (1987). Task-involving and ego-involving properties of evaluation: Effects of different
feedback conditions on motivational perceptions, interest, and performance. Journal of
Educational Psychology, 79(4), 474-482. doi:10.1037/0022-0663.79.4.474 Callaghan, E. (2005). The role of reinforcement in the investigation of executive functioning
deficits in children with ADHD. (Doctoral dissertation). Retrieved from Proquest
Dissertations and Theses. (3160460) Cameron, J. & Pierce, W. D. (1994). Reinforcement, reward, and intrinsic motivation: A meta-
analysis. Review of Educational Research, 64(3), 363-423. doi: 10.3102/00346543064003363
Carton, J.S. (1996). The differential effects of tangible rewards and praise on intrinsic
motivation: A comparison of cognitive evaluation theory and operant theory. The
Behavior Analyst, 19(2), 237-255. "Centereach CDP, New York – Fact Sheet – American FactFinder".
Quickfacts.census.gov. Retrieved 2013-3-25. Clark, W. (1942). Manual of Directions California Test of Mental Maturity. Los Angeles, CA:
California Test Bureau. Cohen, J. (1988). Statistical power analysis for the behavioral sciences. Imprint, Hillsdale,
N.J.: L. Erlbaum Associates. Cronbach, L.J. (1990). Essentials of psychological testing (5th Sub ed.). Imprint, New York, NY:

99
Harpercollins College Div. Deci, E. L., Koestner, R. & Ryan, R. M. (1999). A meta-analytic review of experiments
examining the effects of extrinsic rewards on intrinsic motivation. Psychological Bulletin, 125, 627-668. doi: 10.1037/0033-2909.125.6.627
Delen, E., Kaya, F. & Ritter, N. L. (2009). Test review: Comprehensive Test of Nonverbal Intelligence – Second Edition (CTONI-2). Journal of Psychoeducational Assessment, 30(2), 209-213.
Devers, R., Bradley-Johnson, S., Johnson, C.M. (1994). The effect of token reinforcement on WISC-R performance for fifth- through ninth-grade American Indians. The
Psychological Record, 44(3), 441. Duckworth, A.L., Quinn, P.D., Lynam, D.R., Loeber, R. & Stouthamer-Loeber, M. (2011). Role
of test motivation in intelligence testing. Proceedings of the National Academy of Science
of the United States of America, 108(19), 7716-7720. doi: 10.1073/pnas.1018601108 Dweck, C. S. & Leggett, E. L. (1988). A social-cognitive approach to motivation and
personality. Psychological Review, 95(2), 256-273. doi:10.1037/0033-295X.95.2.256 Edlund, C.V. (1972). The effect on the behavior of children, as reflected in the IQ scores, when
reinforced after each correct response. Journal of Applied Behavior Analysis, 5(3), 317- 319. doi: 10.1901/jaba.1972.5-317
Ehrler, D.J. & McGhee, R.L. (2008). Primary test of nonverbal intelligence. Austin, TX: PRO-ED. England, C.T. & Malcolm, K.K. (2010). [Review of the test Primary Test of Nonverbal
Intelligence]. In The eighteenth mental measurements yearbook. Available from http://www. library.tc.columbia.edu/
Epstein, R. & Skinner, B.F. (1982). Skinner for the classroom: Selected papers. Champaign, Il:
Research Press. Fallon, E. (2002). The effects of different incentive conditions on the WISC-III performance of
conduct disorder adolescents. (Doctoral dissertation). Retrieved from Proquest
Dissertations and Theses. (3024785) Feldman, S.E. & Sullivan, D.S. (1971). Factors mediating the effects of enhanced rapport on
children’s performance. Journal of Consulting and Clinical Psychology, 36(2), 302. doi: 10.1037/h0030768
Fish, J.M. (1988). Reinforcement in testing: Research with children and adolescents.
Professional School Psychology, 3(3), 203-218. doi:10.1037/h0090559 Galbraith, G., Ott, J., & Johnson, C. M. (1986). The effects of token reinforcement on WISC-R

100
performance of low-socioeconomic Hispanic second-graders. Behavioral
Assessment, 8, 191-194. Galdieri , A. Barcikowski , R. Witmer , J. (1972). The effect of verbal approval upon the
performance of middle- and lower-class third-grade children on the WISC. Psychology in
the Schools, 9, 404-408. doi: 10.1002/1520-6807(197210)9:4<404::AID- PITS2310090411>3.0.CO;2-R
Goh , D. Lund , J. (1977). Verbal reinforcement, socioeconomic status, and intelligence test
performance of preschool children. Perceptual and Motor Skills, 44, 1011-1014. Hackenberg, T.D. (2009). Token reinforcement: A review and analysis. Journal of the
Experimental Analysis of Behavior, 91(2), 257-286. doi: 10.1901/jeab.2009.91-257 Hammill, D. D., Pearson, N. A. & Wiederholt, J. L, (2009). Comprehensive test of nonverbal
intelligence (2nd ed.). Austin, TX: PRO-ED. Hammill, D. D. & Pearson, N. A. (2009). In J. A. Naglieri & S. Goldstein (Eds.),
Practitioner’s guide to assessing intelligence and achievement (233-264). Nonverbal
intelligence tests: Comprehensive test of nonverbal intelligence – second edition. Hoboken, NJ: John Wiley & Sons, Inc.
Havinghurst , R. (1970). Minority subcultures and the law of effect. American Psychologist, 25,
313-322. doi: 10.1037/h0029480 Henderlong, J. & Lepper, M.R. (2002). The effects of praise on children’s intrinsic motivation: A
review and synthesis. Psychological Bulletin, 128,(5), 774-795. doi: 10.1037/0033-2909.128.5.774
Hoyle, R.H., Harris, M.J. & Judd C.M. (2002). Research methods in social relations (7th ed.).
Stamford, CT: Wadsworth Cengage Learning. Honeywell, J.A., Dickinson, A.M., & Poling, A. (1997). Individual performance as a function of
individual and group pay contingencies. The Psychological Record, 47(2), 261-274. Hurlock, E.B. (1924). The value of praise and reproof as incentives for children. Archives of
Psychology, 11, 74. Hurlock, E.B. (1925). The effect of incentives upon the constancy of the I.Q. Pedagogical
Seminary and Journal of Genetic Psychology, 32, 422-434. Johnson, C.M., Bradley-Johnson, S., McCarthy, R., & Jamie, M. (1984). Token reinforcement
during WISC-R administration: Effects on mildly retarded, black students. Applied Research in
Mental Retardation, 5(1), 43–52. doi: 10.1016/S0270-3092(84)80018-1 Kazdin, A.E., & Bootzin, R.R. (1972). The token economy: An evaluative review. Journal of

101
Applied Behavioral Analysis, 5, 343-372. doi: 10.1901/jaba.1972.5-343 Kazdin, A.E. (1982). The token economy: A decade later. Journal of Applied Behavioral
Analysis, 15(3), 431-445. doi: 10.1901/jaba.1982.15-431
Kennedy, W.A. & Willcutt, H.C. (1964). Praise and blame as incentives. Psychological Bulletin,
62(5), 323-332. doi: 10.1037/h0042917 Kieffer, D. A. & Goh, D.S. (1981). The effect of individually contracted incentives of
intelligence test performance of middle and low-SES children. Journal of Clinical
Psychology, 37(1), 175-179. doi: 10.1002/1097-4679(198101)37:1<175::AID- JCLP2270370135>3.0.CO;2-1
Klugman , S. (1944). The effect of money incentives versus praise upon the reliability and
obtained scores of the revised Stanford-Binet. Journal of General Psychology, 30, 255- 269.
Kohls, G., Herpertz-Dahlmann, B., & Konrad, K. (2009). Hyperresponsiveness to social rewards
in children and adolescents with attention-deficit/hyperactivity disorder (ADHD). Behavioral
and Brain Functions, 5(1), 20. doi:10.1186/1744-9081-5-20 Lakin, J.M. & Lohman, D.F. (2011). The predictive accuracy of verbal, quantitative, and
nonverbal reasoning tests: Consequences for talent identification and program diversity. Journal for the Education of the Gifted, 34(4), 595–623. doi: 10.1177/016235321103400404
Lohman, D.F. & Gambrell, J.L. (2012). Using nonverbal tests to help identify academically
talented children. Journal of Psychoeducational Assessment, 30(1), 25-34. doi: 10.1177/0734282911428194
Lubin, B., Larsen, R.M., & Matarazzo, J.D. (1984). Patterns of psychological test usage in the
United States: 1935-1982. American Psychologist, 451-454. doi: 10.1037/0003-066X.39.4.451 Martin, G. & Pear, J. (1988). Behavior modification: What it is and how to do it (3rd ed.).
Englewood Cliffs, NJ: Prentice Hall. Masters, J.C., Furman, W. & Barden, R.C. (1977). Effects of achievement standards, tangible
rewards, and self-dispensed achievement evaluations on children’s task mastery. Child
Development, 48(1), 217-224. doi: 10.2307/1128901 McGoey, K.E. & DuPaul, G.J. (2000). Token reinforcement and response cost procedures:
Reducting the disruptive behavior of preschool children with Attention- Deficit/Hyperactivity Disorder. School Psychology Quarterly, 15(3), 330-343. doi:10.1037/h0088790
McMahon, R.J. & Forehand, R.L. (2005). Helping the noncompliant child: Family-based
treatment for oppositional behavior. New York, NY: The Guilford Press.

102
Miller, R.A. (1973). Social milieu and the effects of reinforcement on I.Q. tests (Doctoral
Dissertation). Retrieved from Dissertation Abstracts International, 34, 517-B. Miller, J. & Eller, B.F. (1985). An examination of the effect of tangible and social reinforcers on
intelligence test performance of middle school students. Social Behavior and Personality,
13(2), 147-157. doi: http://dx.doi.org/10.2224/sbp.1985.13.2.147 Moran , J. (1979). A developmental analysis of the effects of reward on Wechsler Intelligence
Test performance (Doctoral Dissertation). Retrieved from Dissertation Abstracts
International, 39B, 4108. (University Microfilms No. 7903709). Mueller, C.M. & Dweck, C.S. (1998). Praise for intelligence can undermine children’s
motivation and performance. Journal of Personality and Social Psychology, 75(1), 33-52. doi: 10.1037/0022-3514.75.1.33
National Association of School Psychologists. (2010). Principles for Professional Ethics. Silver
Spring, MD: Author. Otis, A. (1924). Otis Intelligence Scale Primary Examination. Yonkers-on-Hudson, NY: World
Book Co. Pearl, R. (1985). Cognitive-behavioral interventions for increasing motivation. Journal of
Abnormal Child Psychology, 13(3), 443-454. doi: 10.1007/BF00912727 Piersel , W. Brody , G. Kratochwill , T. (1977). A further examination of motivational influences
on disadvantaged minority group children's intelligence test performance. Child Development,
48, 1142-1145. doi: 10.2307/1128377 Pollock, M.G.A. (1989). Incentive conditions and the selected WISC-R subtest performance
of elementary school children. (Unpublished doctoral dissertation). The City University of New York, New York, NY.
"Rockville Centre Village, New York – Fact Sheet – American Fact Finder". Factfinder.census.gov. Retrieved 2011-01-24.
Quay , L. (1971). Language dialect, reinforcement, and the intelligence-test performance of
Negro children. Child Development, 42, 5-15. doi: 10.2307/1127058 Quay, L. C. (1975). Reinforcement and Binet performance of disadvantaged children.
Journal of Educational Psychology, 67(1), 132-135. doi: 10.1037/h0078681 Reschly, D.L. (1981). Psychological testing in educational classification and placement.
American Psychologist, 36(10), 1094-1102. doi: 10.1037/0003-066X.36.10.1094 Saigh, P. A. & Payne, D. A. (1976). The influence of examiner verbal comments on WISC

103
performances of EMR students. Journal of School Psychology, 14(4), 342-345. doi: 10.1016/0022-4405(76)90031-5
Saigh, P. A. & Payne, D. A. (1978). Effect of reinforcement of response on internal
consistency of selected WISC-R subtests. Psychological Reports, 43, 756-758. doi: 10.2466/pr0.1978.43.3.756
Saigh, P. A. & Payne, D. A. (1979). The effect of type of reinforcer and reinforcement
schedule on performance of EMR students on four selected subtests of the WISC-R. Psychology in the Schools, 16(1), 106-110.
Saigh, P. A. (1981). The effects of positive examiner verbal comments on the total WISC-R
performance of institutionalized EMR students. Journal of School Psychology, 19(1), 86-91. doi: 10.1016/0022-4405(81)90013-3
Saigh, P.A. & Antoun, F.T. (1983). WISC-R incentives and the academic achievement of
conduct disordered adolescent females: A validity study. Journal of Clinical Psychology,
39(5), 771-774. Salvia, J., Ysseldyke, J.E. & Bolt, S. (2007). Assessment in special and inclusive education
(11th ed.). Belmont, CA: Wadsworth Cengage Learning. Sattler, J.M. (1974). Assessment of children’s intelligence (Saunders books in psychology). Imprint,
Philadelphia, PA: Saunders First Edition. Sattler, J.M. (2008). Assessment of children: Cognitive applications (5th ed.). La Mesa, CA: Jerome M.
Sattler, Publisher. Scarr, S. (1981). Testing for children: Assessment and the many determinants of intellectual
competence. American Psychologist, 36(10), 1159-1166. doi:10.1037/0003- 066X.36.10.1159
Skinner, B.F. (1971). Beyond Freedom and Dignity. New York, NY: Alfred A. Knopf. Smiley, P.A. & Dweck, C. S. (1994). Individual differences in achievement goals among
young children. Child development, 65(6), 1723-1743. Spiegler, M.D. & Guevremont, D.C. (2010). Contemporary behavior therapy (5th ed.).
Belmont, CA: Wadsworth Cengage Learning. Sue, D. & Sue, D.W. (2013). Counseling the culturally diverse: theory and practice (6th ed.).
Hoboken, NJ: Wiley. Terman , L. (1916). The measurement of intelligence. Boston: Houghton Mifflin. doi:
10.1037/10014-000

104
Terman , L.M. & Merrill, M.A. (1937). Measuring intelligence. Boston: Houghton Mifflin.
Terman, M. & Merrill, M. A. (1960). Stanford-Binet Intelligence Scale. Boston: Houghton
Mifflin. Terman, M. & Merrill, M. A. (1973). Stanford-Binet Intelligence Scale: Manual for the Third
Revision, Form L-M. New York: Houghton Mifflin. Terrell, F., Taylor, J., & Terrell, S. (1978). Effects of type of social reinforcement on the
intelligence test performance of lower-class Black children. Journal of Consulting and
Clinical Psychology, 46, 1538-1539. doi: 10.1037/0022-006X.46.6.1538 Terrell, F. Terrell, S. & Taylor, J. (1980). Effects of race of examiner and type of reinforcement
on the intelligence test performance of lower-class Black children. Psychology in the
Schools, 17, 270-272. doi: 10.1002/1520-6807(198004)17:2<270::AID- PITS2310170220>3.0.CO;2-F
Terrell, F., Terrell, S., & Taylor, J. (1981). Effects of type of reinforcement on the intelligence
test performance of retarded black children. Psychology in the Schools, 18, 225-227. doi: 10.1002/1520-6807(198104)18:2<225::AID-PITS2310180220>3.0.CO;2-Z
Thorndike, E. (1924). Measurement of intelligence. Psychological Review, 31, 219-252. doi:
10.1037/h0073975 Thorndike, E.L. (1965). Animal Intelligence: Experimental Studies (Reprint). Ann Arbor, MI:
Hafner Publishing Company. Tiber, N. Kennedy,W. (1964). The effects of incentives on the intelligence test performance of
different social groups. Journal of Consulting Psychology, 28, 187. doi: 10.1037/h0048465 U.S. Census Bureau. (2010). State & county Quickfacts: Rockville Centre (village), N.Y.
Retrieved May 14, 2013, from http://quickfacts.census.gov. Walker, H.M. & Buckley, N.K. (1968). The use of positive reinforcement in conditioning
attending behavior. Journal of Applied Behavior Analysis, 1(3), 245-250. doi: 10.1901/jaba.1968.1-245
Wechsler, D. (1940). Nonintellective factors in general intelligence. Psychological Bulletin,
37(7), 444-445. Wechsler, D. (1949). Wechsler Intelligence Scale for Children. New York: The Psychological
Corporation. Wechsler, D. (1955). Wechsler Adult Intelligence Scale. New York, NY: The Psychological
Corporation.

105
Wechsler, D. (1967). Wechsler Preschool and Primary Scale of Intelligence. New York, NY: The
Psychological Corporation. Wechsler , D. (1974). Wechsler Intelligence Scale for Children-Revised. San Antonio, TX: The
Psychological Corporation. Wechsler , D. (1991). Wechsler Intelligence Scale for Children-Third Edition. San Antonio, TX:
The Psychological Corporation. Wechsler, D. (1999). Wechsler Abbreviated Scale of Intelligence. New York: The Psychological
Corporation. Wechsler, D. (2003). Wechsler intelligence scale for children (4th ed.). San Antonio, TX: NCS
Pearson, Inc. Weinberg, R.A. (1989). Intelligence and IQ: Landmark issues and great debates. American
Psychologist, 44(2), 98-104. doi: 10.1037/0003-066X.44.2.98 Witmer, J. Bornstein, A. Dunham, R. (1971). The effects of verbal approval and disapproval
upon the performance of third and fourth grade children on four subtests of the Wechsler Intelligence Scale for Children. Journal of School Psychology, 9, 347-356. doi: 10.1016/0022-4405(71)90093-8
Yeager, N. (1983). The effect of tangible rewards on the WISC-R performance of black, low-
income, sixth graders. (Masters thesis). Retrieved from Proquest Dissertations and
Theses. (1321369) Zigler, E. & Butterfield, E.C. (1968). Motivational aspects of changes in IQ test performance of
culturally derived nursery school children. Child Development, 39(1), 1-14.

106
Appendix Listing
Appendix A: Parent/Guardian Letter and Parent/Guardian Informed Consent
Appendix B: Child Assent Script and Investigator’s Verification of Explanation
Appendix C: Child Reward Menu
Appendix D: Procedure Manual
Appendix E: Treatment Integrity Rating Instructions
Appendix F: Treatment Integrity Rating Worksheets

107
Appendix A
Parent/Guardian Letter and Parent/Guardian Informed Consent

108
Laura Cimini, Ed.M. School Psychology Program
Department of Health & Behavior Studies Teachers College, Columbia University
525 West 120th Street New York, New York 10027
PARENT/GUARDIAN INFORMED CONSENT
Investigator: Laura Cimini, Doctoral Candidate
Description of Research: Your child is invited to participate in a research study on the performance of children in first and second grades as they participate in a measure of nonverbal intelligence under different testing conditions. Your child will be asked to participate in a single procedure to be conducted on one day or separate days, if necessary. If you agree to let your child participate, he or she will be asked to complete two nonverbal tests of ability. One group of children will be verbally praised for their effort during the administration of one of the tests and another group will receive tokens that can be exchanged for such prizes as stickers, pencils or small toys. Your child’s school record will be consulted to obtain demographic (racial/ethnic) data and special education status solely for use in data analysis. All test administrations will be audio recorded to monitor examiner compliance and will not contain identifying information. After all students have been tested, the examiner(s) will visit the classroom(s) to answer any questions.
Risks and Benefits: Students will be exposed to very minimal to no risk. No testing will occur without the written consent of the parents/guardians and verbal assent from each child. Any child who agrees to be tested and subsequently decides against doing so may withdraw from the study without any penalty. If it appears that your child is experiencing distress during the study, counseling will be arranged. Lastly, testing may result in missing class time that cannot be made up, though students will only be tested during activities and class periods that teachers and school administration deem appropriate (e.g., special classes such as Art, Music, and/or Physical Education).
There are no direct benefits for participating in the study. A possible, indirect benefit of study participation may be that students will become more familiarized with standardized testing, but this cannot be guaranteed.
Data Storage to Protect Confidentiality: All test scores, recordings, and demographic information will be kept confidential and will not become part of school records. Furthermore, after each test administration, Ms. Cimini will transform scores to data coding sheets that will not include the students’ names. All test data will be stored in a locked file by Ms. Cimini.
Time Involvement: Your child’s participation will take approximately 40-60 minutes. No session will result in missing significant school work and students will be tested during activities and class periods that teachers and school administration think is best, as determined on an individual school basis. Effort will be made to allow students to make up any work that may be missed as a result of testing.
How Will Results be Used: The results of this study will be used for my dissertation and possible publication in an academic journal.

109
Laura Cimini, Ed.M. School Psychology Program
Department of Health & Behavior Studies Teachers College, Columbia University
525 West 120th Street New York, New York 10027
PARTICIPANT'S RIGHTS
Principal Investigator: Laura Cimini, Doctoral Candidate
Research Title: The effects of positive examiner verbal comments and token reinforcement on the nonverbal intelligence performance of school-age children
• I have read and discussed the Research Description with the researcher. I have had the opportunity to ask questions about the purposes and procedures regarding this study.
• My participation in research is voluntary. I may refuse to participate or withdraw from participation at any time without jeopardy to future medical care, employment, student status or other entitlements.
• The researcher may withdraw me from the research at his/her professional discretion.
• If, during the course of the study, significant new information that has been developed becomes available which may relate to my willingness to continue to participate, the investigator will provide this information to me.
• Any information derived from the research project that personally identifies me will not be voluntarily released or disclosed without my separate consent, except as specifically required by law.
• If at any time I have any questions regarding the research or my participation, I can contact the investigator, who will answer my questions. The investigator's phone number is (516) 528-3067 and her email is [email protected].
• If at any time I have comments, or concerns regarding the conduct of the research or questions about my rights as a research subject, I should contact the Teachers College, Columbia University Institutional Review Board /IRB. The phone number for the IRB is (212) 678-4105. Or, I can write to the IRB at Teachers College, Columbia University, 525 W. 120th Street, New York, NY, 10027, Box 151.
• I should receive a copy of the Research Description and this Participant's Rights document.
• I ( ) consent to be audio taped. I ( ) do NOT consent to being audio taped. The written and/or audio taped materials will be viewed only by the principal investigator and members of the research team.
• Written and/or audio taped materials ( ) may be viewed in an educational setting outside the research ( ) may NOT be viewed in an educational setting outside the research.
• My signature means that I agree to participate in this study.
Guardian's Signature/consent: ____________________________________ Date:___/____/____
Child’s Name: ____________________________________
Child’s Date of Birth: ____________________________ Child’s Race: � White � Black/African American � Hispanic or Latino � American Indian or Alaskan Native � Asian
� Native Hawaiian/Pacific Islander � Two or more races � Other:______________________________
Does your child receive Special Education services in school? � YES � NO

110
Laura Cimini, Ed.M. School Psychology Program
Department of Health & Behavior Studies Teachers College, Columbia University
525 West 120th Street New York, New York 10027
CONSENTIMIENTO INFORMADO DE PADRE/GUARDIAN
Investigadora: Laura Cimini, Candidata Doctoral Descripción de la Investigación: Su niño/a está invitado/a a participar en un estudio de investigación sobre la realización de niños en el primer o segundo grado mientras que participan en una medida de inteligencia no verbal bajo de condiciones de pruebas diferentes. Se pedirá que su niño participe en un procedimiento único para llevarse a cabo en un día o en días separados, si es necesario. Si usted acepta que su hijo/a participe, él o ella tendrán que completar dos pruebas no verbales de capacidad. Un grupo de niños será alabado verbalmente por sus esfuerzos durante la administración de una de las pruebas y el otro grupo recibirá fichas que pueden ser intercambiadas por tales premios como pegatinas, lápices o juguetes pequeños. El expediente académico de su hijo/a será consultado para obtener datos demográficos (raciales y étnicos) y estado de educación especial, exclusivamente para uso en análisis de datos. Todas las administraciones de las pruebas serán audio grabadas para supervisar el cumplimiento del examinador y no contendrá información de identificación. Después de que todos los estudiantes han sido probados, el examinador(es) visitará las clases para responder a cualquier pregunta. Riesgos y Beneficios: Los estudiantes serán expuestos a muy mínimo o ningún riesgo. Ninguna prueba se producirá sin el consentimiento por escrito de los padres/guardianes y el consentimiento verbal de cada niño. Cualquier niño que se compromete a ser probado y posteriormente decide contra hacer la prueba puede retirarse del estudio sin ninguna sanción. Si parece que su hijo está experimentando angustia durante el estudio, apoyo psicológico será arreglada. Por último, la prueba puede resultar en tiempo de clase perdida que no se puede recuperar, aunque los estudiantes sólo se probarán durante actividades y períodos de la clase que los maestros y la administración de la escuela consideren oportunas (por ejemplo, clases especiales tales como arte, música y educación física).
No hay ningún beneficio directo por participar en el estudio. Un posible beneficio indirecto de participación en el estudio es que los estudiantes posiblemente estarán más familiarizados con las pruebas estandarizadas, pero esto no se puede garantizar.
Almacenamiento de Datos para Proteger la Confidencialidad: Todos los resultados de exámenes y grabaciones e información demográfica se mantendrán confidenciales y no serán parte de registros de la escuela. Además, después de la administración de cada prueba, la Srta. Cimini transformará los resultados a codificación de datos que no incluirán los nombres de los estudiantes. Todos los datos de prueba se almacenarán en un archivo cerrado por la Srta. Cimini. Participación de Tiempo: La participación de su hijo tomará aproximadamente 40-60 minutos. Ninguna sesión resultará en faltar al trabajo significativo de la escuela y los estudiantes se probarán durante actividades y períodos de clase que los maestros y la administración de la escuela piensen que

111
es mejor, determinado sobre cada escuela individual. Se hará esfuerzo para permitir a los estudiantes a hacer cualquier trabajo que no han hecho como resultado de las pruebas. Cómo se Utilizará Resultados: Los resultados de este estudio se utilizarán para mi tesis doctoral y su posible publicación en una revista académica.

112
Laura Cimini, Ed.M. Department of Health & Behavior Studies Teachers College, Columbia University
525 West 120th Street New York, New York 10027
DERECHOS DEL PARTICIPANTE
Investigadora Principal: Laura Cimini, Candidata Doctoral
Título de la Investigación: Los efectos del comentario verbal positivo examinador y refuerzo de ficha en el desempeño de inteligencia no verbal de los niños de edad escolar
• He leído y hablado de la descripción de la investigación con la investigadora. He tenido la oportunidad de hacer preguntas sobre los propósitos y procedimientos en cuanto al estudio.
• Mi participación en la investigación es voluntaria. Puedo negarme a participar o retirar de participación en cualquier momento sin riesgo futuro a asistencia médica, empleo, estado estudiantil u otros derechos.
• La investigadora puede retirarme de la investigación a su discreción profesional.
• Si, durante el transcurso del estudio, importante información nueva que se ha desarrollado se encuentra disponible que puede relacionarse con mi disposición a continuar participando, la investigadora proporcionará esta información.
• Cualquier información derivada del proyecto de investigación que personalmente me identifica, no será hecha pública o revelada sin mi consentimiento separado, excepto según lo específicamente requerido por ley.
• Si en cualquier momento, tengo preguntas en cuanto a la investigación o mi participación, puedo ponerme en contacto con la investigadora, quien me contestará las preguntas. El número de teléfono de la investigadora es (516) 528-3067 y su correo electrónico es [email protected].
• Si en cualquier momento, tengo comentarios o dudas en cuanto a la investigación o preguntas sobre mis derechos como un sujeto de investigación, debo ponerme en contacto con el Teachers College, Columbia University Institutional Review Board/IRB. El número de teléfono del IRB es (212) 678-4105. O, puedo escribir al IRB al Teachers College, Columbia University, 525 W. 120th Street, New York, NY, 10027, Box 151.
• Debo recibir una copia de la Descripción de la Investigación y este documento de Derechos del Participante.
• Yo ( ) doy consentimiento para ser grabado en audio. Yo ( ) NO doy consentimiento para estar grabado en audio. Los materiales escritos y/o grabados en audio estarán vistos solo por la investigadora principal y los miembros del equipo de la investigación.
• Los materiales escritos y/o grabados en audio ( ) pueden estar vistos en entornos educativos afuera de la investigación. Los materiales escritos y/o grabados en audio ( ) NO pueden estar vistos en entornos educativos afuera de la investigación.
• Mi firma significa que estoy de acuerdo para participar en este estudio.
Firma/consentimiento del guardián: ____________________________________ Fecha:___/____/____
Nombre del niño/a: ____________________________________
Día de nacimiento del niño/a: ____________________________ Raza del hijo(a): � Blanco(a) � Negro(a)/Afroamericano(a) � Hispano(a) o Latino(a) � Amerindio(a) o nativo(a) de Alaska � Asiático(a) � Hawaiano(a) o isleño(a) del Pacífico � Dos o más razas � Otra:_______________________
¿Recibe su hijo(a) servicios de Educación Especial en la escuela? � SÍ � NO

113
Appendix B
Child Assent Script and Investigator’s Verification of Explanation

114
Laura Cimini School Psychology Program
Department of Health & Behavior Studies Teachers College, Columbia University
525 West 120th Street New York, New York 10027
CHILD ASSENT SCRIPT
Study Title: The effects of positive examiner verbal comments and token reinforcement on the nonverbal intelligence performance of school-age children. Investigator: Laura Cimini, Doctoral Candidate When examiner and student arrive at the testing room, the examiner will read the following to each participant: “Hi. (As you know) my name is _________. I am a student at Columbia University Teachers College and I am working on a project to find out more about ways to help students take tests. I would like your help with this project. If you agree to help, your part in the project will involve a few different activities: You will take an individually presented test taken frequently by students. It has seven parts and will not take more than 40 to 60 minutes. Then we will walk back to your class.” “It is also important for you to know that your parents/guardians have agreed that you can help, you will not miss a lot of school in order to help, and nothing bad will happen to you if you do or do not decide to help with the project. I will record our voices while we work on the project but no one from your school will listen to it or know your scores. Also, students who have helped in projects in the past have enjoyed the activities, and taking part in this project may help other students feel better about taking tests.” “You can ask questions at any time and your parents/guardians have my direct phone number in case you or they have any more questions. Do you have any questions?” “Okay. Do you want to help with project or do you not want to help with the project?”

115
Laura Cimini School Psychology Program
Department of Health & Behavior Studies Teachers College, Columbia University
525 West 120th Street New York, New York 10027
Investigator's Verification of Explanation
I certify that I have carefully explained the purpose and nature of this research to
__________________________________ (participant’s name) in age-appropriate language. He/She
has had the opportunity to discuss it with me in detail. I have answered all his/her questions and he/she
provided the affirmative agreement (i.e. assent) to participate in this research.
Investigator’s Signature: _________________________________________
Date: ______________________

116
Appendix C
Child Reward Menu

117
CHILD REWARD MENU
ID Number: ____________________ Date: _____________________ Listed below are some items that students find rewarding and have a chance to earn while working on the project. Please circle the two items you find most rewarding on the list:
STICKERS
SQUINKIES
PENCILS
SPORTS BRACELET
ZOO ANIMAL RING
WRISTBAND

118
Appendix D
Procedure Manual

119
PROCEDURE MANUAL
The Effects of Positive Examiner Verbal Comments and Token Reinforcement on the CTONI-2
Performance of Early Elementary School Children
Students ages 6 to 7 from various elementary schools will be invited to participate in the study and will be randomly assigned to three treatment groups.
APPROVAL, CONSENT, ASSENT
School (or school district) permission will be obtained through the School (or school district) principal and/or superintendent. A list of potential participants, ages 6 to 7, will be compiled from school records. Based on a review of records:
� Children with Autism Spectrum Disorders and/or Intellectual Disability, will be excluded;
� Children who do not speak English will be excluded; � In the absence of an available chart, any participant who obtains a standard score of less
than 70 on the initial administration of the PTONI will be excluded from the study. Each eligible participant will be randomly assigned to one of three groups. The parents or legal guardians of each participant will receive a cover letter and a consent form (See Appendix A for Parent/Guardian Letter and Parent/Guardian Informed Consent) for the participant. Follow-up calls and mail contacts will be made if necessary. Child Assent (See Appendix B for Child Assent Script) will be obtained verbally from participants who have parent/guardian permission to take part in the study. Participants will be informed they are free to withdraw from the study at any time without reprimand. Once the investigator obtains verbal assent from the child, he/she will sign the Investigator’s Verification of Explanation (See Appendix B). DATA COLLECTION
The investigator will administer the PTONI to each participant in order to determine eligibility for inclusion in the study as well as to obtain participant preexperimental scores to determine equivalency between treatment groups.

120
Information regarding effective and appropriate reinforcers for each participant in the Token Reinforcement treatment condition will be obtained by asking each participant to indicate his or her preferences for reinforcers on the Child Reward Menu (See Appendix C). Each participant’s preference for items worth $2.00 or less will be elicited. Participants will be assigned to one of several examiners who are in the Ed.M. or Ph.D. degree programs in School Psychology at Teachers College, Columbia University for testing based on examiner availability at the time when a participant becomes eligible and available for the study. If more than one examiner is available to work with a participant, the participant will be randomly assigned to an examiner. Examiners will be informed that they must abide by all federal, state, and local laws governing ethical research with vulnerable populations and that they are mandated reporters of child abuse and neglect. Participants will receive an individual administration of the CTONI-2 under one of three treatment conditions (i.e., the standard administration, verbal praise or token reinforcement). The CTONI-2 will be administered to all participants according to specific directions stated herein the Procedure Manual. All CTONI-2 testing will be audio recorded. Administering rewards to a select group in a school setting is likely to establish expectations of receiving rewards during testing for all participants in all groups. Therefore, to avoid the potential distress at not receiving rewards after testing, all participants will receive a reward from the Reward Menu at the conclusion of testing. Participants in the standard administration and Verbal Praise groups will complete the test administrations before they are informed of the rewards. Subtest raw scores will be determined by each examiner according to the CTONI-2 Examiner’s Manual (Hammill et al., 2009). Subtest and IQ scores will be calculated by the investigator using the CTONI-2 Examiner’s Manual norm tables. All test scores and interview results will be confidential and stored in a locked file by the investigator. After each test administration, the investigator will enter data from the test protocols onto a computer file that will not include the participant’s names for data analysis. DATA ANALYSIS
� Neutral observers will independently rate the audio recorded administration of the CTONI-2 of
15 randomly selected participants (five from each condition) for compliance with the experimental and control protocols, as described in the Procedure Manual (Appendix D). The raters will be provided with the Procedure Manual, Treatment Integrity Rating Instructions (Appendix E), and Treatment Integrity Worksheets (Appendix F), which are all adapted versions of texts created by Fallon (2002) for use in studying the effects of incentive conditions on clinical populations. Completed worksheets will be returned to the investigator.

121
o The investigator will then calculate a kappa statistic to determine inter-rater agreement as a measure of treatment integrity based on rater’s responses.
� Initially, a one-way ANOVA will be conducted to determine if PTONI scores significantly differ by group.
o Given a non-significant value, a one-way ANOVA will be conducted to determine if CTONI-2 scores differ by examiner.
o Given a non-significant value, a MANOVA procedure and Bonferroni post-hoc comparisons will be performed on the CTONI-2 scores to determine if there are significant differences between experimental and control groups and also between the two experimental groups (Verbal Praise and Token Reinforcement).
o If the PTONI scores significantly differ, the CTONI-2 scores will be analyzed using an MANCOVA procedure wherein PTONI scores will serve as covariates and CTONI-2 scores will serve as the dependent variable.
o Given significant outcomes, Bonferroni post-hoc comparisons will be performed on the
CTONI-2.

122
TEST PROCEDURES
Standard Administration Group
The participants in the Standard Administration Group will receive the standardized CTONI-2 administration and scoring as specified in the CTONI-2 Examiner’s Manual (Hammill et al. 2009). They will be given all six subtests in a neutral, non-evaluative manner as described in the manual.
� Standardized procedures include a natural, nonthreatening, conversational tone and encouraging interest in and persistence through tasks.
� Testing should proceed at a steady pace. Brief conversations between subtests may help to maintain cooperation and interest and reduce test apprehension.
� Short breaks can be provided if necessary and should occur at the completion of a subtest. � Every effort to administer the entire test in a single session should be made. Fatigue, inadequate
motivation, or other reasons may necessitate discontinuation and rescheduling of a second session within the time period of two weeks.
� Efforts should be made to minimize any potential distraction or interference. The physical setting should be quiet, adequately lit, and well ventilated.
� Seating arrangements and organization of materials should allow easy access to test materials, promote the child’s comfort and ease of manipulating the materials, and allow an unobstructed view of the examinee’s responses and behaviors.
� Feedback on whether a particular response is right or wrong should not be given under any circumstances.
The examiner will audio record the test session. Introduce testing by informing the child that:
� I’m going to give you some tests to see what you’re good at and what you may need more help with.
During the administration of the subtests:
� After each example at the beginning of subtests, examiners are to provide a “Yes” and a smile in response to correct answers (to examples) (Hammill et al., 2009).
After each response on the first three items in a subtest, the examiner will state:
� “Now try this.” (first item) � “How about this.” (second item) � “Here is the next one.” (third item)
For every other response (i.e., fifth, seventh, etc.) after completion of the first three items, the
examiner will comment on an alternating basis:
� “Give this one a try.” � “Let’s try this.”
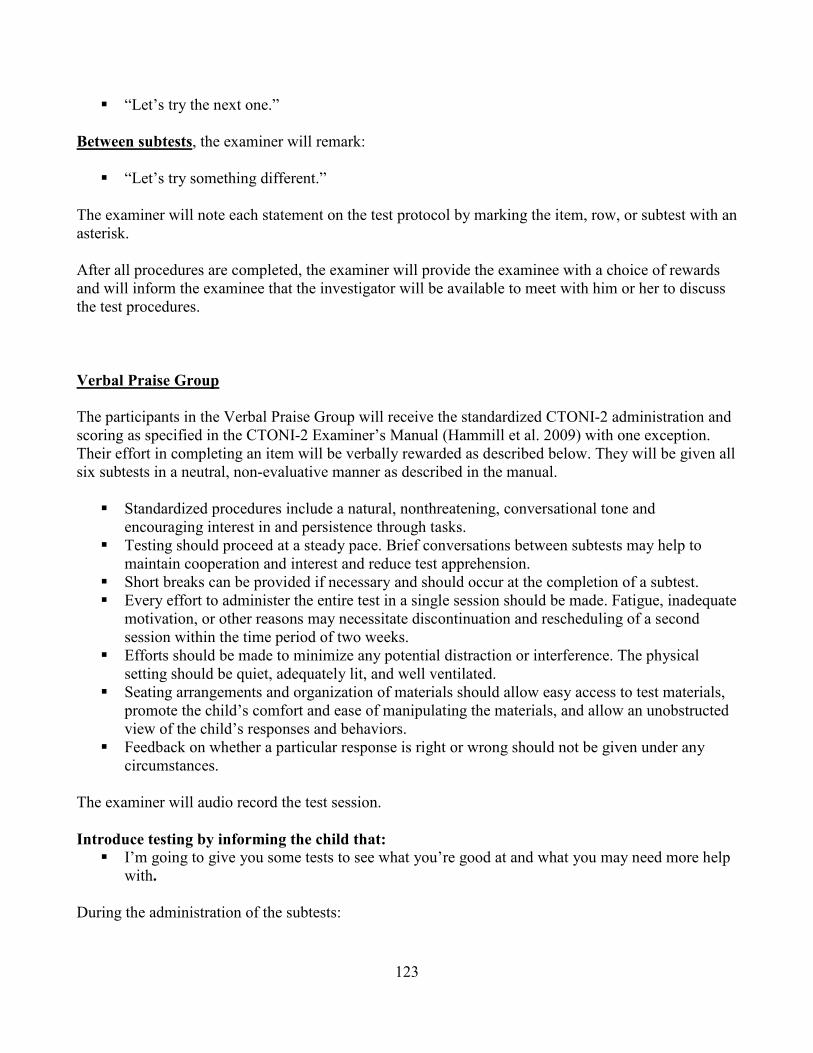
123
� “Let’s try the next one.”
Between subtests, the examiner will remark:
� “Let’s try something different.” The examiner will note each statement on the test protocol by marking the item, row, or subtest with an asterisk. After all procedures are completed, the examiner will provide the examinee with a choice of rewards and will inform the examinee that the investigator will be available to meet with him or her to discuss the test procedures.
Verbal Praise Group
The participants in the Verbal Praise Group will receive the standardized CTONI-2 administration and scoring as specified in the CTONI-2 Examiner’s Manual (Hammill et al. 2009) with one exception. Their effort in completing an item will be verbally rewarded as described below. They will be given all six subtests in a neutral, non-evaluative manner as described in the manual.
� Standardized procedures include a natural, nonthreatening, conversational tone and encouraging interest in and persistence through tasks.
� Testing should proceed at a steady pace. Brief conversations between subtests may help to maintain cooperation and interest and reduce test apprehension.
� Short breaks can be provided if necessary and should occur at the completion of a subtest. � Every effort to administer the entire test in a single session should be made. Fatigue, inadequate
motivation, or other reasons may necessitate discontinuation and rescheduling of a second session within the time period of two weeks.
� Efforts should be made to minimize any potential distraction or interference. The physical setting should be quiet, adequately lit, and well ventilated.
� Seating arrangements and organization of materials should allow easy access to test materials, promote the child’s comfort and ease of manipulating the materials, and allow an unobstructed view of the child’s responses and behaviors.
� Feedback on whether a particular response is right or wrong should not be given under any circumstances.
The examiner will audio record the test session. Introduce testing by informing the child that:
� I’m going to give you some tests to see what you’re good at and what you may need more help with.
During the administration of the subtests:

124
� After each example at the beginning of subtests, examiners are to provide a “Yes” and a smile in response to correct answers (to examples) (Hammill et al., 2009).
After each response on the first three items in a subtest, the examiner will state:
� “Very good effort” (first item) � “Keep it up” (second item) � “That’s the way to try” (third item)
For every other response after completion of the first three items (i.e., fifth, seventh, etc.), the
examiner will comment on an alternating basis:
� “I like the way you’re trying.” � “Keep it up.” � “Very good effort.”
Between subtests, the examiner will remark:
� “Remember, you have to work hard and keep on trying hard.” The examiner will note each statement on the test protocol by marking the item, row, or subtest with an asterisk. After all procedures are completed, the examiner will provide the examinee with a choice of rewards and will inform the examinee that the investigator will be available to meet with him or her to discuss the test procedures.
Token Reinforcement Group
The participants in the Token Reinforcement Group will receive the standardized CTONI-2 administration and scoring as specified in the CTONI-2 Examiner’s Manual (Hammill et al. 2009) with one exception. Their effort in completing an item will be rewarded with tokens (i.e., poker chips) as described below. They will be given all six subtests in a neutral, non-evaluative manner as described in the manual. The investigator will provide tokens and the pre-identified reinforcers before testing sessions.
� Standardized procedures include a natural, nonthreatening, conversational tone and encouraging interest in and persistence through tasks.
� Testing should proceed at a steady pace. Brief conversations between subtests may help to maintain cooperation and interest and reduce test apprehension.
� Short breaks can be provided if necessary and should occur at the completion of a subtest. � Every effort to administer the entire test in a single session should be made. Fatigue, inadequate
motivation, or other reasons may necessitate discontinuation and rescheduling of a second session within the time period of two weeks.
� Efforts should be made to minimize any potential distraction or interference. The physical setting should be quiet, adequately lit, and well ventilated.

125
� Seating arrangements and organization of materials should allow easy access to test materials, promote the examinee’s comfort and ease of manipulating the materials, and allow an unobstructed view of the examinee’s responses and behaviors.
� Feedback on whether a particular response is right or wrong should not be given under any circumstances.
The examiner will audio record the test session. Introduce testing by informing the examinee that:
� I’m going to give you some tests to see what you’re good at and what you may need more help with. Please try your best on all the items. When you receive one of these tokens it will mean I can tell you are working hard. You said that you are interested in receiving a [reward choice] at the end of today. If you try hard, you should earn enough tokens to receive the reward you want. You can trade your tokens in for your reward after the testing is completed. You have to answer all of the questions to the best of your ability. Is it a deal? (5 second pause) Good, let’s begin.”
During the administration of the subtests:
� After each example at the beginning of subtests, examiners are to provide a “Yes” and a smile in response to correct answers (to examples) (Hammill et al., 2009).
After each response on the first three items in a subtest, the examiner will place a token in a clear container and make the following neutral comments as the token is given:
� “Here is a token” or � “Here you go”
For every other response after completion of the first three items (i.e., fifth, seventh, etc.), the examiner will place a token in the clear container and make the following neutral comment as the token is given:
� “Here is a token” or � “Here you go”
Between subtests, the examiner will place a token in a clear container and make the following neutral comments as the token is given:
� “Here is a token” or � “Here you go”
The examiner will note each token dispensed on the test protocol by marking the item, row, or subtest with an asterisk. If a participant makes an effort to manipulate or count his or her tokens, the participant will be reminded,

126
� “You can count and trade your tokens in for your reward after testing is completed.” If the participant inquires about how may tokens are needed to receive the reward, the examiner should state,
� “If you try hard, you should earn enough tokens to receive the reward you want.”
Following completion of the test, a participant will exchange all the tokens for the pre-identified reinforcer regardless of the number of tokens accumulated. After all procedures are completed, the examiner will inform the participant that the investigator will be available to meet with him or her to discuss the test procedures.

127
Appendix E
Treatment Integrity Rating Instructions

128
Treatment Integrity Rating Instructions
Purpose:
A neutral observer (i.e., not the examiner) will independently rate the audio-recorded CTONI-2
administration for 15 randomly selected participants (five from each experimental condition) for
compliance with the experimental protocol provided in the Procedure Manual for the study. The
investigator will obtain a kappa statistic to determine treatment integrity.
Materials:
� Procedure Manual including Test Procedures for the Standard Administration Group, the
Verbal Praise Group, and the Token Reinforcement Group
� Treatment Integrity Rating Worksheets for each randomly selected participant. Items
administered by the examiners in accordance with standard CTONI-2 procedures have been
indicated for each participant. Items scheduled for treatment in accordance with the test
procedures for this study have also been indicated for each participant.
� Audio recordings of the CTONI-2 administration for each selected participant.
� CTONI-2 protocol for each selected participant (to assist the rater in listening to the audio
recording).
Procedures:
� Raters will indicate if a standard introduction statement or the Token Reinforcement condition
introduction statement was made by the examiner (per guidelines or statement provided in the
Procedure Manual)

129
Treatment Integrity Rating Instructions
� Raters will indicate if the required statements or rewards for subtest items occurred for items
scheduled to receive statements or rewards (the first three items of each subtest, and for
alternating items thereafter, regardless of correctness, per instructions provided in the
Procedure Manual). Raters can accept any of the statements listed for the respective conditions.
Changes in the sequence of statements, if they occur, are not to be rated as deviations from
treatment procedures within a treatment condition. Statements for each treatment are
considered to be equivalent for their respective treatment.
� Raters will indicate if the required statements or rewards occurred between subtests (per
instructions provided in the Procedure Manual). Again, raters can accept any one of the
statements listed for the respective conditions. Changes in the sequence of statements, if they
occur, are not to be rated as deviations from treatment procedures within a treatment condition.
Statements for each treatment are considered to be equivalent for their respective treatment.
� Raters will indicate if the CTONI-2 was administered in the standard manner as specified in the
CTONI-2 Examiner’s Manual (Hammill et al., 2009) except for changes associated with the
Verbal Praise and Token Reinforcement treatments, per instructions in the Procedure Manual.
Violations of standard administration should be obvious and extreme (e.g., statements
indicating that a response is right or wrong).
� If the quality of the audio recording is poor, raters will indicate their inability to rate the item
by marking the item “UR” next to the “YES/NO” response that could not be made. If 80% of
the statements are unable to be rated, another participant will be selected at random to replace
the participant whose response could not be rated adequately.

130
Appendix F: Treatment Integrity Rating Worksheets

131
Treatment Integrity Rating Worksheet
Standard Administration Condition
Participant # Selected at Random: ________
Rater: ______________________________
Date: _______________________________
Comprehensive Test of Nonverbal Intelligence – Second Edition
Standard Introduction Statement YES NO
1. Picture Analogies Subtest
ITEM ITEM
ADMINISTERED
STATEMENT
SCHEDULED
STATEMENT
MADE
1 YES/NO YES/NO YES/NO
2 YES/NO YES/NO YES/NO
3 YES/NO YES/NO YES/NO
4 YES/NO YES/NO YES/NO
5 YES/NO YES/NO YES/NO
6 YES/NO YES/NO YES/NO
7 YES/NO YES/NO YES/NO
8 YES/NO YES/NO YES/NO

132
9 YES/NO YES/NO YES/NO
10 YES/NO YES/NO YES/NO
11 YES/NO YES/NO YES/NO
12 YES/NO YES/NO YES/NO
13 YES/NO YES/NO YES/NO
14 YES/NO YES/NO YES/NO
15 YES/NO YES/NO YES/NO
16 YES/NO YES/NO YES/NO
17 YES/NO YES/NO YES/NO
18 YES/NO YES/NO YES/NO
19 YES/NO YES/NO YES/NO
20 YES/NO YES/NO YES/NO
21 YES/NO YES/NO YES/NO
22 YES/NO YES/NO YES/NO
23 YES/NO YES/NO YES/NO
24 YES/NO YES/NO YES/NO
25 YES/NO YES/NO YES/NO
Scheduled Statement Made Between Subtests YES NO
2. Geometric Analogies Subtest
ITEM ITEM
ADMINISTERED
STATEMENT
SCHEDULED
STATEMENT
MADE

133
1 YES/NO YES/NO YES/NO
2 YES/NO YES/NO YES/NO
3 YES/NO YES/NO YES/NO
4 YES/NO YES/NO YES/NO
5 YES/NO YES/NO YES/NO
6 YES/NO YES/NO YES/NO
7 YES/NO YES/NO YES/NO
8 YES/NO YES/NO YES/NO
9 YES/NO YES/NO YES/NO
10 YES/NO YES/NO YES/NO
11 YES/NO YES/NO YES/NO
12 YES/NO YES/NO YES/NO
13 YES/NO YES/NO YES/NO
14 YES/NO YES/NO YES/NO
15 YES/NO YES/NO YES/NO
16 YES/NO YES/NO YES/NO
17 YES/NO YES/NO YES/NO
18 YES/NO YES/NO YES/NO
19 YES/NO YES/NO YES/NO
20 YES/NO YES/NO YES/NO
21 YES/NO YES/NO YES/NO
22 YES/NO YES/NO YES/NO
23 YES/NO YES/NO YES/NO

134
24 YES/NO YES/NO YES/NO
25 YES/NO YES/NO YES/NO
Scheduled Statement Made Between Subtests YES NO
3. Pictorial Categories Subtest
ITEM ITEM
ADMINISTERED
STATEMENT
SCHEDULED
STATEMENT
MADE
1 YES/NO YES/NO YES/NO
2 YES/NO YES/NO YES/NO
3 YES/NO YES/NO YES/NO
4 YES/NO YES/NO YES/NO
5 YES/NO YES/NO YES/NO
6 YES/NO YES/NO YES/NO
7 YES/NO YES/NO YES/NO
8 YES/NO YES/NO YES/NO
9 YES/NO YES/NO YES/NO
10 YES/NO YES/NO YES/NO
11 YES/NO YES/NO YES/NO
12 YES/NO YES/NO YES/NO
13 YES/NO YES/NO YES/NO
14 YES/NO YES/NO YES/NO
15 YES/NO YES/NO YES/NO

135
16 YES/NO YES/NO YES/NO
17 YES/NO YES/NO YES/NO
18 YES/NO YES/NO YES/NO
19 YES/NO YES/NO YES/NO
20 YES/NO YES/NO YES/NO
21 YES/NO YES/NO YES/NO
22 YES/NO YES/NO YES/NO
23 YES/NO YES/NO YES/NO
24 YES/NO YES/NO YES/NO
25 YES/NO YES/NO YES/NO
Scheduled Statement Made Between Subtests YES NO
4. Geometric Categories Subtest
ITEM ITEM
ADMINISTERED
STATEMENT
SCHEDULED
STATEMENT
MADE
1 YES/NO YES/NO YES/NO
2 YES/NO YES/NO YES/NO
3 YES/NO YES/NO YES/NO
4 YES/NO YES/NO YES/NO
5 YES/NO YES/NO YES/NO
6 YES/NO YES/NO YES/NO
7 YES/NO YES/NO YES/NO

136
8 YES/NO YES/NO YES/NO
9 YES/NO YES/NO YES/NO
10 YES/NO YES/NO YES/NO
11 YES/NO YES/NO YES/NO
12 YES/NO YES/NO YES/NO
13 YES/NO YES/NO YES/NO
14 YES/NO YES/NO YES/NO
15 YES/NO YES/NO YES/NO
16 YES/NO YES/NO YES/NO
17 YES/NO YES/NO YES/NO
18 YES/NO YES/NO YES/NO
19 YES/NO YES/NO YES/NO
20 YES/NO YES/NO YES/NO
21 YES/NO YES/NO YES/NO
22 YES/NO YES/NO YES/NO
23 YES/NO YES/NO YES/NO
24 YES/NO YES/NO YES/NO
25 YES/NO YES/NO YES/NO
Scheduled Statement Made Between Subtests YES NO
5. Pictorial Sequences Subtest
ITEM ITEM STATEMENT STATEMENT
137
ADMINISTERED SCHEDULED MADE
1 YES/NO YES/NO YES/NO
2 YES/NO YES/NO YES/NO
3 YES/NO YES/NO YES/NO
4 YES/NO YES/NO YES/NO
5 YES/NO YES/NO YES/NO
6 YES/NO YES/NO YES/NO
7 YES/NO YES/NO YES/NO
8 YES/NO YES/NO YES/NO
9 YES/NO YES/NO YES/NO
10 YES/NO YES/NO YES/NO
11 YES/NO YES/NO YES/NO
12 YES/NO YES/NO YES/NO
13 YES/NO YES/NO YES/NO
14 YES/NO YES/NO YES/NO
15 YES/NO YES/NO YES/NO
16 YES/NO YES/NO YES/NO
17 YES/NO YES/NO YES/NO
18 YES/NO YES/NO YES/NO
19 YES/NO YES/NO YES/NO
20 YES/NO YES/NO YES/NO
21 YES/NO YES/NO YES/NO
22 YES/NO YES/NO YES/NO

138
23 YES/NO YES/NO YES/NO
24 YES/NO YES/NO YES/NO
25 YES/NO YES/NO YES/NO
Scheduled Statement Made Between Subtests YES NO
6. Geometric Sequences Subtest
ITEM ITEM
ADMINISTERED
STATEMENT
SCHEDULED
STATEMENT
MADE
1 YES/NO YES/NO YES/NO
2 YES/NO YES/NO YES/NO
3 YES/NO YES/NO YES/NO
4 YES/NO YES/NO YES/NO
5 YES/NO YES/NO YES/NO
6 YES/NO YES/NO YES/NO
7 YES/NO YES/NO YES/NO
8 YES/NO YES/NO YES/NO
9 YES/NO YES/NO YES/NO
10 YES/NO YES/NO YES/NO
11 YES/NO YES/NO YES/NO
12 YES/NO YES/NO YES/NO
13 YES/NO YES/NO YES/NO
14 YES/NO YES/NO YES/NO

139
15 YES/NO YES/NO YES/NO
16 YES/NO YES/NO YES/NO
17 YES/NO YES/NO YES/NO
18 YES/NO YES/NO YES/NO
19 YES/NO YES/NO YES/NO
20 YES/NO YES/NO YES/NO
21 YES/NO YES/NO YES/NO
22 YES/NO YES/NO YES/NO
23 YES/NO YES/NO YES/NO
24 YES/NO YES/NO YES/NO
25 YES/NO YES/NO YES/NO
Standard CTONI-2 administration was maintained YES NO
Total Statements Scheduled Per Treatment Procedure
Total Statements Made Per Rater Observation

140
Treatment Integrity Rating Worksheet
Verbal Praise Condition
Participant # Selected at Random: ________
Rater: ______________________________
Date: _______________________________
Comprehensive Test of Nonverbal Intelligence – Second Edition
Standard Introduction Statement YES NO
1. Picture Analogies Subtest
ITEM ITEM
ADMINISTERED
STATEMENT
SCHEDULED
STATEMENT
MADE
1 YES/NO YES/NO YES/NO
2 YES/NO YES/NO YES/NO
3 YES/NO YES/NO YES/NO
4 YES/NO YES/NO YES/NO
5 YES/NO YES/NO YES/NO
6 YES/NO YES/NO YES/NO
7 YES/NO YES/NO YES/NO
8 YES/NO YES/NO YES/NO
9 YES/NO YES/NO YES/NO
10 YES/NO YES/NO YES/NO

141
11 YES/NO YES/NO YES/NO
12 YES/NO YES/NO YES/NO
13 YES/NO YES/NO YES/NO
14 YES/NO YES/NO YES/NO
15 YES/NO YES/NO YES/NO
16 YES/NO YES/NO YES/NO
17 YES/NO YES/NO YES/NO
18 YES/NO YES/NO YES/NO
19 YES/NO YES/NO YES/NO
20 YES/NO YES/NO YES/NO
21 YES/NO YES/NO YES/NO
22 YES/NO YES/NO YES/NO
23 YES/NO YES/NO YES/NO
24 YES/NO YES/NO YES/NO
25 YES/NO YES/NO YES/NO
Scheduled Statement Made Between Subtests YES NO
2. Geometric Analogies Subtest
ITEM ITEM
ADMINISTERED
STATEMENT
SCHEDULED
STATEMENT
MADE
1 YES/NO YES/NO YES/NO
2 YES/NO YES/NO YES/NO

142
3 YES/NO YES/NO YES/NO
4 YES/NO YES/NO YES/NO
5 YES/NO YES/NO YES/NO
6 YES/NO YES/NO YES/NO
7 YES/NO YES/NO YES/NO
8 YES/NO YES/NO YES/NO
9 YES/NO YES/NO YES/NO
10 YES/NO YES/NO YES/NO
11 YES/NO YES/NO YES/NO
12 YES/NO YES/NO YES/NO
13 YES/NO YES/NO YES/NO
14 YES/NO YES/NO YES/NO
15 YES/NO YES/NO YES/NO
16 YES/NO YES/NO YES/NO
17 YES/NO YES/NO YES/NO
18 YES/NO YES/NO YES/NO
19 YES/NO YES/NO YES/NO
20 YES/NO YES/NO YES/NO
21 YES/NO YES/NO YES/NO
22 YES/NO YES/NO YES/NO
23 YES/NO YES/NO YES/NO
24 YES/NO YES/NO YES/NO
25 YES/NO YES/NO YES/NO

143
Scheduled Statement Made Between Subtests YES NO
3. Pictorial Categories Subtest
ITEM ITEM
ADMINISTERED
STATEMENT
SCHEDULED
STATEMENT
MADE
1 YES/NO YES/NO YES/NO
2 YES/NO YES/NO YES/NO
3 YES/NO YES/NO YES/NO
4 YES/NO YES/NO YES/NO
5 YES/NO YES/NO YES/NO
6 YES/NO YES/NO YES/NO
7 YES/NO YES/NO YES/NO
8 YES/NO YES/NO YES/NO
9 YES/NO YES/NO YES/NO
10 YES/NO YES/NO YES/NO
11 YES/NO YES/NO YES/NO
12 YES/NO YES/NO YES/NO
13 YES/NO YES/NO YES/NO
14 YES/NO YES/NO YES/NO
15 YES/NO YES/NO YES/NO
16 YES/NO YES/NO YES/NO
17 YES/NO YES/NO YES/NO

144
18 YES/NO YES/NO YES/NO
19 YES/NO YES/NO YES/NO
20 YES/NO YES/NO YES/NO
21 YES/NO YES/NO YES/NO
22 YES/NO YES/NO YES/NO
23 YES/NO YES/NO YES/NO
24 YES/NO YES/NO YES/NO
25 YES/NO YES/NO YES/NO
Scheduled Statement Made Between Subtests YES NO
4. Geometric Categories Subtest
ITEM ITEM
ADMINISTERED
STATEMENT
SCHEDULED
STATEMENT
MADE
1 YES/NO YES/NO YES/NO
2 YES/NO YES/NO YES/NO
3 YES/NO YES/NO YES/NO
4 YES/NO YES/NO YES/NO
5 YES/NO YES/NO YES/NO
6 YES/NO YES/NO YES/NO
7 YES/NO YES/NO YES/NO
8 YES/NO YES/NO YES/NO
9 YES/NO YES/NO YES/NO

145
10 YES/NO YES/NO YES/NO
11 YES/NO YES/NO YES/NO
12 YES/NO YES/NO YES/NO
13 YES/NO YES/NO YES/NO
14 YES/NO YES/NO YES/NO
15 YES/NO YES/NO YES/NO
16 YES/NO YES/NO YES/NO
17 YES/NO YES/NO YES/NO
18 YES/NO YES/NO YES/NO
19 YES/NO YES/NO YES/NO
20 YES/NO YES/NO YES/NO
21 YES/NO YES/NO YES/NO
22 YES/NO YES/NO YES/NO
23 YES/NO YES/NO YES/NO
24 YES/NO YES/NO YES/NO
25 YES/NO YES/NO YES/NO
Scheduled Statement Made Between Subtests YES NO
5. Pictorial Sequences Subtest
ITEM ITEM
ADMINISTERED
STATEMENT
SCHEDULED
STATEMENT
MADE
1 YES/NO YES/NO YES/NO

146
2 YES/NO YES/NO YES/NO
3 YES/NO YES/NO YES/NO
4 YES/NO YES/NO YES/NO
5 YES/NO YES/NO YES/NO
6 YES/NO YES/NO YES/NO
7 YES/NO YES/NO YES/NO
8 YES/NO YES/NO YES/NO
9 YES/NO YES/NO YES/NO
10 YES/NO YES/NO YES/NO
11 YES/NO YES/NO YES/NO
12 YES/NO YES/NO YES/NO
13 YES/NO YES/NO YES/NO
14 YES/NO YES/NO YES/NO
15 YES/NO YES/NO YES/NO
16 YES/NO YES/NO YES/NO
17 YES/NO YES/NO YES/NO
18 YES/NO YES/NO YES/NO
19 YES/NO YES/NO YES/NO
20 YES/NO YES/NO YES/NO
21 YES/NO YES/NO YES/NO
22 YES/NO YES/NO YES/NO
23 YES/NO YES/NO YES/NO
24 YES/NO YES/NO YES/NO

147
25 YES/NO YES/NO YES/NO
Scheduled Statement Made Between Subtests YES NO
6. Geometric Sequences Subtest
ITEM ITEM
ADMINISTERED
STATEMENT
SCHEDULED
STATEMENT
MADE
1 YES/NO YES/NO YES/NO
2 YES/NO YES/NO YES/NO
3 YES/NO YES/NO YES/NO
4 YES/NO YES/NO YES/NO
5 YES/NO YES/NO YES/NO
6 YES/NO YES/NO YES/NO
7 YES/NO YES/NO YES/NO
8 YES/NO YES/NO YES/NO
9 YES/NO YES/NO YES/NO
10 YES/NO YES/NO YES/NO
11 YES/NO YES/NO YES/NO
12 YES/NO YES/NO YES/NO
13 YES/NO YES/NO YES/NO
14 YES/NO YES/NO YES/NO
15 YES/NO YES/NO YES/NO
16 YES/NO YES/NO YES/NO

148
17 YES/NO YES/NO YES/NO
18 YES/NO YES/NO YES/NO
19 YES/NO YES/NO YES/NO
20 YES/NO YES/NO YES/NO
21 YES/NO YES/NO YES/NO
22 YES/NO YES/NO YES/NO
23 YES/NO YES/NO YES/NO
24 YES/NO YES/NO YES/NO
25 YES/NO YES/NO YES/NO
Standard CTONI-2 administration was maintained
(except for Verbal Praise Treatment)
YES NO
Total Statements Scheduled Per Treatment Procedure
Total Statements Made Per Rater Observation

149
Treatment Integrity Rating Worksheet
Token Reinforcement Condition
Participant # Selected at Random: ________
Rater: ______________________________
Date: _______________________________
Comprehensive Test of Nonverbal Intelligence – Second Edition
Token Reinforcement Introduction Statement YES NO
1. Picture Analogies Subtest
ITEM ITEM
ADMINISTERED
TOKEN SCHEDULED TOKEN GIVEN/
STATEMENT MADE
1 YES/NO YES/NO YES/NO
2 YES/NO YES/NO YES/NO
3 YES/NO YES/NO YES/NO
4 YES/NO YES/NO YES/NO
5 YES/NO YES/NO YES/NO
6 YES/NO YES/NO YES/NO
7 YES/NO YES/NO YES/NO
8 YES/NO YES/NO YES/NO
9 YES/NO YES/NO YES/NO
10 YES/NO YES/NO YES/NO

150
11 YES/NO YES/NO YES/NO
12 YES/NO YES/NO YES/NO
13 YES/NO YES/NO YES/NO
14 YES/NO YES/NO YES/NO
15 YES/NO YES/NO YES/NO
16 YES/NO YES/NO YES/NO
17 YES/NO YES/NO YES/NO
18 YES/NO YES/NO YES/NO
19 YES/NO YES/NO YES/NO
20 YES/NO YES/NO YES/NO
21 YES/NO YES/NO YES/NO
22 YES/NO YES/NO YES/NO
23 YES/NO YES/NO YES/NO
24 YES/NO YES/NO YES/NO
25 YES/NO YES/NO YES/NO
Scheduled Token Given and Statement Made Between Subtests YES NO
2. Geometric Analogies Subtest
ITEM ITEM
ADMINISTERED
TOKEN
SCHEDULED
TOKEN GIVEN/
STATEMENT MADE
1 YES/NO YES/NO YES/NO
2 YES/NO YES/NO YES/NO

151
3 YES/NO YES/NO YES/NO
4 YES/NO YES/NO YES/NO
5 YES/NO YES/NO YES/NO
6 YES/NO YES/NO YES/NO
7 YES/NO YES/NO YES/NO
8 YES/NO YES/NO YES/NO
9 YES/NO YES/NO YES/NO
10 YES/NO YES/NO YES/NO
11 YES/NO YES/NO YES/NO
12 YES/NO YES/NO YES/NO
13 YES/NO YES/NO YES/NO
14 YES/NO YES/NO YES/NO
15 YES/NO YES/NO YES/NO
16 YES/NO YES/NO YES/NO
17 YES/NO YES/NO YES/NO
18 YES/NO YES/NO YES/NO
19 YES/NO YES/NO YES/NO
20 YES/NO YES/NO YES/NO
21 YES/NO YES/NO YES/NO
22 YES/NO YES/NO YES/NO
23 YES/NO YES/NO YES/NO
24 YES/NO YES/NO YES/NO
25 YES/NO YES/NO YES/NO

152
Scheduled Token Given and Statement Made Between Subtests YES NO
3. Pictorial Categories Subtest
ITEM ITEM
ADMINISTERED
TOKEN
SCHEDULED
TOKEN GIVEN/
STATEMENT MADE
1 YES/NO YES/NO YES/NO
2 YES/NO YES/NO YES/NO
3 YES/NO YES/NO YES/NO
4 YES/NO YES/NO YES/NO
5 YES/NO YES/NO YES/NO
6 YES/NO YES/NO YES/NO
7 YES/NO YES/NO YES/NO
8 YES/NO YES/NO YES/NO
9 YES/NO YES/NO YES/NO
10 YES/NO YES/NO YES/NO
11 YES/NO YES/NO YES/NO
12 YES/NO YES/NO YES/NO
13 YES/NO YES/NO YES/NO
14 YES/NO YES/NO YES/NO
15 YES/NO YES/NO YES/NO
16 YES/NO YES/NO YES/NO
17 YES/NO YES/NO YES/NO

153
18 YES/NO YES/NO YES/NO
19 YES/NO YES/NO YES/NO
20 YES/NO YES/NO YES/NO
21 YES/NO YES/NO YES/NO
22 YES/NO YES/NO YES/NO
23 YES/NO YES/NO YES/NO
24 YES/NO YES/NO YES/NO
25 YES/NO YES/NO YES/NO
Scheduled Token Given and Statement Made Between Subtests YES NO
4. Geometric Categories Subtest
ITEM ITEM
ADMINISTERED
TOKEN
SCHEDULED
TOKEN GIVEN/
STATEMENT MADE
1 YES/NO YES/NO YES/NO
2 YES/NO YES/NO YES/NO
3 YES/NO YES/NO YES/NO
4 YES/NO YES/NO YES/NO
5 YES/NO YES/NO YES/NO
6 YES/NO YES/NO YES/NO
7 YES/NO YES/NO YES/NO
8 YES/NO YES/NO YES/NO
9 YES/NO YES/NO YES/NO

154
10 YES/NO YES/NO YES/NO
11 YES/NO YES/NO YES/NO
12 YES/NO YES/NO YES/NO
13 YES/NO YES/NO YES/NO
14 YES/NO YES/NO YES/NO
15 YES/NO YES/NO YES/NO
16 YES/NO YES/NO YES/NO
17 YES/NO YES/NO YES/NO
18 YES/NO YES/NO YES/NO
19 YES/NO YES/NO YES/NO
20 YES/NO YES/NO YES/NO
21 YES/NO YES/NO YES/NO
22 YES/NO YES/NO YES/NO
23 YES/NO YES/NO YES/NO
24 YES/NO YES/NO YES/NO
25 YES/NO YES/NO YES/NO
Scheduled Token Given and Statement Made Between Subtests YES NO
5. Pictorial Sequences Subtest
ITEM ITEM
ADMINISTERED
TOKEN
SCHEDULED
TOKEN GIVEN/
STATEMENT MADE
1 YES/NO YES/NO YES/NO

155
2 YES/NO YES/NO YES/NO
3 YES/NO YES/NO YES/NO
4 YES/NO YES/NO YES/NO
5 YES/NO YES/NO YES/NO
6 YES/NO YES/NO YES/NO
7 YES/NO YES/NO YES/NO
8 YES/NO YES/NO YES/NO
9 YES/NO YES/NO YES/NO
10 YES/NO YES/NO YES/NO
11 YES/NO YES/NO YES/NO
12 YES/NO YES/NO YES/NO
13 YES/NO YES/NO YES/NO
14 YES/NO YES/NO YES/NO
15 YES/NO YES/NO YES/NO
16 YES/NO YES/NO YES/NO
17 YES/NO YES/NO YES/NO
18 YES/NO YES/NO YES/NO
19 YES/NO YES/NO YES/NO
20 YES/NO YES/NO YES/NO
21 YES/NO YES/NO YES/NO
22 YES/NO YES/NO YES/NO
23 YES/NO YES/NO YES/NO
24 YES/NO YES/NO YES/NO

156
25 YES/NO YES/NO YES/NO
Scheduled Token Given and Statement Made Between Subtests YES NO
6. Geometric Sequences Subtest
ITEM ITEM
ADMINISTERED
TOKEN
SCHEDULED
TOKEN GIVEN/
STATEMENT MADE
1 YES/NO YES/NO YES/NO
2 YES/NO YES/NO YES/NO
3 YES/NO YES/NO YES/NO
4 YES/NO YES/NO YES/NO
5 YES/NO YES/NO YES/NO
6 YES/NO YES/NO YES/NO
7 YES/NO YES/NO YES/NO
8 YES/NO YES/NO YES/NO
9 YES/NO YES/NO YES/NO
10 YES/NO YES/NO YES/NO
11 YES/NO YES/NO YES/NO
12 YES/NO YES/NO YES/NO
13 YES/NO YES/NO YES/NO
14 YES/NO YES/NO YES/NO
15 YES/NO YES/NO YES/NO
16 YES/NO YES/NO YES/NO

157
17 YES/NO YES/NO YES/NO
18 YES/NO YES/NO YES/NO
19 YES/NO YES/NO YES/NO
20 YES/NO YES/NO YES/NO
21 YES/NO YES/NO YES/NO
22 YES/NO YES/NO YES/NO
23 YES/NO YES/NO YES/NO
24 YES/NO YES/NO YES/NO
25 YES/NO YES/NO YES/NO
Standard CTONI-2 administration was maintained
(except for Token Reinforcement Treatment)
YES NO
Total Tokens/Statements Scheduled Per Treatment Procedure
Total Tokens Given/ Statements Made Per Rater Observation

158