the effects of noise exposure and musical training on
TRANSCRIPT

The effects of noise exposure and musical training on suprathreshold auditory processing
and speech perception in noise.
Ingrid Yeend a, b, c, *, Elizabeth Francis Beach b, c, Mridula Sharma a, c, Harvey Dillon b, c
a Department of Linguistics, Australian Hearing Hub, 16 University Avenue, Macquarie University, New South Wales, 2109, Australia
b The National Acoustic Laboratories, Australian Hearing Hub, 16 University Avenue, Macquarie University, New South Wales, 2109, Australia
c The HEARing CRC, 550 Swanston Street, Audiology, Hearing and Speech Sciences, the University of Melbourne, Victoria, 3010, Australia
Article accepted for publication in the journal Hearing Research on 13 July 2017 and made available online on 2 August 2017.
Highlights
First behavioural study on noise-induced cochlear synaptopathy in 30-60 year-olds
No direct link between noise exposure and ability to understand speech-in-noise
Extended high frequency hearing seems to play a role in speech-in-noise perception
Attention, working memory, and sentence closure skills affect listening in noise
Musical training associated with better temporal and spectral processing
Abstract
Recent animal research has shown that exposure to single episodes of intense noise causes
cochlear synaptopathy without affecting hearing thresholds. It has been suggested that the
same may occur in humans. If so, it is hypothesized that this would result in impaired
encoding of sound and lead to difficulties hearing at suprathreshold levels, particularly in

challenging listening environments. The primary aim of this study was to investigate the
effect of noise exposure on auditory processing, including the perception of speech in noise,
in adult humans. A secondary aim was to explore whether musical training might improve
some aspects of auditory processing and thus counteract or ameliorate any negative
impacts of noise exposure. In a sample of 122 participants (63 female) aged 30-57 years
with normal or near-normal hearing thresholds, we conducted audiometric tests, including
tympanometry, audiometry, acoustic reflexes, otoacoustic emissions and medial
olivocochlear responses. We also assessed temporal and spectral processing, by
determining thresholds for detection of amplitude modulation and temporal fine structure.
We assessed speech-in-noise perception, and conducted tests of attention, memory and
sentence closure. We also calculated participants’ accumulated lifetime noise exposure and
administered questionnaires to assess self-reported listening difficulty and musical training.
The results showed no clear link between participants’ lifetime noise exposure and
performance on any of the auditory processing or speech-in-noise tasks. Musical training
was associated with better performance on the auditory processing tasks, but not the on
the speech-in-noise perception tasks. The results indicate that sentence closure skills,
working memory, attention, extended high frequency hearing thresholds and medial
olivocochlear suppression strength are important factors that are related to the ability to
process speech in noise.
Keywords:
Auditory processing; Cochlear synaptopathy; Cognition; Hidden hearing loss; Lifetime noise exposure; Speech in noise

Abbreviations:
AM4, Amplitude Modulation at 4 Hz; AM90, Amplitude Modulation at 90 Hz; DSB, Digit Span Backwards; DSF, Digit Span Forward; DPOAE, Distortion Product Otoacoustic Emission; KBIT-2, Kaufman Brief Intelligence Test Second Edition; EHF, Extended High Frequency; ERBN,
Equivalent Rectangular Bandwidth (noise); FDR, False Discovery Rate; HF, High Frequency; IHC, Inner Hair Cell; LF, Low Frequency; LiSN-S, Listening in Spatialized Noise-Sentences High-Cue condition; MOCR, Medial-olivocochlear Reflex; NAL-DCT, National Acoustic Laboratories Dynamic Conversations Test; OHC, Outer Hair Cell; Pa2h, Pascal Squared Hours; RST, Reading Span Test; SPIN, Speech Perception In Noise; SSQ12, Short form of the Speech Spatial and Qualities of Hearing Scale; SR, Spontaneous Rate; TE, Test Ear; TEA, Test of Everyday Attention; TEN, Threshold-equalizing Noise; TEOAE, Transient Evoked Otoacoustic Emission; TFS1, Test of Temporal Fine Structure; TRT, Text Reception Threshold; TTS, Temporary Threshold Shift.
* Corresponding author.
Ingrid Yeend National Acoustic Laboratories Level 5, Australian Hearing Hub 16 University Avenue Macquarie University NSW 2109 Email address: [email protected]
1. Introduction
Interest in “hidden hearing loss”, a term first introduced by Schaette and McAlpine (2011),
has grown steadily in the past few years since it was shown in animals that one-off, short,
intense noise exposures inflicted irreversible damage to the synaptic connections between
the inner hair cells (IHCs) of the cochlea and high-threshold low-spontaneous rate (SR)
auditory nerve fibres (Kujawa and Liberman, 2009; Liberman and Liberman, 2015; Lin et al.,
2011). More recent work has suggested that the damage may not be irreversible and that
partial synaptic repair may occur following noise exposure, at least in guinea pigs (Liu et al.,
2012; Shi et al., 2016). In any case, because these noise exposures do not result in loss of
IHCs or damage to outer hair cells (OHCs), auditory detection thresholds are unaffected, but
the encoding of sound at suprathreshold levels is impaired. In noise-exposed humans, it is

predicted that this will manifest as difficulties processing speech in noise in the absence of
clinically elevated thresholds. It has also been suggested that noise-induced cochlear
synaptopathy might be responsible for presentations of tinnitus and hyperacusis in those
with otherwise clinically normal hearing thresholds (Paul et al., 2017; Schaette and
McAlpine, 2011). As yet it is unclear to what extent these animal findings translate to
humans, and the exact nature of any perceptual consequences of cochlear synaptopathy
has become the subject of intensive investigation (Le Prell and Clavier, 2017).
Even before hidden hearing loss was coined, several researchers had reported that prior to
the diagnosis of a clinical hearing loss, people with noise exposure may experience
suprathreshold hearing difficulties including impaired spectro-temporal processing (Stone et
al., 2008); poorer speech understanding in noise (Stephens et al., 2003), altered speech-
sound discrimination (Brattico et al., 2005), and impaired attention (Kujala et al., 2004).
More recently, researchers have sought to identify a direct link between perceptual
problems in humans and noise-induced loss of high-threshold auditory nerve fibres
(Bharadwaj et al., 2015; Plack et al., 2014; Zeng, 2015). Studies conducted at suprathreshold
levels suggest that noise-exposed individuals have reduced sensitivity to amplitude
modulation (Kumar et al., 2012) and temporal fine structure (Stone et al., 2008); reduced
amplitude of ABR wave I (Bramhall et al., 2016); poorer performance on speech-in-noise
tests (Hope et al., 2013; Suting, 2016); and reduced attentional control (Bressler et al.,
2017).
Despite these positive results suggesting that noise exposure is associated with
suprathreshold perceptual difficulties, two recent UK studies of young adults found that
neither symptoms of hidden hearing loss (Prendergast et al., 2016), nor tinnitus (Guest et
al., 2017) appear to vary systematically with noise exposure. It was anticipated that wave I

of the ABR would decrease in amplitude as noise exposure increased, however no
relationship between amplitude and noise exposure (Prendergast et al., 2017) or amplitude
and tinnitus (Guest et al., 2017) was demonstrated. These authors concluded that either
noise-induced synaptopathy was not a problem in their cohort, or their tests lacked
sufficient sensitivity. Further, they suggested that the effects of noise exposure may be
more obvious in older individuals. Here, we conducted a large-scale study focused on
listeners aged 30 to 57 years, on the assumption that people in this age range would be old
enough for noise exposure effects to be measurable, but young enough that aging effects
would be minimized – an important consideration since there is evidence that cochlear
synaptopathy also occurs as part of age-related hearing loss from around the age of 55-60
years (Sergeyenko et al., 2013; Viana et al., 2015).
The main aim of this study was to investigate the effect of noise exposure on auditory
processing skills: temporal and spectral processing, and speech-in-noise perception. We also
investigated cognitive abilities, working memory and attention, to control for non-auditory
processes that might also affect speech-in-noise performance. We hypothesized that adults
with more noise exposure would perform more poorly than those with less noise exposure
on a range of suprathreshold tasks.
A secondary aim was to explore the effect of experience with musical training on the
manifestation of hidden hearing loss. We expected that musical training would enhance
auditory processing skills, as has been demonstrated previously (Parbery-Clark et al., 2009;
Skoe and Kraus, 2012; Zendel and Alain, 2009), and yet we also expected that the noise
exposure concomitant with musical training and performance would impair auditory
processes. Thus, we included musicians with varying degrees of noise exposure to

investigate the interaction between the potentially negative effects of noise exposure and
the positive effects of musical training.
2. Methods
2.1. Ethics
This study complied with the National Statement on Ethical Conduct in Human Research and
was approved by the Australian Hearing and the Macquarie University Human Research
Ethics Committees. All participants gave informed consent and were paid $40 for their
participation.
2.2. Participants
Recruitment targeted adults from the general community aged between 30 and 60 years
with self-reported normal hearing. We included people from a wide range of backgrounds,
including those with and without a history of noise exposure, professional musicians and
non-musicians. We also recruited people who specifically reported difficulties hearing
speech in background noise.
Initially 151 adults enrolled in the study, which comprised two main components: an online
survey (see Supplementary Materials) and laboratory testing. All participants completed the
pre-appointment online survey, but 29 were excluded from the final sample either because
they did not attend the laboratory appointment (n = 13); were found to have hearing
outside the study inclusion criteria (n = 9; see Section 3.4); were speakers of a tonal
language (n = 3); learned English after school age (n = 3); or failed to complete any
laboratory tests (n = 1). This paper reports on the results of the remaining 122 participants
(63 female), aged 30-57 years (Mfemales = 44.7 years, SD = 6.1 years; Mfemales = 45.4 years, SD
= 6.6 years), who undertook laboratory testing.

2.3. Online Survey
Prior to participants attending the laboratory test session, Author 2 reviewed all survey
responses and clarified any uncertainties via face to face, email or telephone interview. The
survey included five sections covering questions about i) demographics; ii) hearing health;
iii) noise exposure; iv) listening ability and v) musical training and engagement. From the
survey responses, eight key data points were extracted as shown in Table 1.
Table 1. Participant characteristics extracted from the online survey
Participant characteristics
Measure
Age Years
Tinnitus 0/1 0: never or almost never/occasionally/sometimes/unsure; 1: frequently/always or almost always
Ototoxicity
0/1 0: no contact with chemicals such as solvents, paints, degreasers, jet fuels, gasoline or cleaning fluids at work/don’t know; 1: at least some contact
Loudness sensitivity 0/1 0: no sensitivity; 1: at least some sensitivity
Temporary Threshold Shift (TTS)
0/1 0: no recalled episodes following exposure to loud sound; 1: at least one recalled episode
Self-reported listening ability
Average SSQ-12 score (out of 10) Questions were from the short form of the Speech, Spatial and Qualities of Hearing scale (SSQ12; Noble et al., 2013).
Music training Noise exposure
Index of music training score The index was calculated using responses to questions on formal and informal music training from the Music Use (MUSE) questionnaire (Chin and Rickard, 2012) and reflects each participant’s highest level of music training obtained. Lifetime noise exposure (workplace + leisure) in log Pa2h Using questions adapted from online surveys previously developed by the research team (Beach et al., 2013b; Williams et al., 2015), respondents listed all jobs in which they had been exposed to noise, length of employment, percentage of time spent in noise, average hours per week, and use of hearing protection. They also estimated attendance at 12 known high-noise leisure activities during each decade of life, and use of hearing protection for each activity/time period. For each leisure activity average noise levels (LAeq) and typical durations were extracted from the NOISE database (Beach et al., 2013a) to calculate total leisure noise exposure (Pa2h). Total workplace noise exposure (Pa2h) was calculated using respondent’s duration estimates and a nominal noise value of 90 dB LAeq. Total lifetime noise exposure was adjusted for hearing protector use and a logarithmic transformation was applied, such that a 1-unit difference in the transformed variable corresponds to a change in exposure by a factor of 10.

2.4. Laboratory Test Session
A fixed order test battery (Table 2) including interview questions, audiometry, auditory
processing tasks and cognitive measures was administered in a sound-treated test room
which met minimum ambient noise level requirements (ISO 8253-1:2010). The laboratory
appointment lasted up to 3.5 hours and included two compulsory rest breaks. Seventy
percent of participants completed all tasks in a single visit, and the remainder attended over
two or more sessions. To minimize the possibility of experimenter bias, the audiologist
conducting the laboratory test session was blind to each participant’s survey answers at the
time of testing.
At the start of the appointment, participants answered questions covering risk factors for
hearing health, prior exposure to noise, use of potentially ototoxic medications and smoking
history; see Supplementary Materials. Otoscopy was performed to ensure that the external
ear was normal and ear canal clear of wax or debris.
Table 2 lists all items in the test battery, together with details of the stimuli and mode of
presentation. All tests, except for the audiogram, were administered at suprathreshold
levels, with the aim of activating high-threshold low-SR auditory nerve fibres (Furman et al.,
2013). As shown in the table, most stimuli were in the 3 – 4 kHz frequency region since this
is where noise damage in humans first becomes evident (ISO-1999, 2013), and where early
signs of synaptopathy were expected to be observed. The right ear was assigned as the test
ear (TE) for all monaurally administered tests except for seven participants who either had
slightly better left ear thresholds (n = 5); a rounded right-ear tympanometric peak (n = 1); or
a narrow but normal right external ear canal (n = 1).

Table 2. Details of test battery items: order of presentation, stimulus, mode of presentation and number of participants.
Presentation Order
Test Stimulus Presentation mode
Participants (n)
Audiometry
1 Tympanometry 226 kHz probe tone Monaural (TE & non-TE)
122
2 Acoustic Reflexes Ipsilateral 500 Hz and 1 kHz, contralateral 500 Hz, 1, 2 and 4 kHz
Monaural (TE & non-TE)
120
3 Audiogram 250 Hz to 12.5 kHz pure tones Monaural (TE & non-TE)
122
4 Threshold-equalizing noise (TEN)
3 and 4 kHz pure tones with TEN masking noise
Monaural (TE only)
122
5 Distortion Product Otoacoustic Emissions (DPOAE)
1 – 12 kHz (for f2) 8 points/octave 2f1-f2, f1 (65 dB SPL), f2 (55 dB SPL)
Binaural 122 (TE) 121 (non-TE)
6 Medial-olivocochlear reflex (MOCR) strength
Transient-evoked otoacoustic emission 50 dB SPL Shera chirp with contralateral 10 kHz low pass filtered broadband noise (60 dB SPL)
Monaural (TE only)
100
Auditory processing and speech-in-noise tasks 7 Listening in Spatialized Noise-
Sentences High-Cue condition (LiSN-S)
Target sentence (initially at 68 dB SPL) in competing speech (61 dB SPL), plus NAL-RP amplification
Binaural *
122
8 National Acoustic Laboratories Dynamic Conversations Test (NAL-DCT)
Monologues in competing conversational noise (72 dB SPL)
Binaural *
93
11 Temporal Fine Structure (TFS1) Complex tone with 400 Hz F0 and 4400 Hz centre frequency (75 dB SPL) with TEN masking noise (60 dB SPL/ERBN at 1 kHz)
Monaural (TE only) *
122
12 Amplitude Modulation (AM4 and AM90)
3.52 kHz carrier tone modulated at 4 and 90 Hz (75 dB SPL) with TEN masking noise (55 dB SPL/ ERBN at 1 kHz)
Monaural (TE only) *
121 (4 Hz) 122 (90 Hz)
Cognitive measures 9 Text Reception Threshold (TRT)
test Modified SPIN sentences Visual task 94
10 Kaufmann Brief Intelligence Test (KBIT-2)
Matrices (pattern recognition) Visual task 122
13 Test of Everyday Attention (TEA)
Elevator counting with Distraction (auditory selective attention) and Elevator counting with Reversal (attentional switching) (76 dB SPL)
Binaural (free field)
122 (S3) 116 (S5)
14 Digit Span Forward (DSF) and Digit Span Back (DSB)
Spoken digit sequences (76 dB SPL) Binaural (free field)
120
15 Reading Span Test (RST) Meaningful and non-meaningful sentences
Visual task 122
* presented via Sennheiser HD215 headphones

2.4.1. Audiometry.
In order to confirm participants’ report of normal or near-normal hearing and assess OHC
function, we administered four audiometric tests.
2.4.1.1. Hearing acuity
Hearing thresholds were measured in 2 dB steps using an Interacoustics AC40 audiometer
and Etymotic EAR 3A insert earphones for test frequencies 0.25, 0.5, 1, 2, 3, 4, 6 and 8 kHz,
and Sennheiser HDA 200 circumaural headphones for extended high frequencies 9, 10, 11.2
and 12.5 kHz, following a modified Hughson-Westlake procedure (Le Prell et al., 2013). Bone
conduction was measured for all frequencies where air conduction thresholds exceeded 20
dB HL. Average hearing threshold level was calculated for the TE and non-TE for three
frequency regions: low frequency (LF) 0.25 – 2 kHz, high frequency (HF) 3 – 6 kHz and
extended high frequency (EHF) 9 – 12.5 kHz.
2.4.1.2. Tympanometry
Tympanometry was performed using Interacoustics Titan IMP440 equipment. Tympanic
membrane compliance values greater than or equal to 0.3 ml with peak pressure in the
range -150 to +50 daPa were accepted as normal middle ear function (Clark et al., 2007).
Two participants had slightly reduced compliance for the non-TE, and four had compliance
greater than 2.0 ml (non-TE = 3, TE = 1), however all had present otoacoustic emissions and
met study hearing level criteria. Ipsilateral (500 Hz and 1 kHz) and contralateral (500 Hz, 1, 2
and 4 kHz) acoustic reflexes were measured in automatic mode at 0 daPa peak pressure. A
start level of 80 dB HL, stop level of 105 dB HL, and a threshold criteria of 0.02 ml were
used. The presence of 1 kHz reflexes was confirmed manually for both conditions (at 5dB
sensation level relative to the threshold obtained in automatic mode).

2.4.1.3. Distortion product otoacoustic emissions
Distortion product otoacoustic emissions (DPOAEs) were recorded using a Mimosa Acoustics
HearID Auditory Diagnostics System (software version 5.1.9) with an Etymotic ER10C sound
probe coupled to the ear with a disposable foam tip. A DPgram (amplitude vs. frequency)
was measured to match the audiometric test frequencies. An f2/f1 ratio of 1.25 was used at
intensity levels of f1 = 65 dB SPL and f2 = 55 dB SPL, which are clinically applicable for noise-
induced dysfunction (Dhar and Hall III, 2012). The amplitude (at f2) was exported and an
average HF DPOAE (3 – 6 kHz) and EHF DPOAE (9 – 12.5 kHz) value was calculated for the TE
and non-TE.
2.4.1.4. Medial-olivocochlear reflex
The medial-olivocochlear reflex (MOCR) indirectly assesses efferent auditory system
function (Dhar and Hall III, 2012) and the strength of each participants’ MOCR potentially
predicts susceptibility to NIHL and cochlear synaptopathy (Marshall et al., 2014). The MOCR
was measured and calculated using an automated research module as described in Marshall
et al. (2014). Transient-evoked otoacoustic emissions were recorded using the
manufacturer’s default protocol (TE50_B2000_N60; Mimosa Acoustics, 2014) and testing
continued until six quality trial pairs were achieved. Results were obtained for 82% of
participants (n = 100) and strength statistics for the 0.5-2.5 kHz band and the 0.5 – 6 kHz
wide band were recorded.
2.4.2. Auditory Processing tasks.
In order to assess the ability to encode sound and understand speech in noise, we
administered four auditory processing and two speech-in-noise tests.

2.4.2.1. Listening in Spatialized Noise-Sentences
Ability to understand speech in noise was tested using the high-cue condition (different
voices +/- 90 degrees) of the Australian version (2.202) of the Listening in Spatialized Noise-
Sentences (LiSN-S) test (Cameron et al., 2011). This condition was chosen because it
presents spatially separated background noise and target speech, the most realistic listening
scenario of the four LISN-S conditions (Glyde et al., 2013). To guarantee sufficient audibility,
maximum stimulation of high-threshold fibres and minimum stimulation of low-threshold
fibres, the prescribed gain amplifier which amplifies the signal according to the NAL-RP
prescription (Dillon, 2012) was applied for all participants, and an additional 6 dB overall
gain was applied via a Yamaha AX350 amplifier.
2.4.2.2. NAL Dynamic Conversations Test
A shortened form of the National Acoustic Laboratories Dynamic Conversations Test (NAL-
DCT), was also used to assess speech-in-noise understanding. The NAL-DCT is an on-the-go
speech comprehension task designed to assess real-world listening ability in background
noise (Best et al., 2016). Participants listened to six 4-minute monologues presented in
competing conversational noise. There was one practice monologue presented at a signal-
to-noise ratio (SNR) of -5 dB, followed by five test monologues presented at -7 dB SNR.
Before each monologue, participants familiarized themselves with a response sheet
containing 10 questions about the monologue. When the monologue commenced,
participants were instructed to provide written responses to each question. Scores for each
monologue were tallied with a maximum possible score of 50. Because this test was added
to the test battery after initial testing commenced, not every participant completed this task
(n = 93).

2.4.2.3. Temporal Fine Structure task
Sensitivity to the temporal fine structure of sound was assessed using the Temporal Fine
Structure task (TFS1) outlined in Moore and Sek (2009). Participants were given a 2-item
forced choice task, in which each item contained four 200 ms sound bursts. One item
contained four complex harmonic tones (HHHH), with a fundamental frequency of 400 Hz,
and the other contained a harmonic tone alternated with an inharmonic tone (HIHI), in
which the components had been shifted up by the same amount (initially set at 150 Hz).
The items were separated by an inter-stimulus interval of 300 ms. Participants were
instructed to choose the item in which the sound seemed to “fluctuate” (HIHI). Participants
completed a short practice session followed by one adaptive test run in which the final
‘threshold’ was automatically calculated as the geometric mean of the values of the
frequency shift of the components in the inharmonic tone in the last six of eight reversals
(Moore and Sek, 2009). Feedback (correct or incorrect) was provided on screen after each
trial. Those who were unable to complete the task at the first attempt (n = 21) were asked
to try again. Of these, 13 were unable to complete the task on the second attempt.
However, they all completed the modified 40-trial version of the test which yielded a d’
score which was converted to a threshold using the method described by Moore et al
(2009). Those with thresholds that fell well beyond the range of scores obtained by the rest
of the cohort (n = 8) were assigned a nominal threshold of 150 Hz.
2.4.2.4. Threshold-equalising Noise test
The threshold-equalising noise (TEN) test with ER-3A insert earphones (Moore et al., 2012)
was administered at 3 kHz and 4 kHz. In our version of the test participants were asked to
detect a 3 kHz or 4 kHz tone presented in TEN, at an elevated level. Presentation level for

the TEN was determined by asking participants to indicate on a loudness scale, with
categories ranging from 1 (very soft) up to 7 (uncomfortably loud), the level they judged to
be ‘Loud but OK’. For 3 kHz, this level ranged from 50 – 90 dB HL/ERBN (M = 70.57, SD =
8.75) and for 4 kHz, the level ranged from 40 – 90 dB HL/ERBN (M = 72.13, SD = 9.34). Test
tone detection thresholds for each frequency were then measured with a 1 dB final step
size. Not surprisingly, the wide variation in presentation levels acceptable to the participants
resulted in TEN thresholds increasing, on average, with the presentation level [r = 0.51, p <
0.001]. To remove the effect of presentation level, we subtracted from each threshold the
value calculated from the regression line of threshold vs. presentation level. These adjusted
TEN thresholds were then used for all further analyses.
2.4.2.5. Amplitude modulation task
Amplitude modulation detection thresholds were tested using a 3.5 kHz carrier tone
modulated sinusoidally at 4 Hz (AM4) and 90 Hz (AM90). The duration of AM4 was 750 ms
and the duration of AM90 was 500 ms, and these stimuli were centred in 1050 ms and 800
ms of TEN noise respectively. A 20 ms smooth cosine-square window was applied at the
beginning and end of the signal. For each modulation rate, participants completed a 3-
alternative forced choice 2-down 1-up adaptive procedure, delivered via Psychon software
((Kwon, 2012). The initial step size was 8 dB for the first two reversals, then 2 dB for the
remaining eight; the final result was the average of the last six reversals and onscreen
feedback (correct or incorrect) was provided after each trial. The first 72 participants were
asked to complete two test runs for each modulation rate. However, after confirming no
significant difference between the runs for 4 Hz modulation rate [t(71) = .17, p > 0.8]; and
90 Hz [t(71) = .83, p > 0.4], all remaining participants performed a single test run. One
participant was unable to complete the AM4 task and no result was obtained.

2.4.3. Cognitive measures.
In order to control for non-auditory processes that might also affect speech-in-noise
performance, we administered four cognitive tasks.
2.4.3.1. Text Reception Threshold test
The Text Reception Threshold (TRT) test was used to assess participants’ generalized or non-
auditory language skills. This adaptive task was designed as a visual analogue of speech-in-
noise testing and measures the participant’s ability to predict a sentence on the basis of
limited visual information (Zekveld et al., 2007). A total of 50 sentences (10 practice; 40 test)
from the Speech Perception In Noise test (Kalikow et al., 1977) were selected as stimuli,
some of which were modified slightly to reflect contemporary word usage. In each trial,
participants were presented with a sentence, in which each word appeared at 500 ms
intervals. The words were masked by a series of vertical bars, and participants were
required to read each word aloud. The degree of masking was decreased in trials following
an incorrect response and increased following correct responses, yielding a TRT for each
participant, i.e., the average percentage of unmasked text across the 40 test trials. The TRT
task was added to the test battery after initial testing commenced and as a result not all
participants completed this task (n = 94).
2.4.3.2. Kaufman Brief Intelligence Test
Nonverbal intelligence was assessed using the matrices subtest of the Kaufman Brief
Intelligence Test (KBIT-2; Kaufman and Kaufman, 2004). This multiple-choice test requires
participants to recognise a logical pattern within an incomplete picture matrix, and select
one option from four alternatives in order to complete the matrix. The test becomes

progressively more difficult, and continues until the participant makes four consecutive
errors or completes the final test item. A total raw score was recorded for each participant.
2.4.3.3. Test of Everyday Attention
Attention was assessed using three auditory subtests from the Test of Everyday Attention
(TEA Version A; Robertson et al., 1994). A modified version of subtest 2 ‘elevator counting’,
which assesses sustained attention, was used to familiarize each participant with the test
procedure. Selective attention was assessed using subtest 3 ‘elevator counting with
distraction’. This requires listeners to count a mid-pitch tone (500 Hz) while ignoring a
higher tone (600 Hz) in order to determine the floor at which an imagined elevator has
arrived. Attention switching was assessed using subtest 5 ‘elevator counting with reversal’,
which requires listeners to count a mid-pitch tone (500 Hz) while using a higher (600 Hz) and
lower tone (400 Hz) as cues to reverse-count as necessary to determine the floor at which
an elevator has arrived. Six participants were unable to complete subtest 5, which accounts
for missing data on this subtest (n = 6). For all remaining participants, the scores from
subtests 3 and 5 were averaged to create a single attention score.
2.4.3.4. Digit Span test
Attention, short-term memory and working memory were tested using the Digit Span
Forwards (DSF) and Digit Span Backwards (DSB) tests (Weschler, 2008a). The DSF task
requires participants to recall digits in the order they are presented while the DSB requires
the digits to be recalled in reverse. The string of digits to be recalled increases successively
over the course of the task, and testing ceased after two consecutive incorrect items. Two
participants failed to complete these tasks and no result was recorded.

2.4.3.5. Reading Span Test
Working memory was assessed using an Australian-English version of the Reading Span Test
(RST; Daneman and Carpenter, 1980) using the method described in Best et al., (2016).
Participants were required to read aloud sentences presented word by word on a screen
and say ‘yes’ or ‘no’ to indicate whether each sentence made sense. The sentences were
presented in blocks of three, four, five or six items, and at the end of each block,
participants were asked to recall the first or last word of each sentence in any order. For
each participant, the percentage of correct words recalled was recorded.
2.5. Statistical methods
The data were analyzed using Statistica (Statsoft, version 10). T-tests were conducted to test
for significant differences between hearing level and DPOAE amplitudes for the TE vs. the
non-TE, and for males vs. females. Independent t-tests were used to test whether males and
females differed in terms of age, education, noise exposure, music training, self-reported
listening ability and scores on the various test battery items. Mann Whitney U tests were
used to test for gender differences in loudness sensitivity, use of ototoxic chemicals and
medications, tinnitus, TTS, history of ear infections and smoking history. To determine if
there was a relationship between risk factors, such as age, gender, smoking, history of ear
infections, use of ototoxic chemicals and medications, TTS episodes and noise exposure, and
audiometric outcomes, Pearson or Spearman’s rank-order correlation coefficients were
calculated, as appropriate. Correlation coefficients were also calculated to examine whether
noise exposure and other predictor factors were related to speech-in-noise processing
(SSQ12, LiSN-S, NAL-DCT) and tests of auditory processing (TFS1, AM4 and AM90, TEN).
Multiple linear regression was then used to assess the relative contribution of each of the

various audiometric, auditory and cognitive factors on the auditory processing and speech-
in-noise measures. In order to correct for multiple comparisons we applied the false
discovery rate (FDR) method with a p-value of .05 and a q-value of .2; a rate which is said to
be appropriate for exploratory studies such as ours (McDonald, 2009).
3. Results
3.1. Education and background
Most participants (68%) held a university degree, 25% had a trade or technical qualification
and the remaining 7% had attended high school. Nonverbal intelligence scores ranged from
25 to 46 (M = 39.4, SD = 4.2). One participant was retired, four were not working and the
others worked in a variety of occupations: there were four community workers, 15
clerical/administrative officers, four labourers/machine operators, six technical or trade
workers, 10 managers, 66 professionals, eight students, and four engaged in full-time home
duties.
3.2. Noise exposure and musical training
There was a wide range of reported noise exposures ranging from 27 – 85,036 Pa2h (or 1.43
– 4.93 logPa2h) as shown in Figure 1. Thirty percent of participants reported no significant
work noise exposure, whereas 70% reported working in at least one high-noise occupation.
Seventy-five percent of participants reported at least some shooting noise exposure and
91% reported nightclub noise exposure during the course of their lifetime. Sixty-two percent
of participants reported at least some use of earplugs or earmuffs during high-noise leisure
and/or workplace activities.
INSERT FIGURE 1 HERE

One quarter (25%) had no musical training; 18% had some musical training (< 8 years); 40%
had substantial musical training (≥ eight years of training and completion of formal music
examinations); and 17% were working professionally as musicians. Participants’ index of
music training scores ranged from 0 – 10 out of a maximum possible score of 11.
3.3. Risk factors for hearing loss and symptoms of noise damage
The percentage of participants reporting risk factors for hearing loss, i.e., smoking, exposure
to ototoxic chemicals and medications, and history of ear infection; and symptoms of
hearing loss, i.e., tinnitus, loudness sensitivity and TTS is shown in Table 3.
Table 3 Percentage of participants reporting risk factors for hearing loss and symptoms of
noise damage.
Risk Factor Category Incidence %
Smoking history
Non smoker 62 Past smoker 31 Current smoker 7
Ototoxic chemicals
No contact 64 At least some contact 36
Ototoxic medications
No exposure 58 At least some exposure 31 High level exposure 11
Ear infections None reported 65 Past history (childhood or other)
32
Recently (within past three months)
3
Symptom Tinnitus Frequently /always or almost
always 15
Less frequently (i.e. never or
almost never / occasionally / sometimes / unsure)
85
Loudness sensitivity
No sensitivity 70 Yes, at least some sensitivity 30
TTS No recalled episodes 52 At least one recalled episode 48

Correlation coefficients were used to test whether various risk factors: age, gender,
smoking, history of ear infections, use of ototoxic chemicals and medications, TTS episodes
and noise exposure, were associated with LF, HF and EHF hearing thresholds, DPAOEs,
tinnitus, and loudness sensitivity. There were only five significant correlations. As expected,
age was correlated positively with HF [r = .25, p = .006] and EHF [r = .44, p < 0.001] hearing
thresholds, but negatively with tinnitus [r = -.233, p = .01] and HF DPOAE amplitude [r = -.25,
p = .006]. Tinnitus was correlated with TTS [rs = .29, p = .001] indicating that participants
who reported tinnitus were likely to also recall episodes of TTS following loud sound
exposures.
Importantly, the two noise-related risk factors, noise exposure and TTS, were not
significantly related to hearing thresholds or DPOAEs, suggesting little evidence of noise-
related OHC damage in this cohort.
3.4. Hearing thresholds and DPOAEs
Seventy-one percent of participants had normal hearing thresholds (less than or equal to 20
dB HL at 0.25 – 6 kHz); 21% had near to normal thresholds as defined by (Moore et al.,
2012), i.e., less than or equal to 25 dB HL up to 2 kHz; less than or equal to 30 dB HL at 3
kHz, less than or equal to 35 dB HL at 4 kHz; and less than or equal to 40 dB HL at 6 kHz. In
the remaining 8% of participants, there were only one or two thresholds outside these
criteria, so a decision was made to include them. There were no significant differences
between thresholds or DPOAEs for males and females, and all participants had clinically
symmetrical hearing with no more than a 10 dB threshold difference between the ears at
more than two adjacent standard octave frequencies (Besser et al., 2015).

Figure 2 shows the TE hearing threshold levels for the group. Participants’ average LF
thresholds (0.25 – 2 kHz) for the TE did not differ significantly from those of the non-TE.
However, there were small, but significant differences in TE and non-TE thresholds above 3
kHz. In the HF region (3-6 kHz), there was a 1.5 dB difference in threshold levels [t(121) = -
3.4, p = .0009] and in the EHF region, a 1.9 dB difference, [t(121) = -2.3, p= .02], with the TE
better than the non-TE in both cases. Similarly, there was a 1.5 dB difference in the TE and
non-TE HF DPOAE [t(121) = 2.8, p = .007].
INSERT FIGURE 2 HERE
Nine participants reported exposure to loud noise in the 24 hours before attending the
laboratory, and of these, seven did not wear hearing protection, however only one had
thresholds that fell outside the near to normal criteria (by 2dB at 3 kHz). Furthermore, the
average TE hearing threshold levels (LF, HF and EHF) and DPOAE amplitudes for this group
did not differ significantly from the other participants, and thus all were included in the
study.
3.5. Gender differences.
Gender was associated with loudness sensitivity, with females reporting a significantly
higher incidence of sensitivity to loud sounds [U = 1499, p = .02]. Females also reported
significantly higher levels of music training (Mfemales = 4.98; Mmales = 3.44), [t(120) = 2.96, p =
.004], and and significantly lower levels of exposure, in current and past employment, to
potentially ototoxic chemicals [U = 1204.5, p = .00006]. There were no significant gender
differences for age, education level, noise exposure, reported incidence of tinnitus, TTS, ear
infections, use of potentially ototoxic medications or smoking history. Neither were there
any significant gender differences for performance on any of the items in the test battery

except the nonverbal intelligence test, where females obtained significantly lower scores
than males (Mfemales = 38.4; Mmales = 40.4), [t(120) = -2.67, p = .009].
3.6. Effect of noise exposure on auditory processing.
Pearson correlation coefficients were calculated to examine whether noise exposure was
related to speech-in-noise processing (SSQ12, LiSN-S, NAL-DCT) or performance on tests of
auditory processing (TFS1, AM4 and AM90, TEN). There were no significant correlations
between noise exposure and any of these auditory processing or speech-in-noise measures
(see Supplementary Materials). To probe the effect of noise exposure further, we decided to
re-examine the data by taking a group-based approach. The rationale was that by
comparing cases with either very high- or very low-noise exposures, the impact of noise
exposure on auditory processing and/or speech-in-noise measures may be more evident.
First, we selected participants who reported attending nightclubs more than once a week
during at least one decade of their life (n = 11). This attendance pattern was selected
because it represents the type of noise exposure most similar to the synaptopathic exposure
imposed on mice by Kujawa and Liberman (2009). We compared these frequent nightclub
attendees with a group of participants who reported never having attended a nightclub
(n=11). We conducted a series of t-tests to determine any differences between the two
groups, but the only significant difference between the groups was in terms of their
nightclub noise exposure (Mfrequent nightclub exposure = 3.9; Mno nightclub exposure = 0), [t(20) = -39.66,
p = < .001].
Next, we compared two groups of 25 participants with no workplace noise exposure vs. the
highest levels of workplace noise exposure (excluding professional musicians). While
workplace exposure tends to be of lower intensity than nightclub noise, it occurs more

regularly and over a greater time period, and is potentially as damaging as shorter more
intense exposures, at least in mice (Fernandez et al., 2015). The groups differed only on
their exposure to ototoxic chemicals (Mhigh workplace noise = .12; Mno workplace noise= .76), [t(48) = -
5.84, p < .001]; HF thresholds (Mhigh workplace noise = 13.47; Mno workplace noise = 8.53), [t(48) = -
2.57, p = .013]; and exposure to workplace noise (Mhigh workplace noise = 3.04; Mno workplace noise =
0), [t(48) = -47.96, p < .001].
Finally, we compared 20 participants with the highest noise exposure, regardless of its
source vs. those with the lowest exposure. In this case the only significant differences
between the two groups was the level of musical training (Mlow lifetime noise exposure = 3.05; Mhigh
lifetime noise exposure = 5.55), [t(38) = -3.03, p < .004] and lifetime noise exposure (Mlow lifetime noise
exposure= 2.96; Mhigh lifetime noise exposure = 4.39), [t(38) = -12.83, p< .001], which was expected
given the number of professional musicians in our cohort.
3.7. Effect of other variables and auditory processes
Despite the lack of a relationship between noise exposure and performance on these
auditory processing and speech-in-noise tasks, there were several significant low-to-
moderate correlations with other predictor variables. As shown in Table 4, ototoxicity and
HF thresholds were positively correlated with TFS1 thresholds [rs otoxicity = .26, p = .004; rHF
thresholds = .23, p = .01], indicating that participants reporting more contact with ototoxic
chemicals and those with poorer HF hearing had higher (i.e., worse) TFS1 thresholds. Music
training and TEA scores were also significantly negatively correlated with TFS1 thresholds
[rmusic training = -.36, p < 0.001; rattention= -.23, p = .012] indicating that those with more music
training and higher attention scores demonstrated greater sensitivity to temporal fine
structure.

Age was positively correlated with AM90 [r = .22, p =.01] indicating that older participants
have poorer performance (higher thresholds) on this temporal processing task. Tinnitus,
TTS, music training, MOCR and TEA were all significantly negatively correlated with AM90 [rs
tinnitus = -.19, p = .04; rs TTS = -.24, p = .008; rmusic training = -.25, p = .005; rMOCR = -.26, p = .008; rTEA
= -.36, p <.001] indicating that participants who reported a higher incidence of tinnitus and
TTS and those with more musical training, stronger MOCR suppression and better
attentional skills had lower AM90 thresholds (i.e., better temporal processing).
MOCR strength and TEA was also negatively correlated with TEN tone thresholds [ rMOCR = -
0.27, p = .006; rTEA = -0.20, p = 0.02]] suggesting that those with higher MOCR suppression
strength and better attention are better able to detect tones in noise.

Table 4 Significant correlation coefficients and regressors for three auditory processing tasks.
Variable Mean SD TFS1 TEN AM90
r / rs b β r / rs b β r / rs b β
Age * 45.04 6.36 0.03 -0.45 -0.07 0.08 0.00 0.01 0.22 0.07 0.12
Tinnitus * 0.16 0.36 0.07 6.21 0.05 -0.11 -0.80 -0.13 -0.19 -1.62 -0.15
Ototoxicity * 0.36 0.48 0.26 11.82 0.14 0.02 -0.26 -0.05 0.17 0.47 0.06
Loudness sensitivity
0.30 0.46 0.00 -0.07 0.02
TTS * 0.48 0.50 0.07 10.18 0.12 0.06 0.62 0.13 -0.24 -1.06 -0.14
Music training * 4.24 2.97 -0.36 -4.24 -0.30 -0.15 -0.11 -0.14 -0.25 -0.15 -0.11
LF hearing 6.09 4.57 0.16 0.06 -0.08
HF hearing * 9.86 7.40 0.22 0.98 0.17 0.06 -0.01 -0.03 -0.01 -0.07 -0.13
EHF hearing 22.66 17.93 0.11 -0.05 0.16
MOCR * 40.98 10.52 -0.14 -0.32 -0.08 -0.27 -0.06 -0.28 -0.26 -0.09 -0.25
Attention (TEA) * 7.97 2.03 -0.23 -1.82 -0.09 -0.20 -0.15 -0.13 -0.36 -0.51 -0.26
Attention/Memory (DS)
10.28 1.96 0.06 -0.04 -0.04
Working memory (RST)
49.04 10.85 -0.08 -0.06 -0.05
Noise exposure 3.76 0.50 -0.11 -0.17 -0.08
Note: There were no significant results for the AM4 tasks and therefore results for this test have not been included. Results highlighted in bold are significant when controlling the FDR at level .2; * indicates predictor variables that are correlated with at least one auditory processing task.
To examine the relative effects of each of these predictor variables on auditory processing
performance, we tested three regression models, one for each of TFS1, TEN and AM90. We
included the eight predictor variables that correlated significantly with at least one of the
auditory processes (marked with * in Table 4). For TFS1, the regression showed that when
all other variables were held steady, music training was the only predictor significantly
associated with lower (better) TFS1 thresholds. This model accounted for 24% of the
variation [R2 = .24, F(8,91) = 3.54, p < .001]. For the AM90 model, MOCR and TEA were the

two significant predictors, indicating that stronger MOCR scores and better attention scores
were associated with lower (better) AM90 thresholds, and this model was also significant
accounting for 29% of the variation [R2 = .29, F(8,91) = 4.64, p < .001]. For TEN, MOCR
strength and TEA were significantly associated with a lower (better) threshold elevation,
although this model was not significant [R2 = .14, F(8,91) = 1.88, p < 0.007].
3.8. Speech-in-noise measures
In our final analysis, we examined the relationship between the various predictor variables
and speech-in-noise measures, again using Pearson correlations and multiple linear
regression. The significant results are shown in bold in Table 5. The correlation coefficients
showed that MOCR strength, TEN and RST were positively correlated with SSQ12 [rMOCR =
.29, p = .003; rRST = .20, p = .02] indicating that participants with higher MOCR strength and
higher working memory had higher self-rated listening ability. Conversely, age, EHF and TEN
thresholds were negatively correlated with SSQ12 [rage = -.19, p = .04; rEHF thresholds = -.21, p =
.02; rTEN = -0.19, p = 0.04] indicating that older people and those with poorer EHF and TEN
thresholds had lower self-reported listening ability.
Age, LF, HF and EHF thresholds, TFS1 and AM4 were all positively correlated with LiSN-S
[rage = .32, p < 0.001; rLF thresholds = 0.27, p = .003; rHF thresholds = .33, p < .001; rEHF thresholds= .38, p
< .001; rTFS1 = .25, p =.005; rAM4 = .20, p = .03] indicating that participants with increasing age
and ototoxic contact, poorer hearing thresholds, and poorer performances on TFS1 and
AM4 performed more poorly on this speech-in-noise task. TEA and RST were both negatively
correlated with LiSN-S [rTEA = -.20, p = .03; rRST =- .24, p < .009] indicating that participants
with better attention and working memory achieved lower (i.e., better) scores on this
speech-in-noise task.

TEA and RST were also positively correlated with NAL-DCT passage scores [rTEA = .23, p = .03;
rRST = .40, p < .001] indicating that those with better attention and working memory
performed better on this real-world listening task. Age, EHF thresholds, TFS1 and TRT
thresholds were negatively correlated with the NAL-DCT [rage = -.30, p = .004; rEHF thresholds = -
.37, p < .001; rTFS1= -0.27, p = .009; rTRT = -.47, p < .001] indicating that older participants with
poorer EHF hearing, and higher (worse) TFS1 and TRT thresholds performed more poorly
when undertaking this real-world listening task.

Table 5 Correlation coefficients and regressors for three speech-in-noise measures
Variable Mean SD SSQ12 LiSN-S NAL-DCT
r / rs b β r / rs b β r / rs b β
Age * -0.19 -0.02 -0.08 0.32 0.07 0.15 -0.30 -0.11 -0.10
Tinnitus 0.05 0.03 -0.02
Ototoxicity -0.16 0.16 0.03
Loudness sensitivity
-0.12 -0.04 0.08
TTS 0.06 0.00 0.13
Music training 0.14 -0.06 0.07
LF hearing * -0.01 0.02 0.07 0.27 0.05 0.09 -0.20 -0.07 -0.04
HF hearing * -0.18 -0.02 -0.08 0.33 0.06 0.16 -0.15 0.04 0.04
EHF hearing * -0.21 -0.01 -0.09 0.38 0.03 0.21 -0.37 -0.10 -0.26
MOCR * 0.29 0.03 0.19 0.07 0.05 0.17 -0.05 -0.09 -0.13
Attention (TEA) * 0.07 -0.06 -0.08 -0.20 -0.03 -0.02 0.23 0.12 0.03
Attention/ Memory (DS)
0.10 -0.18 0.11
Working memory (RST) *
0.20 0.03 0.23 -0.24 -0.03 -0.12 0.40 0.12 0.24
Noise exposure -0.10 0.01 0.05
TRT * 59.86 2.96 -0.03 0.05 0.10 0.15 0.04 0.04 -0.47 -0.78 -0.31
TFS1 * 54.48 41.73 -0.09 0.00 -0.02 0.25 0.01 0.14 -0.27 -0.03 -0.19
AM4 * -24.61 3.83 -0.03 0.03 0.07 0.20 0.10 0.14 -0.06 0.10 0.05
AM90 * -24.02 3.91 -0.18 -0.05 -0.15 0.14 0.00 -0.00 -0.19 -0.10 -0.05
TEN 0.003 2.34 -0.19 -0.09 -0.14 0.06 0.05 0.04 -0.01 0.11 0.04
Results highlighted in bold are significant when controlling the FDR at .2; * indicates predictor variables that correlated with at least one speech-in-noise measure.
We hypothesized that the performance on the auditory processing tasks would be related to
the three speech-in-noise measures so these were added to the regression model together
with the eight predictor variables that correlated significantly with the speech-in-noise
measures. These are marked with * in Table 5 and the significant results are shown in bold.
Despite the LISN-S model accounting for 32% of the variance [R2 = .32, F(12,63) = 2.43, p <
.01], there were no significant regressors indicating that none of the variables significantly
predicted the LiSN-S score. For the SSQ12 model, only 19% of the variance was accounted
for [R2 = .19, F(12,63) = 1.27, p < .26], and the only regressor that approached significance
was RST [β = .23, t(63) = 1.89, p =.06], suggesting that higher working memory scores were

associated with better self-reported listening after taking into account the effect of all the
other variables. In the NAL-DCT model, which accounted for 44% of the total variance [R2 =
.44, F(12,63) = 4.1 p < .0001], RST was significant [β = .24,t(63) = 2.37, p = .02], indicating
that higher working memory scores were associated with higher scores on the NAL-DCT,
after taking into account the effect of all the other variables. EHF thresholds and TRT were
also significant [β = -.26, t(63) = -2.13, p = .04; β = -.31, t(63) = -3.02, p = .004], indicating
that when other variables were held constant, better EHF hearing and TRT scores were
associated with higher scores on the NAL-DCT. The regression weight for TFS1 threshold
approached significance [β = -.19, t(63) = -1.78, p =.08], suggesting that better sensitivity to
temporal fine structure may also be associated with better real-world speech-in-noise
listening.
4. Discussion
The present study set out to examine the effect of noise exposure on auditory processes
and speech-in-noise performance. In other words, we sought to determine if there is a
direct link between noise exposure and perceptual problems in humans. It was
hypothesized that, due to noise-induced loss of synaptic connections between cochlea IHCs
and high threshold low-SR auditory nerve fibres, auditory processing skills would be
compromised in normal-hearing noise-exposed adults and they would exhibit difficulty
processing speech in noise, even though they would ‘pass’ a standard hearing test.
However, the results did not support the research hypothesis – there was no evidence of
the anticipated effect of noise exposure on auditory processing, nor on the ability to
understand speech in noise. This was the case regardless of whether we analysed our data
as ‘continuous’ or compared discrete groups of low- and high-noise exposure cases.

4.1. Differences between animal and human research
There are several possible explanations for this finding. First, it may be that humans, like
guinea pigs, have a greater capacity for synaptic repair than the CBA/CaJ mice strain in
which noise-induced neural degeneration was first observed (Kujawa and Liberman, 2009;
Liberman and Liberman, 2015). Recent guinea pig studies (Liu et al., 2012; Shi et al., 2016)
showed that, in addition to synaptic degeneration, partial synaptic repair also occurs
following high-noise exposure, and this process of repair may be one reason why noise-
induced damage in humans seems to be more highly variable than in mice. Comparative
studies of the synaptic structures in humans and rodents show that, while largely similar,
there are also important differences, which are related to greater plasticity in humans. For
example, a study of excitatory synaptic structures in the cortex of humans and mice showed
that while there is considerable overlap in the protein components of the post-synaptic
terminals of both species, humans have a greater abundance of proteins associated with
neural plasticity (Bayés et al., 2012). Similarly, a study of synaptic protein development in
the visual cortex of rats and humans showed that human synapses follow a slower
developmental time course and exhibit greater plasticity since there is more inter-individual
variability in human synaptic proteins when compared to rats (Pinto et al., 2015). Although
these findings relate to cortical synapses, they suggest a greater overall propensity for
plasticity in human synapses, which might translate to an increased likelihood of successful
synaptic repair in humans following noise damage. This might account, at least to some
extent, for our inability to replicate the animal findings.
A second potential difference between animal and human auditory systems that might have
contributed to our results relates to the time course of cell death following cochlear
synaptopathy. The animal studies suggest that synaptopathy occurs during high-noise

exposures but spiral ganglion cell death is not evident until 12 months later, and continues
to occur up to two years post-exposure (Kujawa and Liberman, 2009; Liberman and
Liberman, 2015). If this timeframe is translated to the human lifespan, then we might expect
that cell death will occur gradually from time of initial exposure until mid-late adulthood.
During this time, as long as the spiral ganglion cell remains viable, some degree of synaptic
repair may yet occur, and there may also be additional noise exposures which could disrupt
repair processes. The presumed extended timeframe for cell death in humans, variation in
human patterns of noise exposure, and their greater inter-individual synaptic variation
(Pinto et al., 2015) means there is more scope for synaptic repair to vary between humans,
and this might explain the high level of individual variation observed in our study cohort and
other noise-exposed samples (e.g., Hope et al., 2013).
A third factor that may have affected our results is related to genetic and anatomic
differences between humans. These factors are well controlled in animal studies, in which
researchers select particular strains that are specially bred to minimize genetic and
anatomic variation. In contrast, large and diverse groups of humans, such as the one
described here, include a vast array of genetic and anatomic variation between participants.
Dobie and Humes (2017) have suggested that humans are less susceptible to TTS and argue
that they are therefore less likely to sustain noise-induced cochlear synaptopathy than
rodents. There is also evidence that certain individuals may be more or less genetically
susceptible to damage from noise exposure/s than others (Abreu-Silva et al., 2011; Kowalski
et al., 2014; Yang et al., 2016; Zhang et al., 2014). Furthermore, there may be interactive
effects between genetic susceptibility and environmental factors, such as exposure to
ototoxic agents. Anatomical differences in ear canal length and cochlear morphology may
also affect one’s susceptibility to noise damage. These inter-individual differences are likely

to result in outcomes that are highly variable across individual humans, as we and others
have found (Bharadwaj et al., 2015; Ruggles et al., 2014; Swaminathan et al., 2015).
Large variations in people’s noise exposure is another relevant factor that distinguishes
human research from the earlier mammalian work. In the animal studies, the noise
exposure dose and age at which it occurred was carefully controlled, a situation not possible
in human research. Indeed, our participants reported a wide range of noise exposures of
varying intensity and duration, occurring at various stages of life. All but 11 participants
reported attending nightclubs at least occasionally, which means that nearly all had likely
been exposed to a noise dose very similar to the 2-hour 98 – 100 dB SPL doses used in the
animal studies. Dobie and Humes (2017) argued that very high levels of exposure are likely
to be required to induce synaptopathy in humans, however if the animal results were
directly translatable to humans (in regard to both the damage mechanisms and the noise
dose needed to cause damage), then we would assume that 111 of our participants had
sustained at least a degree of cochlear synaptopathy. However, because we cannot be sure
whether the impact of additional repeated noise exposures is incremental or additive, and
given the possibility of synaptic repair during the extended time course of cell death, it is
not possible to predict the degree of synaptopathy in each participant on the basis of
lifetime noise history alone. It is therefore perhaps not surprising that we found no clear
relationship between accumulated noise exposure and auditory perception.
Despite the fact that reported lifetime noise exposure was not a significant predictor of
auditory processing deficits, other notable results have emerged, which have implications
for our understanding of how the human auditory system processes speech in noise, and
the interplay between peripheral and central mechanisms.

4.2. Incoming signal vs. noise suppression.
Our results demonstrated that those with superior skills in detecting amplitude modulation
and fine differences in the temporal features of sound perform better on speech-in-noise
tasks, consistent with encoding of timing information being important for processing speech
in background noise (Paul et al., 2017). However, our data also provide evidence that the
ability to suppress noise, not just detect an incoming signal, is also crucial to effective
listening. Our MOCR test, revealed that those with a lower strength score reported
experiencing more overall listening difficulty. Those with lower MOCR strength also
performed more poorly on two of the auditory processes: AM90 and the TEN test, both of
which involved detecting a tone in noise. While the full extent of the mechanisms and
function of the olivocochlear system are still being clarified (Froud et al., 2015), our findings
are consistent with previous research which suggests that the medial-olivocochlear
pathway plays a role in detection and discrimination of sounds in noise (Garinis et al., 2011;
Guinan Jr, 2006) and in mediating attention (Harkrider and Bowers, 2009; Srinivasan et al.,
2014). It may also be that the involvement of efferent centrally driven processes that
suppress noise and/or enhance incoming signals in accordance with cognitive and
attentional processes may play a greater role in human sound perception than in animals
(Wittekindt et al., 2014). Individual differences in such processes might interact with any
noise-induced effects on the peripheral system, and make any relationships between noise
exposure and auditory perception less apparent.
4.3. Attention and working memory.
The results obtained here support the notion that working memory and attention are
central to the ability to understand speech in noise (Ingvalson et al., 2015; Keidser et al.,

2015). Scores on the RST, which assesses working memory by simultaneously testing storage
capacity and processing of information (Daneman and Carpenter, 1980; Ronnberg et al.,
1989) were a significant predictor of speech-in-noise scores and participants’ estimates of
listening ability. The significant correlations, albeit weak, between RST and the LiSN-S task
and between attention and the auditory process (TFS1, TEN and AM90) and speech-in-noise
measures (LiSN-S and NAL-DCT) reinforce the notion that working memory and attention
are crucial factors in speech-in-noise perception. This finding is consistent with numerous
studies which report a link between speech-in-noise perception and working memory and
attention for those with documented noise exposure (Bressler et al., 2017; Hope et al.,
2013; Suting, 2016) and those from the general population (Anderson et al., 2013; Füllgrabe
et al., 2014; Gordon-Salant and Cole, 2016; Mattys et al., 2012; Silbert and Motlagh Zadeh,
2015; Wild et al., 2012).
4.4. Extended high frequency hearing.
Previous research has suggested that damage from noise exposure may first become
apparent in the EHF region not routinely included in clinical assessments (Le Prell et al.,
2013; Mehrparvar et al., 2011; Somma et al., 2008; Sulaiman et al., 2014). Although we did
not find a relationship between noise exposure and EHF thresholds, we did find that
elevated EHF thresholds were related to poorer speech-in-noise performance (LiSN-S and
NAL-DCT) and greater self-reported listening difficulty (SSQ12). These findings imply that
EHF thresholds, whether or not they are elevated as a result of noise exposure, may be an
early indicator of an impaired auditory system. Indeed several recent studies support this
conclusion. Badri et al. (2011) reported that normal hearers who performed poorly on a
speech-in-noise task had elevated thresholds at 12.5 and 14 kHz; Prendergast et al. (2017)
reported that normal-hearing young female adults with greater cumulative noise exposure

had poorer sensitivity at 16 kHz compared to those with less exposure; and Liberman et al.
(2016) also found that normal-hearing young adults with self-reported high-noise risk had
elevated thresholds at 10-16 kHz. Interestingly, evidence from animal research shows that
8-week old mice (but not 16-week-old mice) exposed to a single 98 dB SPL noise episode
exhibit permanent threshold shift and loss of OHCs at high frequencies (Liberman and
Liberman, 2015). In humans, these ages equate approximately with adolescence and early
adulthood respectively, thus it may be that humans who sustain noise exposure while
teenagers might be expected to have poorer HF and EHF thresholds than those first exposed
at a later age. Taken together, these findings suggest that elevated EHF thresholds are an
early indicator that subclinical damage has occurred and it may be prudent to test
thresholds at some or all of these frequencies for patients who present with speech-in-noise
difficulties or suspected noise damage (Rodríguez Valiente et al., 2016).
4.5. Sentence closure skills.
Interestingly, performance on the TRT test, which is a visual language task, was a significant
predictor of performance on the NAL-DCT. The fact that those who were better at a
challenging real world listening task were also better at a challenging visual reading task
suggests that under adverse conditions perceptual abilities in the auditory and visual
domains may depend at least in part on a common system (Anaya et al., 2016). Our results
are consistent with previous research linking auditory and visual language perception
(Zekveld et al., 2007) and indicate that generalised sentence closure skills or an ability to ‘fill
in the gaps’ is an influential factor for understanding real-world speech in noise. The larger
regression coefficient obtained for the TRT task (β=-.31) suggests that sentence closure is
more important than working memory and attention, at least for the NAL-DCT task, and

further implies that this test may be a useful tool for predicting real-world speech-in-noise
performance (Besser et al., 2015; Zekveld et al., 2013).
4.6. Musical training.
Musical training has previously been found to provide listeners with enhanced auditory
processing skills (Strait and Kraus, 2014), enhanced ability to understand speech in noise
(Anaya et al., 2016; Parbery-Clark et al., 2009), and stronger neurophysiological responses to
sound (Parbery-Clark et al., 2012). While we demonstrated that participants with more
musical training were better at the TFS and AM processing tasks, we did not find that
musicians were better at either of the speech-in-noise tests (see Supplementary Materials).
This suggests that while musical training does seem to provide listeners with some form of
advantage when processing tones in noise, there are clearly other factors that play a role
when perceiving more complex signals such as speech in noise.
4.7. Study limitations and future directions.
There are a number of methodological factors which may have affected the results of this
study, and these should be considered when interpreting the findings. Firstly, for our main
analyses, we measured noise exposure as a continuous variable, which is in contrast to
other laboratories who have reported on results from two discrete groups, one low-noise
and high-noise (e.g., Liberman et al., 2016). However, even when we selected and compared
disparate groups from within our cohort, there were no significant differences in the
performance of the groups. As with other similar retrospective studies, because the
calculation of lifetime noise exposure involves recall of past events and inherent difficulties
estimating the contribution of impulse noise exposure (Honeth et al., 2015; Nakashima and

Hu, 2007), there is necessarily a degree of uncertainty in the noise exposure metrics. With
regards to our test battery, although care was taken to minimize the duration of the various
tasks, the large number of test items may have resulted in fatigue and a reduction in
performance for some participants. Our chosen method of correcting for multiple
comparisons means that some positive results may have been falsely identified. Although
the approach taken is appropriate given the exploratory nature of this study, it does mean
that the significant results should be interpreted with caution, at least until they have been
replicated by other researchers. Our speech-in-noise measures were complex in order to
mimic real-world conditions and increase ecological validity. However, more simplistic
phoneme- or syllable-based tasks may have produced different results. Finally, it might be
that the use of more objective measures of auditory processing, that are less susceptible to
attentional and cognitive processes, would have yielded alternative results. To this end, a
subset of participants from this study has completed a related electrophysiological study
that examined auditory responses at the brainstem and cortical level. Analysis of these
results will shed further light on the effect of noise exposure and musical training on the
human auditory system.
4.8. Conclusion
This study is one of several that have tried to test the hypothesis that there is a link between
noise-induced cochlear synaptopathy and auditory difficulties in humans. To date there
have been mixed results, and it is becoming clear that replicating the results reported for
animal models in a human cohort is challenging and may not even be possible. Although we
found no clear relationship between noise exposure and auditory perception, our results

point to the fact that understanding speech in noise is a multifaceted and complex task that
is susceptible to a wide range of peripheral and central factors. Working memory, attention,
generalized language skills and EHF hearing all appear to be critical elements in determining
performance in challenging listening environments. Our results do not rule out the existence
of noise-induced cochlear synaptopathy, nor do they imply that it has no detrimental
effects, but at least in this large and diverse group of individuals, there was no clear
evidence of noise-induced cochlear synaptopathy, and noise exposure was not significantly
related to auditory processing or speech-in-noise performance.
Acknowledgements
The authors thank Jermy Pang for data collection, and Mark Seeto for advice on statistical
analysis. This work was funded by the National Health and Medical Research Council
[APP1063905,2013]; and the Hearing Industry Research Consortium. This work was also
supported by the HEARing CRC, established and supported under the Cooperative Research
Centres Program – Business Australia. IY was supported by an Australian Government
Research Training Program Scholarship. The authors declare no competing financial
interests.

References
Abreu-Silva, R.S., Rincon, D., Horimoto, A.R.V.R., Sguillar, A.P., Ricardo, L.A.C., Kimura, L., Batissoco, A.C., Auricchio, M.T.B.D.M., Otto, P.A., Mingroni-Netto, R.C. 2011. The search of a genetic basis for noise-induced hearing loss (NIHL). Annals of Human Biology 38, 210-218. doi:10.3109/03014460.2010.513774
Anaya, E.M., Pisoni, D.B., Kronenberger, W.G. 2016. Long-term musical experience and auditory and visual perceptual abilities under adverse conditions. Acoustical Society of America, 2074-2081. doi:dx/doi.org/10.1121/1.462628
Anderson, S., White-Schwoch, T., Parbery-Clark, A., Kraus, N. 2013. A dynamic auditory-cognitive system supports speech-in-noise perception in older adults. Hearing Research 300, 18-32. doi:10.1016/j.heares.2013.03.006
Badri, R., Siegel, J.H., Wright, B.A. 2011. Auditory filter shapes and high-frequency hearing in adults who have impaired speech in noise performance despite clinically normal audiograms. The Journal of the Acoustical Society of America 129, 852-863. doi:10.1121/1.3523476
Bayés, À., Collins, M.O., Croning, M.D.R., van de Lagemaat, L.N., Choudhary, J.S., Grant, S.G.N. 2012. Comparative Study of Human and Mouse Postsynaptic Proteomes Finds High Compositional Conservation and Abundance Differences for Key Synaptic Proteins. PLOS ONE 7, e46683. doi:10.1371/journal.pone.0046683
Beach, E.F., Gilliver, M., Williams, W. 2013a. The NOISE (Non-Occupational Incidents, Situations and Events) Database: A new research tool. Annals of Leisure Research 16, 149-159. doi:10.1080/11745398.2013.793157
Beach, E.F., Gilliver, M., Williams, W. 2013b. Sound Check Australia: A citizen science approach to noise & hearing conservation research. Paper presented at the National Hearing Conservation Association Conference.
Besser, J., Festen, J.M., Goverts, S.T., Kramer, S.E., Pichora-Fuller, K.M. 2015. Speech-in-Speech Listening on the LiSN-S Test by Older Adults With Good Audiograms Depends on Cognition and Hearing Acuity at High Frequencies. Ear and Hearing 36, 24-41. doi:10.1097/AUD.0000000000000096
Best, V., Keidser, G., Freeston, K., Buchholz, J.M. 2016. A Dynamic Speech Comprehension Test for Assessing Real-World Listening Ability. Journal of the American Academy of Audiology 27, 515-526. doi:10.3766/jaaa.15089
Bharadwaj, H.M., Masud, S., Mehraei, G., Verhulst, S., Shinn-Cunningham, B.G. 2015. Individual differences reveal correlates of hidden hearing deficits. The Journal of Neuroscience : the official journal of the Society for Neuroscience 35, 2161-2172. doi:10.1523/JNEUROSCI.3915-14.2015
Bramhall, N.F., Konrad-Martin, D., McMillan, G.P., Griest, S.E. 2016. Auditory Brainstem Response Altered in Humans With Noise Exposure Despite Normal Outer Hair Cell Function. Ear and Hearing, e1-e12. doi:10.1097/AUD.0000000000000370
Brattico, E., Kujala, T., Tervaniemi, M., Alku, P., Ambrosi, L., Monitillo, V. 2005. Long-term exposure to occupational noise alters the cortical organization of sound processing. Clinical Neurophysiology 116, 190-203. doi:10.1016/j.clinph.2004.07.030
Bressler, S., Goldberg, H., Shinn-Cunningham, B. 2017. Sensory coding and cognitive processing of sound in Veterans with blast exposure. Hearing Research 349, 98-110. doi:10.1016/j.heares.2016.10.018
Cameron, S., Glyde, H., Dillon, H. 2011. Listening in Spatialized NoiseSentences Test (LiSN-S): Normative and Retest Reliability Data for Adolescents and Adults up to 60 Years of Age. Journal of the American Academy of Audiology 22, 697-709.
Chin, T., Rickard, N.S. 2012. The Music USE (MUSE) Questionnaire: An Instrument to Measure Engagement in Music. Music Perception 29, 429-446. doi:10.1525/mp.2012.29.4.429

Clark, J.L., Roeser, R.J., Mendrygal, M. 2007. Middle Ear Measures. In: Roeser, R.J., Valente, M., Hosford-Dunn, H., (Eds.), Audiology Diagnosis, Second ed. Thieme, New York Stuttgart. pp. 380-399.
Daneman, M., Carpenter, P.A. 1980. Individual Differences in Working Memory and Reading. Journal of Verbal Learning and Verbal Behavior 19, 450-66.
Dhar, S., Hall III, J.W. 2012. Otoacoustic Emissions: Principles, Procedures and Protocols Plural, San Diego, Calif.
Dillon, H. 2012. Hearing Aids 2nd ed. Sydney : Boomerang Press : New York : Thieme distributor. Dobie, R.A., Humes, L.E. 2017. Commentary on the regulatory implications of noise-induced cochlear
neuropathy. International Journal of Audiology 56:sup1, 74-78. doi:10.1080/14992027.2016.1255359
Fernandez, K.A., Jeffers, P.W.C., Lall, K., Liberman, M.C., Kujawa, S.G. 2015. Aging after noise exposure: acceleration of cochlear synaptopathy in "recovered" ears. The Journal of neuroscience : the official journal of the Society for Neuroscience 35, 7509-7520. doi:10.1523/JNEUROSCI.5138-14.2015
Froud, K.E., Wong, A.C.Y., Cederholm, J.M.E., Klugmann, M., Sandow, S.L., Julien, J.-P., Ryan, A.F., Housley, G.D. 2015. Type II spiral ganglion afferent neurons drive medial olivocochlear reflex suppression of the cochlear amplifier. Nature Communications 6:7115. doi:10.1038/ncomms8115
Füllgrabe, C., Moore, B.C.J., Stone, M.A. 2014. Age-group differences in speech identification despite matched audiometrically normal hearing: contributions from auditory temporal processing and cognition. Frontiers in Aging Neuroscience 6:347. doi:10.3389/fnagi.2014.00347
Furman, A.C., Kujawa, S.G., Liberman, M.C. 2013. Noise-induced cochlear neuropathy is selective for fibers with low spontaneous rates. J. Neurophysiol. 110, 577-86.
Garinis, A.C., Glattke, T., Cone, B.K. 2011. The MOC Reflex during Active Listening to Speech. Journal of Speech, Language, and Hearing Research 54, 1464-1476. doi:10.1044/1092-4388(2011/10-0223)
Glyde, H., Cameron, S., Dillon, H., Hickson, L., Seeto, M. 2013. The effects of hearing impairment and aging on spatial processing. Ear and Hearing 34, 15-28. doi:10.1097/AUD.0b013e3182617f94
Gordon-Salant, S., Cole, S.S. 2016. Effects of Age and Working Memory Capacity on Speech Recognition Performance in Noise Among Listeners With Normal Hearing. Ear and Hearing 37, 593-602. doi:10.1097/AUD.0000000000000316
Guest, H., Munro, K.J., Prendergast, G., Howe, S., Plack, C.J. 2017. Tinnitus with a normal audiogram: Relation to noise exposure but no evidence for cochlear synaptopathy. Hearing Research 344, 265-274. doi:10.1016/j.heares.2016.12.002
Guinan Jr, J.J. 2006. Olivocochlear Efferents: Anatomy, Physiology, Function, and the Measurement of Efferent Effects in Humans. Ear and Hearing 27, 589-607. doi:10.1097/01.aud.0000240507.83072.e7
Harkrider, A.W., Bowers, C.D. 2009. Evidence for a cortically mediated release from inhibition in the human cochlea.(Report). Journal of the American Academy of Audiology 20, 208-215.
Honeth, L., Ström, P., Ploner, A., Bagger-Sjöbäck, D., Rosenhall, U., Nyrén, O. 2015. Shooting history and presence of high-frequency hearing impairment in swedish hunters: A cross-sectional internet-based observational study. Noise and Health 17, 273-281. doi:10.4103/1463-1741.165043
Hope, A.J., Luxon, L.M., Bamiou, D.E. 2013. Effects of chronic noise exposure on speech-in-noise perception in the presence of normal audiometry. The Journal of Laryngology and Otology 127, 233-238. doi:10.1017/S002221511200299X
Ingvalson, E.M., Dhar, S., Wong, P.C.M., Liu, H. 2015. Working memory training to improve speech perception in noise across languages. The Journal of the Acoustical Society of America 137, 3477-3486. doi:10.1121/1.4921601
ISO-1999. 2013. Acoustics - Estimation of noise-induced hearing loss International Organisation for Standardization, Geneva.

ISO-8253-1. 2010. Acoustics - Audiometric test methods - Part1: Pure-tone air and bone conduction audiometry International Organisation for Standardization, Geneva.
Kalikow, D.N., Stevens, K.N., Elliott, L.L. 1977. Development of a test of speech intelligibility in noise using sentence materials with controlled word predictability. The Journal of the Acoustical Society of America 61, 1337-1351.
Kaufman, A.S., Kaufman, N.L. 2004. Kaufman Brief Intelligence Test manual Second Edition, 5-20. Keidser, G., Best, V., Freeston, K., Boyce, A. 2015. Cognitive spare capacity: evaluation data and its
association with comprehension of dynamic conversations. Frontiers in Psychology 6:597. doi:10.3389/fpsyg.2015.00597
Kowalski, T.J., Pawelczyk, M., Rajkowska, E., Dudarewicz, A., Sliwinska-Kowalska, M. 2014. Genetic Variants of CDH23 Associated With Noise-Induced Hearing Loss. Otology & Neurotology 35, 358-365. doi:10.1097/MAO.0b013e3182a00332
Kujala, T., Shtyrov, Y., Winkler, I., Saher, M., Tervaniemi, M., Sallinen, M., Teder‐sälejärvi, W., Alho, K., Reinikainen, K., Näätänen, R. 2004. Long‐term exposure to noise impairs cortical sound processing and attention control. Psychophysiology 41, 875-881. doi:10.1111/j.1469-8986.2004.00244.x
Kujawa, S.G., Liberman, M.C. 2009. Adding insult to injury: cochlear nerve degeneration after "temporary" noise-induced hearing loss. The Journal of Neuroscience : the official journal of the Society for Neuroscience 29, 14077-14085. doi:10.1523/JNEUROSCI.2845-09.2009
Kumar, A.U., Ameenudin, S., Sangamanatha, A.V. 2012. Temporal and speech processing skills in normal hearing individuals exposed to occupational noise. Noise and Health 14, 100-105. doi:10.4103/1463-1741.97252
Kwon, B. 2012. AUX: A scripting language for auditory signal processing and software packages for psychoacoustic experiments and education. Behavior Research Methods 44, 361-373. doi:10.3758/s13428-011-0161-1
Le Prell, C.G., Clavier, O.H. 2017. Effects of noise on speech recognition: Challenges for communication by service members. Hearing Research 349, 76-89. doi:10.1016/j.heares.2016.10.004
Le Prell, C.G., Spankovich, C., Lobariñas, E., Griffiths, S.K. 2013. Extended high-frequency thresholds in college students: Effects of music player use and other recreational noise. Journal of the American Academy of Audiology 24, 725-739. doi:10.3766/jaaa.24.8.9
Liberman, L.D., Liberman, M.C. 2015. Dynamics of cochlear synaptopathy after acoustic overexposure. Journal of the Association for Research in Otolaryngology 16, 205-219. doi:10.1007/s10162-015-0510-3
Liberman, M.C., Epstein, M.J., Cleveland, S.S., Wang, H., Maison, S.F. 2016. Toward a Differential Diagnosis of Hidden Hearing Loss in Humans. PloS One 11, e0162726. doi:10.1371/journal.pone.0162726
Lin, H.W., Furman, A.C., Kujawa, S.G., Liberman, M.C. 2011. Primary Neural Degeneration in the Guinea Pig Cochlea After Reversible Noise-Induced Threshold Shift. Journal of the Association for Research in Otolaryngology 12, 605-616. doi:10.1007/s10162-011-0277-0
Liu, L., Wang, H., Shi, L., Almuklass, A., He, T., Aiken, S., Bance, M., Yin, S., Wang, J. 2012. Silent Damage of Noise on Cochlear Afferent Innervation in Guinea Pigs and the Impact on Temporal Processing (Noise Damage on Cochlear Temporal Processing) 7, e49550. doi:10.1371/journal.pone.0049550
Marshall, L., Lapsley Miller, J.A., Guinan, J.J., Shera, C.A., Reed, C.M., Perez, Z.D., Delhorne, L.A., Boege, P. 2014. Otoacoustic-emission-based medial-olivocochlear reflex assays for humans. The Journal of the Acoustical Society of America 136, 2697-2713. doi:10.1121/1.4896745
Mattys, S.L., Davis, M.H., Bradlow, A.R., Scott, S.K. 2012. Speech recognition in adverse conditions: A review. Language and Cognitive Processes 27, 953-978. doi:10.1080/01690965.2012.705006
McDonald, J.H. 2009. Handbook of biological statistics Sparky House Publishing, Baltimore, MD.

Mehrparvar, A.H., Mirmohammadi, S.J., Ghoreyshi, A., Mollasadeghi, A., Loukzadeh, Z. 2011. High-frequency audiometry: A means for early diagnosis of noise-induced hearing loss. Noise and Health 13, 402-406. doi:10.4103/1463-1741.90295
Mimosa Acoustics. 2014. MOCR User Manual Help Version 1.0. Moore, B.C.J., Sek, A. 2009. Development of a fast method for determining sensitivity to temporal
fine structure. International Journal of Audiology, 2009, Vol.48(4), p.161-171 48, 161-171. doi:10.1080/14992020802475235
Moore, B.C.J., Creeke, S., Glasberg, B.R., Stone, M.A., Sek, A. 2012. A version of the TEN Test for use with ER-3A insert earphones. Ear and Hearing 33, 554-557. doi:10.1097/AUD.0b013e31824b9e43
Nakashima, A., Hu, Y. 2007. Impulse noise exposure during personal weapons testing on an outdoor shooting range. Canadian Acoustics 35, 192-193.
Noble, W., Jensen, N.S., Naylor, G., Bhullar, N., Akeroyd, M.A. 2013. A short form of the Speech, Spatial and Qualities of Hearing scale suitable for clinical use: The SSQ12. International Journal of Audiology, 2013, 2013, Vol.52(6), p.409-412 52, 409-412. doi:10.3109/14992027.2013.781278
Parbery-Clark, A., Skoe, E., Lam, C., Kraus, N. 2009. Musician enhancement for speech-in-noise. Ear and Hearing 30, 653-661.
Parbery-Clark, A., Tierney, A., Strait, D.L., Kraus, N. 2012. Musicians have fine-tuned neural distinction of speech syllables.(Report). Neuroscience 219, 111-119.
Paul, B.T., Bruce, I.C., Roberts, L.E. 2017. Evidence that hidden hearing loss underlies amplitude modulation encoding deficits in individuals with and without tinnitus. Hearing Research 344, 170-182. doi:10.1016/j.heares.2016.11.010
Pinto, J.G.A., Jones, D.G., Williams, C.K., Murphy, K.M. 2015. Characterizing synaptic protein development in human visual cortex enables alignment of synaptic age with rat visual cortex. Frontiers in Neural Circuits 9. doi:10.3389/fncir.2015.00003
Plack, C.J., Barker, D., Prendergast, G. 2014. Perceptual consequences of "hidden" hearing loss. Trends in hearing 18, 1-11. doi:10.1177/2331216514550621
Prendergast, G., Guest, H., Léger, A., Munro, K., Kluk, K., Plack, C. 2016. Evidence that hidden hearing loss does not vary systematically as a function of noise exposure in young adults with normal audiometric hearing. Journal of the Acoustical Society of America 139, 2122-2122. doi:10.1121/1.4950316
Prendergast, G., Guest, H., Munro, K.J., Kluk, K., Léger, A., Hall, D.A., Heinz, M.G., Plack, C.J. 2017. Effects of noise exposure on young adults with normal audiograms I: Electrophysiology. Hearing Research 344, 68-81. doi:10.1016/j.heares.2016.10.028
Robertson, I.H., Ward, T., Ridgeway, V., Nimmo-Smith, I. 1994. The Test of Everday Attention Manual.
Rodríguez Valiente, A., Roldán Fidalgo, A., Villarreal, I.M., García Berrocal, J.R. 2016. Extended High-frequency Audiometry (9000–20 000 Hz). Usefulness in Audiological Diagnosis. Acta Otorrinolaringologica (English Edition) 67, 40-44. doi:10.1016/j.otoeng.2015.02.001
Ronnberg, J., Arlinger, S., Lyxell, B., Kinnefors, C. 1989. Visual Evoked Potentials: Relation to Adult Speechreading and Cognitive Function. Journal of Speech Language and Hearing Research 32, 725-735. doi:10.1044/jshr.3204.725
Ruggles, D.R., Freyman, R.L., Oxenham, A.J. 2014. Influence of musical training on understanding voiced and whispered speech in noise. PloS One 9, e86980. doi:10.1371/journal.pone.0086980
Schaette, R., McAlpine, D. 2011. Tinnitus with a normal audiogram: physiological evidence for hidden hearing loss and computational model. The Journal of Neuroscience : the official journal of the Society for Neuroscience 31, 13452-13457. doi:10.1523/JNEUROSCI.2156-11.2011
Sergeyenko, Y., Lall, K., Liberman, M.C., Kujawa, S.G. 2013. Age-related cochlear synaptopathy: an early-onset contributor to auditory functional decline. The Journal of Neuroscience : the
official journal of the Society for Neuroscience 33, 13686-13694. doi:10.1523/JNEUROSCI.1783-13.2013
Shi, L., Chang, Y., Li, X., Aiken, S.J., Liu, L., Wang, J. 2016. Coding Deficits in Noise-Induced Hidden Hearing Loss May Stem from Incomplete Repair of Ribbon Synapses in the Cochlea. Frontiers in Neuroscience 10. doi:10.3389/fnins.2016.00231
Silbert, N., Motlagh Zadeh, L. 2015. Listener characteristics and the perception of speech in noise. The Journal of the Acoustical Society of America 138, 1812-1812. doi:10.1121/1.4933754
Skoe, E., Kraus, N. 2012. A Little Goes a Long Way: How the Adult Brain Is Shaped by Musical Training in Childhood. The Journal of Neuroscience 32, 11507-11510. doi:10.1523/JNEUROSCI.1949-12.2012
Somma, G., Pietroiusti, A., Magrini, A., Coppeta, L., Ancona, C., Gardi, S., Messina, M., Bergamaschi, A. 2008. Extended high‐frequency audiometry and noise induced hearing loss in cement workers. American Journal of Industrial Medicine 51, 452-462. doi:10.1002/ajim.20580
Srinivasan, S., Keil, A., Stratis, K., Osborne, A.F., Cerwonka, C., Wong, J., Rieger, B.L., Polcz, V., Smith, D.W. 2014. Interaural attention modulates outer hair cell function. European Journal of Neuroscience 40, 3785-3792. doi:10.1111/ejn.12746
Stephens, D., Zhao, F., Kennedy, V. 2003. Is there an association between noise exposure and King Kopetzky Syndrome? Noise and Health 5, 55-62.
Stone, M.A., Moore, B.C.J., Greenish, H. 2008. Discrimination of envelope statistics reveals evidence of sub-clinical hearing damage in a noise-exposed population with ‘normal’hearing thresholds. International Journal of Audiology 47, 737-750.
Strait, D.L., Kraus, N. 2014. Biological impact of auditory expertise across the life span: Musicians as a model of auditory learning. Hearing Research 308, 109-121. doi:10.1016/j.heares.2013.08.004
Sulaiman, A.H., Husain, R., Seluakumaran, K. 2014. Evaluation of early hearing damage in personal listening device users using extended high-frequency audiometry and otoacoustic emissions. and Head & Neck 271, 1463-1470. doi:10.1007/s00405-013-2612-z
Suting, L.B. 2016. Impact of long-term occupation-related experience on speech perception in noise. Unpublished Masters Thesis, Austin, Texas, USA.
Swaminathan, J., Mason, C.R., Streeter, T.M., Best, V., Kidd Jr, G., Patel, A.D. 2015. Musical training, individual differences and the cocktail party problem. Nature Scientific reports. doi:10.1038/srep11628
Viana, L.M., O'Malley, J.T., Burgess, B.J., Jones, D.D., Oliveira, C.A.C.P., Santos, F., Merchant, S.N., Liberman, L., Liberman, M.C. 2015. Cochlear neuropathy in human presbycusis: Confocal analysis of hidden hearing loss in post-mortem tissue. Hearing Research 327, 78-88. doi:10.1016/j.heares.2015.04.014
Weschler, D. 2008a. Wechsler Adult Intelligence Scale - Fourth Edition. San Antonio, TX:Pearson. Wild, C.J., Yusuf, A., Wilson, D.E., Peelle, J.E., Davis, M.H., Johnsrude, I.S. 2012. Effortful listening: the
processing of degraded speech depends critically on attention. Journal of Neuroscience 32, 14010-21. doi:10.1523/JNEUROSCI.1528-12.2012
Williams, W., Carter, L., Seeto, M. 2015. Pure tone hearing thresholds and leisure noise: Is there a relationship? Noise and Health 17, 358-363. doi:10.4103/1463-1741.165066
Wittekindt, A., Kaiser, J., Abel, C. 2014. Attentional Modulation of the Inner Ear: A Combined Otoacoustic Emission and EEC Study. Journal of Neuroscience 34, 9995-10002. doi:10.1523/JNEUROSCI.4861-13.2014
Yang, Q., Xu, X., Jiao, J., Zheng, Y., He, L., Yu, S., Gu, G., Chen, G., Zhou, W., Wu, H., Li, Y., Zhang, H., Zhang, Z. 2016. Genetic variation in EYA4 on the risk of noise-induced hearing loss in Chinese steelworks firm sample. Occupational and Environmental Medicine 73, 823-828. doi:10.1136/oemed-2016-103613
Zekveld, A.A., George, E.L.J., Houtgast, T., Kramer, S.E. 2013. Cognitive abilities relate to self-reported hearing disability. Journal of Speech, Language, and Hearing Research 56, 1364-1372.

Zekveld, A.A., George, E.L.J., Kramer, S.E., Goverts, S.T., Houtgast, T. 2007. The Development of the Text Reception Threshold Test: A Visual Analogue of the Speech Reception Threshold Test. Journal of Speech, Language, and Hearing Research 50, 576-584. doi:10.1044/1092-4388(2007/040)
Zendel, B.R., Alain, C. 2009. Concurrent sound segregation is enhanced in musicians. Journal of Cognitive Neuroscience 21, 1488-1498.
Zeng, F.-G. 2015. Uncovering Hidden Hearing Loss. The Hearing Journal 68, 6-6. doi:10.1097/01.HJ.0000459741.56134.79
Zhang, X., Liu, Y., Zhang, L., Yang, Z., Shao, Y., Jiang, C., Wang, Q., Fang, X., Xu, Y., Wang, H., Zhang, S., Zhu, Y. 2014. Genetic variations in protocadherin 15 and their interactions with noise exposure associated with noise-induced hearing loss in Chinese population. Environmental Research 135, 247-252. doi:10.1016/j.envres.2014.09.021

Fig. 1. Participants’ estimated lifetime noise exposure as a function of age.
Fig. 2. Participants’ hearing thresholds from 0.25 to 12.5 kHz in the test ear.

Supplementary Materials
Online Early Indicators of Noise Injury Survey
Welcome to the NAL Survey on Hearing, Noise, and Music. This survey is in five parts
and will take you around 20-30 minutes to complete:
1. About You
2. Your Hearing
3. Listening and Hearing
4. Your Noise Exposure
5. You and Music
Please complete all questions as accurately as you can. In the Your Noise Exposure section, you will be
asked to estimate your participation in various activities throughout your lifetime. We understand that no-
one has a perfect memory but please give your best estimate.
Be assured that your personal information and any data collected as part of the research project will be
treated as strictly confidential. Any data released or referred to in scientific reports or publications will be
de-identified and contain no personal information. NAL will not release your personal information either
verbally or in writing to any individual or outside agency without your written consent.
ABOUT YOU
Are you
( ) Female ( ) Male ( ) Indeterminate/intersex/unspecified
How old are you?
Do you speak a language other than English?
( ) No, English only
( ) Yes, Italian
( ) Yes, Greek
( ) Yes, Cantonese
( ) Yes, Arabic
( ) Yes, Vietnamese
( ) Yes, Mandarin
( ) Yes, other (please specify):
What is the postcode of the suburb you live in?
What is the highest level of education that you have completed?
( ) Primary school
( ) Secondary school up to Year 10 (or equivalent)
( ) Secondary school up to Year 12 (or equivalent)
( ) Trade or technical qualification
( ) Undergraduate university degree
( ) Postgraduate university degree
Select the option that best describes your current job
( ) Community/personal worker
( ) Clerical/administrative worker
( ) Labourer
( ) Machinery operator/driver
( ) Manager
( ) Professional

( ) Sales worker
( ) Technician/trade worker
( ) Student
( ) Full time home duties
( ) Retired
( ) Currently not working
If you are studying and/or working, please select as many options as appropriate to describe
your current arrangements. If not, please select 'Not applicable'.
( ) Working full-time
( ) Working part-time
( ) Studying full-time
( ) Studying part-time
( ) Not applicable - I am not working or studying right now
In your current or past jobs, have you been in contact with chemicals such as solvents, paints,
degreasers, jet fuels, gasoline, or cleaning fluids?
( ) No
( ) I don't know
( ) Yes, please describe:
In general, would you say your health is
( ) Excellent
( ) Very good
( ) Good
( ) Fair
( ) Poor
Please indicate which of the following best describes your usual level of leisure activity in the
past 12 months:
( ) Reading, watching television, or engaging in sedentary activities
( ) At least 4 hours a week walking, bicycling, or engaging in other types of physical activity
( ) At least 4 hours a week exercising to keep fit and participating in recreational athletics
( ) Regular, vigorous training or participating in competitive sports several times a week
When you have free time, do you:
( ) almost always prefer to do something with others
( ) usually prefer to do something with others
( ) sometimes like to be with others but also enjoy spending time by yourself
( ) usually prefer to spend time alone
( ) almost always prefer to spend time alone
When you were at school did you have any difficulties with reading or literacy?
( ) Yes, please describe:
( ) No
Have you participated in any research studies or other activities that involved auditory,
psychoacoustic or hearing tasks?
( ) Yes, please describe:
( ) No
Is there any history of hearing loss amongst your siblings, parents or grandparents?
( ) No
( ) I don't know
( ) Yes, please describe:

Which hand do you use for writing and other hand-related activities?
( ) Left hand
( ) Right hand
( ) Both hands
YOUR HEARING
Do you, or other people, notice any problems with your hearing?
( ) Yes, please describe:
( ) No
( ) I don't know
Have you had a hearing test/s in the past and if so, what was the most recent result?
( ) Yes, normal hearing in both ears
( ) Yes, hearing loss in one ear
( ) Yes, hearing loss in both ears
( ) Yes, but I don't know the result
( ) No, I have not had a hearing test
Would you say that you are particularly sensitive to loud sounds?
( ) Yes, please describe:
( ) No
Have you ever noticed that your hearing was dull or impaired after exposure to loud sound?
( ) Yes, please describe:
( ) No
Have you ever been exposed to any sudden, very loud sound, e.g., an explosion or gunshot?
( ) Yes, please describe:
( ) No
Tinnitus is defined as any sound that a person can hear internally that is not present externally.
It may be heard as a buzzing, ringing, whistling, hissing or pulsing sound. Have you ever
experienced tinnitus?
( ) Never or almost never
( ) Occasionally
( ) Sometimes
( ) Frequently
( ) Always or almost always
( ) Unsure
[Note: The next three questions were displayed only if respondent reported at least occasional
tinnitus in the previous question]
Where do you hear the tinnitus?
( ) Left ear only
( ) Right ear only
( ) Both ears
( ) In my head

Below are some statements relating to your tinnitus. Please read each statement and indicate
whether you agree or disagree with it by selecting the appropriate option on the scale [Note: this
was shown in a table format with the six statements below].
--------------------------------------------------------------------------------------------------------------------------
strongly disagree / disagree / neither agree nor disagree / agree / strongly agree
1 2 3 4 5
---------------------------------------------------------------------------------------------------------------------------
My tinnitus makes it uncomfortable to be in a quiet room.
I can easily ignore my tinnitus when it is present.
My tinnitus makes it difficult to concentrate.
My tinnitus rarely interferes with sleep.
My tinnitus is more noticeable than usual after I've been in a noisy environment.
My tinnitus interferes with my overall enjoyment of life.
LISTENING and HEARING
[Note: These questions were taken from the SSQ12 (Gatehouse and Noble 2004)]
Now we are going to ask 12 questions about aspects of your ability and experience hearing and listening in
different situations.
For each question, the scale runs from 0 through to 10. Selecting 10 means that you would
be perfectly able to do or experience what is described in the question. Selecting 0 means that you would
be quite unable to do or experience what is described. [Note: the scale was 0-10 in 0.5 steps for all 12
questions]
For example, the first question asks about having a conversation with someone while the TV is on at the
same time. If you are well able to do this then select a button toward the right-hand end of the scale. If you
could follow about half the conversation in this situation select a button around the mid-point, and so on.
We expect that all the questions are relevant to your everyday experience, but if a question describes a
situation that does not apply to you select the "Not applicable" button. Please also explain why it does not
apply in your case in the comments box.
[Note: The scale below was used for the 10 questions listed below].
Not at all Perfectly
( ) 0_______________________________________________________ ( ) 10 ( ) N/A
Comments:
You are talking with one other person and there is a TV on in the same room. Without turning
the TV down, can you follow what the person you're talking to says?
You are listening to someone talking to you, while at the same time trying to follow the news on
TV. Can you follow what both people are saying?
You are in conversation with one person in a room where there are many other people talking.
Can you follow what the person you are talking to is saying?
You are in a group of about five people in a busy restaurant. You can see everyone else in the
group. Can you follow the conversation?
You are with a group and the conversation switches from one person to another. Can you easily
follow the conversation without missing the start of what each new speaker is saying?
You are outside. A dog barks loudly. Can you tell immediately where it is, without having to
look?
Can you tell how far away a bus or a truck is, from the sound?
Can you tell from the sound whether a bus or truck is coming towards you or going away?
When you listen to music, can you make out which instruments are playing?

Do every day sounds that you can hear easily seem clear to you (not blurred)?
[Note: The scale below was used for the question listed after it].
Jumbled Not Jumbled
( ) 0_______________________________________________________ ( ) 10 ( ) N/A
Comments:
When you hear more than one sound at a time, do you have the impression that it seems like a
single jumbled sound?
[Note: The scale below was used for the question listed after it].
Concentrate hard No need to concentrate
( ) 0_______________________________________________________ ( ) 10 ( ) N/A
Comments:
Do you have to concentrate very much when listening to someone or something?
YOUR NOISE EXPOSURE: LEISURE
Now we would like to find out how much noise you have been exposed to over your lifetime. We've
divided this into two sections - leisure activities and workplace noise.
Leisure Activities: Each leisure activity is presented in a table with a separate row for each decade of your
life. Complete all the tables by estimating how often you participated in the activity in each decade.
Remember to answer for each decade of your life for all activities.
[Note: A Table, as shown below, was displayed with appropriate decades according to respondent’s
age, for each of the twelve questions listed after it.]
Never
About
once
or
twice
a year
About
once
every
2-3
months
About
once a
month
About
once a
fortnight
About
once
a
week
More
than
once a
week
in
your
teens
( ) ( ) ( ) ( ) ( ) ( ) ( )
in
your
20's
( ) ( ) ( ) ( ) ( ) ( ) ( )
in
your
30's
( ) ( ) ( ) ( ) ( ) ( ) ( )
Etc…

How often did you attend nightclubs or dance clubs?
How often did you attend amplified music events such as pop/rock concerts, live
gigs or outdoor music festivals?
How often did you attend parties, dances or discos with amplified music?
How often did you perform in or rehearse with a band that played amplified music?
How often did you perform in or rehearse with an orchestra or concert band?
How often did you play solo (e.g., in practice or lesson) one of the following instrument
types: saxophone, clarinet, flute, piccolo, drums, any brass instrument, or any amplified
instrument? How often did you listen to a personal audio device through headphones or earbuds at 80% of the
full volume or higher?
How often did you attend a live professional sporting event?
How often did you attend a live motor sports event?
How often did you drive a motorcycle, motorised scooter or a noisy recreational vehicle?
How often did you go shooting?
How often did you use garden power tools, other power tools or a chainsaw?
YOUR NOISE EXPOSURE: LEISURE (HEARING PROTECTION)
Hearing Protection in Leisure Activities: Now we would like you to tell us whether you wore hearing
protection (e.g., earplugs or earmuffs) and how often you wore it during the leisure activities.
Depending on your previous answers, you will see a series of tables showing all the leisure activities you
have participated in with a separate row for each decade in which you participated. Complete all the tables
by indicating how often you wore hearing protection for each activity/decade.
If you have never worn hearing protection during any leisure activities in any decade of your life, please
tick the box below. Otherwise, click on the 'Next' button to start completing the tables.
[ ] I have never worn hearing protection during any leisure activities
[Note: A table, as shown below, was presented, containing appropriate decades according to
respondent’s age, and only for those activities/events (see list below) that the respondent had
previously indicated that they had participated in].
Select the appropriate
option
in your teens ( ) No
( ) Yes, < 10% of the time
( ) Yes, <50% of the time
( ) Yes, about 50% of the time
( ) Yes, > 50% of the time
( ) Yes, > 90% of the time
in your 20's Etc…
in your 30's Etc…

Did you wear hearing protection at nightclubs or dance clubs?
Did you wear hearing protection at amplified music events such as pop/rock concerts, live
gigs or outdoor music festivals?
Did you wear hearing protection at parties, dances or discos with amplified music?
Did you wear hearing protection when you performed in or rehearsed with a band that played
amplified music?
Did you wear hearing protection when you performed in or rehearsed with an orchestra or
concert band?
Did you wear hearing protection when you played solo on saxophone, clarinet, flute, piccolo,
drums, any brass instrument, or any amplified instrument?
Did you wear hearing protection at a live professional sporting event?
Did you wear hearing protection at a live motor sports event?
Did you wear hearing protection when you drove a motorcycle, motorised scooter or a noisy
recreational vehicle?
Did you wear hearing protection when you went shooting?
Did you wear hearing protection when you used garden power tools, other power tools or a
chainsaw?
YOUR NOISE EXPOSURE: WORK
Workplace noise: Now we'd like to find out more about any noisy environments that you work in or have
previously worked in where the noise level was loud enough that you had to raise your voice to be heard.
When thinking about the noisy work environments you have been in, it's important to consider the level of
noise you worked in rather than the type or place of work. For example, if you worked in a noisy pub for
three years and your job changed from glass collector to bar tender but the noise level remained the same,
make this a single work environment.
For each work environment there are five short questions to answer. When you have completed all
questions for your first work environment, click on the button labelled "Add next work environment" to
answer the questions again for your next work environment (if you have one).
[Note: The respondent was able to enter details for as many work environments as needed].
If you have never worked in a noisy work environment, please tick the box below. Otherwise,
click on the 'Next' button to start entering your first noisy work environment.
[ ] I have never worked in a noisy environment
Please answer the 5 questions below for each work environment in which you were exposed to loud
noise. Remember: loud noise = noise loud enough that you had to raise your voice to be heard.
Click on "Add next work environment" to answer the questions again for your next work environment (if
you have one).
Describe the work environment: _____________________________________________
Estimate how many hours you work / worked in this environment each week
( ) 1 hour – 50+ hours [Note: a full set of options was provided but is not listed here]
What proportion of time is / was the noise level so loud that you had to raise your voice to be
heard?

( ) about 10% of the time
( ) about 20% of the time
( ) about 30% of the time
( ) about 40% of the time
( ) about 50% of the time
( ) about 60% of the time
( ) about 70% of the time
( ) about 80% of the time ( ) about 90% of the time
( ) 100% of the time
How many years have you spent / did you spend in that work environment? [Note: a full set of
options was provided but is not listed here].
( ) < 1 year - 50 years
Do / did you wear hearing protection in this work environment?
( ) No
( ) Yes, < 10% of the time
( ) Yes, < 50% of the time
( ) Yes, around 50% of the time
( ) Yes, > 50% of the time
( ) Yes, > 90% of the time
YOU and MUSIC [Note: These questions were taken from the Music Use Questionnaire (MUSE) (Chin and Rickard,
2012)]
We will now ask you to tell us about your experiences with music. Read each question carefully and select
the option that describes you best.
On average, how often do you listen to music in a week?
( ) Less than once a week
( ) 1 - 2 times a week
( ) 3 - 4 times a week
( ) 5 - 6 times a week
( ) More than 6 times a week
On average, how many hours a day do you purposely listen to music (as opposed to music in the
environment that you have no control over e.g., music in cafes, stores)
( ) Less than 1 hour per day
( ) 1 - 2 hours per day
( ) 3 - 4 hours per day
( ) 5 - 6 hours per day
( ) More than 6 hours per day
Have you played / do you play a musical instrument (includes singing, practice and
performance)?
( ) No ( ) Yes
How many years have you played a musical instrument for? [Note: a full set of options was
provided but is not listed here].
( ) < 1 year – 60 years
At the peak of your interest, how many hours per day did you play/practise the musical
instrument (includes singing)? [Note: a full set of options was provided but is not listed here].

( ) 0.5 hours – 18 hours
How long since you last regularly played a musical instrument (includes singing, practice and
performance)?
( ) Less than a week ago
( ) Less than a month ago
( ) Less than 1 year ago
( ) Between 1 and 5 years ago
( ) Between 5 and 10 years ago
( ) More than 10 years ago
What is the highest level of formal music training you have received?
( ) None
( ) Primary (Elementary) school music classes
( ) Secondary (High) school music lessons
( ) Tertiary (University) undergraduate training, Conservatory of music or master classes
( ) Postgraduate training, or advanced overseas training
What other type of music training did you receive?
( ) None
( ) Self-taught (no formal training)
( ) Private (individual) music classes/tuition
( ) Group music classes/tuition
Have you completed AMEB (or equivalent such as ABRSM) music examinations?
( ) No
( ) Yes, the highest grade (Theory or Performance/Practical) I have completed is Grade 1
( ) Yes, the highest grade (Theory or Performance/Practical) I have completed is Grade 2
( ) Yes, the highest grade (Theory or Performance/Practical) I have completed is Grade 3
( ) Yes, the highest grade (Theory or Performance/Practical) I have completed is Grade 4
( ) Yes, the highest grade (Theory or Performance/Practical) I have completed is Grade 5
( ) Yes, the highest grade (Theory or Performance/Practical) I have completed is Grade 6
( ) Yes, the highest grade (Theory or Performance/Practical) I have completed is Grade 7
( ) Yes, the highest grade (Theory or Performance/Practical) I have completed is Grade 8
( ) Yes, the highest level I have completed is Associate and/or Licentiate Diploma in Music
Participation with music activities
[Note: The scale shown below was displayed, for each of the 24 statements listed below. A “Not
Applicable” option was also available to respondents].
--------------------------------------------------------------------------------------------------------------------------
strongly disagree / disagree / neither agree nor disagree / agree / strongly agree
1 2 3 4 5
Music is often a source of inspiration for me
I often play challenging pieces
There is a greater connection with my friends when we like the same music
Music provides me with a good pace for exercising
Music often takes away tension at the end of the day
Performing music is emotionally rewarding for me
I often listen to new compositions
I often look forward to attending music practices with my friends

Certain types of music help me think
Mastering a piece of music gives me greater recognition as a performer
Having a similar taste in music often helps me relate better to my peers
Dance is an expression of my feelings
I often listen to music when I am feeling down
I often get recognition from my friends for playing in a group
I am able to make more friends when we like the same type of music
Listening to music whilst exercising often helps me exercise for longer
Specific types of music make me feel better
Being able to improvise whilst playing music gives me a great sense of satisfaction
Dancing keeps me fit
I feel good when my performance is applauded
Practice helps me improve my music playing skills
I use a particular type of music to get me through tough times
Music performance demonstrates my knowledge of music theory
Music improves my physical endurance level
Thank You
Congratulations! You have reached the end of our survey. We appreciate the time you have taken to
complete the questions and we will now review your responses. If necessary we will seek clarification
and/or additional information when you attend your appointment at our research laboratory.
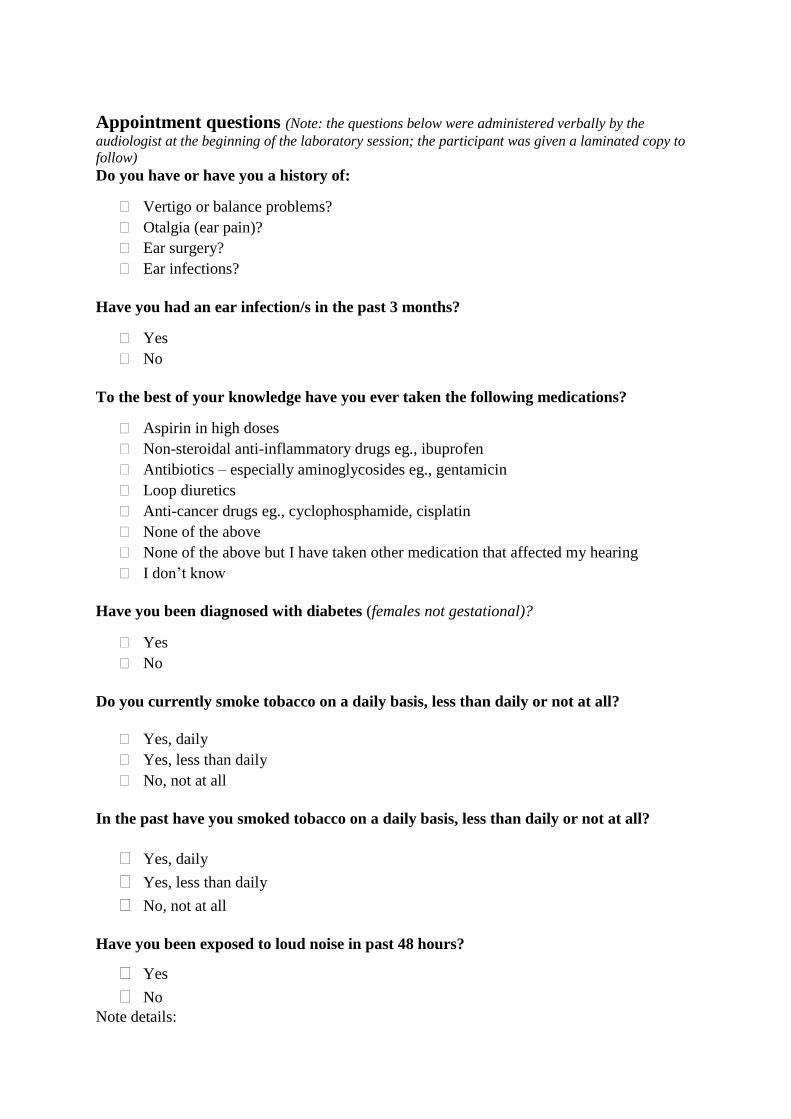
Appointment questions (Note: the questions below were administered verbally by the
audiologist at the beginning of the laboratory session; the participant was given a laminated copy to
follow) Do you have or have you a history of:
Vertigo or balance problems?
Otalgia (ear pain)?
Ear surgery?
Ear infections?
Have you had an ear infection/s in the past 3 months?
Yes
No
To the best of your knowledge have you ever taken the following medications?
Aspirin in high doses
Non-steroidal anti-inflammatory drugs eg., ibuprofen
Antibiotics – especially aminoglycosides eg., gentamicin
Loop diuretics
Anti-cancer drugs eg., cyclophosphamide, cisplatin
None of the above
None of the above but I have taken other medication that affected my hearing
I don’t know
Have you been diagnosed with diabetes (females not gestational)?
Yes
No
Do you currently smoke tobacco on a daily basis, less than daily or not at all?
Yes, daily
Yes, less than daily
No, not at all
In the past have you smoked tobacco on a daily basis, less than daily or not at all?
Yes, daily
Yes, less than daily
No, not at all
Have you been exposed to loud noise in past 48 hours?
Yes
No
Note details:

TFS1 vs. Noise Exposure
1.0 1.5 2.0 2.5 3.0 3.5 4.0 4.5 5.0 5.5
Noise Exposure (Log Pa2h)
-20
0
20
40
60
80
100
120
140
160
TF
S1
(H
z)
r = -0.11
AM4 vs. Noise Exposure
1.0 1.5 2.0 2.5 3.0 3.5 4.0 4.5 5.0 5.5
Noise Exposure (Log Pa2h)
-34
-32
-30
-28
-26
-24
-22
-20
-18
-16
-14
-12
AM
4 (
dB
)
r = -0.17
AM90 vs. Noise Exposure
1.0 1.5 2.0 2.5 3.0 3.5 4.0 4.5 5.0 5.5
Noise Exposure (Log Pa2h)
-36
-34
-32
-30
-28
-26
-24
-22
-20
-18
-16
-14
-12
AM
90
(dB
)
r = -0.08
TEN vs. Noise Exposure
1.0 1.5 2.0 2.5 3.0 3.5 4.0 4.5 5.0 5.5
Noise Exposure (Log Pa2h)
-10
-8
-6
-4
-2
0
2
4
6
TE
N T
hre
sh
old
r = -0.17
SSQ12 vs. Noise Exposure
1.0 1.5 2.0 2.5 3.0 3.5 4.0 4.5 5.0 5.5
Noise Exposure (Log Pa2h)
2.0
3.0
4.0
5.0
6.0
7.0
8.0
9.0
10.0
11.0
SS
Q1
2 (
To
tal S
co
re)
r = -0.10
LiSN-S vs. Noise Exposure
1.0 1.5 2.0 2.5 3.0 3.5 4.0 4.5 5.0 5.5
Noise Exposure (Log Pa2h)
-32
-30
-28
-26
-24
-22
-20
-18
-16
-14
-12
LiS
N-S
Hig
h-C
ue
SR
T (
dB
)
r = 0.01
NAL-DCT vs. Noise Exposure
1.5 2.0 2.5 3.0 3.5 4.0 4.5 5.0 5.5
Noise Exposure (Log Pa2h)
0
5
10
15
20
25
30
35
40
45
50
NA
L-D
CT
Pa
ssa
ge
Sco
re
r = 0.05
Scatterplots showing the relationship
between noise exposure and dependent
variables.

TFS1 vs. Music Training
-2 0 2 4 6 8 10 12
Index of Music Training Score
-20
0
20
40
60
80
100
120
140
160
TF
S1
(H
z)
r = -0.36
AM4 vs. Music Training
-2 0 2 4 6 8 10 12
Index of Music Training Score
-34
-32
-30
-28
-26
-24
-22
-20
-18
-16
-14
-12
AM
4 (
dB
)
r = -0.13
AM90 vs. Music Training
-2 0 2 4 6 8 10 12
Index of Music Training Score
-36
-34
-32
-30
-28
-26
-24
-22
-20
-18
-16
-14
-12
AM
90
(d
B)
r = -0.25
TEN vs. Music Training
-2 0 2 4 6 8 10 12
Index of Music Training Score
-10
-8
-6
-4
-2
0
2
4
6
TE
N T
hre
sh
old
r = -0.15
SSQ12 vs. Music Training
-2 0 2 4 6 8 10 12
Index of Music Training Score
2.0
3.0
4.0
5.0
6.0
7.0
8.0
9.0
10.0
11.0
SS
Q1
2 (
To
tal S
co
re)
r = 0.14
LiSN-S vs. Music Training
-2 0 2 4 6 8 10 12
Index of Music Training Score
-32
-30
-28
-26
-24
-22
-20
-18
-16
-14
-12
LiS
N-S
Hig
h-C
ue
SR
T (
dB
)
r = -0.06
NAL-DCT vs. Music Training
-2 0 2 4 6 8 10 12
Index of Music Training Score
0
5
10
15
20
25
30
35
40
45
50
NA
L-D
CT
Pa
ssa
ge
Sco
re
r = 0.07
Scatterplots showing the relationship
between music training and dependent
variables.