the effects of isobutanul addition on bubble size, gas
TRANSCRIPT
Abstract—The bubble coalescence and the transition
concentration in a dispersion column have been experimentally
studied in this study work by adopting isobutanol-water
mixture as a liquid phase and air as a gas phase. The
experimental work included the following experimental
variables; the weight percent of isobutanol in water and
superficial gas velocity of air. The using of two distributors
single-orifice and multi-orifice, bubble size, gas holdup and
gas-liquid interfacial area are measured. The experimental
results have showed that the isobutanol transition concentration
is successfully correlated as a function of superficial air velocity,
ct=0.072079-0.006408Ug+0.000425Ug2-0.00001Ug
3. This equation
gives mean deviation of 4.501%.
Index Terms—Gas-liquid dispersion column, bubble
coalescence, transition concentration.
NOTATIONS
a = specific gas-liquid interfacial area, mm2/mm
3
cA= isobutanol concentration, kmol/m3
ct = transition concentration of isobutanol, kmol/m3
dBi = diameter of bubbles of size i, mm
do= orifice diameter of perforated plate, mm
dvs = sauter mean diameter of bubbles, mm
K = number of variables in the system
n = number of orifices in perforated plate
ni = number of bubbles of size i
N = number of experiments
rc = correlation coefficient
Ug = superficial gas velocity of air, mm/s
Wt % = weight percent of isobutanol in water, %
x1, x2 = coded or independent variables of polynomial
equation
Zo, Z1, Z3 = liquid levels in the manometers, mm.
Greek Letters:
g = gas holdup
= coalescence percentage, %
Manuscript received October 26, 2013; revised March 20, 2014. F. Z. Hanna is with Koya University, Kurdistan Region of Iraq (e-mail:
R. K. Abdulrahman is with Koya University, Kurdistan Region of Iraq
(e-mail: [email protected]).
I. INTRODUCTION
The most important process in a bubble column is the
formation of a gas at the sparger. The smaller the bubbles, the
larger are the area for mass transfer between the gas and
liquid phases. Bubble swarm behavior in a bubble column is
mainly determined by the gas superficial velocity (Heijnen
and Riet [1]). Bubble size, bubble rise velocity, bubble size
distribution, and liquid and bubble velocity profile have a
direct bearing on the performance of bubble columns (Shah et
al. [2]). Akita and Yoshida [3] determined the bubble size
distribution using a photographic technique. The gas was
sparger through perforated plates and single-orifice using
various liquids (water, aqueous and pure glycol, methanol,
carbon tetrachloride). Saxena A. C and Sexena S. C [4]
studied the bubble size distribution in bubble column for the
air-water system as a function of gas velocity at room
temperature in the two bubble columns. High speed
cinephotography and fiber optic probe techniques were used
to measure bubble size. They suggest that the bubble size
may be dependent on column diameter with smaller bubbles
for narrower columns. The bubble size appears to be smaller
at the column wall than at distance away from the wall. Gas
holdup is one of the most important parameters
characterizing the hydrodynamics of bubble columns. It can
be defined as the percentage by volume of the gas in the two
or three phases mixture in the column (Shah et al. [2]). The
influence of gas velocity on gas holdup for alcohols aqueous
solutions is reported by Posarac and Tekic [5]. They found
that gas holdup value increase with increasing gas velocity
and depend significantly on the type of alcohol added.
Ruzicka et al. [6] studied experimentally the effect of the
column size (height and diameter) on the stability of the
homogeneous flow regime. The stability was expressed by
values of the critical gas holdup and critical gas flow rate.
They concluded from their results that the gas holdup values
increases with increasing gas flow rate, and these values are
mainly dependent on the bubble column diameter. Zahradnik
et al. [7] studied the effect of aliphatic alcohols with different
lengths of carbon chain ranging from methanol to octanol on
bubble coalescence and gas holdup. The gas-liquid interfacial
area is an important design variable in bubble column which
depend on the geometry of the apparatus, the operating
conditions, and the physical properties of liquid media (Shah
et al. [2]). Bubble coalescence plays a significant role in
determining bubble size distribution, gas holdup, interfacial
area, and bubble rise velocity, which govern the performance
of bubble columns and distillation towers (Kim and Lee [8]).
Coalescence of bubbles in gas-liquid dispersions will be
Fadi Zakariya Hanna and Ribwar Kermanj Abdulrahman
The Effects of Isobutanul Addition on Bubble Size, Gas
Holdup, Interfacial Area, Bubble Coalescence, and
Transition Concentration in Dispersion Column
International Journal of Materials, Mechanics and Manufacturing, Vol. 2, No. 3, August 2014
245DOI: 10.7763/IJMMM.2014.V2.136

inhibited, when the liquid phase is not pure component, but a
mixture, as has been reported by Marrucci and Nicodemo [9].
Zahradnik et al. [10] studied the link the coalescence
behavior of bubbles in aqueous electrolyte solutions with the
character of gas-liquid beds generated in bubble column
reactors and with corresponding values of bubble bed
voidage. The experimental programme, performed with the
set of nine inorganic salts, included determination of the
bubble coalescence frequency in a coalescence cell and
measurement of gas holdup in a sieve tray bubble column
reactor of 0.14m inside diameter. The aim of the present work
is to study the effect of addition of isobutanol on the
performance of dispersion column, gas hold up, bubble size,
gas-liquid interfacial area, were they effected directly by the
bubble coalescence frequency. The transition concentration
is predicted from bubble coalescence frequency were it is
very important parameters that effect the mass transfer in the
bubble column.
(a)
(b)
Fig. 1. (a) Experimental set-up: (1) bubble column (2) perforated plate (3)
manometers (4) air compressor (5) air filter (6) regulating valves (7)
rotameter (8) digital camera (9) centrifugal pump (b) Scheme of coalescence
cell (1) bubble column (2)capillaries (3) air compressor (4) air filter (5)
regulating valves (6) rotameter (7) digital camera (8) centrifugal pump.
II. EXPERIMENTAL SECTION
Photographing the bubbles and studying the
hydrodynamics of bubbles were performed in perspex
column of 75mm inside diameter and 2000mm in height,
(shown in Fig. 1(a)).Two kind of perforated plates were used,
single-orfice (plate A) (do=2mm), and multi-orfice (plate B)
(do=0.5mm, and n=45) in a triangular pitch. The bubble
column opened to the atmosphere and operated continuously
with respect to the gas phase and batch wise with respect to
the liquid phase. The liquid used in this work is aqueous
solutions of isobutanol. The clear liquid height was 1500mm,
and liquid temperature was kept at 26 oC. The gas phase (air)
was fed to the bottom of the column through the distributor,
after the flow rate had been measured with rotameter. The
liquid was discharged from the bottom of the column using
centrifugal pump. While the bubble coalescence was
performed in the other perspex column of 75mm inside
diameter and 1500mm in height, (shown in Fig. 1(b)). The
head of liquid over the gas injection region was 1200mm.
Pairs of bubbles were formed simultaneously at opposite
orifices of the two stainless steel capillaries 2mm in diameter,
the distance of orifices was 10mm. One thousand bubble
pairs were contacted in each experimental run and the
coalescence percentage was then directly obtained as the
number of coalescing bubble pairs. The transition
concentration, define by Lessard and Zieminski [11] as the
concentration corresponding to 50% coalescence, were then
determined from the graphs ( vs. cA) showing dependence
of the coalescence percentage on the ethanol concentration.
When the bubble column is operated, the volume fraction
of gas bubbles in the column can be computed from the
heights of liquid levels in the manometer, by following Eq.
(1), Jeng et al. [12]:
1 2g oZ Z Z (1)
The photographs of bubbles are taken by digital camera at
the speed of 500frames/s, using a steel ball to calibrate the
bubble shape. The diameter of each bubble is measured on
the photograph and sauter mean diameter is computed, by
following Eq. (2), Jeng et al. [12]:
3 2
vs i Bi i Bid n d n d (2)
Specific gas-liquid interfacial area per unit volume of the
dispersion column was obtained from Eq. (3), Jeng et al. [12]:
6 g vsa d (3)
The experimental parameters of bubble size (sauter mean
diameter), gas holdup, and gas-liquid interfacial area were
designed using the centrol composite rotatable design with
the following ranges of process variables:
1. Weight percent of isobutanol in water: (0.05-0.95)
Wt %.
2. Superficial gas velocity of air (Ug): (1.5-28.5) mm/s.
Using two perforated plate [single-orifice (plate A), and
multi -orifice (plate B)].
A preliminary step is to setup the relationships between the
coded levels and the corresponding real variables. The
general relationship is following, (Montgomery [13], Peters
and Timmerhaus [14]):
codedX =
min
actual center
center imum
X X
X X
K
(4)
The number of experiments N needed is estimated
according to the following equation, (Montgomery [13],
International Journal of Materials, Mechanics and Manufacturing, Vol. 2, No. 3, August 2014
246
Peters and Timmerhaus [14]):
2 2 1KN K (5)
For the purpose of a second-order polynomial regression
the central composite rotatable design for two variables was
used. The coded levels are related to real process variables as
follows:
% 0.5
1 0.3182
WtX
(6)
2
15
9.5459
gUX
(7)
III. RESULTS AND DISCUSSION
A. Use Non-Linear Regression Analysis
Second order polynomial regression analysis of the
objective function (sauter mean diameter, gas holdup,
gas-liquid interfacial area, and bubble coalescence
percentage) gave Eqs. (8) to (13) respectively. In the analysis
of the experimental results it is possible to determine not only
the effect of each individual variable but also the way in
which each variable effect depends on the other variables (i.e.
interaction). A complete regression results with a computer
program named “Statistica”.
For Plate (A):
2
1 2 1
2
2 1 2
4.299955 1.01878 0.188403 0.237526
0.012549 0.05
vsd X X X
X X X
(8)
Mean deviation = 5.04%
Correlation coefficient (rc) = 0.976
2
1 2 1
2
2 1 2
0.384505 0.1093791 0.01884 0.008504
0.008504 0.005
g X X X
X X X
(9)
Mean deviation = 3.065%
Correlation coefficient (rc) = 0.989
2
1 2 1
2
2 1 2
0.536559 0.412624 0.054318 0.200963
0.022438 0.033508
a X X X
X X X
(10)
Mean deviation = 8.055%
Correlation coefficient (rc) = 0.986
For Plate (B):
2
1 2 1
2
2 1 2
3.559963 0.845203 0.154991 0.194397
0.013166 0.04
vsd X X X
X X X
(11)
Mean deviation = 4.999%
Correlation coefficient (rc) = 0.977
2
1 2 1
2
2 1 2
0.427029 0.121356 0.020886 0.009784
0.009784 0.005478
g X X X
X X X
(12)
Mean deviation = 3.021%
Correlation coefficient (rc) = 0.989
2
1 2 1
2
2 1 2
0.624825 0.382013 0.09886 0.108246
0.016472 0.0956
a X X X
X X X
(13)
Mean deviation = 11.683%
Correlation coefficient (rc) = 0.985
B. Influence of Process Variables on dvs, g, a, and .
Two variables were studied in dispersion column: weight
percent of isobutanol in water, and superficial gas velocity of
air, for two perforated plates (A) and (B). The meanings of
code numbers for all Figures are given below (Table I).
TABLE I: WORKING RANGE OF CODED AND CORRESPONDING REAL
VARIABLES
Coded Level Wt (%) Ug (mm/s)
-1.414 0.05 1.5
-1 0.1818 5.4541
0 0.5 15
1 0.8182 24.5459
1.414 0.95 28.5
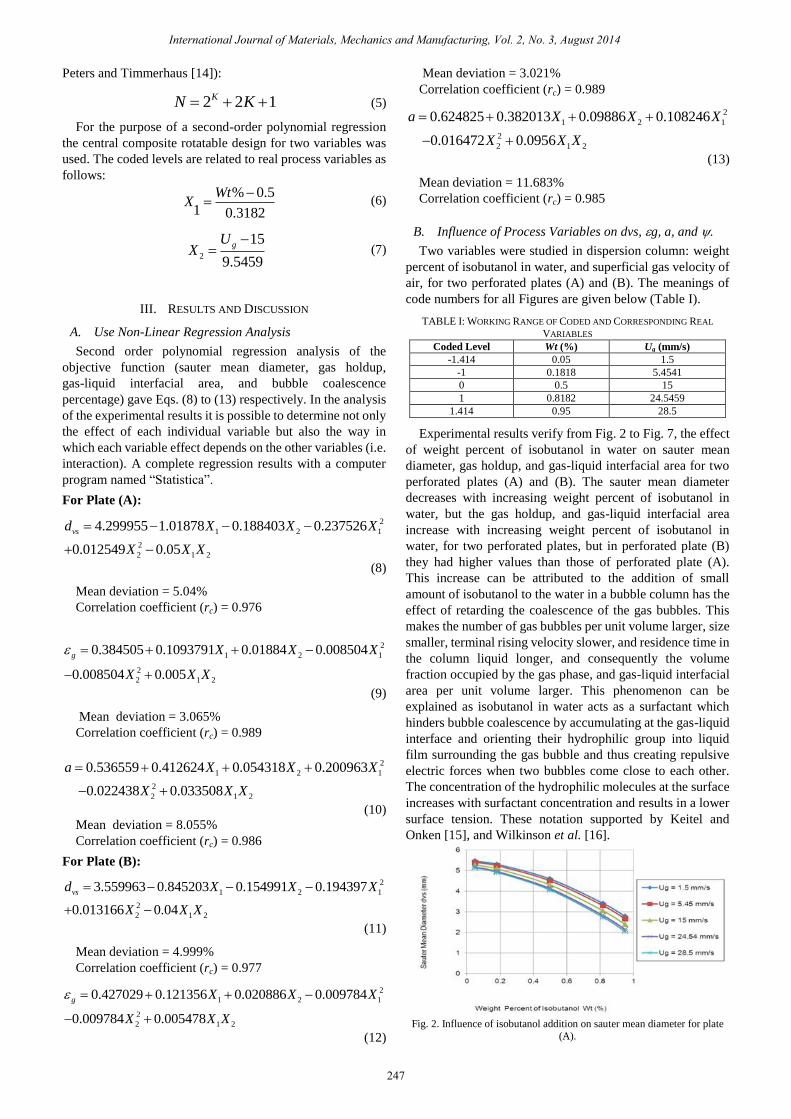
Experimental results verify from Fig. 2 to Fig. 7, the effect
of weight percent of isobutanol in water on sauter mean
diameter, gas holdup, and gas-liquid interfacial area for two
perforated plates (A) and (B). The sauter mean diameter
decreases with increasing weight percent of isobutanol in
water, but the gas holdup, and gas-liquid interfacial area
increase with increasing weight percent of isobutanol in
water, for two perforated plates, but in perforated plate (B)
they had higher values than those of perforated plate (A).
This increase can be attributed to the addition of small
amount of isobutanol to the water in a bubble column has the
effect of retarding the coalescence of the gas bubbles. This
makes the number of gas bubbles per unit volume larger, size
smaller, terminal rising velocity slower, and residence time in
the column liquid longer, and consequently the volume
fraction occupied by the gas phase, and gas-liquid interfacial
area per unit volume larger. This phenomenon can be
explained as isobutanol in water acts as a surfactant which
hinders bubble coalescence by accumulating at the gas-liquid
interface and orienting their hydrophilic group into liquid
film surrounding the gas bubble and thus creating repulsive
electric forces when two bubbles come close to each other.
The concentration of the hydrophilic molecules at the surface
increases with surfactant concentration and results in a lower
surface tension. These notation supported by Keitel and
Onken [15], and Wilkinson et al. [16].
Fig. 2. Influence of isobutanol addition on sauter mean diameter for plate
(A).
International Journal of Materials, Mechanics and Manufacturing, Vol. 2, No. 3, August 2014
247
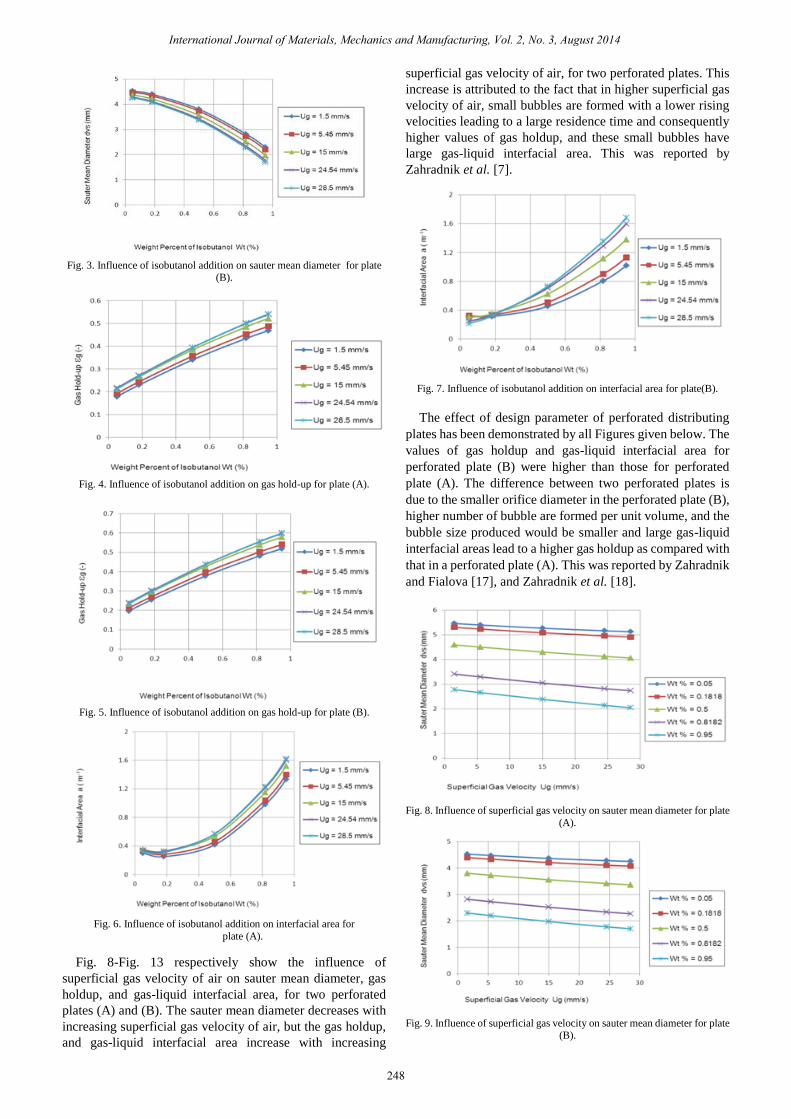
Fig. 3. Influence of isobutanol addition on sauter mean diameter for plate
(B).
Fig. 4. Influence of isobutanol addition on gas hold-up for plate (A).
Fig. 5. Influence of isobutanol addition on gas hold-up for plate (B).
Fig. 6. Influence of isobutanol addition on interfacial area for
plate (A).
Fig. 8-Fig. 13 respectively show the influence of
superficial gas velocity of air on sauter mean diameter, gas
holdup, and gas-liquid interfacial area, for two perforated
plates (A) and (B). The sauter mean diameter decreases with
increasing superficial gas velocity of air, but the gas holdup,
and gas-liquid interfacial area increase with increasing
superficial gas velocity of air, for two perforated plates. This
increase is attributed to the fact that in higher superficial gas
velocity of air, small bubbles are formed with a lower rising
velocities leading to a large residence time and consequently
higher values of gas holdup, and these small bubbles have
large gas-liquid interfacial area. This was reported by
Zahradnik et al. [7].
Fig. 7. Influence of isobutanol addition on interfacial area for plate(B).
The effect of design parameter of perforated distributing
plates has been demonstrated by all Figures given below. The
values of gas holdup and gas-liquid interfacial area for
perforated plate (B) were higher than those for perforated
plate (A). The difference between two perforated plates is
due to the smaller orifice diameter in the perforated plate (B),
higher number of bubble are formed per unit volume, and the
bubble size produced would be smaller and large gas-liquid
interfacial areas lead to a higher gas holdup as compared with
that in a perforated plate (A). This was reported by Zahradnik
and Fialova [17], and Zahradnik et al. [18].
Fig. 8. Influence of superficial gas velocity on sauter mean diameter for plate
(A).
Fig. 9. Influence of superficial gas velocity on sauter mean diameter for plate (B).
International Journal of Materials, Mechanics and Manufacturing, Vol. 2, No. 3, August 2014
248
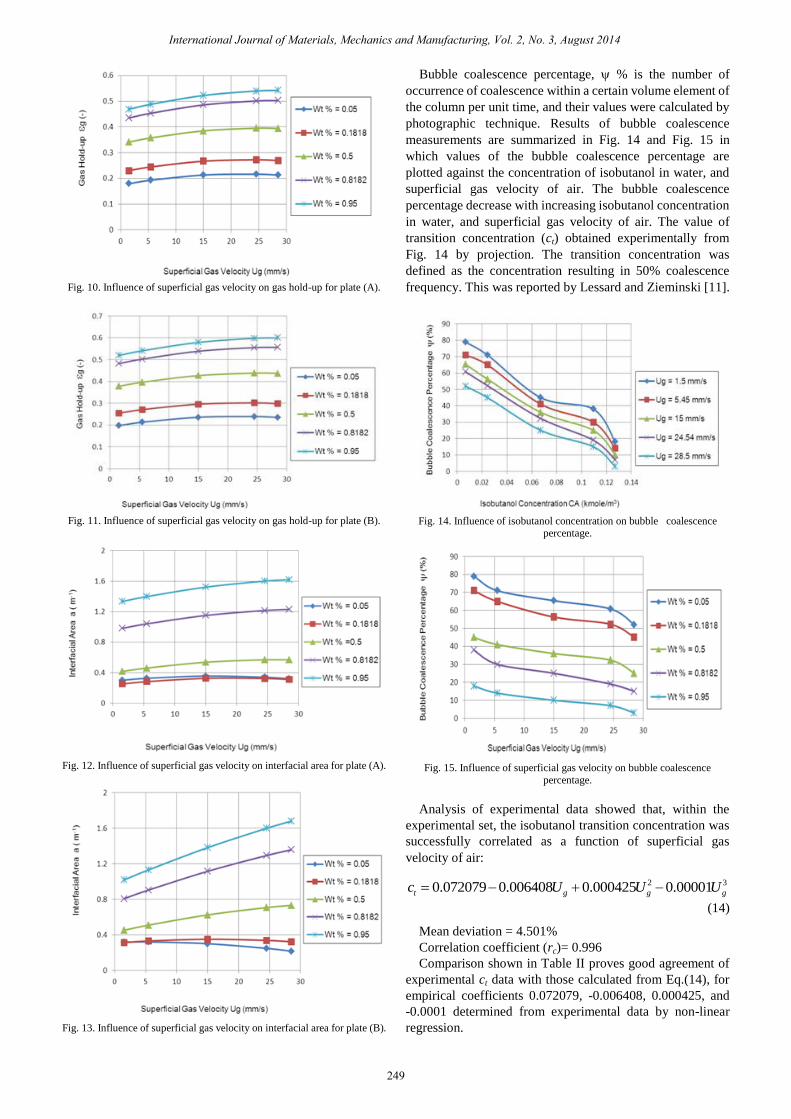
Fig. 10. Influence of superficial gas velocity on gas hold-up for plate (A).
Fig. 11. Influence of superficial gas velocity on gas hold-up for plate (B).
Fig. 12. Influence of superficial gas velocity on interfacial area for plate (A).
Fig. 13. Influence of superficial gas velocity on interfacial area for plate (B).
Bubble coalescence percentage, % is the number of
occurrence of coalescence within a certain volume element of
the column per unit time, and their values were calculated by
photographic technique. Results of bubble coalescence
measurements are summarized in Fig. 14 and Fig. 15 in
which values of the bubble coalescence percentage are
plotted against the concentration of isobutanol in water, and
superficial gas velocity of air. The bubble coalescence
percentage decrease with increasing isobutanol concentration
in water, and superficial gas velocity of air. The value of
transition concentration (ct) obtained experimentally from
Fig. 14 by projection. The transition concentration was
defined as the concentration resulting in 50% coalescence
frequency. This was reported by Lessard and Zieminski [11].
Fig. 14. Influence of isobutanol concentration on bubble coalescence
percentage.
Fig. 15. Influence of superficial gas velocity on bubble coalescence
percentage.
Analysis of experimental data showed that, within the
experimental set, the isobutanol transition concentration was
successfully correlated as a function of superficial gas
velocity of air:
2 30.072079 0.006408 0.000425 0.00001t g g gc U U U
(14)
Mean deviation = 4.501%
Correlation coefficient (rc)= 0.996
Comparison shown in Table II proves good agreement of
experimental ct data with those calculated from Eq.(14), for
empirical coefficients 0.072079, -0.006408, 0.000425, and
-0.0001 determined from experimental data by non-linear
regression.
International Journal of Materials, Mechanics and Manufacturing, Vol. 2, No. 3, August 2014
249

TABLE II: TRANSITION CONCENTRATION OF THE ISOBUTANOL ADDITION
TO THE WATER
ct (exp.)
kmol/m3
ct (cal.)
kmol/m3
0.0625 0.06339
0.05 0.048221
0.0375 0.039278
0.03125 0.029473
0.0125 0.013387
IV. CONCLUSION
1) A surface active additives (i.e. isobutanol) in an effective
means of improving the operating efficiency of bubble
column, has the effect of retarding the coalescence of gas
bubbles.
2) The bubble size (sauter mean diameter) is found to
decrease with increasing weight percent of isobutanol in
water, and superficial gas velocity of air, whereas the gas
holdup is found increased resulting in an increase in
gas-liquid interfacial area.
3) When central composite rotatable design technique was
used, a relationship was found between process variable
(Wt, and Ug) and (dvs, g, and a) was obtain for two
perforated plates (A), and (B).
4) Transition concentration of isobutanol, characterizing
suppression of coalescence in isobutanol aqueous
solutions, and isobutanol concentration was correlated as
a function of superficial gas velocity of air.
5) The relation between the transition concentration of
isobutanol and superficial gas velocity was polynomial
equation.
REFERENCES
[1] J. J. Heijnen and K. V. Riet, “Mass transfer, mixing and heat transfer
phenomena in low viscosity bubble column reactors,” The Chemical Engineering Journal, vol. 28, issue 2, pp. B21-B42, April 1984.
[2] T. T. Shah, B. G. Kelkar, S. P. Godbole, and W. D. Deckwer,
“Design parameters estimations for bubble column reactors,” American Institute for Chemical Engineers journal, vol. 28, issue 3,
pp. B354-B379, March 1986.
[3] K. Akita and F. Yoshida, “Bubble size, interfacial area, and liquid phase mass transfer coefficients in bubble columns,” Industrial and
Engineering Chemistry Process Design and Development, vol. 13,
issue 84, pp. B84–B91, May 1974. [4] A. C. Saxena and S. C. Saxena, “Bubble size distribution in bubble
columns,” The Canadian Journal of Chemical Engineering, vol. 68,
issue , pp. 159-161, March 1990. [5] D. Posarac and M. N. Tekic, “Gas holdup and volumetric mass
transfer coefficient in bubble columns with dilute alcohol solutions,”
American Institute for Chemical Engineers journal, vol. 33, issue 3, pp. 497-499, November 1987.
[6] M. C. Ruzicka, J. Drahos, M. Fialova, and N. H. Thomas, “Effect of
bubble column dimensions on flow regime transition,” Chemical Engineering Society, vol. 56, issue 2, pp. 6117-6124, February 2001.
[7] J. Zahradnik, G. Kuncova, and M. Fialova, “The effect of surface
active additives on bubble coalescence and gas holdup in viscous aerate batches,” Chemical Engineering Society, vol. 54, issue 1, pp.
2401-2408, January 1999.
[8] J. W. Kim and W. K. Lee, “Coalescence behavior of two bubbles in stagnant liquids,” Journal of Chemical Engineering Japan, vol. 20,
issue 5, pp. 448-453, March 1987.
[9] G. Marrucci and L. Nicodemo, “Coalescence of gas bubbles in a
aqueous solutions of in organic electrolytes,” Chemical. Engineering
Society, vol. 22, issue 2, pp.1257-1265, April 1967. [10] J. Zahradnik, M. Fialova, F. Kastanek, K. D. Green, and N. Thomas,
“The effect of electrolytes on bubble coalescence and gas holdup in
bubble column reactors,” Transactions of IChemE Journal, vol. 73, issue 2, pp. 341-346, April 1995.
[11] R. D. Lessard and S. A. Zieminski, “Bubble coalescence and gas
transfer in aqueous electrolytic solutions,” Industrial & Engineering Chemistry Fundamentals, vol. 10, issue 1, pp. 260-289, January
1971.
[12] J. J. Jeng, J. R. Maa, and Y. M. Yang, “Surface effects and mass transfer in bubble column,” Industrial & Engineering Chemistry
Process Design and Developments, vol. 25, issue 4, pp. 974-978
April 1986. [13] D. C. Montgomery, Design and analysis of experiments, John Wiley
and Sons, New York, ch. 15, 445-461, 1976
[14] M. S. Peters and K. D. Timmerhaus, Plant design and economics for chemical engineers, Mc Graw-Hill, Kogakusha, 2nd ed., ch. 16, 702.
1987.
[15] G. Keitel and U. Onken, “Inhibition of bubble coalescence by solutes in air/water dispersions,” Chemical Engineering Society, vol. 37,
issue 11, pp. 1635-1638, March 1982.
[16] P. M. Wilkinson, A. P. Spek, and L. L. Van Dierendonck, “Design parameters estimation for scale-up of high pressure bubble columns,”
American Institute for Chemical Engineers journal, vol. 38, issue 2,
pp. 544-554, December 1992. [17] J. Zahradnik and M. Fialova, “The effect of bubbling regime on gas
and liquid phase mixing in bubble column reactors,” Chemical
Engineering society, vol. 51, issue 10, pp. 2491-2500, December 1996.
[18] J. Zahradnik, M. Fialova, M. Ruzicka, J. Drahos, F. Kastanek, and N.
Thomas, “Duality of the gas-liquid regimes in bubble column reactors,” Chemical Engineering Society Journal, vol. 52, issue 22,
pp. 3811-3826, April 1997.
Fadi Z. Hanna is an assistant professor of chemical engineering in the Department of Chemical
Engineering, where he joined the work at Koya University since 2011. Before that he was an assistant
professor at The University of Technology, Baghdad,
Iraq, where he was a lecturer in Chemical Engineering Department (2002-2011). He gained a B.Sc. degree in
chemical engineering from University of Technology in
1997, M.Sc. degree in chemical engineering from University of Technology in 2000, and Ph.D. degree in chemical engineering from University of
Technology in 2004. He started his academic teaching in 2004 when he
joined the work at the University of Technology, Baghdad, as a lecturer in the Department of Chemical engineering. In 2011 he joined the Koya
University, Kurdistan Region, Erbil as teaching staff of Chemical
Engineering Department. He has research activities are multiphase flow, heat transfer (i.e., type of heat exchanges), thermodynamics (i.e., phase change),
mass transfer (i.e., absorption columns), type of reactors (i.e., batch,
semibatch, continuous stirrer tank reactor and plug flow reactor) and process control on many chemical engineering units.
Ribwar Abdulrahman has extensive experience of
research and teaching within the area of Natural gas
processing and related fields, having worked at Koya University since 2006 when the Chemical
Engineering Department was established in that year
and his current role as assistant lecturer. He gained his master degree with distinction at United Kingdom
master level from Teesside University in the northern
of England in area of Petrochemical engineering.
International Journal of Materials, Mechanics and Manufacturing, Vol. 2, No. 3, August 2014
250