the effects of implant surface nanoscale features on...
TRANSCRIPT

lable at ScienceDirect
Biomaterials 30 (2009) 4053–4062
Contents lists avai
Biomaterials
journal homepage: www.elsevier .com/locate/biomateria ls
The effects of implant surface nanoscale features on osteoblast-specific gene expression
Gustavo Mendonça a,b, Daniela B.S. Mendonça a,b, Luis G.P. Simoes c, Andre L. Araujo c,Edson R. Leite c, Wagner R. Duarte d, Francisco J.L. Aragao a,e, Lyndon F. Cooper b,*
a Universidade Catolica de Brasılia, Pos-Graduaçao em Ciencias Genomicas e Biotecnologia, SGAN Quadra 916, Modulo B, Av. W5 Norte 70.790-160-Asa Norte Brasılia/DF, Brazilb Bone Biology and Implant Therapy Laboratory, Department of Prosthodontics, University of North Carolina at Chapel Hill, 404 Brauer Hall, CB #7450, Chapel Hill, NC 27511, USAc Departmento de Quımica, Universidade Federal de Sao Carlos-UFSCAR, Rod. Washington Luiz, 13565-905 Sao Carlos, SP, Brazild Programa de Pos-graduaçao em Periodontia, EBO/Sao Leopoldo Mandic, 70770-900 Brasılia, DF, Brazile Embrapa Recursos Geneticos e Biotecnologia, Laboratorio de Introduçao e Expressao de Genes, PqEB W5 Norte, 70770-900 Brasılia, DF, Brazil
a r t i c l e i n f o
Article history:Received 3 March 2009Accepted 13 April 2009Available online 21 May 2009
Keywords:Titanium oxideAluminum oxideZirconium oxideNanotopographyDental implantSurface treatment
* Corresponding author. Tel.: þ1 919 966 2712; faxE-mail addresses: [email protected] (G. Mendon
ry.unc.edu (L.F. Cooper).
0142-9612/$ – see front matter � 2009 Elsevier Ltd.doi:10.1016/j.biomaterials.2009.04.010
a b s t r a c t
This study investigated the influence of nanoscale implant surface features on osteoblast differentiation.Titanium disks (20.0� 1.0 mm) with different nanoscale materials were prepared using sol–gel-derivedcoatings and characterized by scanning electron microscopy, atomic force microscopy and analyzed byX-ray Photoelectron Spectrometer. Human Mesenchymal Stem Cells (hMSCs) were cultured on the disksfor 3–28 days. The levels of ALP, BSP, Runx2, OCN, OPG, and OSX mRNA and a panel of 76 genes related toosteogenesis were evaluated. Topographical and chemical evaluation confirmed nanoscale featurespresent on the coated surfaces only. Bone-specific mRNAs were increased on surfaces with superimposednanoscale features compared to Machined (M) and Acid etched (Ac). At day 14, OSX mRNA levels wereincreased by 2-, 3.5-, 4- and 3-fold for Anatase (An), Rutile (Ru), Alumina (Al), and Zirconia (Zr),respectively. OSX expression levels for M and Ac approximated baseline levels. At days 14 and 28 the BSPrelative mRNA expression was significantly up-regulated for all surfaces with nanoscale coated features(up to 45-fold increase for Al). The PCR array showed an up-regulation on Al coated implants whencompared to M. An improved response of cells adhered to nanostructured-coated implant surfaces wasrepresented by increased OSX and BSP expressions. Furthermore, nanostructured surfaces producedusing aluminum oxide significantly enhanced the hMSC gene expression representative of osteoblastdifferentiation. Nanoscale features on Ti implant substrates may improve the osseointegration responseby altering adherent cell response.
� 2009 Elsevier Ltd. All rights reserved.
1. Introduction
Implant surfaces have been developed in the last decade ina concentrated effort to provide bone in a faster and improvedosseointegration process [1–7]. Many studies have focused on surfacecharacteristics and chemical composition as a way to control bonehealing around dental implants [8–15]. The cellular mechanismsinvolved in this faster and improved osseointegration are yet to befully determined. Surfaces with imparted implant surface micro-topography improve cell attachment and differentiation [16,17].Suggested is the signaled alteration in adherent cell gene expression.Several investigators have revealed that nanoscale topography also
: þ1 919 966 3821.ça), lyndon_cooper@dentist-
All rights reserved.
influences cell adhesion and osteoblastic differentiation [18,19]. Thesefindings reiterate observations demonstrating that nanotopographymay directly influence adherent cell behavior [4,5,20–23].
Nanotechnology can alter the implant surface at an atomic level[24] and may influence the chemical composition of these surfaces[4]. Different chemical elements can be added to the implant surface,and biomolecules, such as BMP2 or FGF, can be applied and cova-lently bonded to the Ti implant surface [25]. The benefits of usingnanotechnology on dental implants have been proved both in vitroand in vivo [1,4,5,20–23]. These studies using animal and cell culturemodels implicate a role for nanocues in directing osteoblast differ-entiation. These effects may be related to an alteration in proteinadsorption onto the surface [22]. Through surface protein change ordirect cell interaction, nanoscale topography is able to affect anincrease in the expression of bone-related transcription factors suchas Runx2 and Osterix (Osx) that can drive mesenchymal stem cell(MSC) differentiation along the osteoblastic pathway [4,26].

G. Mendonça et al. / Biomaterials 30 (2009) 4053–40624054
The aim of this study was to investigate the behavior of hMSCscultured on titanium implants with nanoscale features for up to 28days. We also evaluated the gene expression profile of these cells byPCR array. The hypothesis was that the nanoscale features on thesurface can module the gene expression and control the osteoblastdifferentiation compared to machined implant surface. In thisstudy, detailed evaluation of nanoscale aluminum oxide coatedimplant led to an increased expression of 33 osteoblastic differen-tiation related genes compared to machined surfaces. Titaniumdisks coated with nanoscale features of each aluminum, titanium orzirconium presented an increased expression of Osx and Bonesialoprotein (BSP) over a 28-day period of culture of adherenthuman mesenchymal stem cells (hMSCs). It is possible that nano-scale surface topography can influence the osteoinductive programof gene expression in mesenchymal stem cells.
2. Materials and methods
2.1. Surface preparation
Commercial pure grade IV titanium disks (20.0�1.0 mm) were prepared bymachining, and cleaned by sonicating in acetone and subsequently water threetimes for 15 min each. The disks were treated by coating with a titanium (TiO2),zirconium (ZrO2), or aluminum oxide (Al2O3) nanocoating. The coated surfaces wereprepared by dip coating the disks in a Titanium, Zirconium or Aluminum sol–gel.These sol–gel reactions were prepared using the polymeric method [27] ina controlled temperature. The disks were cleaned by sonicating three times inacetone followed by water for 15 min each. Another set of disks was machined onlyand composed the Machined (M) group. The disks were cleaned by sonicating inacetone followed by water, as described above, and then were passivated with 30%HNO3 for 5 min. A sixth group was composed of disks that after machining weregrit-blasted with 100 mm aluminum oxide particles, and cleaned by sonicating threetimes in acetone, followed by water for 15 min each, followed by immersion in HClsolution (Fisher Scientific Inc., Pittsburgh, PA) overnight, and then passivated with30% HNO3 for 5 min. This treatment imparted a micron scale surface topography[28]. The disks were divided into six groups: machined (M), acid etched (Ac), Titania-Anatse (An), Titania-Rutile (Ru), Alumina (Al), and Zirconia (Zr) nanocoating.
2.2. Surface analysis
The surface of the disks was examined by high-resolution scanning electronmicroscopy (Field Emission Scanning Electron Microscope (FEG-SEM), HitachiS-4700, Tokyo, Japan) and atomic force microscopy (Nanoscope IIIA atomic forcemicroscope, Digital Instruments, Santa Barbara, CA,). Observations were made atthree different points on the disk surfaces, and average values were calculated. XPSspectra were recorded on a Kratos Axis Ultra spectrometer with a concentrichemispherical analyzer and a delay line detector. Monochromatic Al Ka X-rays wereused at 150 W, and the chamber base pressure was less than 10�8 torr. Surveyspectra were obtained at a pass energy of 80 eV and a step size of 1 eV, while high-resolution elemental scans were taken at a pass energy of 20 eV and a step size of0.1 eV. All spectra were corrected for the adventitious C 1s peak at 284.6 eV.
2.3. Cell culture
Human mesenchymal stem cells (hMSCs) P2 were purchased (Lonza) andcultured in accordance with published protocols [29]. Growth media includedDulbecco’s modified eagle medium Low glucose (LG-DMEM) (Gibco) supplementedwith 10% fetal bovine serum (FBS) and antibiotic/antimycotic (penicillin/strepto-mycin/amphotericin B, Sigma). Osteogenic media includes LG-DMEM (Gibco,#11885) supplemented with 10% FBS and antibiotic/antimycotic and the osteogenicsupplements 10�7
M dexamethasone (Sigma), 10 mM glycerophosphate (SigmaG9891) and 0.2 mM ascorbic acid (Sigma). Passage 2 cells were plated at low densityand grown until 80% confluent. Cells were subsequently passaged onto preparedtitanium disks using 100,000 cells in 250 ml of growth media. The formed meniscuswas left undisturbed to permit cell attachment over 4 h and subsequently additionalgrowth media were applied. Following overnight incubation, cultures were carefullyrinsed and osteogenic media were placed in culture dishes. This represented thestarting time point (T¼ 0). The osteogenic media were replaced every third day.Disks with adherent cell and forming tissue layers were collected on days 3, 7, 14,and 28 for RNA isolation and gene expression analysis.
2.4. RNA isolation and quantification
For evaluation of adherent cell mRNA expression, titanium disks were rinsedtwice with cold phosphate buffered saline (PBS), and adherent cells were lysed using
Trizol (Invitrogen, Carlsbad, CA). Cell lysates were collected by centrifugation andpipetting. Total RNA in the cell lysates was isolated using the Trizol according to themanufacturer’s protocol and collected by ethanol precipitation. Total RNA wasquantified using UV spectrophotometry.
2.5. Real-time RT-PCR analysis
From each total RNA sample, cDNA was generated using RT2 First Strand Kitreverse transcriptase (Superarray, Frederick, MD) in a standard 20 mL reaction using1 mg of the total RNA. All cDNAs were subjected to polymerase chain reaction (PCR)for GAPDH mRNA as a test of RNA integrity and cDNA synthesis. Subsequently, equalvolumes of cDNA were used to program real-time PCR reactions specific for mRNAsencoding ALP, BSP, Runx2, OCN, OPN, and OSX. Reactions were performed usinga customized RT2 Profiler� PCR Arrays (CAPH-0398) (Superarray, Frederick, MD)and thermocycling in an ABI 7200 real time thermocyler (Applied Biosystems, FosterCity, CA). Relative mRNA abundance was determined by the 2�DDCt method andreported as fold induction. GAPDH abundance was used for normalization. The datapoints analyzed were 3, 7, 14 and 28 days. Real-Time PCR was used to measure themRNA levels of ALP, BSP, Runx2, OCN, OPN, and OSX. The housekeeping gene GAPDHwas used as a control.
The effects of machined and nanoscale alumina on the osteoblast-specific geneexpression were further evaluated for 3, 7 and 14 days, by means of an array ofosteogenesis-related genes (human osteogenesis RT2 Profiler PCR array, PAHS-0026A – SuperArray Bioscience, Frederick, MD) according to the manufacturer’sinstructions, and compared to the Machined surface. cDNA was prepared from 1 mgtotal RNA by using a RT2 PCR array first strand kit (Superarray, Frederick, MD). A totalvolume of 25 ml of PCR mixture, which included 12.5 ml of RT2 Real-Time SYBR Green/ROX PCR master mix from SuperArray Bioscience (containing HotStart DNA poly-merase, SYBR Green dye, and the ROX reference dye), 11.5 ml of double-distilled H2O,and 1 ml of template cDNA, were loaded in each well of the PCR array. PCR ampli-fication was conducted with an initial 10-min step at 95 �C followed by 40 cycles of95 �C for 15 s and 60 �C for 1 min. The fluorescent signal from SYBR Green wasdetected immediately after the extension step of each cycle, and the cycle at whichthe product was first detectable was recorded as the cycle threshold. Data wereimported into an Excel database and analyzed using the comparative cycle thresholdmethod with normalization of the raw data to housekeeping genes including b2M,hypoxanthine phosphoribosyltransferase 1, ribosomal protein L13a, GAPDH, andACTB (b-actin).
2.6. Statistical analysis
Descriptive statistics were calculated using SPSS software (SPSS 14.0, SPSS Inc.,Chicago, IL, USA). The roughness parameter (Sa) was compared by one-way ANOVAfollowed by Tukey Test. For the gene expression analysis, T-test was performed forcomparison of mRNA levels compared to M surfaces. For all statistical analysissignificance level was set at p< .05.
3. Results
3.1. Surface analysis
The surfaces in this study presented linear scale surface topo-graphy. At low resolution, scanning electron micrographs suggestthe conservation of micron scale roughness between the Machinedand the nanostructured surface (M and An, Ru, Al and Zr) charac-teristics. Acid etched surfaces possessed a unique micron scaleroughness (Figs. 1–6). High-resolution microscopy revealed thepresence of 20–30 nm nanofeatures on all four nanostructuredsurfaces (An, Ru, Al and Zr) (Figs. 1–6). At high resolution, there arefew nanotopographic features on the M and Ac surfaces (Figs. 1–6).
Surface roughness parameters were obtained from the AFManalysis and are described in Table 1. The roughness profile is shownin Figs. 1–6. AFM images and resultant values for nanocoatedsurfaces were comparable to Machined surfaces and resulted fromthe coating process. At higher resolution, nanoscale features wereevident on the coated surfaces.
The XPS analysis demonstrated traces of different chemicalcomponents on each surface (Table 2 and Fig. 7). On the M surfacetraces of Mg, Zn, Na, Ca, S and Si were probably due to themachining, polishing and cleaning processes. A high-resolutionanalysis showed presence of Ti metallic and titanium oxide (TiO2) onthis surface. The Ac surface presented traces of Zn, Ca and S. Thehigh-resolution analysis also showed presence of Ti metallic and

Fig. 1. AFM and SEM evaluation of the Machined implant surface. (A) Surface roughness (AFM) for Machined. (B, C and D) SEM images at low and high magnification for theMachined surface. At 50,000� and 100,000� magnification a very few nanofeatures are observed (C and D).
G. Mendonça et al. / Biomaterials 30 (2009) 4053–4062 4055
titanium oxide (TiO2) on this surface. For the nanostructuredsurfaces, the high-resolution scanning demonstrated that the tita-nium on these surfaces was in oxide groups and no traces of tita-nium metallic were found. They also demonstrated that aluminumor zirconium found on Al and Zr surfaces were in oxide groups. Forthe Al group, a high level of aluminum was found on this surface,and Zr was observed at a high concentration on Zr group surfaces.The small amount of Mg, Zn, N, Ca, P and Si found on these surfaceswas attributed to the cleaning/coating process. The amount oftitanium observed on Al and Zr surfaces also demonstrates that theoxide surface is composed of titanium oxide and aluminum orzirconium oxides, for Al and Zr, respectively.
Cells were successfully grown and expanded on all surfaces. Celllayers were formed in multilayer and retraction from the disks wasnot observed. From the cultures established with 100,000 cells,there were sufficient numbers of cells present after 3, 7, 14 and 28days for isolation of total RNA (>5 mg of total RNA) to perform thearrayed real-time PCR reactions.
Initially, all six surfaces were evaluated regarding Runx2, OSX,ALP, OCN, OPN, and BSP gene expression (Fig. 8). Subsequentevaluation using a larger osteogenesis gene set was conducted.Comparisons were performed to compare nanoscale alumina (Al)to the machined (M) group (Table 3). Surface-specific gene regu-lation was observed for most of the studied genes. One generalobservation was that early differences among the surfaces (day 3 or7) were often of lower magnitude than differences observed at 14and 28 days. At day 3 no statistical difference was found among thesurfaces. After 14 days, adherent hMSCs growing on nano-structured surfaces presented increased OSX and BSP relativeexpression compared to M and Ac (Fig. 8).
The relative expression levels of Runx2 RNA, a key transcriptionfactor for osteoblast differentiation, were relatively unchangedbetween surfaces (Fig. 8A). OSX mRNA (another key transcription
factor for osteoblast differentiation) levels were more than 2-foldup-regulated at day 14 for An (2-fold), Ru (3.5-fold), Al (4-fold) andZr (3-fold) (Fig. 8B). OSX expression levels for M and Ac approxi-mated baseline levels at all time points. ALP mRNA relative levelsfor An, Al and Zr presented the highest level at day 28 (around 4-fold increase) (Fig. 8C). OCN and OPN mRNA levels were constantfor all surfaces throughout the 28-day period of the experiment(Fig. 8D and E). The only exception was for Al that presented an up-regulation of 2.5-fold for both genes at day 28. At days 14 and 28 theBSP relative mRNA expression was significantly up-regulated for allnanostructured surfaces (up to 45-fold increase for Al) (Fig. 8F).
To begin to understand the potential mechanisms involved in theregulatory effect of aluminum oxide nanoscale coating on humanmesenchymal stem cells, we screened an array of osteogenic-specific genes. These genes were classified in groups of mRNAsaccording to the known or proposed function of the encoded protein(Table 3). The categories are: growth factors, transcription factors,soluble ligand receptors, integrin receptors, bone matrix proteins,cartilage-related genes, collagen, and TGF/BMP superfamily genes.As shown in Table 3, from day 3 to day 7 an increasing number ofgenes were up-regulated on nano-Al compared to machined. At day3, 16 genes were up-regulated and six were down-regulatedcompared to M 3d. At day 7, Al had 20 genes up-regulated and fourgenes down-regulated, while M at day 7 presented 10 genes up-regulated and one gene down-regulated. At 14 days, 25 genes wereup-regulated and three down-regulated on Al, and M had 14 genesup-regulated and 7 genes down-regulated.
3.2. Transcription factors
In this study, we did not observe any significant change in Runt-related transcription factor 2 (Runx2) mRNA relative levels oneither surface at any time point (Table 3). However, at day 14 we

Fig. 2. AFM and SEM evaluation of the Acid etched implant surface. (A) Surface roughness (AFM). (B, C and D) SEM images at low and high magnification. At 50,000� and 100,000�magnification a very few nanofeatures are observed (C and D).
Fig. 3. AFM and SEM evaluation of the Anatase coated implant surface. (A) Surface roughness (AFM). (B, C and D) SEM images at low and high magnification. At 50,000� and100,000� magnification the nanofeatures of the surface are evident (C and D).
G. Mendonça et al. / Biomaterials 30 (2009) 4053–40624056

Fig. 4. AFM and SEM evaluation of the Rutile coated implant surface. (A) Surface roughness (AFM). (B, C and D) SEM images at low and high magnification. At 50,000� and100,000� magnification the nanofeatures of the surface are evident (C and D).
Fig. 5. AFM and SEM evaluation of the Alumina coated implant surface. (A) Surface roughness (AFM). (B, C and D) SEM images at low and high magnification. At 50,000� and100,000� magnification the nanofeatures of the surface are evident (C and D).
G. Mendonça et al. / Biomaterials 30 (2009) 4053–4062 4057
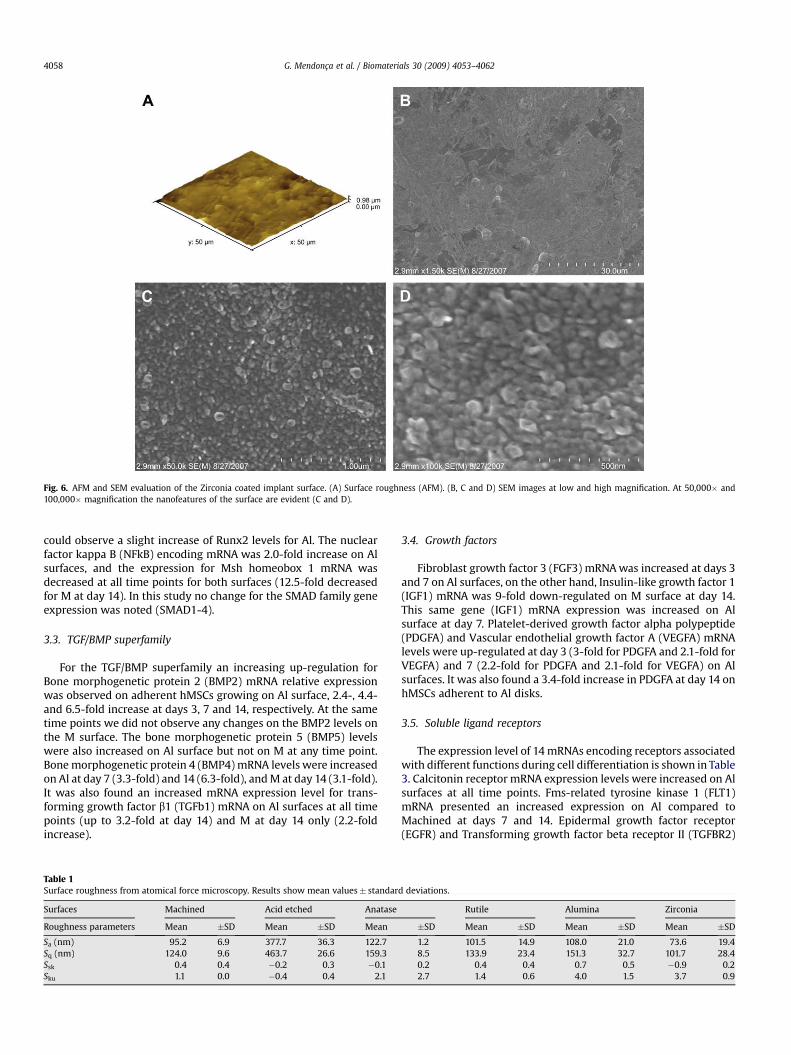
Fig. 6. AFM and SEM evaluation of the Zirconia coated implant surface. (A) Surface roughness (AFM). (B, C and D) SEM images at low and high magnification. At 50,000� and100,000� magnification the nanofeatures of the surface are evident (C and D).
G. Mendonça et al. / Biomaterials 30 (2009) 4053–40624058
could observe a slight increase of Runx2 levels for Al. The nuclearfactor kappa B (NFkB) encoding mRNA was 2.0-fold increase on Alsurfaces, and the expression for Msh homeobox 1 mRNA wasdecreased at all time points for both surfaces (12.5-fold decreasedfor M at day 14). In this study no change for the SMAD family geneexpression was noted (SMAD1-4).
3.3. TGF/BMP superfamily
For the TGF/BMP superfamily an increasing up-regulation forBone morphogenetic protein 2 (BMP2) mRNA relative expressionwas observed on adherent hMSCs growing on Al surface, 2.4-, 4.4-and 6.5-fold increase at days 3, 7 and 14, respectively. At the sametime points we did not observe any changes on the BMP2 levels onthe M surface. The bone morphogenetic protein 5 (BMP5) levelswere also increased on Al surface but not on M at any time point.Bone morphogenetic protein 4 (BMP4) mRNA levels were increasedon Al at day 7 (3.3-fold) and 14 (6.3-fold), and M at day 14 (3.1-fold).It was also found an increased mRNA expression level for trans-forming growth factor b1 (TGFb1) mRNA on Al surfaces at all timepoints (up to 3.2-fold at day 14) and M at day 14 only (2.2-foldincrease).
Table 1Surface roughness from atomical force microscopy. Results show mean values� standar
Surfaces Machined Acid etched Anatase
Roughness parameters Mean �SD Mean �SD Mean
Sa (nm) 95.2 6.9 377.7 36.3 122.7Sq (nm) 124.0 9.6 463.7 26.6 159.3Ssk 0.4 0.4 �0.2 0.3 �0.1Sku 1.1 0.0 �0.4 0.4 2.1
3.4. Growth factors
Fibroblast growth factor 3 (FGF3) mRNA was increased at days 3and 7 on Al surfaces, on the other hand, Insulin-like growth factor 1(IGF1) mRNA was 9-fold down-regulated on M surface at day 14.This same gene (IGF1) mRNA expression was increased on Alsurface at day 7. Platelet-derived growth factor alpha polypeptide(PDGFA) and Vascular endothelial growth factor A (VEGFA) mRNAlevels were up-regulated at day 3 (3-fold for PDGFA and 2.1-fold forVEGFA) and 7 (2.2-fold for PDGFA and 2.1-fold for VEGFA) on Alsurfaces. It was also found a 3.4-fold increase in PDGFA at day 14 onhMSCs adherent to Al disks.
3.5. Soluble ligand receptors
The expression level of 14 mRNAs encoding receptors associatedwith different functions during cell differentiation is shown in Table3. Calcitonin receptor mRNA expression levels were increased on Alsurfaces at all time points. Fms-related tyrosine kinase 1 (FLT1)mRNA presented an increased expression on Al compared toMachined at days 7 and 14. Epidermal growth factor receptor(EGFR) and Transforming growth factor beta receptor II (TGFBR2)
d deviations.
Rutile Alumina Zirconia
�SD Mean �SD Mean �SD Mean �SD
1.2 101.5 14.9 108.0 21.0 73.6 19.48.5 133.9 23.4 151.3 32.7 101.7 28.40.2 0.4 0.4 0.7 0.5 �0.9 0.22.7 1.4 0.6 4.0 1.5 3.7 0.9

Table 2Ion composition data from XPS analyses.
Atomic concentration %
Mg 1s Zn 2p Na 1s N 1s Ca 2p S 2p P 2p Si 2p Al 2p Zr 3d O 1s C 1s Ti 2p
Machined 0.7 3.66 0.61 0.59 3.15 54.68 26.61 10.01Acid etched 0.89 0.3 0.8 56.93 18.33 22.76Anatase 0.55 0.43 0.28 61.11 13.63 24Rutile 0.24 0.66 0.93 60.5 18.63 19.05Alumina 0.48 0.09 1.34 0.48 0.61 1.99 7.7 52.01 25.47 9.84Zirconia 0.74 1.28 11.61 57.04 21.28 8.05
G. Mendonça et al. / Biomaterials 30 (2009) 4053–4062 4059
were also up-regulated on Al surfaces compared to M surfaces at alltime points.
3.6. Integrin receptors
Integrin a1 and integrin a2 mRNA levels were increased onadherent cells plated on Al surfaces at the earliest time point, withup to 2.2- and 2.8-fold increase for the integrin a1 and integrin a2
0102030405060708090
100
0200400600800100012001400
x103
Binding Energy (eV)
O
Ti
ZrZrZr
C
Al
AlCaMgN
Ti
Ti O
Zirconia
Alumina
Rutile
Anatase
Acid etched
Machined
Arb
itrary u
nits
Fig. 7. Representative wide-scan XPS spectra of Machined, Acid etched, Anatase,Rutile, Alumina and Zirconia treated Titanium disks (Arbitrary units).
0.0
0.5
1.0
1.5
2.0
2.5
3.0
Day 3 Day 7 Day 14 Day 28
Fo
ld
ch
an
ge
Runx2
MachinedAcid etchedAnataseRutileAluminaZirconia
0.00.51.01.52.02.53.03.54.04.55.0
Day 3 Day 7
Fo
ld
ch
an
ge
O
MachinedAcid etchedAnataseRutileAluminaZirconia
0.0
0.5
1.0
1.5
2.0
2.5
3.0
Day 3 Day 7 Day 14 Day 28
Fo
ld
ch
an
ge
OCN
MachinedAcid etchedAnataseRutileAluminaZirconia
0.0
0.5
1.0
1.5
2.0
2.5
3.0
Day 3 Day 7
Fo
ld
ch
an
ge
O
MachinedAcid etchedAnataseRutileAluminaZirconia
A B
D E
Fig. 8. Adherent hMSCs bone-specific mRNA expression. Total RNA was isolated from cells aZirconia treated Titanium disks. Expression levels (fold change) for (A) Runx2, (B) Osterix, (Ccompared for all surfaces. The results are shown as fold change (2�DDCt method, baseline¼
mRNAs, respectively. Integrin b1 mRNA was also evaluated in thisstudy and levels were unchanged. Integrin a3 mRNA levels wereup-regulated on both Al and M at day 7 and day 14.
3.7. Collagen genes
Collagen type I a2 was increased at all time points. We also foundan increased mRNA expression levels for collagen type XI a1 for Alonly at days 7 and 14, and an up-regulation at day 14 for collagentype X a1 for both surfaces. Collagen type II a1 mRNA levels, whichare the major components of the ECM in cartilage, were not detectedon adherent hMSCs on both surfaces at any time point.
3.8. Bone matrix proteins
Table 3 shows the expression of several bone matrix mRNAs. Thelevel of biglycan (BGN) mRNA was up-regulated at days 3, 7 and 14on Al compared to M at all time points. At day 14 this gene reachedthe peak of 3.1-fold increase for Al. Osteocalcin mRNA levels werealso increased on Al, but on day 7 its levels on M reached up to 8.6-fold increase. In this study, alkaline phosphatase mRNA relativeexpression was increased on M surface in all time points.
3.9. Cartilage-related genes
Two cartilage-related genes were also evaluated in this study.Cartilage oligomeric matrix protein (COMP) mRNA levels were
Day 14 Day 28
SX
0.00.51.01.52.02.53.03.54.04.55.0
Day 3 Day 7 Day 14 Day 28
Fo
ld
ch
an
ge
ALP
MachinedAcid etchedAnataseRutileAluminaZirconia
Day 14 Day 28
PN
0.05.0
10.015.020.025.030.035.040.045.050.0
Day 3 Day 7 Day 14 Day 28
Fo
ld
ch
an
ge
BSP
MachinedAcid etchedAnataseRutileAluminaZirconia
C
F
t 3, 7, 14 and 28 days of culture on Machined, Acid etched, Anatase, Rutile, Alumina and) Alkaline phosphatase, (D) Osteocalcin, (E) Osteopontin, and (F) Bone sialoprotein areday 3 cells on Machined surface).

Table 3Up and down-regulated genes on machined and alumina surfaces at days 3, 7 and 14 (normalized with machined day 3 and presented as fold change). *Significantly different atp� 0.05. **Significantly different at p� 0.001.
Symbol Description Alumina 3d Machined 7d Alumina 7d Machined 14d Alumina 14d
Bone matrix proteinsALPL Alkaline phosphatase, liver/bone/kidney �3.0* 5.4 �1.4 2.3 1.7BGLAP Osteocalcin 2.2* 8.6 2.6* 1.9 3.3*BGN Biglycan 1.8 1.4 2.2* 1.7 3.2*
BMP superfamilyBMP2 Bone morphogenetic protein 2 2.4 1.8 4.5* 1.3 6.5*BMP4 Bone morphogenetic protein 4 2.0 1.5 3.3* 3.1* 6.4**BMP5 Bone morphogenetic protein 5 2.0 1.2 1.9 1.4 4.0BMP6 Bone morphogenetic protein 6 �2.2 �3.2 �14.2* �8.9* �5.7GDF10 Growth differentiation factor 10 2.2 2.2 2.2 1.1 2.1TGFB1 Transforming growth factor, beta 1 2.9** 1.7 2.0* 2.2* 3.2*TGFB2 Transforming growth factor, beta 2 1.9 �1.1 1.1 �1.1 1.3TGFB3 Transforming growth factor, beta 3 1.2 1.1 �1.4 �2.2* �1.7
ReceptorsCD36 CD36 molecule (thrombospondin receptor) 1.6 �1.1 1.3 �1.4 4.0*CDH11 Cadherin 11, type 2, OB-cadherin 2.1* 1.1 2.8* 1.2 2.7*EGFR Epidermal growth factor receptor 2.3 1.7 2.5* 2.5* 3.5*FGFR1 Fibroblast growth factor receptor 1 �1.2 1.3 1.5 �1.1 1.3FGFR2 Fibroblast growth factor receptor 2 1.4 �1.5 1.2 �2.5* 1.3FLT1 Fms-related tyrosine kinase 1 1.6 3.8 * 4.2 * 2.3 3.9ICAM1 Intercellular adhesion molecule 1 (CD54) �1.8 3.0* 1.6 4.0* 1.9SCARB1 Scavenger receptor class B, member 1 �3.8* 1.5 �1.2 1.2 �1.6TGFBR1 Transforming growth factor, beta receptor I 1.0 �1.3 �1.3 �1.3 �1.2TGFBR2 Transforming growth factor, beta receptor II 2.8* 2.5* 2.7 2.8* 3.4*VCAM1 Vascular cell adhesion molecule 1 1.5 1.6 3.7** 1.7 2.4*VDR Vitamin D (1,25- dihydroxyvitamin D3) receptor 1.4 �1.1 1.4 �1.2 1.5IGF1R Insulin-like growth factor 1 receptor �1.1 �1.2 �1.6 �1.2 1.5PHEX Phosphate regulating endopeptidase homolog, X-linked 1.0 2.0* 2.4* 2.2 3.4*
Growth factorsEGF Epidermal growth factor (beta-urogastrone) �1.0 �1.6 1.1 �1.0 �1.6FGF1 Fibroblast growth factor 1 (acidic) 1.6 �1.3 �1.8 1.5 1.1FGF2 Fibroblast growth factor 2 (basic) 1.6 1.5 �1.3 1.7 1.4IGF1 Insulin-like growth factor 1 (somatomedin C) �2.6* �1.1 2.1* �9.5* 1.8IGF2 Insulin-like growth factor 2 (somatomedin A) �1.9 2.0 2.1 1.2 1.5PDGFA Platelet-derived growth factor alpha 3.0** 2.0* 2.2 2.9* 3.4*VEGFA Vascular endothelial growth factor A 2.1 1.1 2.1** 1.2 1.6VEGFB Vascular endothelial growth factor B �1.7 1.2 1.4 1.1 2.9 *
Integrin receptorsITGA1 Integrin, alpha 1 2.2* 1.6 1.1 1.6 2.3ITGA2 Integrin, alpha 2 2.8 �1.1 �1.8 1.3 1.1ITGA3 Integrin, alpha 3 1.5 3.2* 2.7* 3.6* 3.5*ITGB1 Integrin, beta 1 1.2 �1.2 1.0 1.1 1.2
CollagenCOL10A1 Collagen, type X, alpha 1 �1.5 1.4 1.5 6.7* 5.5*COL11A1 Collagen, type XI, alpha 1 1.7 1.4 2.3* 1.4 3.1*COL12A1 Collagen, type XII, alpha 1 1.6 1.1 1.5 1.0 1.9COL14A1 Collagen, type XIV, alpha 1 1.5 �1.6 �1.4 �2.5* �1.1COL15A1 Collagen, type XV, alpha 1 2.5* �1.9 1.2 2.7* 2.4*COL1A1 Collagen, type I, alpha 1 1.2 �1.1 1.0 �1.1 �1.2COL1A2 Collagen, type I, alpha 2 2.9* 1.2 2.8* 2.2* 3.1*COL2A1 Collagen, type II, alpha 1 1.3 1.0 1.8 �1.2 1.5COL3A1 Collagen, type III, alpha 1 1.1 1.2 �1.7 �1.3 1.1COL4A3 Collagen, type IV, alpha 3 �1.2 1.7 1.0 2.8 1.3COL5A1 Collagen, type V, alpha 1 1.7 �1.1 1.2 1.2 1.3
Cartilage-related genesCOMP Cartilage oligomeric matrix protein 1.9 1.1 2.3* 1.2 4.1*SOX9 SRY (sex determining region Y)-box 9 1.6 �1.5 1.4 �1.8 1.1
MetalloproteinasesBMP1 Bone morphogenetic protein 1 1.9 1.3 1.8 1.1 3.2*MINPP1 Multiple inositol polyphosphate histidine phosphatase, 1 1.1 �1.1 1.2 �1.0 1.2MMP10 Matrix metallopeptidase 10 (stromelysin 2) 2.0 1.2 �1.2 �2.2 1.5MMP2 Matrix metallopeptidase 2 1.5 1.2 1.2 1.1 1.7MMP8 Matrix metallopeptidase 8 �7.1* 1.3 �2.9* �1.0 �5.0*MMP9 Matrix metallopeptidase 9 1.7 �1.9 1.7 �1.5 1.3
Transcription factorsMSX1 Msh homeobox 1 �5.2 �1.8 �6.3 �12.5 �2.2NFKB1 Nuclear factor of kappa in B-cells 1 (p105) 1.4 1.2 1.7 1.8 2.1RUNX2 Runt-related transcription factor 2 1.3 1.2 1.5 �1.2 1.9SMAD1 SMAD family member 1 1.1 �1.1 1.0 �1.6 1.2
G. Mendonça et al. / Biomaterials 30 (2009) 4053–40624060

Table 3 (continued )
Symbol Description Alumina 3d Machined 7d Alumina 7d Machined 14d Alumina 14d
SMAD2 SMAD family member 2 1.6 1.5 1.8 1.4 1.9SMAD3 SMAD family member 3 1.5 1.9 1.8 1.9 1.8SMAD4 SMAD family member 4 1.3 �1.2 1.1 �1.3 �1.1TWIST1 Twist homolog 1 1.7 1.5 �5.5 1.1 1.4
Other genesCTSK Cathepsin K 1.7 1.5 2.8* 3.0* 7.3*FN1 Fibronectin 1 2.1* 1.3 1.4 1.7 2.0*SERPINH1 Heat shock protein 47 2.3* 1.2 1.8 1.4 1.6STATH Statherin 4.3* 2.4 2.7* 2.4 4.1*
G. Mendonça et al. / Biomaterials 30 (2009) 4053–4062 4061
increased on Al at days 7 and 14 (4.0-fold) and had no changes on Msurface. The Sox9 mRNA expression was not observed in this study.
3.10. Other genes
Other genes evaluated in this study were: Cathepsin K (CTSK),Fibronectin 1 (FN1), and Heat shock protein 47 (HSP47). CTSKmRNA expression levels increased up to 7.3-fold for Al and 3-foldfor M at day 14. FN1 expression levels were increased for Al surfacesat days 3 (2-fold) and 14 (2-fold).
4. Discussion
This investigation of osteoblast-specific gene expression ofhMSCs adherent to different surface topographies indicates thereare changes that may be attributable to the scale magnitude ofsurface topographic features. Human MSCs that were differentiatedinto the osteoblastic lineage were evaluated with respect to theeffects of a surface with nanoscale features on the gene expressionprofile. Distinct pattern of gene regulation was observed for cells onmicron versus nanoscale topographic substrates. This is revealedprominently for OSX and BSP. The changes in mRNA levels observedin this study are attributed to an enhanced effect of nanostructuredsurfaces on osteoblast differentiation. Other studies have demon-strated its beneficial effects on osteoblast differentiation and boneaccrual around dental implants in vivo and in vitro [4,5,7,26]. Thisstudy also demonstrated that the chemical composition of thesurface could be altered, by adding aluminum or zirconium ontothe surface (Fig. 7 and Table 2). The nanofeatures on the surfaceswere around 20–50 nm and did not change significantly the micronscale roughness of the Machined surface.
Alumina nanoscale topography elicited a distinct responsefrom Machined and Acid etched surfaces and this difference wasexploited further. In an effort to identify further nanoscale specificresponses of differentiating hMSCs, 76 genes related to osteoblastdifferentiation and mineralized tissue formation were examined.In all cases of comparison, the nanoscale Alumina surfacepromoted more prominent osteoblastic gene expressions than theMachined surface. Induction of osteoblastic differentiation wasrevealed by all classes of genes explored (Fig. 8 and Table 3).Expression of Cartilage oligomeric matrix protein (COMP) wasgreater on nanoscale Al surfaces. COMP is an important compo-nent of endochondral ossification, but it was also demonstrated tobe expressed by osteoblasts in embryonic and adult tissues, butnot in osteocytes [30]. Collagen type I a2 (major component ofbone tissue) was up-regulated on Al surface at all time points, andincreased on M only at day 14. BMP1 or procollagen C proteinase,which is an enzyme responsible for removal of the C-terminalprocollagen propeptides of the major fibrillar collagen types I–III,is a secreted metalloprotease requiring calcium and needed forcartilage and bone formation [31,32] and it was also up-regulatedon Al surfaces at day 14.
Regarding the TGF/BMP superfamily, increased BMP2 and BMP4expression was noted for the Al surface at all time points. BMP5 wasalso highly expressed at days 3 and 14 for Al. For the M surface weonly observed an increase in BMP4 expression at day 14. Ho andcolleagues [33], suggested that BMP5 is required not only forskeletal patterning during embryonic development but also forbone response and remodeling to mechanical stimulation, whichmay be important for the implant/bone interface withstand theloading. TGFb1, another factor involved in osteoblast proliferationand differentiation [34], was also up-regulated on Al at all timepoints, but only at day 14 on M. Although we observed this increasein TGF/BMP superfamily genes, we did not observe any significantchanges in the SMAD transcription factor genes.
Otomo and colleagues [35], demonstrated that disruption of theFLT1 tyrosine kinase domain gene (FLT1(TK�/�)) led to significantreduction in the mineralizing surface, mineral apposition rate, andbone formation rate in the trabecular bone of the proximal tibiae ofFLT1(TK�/�) mice compared with those in (FLT1(TKþ/þ)) mice. Inour study the levels of FLT1 were increased in both surfaces at days7 and 14, but at day 14 the mRNA expression levels for Al (3.9-fold)was higher than for M (2.3-fold). Mayer and colleagues [36] eval-uated the expression of vascular endothelial growth factor (VEGFA)expression in hMSCs and the role of VEGF signaling in modulationof osteogenic differentiation. The authors found that transcripts forVEGFA were elevated during osteogenesis. High expression ofVEGFA stimulated mineralization [36]. They suggested that VEGFAacts as autocrine factor for osteoblast differentiation. Here, thelevels of VEGFA were increased on Al at days 3 and day 7 and thelevels of VEGFB were increased at day 14. Importantly, no changeswere observed for these genes on M surface.
For the genes related to the bone matrix, increased expression ofALP for M was recorded at all time points. Osteocalcin mRNA levelswere increased in adherent cells growing on Al surface at all timepoints, but at day 7 it reached its highest levels on M (8.6-fold).However, according to Kotobuki and colleagues [37], they sug-gested that OCN expression at the gene level does not lead to matrixmineralization.
In the present study, the modeled process of osseointegrationcould be differentiated as a function of surface topography at thenanoscale level. The in vitro molecular data, obtained for Al2O3,when compared with machined cpTitanium implant surfaces indi-cated greater osteoblastic differentiation through increased osteo-blast-specific gene expression. A systematic investigation of hownanoscale topography of a given bulk chemistry affects adherent cellbehavior related to osseointegration is indicated. The present datacannot explicitly distinguish between chemical and nanotopo-graphic effects. Similarities among all four coated surfaces wereobserved and they were distinguished from M and Ac surfaces.Other recent studies have shown that the size and characteristics ofthe features may be more important than chemical compositioneffects alone [5]. Therefore, nanoscale features (nanocues) play animportant role in the osteoblast-specific gene expression.
G. Mendonça et al. / Biomaterials 30 (2009) 4053–40624062
5. Conclusion
An improved response of hMSCs on titanium implant surfaceswith defined nanoscale features was observed as increased OSXand BSP mRNA expression. Further, it was demonstrated that thealuminum oxide nanoscale feature surface significantly changedthe hMSCs gene expression pattern towards an up-regulation inosteoblast differentiation. These surfaces may be able to improvethe osseointegration response providing a faster and more reliablebone to implant contact.
Acknowledgements
The authors would like to thank CAPES (Coordenaçao de Aper-feiçoamento de Pessoal de Nıvel Superior), CNPq (Conselho Nacionalde Desenvolvimento Cientıfico e Tecnologico), Neodent ImplanteOsteointegravel for its contributions to this article by grant.
Appendix
Figures with essential colour discrimination. Figure 8 of thisarticle may be difficult to interpret in black and white. The fullcolour image can be found in the on-line version, at doi:10.1016/j.biomaterials.2009.04.010.
References
[1] Ellingsen JE, Johansson CB, Wennerberg A, Holmen A. Improved retention andbone-to-implant contact with fluoride-modified titanium implants. Int J OralMaxillofac Implants 2004;19:659–66.
[2] Buser D, Broggini N, Wieland M, Schenk RK, Denzer AJ, Cochran DL, et al.Enhanced bone apposition to a chemically modified SLA titanium surface.J Dent Res 2004;83:529–33.
[3] Coelho PG, Suzuki M. Evaluation of an IBAD thin-film process as an alternativemethod for surface incorporation of bioceramics on dental implants: a studyin dogs. J Appl Oral Sci 2005;13:87–92.
[4] Guo J, Padilla RJ, Ambrose W, De Kok IJ, Cooper LF. Modification of TiO2 gritblasted titanium implants by hydrofluoric acid treatment alters adherentosteoblast gene expression in vitro and in vivo. Biomaterials 2007;28:5418–25.
[5] Mendes VC, Moineddin R, Davies JE. The effect of discrete calcium phosphatenanocrystals on bone-bonding to titanium surfaces. Biomaterials 2007;28:4748–55.
[6] Le Guehennec L, Soueidan A, Layrolle P, Amouriq Y. Surface treatments oftitanium dental implants for rapid osseointegration. Dent Mater 2007;23:844–54.
[7] Mendonça G, Mendonça DB, Aragao FJ, Cooper LF. Advancing dental implantsurface technology – from micron- to nanotopography. Biomaterials 2008;29:3822–35.
[8] Kasemo B. Biocompatibility of titanium implants: surface science aspects.J Prosthet Dent 1983;49:832–7.
[9] Nanci A, Wuest JD, Peru L, Brunet P, Sharma V, Zalzal S, et al. Chemicalmodification of titanium surfaces for covalent attachment of biologicalmolecules. J Biomed Mater Res 1998;40:324–35.
[10] Davies JE. Understanding peri-implant endosseous healing. J Dent Educ 2003;67:932–49.
[11] Albrektsson T, Wennerberg A. Oral implant surfaces: part 1 – review focusingon topographic and chemical properties of different surfaces and in vivoresponses to them. Int J Prosthodont 2004;17:536–43.
[12] Albrektsson T, Wennerberg A. Oral implant surfaces: part 2 – review focusingon clinical knowledge of different surfaces. Int J Prosthodont 2004;17:544–64.
[13] Schwartz Z, Nasazky E, Boyan BD. Surface microtopography regulatesosteointegration: the role of implant surface microtopography in osteointe-gration. Alpha Omegan 2005;98:9–19.
[14] Cooper LF, Zhou Y, Takebe J, Guo J, Abron A, Holmen A, et al. Fluoride modi-fication effects on osteoblast behavior and bone formation at TiO2 grit-blastedc.p. titanium endosseous implants. Biomaterials 2006;27:926–36.
[15] Christenson EM, Anseth KS, van den Beucken JJ, Chan CK, Ercan B, Jansen JA,et al. Nanobiomaterial applications in orthopedics. J Orthop Res 2007;25:11–22.
[16] Buser D, Schenk RK, Steinemann S, Fiorellini JP, Fox CH, Stich H. Influence ofsurface characteristics on bone integration of titanium implants. A histo-morphometric study in miniature pigs. J Biomed Mater Res 1991;25:889–902.
[17] Ogawa T, Nishimura I. Different bone integration profiles of turned and acid-etched implants associated with modulated expression of extracellular matrixgenes. Int J Oral Maxillofac Implants 2003;18:200–10.
[18] Dalby MJ, Gadegaard N, Tare R, Andar A, Riehle MO, Herzyk P, et al. The controlof human mesenchymal cell differentiation using nanoscale symmetry anddisorder. Nat Mater 2007;6:997–1003.
[19] Dalby MJ, Andar A, Nag A, Affrossman S, Tare R, McFarlane S, et al. Genomicexpression of mesenchymal stem cells to altered nanoscale topographies. J RSoc Interface 2008;5:1055–65.
[20] Webster TJ, Siegel RW, Bizios R. Osteoblast adhesion on nanophase ceramics.Biomaterials 1999;20:1221–7.
[21] Webster TJ, Ergun C, Doremus RH, Siegel RW, Bizios R. Enhanced functions ofosteoblasts on nanophase ceramics. Biomaterials 2000;21:1803–10.
[22] Webster TJ, Schadler LS, Siegel RW, Bizios R. Mechanisms of enhancedosteoblast adhesion on nanophase alumina involve vitronectin. Tissue Eng2001;7:291–301.
[23] Price RL, Gutwein LG, Kaledin L, Tepper F, Webster TJ. Osteoblast function onnanophase alumina materials: influence of chemistry, phase, and topography.J Biomed Mater Res A 2003;67:1284–93.
[24] Oh SH, Finones RR, Daraio C, Chen LH, Jin S. Growth of nano-scale hydroxyapatiteusing chemically treated titanium oxide nanotubes. Biomaterials 2005;26:4938–43.
[25] Scotchford CA, Gilmore CP, Cooper E, Leggett GJ, Downes S. Protein adsorptionand human osteoblast-like cell attachment and growth on alkylthiol on goldself-assembled monolayers. J Biomed Mater Res 2002;59:84–99.
[26] Isa ZM, Schneider GB, Zaharias R, Seabold D, Stanford CM. Effects of fluo-ridemodified titanium surfaces on osteoblast proliferation and gene expres-sion. Int J Oral Maxillofac Implants 2006;21:203–11.
[27] Pechini M. US Patent No. 3300697; 1967.[28] Abron A, Hopfensperger M, Thompson J, Cooper LF. Evaluation of a predictive
model for implant surface topography effects on early osseointegration in therat tibia model. J Prosthet Dent 2001;85:40–6.
[29] Jaiswal N, Haynesworth SE, Caplan AI, Bruder SP. Osteogenic differentiation ofpurified, culture-expanded human mesenchymal stem cells in vitro. J CellBiochem 1997;64:295–312.
[30] Di Cesare PE, Fang C, Leslie MP, Tulli H, Perris R, Carlson CS. Expression ofcartilage oligomeric matrix protein (COMP) by embryonic and adult osteo-blasts. J Orthop Res 2000;18:713–20.
[31] Amano S, Scott IC, Takahara K, Koch M, Champliaud MF, Gerecke DR, et al.Bone morphogenetic protein 1 is an extracellular processing enzyme of thelaminin 5 gamma 2 chain. J Biol Chem 2000;275:22728–35.
[32] Palmieri A, Pezzetti F, Brunelli G, Zollino I, Lo Muzio L, Martinelli M, et al.Zirconium oxide regulates RNA interfering of osteoblast-like cells. J Mater SciMater Med 2008;19:2471–6.
[33] Ho AM, Marker PC, Peng H, Quintero AJ, Kingsley DM, Huard J. Dominantnegative Bmp5 mutation reveals key role of BMPs in skeletal response tomechanical stimulation. BMC Dev Biol 2008;8:35.
[34] Macdonald KK, Cheung CY, Anseth KS. Cellular delivery of TGFbeta1 promotesosteoinductive signalling for bone regeneration. J Tissue Eng Regen Med2007;1:314–7.
[35] Otomo H, Sakai A, Uchida S, Tanaka S, Watanuki M, Moriwaki S, et al. Flt-1tyrosine kinase-deficient homozygous mice result in decreased trabecularbone volume with reduced osteogenic potential. Bone 2007;40:1494–501.
[36] Mayer H, Bertram H, Lindenmaier W, Korff T, Weber H, Weich H. Vascularendothelial growth factor (VEGF-A) expression in human mesenchymal stemcells: autocrine and paracrine role on osteoblastic and endothelial differen-tiation. J Cell Biochem 2005;95:827–39.
[37] Kotobuki N, Matsushima A, Kato Y, Kubo Y, Hirose M, Ohgushi H. Smallinterfering RNA of alkaline phosphatase inhibits matrix mineralization. CellTissue Res 2008;332:279–88.