the effects of immigration on nhs waiting times effects of immigration on nhs waiting times osea...
TRANSCRIPT

The Effects of Immigration on NHS Waiting Times
Osea Giuntella∗University of Oxford, IZA
Catia Nicodemo†University of Oxford, CHSEO, IZA
Carlos Vargas Silva‡University of Oxford, COMPAS
January 11, 2016
Abstract
This paper analyzes the effects of immigration on waiting times for the National HealthService (NHS) in England. Linking administrative records from Hospital Episode Statistics(2003-2012) with immigration data drawn from the UK Labour Force Survey, we find that im-migration reduced waiting times for outpatient referrals and did not have significant effectson waiting times in accident and emergency (A&E) and elective care. These results are ex-plained by the fact that immigration increases natives’ internal mobility and that immigrantstend to be healthier than natives who move to different areas. Conversely, we observe higheroutpatient waiting times in places to which native internal migrants have moved. Finally, wefind evidence that immigration increased waiting times for outpatient referrals in more de-prived areas outside of London. The increase in average waiting times in more deprived areasis concentrated in the years immediately following the 2004 EU enlargement and disappearsin the medium term (e.g., 3 to 4 years).
Keywords: Immigration, waiting times, NHS, access to health care, welfareJEL Classification Numbers: J61,I10
∗University of Oxford, Blavatnik School of Government and Nuffield College. 1 New Road, OX11NF, Oxford,Oxfordshire, UK. Email: [email protected].†University of Oxford, Department of Economics, Manor Road, OX13UQ, Oxford, Oxfordshire, UK. Email: ca-
[email protected]‡University of Oxford, Centre on Migration, Policy and Society (COMPAS), 58 Banbury Rd, OX26QS, Oxford,
Oxfordshire, UK. Email: [email protected]. We thank participants to seminars at Universitat deBarcelona, King’s College, University of Munich, Universitat Pompeu Fabra, University of Oxford, Royal EconomicSociety Conference (2015), International Health Economics Association Conference (2015). We thank Yvonni Markakifor precious research assistance. This publication arises from research funded by the John Fell Oxford University Press(OUP) Research Fund.
1
1 Introduction
The impact of immigration on the welfare of host-country residents has long been a con-
tentious topic. In the UK, a majority of the public has been opposed to more immigration since
at least the 1960s, and most people perceive the costs of immigration to be greater than the ben-
efits (Blinder, 2012). The EU enlargement of May 1, 2004, exacerbated this debate as citizens of
eight new member states (Czech Republic, Estonia, Hungary, Latvia, Lithuania, Poland, Slovakia
and Slovenia), commonly referred to as the A8, were granted immediate unrestricted rights to
work in the country. The UK was one of only three EU countries, including Ireland and Sweden,
that opened its labor market to A8 citizens immediately upon accession, a decision that led to a
substantial immigrant inflow to the UK.
Previous papers have analyzed the effect of immigration in the UK on public finances (Dust-
mann et al., 2010; Dustmann and Frattini, 2014), labor markets (Dustmann et al., 2013), the hous-
ing market (Sa, 2015) and crime (Bell et al., 2013), among others. We know less about the effects of
immigration on the National Health Service (NHS). Residents of the UK, including immigrants,
have free access to the NHS. This free access has resulted in speculation that immigrants may
increase the demand for NHS services disproportionately and that some immigrants move to
the UK with the explicit purpose of abusing the health care system. These arguments and the
potential health care costs associated with immigration have resulted in the introduction of an
NHS surcharge for non-EU citizens applying for a UK visa.
Despite the intense political debate on the impact of immigration on the NHS, research on
this topic has been limited by the paucity of data. Using longitudinal data from the British
Household Panel Survey, Wadsworth (2013) finds that immigrants generally use hospital and
general practice services at the same rate as those born in the UK. Steventon and Bardsley (2011)
provide evidence suggesting that the belief that immigrants use more secondary care than British
natives may be unfounded. Although these are valuable findings, these studies do not provide
information on the impact of immigration on NHS efficiency. Waiting times are an important
measure of the quality and productivity of a public health care system (Castelli et al., 2007;
Gaynor et al., 2012a; Propper et al., 2008a). This paper aims to provide insights on this impact by
examining NHS waiting times.
2

Waiting times function as a rationing mechanism in the NHS and play a role similar to a
price (Lindsay and Feigenbaum, 1984). Research suggests that waiting times are one of the
leading factors of patients’ dissatisfaction with the NHS (Appleby, 2012; Sitzia and Wood, 1997;
Propper, 1995). Postponing treatment delays the associated benefits and can have negative effects
on patient health (Siciliani and Iversen, 2012; Cullis et al., 2000). Average waiting times for some
NHS services were considerably high during the 2000s, and British politicians have suggested
that increased immigration was a key factor contributing to NHS waiting times.
Between 1993 and 2013, the number of foreign-born UK residents more than doubled from
3.8 million to approximately 7.8 million (Rienzo and Vargas-Silva, 2012). This increase in the
stock of immigrants is likely to have directly increased the demand for health care services. Im-
migration also affects the demographic composition and population morbidity rates, two factors
that have key repercussions for health care demand. These effects of immigration are likely to
vary significantly by location, as there is substantial variation across local areas in both the share
of immigrants and NHS capacity.
Using a basic theoretical framework, this paper investigates the effects of immigration on
waiting times in the NHS. We consider waiting times in outpatients (referrals), elective care and
A&E. We exploit a unique dataset created by merging administrative records and survey data.
To the best of our knowledge, no studies have directly examined the impact of immigration on
NHS waiting times. The purpose of this paper is to fill this gap in the literature.
Following previous studies on the effects of immigration in the UK (Sa, 2015; Bell et al., 2013),
we analyze the correlation between spatial variation in the immigrant inflows and waiting times
in England. We use immigration data at the local authority level drawn from the special license
access version of the UK Labour Force Survey (LFS), obtained via an agreement with the Office
of National Statistics (ONS). To study the effects of immigration on waiting times in the NHS, we
merge this information with administrative records drawn from the Hospital Episodes Statistics
(HES) provided by the Health and Social Care Information Centre (HSCIC) and extracted at the
lower super output area (LSOA) level.
As waiting times are not based on socioeconomic status, they are usually viewed as an equi-
table rationing mechanism in publicly funded health care systems. However, research provides
evidence of marked inequalities in waiting times across socioeconomic status (Cooper et al., 2009;
3

Laudicella et al., 2012; Propper et al., 2007). We also analyze differences in our results based on
the level of deprivation of the LSOA in order to explore differences in the impact of immigration
in different areas.
To address the concern that immigration may be endogenous to the demand for health ser-
vices and correlated with unobserved determinants of NHS waiting times, we used an instru-
mental variable approach exploiting the fact that historical concentrations of immigrants are a
good predictor of current immigrant inflows. By including local-area and year fixed effects and
controlling for local time-varying characteristics, we can reasonably assume that past immigrant
concentrations are uncorrelated with current unobserved shocks that could be correlated with
demand for health care services.
Although the political debate has mostly focused on the possible effects of immigration on
A&E, we find no evidence of significant effects on waiting times in A&E and elective care. Fur-
thermore, we find a reduction in waiting times for outpatient care. In particular, we show that
an increase in the stock of immigrants equal to 10% of the local initial population leads to a 19%
reduction in outpatient waiting times.
To investigate the mechanisms underlying the negative effect of immigration on waiting
times, we analyze the effects of immigration on native mobility, average morbidity in the pop-
ulation and health care supply. Consistent with previous studies, our results indicate that im-
migration increases natives’ likelihood of moving to different local authorities. Our analysis
also confirms that recent cohorts of immigrants are relatively young and healthy upon arrival
(“healthy immigrant effect”), suggesting that the increase in demand may have been less than
predicted by the NHS (Sa, 2015; Wadsworth, 2013; Steventon and Bardsley, 2011). These effects
on mobility and population composition are likely to explain the observed reduction in waiting
times. Meanwhile, we find that the supply of health care is not affected by immigration.
We also find that waiting times increased in areas that native internal migrants moved into
and that immigration increased the average waiting time for outpatients living in deprived areas
outside of London in the period immediately following the 2004 EU enlargement. Our findings
suggest that the short-term increase in outpatient waiting times in deprived areas in response to
immigration can be explained by both the lower mobility of incumbent residents in these areas
and the higher morbidity observed among immigrants moving into more deprived areas.
4

This paper is organized as follows. Section 2 presents the theoretical framework. Section
3 provides a discussion of the empirical specification, the identification strategy and the data.
Section 4 presents the main results of the paper. Section 5 discusses the potential mechanisms
explaining our main findings. We then illustrate the the heterogeneity of the results across
England in section 6 and present robustness checks in section 7. Concluding remarks are given
in section 8.
2 Theoretical framework
We illustrate the relationship between immigration and waiting times using a basic model of
the demand and supply of health care services. Our model builds on Lindsay and Feigenbaum
(1984); Windmeijer et al. (2005); Martin et al. (2007); Siciliani and Iversen (2012), and we extend
the model to explicitly incorporate the effects of immigration. Unless admitted through A&E, all
patients are referred by their GP to access NHS elective care. If patients receive a referral, they join
the waiting list for outpatient care. The specialist can decide whether the patient needs elective
hospital care, in which case the patient is placed on the waiting list for hospital admission.
Patients can alternatively seek private care or receive no care at all if the waiting time becomes
too long. The demand for NHS care will depend on the expected waiting time and on various de-
mand shifters, such the health needs of the population (e.g., morbidity), the proportion of elderly
patients, the overall size of the population, and other variables that may affect both the supply
and demand of health care services (e.g., the quality of NHS care, the level of competition).
The sign of the effect of immigration on waiting times is ambiguous. An increase in the
number of immigrants will affect demand and supply through its effects on demand shifters,
patients’ and managers’ expected waiting time, and the supply of health care personnel. The
effect on waiting times will tend to be positive if the increase in the immigrant population is
not offset by an increase in the supply. In the short term, managers may be constrained by
the annual budget-setting process. Moreover, as managers forecast waiting times depend on
the predicted change in population based on previous observations, unexpected immigration
inflows may result in excess demand. As such, the supply may not adjust immediately because
of differences between predicted and actual inflows or because of budget constraints. By contrast,
5

the effect could be negative if the supply increases more than the actual demand for health care
services. This may occur if immigration leads natives to move to and/or seek care in different
areas or in the private sector and if immigrants have a lower incidence of morbidities or, more
generally, a lower demand for health care services. If natives with higher incomes are more likely
to move (or seek private care) as a response to immigration inflows, one may expect the negative
effect of native out-migration on waiting times to be amplified in less deprived areas. One may
instead expect larger positive effects of immigration on waiting times in areas where the demand
for health care services is less elastic (higher mobility costs) or in areas that attract less healthy
immigrants.
Following Siciliani and Iversen (2012), we can describe the demand and supply function in
the following way:
Ydi = α0 + α1wi + α2xd
i + α3zi + edi (1)
Ysi = β0 + β1wi + β2xs
i + β3zi + esi (2)
where Ydi and YS
i are the demand and supply of health care in area i and wi is the waiting time.
Under the equilibrium assumption Ydi =YS
i , we can write the waiting time as a function of demand
and supply shifters:
wi = γ0 + γ1xdi + γ2xs
i + γ3zi + ei (3)
where
γ0 = α0−β0β1−α1
, γ1 = α2β1−α1
, γ2 = −β2β1−α1
, γ3 = α3−β3β1−α1
.
We can adapt this framework to analyze the effects of immigration as an exogenous shock to
the demand for health care services. Formally,
wit = λ0 + λ1 IMMit + λ2Xd,it + λ3Xs,it + λ4Zit + µi + ηt + eit (4)
where wit is the average waiting time in local area i, λ1 captures the effect of an increase in
the number of immigrants living in local area i on waiting times, λ2 (λ3) are the parameters
associated with a vector of variables controlling for other demand (supply) shifters, λ4 captures
6

the effects of variables affecting both the supply and demand for health care services, and µi and
ηt are the health local area and time fixed effects.
3 Data and Empirical Specification
3.1 Data
Data on waiting times are extracted from the HES database provided by the HSCIC. The HES
dataset includes patients treated by the publicly funded NHS in England. The HES database is
a record-based system that covers all NHS trusts in England, including acute hospitals, primary
care trusts and mental health trusts. We extracted data on waiting times and basic population
demographics from the HES at the LSOA level. LSOAs were designed to improve the reporting
of small-area statistics and are constructed from groups of output areas. England is divided
into 32,483 LSOAs with a minimum population of 1,000 inhabitants and a maximum of 3,000
inhabitants.
The HES dataset provides counts and time waited for all patients referred or admitted to a
hospital (inpatients, outpatients and A&E). For outpatients and inpatients, we restrict the analysis
to first admissions and exclude maternity data. Data on waiting times for outpatients and elective
care are available for the entire period under analysis (2003-2012), while in the HES dataset, we
have data on A&E only since 2007. Waiting times for outpatients are defined as the number of
days that a patient waits from the referral date to the appointment with the specialist; waiting
times for elective care are defined as the period between the date of the decision to admit and
the date of actual admission. For the A&E department, waiting times are defined as the minutes
from a patient’s arrival in the A&E room and the decision of transfer, admission or discharge
the patient. We calculate the average waiting time for outpatients, elective care and A&E by the
LSOA of patients’ residence. Note that in England, to access an NHS specialist, individuals must
obtain a referral from their GP. Until 2015, although patients had the the right to choose a GP
practice, for most people, this choice was limited to a practice near where they lived, as the GP
surgeries could refuse to register the patient if he resided outside the practice boundaries.1 Until
1Since January 5, 2015, all GP practices in England are free to register new patients who live outside their practiceboundary area. See also http://www.nhs.uk/choiceintheNHS/Yourchoices/GPchoice/Pages/ChoosingaGP.aspx.
7

2006, patients had no choice in their hospital when seeking a referral to see a specialist; the GP
would decide for the patient. Since January 2006, NHS patients can choose between 5 hospitals.
However, the evidence suggests that patients have strong preferences for short distances and
that, on average, patients did not travel any farther and were not less likely to choose the closest
hospital after the 2006 reform (Gutacker et al., 2015; Gaynor et al., 2012b). As noted by Dixon and
Robertson (2011), despite the increased choice and the provision of information on differences
in the quality of care between hospitals, patients tend to be loyal to their local providers. For
instance, Beckert et al. (2012) show that patients traveled, on average, just over 12 km for a hip
operation in 2008-2009.
In addition, we use data at the primary care trust (PCT) level from the HES and HSCIC
databases on the supply side, including information on the number of GPs, the number of GP
practices, the number of specialists, the ratio of occupied beds in the PCT hospitals, the annual
NHS expenditure and the number of doctors with a foreign degree. Using these variables, we
can partially account for time-varying changes in the NHS supply at the PCT level. PCTs were
largely administrative bodies responsible for commissioning primary, community and secondary
health services from providers until 2013. As of October 1, 2006, there were 152 PCTs in England,
with an average population of just under 330,000 per trust. After these changes, approximately
70% of PCTs were coterminous with local authorities having social service responsibilities, which
facilitated joint planning. PCTs were replaced by clinical commissioning groups on March 31,
2013, as part of the Health and Social Care Act of 2012.
We use information on the immigrant population by local authority and year drawn from
the special license of the UK LFS between 2003 and 2012. We define immigration based on
country of birth and pool quarters for each year. The LFS is the largest household survey in
the UK and consists of a sample of approximately 40,000 households (100,000 individuals) per
quarter. Even with its large size, concerns could arise regarding the accuracy with which this
survey measures the size of the immigrant stock at smaller geographical levels (even when data
are pooled across quarters for a given year). Therefore, as a robustness check, we also use data
from NINO registrations of overseas nationals from the Department for Work and Pensions (see
Section 7 and the Data Appendix).
The merged sample includes 32,483 LSOAs, 141 local authorities, 150 PCTs, and 16 regions
8

of residence in England. Each LSOA belongs to a given PCT and a given local authority. In our
sample, 127 PCTs (90%) are coterminous with local authorities.
Table 1 presents the summary statistics on waiting times, the immigrant share of the popula-
tion and a vector of variables affecting the demand and supply of health care services. For the
2003-2012 period, the average waiting time for outpatients was 47 days, while that for inpatients
was 70 days. The average waiting time for A&E was 52 minutes.
The native population of the UK has remained relatively stable for the last decade. In contrast,
the foreign-born population increased continuously over the same period, with a sharp increase
in individuals born in other EU countries. Figure 1 shows the growth in the foreign-born share
of the population of England between 2003 and 2012. During that period, the foreign-born share
of the working-age population increased from 9% to 13%. The EU expansion induced a sharp
increase in the number of recent immigrants–defined as foreign-born people who have been
living in the UK for 5 years or less–from 2% to 4% of the population (Rienzo and Vargas-Silva,
2012). Another indicator of the growth in the migrant population is the trend in new immigrant
GP registrations. As shown in Figure 2, new immigrant GP registrations as a share of the total
population in England increased from 0.9% in 2004 to 1.15% in 2010.
Waiting times decreased for outpatients and elective care between 2003 and 2012 and for A&E
between 2007 and 2012, as reported in Figure 3. This outcome is partly the result of NHS policies
implemented during this period. The NHS Plan in 2000 shifted the focus from the size of the
waiting list to the maximum waiting times experienced by patients. In particular, the government
adopted an aggressive policy of targets. The maximum wait for inpatient and day-case treatment
was reduced from 18 to 6 months, while the maximum wait for an outpatient appointment was
reduced from 6 to 3 months. Targets were coupled with the release of information on waiting
times at the hospital level and strong sanctions for poorly performing hospital managers. These
changes led to a significant reduction in the percentage of patients waiting at various points of
the distribution of waiting times (Propper et al., 2008b). However, as shown in Figure 3, there has
been an increase in waiting times for elective care since 2008 (see also Appleby et al. (2014)).2.
Finally, we also use data on health status, self-reported disability and health care use from
2For a more detailed analysis of recent trends in NHS waiting times, see also the2014 Department of Health Report: https://www.nao.org.uk/wp-content/uploads/2014/01/
NHS-waiting-times-for-elective-care-in-England.pdf.
9

the Labor Force Survey, Understanding Society and General Household Survey (see the Data
Appendix).
3.2 Identification Strategy
To identify the effect of immigration on NHS waiting times, we exploit variation over time
in the share of immigrants living in a local authority between 2003 and 2012. In our baseline
specification, we estimate the following model:
wit = α + βSlt + X′itγ + Z′ptλ + µp + ηt + εit, (5)
where wit is the average waiting time (for outpatients, elective care, or A&E) in LSOA i belonging
to the PCT p at time t; Slt is the share of immigrants in local authority l at time t; X′it is a vector
of time-varying LSOA characteristics (index of deprivation and rural indicator); Z′pt is a vector
of time-varying characteristics at the PCT level, and µp and ηt are PCT and year fixed effects,
respectively; and εit captures the residual variation in waiting times.3 To capture time-invariant
characteristics that may be correlated with both waiting times and immigration inflows we con-
trol for PCT fixed effects. PCTs are the health administrative areas responsible for commissioning
primary, community, and secondary health services from providers. The capacity of the nearest
hospital is likely to determine the average waiting time in a given LSOA. LSOAs served by the
same hospitals would therefore share common determinants of waiting times. Thus, we include
nearest NHS trust fixed effects instead of PCT fixed effects as a robustness check.
The use of geographical variation in the share of immigrants (often called an “area approach”)
has been criticized by scholars (e.g., Borjas et al., 1996; Borjas, 2003) for two main reasons. First,
natives may respond to the impact of immigration on a local area by moving to other areas. This
is important in our study because healthier natives may be more likely to migrate. Following
Borjas et al. (1996), we test the robustness of our results to a change in the geographical unit
using a higher level of aggregation. Furthermore, we analyze the effects of immigration on
native internal mobility and examine whether waiting times were affected by native internal
3As immigration information is available only at the local authority level, we cannot control for LSOA fixed effectsin the regression.
10
inflows across local authorities.
The second critique of the area approach is that immigrants might endogenously cluster in
areas with better economic conditions. To address the concern of a local unobserved shock af-
fecting both native and immigrant labor demand, we adopt an instrumental variable approach.
Following Altonji and Card (1991), Card (2001), Bell et al. (2013) and Sa (2015), we use an instru-
mental variable based on a “shift share” of national levels of immigration into local authorities
to impute the supply-driven increase in immigrants in each local authority.
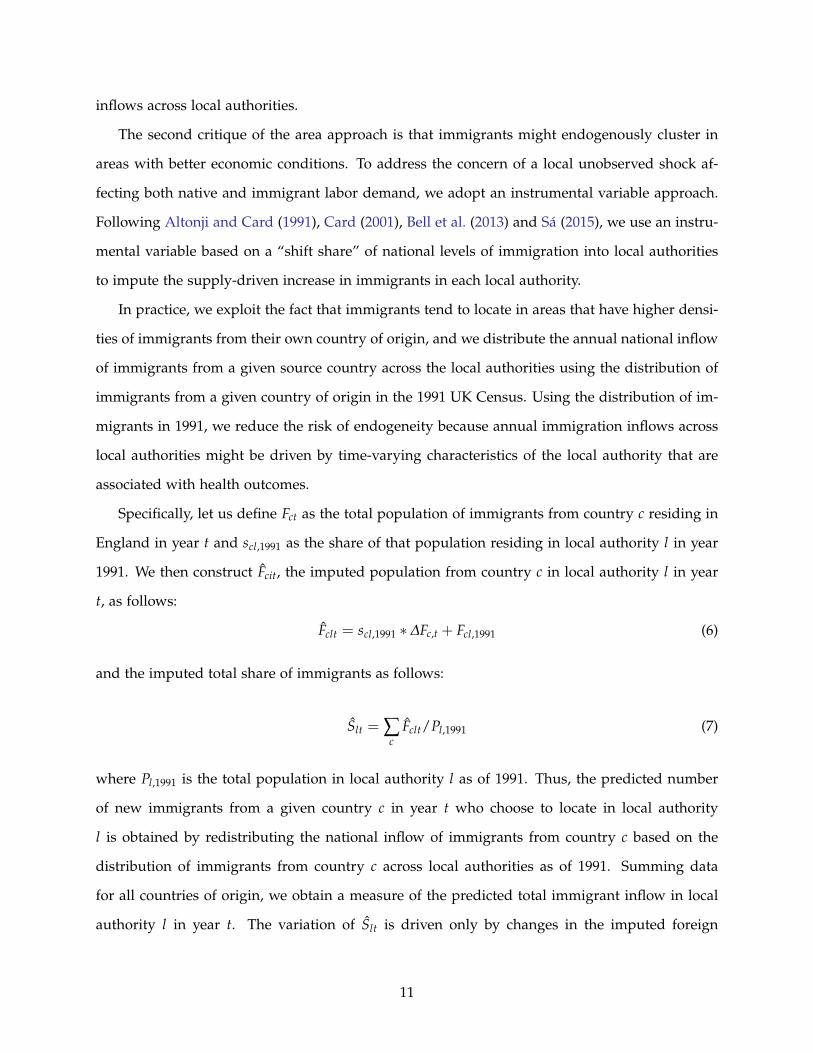
In practice, we exploit the fact that immigrants tend to locate in areas that have higher densi-
ties of immigrants from their own country of origin, and we distribute the annual national inflow
of immigrants from a given source country across the local authorities using the distribution of
immigrants from a given country of origin in the 1991 UK Census. Using the distribution of im-
migrants in 1991, we reduce the risk of endogeneity because annual immigration inflows across
local authorities might be driven by time-varying characteristics of the local authority that are
associated with health outcomes.
Specifically, let us define Fct as the total population of immigrants from country c residing in
England in year t and scl,1991 as the share of that population residing in local authority l in year
1991. We then construct Fcit, the imputed population from country c in local authority l in year
t, as follows:
Fclt = scl,1991 ∗∆Fc,t + Fcl,1991 (6)
and the imputed total share of immigrants as follows:
Slt = ∑c
Fclt/Pl,1991 (7)
where Pl,1991 is the total population in local authority l as of 1991. Thus, the predicted number
of new immigrants from a given country c in year t who choose to locate in local authority
l is obtained by redistributing the national inflow of immigrants from country c based on the
distribution of immigrants from country c across local authorities as of 1991. Summing data
for all countries of origin, we obtain a measure of the predicted total immigrant inflow in local
authority l in year t. The variation of Slt is driven only by changes in the imputed foreign
11
population (the denominator is held fixed at its 1991 value) and is used as an instrument for the
actual share of immigrants in local authority l at time t (Slt).
One potential threat to the validity of this approach is that the instrument cannot credibly ad-
dress the resulting endogeneity problem if the local economic shocks that attracted immigrants
persist over time. However, this problem is substantially mitigated by including PCT fixed effects
and by controlling for time-varying characteristics at the LSOA and PCT levels; thus, we can rea-
sonably assume that past immigrant concentrations are not correlated with current unobserved
local shocks that might be correlated with health. Under the assumption that the imputed inflow
of immigrants is orthogonal to the local specific shocks and trends in labor market conditions
after controlling for PCT and year fixed effects and time-varying characteristics of LSOAs and
PCTs, the exclusion restriction holds.
4 Results
4.1 Waiting Times for Outpatients
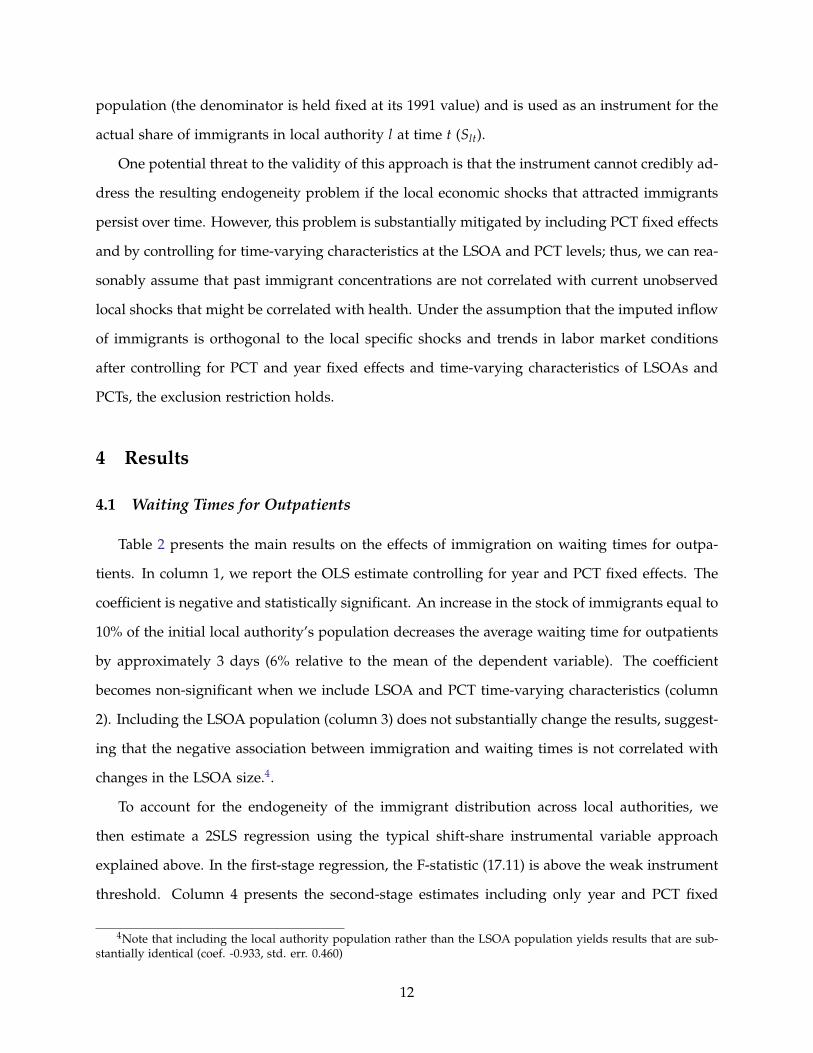
Table 2 presents the main results on the effects of immigration on waiting times for outpa-
tients. In column 1, we report the OLS estimate controlling for year and PCT fixed effects. The
coefficient is negative and statistically significant. An increase in the stock of immigrants equal to
10% of the initial local authority’s population decreases the average waiting time for outpatients
by approximately 3 days (6% relative to the mean of the dependent variable). The coefficient
becomes non-significant when we include LSOA and PCT time-varying characteristics (column
2). Including the LSOA population (column 3) does not substantially change the results, suggest-
ing that the negative association between immigration and waiting times is not correlated with
changes in the LSOA size.4.
To account for the endogeneity of the immigrant distribution across local authorities, we
then estimate a 2SLS regression using the typical shift-share instrumental variable approach
explained above. In the first-stage regression, the F-statistic (17.11) is above the weak instrument
threshold. Column 4 presents the second-stage estimates including only year and PCT fixed
4Note that including the local authority population rather than the LSOA population yields results that are sub-stantially identical (coef. -0.933, std. err. 0.460)
12

effects. The coefficient diminishes by approximately 30% when including LSOA and PCT time-
varying characteristics (column 5) but is still negative and significant, suggesting that an increase
in the stock of immigrants equal to 10% of the initial local authority’s population would reduce
the average waiting time for outpatients by approximately 9 days (19% relative to the mean of
the dependent variable). Propper (1995) estimated that patients would be willing to pay GBP 80
(in 1991 prices)–roughly GBP 150 in 2013 prices–for a reduction of one month in waiting times. If
disutility from the waiting list were linear, one could estimate that a 10-day reduction in waiting
time would be equivalent to GBP 37.5 in 2013 prices.
Again, including population size (column 6) does not change the results. Overall, these
results suggest that immigration was associated with a reduction in the average waiting time for
outpatients.
As a robustness check in Table A.1, we replicate the analysis using nearest NHS trust fixed ef-
fects instead of PCT fixed effects. The coefficient of our preferred estimate (column 5) is smaller–
but not statistically different–than the one reported in Table A.1, suggesting that an increase in
the stock of immigrants equal to 10% of the initial local authority’s population would reduce the
average waiting time for outpatients by approximately 6 days (13% relative to the mean of the
dependent variable).
4.2 Waiting Times in Elective Care
In Table 3, we examine the effects of immigration on waiting times for elective care. The OLS
estimate reported in column 2, which includes LSOA time-varying characteristics, year and PCT
fixed effects, suggests that immigration is negatively associated with waiting time for elective
care. An increase of 10 percentage points in the immigration share is associated with a 5-day
reduction in the average waiting time for elective care (a 7% reduction relative to the average
waiting time for elective care observed in the sample). However, the 2SLS estimate presented in
column 4 is positive and non-significant, and the point estimate suggests a relatively small effect
(+2% relative to the mean).
13
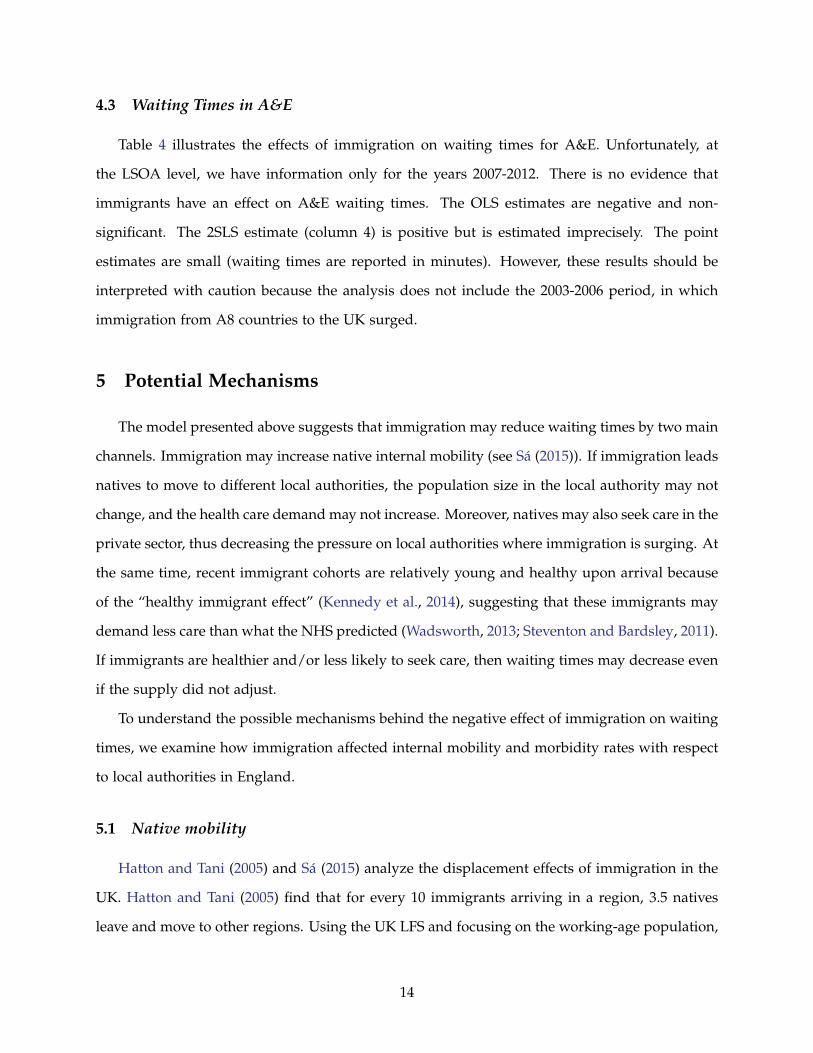
4.3 Waiting Times in A&E
Table 4 illustrates the effects of immigration on waiting times for A&E. Unfortunately, at
the LSOA level, we have information only for the years 2007-2012. There is no evidence that
immigrants have an effect on A&E waiting times. The OLS estimates are negative and non-
significant. The 2SLS estimate (column 4) is positive but is estimated imprecisely. The point
estimates are small (waiting times are reported in minutes). However, these results should be
interpreted with caution because the analysis does not include the 2003-2006 period, in which
immigration from A8 countries to the UK surged.
5 Potential Mechanisms
The model presented above suggests that immigration may reduce waiting times by two main
channels. Immigration may increase native internal mobility (see Sa (2015)). If immigration leads
natives to move to different local authorities, the population size in the local authority may not
change, and the health care demand may not increase. Moreover, natives may also seek care in the
private sector, thus decreasing the pressure on local authorities where immigration is surging. At
the same time, recent immigrant cohorts are relatively young and healthy upon arrival because
of the “healthy immigrant effect” (Kennedy et al., 2014), suggesting that these immigrants may
demand less care than what the NHS predicted (Wadsworth, 2013; Steventon and Bardsley, 2011).
If immigrants are healthier and/or less likely to seek care, then waiting times may decrease even
if the supply did not adjust.
To understand the possible mechanisms behind the negative effect of immigration on waiting
times, we examine how immigration affected internal mobility and morbidity rates with respect
to local authorities in England.
5.1 Native mobility
Hatton and Tani (2005) and Sa (2015) analyze the displacement effects of immigration in the
UK. Hatton and Tani (2005) find that for every 10 immigrants arriving in a region, 3.5 natives
leave and move to other regions. Using the UK LFS and focusing on the working-age population,
14

Sa (2015) finds even larger effects, suggesting a 1-to-1 immigrant-native displacement. In Table
5, we replicate the same analysis of Sa (2015) focusing on the population 15 years of age and
older.5 As we are interested in the effects of immigration on the NHS, it is important for us to
consider the effects on the elderly, who represent an important share of the demand for health
care services.
Exploiting LFS information on residence in the previous year, we analyze the response of the
native population to immigration in our examination of in-migration and out-migration rates.
Following Sa (2015), we classify natives as having moved out of local authority l if they lived
in local authority i in the previous year (t− 1) and currently, in year t, live in a different local
authority. We then define the out-migration rate as the number of natives who moved out of local
authority l divided by the native population of local authority l in year t. Similarly, we classify
natives as having moved into local authority l if they live there in year t and were living in a
different local authority in the previous year. We compute the in-migration rate as the ratio of
the the number of natives who moved into local authority l to the native population of l in year
t− 1. The out-migration rate is simply the difference between the out-migration and in-migration
rates.
To examine the effect of immigration on native out-migration, in-migration and net out-
migration rates, we estimate the following equation:
mobilitylt = β∆FBlt/Poplt−1 + φt + ρl + εlt (8)
The dependent variables are the native out-migration, in-migration or net out-migration rate.
The coefficient β captures the change in mobility rates generated by an immigration increase
equal to 1% of the local authority population. As the mobility of natives is affected by many
factors that may also be correlated with the immigrant inflow in a local area, we adopt the
instrument based on historical settlement patterns of immigrants to address the endogeneity
concern.
Overall, our results are in the same direction as those obtained by Sa (2015) and, if anything,
suggest an even larger displacement of natives. An increase in the stock of immigrants equal to
5Information on the local authority of residence in the year before the interview is available in the LFS since 2004.
15

1% of the local initial population increases the native out-migration rate by 16 percentage points
and the native in-mobility rate by 6.2 percentage points. As a result, native net out-migration rate
increases by 9.7 percentage points.6 These results confirm that immigration leads natives to move
to different areas. This also explains why we find no differences in the effect of immigration on
waiting times when we include population size as a control variable.
Native out-migration in response to immigration may increase demand for health care ser-
vices in the local areas to which natives move. As shown in Table 6 (column 1), an increase of
1 percentage point in the native population relative to the resident population in the previous
year increases the average waiting time for outpatients by approximately 6 days (13% more rela-
tive to the mean of the dependent variable). The coefficient diminishes when we include LSOA
time-varying characteristics (column 2) and does not change substantially when we control for
population size. The effect of native out-migration on waiting times for elective care and A&E is
insignificant (not reported).
5.2 Immigration and Health
As returns on migration are higher for healthier individuals, immigrants are likely to self-
select migration based on health, along with other dimensions (e.g., education, Palloni and
Morenoff (2001); Jasso et al. (2004); Giuntella (2013)). Kennedy et al. (2014) show that this is
particularly true for less educated immigrants, who have much better health outcomes than the
average native person with low education.
The LFS contains questions on whether individuals had a health problem lasting more than
12 months, whether they reported any disability7, and whether they had days off work because
they were sick or injured in the reference week. Unsurprisingly, we find a positive and signif-
icant correlation between the incidence of individuals reporting health problems and disability
and waiting times across Englands local authorities. For instance, an increase of 10 percentage
points in the share of individuals reporting health problems is associated with a 9.3% increase in
average waiting times for outpatients (results are available upon request). By changing the de-
6Consistent with these results, our findings indicate that an increase in the share of immigrants living in a localauthority has no significant effects on the local authority population size.
7We include both individuals who have a long-term disability that substantially limits their day-to-day activitiesand those who have a long-term disability that affects the kind or amount of work that they can do.
16

mographic composition of the population living in a local area, immigration may affect the share
of individuals reporting health problems and disability and thus affect waiting times. To inves-
tigate this potential mechanism, in Table 7, we analyze immigrant-native differences in health
using individual data from the LFS (2003-2012).
Panel A shows that foreign-born individuals are significantly less likely to report any health
problem. In particular, the raw difference reported in column 1 shows that immigrants in Eng-
land are 8 percentage points less likely (than their UK-born counterparts) to report a health
problem lasting more than a year. This is equivalent to a 25% difference with respect to the mean
of the dependent variable in the sample (32%). The difference becomes smaller when we account
for age, education, gender and year fixed effects, indicating a difference of 4.6 percentage points
equivalent to 15% of the mean (column 2). The coefficient remains stable when we include local
authority fixed effects (column 3). In Panel B, we illustrate the difference in the likelihood of
reporting any disability. On average, immigrants are 4.4 percentage points less likely to report
any disability (column 1). The coefficient reduces to 2.8 percentage points when we account for
sociodemographic characteristics, year fixed effects (column 2), and local authority fixed effects
(column 3), revealing a 12% difference with respect to the incidence of disability in the sample
(22%). Immigrants are also less likely to take time off because of health problems. The condi-
tional difference reported in column 3 of Panel C shows that foreign-born individuals are 17%
less likely to be absent from work because of health problems than their UK-born counterparts.
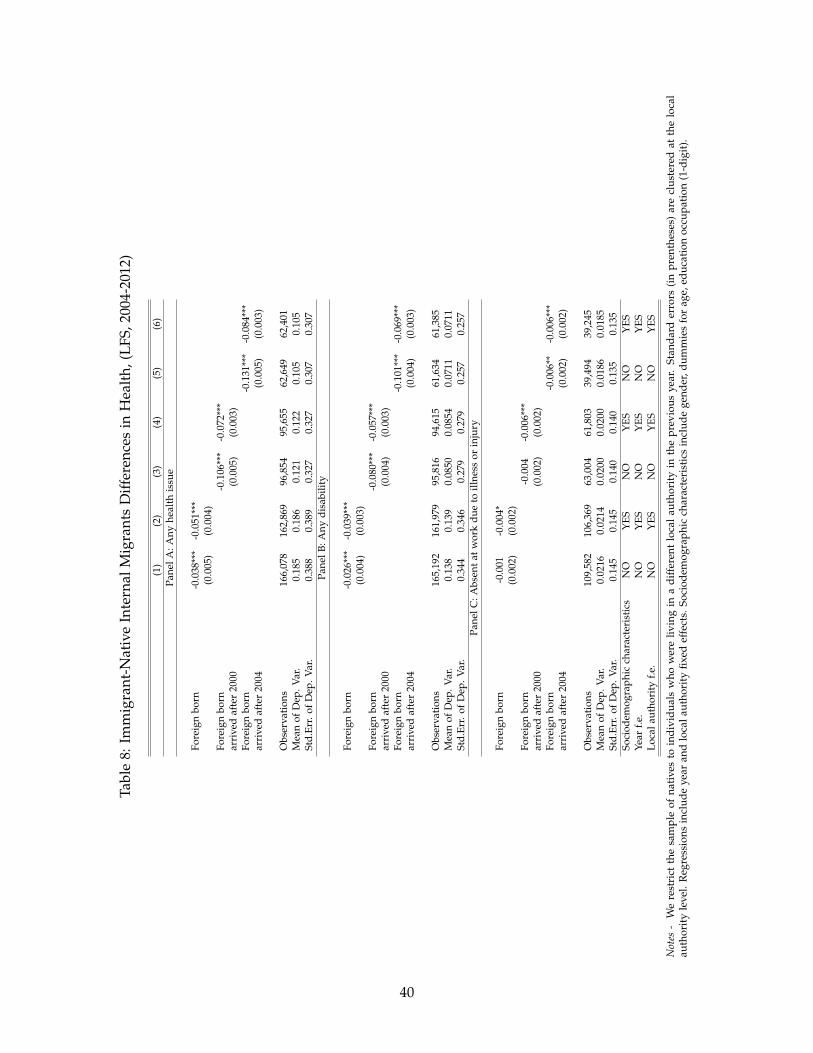
In Table 8, we restrict the native sample to individuals who resided in a different local authority
in the previous year. The results show that immigrants tend to be healthier than native internal
migrants. Consistent with previous literature on the healthy immigrant effect, the advantage is
larger among recent cohorts of immigrants (columns 3-6).
These results are also confirmed when we use data from the Understanding Society survey
(2009-2014). As shown in Table 9, the Understanding Society data suggest that immigrants are
less likely to report having a poor health status, any health limitation, or any disability. This
is particularly true for immigrants who arrived in England after 2000. The health immigrant
advantage still remains when we control for sociodemographic characteristics such as gender,
age, education, marital status, occupational category, region of residence, rural status, and year
fixed effects. Given these findings, it is unsurprising that immigrants are less likely to use health
17

care services than natives.
Using the same Understanding Society sample, we also illustrate differences between im-
migrants and natives in their health care use (see Table 10). Consistent with previous findings
by Wadsworth (2013) and Steventon and Bardsley (2011), we find that recent immigrants are
significantly less likely than natives to have consulted a GP and to have received treatment as
outpatients or inpatients. Again, the results hold when we control for sociodemographic charac-
teristics.8
As shown in Panel C in Table 10, immigrants are overall more likely to use GP services. This
result is driven by earlier cohorts of immigrants. Recent cohorts are, by contrast, less likely than
natives to use GP services (column 3-6).9 We obtain similar results using the General Household
Survey (2002-2006). See Table A.2 in the appendix for further details.
5.3 Immigration and the Supply of Health Care
Thus far, we have focused on the effects of immigration on the demand for care and waiting
times. However, immigration may also induce a rightward shift in supply, as many doctors and
nurses come to the UK from overseas, increasing the supply of health care personnel. In this
section, we analyze how immigration affects the supply of health care services by focusing on
the number of GPs, the number of GPs who graduated abroad, specialists, GP practices, the ratio
of occupied hospital beds to the population, and average NHS expenditure.
The results presented in Table 11 reveal no evidence of a significant association between
immigration and the health care supply across England. As the NHS supply may not adjust
immediately to immigration, we also replicate the same estimates using a model with long dif-
ferences (between years t and t-3) and confirm the lack of any significant effect on the supply
side at the local level.10 Consistent with these results, using data on individual occupations from
the LFS 2003-2012, we find no evidence of a significant relationship between immigration and
8Dustmann and Frattini (2014) estimate that immigrants from the European Economic Area (EEA), particularlyimmigrants from countries that joined the EU in 2004, made a positive fiscal contribution. Our results suggestthat their estimates may be downward biased because they estimate the proportion of health services expenditureattributable to each group based on the groups age structure, yet we show that immigrants are healthier than nativesin their same age group even after controlling for socioeconomic status and education.
9Note that information on doctor and hospital services is available only in the 4th wave of the UnderstandingSociety survey.
10The results are available upon request.
18

the proportion of health care professionals and nurses in the population. Furthermore, when
including the number of GPs, health care professionals and nurses in our main regression on
waiting times, we find that the coefficient is not substantially affected.11
While the NHS is strongly dependent on foreign-trained doctors and foreign health care
professionals, the lack of a significant association between immigration and the supply of health
care may have several explanations. First, the large majority of immigrants do not work in
the NHS, and this could affect the correlation between the share of immigrants and the staff
size across local authorities. Indeed, using LFS data (2003-2012), only 7% of the working-age
immigrant population works in professional health care occupations, including medical doctors,
dentists, pharmacists, nurses and midwives. Second, the vast majority of foreign-born health
care professionals are concentrated in a few areas (e.g., London, Oxford), as local authorities
with the highest provision of doctors and nurses are those with major cities/urban centers along
with medical schools and teaching hospitals (Yar et al., 2006; Shutes, 2011). Third, many new
immigrants working in the NHS could be substituting for natives or other immigrants and may
not necessarily increase the supply of NHS staff. It is also important to note that an increase in the
number of GPs or practitioners may not necessarily reduce waiting times (Silvester et al., 2004;
Devlin et al., 2002). Previous studies analyzing the association between waiting lists and supply
measures such as the number of consultants, the number of beds and hospital expenditure have
found no clear pattern (Cullis et al., 2000). Finally, there is evidence that while NHS increased
the number of qualified doctors and nurses during the 2002-2012 period, the productivity of
consultants specialists decreased over this period (Bohmer and Imison, 2013).
6 The Heterogeneous Impact of Immigration Across Local Authorities
The extent of immigrant health selectivity is likely to differ among local authorities in Eng-
land. Figure 4 shows that both natives and immigrants in more deprived areas are more likely
11Immigrants represent a large and growing share of care workers in the UK who provide home care servicesfor elderly natives (Shutes, 2011). While home care workers are unlikely to have any direct effect on waiting times,they may affect population access to NHS health care services by increasing early diagnosis and patient mobility. Toverify whether our main result is partially explained by the increase in home care workers induced by immigration,we include the share of foreign-born home care workers as a control when analyzing the effect of immigration onwaiting times. The coefficient is only marginally higher–and not statistically different–than that found in our baselinespecification. The results are available upon request.
19

to report health problems lasting more than 12 months and disabilities. Unsurprisingly, Table
12 shows that individuals living in areas with an Index of Multiple Deprivation (IMD) above
the median are, on average, less healthy than those living in less deprived areas.12 In particular,
immigrants in deprived areas tend to be less favorably selected (see columns 5 and 6).
There is evidence that migrants moving to less deprived areas are healthier than migrants
who move to more deprived locations, thus increasing health inequalities across areas (Norman
et al., 2005). This suggests that the effects of immigration on waiting times may be very different
in deprived areas, particularly as these are areas where the supply tends to be more inelastic,
where the population faces higher mobility costs, and where waiting times tend to be longer
(Laudicella et al., 2012).
In Table 13, we explore this further by estimating the impact of immigration on outpatient
waiting times based on the level of deprivation of the area.13 The results show that the negative
effect on waiting times for outpatients is driven by less deprived areas. Columns 1-5 report the
estimates of the main effect for LSOAs in the different quintiles of the IMD distribution. The table
shows that the negative effect is largest (in absolute value) in the LSOAs in the less deprived areas
(Q1) and lowest in the more deprived areas (Q5), with the coefficient decreasing monotonically
along the IMD distribution.14
We also investigate whether there are any specific short-term effects of immigration in de-
prived areas and whether the results are affected by the inclusion of London, the region that
has the largest concentration of immigrants and the largest health care supply in England. We
find that the results are affected by the exclusion of London and the focus on more deprived
areas of England before 2008. In particular, columns 4-5 of Table 14 show that immigration had
a heterogeneous impact across England and that, at least in the first years following the 2004 EU
enlargement, immigration increased the average waiting time in deprived areas outside of Lon-
don. Column 4 shows that in the first three years after the 2004 EU enlargement, an increase of 10
percentage points in the share of immigrants living in a local authority increased waiting times
by approximately 14 days (a 25% increase relative to the mean of the dependent variable) when
12Note that we exclude the health domain from the computation of the IMD score.13We replicate Table 14 for waiting times in elective care and A&E but find no evidence of significant effects even
when restricting the analysis to deprived areas outside of London.14Note that in Table 13, we include region fixed effects rather than PCT fixed effects, as the smaller sample size of
each quintile does not allow us to have sufficient identification power when using PCT fixed effects.
20
we restrict the analysis to local authorities with an IMD above the median. The effect becomes
even larger (20 days, + 38% of the mean of the dependent variable) when limit the sample to the
4 highest deciles of the IMD. With the estimates of Propper (1995) on the cost of waiting time, an
average increase of 20 days in waiting time would be equivalent to GBP 100 (in 2013 prices) per
patient.
As shown in Figure 4 and Table 12, deprived areas attract immigrants with worse health
status. One of the factors contributing to the higher morbidity of immigrants moving into more
deprived areas may be the greater presence of non-economic immigrants. Previous studies have
shown that refugees and asylum seekers have worse health than economic migrants (Chiswick
et al. (2008)). In the UK, most asylum seekers are assigned to local areas by the UK government
based on space and logistical considerations. However, as noted by Bell et al. (2013), asylum seek-
ers are disproportionately sent to deprived areas. Using data from the Home Office Immigration
Statistics confirms this result in Figure 5.
In Table A.3, we show that a larger number of asylum seekers in a local authority is associated
with higher waiting times. Columns 1 and 2 report OLS estimates including PCT and year fixed
effects (column 2). Columns 3 and 4 repeat this analysis for asylum seekers in dispersal accom-
modation. The coefficient is positive but becomes non-significant when we include year fixed
effects. The sign of this relationship between the share of asylum seekers and the average wait-
ing time for outpatients is confirmed when using asylum seekers in dispersal accommodation to
instrument for the total number of asylum seekers in an area (column 5), as in (Bell et al., 2013).
Again, the coefficient is not precisely estimated when we include year fixed effects (column 6),
and the estimated effect is relatively small: one standard deviation in the share of asylum seek-
ers is associated with an approximately 1% increase in waiting times relative to the mean of the
dependent variable. However, these results suggest that the larger presence of asylum seekers in
deprived areas may contribute to the increase in waiting times shown in Table 14.
21

7 Robustness Checks
7.1 Using Data from National Insurance Numbers (NINOs) as an Alternative Mea-
sure of Immigration
Using the LFS to compute the stock of immigrants living in a local authority is subject to mea-
surement error because in some local authorities, the share of immigrants in the LFS sample is
low. Measurement error can result in substantial attenuation bias. Although using an instrumen-
tal variable based on census data and national-level inflows substantially mitigates this concern,
as underlined by Sa (2015), we further check the robustness of our results using data from NINo
registrations to overseas nationals from the Department for Work and Pensions.
Overseas nationals seeking to work, claim benefits or claim tax credits in the UK need a NINO.
Thus, NINOs registrations of foreign nationals constitute an alternative source of information on
immigrant inflows across local authorities. The main advantage of using NINOs data is that
they are based on administrative records and provide a good measure of employment-driven
migration (Lucchino et al., 2012). However, NINOs provide information only for the point and
time of registration. Immigrants may change residence over time or leave the UK and return
without having to re-register for a new NINO. We compute the stock of immigrants living in
different local authorities using the 2001 Census data as a base for the initial stock of immigrants
by the local authority and the NINOs data (available since 2002) to compute the evolution of the
stock of immigrants by local authorities in the period under study (2003-2012). In Table 15, we
replicate the main results presented in Tables 2-4 and find very similar results, thus confirming
the negative effect on waiting times for outpatients and the non-significant effects on waiting
times for elective care and A&E.
7.2 Regional Analysis
In this section, we test the robustness of our results to a change in the geographical unit using
a higher level of aggregation. Consistent with previous analyses by Borjas (2006) and Sa (2015),
we find no evidence that immigration has a negative effect on waiting times when waiting times
are aggregated at the regional level (see Table 16). While point estimates are not precise and the
standard errors are very large because the sample is much smaller, the point estimate is much
22

smaller than that presented in Table 2.
A likely explanation of this result is that intra-region native mobility is causing diffusion of the
effects of immigration within a region (see Tables 5). Immigration may decrease waiting times at
the local level, but the outflow of natives in response to immigration may increase waiting times
in other local areas (see Table 6).
8 Conclusion
Immigrants’ free access to the NHS and the perceived associated health care costs have gen-
erated much debate in the UK and have even resulted in the introduction of a fee for non-EU
citizens to access NHS services. While previous papers have analyzed the effect of immigration
to the UK on welfare use and documented differences in health care use between foreign-born
individuals and natives, we know less about the effects of immigration on NHS waiting times,
which is one of the most pressing issues for the NHS system.
This article contributes to the previous literature by estimating the effects of immigration
on NHS waiting times in England. We find that immigration has reduced waiting times for
outpatient referrals. An increase of 10 percentage points in the share of migrants living in a
local authority would reduce waiting times by 9 days on average. We find no evidence that
immigration affects waiting times in A&E and in elective care. This result is likely to be driven
by two key factors. First, migrants tend to be young and healthy upon arrival (healthy immigrant
effect) and are likely to have a smaller impact on the demand for NHS services. Second, the
arrival of immigrants increases the likelihood of natives moving and accessing health services
in a different local authority. Thus, the effects of immigration on the demand for health care
services are dispersed throughout the country (via internal migration).
We also observe a positive impact of immigration on outpatient waiting times in the years
immediately following the 2004 EU enlargement in the more deprived areas outside of London.
This effect is partly explained by the fact that less healthy immigrants tend to move into more
deprived areas, thereby increasing the demand for NHS services in those areas. Another driving
factor is the lower mobility of natives in deprived areas, particularly among those with health
problems.
23
References
Altonji, J. G., Card, D., 1991. The effects of immigration on the labor market outcomes of less-
skilled natives. In: Immigration, trade and the labor market. University of Chicago Press, pp.
201–234.
Appleby, J., 2012. Public satisfaction with the NHS and its services. Headlines from the British
Social Attitudes Survey. London: The King’s Fund.
Appleby, J., Thompson, J., Jabbal, J., 2014. How is the NHS performing? The King’s Fund Quar-
terly Monitoring Report.
Beckert, W., Christensen, M., Collyer, K., 2012. Choice of nhs-funded hospital services in eng-
land*. The Economic Journal 122 (560), 400–417.
Bell, B., Fasani, F., Machin, S., 2013. Crime and immigration: Evidence from large immigrant
waves. Review of Economics and Statistics 21 (3), 1278–1290.
Blinder, S., 2012. UK public opinion toward immigration: Overall attitudes and level of concern.
Centre on Migration, Policy and Society Briefing Paper. Available at http://www. migrationob-
servatory. ox. ac. uk/sites/files/migobs/Public% 20Opinion-Overall% 20Attitudes% 20and%
20Level% 20of% 20Concern. pdf.
Bohmer, R. M., Imison, C., 2013. Lessons from englands health care workforce redesign: no quick
fixes. Health Affairs 32 (11), 2025–2031.
Borjas, G. J., 2003. The labor demand curve is downward sloping: Reexamining the impact of
immigration on the labor market. The Quarterly Journal of Economics 118 (4), 1335–1374.
Borjas, G. J., 2006. Native internal migration and the labor market impact of immigration. Journal
of Human Resources 41 (2), 221–258.
Borjas, G. J., Freeman, R. B., Katz, L. F., 1996. Searching for the effect of immigration on the labor
market. The American Economic Review, 246–251.
Card, D., 2001. Immigrant inflows, native outflows, and the local labor market impacts of higher
immigration. Journal of Labor Economics 19 (1), 22–64.
24

Castelli, A., Dawson, D., Gravelle, H., Jacobs, R., Kind, P., Loveridge, P., Martin, S., O’Mahony,
M., Stevens, P. A., Stokes, L., et al., 2007. A new approach to measuring health system output
and productivity. National Institute Economic Review 200 (1), 105–117.
Chiswick, B. R., Lee, Y. L., Miller, P. W., October 2008. Immigrant selection system and immigrant
health. Contemporary Economic Policy 26 (4), 1074–3529.
Cooper, Z. N., McGuire, A., Jones, S., Le Grand, J., 2009. Equity, waiting times, and NHS reforms:
retrospective study. BMJ 339.
Cullis, J. G., Jones, P. R., Propper, C., 2000. Waiting lists and medical treatment: analysis and
policies. Handbook of Health Economics 1, 1201–1249.
Devlin, N., Harrison, A., Derrett, S., 2002. Waiting in the nhs: Part 1a diagnosis. Journal of the
Royal Society of Medicine 95 (5), 223–226.
Dixon, A., Robertson, R., 2011. 4 patient choice of hospital.
Dustmann, C., Frattini, T., 2014. The fiscal effects of immigration to the UK. The Economic Journal
124 (580), F593–F643.
URL http://dx.doi.org/10.1111/ecoj.12181
Dustmann, C., Frattini, T., Halls, C., 2010. Assessing the fiscal costs and benefits of A8 migration
to the UK. Fiscal Studies 31 (1), 1–41.
Dustmann, C., Frattini, T., Preston, I. P., 2013. The effect of immigration along the distribution of
wages. The Review of Economic Studies 80 (1), 145–173.
Gaynor, M., Laudicella, M., Propper, C., 2012a. Can governments do it better? Merger mania and
hospital outcomes in the English NHS. Journal of Health Economics 31 (3), 528–543.
Gaynor, M., Propper, C., Seiler, S., 2012b. Free to choose? reform and demand response in the
english national health service. NBER Working Paper (18574).
Giuntella, O., 2013. Why does the health of immigrants deteriorate? Evidence from birth records.
IZA Discussion Paper 7588.
25

Gutacker, N., Siciliani, L., Moscelli, G., Gravelle, H., 2015. Do patients choose hospitals that
improve their health? CHE Research Paper 111.
Hatton, T. J., Tani, M., 2005. Immigration and inter-regional mobility in the UK, 1982–2000*. The
Economic Journal 115 (507), F342–F358.
Jasso, G., Massey, D. S., Rosenzweig, M. R., Smith, J. P., 2004. Immigrant health: Selectivity and
acculturation. The Institute for Fiscal Studies Working Paper 4 (23), 1–46.
Kennedy, S., Kidd, M. P., McDonald, J. T., Biddle, N., 2014. The healthy immigrant effect: Patterns
and evidence from four countries. Journal of International Migration and Integration 16 (2),
317–332.
Laudicella, M., Siciliani, L., Cookson, R., 2012. Waiting times and socioeconomic status: evidence
from England. Social Science & Medicine 74 (9), 1331–1341.
Lindsay, C. M., Feigenbaum, B., 1984. Rationing by waiting lists. The American Economic Review,
404–417.
Lucchino, P., Rosazza-Bondibene, C., Portes, J., 2012. Examining the relationship between im-
migration and unemployment using National Insurance Number Registration Data. NIESR
Discussion Paper No. 386.
Martin, S., Rice, N., Jacobs, R., Smith, P., 2007. The market for elective surgery: Joint estimation
of supply and demand. Journal of Health Economics 26 (2), 263–285.
Norman, P., Boyle, P., Rees, P., 2005. Selective migration, health and deprivation: a longitudinal
analysis. Social Science & Medicine 60 (12), 2755–2771.
Palloni, A., Morenoff, J. D., 2001. Interpreting the paradoxical in the Hispanic paradox. Annals
of the New York Academy of Sciences 954 (1), 140–174.
Propper, C., 1995. The disutility of time spent on the United Kingdom’s National Health Service
waiting lists. Journal of Human Resources, 677–700.
Propper, C., Burgess, S., Gossage, D., 2008a. Competition and quality: Evidence from the NHS
internal market 1991–9*. The Economic Journal 118 (525), 138–170.
26

Propper, C., Damiani, M., Leckie, G., Dixon, J., 2007. Impact of patients’ socioeconomic status on
the distance travelled for hospital admission in the English National Health Service. Journal of
Health Services Research & Policy 12 (3), 153–159.
Propper, C., Sutton, M., Whitnall, C., Windmeijer, F., 2008b. Did’targets and terror’reduce waiting
times in england for hospital care? The BE Journal of Economic Analysis & Policy 8 (2).
Rienzo, C., Vargas-Silva, C., 2012. Migrants in the UK: An overview. Migration Observatory
Briefing, COMPAS, University of Oxford, Oxford.
Sa, F., 2015. Immigration and house prices in the UK. The Economic Journal 125 (587), 1393–1424.
Shutes, I., 2011. Social care for older people and demand for migrant workers.
Siciliani, L., Iversen, T., 2012. Waiting times and waiting lists. The Elgar Companion to Health
Economics, 259.
Silvester, K., Lendon, R., Bevan, H., Steyn, R., Walley, P., 2004. Reducing waiting times in the nhs:
is lack of capacity the problem? Clinician in Management 12 (3), 105–111.
Sitzia, J., Wood, N., 1997. Patient satisfaction: a review of issues and concepts. Social Science &
Medicine 45 (12), 1829–1843.
Steventon, A., Bardsley, M., 2011. Use of secondary care in england by international immigrants.
Journal of Health Services Research & Policy 16 (2), 90–94.
Wadsworth, J., 2013. Mustn’t grumble: Immigration, health and health service use in the UK and
Germany. Fiscal Studies 34 (1), 55–82.
Windmeijer, F., Gravelle, H., Hoonhout, P., 2005. Waiting lists, waiting times and admissions: an
empirical analysis at hospital and general practice level. Health economics 14 (9), 971–985.
Yar, M., Dix, D., Bajekal, M., 2006. Socio-demographic characteristics of the healthcare workforce
in england and wales–results from the 2001 census. Health Statistics Quarterly 32, 44–55.
27

Figure 1: Foreign-born share of the population in England
Notes - Data are drawn from the UK Labor Force Survey (2003-2012).
28

Figure 2: New migrant GP registrations as a share of total population in England
Notes - Source: Patient Register Data Service (2004-2012).
29

Figure 3: Waiting Times in the NHS (2003-2012)
Notes - Data on average waiting times for outpatient services are drawn from the Hospital Episodes Statistics.
30

Figure 4: Health by migrant status and Index of Multiple Deprivation (IMD) in England (2003-2012)
Notes - Data are drawn from the UK Labor Force Survey.
31

Figure 5: Share of asylum seekers in the population by Index of Multiple Deprivation (IMD) inEngland (2003-2012)
Notes - Data are drawn from the UK Home Office (2003-2012).
32

Table 1: Summary Statistics, 2003-2012
Mean Std
Waiting times (LSOA-level, Source: NHS, HES)
Waiting time for Outpatients (Days) 47.06 (16.61)Waiting time for Elective (Days) 69.82 (39.51)Waiting time for A&E (minutes) 51.98 (64.56)
LSOA characteristics
Log total population 7.35 (0.15)Share of Women over 60 0.12 (0.05)Share of Men over 65 0.07 (0.03)Share of Women 0.51 (0.03)Rural Index (1-8) 5.30 (0.86)IMD score 21.54 (15.61)
Supply Characteristics (PCT-level, Source: NHS, ONS)
GPs per 1k pop 0.94 (0.17)Specialists per 1k pop 0.16 (0.03)Ratio of occupied hospital beds to population 0.82 (0.19)NHS expenditure per capita , (000s) 1.11 (0.59)
Incidence of Disease ((PCT-level, per 1000, , Source: HES, ONS)
Stroke 16.61 (3.88)Coronary disease 37.28 (8.57)Hypertension 138.25 (18.60)Diabetes 39.14 (7.11)Pulmonary Disease 15.19 (4.80)Epilepsy 6.32 (1.04)Hypothyroidism 26.60 (6.20)Cancer 9.43 (4.17)Mental Health 7.00 (2.13)Ventricular Disfunction 5.30 (0.86)
Immigration(LA-level, Source: LFS)
Share of Immigrants (LFS) 11.75 (10.99)
Observation 287,092 287,092
Notes - Data are drawn from the Hospital Episodes Statistics, the UK Labor Force Survey, and the UK ONS.
33

Table 2: Immigration and Waiting Times (days) in the NHS (Outpatients), 2003-2012
(1) (2) (3) (4) (5) (6)OLS OLS OLS 2SLS 2SLS 2SLS
Share of Immigrants -0.324* -0.163 -0.164 -1.575** -0.933** -0.935**(0.178) (0.158) (0.158) (0.701) (0.461) (0.461)
Year f.e. YES YES YES YES YES YESPCT f.e. YES YES YES YES YES YESLSOA time-varying NO YES YES NO YES YEScharacteristicsLSOA NO NO YES NO NO YESpopulationObservations 287,092 287,092 287,092 287,092 287,092 287,092Mean of Dep. Var. 47.07 47.12 47.12 47.07 47.12 47.12Std.Err. of Dep. Var. 16.61 16.65 16.65 16.61 16.65 16.65IV F-stat 17.11 16.07 16.05
Notes - The dependent variable is the average waiting time for outpatient services (in days). Data on average waiting times foroutpatient services are drawn from the Hospital Episodes Statistics. Data on immigrant distribution across Local Authorities aredrawn from the UK Labor Force Survey. Time-varying LSOA characteristics include an Index of Deprivation (we use dummies foreach decile of the index) and an indicator for rural status, the share of women, and the share of over 65 in the LSOA population. PCTtime-varying characteristics include ratio of occupied hospital beds to population, number of GPs per capita, number of GP practiceper capita, number of health consultants per capita, health expenditure per capita, incidence of most common diseases. Columns 3and 6 include LSOA size. Standard errors are clustered at the Local Authority level.
34
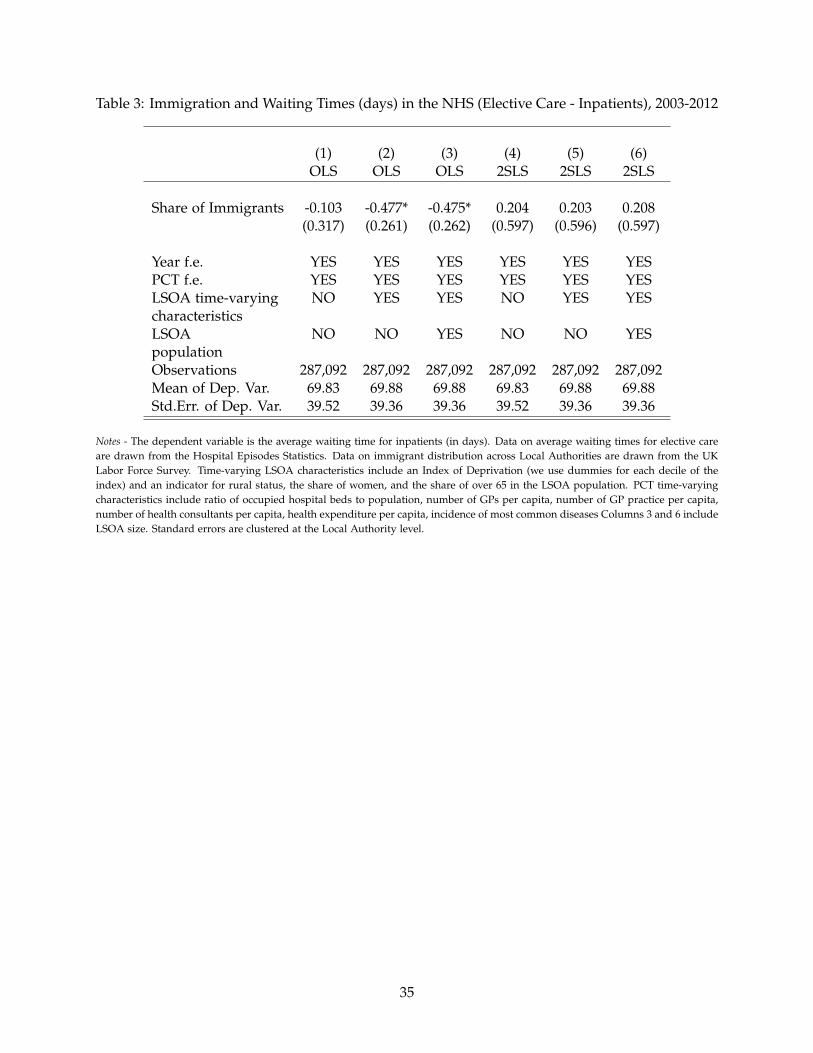
Table 3: Immigration and Waiting Times (days) in the NHS (Elective Care - Inpatients), 2003-2012
(1) (2) (3) (4) (5) (6)OLS OLS OLS 2SLS 2SLS 2SLS
Share of Immigrants -0.103 -0.477* -0.475* 0.204 0.203 0.208(0.317) (0.261) (0.262) (0.597) (0.596) (0.597)
Year f.e. YES YES YES YES YES YESPCT f.e. YES YES YES YES YES YESLSOA time-varying NO YES YES NO YES YEScharacteristicsLSOA NO NO YES NO NO YESpopulationObservations 287,092 287,092 287,092 287,092 287,092 287,092Mean of Dep. Var. 69.83 69.88 69.88 69.83 69.88 69.88Std.Err. of Dep. Var. 39.52 39.36 39.36 39.52 39.36 39.36
Notes - The dependent variable is the average waiting time for inpatients (in days). Data on average waiting times for elective careare drawn from the Hospital Episodes Statistics. Data on immigrant distribution across Local Authorities are drawn from the UKLabor Force Survey. Time-varying LSOA characteristics include an Index of Deprivation (we use dummies for each decile of theindex) and an indicator for rural status, the share of women, and the share of over 65 in the LSOA population. PCT time-varyingcharacteristics include ratio of occupied hospital beds to population, number of GPs per capita, number of GP practice per capita,number of health consultants per capita, health expenditure per capita, incidence of most common diseases Columns 3 and 6 includeLSOA size. Standard errors are clustered at the Local Authority level.
35
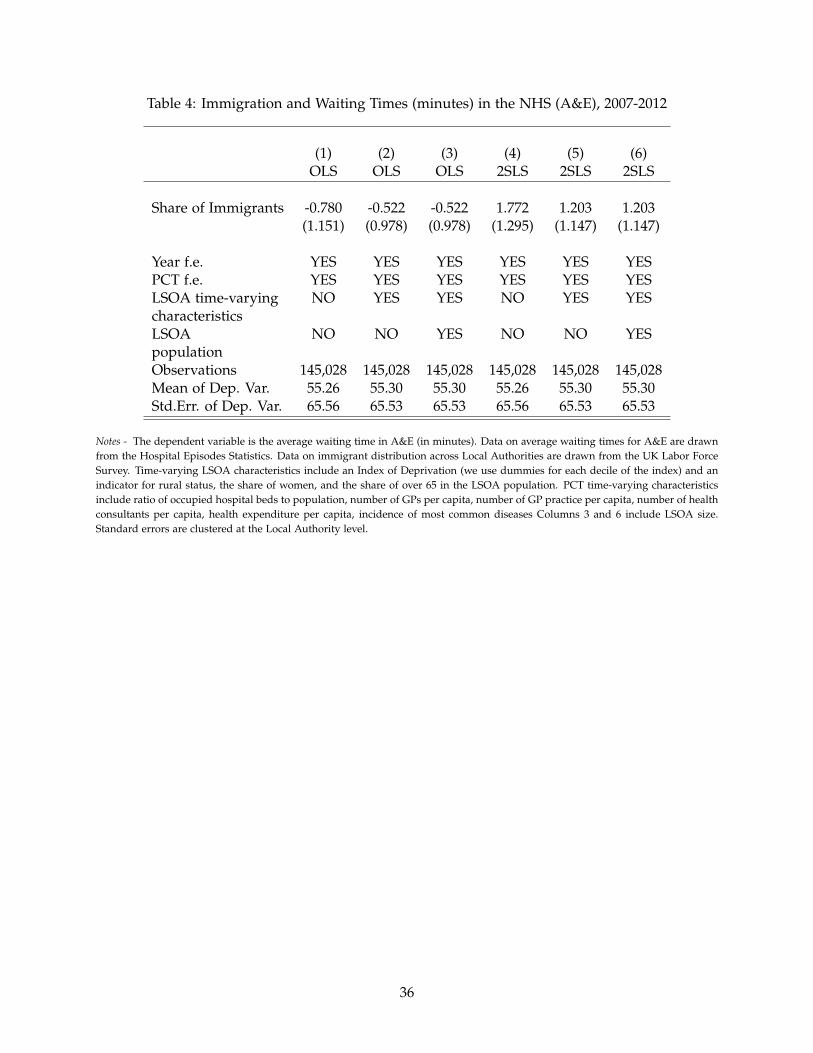
Table 4: Immigration and Waiting Times (minutes) in the NHS (A&E), 2007-2012
(1) (2) (3) (4) (5) (6)OLS OLS OLS 2SLS 2SLS 2SLS
Share of Immigrants -0.780 -0.522 -0.522 1.772 1.203 1.203(1.151) (0.978) (0.978) (1.295) (1.147) (1.147)
Year f.e. YES YES YES YES YES YESPCT f.e. YES YES YES YES YES YESLSOA time-varying NO YES YES NO YES YEScharacteristicsLSOA NO NO YES NO NO YESpopulationObservations 145,028 145,028 145,028 145,028 145,028 145,028Mean of Dep. Var. 55.26 55.30 55.30 55.26 55.30 55.30Std.Err. of Dep. Var. 65.56 65.53 65.53 65.56 65.53 65.53
Notes - The dependent variable is the average waiting time in A&E (in minutes). Data on average waiting times for A&E are drawnfrom the Hospital Episodes Statistics. Data on immigrant distribution across Local Authorities are drawn from the UK Labor ForceSurvey. Time-varying LSOA characteristics include an Index of Deprivation (we use dummies for each decile of the index) and anindicator for rural status, the share of women, and the share of over 65 in the LSOA population. PCT time-varying characteristicsinclude ratio of occupied hospital beds to population, number of GPs per capita, number of GP practice per capita, number of healthconsultants per capita, health expenditure per capita, incidence of most common diseases Columns 3 and 6 include LSOA size.Standard errors are clustered at the Local Authority level.
36

Tabl
e5:
Imm
igra
ntIn
flow
san
dN
ativ
eIn
tern
alM
obili
ty(L
FS,2
004-
2012
)
(1)
(2)
(3)
(4)
(5)
(6)
OLS
2SLS
OLS
2SLS
OLS
2SLS
Dep
ende
ntV
aria
ble:
Out
-mig
rati
onO
ut-m
igra
tion
In-m
igra
tion
In-m
igra
tion
Net
out-
mig
rati
onN
etou
t-m
igra
tion
rate
rate
rate
rate
rate
rate
∆FB
it/
Pop
it−
10.
119*
**0.
159*
**0.
053*
**0.
062*
**0.
066*
**0.
097*
**(0
.014
)(0
.027
)(0
.016
)(0
.019
)(0
.022
)(0
.033
)
Obs
erva
tion
s1,
269
1,26
91,
269
1,26
91,
269
1,26
9M
ean
ofD
ep.V
ar.
0.03
30.
033
0.03
00.
030
0.00
30.
003
Std.
Err.
ofD
ep.V
ar.
0.05
60.
056
0.04
20.
042
0.04
80.
048
IV-F
stat
25.3
625
.36
25.3
6
Not
es-
Dat
aar
edr
awn
from
the
UK
Labo
rFo
rce
Surv
ey.
Info
rmat
ion
onpa
stye
arre
side
nce
isav
aila
ble
only
sinc
e20
04.
All
the
regr
essi
ons
incl
ude
year
and
loca
lau
thor
ity
fixed
effe
cts
and
the
stan
dard
erro
rsar
ecl
uste
red
atth
eLo
calA
utho
rity
leve
l.
37

Table 6: Native Internal Mobility and Waiting Times for Outpatients (days), 2004-2012
(1) (2) (3)2SLS 2SLS 2SLS
Dependent Variable: Waiting Time Waiting Time Waiting Time
Natives 5.689*** 3.219*** 3.227***(1.716) (1.138) (1.138)
Year f.e. YES YES YESPCT f.e. YES YES YESLSOA time-varying NO YES YEScharacteristicsLSOA NO NO YESpopulationFirst-Stage F 11.14 7.00 7.01Observations 258,458 258,458 258,458Mean of Dep. Var. 45.71 45.71 45.71Std.Err. of Dep. Var. 15.64 15.64 15.64IV-Fstat 12.52 11.91 11.91
Notes - The dependent variable is the average waiting time for outpatient services (in days. Data on average waiting times foroutpatient services are drawn from the Hospital Episodes Statistics. Data on immigrant distribution across Local Authorities aredrawn from the UK Labor Force Survey. Information on past year residence is available only since 2004. Time-varying LSOAcharacteristics include an Index of Deprivation (we use dummies for each decile of the index) and an indicator for rural status,the share of women, and the share of over 65 in the LSOA population. PCT time-varying characteristics include ratio of occupiedhospital beds to population, number of GPs per capita, number of GP practice per capita, number of health consultants per capita,health expenditure per capita, incidence of most common diseases. Columns 3 includes LSOA size. Standard errors are clustered atthe Local Authority level.
38
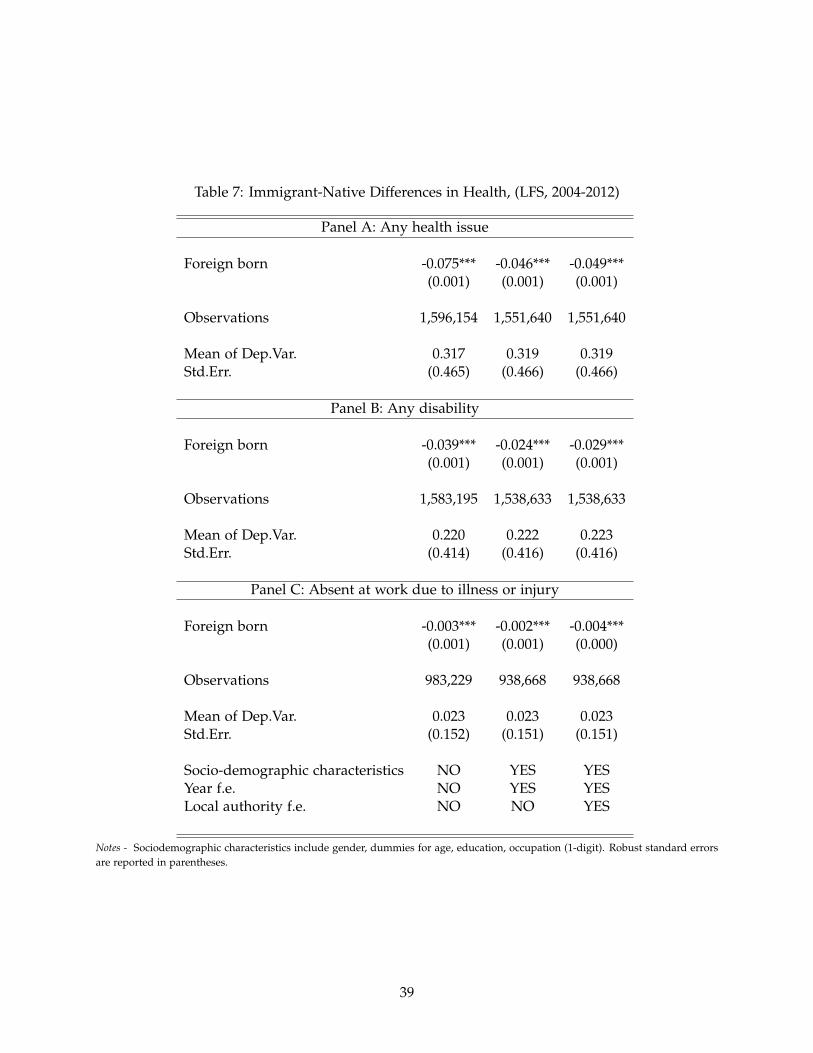
Table 7: Immigrant-Native Differences in Health, (LFS, 2004-2012)
Panel A: Any health issue
Foreign born -0.075*** -0.046*** -0.049***(0.001) (0.001) (0.001)
Observations 1,596,154 1,551,640 1,551,640
Mean of Dep.Var. 0.317 0.319 0.319Std.Err. (0.465) (0.466) (0.466)
Panel B: Any disability
Foreign born -0.039*** -0.024*** -0.029***(0.001) (0.001) (0.001)
Observations 1,583,195 1,538,633 1,538,633
Mean of Dep.Var. 0.220 0.222 0.223Std.Err. (0.414) (0.416) (0.416)
Panel C: Absent at work due to illness or injury
Foreign born -0.003*** -0.002*** -0.004***(0.001) (0.001) (0.000)
Observations 983,229 938,668 938,668
Mean of Dep.Var. 0.023 0.023 0.023Std.Err. (0.152) (0.151) (0.151)
Socio-demographic characteristics NO YES YESYear f.e. NO YES YESLocal authority f.e. NO NO YES
Notes - Sociodemographic characteristics include gender, dummies for age, education, occupation (1-digit). Robust standard errorsare reported in parentheses.
39
Tabl
e8:
Imm
igra
nt-N
ativ
eIn
tern
alM
igra
nts
Diff
eren
ces
inH
ealt
h,(L
FS,2
004-
2012
)
(1)
(2)
(3)
(4)
(5)
(6)
Pane
lA:A
nyhe
alth
issu
e
Fore
ign
born
-0.0
38**
*-0
.051
***
(0.0
05)
(0.0
04)
Fore
ign
born
-0.1
06**
*-0
.072
***
arri
ved
afte
r20
00(0
.005
)(0
.003
)Fo
reig
nbo
rn-0
.131
***
-0.0
84**
*ar
rive
daf
ter
2004
(0.0
05)
(0.0
03)
Obs
erva
tion
s16
6,07
816
2,86
996
,854
95,6
5562
,649
62,4
01M
ean
ofD
ep.V
ar.
0.18
50.
186
0.12
10.
122
0.10
50.
105
Std.
Err.
ofD
ep.V
ar.
0.38
80.
389
0.32
70.
327
0.30
70.
307
Pane
lB:A
nydi
sabi
lity
Fore
ign
born
-0.0
26**
*-0
.039
***
(0.0
04)
(0.0
03)
Fore
ign
born
-0.0
80**
*-0
.057
***
arri
ved
afte
r20
00(0
.004
)(0
.003
)Fo
reig
nbo
rn-0
.101
***
-0.0
69**
*ar
rive
daf
ter
2004
(0.0
04)
(0.0
03)
Obs
erva
tion
s16
5,19
216
1,97
995
,816
94,6
1561
,634
61,3
85M
ean
ofD
ep.V
ar.
0.13
80.
139
0.08
500.
0854
0.07
110.
0711
Std.
Err.
ofD
ep.V
ar.
0.34
40.
346
0.27
90.
279
0.25
70.
257
Pane
lC:A
bsen
tat
wor
kdu
eto
illne
ssor
inju
ry
Fore
ign
born
-0.0
01-0
.004
*(0
.002
)(0
.002
)Fo
reig
nbo
rn-0
.004
-0.0
06**
*ar
rive
daf
ter
2000
(0.0
02)
(0.0
02)
Fore
ign
born
-0.0
06**
-0.0
06**
*ar
rive
daf
ter
2004
(0.0
02)
(0.0
02)
Obs
erva
tion
s10
9,58
210
6,36
963
,004
61,8
0339
,494
39,2
45M
ean
ofD
ep.V
ar.
0.02
160.
0214
0.02
000.
0200
0.01
860.
0185
Std.
Err.
ofD
ep.V
ar.
0.14
50.
145
0.14
00.
140
0.13
50.
135
Soci
odem
ogra
phic
char
acte
rist
ics
NO
YES
NO
YES
NO
YES
Year
f.e.
NO
YES
NO
YES
NO
YES
Loca
laut
hori
tyf.e
.N
OY
ESN
OY
ESN
OY
ES
Not
es-
We
rest
rict
the
sam
ple
ofna
tive
sto
indi
vidu
als
who
wer
eliv
ing
ina
diff
eren
tlo
cal
auth
orit
yin
the
prev
ious
year
.St
anda
rder
rors
(in
pren
thes
es)
are
clus
tere
dat
the
loca
lau
thor
ity
leve
l.R
egre
ssio
nsin
clud
eye
aran
dlo
cala
utho
rity
fixed
effe
cts.
Soci
odem
ogra
phic
char
acte
rist
ics
incl
ude
gend
er,d
umm
ies
for
age,
educ
atio
noc
cupa
tion
(1-d
igit
).
40

Tabl
e9:
Imm
igra
ntH
ealt
hA
dvan
tage
,(U
nder
stan
ding
Soci
ety,
2009
-201
4)
Pane
lA:P
oor
heal
th,w
aves
1-4
(1)
(2)
(3)
(4)
(5)
(6)
Fore
ign
born
-0.0
47**
*-0
.047
***
(0.0
07)
(0.0
07)
Fore
ign
born
-0.1
34**
*-0
.134
***
cam
eaf
ter
2000
(0.0
07)
(0.0
07)
Fore
ign
born
-0.1
44**
*-0
.144
***
cam
eaf
ter
2004
(0.0
08)
(0.0
08)
Obs
erva
tion
s67
,584
67,5
8462
,711
62,7
1161
,565
61,5
65So
ciod
emog
raph
icC
ontr
ols
NO
YES
NO
YES
NO
YES
Mea
nof
Dep
.Var
.0.
193
0.19
30.
190
0.19
00.
192
0.19
2St
d.Er
r.of
Dep
.Var
.0.
394
0.39
40.
393
0.39
30.
394
0.39
4Pa
nelB
:Dis
abili
ty,w
aves
1-4
Fore
ign
born
-0.1
27**
*-0
.127
***
(0.0
09)
(0.0
09)
Fore
ign
born
-0.2
56**
*-0
.256
***
cam
eaf
ter
2000
(0.0
10)
(0.0
10)
Fore
ign
born
-0.2
76**
*-0
.276
***
cam
eaf
ter
2004
(0.0
11)
(0.0
11)
Obs
erva
tion
s67
,649
67,6
4962
,770
62,7
7061
,623
61,6
23So
ciod
emog
raph
icC
ontr
ols
NO
YES
NO
YES
NO
YES
Mea
nof
Dep
.Var
.0.
359
0.35
90.
360
0.36
00.
365
0.36
5St
d.Er
r.of
Dep
.Var
.0.
480
0.48
00.
480
0.48
00.
481
0.48
1Pa
nelC
:Any
heal
thlim
itat
ion,
wav
es1-
4
Fore
ign
born
-0.0
18**
*-0
.018
***
(0.0
05)
(0.0
05)
Fore
ign
born
-0.0
66**
*-0
.066
***
cam
eaf
ter
2000
(0.0
05)
(0.0
05)
Fore
ign
born
-0.0
74**
*-0
.074
***
cam
eaf
ter
2004
(0.0
06)
(0.0
06)
Obs
erva
tion
s67
,672
67,6
7262
,791
62,7
9161
,643
61,6
43So
ciod
emog
raph
icch
arac
teri
stic
sN
OY
ESN
OY
ESN
OY
ESM
ean
ofD
ep.V
ar.
0.11
40.
114
0.11
20.
112
0.11
30.
113
Std.
Err.
ofD
ep.V
ar.
0.31
80.
318
0.31
60.
316
0.31
70.
317
Not
es-
Dat
aar
edr
awn
from
wav
es1-
4of
the
Und
erst
andi
ngSo
ciet
y.So
ciod
emog
raph
icch
arac
teri
stic
sin
clud
eco
ntro
lsfo
rge
nder
,dum
mie
sfo
rag
e,ed
ucat
ion
occu
pati
on(1
-dig
it),
empl
oym
ent
stat
us,i
ncom
e,re
gion
,an
inde
xof
rura
lsta
tus,
and
year
fixed
effe
cts.
Rob
ust
stan
dard
erro
rsar
ere
port
edin
pare
nthe
ses.
41

Tabl
e10
:Im
mig
rant
-Nat
ive
Diff
eren
ces
inH
ealt
hC
are
Use
,(U
nder
stan
ding
Soci
ety,
2009
-201
4)
(1)
(2)
(3)
(4)
(5)
(6)
Pane
lA:I
npat
ient
days
,wav
es1-
4
Fore
ign
born
-0.0
01-0
.001
(0.0
02)
(0.0
02)
Fore
ign
born
-0.0
10**
*-0
.010
***
cam
eaf
ter
2000
(0.0
03)
(0.0
03)
Fore
ign
born
-0.0
13**
*-0
.013
***
cam
eaf
ter
2004
(0.0
03)
(0.0
03)
Obs
erva
tion
s67
,672
67,6
7262
,791
62,7
9161
,643
61,6
43So
ciod
emog
raph
icC
ontr
ols
NO
YES
NO
YES
NO
YES
Mea
nof
Dep
.Var
.0.
0196
0.01
960.
0190
0.01
900.
0191
0.01
91St
d.Er
r.of
Dep
.Var
.0.
160
0.16
00.
157
0.15
70.
158
0.15
8Pa
nelB
:Hos
pita
lser
vice
sus
e,w
ave
4
Fore
ign
born
-0.0
02-0
.002
(0.0
15)
(0.0
15)
Fore
ign
born
-0.0
37**
-0.0
37**
cam
eaf
ter
2000
(0.0
18)
(0.0
18)
Fore
ign
born
-0.0
51**
-0.0
51**
cam
eaf
ter
2004
(0.0
20)
(0.0
20)
Obs
erva
tion
s4,
551
4,55
13,
178
3,17
82,
816
2,81
6So
ciod
emog
raph
icC
ontr
ols
NO
YES
NO
YES
NO
YES
Mea
nof
Dep
.Var
.0.
483
0.48
30.
459
0.45
90.
457
0.45
7St
d.Er
r.of
Dep
.Var
.0.
500
0.50
00.
498
0.49
80.
498
0.49
8Pa
nelC
:Doc
tor
serv
ices
use,
wav
e4
Fore
ign
born
0.02
0*0.
020*
(0.0
11)
(0.0
11)
Fore
ign
born
-0.0
20-0
.020
cam
eaf
ter
2000
(0.0
14)
(0.0
14)
Fore
ign
born
-0.0
26-0
.026
cam
eaf
ter
2004
(0.0
16)
(0.0
16)
Obs
erva
tion
s4,
551
4,55
13,
178
3,17
82,
816
2,81
6So
ciod
emog
raph
icch
arac
teri
stic
sN
OY
ESN
OY
ESN
OY
ESM
ean
ofD
ep.V
ar.
0.84
60.
846
0.82
10.
821
0.82
10.
821
Std.
Err.
ofD
ep.V
ar.
0.36
10.
361
0.38
30.
383
0.38
40.
384
Not
es-
Dat
afo
rPa
nel
Aar
edr
awn
from
wav
es1-
4of
the
Und
erst
andi
ngSo
ciet
y.D
ata
for
Pane
lB
and
car
edr
awn
from
wav
e4
ofth
eU
nder
stan
ding
Soci
ety.
Soci
odem
ogra
phic
char
acte
rist
ics
incl
ude
cont
rols
for
gend
er,d
umm
ies
for
age,
educ
atio
noc
cupa
tion
(1-d
igit
),em
ploy
men
tst
atus
,inc
ome,
regi
on,a
nin
dex
ofru
rals
tatu
san
dye
arfix
edef
fect
s.R
obus
tst
anda
rder
rors
are
repo
rted
inpa
rent
hese
s.
42

Tabl
e11
:Im
mig
rati
onan
dN
HS
Supp
ly,2
003-
2012
(1)
(2)
(3)
(4)
(5)
(6)
(7)
(8)
(9)
(10)
2SLS
2SLS
2SLS
2SLS
2SLS
2SLS
2SLS
2SLS
2SLS
2SLS
Dep
ende
ntV
aria
ble:
Ove
rall
Expe
ndit
ure
Rat
ioof
#Pr
acti
ce#
Prac
tice
#G
P#G
P#c
onsu
ltan
t#
cons
ulta
nt#
GP
expe
ndit
ure
per
capi
taoc
cupi
edbe
dspe
rca
pita
per
capi
tape
rca
pita
grad
uate
dab
road
Shar
eof
Imm
igra
nts
-0.0
04-0
.006
0.00
00.
368
-0.0
001.
818
-0.0
030.
711
0.00
7-0
.054
(0.0
11)
(0.0
07)
(0.0
03)
(0.3
21)
(0.0
00)
(2.4
26)
(0.0
03)
(3.8
16)
(0.0
12)
(0.2
57)
Obs
erva
tion
s1,
290
1,29
01,
290
1,29
01,
290
1,29
01,
290
1,29
01,
290
1,29
0M
ean
ofD
ep.V
ar.
12.6
81.
226
0.81
457
.52
0.17
034
0.1
0.95
325
3.4
0.82
748
.20
Std.
Err.
ofD
ep.V
ar.
0.64
60.
546
0.21
825
.71
0.04
0820
6.0
0.21
720
6.1
0.70
625
.98
IV-F
stat
11.8
311
.83
11.8
311
.83
11.8
311
.83
11.8
311
.83
11.8
317
.82
Not
es-
Dat
aon
per
capi
taex
pend
itur
e,sh
are
ofoc
cupi
edbe
ds,
prac
tice
s,co
nsul
tant
san
dG
Psar
edr
awn
from
the
Hos
pita
lEp
isod
esSt
atis
tics
and
are
atth
ePC
Tle
vel.
Dat
aon
imm
igra
ntdi
stri
buti
onac
ross
Loca
lAut
hori
ties
are
draw
nfr
omth
eU
KLa
bor
Forc
eSu
rvey
.All
esti
mat
ein
clud
ePC
Tan
dye
arfix
edef
fect
s.St
anda
rder
rors
are
clus
tere
dat
the
Loca
lA
utho
rity
leve
l.
43

Tabl
e12
:Hea
lth
Acr
oss
Less
and
Mor
eD
epri
ved
Are
asin
Engl
and,
(LFS
,200
3-20
12)
(1)
(2)
(3)
(4)
(5)
(6)
Dep
ende
ntva
riab
le:
Any
heal
this
sue
Any
heal
this
sue
Any
heal
this
sue
Any
heal
this
sue
Any
heal
this
sue
Any
heal
this
sue
All
All
UK
-bor
nU
K-b
orn
Fore
ign-
born
Fore
ign-
born
Hig
hly
depr
ived
area
s0.
016*
**0.
010*
**0.
021*
**0.
011*
**0.
023*
**0.
015*
*(0
.001
)(0
.002
)(0
.001
)(0
.002
)(0
.002
)(0
.006
)
Soci
odem
ogra
phic
char
acte
rist
ics
YES
YES
YES
YES
YES
YES
Year
F.E.
YES
YES
YES
YES
YES
YES
Loca
laut
hori
tyF.
E.Y
ESY
ESY
ESY
ESY
ESY
ESM
ean
ofD
ep.V
ar.
0.30
20.
319
0.32
60.
329
0.24
20.
244
Std.
Err.
(0.4
59)
(0.4
66)
(0.4
69)
(0.4
70)
(0.4
29)
(0.4
29)
Obs
erva
tion
s1,
596,
291
1,55
1,77
71,
392,
313
1,35
1,75
420
3,84
119
9,88
6
Not
es-
All
esti
mat
esin
clud
eye
aran
dlo
cal
auth
orit
yfix
edef
fect
s.So
ciod
emog
raph
icch
arac
teri
stic
sin
clud
ege
nder
,ag
e(d
umm
ies)
,ed
ucat
ion
(dum
mie
s),
occu
pati
on(1
-dig
it,
dum
mie
s).S
tand
ard
erro
rsin
pare
nthe
ses
are
clus
tere
dat
the
loca
laut
hori
tyle
vel.
Rob
ust
stan
dard
erro
rsar
ere
port
edin
pare
nthe
ses.
44

Tabl
e13
:Im
mig
rati
onan
dW
aiti
ting
Tim
es(i
nda
ys)
for
Out
pati
ents
byIn
dex
ofM
ulti
ple
Dep
riva
tion
(IM
D)
quin
tile
s,20
03-2
012
(1)
(2)
(3)
(4)
(5)
2SLS
2SLS
2SLS
2SLS
2SLS
Q1
Q2
Q3
Q4
Q5
Shar
eof
Imm
igra
nts
-0.8
93-0
.730
***
-0.6
69**
*-0
.549
***
-0.2
77(0
.543
)(0
.234
)(0
.213
)(0
.201
)(0
.193
)
Reg
ion
f.eY
ESY
ESY
ESY
ESY
ESYe
arf.e
.Y
ESY
ESY
ESY
ESY
ESO
bser
vati
ons
57,4
9157
,513
57,6
3257
,352
57,1
04R
-squ
ared
0.31
90.
344
0.37
40.
428
0.47
5M
ean
ofD
ep.V
ar.
45.6
946
.24
47.2
948
.19
48.2
2St
d.Er
r.of
Dep
.Var
.15
.17
16.4
016
.75
17.3
317
.34
IV-F
stat
9.44
14.2
913
.39
33.0
772
.14
Not
es-
Dat
aon
aver
age
wai
ting
tim
esfo
rou
tpat
ient
serv
ices
are
draw
nfr
omth
eH
ospi
tal
Epis
odes
Stat
isti
cs.
Dat
aon
imm
igra
ntdi
stri
buti
onac
ross
Loca
lA
utho
riti
esar
edr
awn
from
the
UK
Labo
rFo
rce
Surv
ey.
Tim
e-va
ryin
gLS
OA
char
acte
rist
ics
incl
ude
anIn
dex
ofD
epri
vati
on(w
eus
edu
mm
ies
for
each
deci
leof
the
inde
x)an
dan
indi
cato
rfo
rru
rals
tatu
s,th
esh
are
ofw
omen
,and
the
shar
eof
over
65in
the
LSO
Apo
pula
tion
.PC
Tti
me-
vary
ing
char
acte
rist
ics
incl
ude
hosp
ital
beds
’ava
ilabi
lity,
num
ber
ofG
Pspe
rca
pita
,num
ber
ofG
Ppr
acti
cepe
rca
pita
,num
ber
ofhe
alth
cons
ulta
nts
per
capi
ta,h
ealt
hex
pend
itur
epe
rca
pita
,inc
iden
ceof
mos
tco
mm
ondi
seas
es.
Col
umns
3an
d6
incl
ude
LSO
Asi
ze.
Stan
dard
erro
rsar
ecl
uste
red
atth
eLo
calA
utho
rity
leve
l.
45

Table 14: Immigration and Waiting Times (days) for Outpatients, by Index of Multiple Depriva-tion (IMD)
(1) (2) (3) (4) (5)2SLS 2SLS 2SLS 2SLS 2SLS
Overall Overall Outside London Outside London Outside London2003-2012 2003-2007 2003-2007 2003-2007 2003-2007
More Deprived More DeprivedAreas (6-10 ) Areas(7-10)
Share of Immigrants -0.935** -0.818*** 0.479 1.499* 2.085*(0.461) (0.317) (0.350) (0.788) (1.143)
Year f.e. YES YES YES YES YESPCT f.e. YES YES YES YES YESLSOA time-varying YES YES YES YES YEScharacteristics YES YES YES YES YESLSOA YES YES YES YES YESpopulationObservations 287,092 144,476 122,067 57,146 44,964Mean of Dep. Var. 47.12 54.26 51.49 52.03 52.01Std.Err. of Dep. Var. 16.65 17.27 15.40 16.04 16.27IV-Fstat 16.05 28.72 54.54 20.60 14.09
Notes - The dependent variable is the average waiting time for outpatient services (in days). Data on average waiting times for outpatient services are drawn from the Hospital
Episodes Statistics. Data on immigrant distribution across Local Authorities are drawn from the UK Labor Force Survey. LSOA characteristics include: an Index of Deprivation,
ratio of occupied hospital beds to population, density of GP practices, number of specialists and GPs, Rural Index, share of women, share of over 65, LSOA incidence of most
common diseases and LSOA size. Standard errors are clustered at the Local Authority level.
46
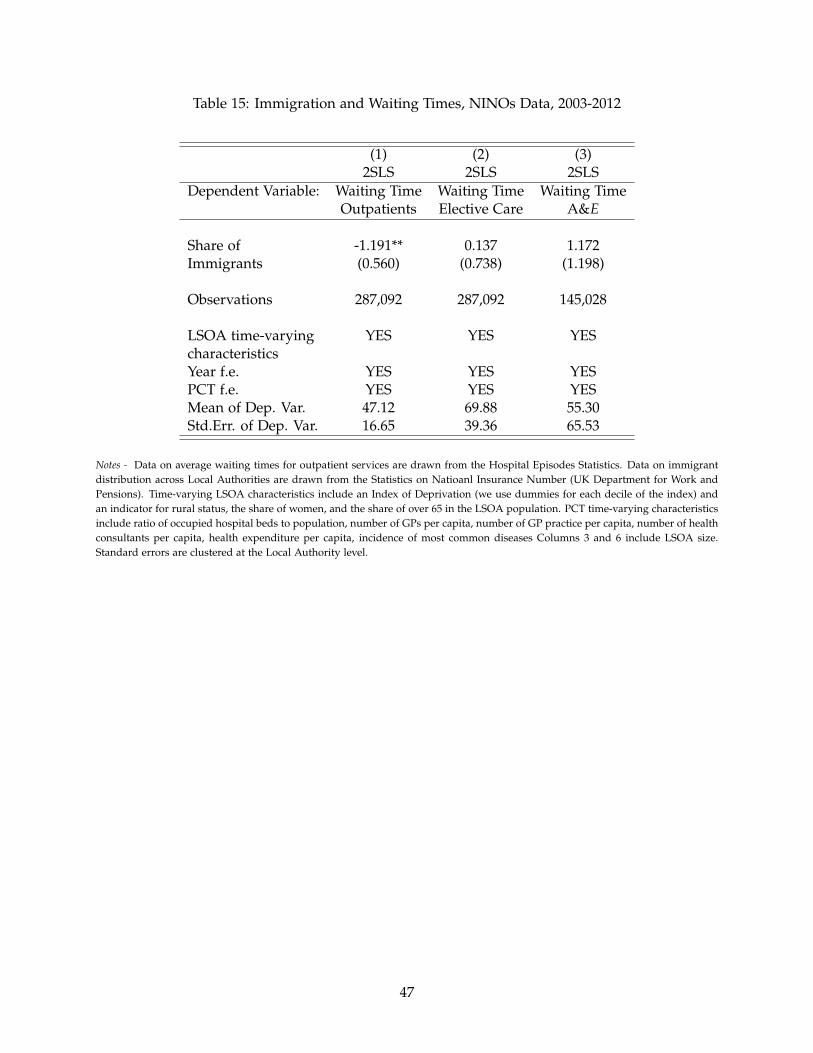
Table 15: Immigration and Waiting Times, NINOs Data, 2003-2012
(1) (2) (3)2SLS 2SLS 2SLS
Dependent Variable: Waiting Time Waiting Time Waiting TimeOutpatients Elective Care A&E
Share of -1.191** 0.137 1.172Immigrants (0.560) (0.738) (1.198)
Observations 287,092 287,092 145,028
LSOA time-varying YES YES YEScharacteristicsYear f.e. YES YES YESPCT f.e. YES YES YESMean of Dep. Var. 47.12 69.88 55.30Std.Err. of Dep. Var. 16.65 39.36 65.53
Notes - Data on average waiting times for outpatient services are drawn from the Hospital Episodes Statistics. Data on immigrantdistribution across Local Authorities are drawn from the Statistics on Natioanl Insurance Number (UK Department for Work andPensions). Time-varying LSOA characteristics include an Index of Deprivation (we use dummies for each decile of the index) andan indicator for rural status, the share of women, and the share of over 65 in the LSOA population. PCT time-varying characteristicsinclude ratio of occupied hospital beds to population, number of GPs per capita, number of GP practice per capita, number of healthconsultants per capita, health expenditure per capita, incidence of most common diseases Columns 3 and 6 include LSOA size.Standard errors are clustered at the Local Authority level.
47
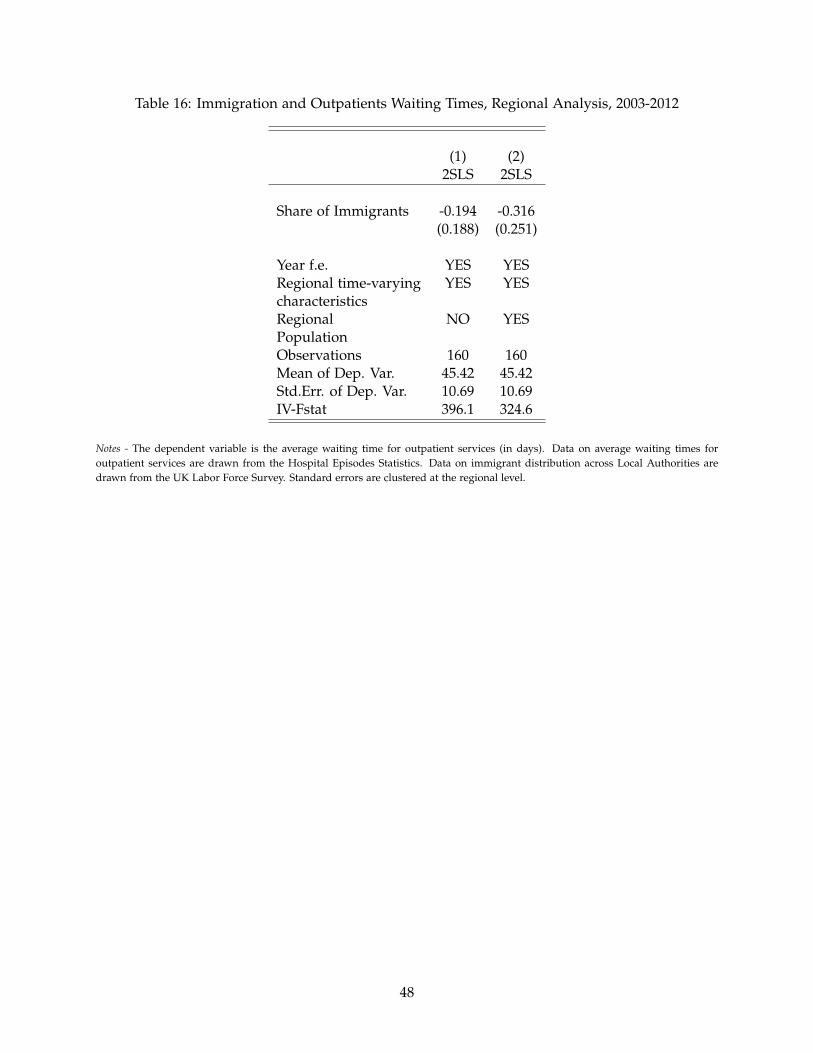
Table 16: Immigration and Outpatients Waiting Times, Regional Analysis, 2003-2012
(1) (2)2SLS 2SLS
Share of Immigrants -0.194 -0.316(0.188) (0.251)
Year f.e. YES YESRegional time-varying YES YEScharacteristicsRegional NO YESPopulationObservations 160 160Mean of Dep. Var. 45.42 45.42Std.Err. of Dep. Var. 10.69 10.69IV-Fstat 396.1 324.6
Notes - The dependent variable is the average waiting time for outpatient services (in days). Data on average waiting times foroutpatient services are drawn from the Hospital Episodes Statistics. Data on immigrant distribution across Local Authorities aredrawn from the UK Labor Force Survey. Standard errors are clustered at the regional level.
48

Appendix A
Table A.1: Immigration and Waiting Times (days) in the NHS (Outpatients), Nearest NHS Trustfixed-effects, 2003-2012
(1) (2) (3) (4) (5) (6)OLS OLS OLS 2SLS 2SLS 2SLS
Share of Immigrants -0.081 -0.113 -0.114 -0.295*** -0.595*** -0.596***(0.056) (0.088) (0.088) (0.088) (0.183) (0.184)
Year f.e. YES YES YES YES YES YESNearest NHS Trust f.e. YES YES YES YES YES YESLSOA time-varying NO YES YES NO YES YEScharacteristicsLSOA NO NO YES NO NO YESpopulationObservations 287,092 287,092 287,092 287,092 287,092 287,092Mean of Dep. Var. 47.07 47.12 47.12 47.07 47.12 47.12Std.Err. of Dep. Var. 16.61 16.65 16.65 16.61 16.65 16.65
Notes - The dependent variable is the average waiting time for outpatient services (in days). Data on average waiting times foroutpatient services are drawn from the Hospital Episodes Statistics. Data on immigrant distribution across Local Authorities aredrawn from the UK Labor Force Survey. Time-varying LSOA characteristics include an Index of Deprivation (we use dummies foreach decile of the index) and an indicator for rural status, the share of women, and the share of over 65 in the LSOA population. PCTtime-varying characteristics include ratio of occupied hospital beds to population, number of GPs per capita, number of GP practiceper capita, number of health consultants per capita, health expenditure per capita, incidence of most common diseases. Columns 3and 6 include LSOA size. Standard errors are clustered at the Local Authority level.
49

Tabl
eA
.2:I
mm
igra
nt-N
ativ
eD
iffer
ence
sin
Hea
lth
Car
eU
se,(
Gen
eral
Hou
seho
ldSu
rvey
,200
0-20
06)
(1)
(2)
(3)
(4)
(5)
(6)
Pane
lA:C
onsu
lted
doct
orla
st2
wks
(exc
.hos
p)Fo
reig
nbo
rn0.
007*
0.00
7*(0
.004
)(0
.004
)Fo
reig
nbo
rn-0
.049
***
-0.0
28**
*ca
me
afte
r20
00(0
.007
)(0
.007
)Fo
reig
nbo
rn-0
.069
***
-0.0
48**
*ca
me
afte
r20
04(0
.012
)(0
.012
)
Obs
erva
tion
s13
7,27
313
7,27
312
8,49
412
8,49
412
7,12
112
7,12
1So
ciod
emog
raph
icC
ontr
ols
NO
YES
NO
YES
NO
YES
Mea
nof
Dep
.Var
.0.
153
0.15
30.
152
0.15
20.
152
0.15
2St
d.Er
r.of
Dep
.Var
.0.
360
0.36
00.
359
0.35
90.
359
0.35
9Pa
nelB
:NH
SG
Pco
nsul
tati
ons
last
2w
ksFo
reig
nbo
rn0.
004
0.00
6(0
.005
)(0
.005
)Fo
reig
nbo
rn-0
.067
***
-0.0
44**
*ca
me
afte
r20
00(0
.009
)(0
.009
)Fo
reig
nbo
rn-0
.086
***
-0.0
65**
*ca
me
afte
r20
04(0
.013
)(0
.014
)
Obs
erva
tion
s13
7,27
313
7,27
312
8,49
412
8,49
412
7,12
112
7,12
1So
ciod
emog
raph
icC
ontr
ols
NO
YES
NO
YES
NO
YES
Mea
nof
Dep
.Var
.0.
168
0.16
80.
167
0.16
70.
167
0.16
7St
d.Er
r.of
Dep
.Var
.0.
470
0.47
00.
468
0.46
80.
469
0.46
9Pa
nelC
:NH
SG
Pco
nsul
tati
ons
last
year
Fore
ign
born
0.10
30.
168
(0.1
24)
(0.1
28)
Fore
ign
born
-1.7
44**
*-1
.140
***
cam
eaf
ter
2000
(0.2
25)
(0.2
30)
Fore
ign
born
-2.2
28**
*-1
.682
***
cam
eaf
ter
2004
(0.3
50)
(0.3
56)
Obs
erva
tion
s13
7,27
513
7,27
512
8,49
712
8,49
712
7,12
212
7,12
2So
ciod
emog
raph
icC
ontr
ols
NO
YES
NO
YES
NO
YES
Mea
nof
Dep
.Var
.4.
366
4.36
64.
332
4.33
24.
349
4.34
9St
d.Er
r.of
Dep
.Var
.12
.22
12.2
212
.18
12.1
812
.20
12.2
0Pa
nelD
:Hos
pita
lOut
pati
ent
Att
end
-la
st3
mon
ths
Fore
ign
born
-0.0
15**
*-0
.010
***
(0.0
03)
(0.0
04)
Fore
ign
born
-0.0
50**
*-0
.019
***
cam
eaf
ter
2000
(0.0
07)
(0.0
07)
Fore
ign
born
-0.0
63**
*-0
.033
***
cam
eaf
ter
2004
(0.0
12)
(0.0
12)
Obs
erva
tion
s13
7,28
713
7,28
712
8,50
612
8,50
612
7,13
212
7,13
2So
ciod
emog
raph
icch
arac
teri
stic
sN
OY
ESN
OY
ESN
OY
ESM
ean
ofD
ep.V
ar.
0.14
40.
144
0.14
50.
145
0.14
50.
145
Std.
Err.
ofD
ep.V
ar.
0.35
10.
351
0.35
20.
352
0.35
20.
352
Not
es-
Dat
aar
edr
awn
from
the
Gen
eral
Hou
seho
ldSu
rvey
(GH
S,20
00-2
006)
.So
ciod
emog
raph
icch
arac
teri
stic
sin
clud
eco
ntro
lsfo
rge
nder
,du
mm
ies
for
age,
educ
atio
n,in
com
e,re
gion
and
anin
dex
ofru
rals
tatu
san
dan
indi
cato
rfo
rm
issi
ngin
form
atio
non
inco
me.
50

Table A.3: Asylum Seekers and Waiting Times for Outpatients, 2003-2012
(1) (2) (3) (4) (5) (6)OLS OLS OLS OLS 2SLS 2SLS
Share of Asylum Seekers 80.421*** 24.499*** 68.646*** 3.985in a Local Authority (9.077) (7.397) (12.180) (13.322)Share of Asylum Seekers 76.776*** 3.733in Dispersal Accommodation (13.963) (12.548)
PCT f.e. YES YES YES YES YES YESYear f.e. NO YES NO YES NO YESObservations 293,382 293,382 293,382 293,382 293,382 293,382IV F-stat 1529 627.2
Notes - The dependent variable is the average waiting time for outpatient services (in days). Data on average waiting timesfor outpatient services are drawn from the Hospital Episodes Statistics. Data on asylum seekers are drawn from Home Office,Immigration Statistics (2003-2012). Standard errors (in parentheses) are clustered at the local authority level.
51

Appendix B
Data Sources:
UK Labour Force Survey (LFS, 2003-2012): the LFS is a quarterly survey of employment and
labour markets in the UK. We use the special license version of the survey which includes local
authority level information. Source: Office for National Statistics.
National Insurance Number (NINO) registration of overseas nationals (2002-2012): NINOs
are used to record contributions and taxes of individuals. The NINO is also necessary for most
benefit claims. Source: Department for Work and Pensions.
Asylum seeker statistics (2003-2012): this reports the number of asylum seekers in each local
authority receiving Government support (Section 95). It includes asylum seekers in dispersal and
non-dispersal accommodation. Source: Home Office.
Hospital Episode Statistics (HES, 2003-2012): it is a records-based system that covers all
NHS trusts in England, including acute hospitals, primary care trusts and mental health trusts.
Source: Health and Social Care Information Centre.
Understanding Society (US, 2009-2014): it is the largest panel survey in the world, supporting
social and economic research. Its sample size is 40,000 households from around the UK. Source:
Understanding Society project.
General Household Survey (GHS, 2002-2006): it is a multi-purpose continuous survey car-
ried out by the collecting information on a range of topics from people living in private house-
holds in Great Britain. Source: Office for National Statistics.
52