the effects of housing assistance on labor supply: …home.uchicago.edu/ludwigj/papers/aer housing...
TRANSCRIPT

American Economic Review 2012, 102(1): 272–304http://dx.doi.org/10.1257/aer.102.1.272
272
In 2006 the federal government spent around $40 billion on housing assistance for the poor, substantially more than the $28 billion spent on Temporary Assistance for Needy Families (TANF).1 Understanding how means-tested housing programs affect the behavior of recipients is relevant for policy decisions about how best to
1 The US House of Representatives Ways and Means Committee “Green Book” for 2008 reports that a total of $42.2 billion was spent on housing programs by the US Department of Housing and Urban Development (HUD), although part of the $7 billion spent on block grant programs by HUD may go to nonhousing activities such as crime prevention or child care under the Community Development Block Grant program. The US Department of Agriculture also spends around a half-billion dollars per year on rental assistance to rural families in the Section 521 program; see http://www.obpa.usda.gov/budsum/FY10budsum.pdf. Some low-income homeowners may also receive a tax subsidy through the mortgage interest deduction if they itemize.
The Effects of Housing Assistance on Labor Supply: Evidence from a Voucher Lottery†
By Brian A. Jacob and Jens Ludwig*
This study estimates the effects of means-tested housing programs on labor supply using data from a randomized housing voucher wait-list lottery in Chicago. Economic theory is ambiguous about the expected sign of any labor supply response. We find that among working-age, able-bodied adults, housing voucher use reduces labor force par-ticipation by around 4 percentage points (6 percent) and quarterly earnings by $329 (10 percent), and increases Temporary Assistance for Needy Families program participation by around 2 percentage points (15 percent). We find no evidence that the housing-specific mechanisms hypothesized to promote work, such as neighborhood quality or residential stability, are important empirically. (JEL I38, J22, R23, R38)
* Jacob: Gerald R. Ford School of Public Policy, University of Michigan, 735 S. State Street, Ann Arbor, MI 48109 (e-mail: [email protected]); Ludwig: Irving B. Harris School of Public Policy, University of Chicago, 1155 E. 60th Street, Chicago, IL 60637 (e-mail: [email protected]). This article is part of a larger series of studies of housing vouchers in Chicago with Greg Duncan, Michael Johnson, James Rosenbaum, and Jeffrey Smith. Generous financial support was provided by the National Consortium on Violence Research, the Northwestern University/University of Chicago Joint Center for Poverty Research, the Russell Sage Foundation (through their visiting scholar program for Ludwig), Smith Richardson Foundation, the William T. Grant Foundation, a HUD Urban Studies Postdoctoral Fellowship (to Jacob), and a Brookings Institution postdoctoral fellowship sponsored by the Andrew W. Mellon Foundation (to Ludwig). We thank John Baj, Ken Coles, Robert Goerge, Ron Graf, Anjali Gupta, Barry Isaacson, Bong Joo Lee, Lucy Mackey Bilaver, Jennifer O’Neil, Todd Richardson, and William Riley for their assistance in obtaining and interpreting the data used in this study, and to Abdollah Haghighi at HUD for a special data tabulation. Thanks to Kerwin Charles, Joe Doyle, Susan Dynarski, Amy Finkelstein, Jeffrey Liebman, Erzo Luttmer, Brian McCall, Bruce Meyer, Ben Olken, Edgar Olsen, Harold Pollack, Albert Saiz, Barbara Sard, Barbara Schone, Mark Shroder, Jeffrey Smith, seminar participants at the American Real Estate and Urban Economics Association, the Association for Public Policy Analysis and Management, the Bureau of Labor Statistics, the Chicago Federal Reserve, Harvard University, New York University Law School, and particularly Jeffrey Kling for helpful comments. Thanks to Dave Kirk, Sarah Rose, Elias Walsh, Wei Ha, Josh Hyman, Caroline Weber, and Thomas Wei for excellent research assistance. Any errors and all opinions are our own.
† To view additional materials, visit the article page at http://dx.doi.org/10.1257/aer.102.1.272.
ContentsThe Effects of Housing Assistance on Labor Supply: Evidence from a Voucher Lottery† 272
I. Housing Vouchers 275II. Previous Evidence 277III. The Chicago Housing Voucher Lottery 279IV. Data and Summary Statistics 279V. Empirical Strategy 283A. The Effect of Receiving a Voucher Offer 283B. The Effects of Using a Voucher 284C. Changes in Treatment Effects over Time 285VI. Results 286A. Effects of the CHAC Lottery on Voucher Utilization 286B. Effects of a Voucher Offer on Employment, Earnings, and Social Program Participation 288C. Effects of a Voucher Offer by Time Since Offer 293D. Effects of a Voucher Offer on Residential Stability and Neighborhood Environment 294E. Implied Wage and Income Elasticities 295F. The Relationship between Voucher Effects and the Economy 298VII. Discussion 300References 302

273JACoB ANd LudWig: ThE EFFECTs oF housiNg AssisTANCE oN LABoR suppLyVoL. 102 No. 1
help poor people with their housing needs, including the optimal design of housing programs and the question of whether to address housing problems among the poor through housing programs at all. Yet the research literature on the behavioral effects of housing programs is, in the words of one leading housing economist, “shockingly small” (Olsen 2003, p. 366).
The lack of good empirical evidence on this topic is particularly unfortunate because economic theory yields ambiguous predictions about the sign, let alone the magnitude, of any labor supply response to means-tested housing programs. In addition to providing fairly large subsidies, housing programs also dictate that paid rent is inversely related to family income (often referred to as the Department of Housing and Urban Development’s “HUD tax”).2 The standard static labor supply model thus predicts a reduction in labor supply through both income and substitu-tion effects. However, the effects of in-kind transfers depend on how the program constrains consumption, and whether the subsidized good is a complement or sub-stitute to leisure (Murray 1980; Leonesio 1988; Moffitt 2002). Some analysts claim housing programs may be work neutral, or even increase work, by reducing the price of complements to work (e.g., residential stability, housing or neighborhood quality, proximity to jobs) or because of the particular nonlinear budget frontiers created by the program (Schone 1992; Gahvari 1994; Shroder 2002).
Existing estimates of the effect of means-tested housing assistance on labor sup-ply are limited and mixed. One widely cited review argues “housing assistance is not persuasively associated with any effect on employment” (Shroder 2002, p. 381, 410). But absent a clear source of exogenous identifying variation, selection bias remains a serious concern with nearly all prior studies. The one randomized experi-ment in this area finds that so-called Welfare to Work (WtW) housing vouchers reduced labor supply, but just for the first year following random assignment, while also causing a large, persistent increase in TANF receipt (Mills et al. 2006). While the WtW experiment has a strong research design, its external validity may be lim-ited because eligibility for the program was restricted to those who were eligible for, received, or had recently received TANF benefits.
In this paper, we estimate the effects on labor supply of the nation’s largest low-income housing program—housing vouchers, which serve around 2 million house-holds annually at a cost of about $16 billion (Rice and Sard 2006)—using a unique dataset of everyone who applied for a housing voucher in Chicago during the late 1990s. Our identification strategy takes advantage of the fact that housing assis-tance, unlike many other social programs, is not an entitlement, and so benefits are rationed. When the organization running Chicago’s Section 8 housing voucher program3—Chicago Housing Authority Corporation, Inc. (CHAC)—formed a new
2 The system of income-based rent was debated when these programs began in the 1930s. A senior staffer of the United States Housing Authority, Warren Vinton, argued in 1940 that “good social policy would demand that families in the lowest income grade pay a lower rent in order to have some decent amount left for food and clothing. The families in the highest income grade might reasonably be expected to pay a higher rent.” A leading housing economist of the time, Edith Wood, argued instead that income-based rent would “damage the character of the next generation of American wage earners more than the improved physical conditions could possibly help their bodies. I would rather see no public housing than public housing so administered” (Hunt 2009, p. 51–52).
3 For many years, federal rental subsidy programs included both a certificate program, which required families to lease units with rents at or below the HUD Fair Market Rent (FMR), typically, as discussed below, set at the fortieth or fiftieth percentile of the local-area rent distribution, and a housing voucher program that let families lease units with higher rents (Olsen 2003, p. 402–3). Recently both programs have been combined into the Housing Choice

274 ThE AMERiCAN ECoNoMiC REViEW FEBRuARy 2012
waiting list for the program in July, 1997, a total of 82,607 income-eligible families applied to CHAC for housing vouchers—far more than the number of vouchers available. As a fair way to allocate vouchers in the presence of excess demand, CHAC randomly assigned each applicant a position on the waiting list. By 2003, a total of 18,110 families had been offered a voucher.
We focus on the roughly 90 percent of CHAC voucher applicants living in private-market housing at the time they applied, for whom vouchers typically increase con-sumption of housing and other goods, as well as marginal tax rates.4 In this way, our analysis is very different from the Moving to Opportunity (MTO) experiment, which offered vouchers to families living in public housing. For the MTO population, hous-ing vouchers do not directly affect income or wage rates (because the program rules for housing vouchers and public housing are similar) but do generate large changes in neighborhood environments (Kling, Liebman, and Katz 2007). Hence, MTO tells us something about the effects of changing the type of housing assistance provided to low-income families (vouchers versus public housing) and more generally helps shed light on the importance of neighborhood effects on behavior and well-being. Our study instead is about what would happen if we expanded the set of people receiving housing assistance by issuing more vouchers.
The primary contribution of our paper is to provide what we believe are the first estimates of the effects of a very large and understudied social program—housing vouchers—on labor supply that rely on both a clearly exogenous source of identify-ing variation and a fairly representative sample of program participants. Our ana-lytic sample consists of the entire population of families who applied for housing vouchers in Chicago in the late 1990s.
Our reduced-form estimates suggest that for working-age, able-bodied adults, voucher use reduces quarterly employment rates by nearly 4 percentage points (6 percent) and quarterly earnings by $329 (10 percent) and increases TANF receipt by 2 percentage points (15 percent). Unlike with the WtW voucher experiment, the labor supply impacts we estimate seem to persist. We also see a slight increase in average labor supply for those families who expect to receive a voucher in the future, consistent with predictions from the lifecycle labor supply model that people may shift work effort towards periods when their net wage is relatively higher. At the same time, we find that housing vouchers have little effect on two of the key housing-specific mechanisms hypothesized to boost employment: the presence of employed or otherwise affluent neighbors (who might provide useful job references or otherwise be supportive of work) and residential stability (although we note that vouchers do seem to change slightly the timing of moves, as families who expect to receive a voucher delay moves until their voucher offer).
Voucher program, which allows families to lease up units with rents above FMR so long as the family does not spend > 40 percent of adjusted income on rent (see www.hud.gov/offices/pih/programs/hcv/about/fact_sheet.htm). For convenience, we refer to rental subsidies in our analysis as “housing vouchers” or “Section 8 vouchers,” which are how most of the Chicago Housing Authority Corporation families knew the program.
4 We can identify which families are living in public housing at baseline from the forms families filled out in applying for a housing voucher. Unfortunately, we do not have data about receipt of project-based housing assis-tance after baseline, which requires data from the Chicago Housing Authority that we have been unable to access. However, we suspect that a relatively modest share of families in private market housing at baseline would have been able to enter public housing (including project-based housing assistance) during the post–voucher lottery period, given news accounts of very long wait lists for public housing in Chicago and slow development of new housing projects (see, for example, Grotto, Cohen, and Olkon 2008).

275JACoB ANd LudWig: ThE EFFECTs oF housiNg AssisTANCE oN LABoR suppLyVoL. 102 No. 1
To determine what income and substitution elasticities are consistent with our data, we write down a simple labor supply model and calibrate it using data from our treatment and control groups. This exercise suggests that our data are consistent with an income elasticity of −0.09 and a compensated wage elasticity of 0.15.
Section I discusses the behavioral mechanisms through which vouchers might affect labor supply. Sections II and III review the prior literature and describe the Chicago voucher lottery that we study. Sections IV and V discuss our data and empirical strat-egy. Finally, we present our findings and discussion in Sections VI and VII.
I. Housing Vouchers
In this section, we provide a brief review of the housing voucher program rules and how vouchers might affect labor supply. For a more detailed discussion, see online Appendix A.
Housing vouchers subsidize low-income families to live in private-market housing. Eligibility limits for housing programs are a function of family size and income. Since 1975, an increasing share of housing assistance has been devoted to households with incomes below 50 percent of the local median. Yet, demand far exceeds supply. Only 28 percent of renters with incomes below 50 percent of the local median receive hous-ing assistance (Olsen 2003). The maximum subsidy available to families is governed by the Fair Market Rent (FMR), which was essentially equal to the forty-fifth percen-tile of the local private-market rent distribution up through 1995, then lowered to the fortieth percentile.5 Since 2001, selected metropolitan areas, including Chicago, were allowed to set FMR at the fiftieth percentile. The FMR for a two-bedroom apartment in Chicago was equal to $699 in 1994, $732 in 1997, and $762 in 2000 (in nominal dollars). The voucher subsidy equals the difference between the family’s rent contri-bution (30 percent of adjusted income) and the lesser of either FMR or the unit rent. Families with vouchers can keep the subsidy for as long as they stay income eligible, which for our sample should be quite some time: average baseline income in our sample was around $14,000, while the subsidy phase-out range is around $43,000 (unless otherwise noted, all figures are reported in 2007 dollars).
However, many families who are offered vouchers do not use them (Olsen 2003). There are several explanations for the limited take-up rates. Many housing units have rents above the voucher program’s FMR. Families offered vouchers have a limited amount of time to lease a unit (usually three to six months). And some land-lords may not want to deal with the voucher program’s requirements on paperwork or minimum housing unit quality, which is verified by inspection (although failed units can be modified and reinspected).6 These program requirements, together with
5 For more detailed discussion of how the FMR is set, see the FMR overview at www.huduser.org/datasets/fmr.html.6 The share of families for whom the minimum housing unit quality constraint is binding is difficult to determine but
may be modest. Among families with incomes below 50 percent of local-area median and not receiving a housing sub-sidy, around 4 percent live in housing units that have “severe” physical problems related to plumbing, heating, electric, upkeep, and hallways, which means these units would almost surely fall below the voucher program’s minimum unit quality requirement. Another 9 percent of families live in units with “moderate” physical problems, many of which would also fall below the minimum unit quality level, suggesting a (very rough) upper bound of around 13 percent of income-eligible, unsubsidized families live in units below the voucher program’s minimum quality. (See http://www.huduser.org/portal/publications/pubasst/hud_asst_rent.html, Tables 5–7). Comparable figures for voucher recipients are 3 percent in units with severe problems, and another 6 percent are in units with moderate problems (Tables 3–7).

276 ThE AMERiCAN ECoNoMiC REViEW FEBRuARy 2012
large disparities between average baseline rents and the FMR for most voucher pro-gram participants (documented below), could help explain why only 21 percent of families nationwide who leased up with a voucher stayed in their preprogram unit (Finkel and Buron 2001).7
The most obvious way in which housing voucher receipt might affect labor supply is through the substitution and income effects implied by the standard static labor supply model illustrated in Figure 1.8 The budget constraint for families who do not receive housing assistance is given by ADE, with slope equal to minus one times the individual’s market wage (w). The maximum subsidy for a family with no earn-ings is the value of the FMR (given by G), which for the typical CHAC applicant is equal to around $12,000 per year (in 2007 dollars). Voucher rules require par-ticipants to pay 30 percent of their (adjusted) income towards rent, which reduces the after-tax wage of voucher recipients. The amount of this “tax” will be smaller for families receiving other social benefits given the way the various program rules interact (see online Appendix A). The subsidy value for families with labor market earnings (given by B in Figure 1) will be less than the full amount of the FMR but, as discussed below, the average voucher subsidy is still extremely large relative to most means-tested transfer programs.
Predicting the effect of housing programs on work is complicated for at least two reasons. The first involves how the dynamics of these programs relate to the life-cycle model of labor supply (see, for example, MaCurdy 1981). In many cities, housing programs have very long waiting lists. Families on the wait list expect to receive a subsidy in the future, which increases lifetime permanent income. But these families also know that once they receive a voucher, their wage rate will be reduced because of the implicit tax. If people wish to supply more labor in periods when wages are high,
7 One potential concern with housing vouchers is that they might simply increase market rents. Yet data from the Supply Experiment of the Experimental Housing Allowance Program of the 1970s revealed no such inflationary effects (Struyk and Bendick 1981; Olsen 2003,).
8 Since income limits are set at half of local median income and the FMR is set at between 40 and 50 percent of the local rent distribution, in places where rents are high relative to income, “housing notches” are a possibility. We abstract from this possibility in our figure to simplify the discussion.
G
Hours worked
Income
Slope = −w
Slope = −w (1 − t)
B C
A
0
E
D
Figure 1. Budget Constraint with a Means-Tested Transfer

277JACoB ANd LudWig: ThE EFFECTs oF housiNg AssisTANCE oN LABoR suppLyVoL. 102 No. 1
and if intertemporal substitution effects dominate lifetime wealth effects, we could observe an increase in work effort while they are on the program wait list.
Second, and perhaps more important, Schone (1992) shows that the nonlinearities housing vouchers generate in budget constraints could also potentially increase work effort. The basic intuition is that housing programs offer participants a “take it or leave it” level of housing consumption. If housing program participation increases the amount that people contribute out-of-pocket towards housing, the result could be an increase in work effort in order to meet minimal levels of consumption for other goods.9
The in-kind nature of the subsidy also makes it hard to predict the effects of hous-ing vouchers on labor supply, which will depend in part on the degree to which the in-kind subsidy constrains people’s consumption, and how the subsidized commod-ity complements or substitutes for leisure (Murray 1980; Leonesio 1988; Moffitt 2002). If the subsidized good is a substitute for leisure, then the transfer may lead to a smaller reduction in work effort compared to an equally generous cash transfer, or could even increase work (Leonesio 1988; Gahvari 1994).10
The other key indicator of self-sufficiency that we examine in our study is par-ticipation in other social programs. Housing vouchers could increase receipt of other social services if interaction with housing agencies reduces the information or other costs of enrolling in other programs. In the Welfare to Work study, Mills et al. (2006) found that housing vouchers enabled unmarried women to change their living arrange-ments and form their own households, which they hypothesize was one reason for the increase in welfare utilization rates observed in that study. And if housing vouchers reduce (increase) labor supply, this would increase (decrease) the subsidy amount families would receive from enrolling in the TANF or Food Stamp programs.
II. Previous Evidence
Whether, and how, means-tested housing programs impact work effort are ulti-mately empirical questions. In an influential review of the housing literature, Mark Shroder (2002) laments the “critical theoretical weaknesses” of the standard labor supply model in ignoring the possibility that increased housing consumption could help increase work and argues the empirical research is “consistent with [a hous-ing voucher] … effect of zero” on labor supply. However, Shroder notes that most studies simply compare the labor supply of program participants with nonpartici-pants, which may confound program impacts with unmeasured individual attributes
9 The share of CHAC voucher applicants for whom spending on housing would increase (rather than decrease) as a result of voucher receipt could be relatively low. Data from Chicago on all renter households with incomes under $50,000 per year shows that 80 to 90 percent spend at least a third of their (gross) incomes on rent. (See http://www.chicagorehab.org/resources/docs/research/city_of_chicago_2009factsheet.pdf.) Note also that the share of house-holds that would wind up spending more on housing if they receive a voucher could even be lower than these figures suggest, since the voucher program requires families to make rent contributions of 30 percent of adjusted income, which is less than gross income as described in online Appendix A.
10 The substitute/complement issue is relevant even for programs that provide families directly with an in-kind benefit (like a housing voucher), rather than directly change the price of housing by setting the subsidy equal to some share of housing expenditure. Gahvari (1994) defines a good to be “over-provided” if “the transfer recipient strictly prefers an offer of a one dollar cut in his allotment of in-kind transfers, matched by a one-dollar increase in his cash grants, to his current allocation” (p. 498). Figure 1 from Currie and Gahvari (2008) shows that if a govern-ment program that provides people with an in-kind benefit leads the good to be overprovided, households are at the kink in their budget constraint created by the in-kind benefit, and the virtual budget constraint through the relevant indifference curve will have a lower price of housing than before. We thank the editor for this point.

278 ThE AMERiCAN ECoNoMiC REViEW FEBRuARy 2012
associated with both work decisions and program participation. In addition, many studies measure program participation using survey self-reports, which suffer from reporting problems that vary systematically by actual program involvement.
More recent studies also paint a mixed picture of whether housing programs impact labor supply. The most common estimation approach among recent studies is to rely on within-person, over-time variation in housing program participation and labor supply. Studies using this design yield conflicting results regarding whether and how housing assistance impacts labor supply and social program participation. However, such studies are vulnerable to bias from omitted variables correlated with both changes in housing status and work or social program participation.11
An alternative approach is employed by Yelowitz (2001), who exploits across-area variation in FMRs and housing program rules that relate housing benefits provided by either public housing or housing vouchers to the sex composition of a family’s children. He finds a one–standard deviation increase in housing subsidy ($180 per month) reduces labor force participation by 4 percentage points (from a baseline of 70–75 percent). It is not clear, however, how much of the identification comes from variation in benefit levels due to the sex composition of children, which is plausibly exogenous, versus within- and/or across-MSA changes in FMR or income eligibil-ity limits, which may be correlated with unobserved factors that affect labor supply. Similar evidence that housing programs reduce labor force participation comes from Painter (2001), who uses data from the 1984 wave of the Survey of Income and Program Participation (SIPP) that ask respondents whether they are on a housing program wait list.
The recent WtW experiment by HUD finds that voucher use reduces quarterly employment rates (earnings) by 7 (12) percent in the first year, but in years two and three the labor supply effects are smaller and not statistically significant (Mills et al. 2006). The authors interpret this pattern as revealing a temporary decline in work due to the disruptions associated with moving. However, the confidence intervals around the WtW estimates cannot rule out impacts on work and earnings of up to 10 and 13 percent, respectively, which fit quite comfortably around the point estimates that we derive from the Chicago sample, presented below. The apparent discrepancy between the statistically insignificant medium-term WtW estimates and our own statistically significant medium-term results may simply be due to our much larger sample. Like our study, the WtW experiment does suggest that vouchers generate large, sustained increases in TANF receipt.
The main limitation with the WtW voucher experiment has to do with exter-nal validity. The sample is restricted to families who at baseline were eligible for, received, or had recently received TANF benefits. As we note below, TANF partici-pation mutes the effect of voucher receipt on effective marginal tax rates because of the way the program rules interact for TANF and housing vouchers. Of course,
11 Olsen et al. (2005) use data from HUD administrative records and the Panel Study of Income Dynamics (PSID) and find a 30 to 35 percent reduction in earnings associated with receiving either a housing voucher or a project-based subsidized housing unit. In contrast, Newman, Holupka, and Harkness (2009) use propensity-score matching methods with the PSID and find no detectable effects of entering project-based assistance on work or earnings but find welfare receipt increases by over 50 percent. Using a similar propensity-score matching design, Susin (2005) finds housing assistance reduces earnings by 15 percent among respondents to the Survey of Income and Program Participation, and Carlson et al. (2008) find earnings drop 12 percent the first year following voucher receipt using administrative data from Wisconsin, although the effect fades out within five years.

279JACoB ANd LudWig: ThE EFFECTs oF housiNg AssisTANCE oN LABoR suppLyVoL. 102 No. 1
having results applicable to just TANF recipients is still useful, despite the large decline over time in TANF receipt rates, but does limit the degree to which these findings generalize to the broader population of housing program participants.
III. The Chicago Housing Voucher Lottery
In July 1997, Chicago Housing Authority Corporation (CHAC) opened the city’s voucher wait list for the first time in 12 years and received a total of 82,607 applica-tions from income-eligible people. CHAC randomly assigned applicants to a waiting list in August 1997 and notified those in the top 35,000 positions of their wait list number. CHAC told these families on the “active wait list” that they would be offered a voucher within three years. CHAC informed the remaining applicants (random lot-tery numbers 35,001 to 82,607) that they would not receive vouchers. About 4,625 families were offered vouchers in the first year after the wait list lottery. Service of the July 1997 wait list was interrupted in August 1998, as CHAC was required to provide vouchers to a set of Latino families in response to a discrimination lawsuit against the City of Chicago. CHAC began to serve the 1997 wait list again at the start of 2000. By May 2003, after offering vouchers to 18,110 families from this original 1997 waiting list, CHAC was “overleased,” that is, had issued as many or more vouchers than it had funding to pay for and essentially stopped offering any new vouchers.12
In the analysis that follows, we define our “treatment group” to be families offered vouchers by May 2003 (lottery numbers 1 to 18,110). The control group consists of applicants with lottery numbers above 35,000 who were told that they were not on the active wait list and would not get a voucher. We exclude families with lot-tery numbers between 18,110 and 35,000 from our primary sample because of their ambiguous treatment status (i.e., their behavior might have been affected by the anticipation of a voucher, but since CHAC stopped giving out vouchers in 2003 these families may have given up hope of getting one). We later show that including this group does not change our findings.
IV. Data and Summary Statistics
This section briefly describes the primary data sources used in our analysis. For more details, see online Appendix B. The application forms for the 1997 wait list pro-vide baseline information on the 82,607 adults and nearly 8,700 spouses who applied to CHAC for a housing voucher (CHAC 1997). These files include information on address, lottery number, and basic household demographics, as well as identifying information for the household heads and spouses. The baseline application forms do not include identifying information on other members of the applicant’s household. We use data from the Illinois Department of Human Services (IDHS) to determine who lived with the CHAC applicants in the period immediately before the wait list was opened (Chapin Hall 2005). Because this procedure (described in Appendix C) relies entirely on prelottery data, any measurement error in identifying baseline household
12 The number of families offered vouchers per year (and the voucher utilization rate) was 1,540 (50.3 percent) in 1997; 3,085 in 1998 (50.1 percent); 2,631 in 2000 (43.6 percent); 5,733 (44.5 percent) in 2001; 4,674 (49.7 per-cent) in 2002; 446 (42.7 percent) in 2003.

280 ThE AMERiCAN ECoNoMiC REViEW FEBRuARy 2012
members will be orthogonal to wait list position. Data on voucher utilization comes from HUD 50058 records, which families must complete at least once each year to verify program eligibility (CHAC 2005).
To track residential locations for both the treatment and control groups, we rely on a variety of passive tracking sources such as the National Change of Address (NCOA) registry and national credit bureau checks. Because of resource constraints, we tracked a random 10 percent subsample of all CHAC applicants (NORC 2005).13 Using these addresses, we are able to characterize each household’s residential neighborhood using (among other sources) 2000 census data down to the block group level. To determine whether a family was in public housing or project-based Section 8 housing (essentially privately operated public housing) at the time of the lottery, we merge baseline addresses from the lottery application files to lists of subsidized units maintained by the Chicago Housing Authority and HUD (Jacob 2004).14
To obtain measures of labor force participation, we merge the applicants to sev-eral different Illinois state administrative databases using probabilistic matching techniques that use data on name, date of birth, and Social Security number. Illinois Unemployment Insurance (UI) records from 1990 through the end of 2005 provide quarterly earnings for individuals working for employers who pay more than $1,500 in total wages in a quarter to all employees (IDES 1999–2005). We consider an individual employed in a quarter if he or she has positive earnings. One limitation of the UI data is that coverage excludes those who are self-employed or indepen-dent contractors, work for the military or federal government, do part-time work for schools or selected nonprofits, or engage in agricultural work. Previous studies have found that people’s survey-reported earnings often exceed those captured by UI data, which Schochet, Burghardt, and McConnell (2008) suggest may be due to some combination of overreporting of hours in surveys, survey nonresponse bias, and omission of short-term cash-only or casual jobs in the UI data.15
Public assistance files from the Illinois Department of Human Services (IDHS) provide information on Aid to Families with Dependent Children (AFDC)/TANF, Food Stamp, and Medicaid receipt from 1989 through the end of 2005 (Chapin Hall 2005). This information contains the starting and ending dates of all social program spells, from which we create indicators for whether any assistance is received dur-ing a given quarter.
13 We have confirmed that this subset matches the overall applicant pool on a variety of baseline characteristics, and that the impact estimates on labor supply for this 10 percent subsample are virtually identical to the impact estimates for the full sample. We are also able to (at least partially) verify the accuracy of the passive tracking tech-niques by comparing the addresses listed on the housing voucher applications to the earliest addresses identified by the passive tracking process. In 66 (77) percent of cases, we find that the address listed on the housing voucher application form matches at least one of the 1997 (any year) addresses identified through the passive tracking. It is worth noting that any measurement error in the residential location information we use will simply reduce the precision of our estimates (rather than bias the point estimates themselves), since these location measures will be used as dependent variables.
14 Throughout our analysis, we focus on baseline housing status because the outcome of the voucher lottery may have influenced a family’s living arrangement. This means the group identified as living in a housing project at baseline may include some families who are in private-market housing by the time they are actually offered a housing voucher by CHAC because of both the natural transition of families out of project-based housing units over time, and demolition of public housing in Chicago during this period (Jacob 2004).
15 While survey earnings are typically higher than UI earnings, sometimes impact estimates are similar for the two data sources, as in Kornfeld and Bloom’s (1999) study of the National Job Training Partnership Act. This was not the case in the Schochet, Burghardt, and McConnell (2008) study of Job Corps, where survey data showed larger earnings gains than did the UI data. See also Hotz and Scholz (2001) for a discussion of this measurement issue.

281JACoB ANd LudWig: ThE EFFECTs oF housiNg AssisTANCE oN LABoR suppLyVoL. 102 No. 1
One potential threat to the internal validity of our estimates comes from the pos-sibility that our treatment and control groups might move out of state at differential rates, since we rely on Illinois data and families can use their vouchers to move else-where. However, our address data show that the same fraction of treatment and con-trol households—roughly 10 percent—spent at least some time between 1997:III and 2005:IV out of Illinois. Similarly, the average fraction of quarters spent outside of Illinois was 0.042 for both treatment and control households.
For the main analyses presented below, we limit our sample to the set of CHAC applicants who were working age (i.e., younger than 65 years old), able bodied (i.e., not disabled, as self-reported on the application form) and living in private-market housing when they applied to the voucher lottery. Table 1 presents summary statis-tics of the baseline characteristics for this sample for our treatment group (lottery numbers 1 to 18,110) and control group (35,001 to 82,607). The vast majority of applicants in our sample are low-income African-American women, with annual baseline income of around $14,000. Among all recipients of tenant-based subsi-dies nationwide, 16 percent are elderly and 25 percent are disabled (Green Book 2008, Table 15-1). Among the 59 percent of voucher holders nationwide who are working age and able bodied, 91 percent are female, 82 percent have one or more children, 55 percent are black and no other race, 19 percent are Hispanic, 51 percent live in central cities, and the overall mean income is $13,200.16 Our sample over-represents central city residents and blacks but otherwise seems fairly representative of working-age, able-bodied voucher holders nationwide.
We estimate average annual baseline rent to be $8,160 for our sample, based on mean rents paid by similar types of families living in the same baseline census tracts (see online Appendix D). The figures suggest that even if families have some unre-ported income, they are presumably still devoting a large share of income towards rent, although it should be noted that simple rent-to-income ratios ignore the value of the in-kind subsidies that these low-income families receive, and that voucher applicants doubled up with another family may be paying less in rent at baseline.17 In any case, our figures are consistent with previous estimates that more than one in five of all renter households in Chicago devote over half their income towards rent.18
The average fair market rent (FMR) for our sample was approximately $12,000 per year. The average CHAC applicant would be required to contribute around $3,735 per year towards rent under the voucher program rules, so that the average maximum subsidy would be $8,265 per year. Reeder (1985) estimates the ratio of mean benefit to mean subsidy for housing vouchers to be around 0.83, so that the average equivalent variation of a housing voucher for our sample is $6,860 per year. Because the average family that leases up with a voucher could reduce out-of-pocket spending on rent from $8,160 to $3,735, it can consume over half the subsidy value in the form of goods other than housing.
16 We are grateful to Abdollah Haghighi and Mark Shroder at HUD for carrying out a special data tabulation for the characteristics of working-age, able-bodied voucher recipients. These figures are as of March 31, 2009.
17 Olsen (2003) reports that housing agencies tend to prioritize vouchers for the neediest families. Sinai and Waldfogel’s (2005) cross-sectional estimates suggest that each housing voucher increases the total number of occu-pied housing units in an area by 0.7.
18 The Census Bureau’s Fact Sheet for Chicago indicates there are a total of 515,047 renter households in the city, while the Chicago Rehab Network estimates that 117,000 renter households are spending more than 50 percent of their incomes on rent (www.chicagorehab.org/takeaction/facts.htm, accessed on October 14, 2008).

282 ThE AMERiCAN ECoNoMiC REViEW FEBRuARy 2012
The key to estimating the effects of these housing subsidies on labor supply is that CHAC assigned applicants randomly to the program wait list. Table 1 provides evidence suggesting that the CHAC randomized voucher wait list lottery was indeed random. The mean values for the 11,696 treatment applicants and 30,662 control group applicants for the baseline (i.e., pre-lottery) characteristics listed in Table 1 are virtually identical. Only two of the 26 pairwise differences are significant at 5 percent, and the magnitudes are quite small. An omnibus test of the differences between the treatment and control groups, which essentially consists of regressing lottery numbers against all of the baseline characteristics shown in Table 1 in a way that accounts for the correlation among these baseline variables, yields a p-value of 0.50.19
19 We conduct an omnibus F-test of the differences between the treatment and control group by estimating a seemingly unrelated regression (SUR) where all of the characteristics listed in Table 1 are stacked as y (outcome) variables and the only X variable is an indicator for treatment group status and a constant. We conduct this test two ways, first clustering standard errors at the household level, and then again clustering at the baseline census tract level. In either case, the p-value is far from the conventional threshold for statistical significance.
Table 1—Baseline Characteristics of Treatment and Control Group Households
Control group
Treatment group
All Compliers Noncompliers
HHH male 0.121 0.124 0.076 0.173HHH black 0.943 0.942 0.956 0.926HHH Hispanic 0.035 0.035 0.026 0.045HHH white 0.033 0.033 0.018 0.050HHH other 0.004 0.005 0.002 0.008Has spouse 0.088 0.087 0.057 0.117Number of adults in HH 1.254 1.253 1.208 1.298Number of kids 0–18 in HH 1.752 1.746 1.855 1.638Age of HHH 32.023 32.116 30.624 33.615Indicated interest in the certificate program as well as the voucher program
0.786 0.786 0.792 0.781
Reported receiving Supplemental Security Income (SSI) benefits
0.059 0.060 0.061 0.058
Time (in days) of application since applications opened 9.944 9.942 9.436 10.451HHH receiving TANF 1997:II 0.409 0.395** 0.505 0.285HHH wage (2007$) 1997:II 2,363 2,415 1,897 2,936HHH employed 1997:II 0.562 0.572* 0.544 0.601HHH receiving TANF, Med, or FS 1997:II 0.600 0.593 0.714 0.471HHH number of prior violent crime arrests 0.146 0.157 0.155 0.159HHH number of prior property crime arrests 0.185 0.186 0.164 0.208HHH number of prior drug crime arrests 0.119 0.122 0.103 0.141HHH number of prior other crime arrests 0.178 0.179 0.166 0.193Percent black in census tract 0.819 0.820 0.848 0.790Poverty rate in census tract 0.289 0.289 0.299 0.278Census tract property crime (crimes per 1,000 residents) 84.8 83.2** 86.1 80.3Census tract violent crime (crimes per 1,000 residents) 20.1 19.9 21.3 18.6Monthly rent, 2007$ 682 678 671 687Monthly fair market rent, 2007$ 1,053 1,052 1,061 1,044Number of households 30,662 11,696 5,863 5,833F-statistic (clustering at the HH level) 0.94p-value 0.5474
Notes: The unit of analysis is the household head. The sample includes all working-age, able-bodied CHAC appli-cants who were living in private housing at baseline. All earnings, rent, and FMR are measured in 2007 dollars.
** Significant at the 5 percent level. * Significant at the 10 percent level.

283jacob and ludwig: the effects of housing assistance on labor supplyVol. 102 no. 1
Roughly half of those in the treatment group used a voucher. While the families within the treatment group that used vouchers differ from those that did not, this does not bias our estimates below because we focus on the essentially “experimen-tal” comparison of all treatment to all control families.
V. Empirical Strategy
Given that the voucher wait list lottery was random, a simple comparison of means between those offered vouchers and those who were not will provide an unbiased estimate of the effects of being offered a voucher (the intent-to-treat effect, or ITT). Our application is complicated slightly by the fact that people were offered vouchers at different points in time. In this section we discuss how we estimate the ITT effect as well as the effects of using a voucher.
A. the effect of receiving a Voucher offer
Our data consist of a balanced panel where the unit of observation is the household- quarter, from 1997:III (the first post-lottery quarter) through 2005:IV. For some out-come y it for CHAC applicant i in calendar quarter t, we use OLS to estimate the ITT effect from equation (1):
(1) yit = α + β1 (postofferit) + β2 (preofferit) + XΓ + γt + εit.
postofferit equals one if individual i has been offered a housing voucher through the CHAC 1997 lottery in any period prior to t, and zero otherwise. preofferit equals one for individuals in the treatment group in the post-lottery quarters prior to their voucher offer. We also control for calendar year-quarter effects, γ t , to account for changes over time in economic conditions. Among the control group, employment rates rose through 2000 then declined, while rates of public assistance receipt fell steadily over our study period (online Appendix Figure 1). These patterns mirror trends in the Chicago-area unemployment and rental vacancy rates (online Appendix Figure 2).
The fact that applicants were randomly assigned positions on the waiting list (and thus randomly assigned a likelihood of receiving a voucher offer) ensures that equa-tion (1) will provide consistent estimates of the voucher treatment effect. Unlike the vast majority of prior work in this literature, the inclusion of covariates should not significantly change the point estimates. To increase statistical precision, however, we do control for a rich set of individual and family baseline characteristics, X, which are described in detail in online Appendix B. Standard errors are clustered by household (Bertrand, Duflo, and Mullainathan 2004).
In equation (1), identification of the main intent-to-treat (ITT) effect, given by β 1 , comes from a within-period comparison of the average outcomes of those offered vouchers versus the control group. If there is heterogeneity in the effects of a voucher offer on labor supply across people, calendar time or duration of voucher receipt, then our ITT estimate can be interpreted as an average of the ITT effects across all post-voucher-offer person-quarter observations in our panel. The coefficient β 2 on the preoffer indicator provides some evidence on whether families change their

284 ThE AMERiCAN ECoNoMiC REViEW FEBRuARy 2012
behavior in anticipation of getting a voucher. This coefficient does not serve as an additional “randomization check,” since it is estimated off of postrandomization treatment-control differences (recall our panel includes only post-lottery quarters).
B. The Effects of using a Voucher
The intent-to-treat estimates will not equal the effect of actually utilizing a hous-ing voucher in our data because not all treatment-group families who were offered a voucher use it, and a small share of control group families received a housing voucher through some other special allocation during our study period (between 5 and 8 percent, as shown below).20 Under the assumption that the voucher offer does not have an impact on those who choose not to take it,21 one can use the exogenous variation in voucher offers generated by the randomized July 1997 CHAC wait list lottery to estimate the effect of utilizing a housing voucher. We implement this in a simple two-stage least squares framework:
(2) Lease d it = α + θ 1 postoffe r it + θ 2 preoffe r it + X Γ + γ t + ε it
(3) y it = η + π 1 Lease d it + X Π + μ t + υ it .
For the first-stage equation in (2), the outcome is an indicator for whether house-hold i had utilized a housing voucher provided by any source (the CHAC lottery or some other special allocation) by period t. Under this definition a family that uses but then gives up its voucher does not become “untreated.” If we were sure the only relevant behavioral mechanisms were income and substitution effects, we might define treatment more narrowly as active use of a voucher in a given quarter. But the housing literature provides some plausible reasons to believe there could be other channels through which vouchers could affect work.22
If the effects of a voucher on behavior do not vary by time since lease-up, then our instrumental variables (IV) estimate for π1 captures the local average treatment effect (LATE) on those who are induced to use a voucher by being assigned a good lottery number by CHAC (Angrist, Imbens, and Rubin 1996). If voucher effects instead vary by how long a family has been leased up, then π1 captures the LATE for those who lease up for a longer period of time due to treatment group assignment, so long as we are willing to assume that control group crossovers would have been leased up for at least as much time had they instead been assigned to the treatment group. If we instead calculated our IV estimate using a more conservative assump-tion that all treatment group voucher users lease up for a longer period of time than if
20 Among the other sources of housing vouchers during our study period was the Hope VI program, through which HUD financed CHA to demolish some of the city’s most notorious housing projects; some of the displaced families were offered vouchers through a special allocation. Other families on the CHAC application list could have received vouchers from another program because they contained a disabled member, or were at risk for having parents separated from children without a change in housing status, or were Latino and so received vouchers as a result of litigation by Latinos United against the CHA.
21 While we do not think this assumption is strictly true, we believe that it is a reasonable approximation.22 For instance, if a family uses a voucher to move to a neighborhood that is closer to job opportunities and filled
with more employed neighbors who can provide useful job references, and as a result gets a good job that boosts the family’s income beyond the eligibility limit of the voucher program, we would not wish to count it as being “untreated” after it leaves the voucher program.

285JACoB ANd LudWig: ThE EFFECTs oF housiNg AssisTANCE oN LABoR suppLyVoL. 102 No. 1
they had been assigned to the control group, our IV estimate will capture the effects of treatment on the treated (TOT). We show below that using alternative definitions of “treatment” does not change our findings, which is not surprising given that our control group crossover rates are relatively low.
As a benchmark for judging the size of our IV estimates, we present what Katz, Kling, and Liebman (2001) call the control complier mean (CCM), or the average outcome for controls who would have used vouchers had they been assigned to the treatment group. The CCM is estimated by subtracting π1 from the mean outcome for the treatment group families that lease up with a housing voucher.23
C. Changes in Treatment Effects over Time
We are also interested in how voucher effects might change over time, both for policy purposes and to learn more about underlying behavioral mechanisms. To do so, we calculate ITT effects for each period after the voucher offer, using the fol-lowing equation:
(4) y it = α + ∑ k
d it k δ k + X Γ + γ t + ε it ,
where the binary variables d it k equal one if, in period t, individual i is k periods from
when she was offered a voucher through the CHAC 1997 lottery (where k can take on positive and negative values). The coefficients δ k capture the effect of a voucher offer over time relative to when the voucher was offered. ITT estimates by time relative to the voucher offer reflect the net (reduced form) effect of a variety of fac-tors. The ITT effect could be changing over time because the behavioral response to leasing up with a voucher varies, or because the fraction of treatment or control group families that have leased up with a voucher changes over time.24 Moreover, because vouchers were offered to different families in different years, changes in the ITT over time may reflect, in part, the fact that the voucher impact varies over time because of changes in factors like economic conditions. We explore some of these sources of heterogeneity below.
In principle, we might also like to estimate the effects of actually being leased up for a given period of time. However we cannot identify this parameter without imposing additional structure on the data,25 and so instead focus on the simpler ITT-by-time estimates.
23 This CCM calculation assumes a TOT interpretation of the IV estimate, in which all of the treatment group fami-lies who use a voucher are “treated.” A LATE interpretation of the IV estimate may be more appropriate, defined as the average effect of voucher use on those families who lease up if assigned to the treatment group, but who would not have leased up if they were assigned to the control group. In this case the CCM will not be quite the right benchmark for the IV but should be close to the right benchmark given that control group crossover rates are low.
24 If the treatment effects are heterogeneous, then changes in the composition of the treatment and control fami-lies utilizing a housing voucher may also contribute to changes in the ITT effects over time.
25 For example, Mills et al. (2006, Appendix B) present a method for estimating the effects of being leased up for a given duration that uses a recursive approach, in which they first calculate the effects of being leased up for one period (which they can identify with their data) and then use that estimate to back out the effects of being leased up for two periods, then use both of those estimates to back out the effects of being leased up for three periods, and so on. But their estimation approach assumes that the effect of being leased up for one period in the first period since random assignment is the same as the effect of being leased up for one period in the second period since random assignment. This assumption may be violated if the people who lease up with some delay have a different behav-ioral response to vouchers from those who lease up right away after the voucher offer. The assumption may also

286 ThE AMERiCAN ECoNoMiC REViEW FEBRuARy 2012
VI. Results
We show that being offered a voucher through the CHAC wait list increases the chances of using a voucher, and that voucher use reduces work and earnings and increases social program participation but has little impact on neighborhood envi-ronments or residential stability.
A. Effects of the ChAC Lottery on Voucher utilization
The vouchers allocated by CHAC through the 1997 wait list lottery represent the largest, but not the only, voucher allocation in Chicago during our study period. By the end of our study period in 2005, nearly 8 percent of control households had used a voucher obtained from some other allocation (online Appendix Figure 3). Nonetheless, receiving a voucher offer through the 1997 wait list lottery substan-tially increases the chances of utilizing a voucher from any source, as shown in Table 2. Column 1 shows the coefficient on the postoffer indicator from estimating equation (2). The control mean indicates that, in the average quarter, 5.3 percent of controls used a voucher. Assignment of a good wait list number by CHAC increased voucher lease-up rates by roughly 40 percentage points (the F-test statistic is over 7,500). To more clearly illustrate the total fraction of households who ever utilized a housing voucher, in column 2 we regress an indicator for whether the family ever uses a voucher during our study period against an indicator for ever receiving a voucher offer through the 1997 wait list (between 1997 and 2003), conditional on baseline covariates. The unit of observation now is the household, not the house-hold-quarter. A total of 7.6 percent of control families obtained a voucher at some point. Households that received a voucher offer were 42.6 percentage points more likely than controls to use a voucher over our sample period. Two-thirds of the treat-ment group households that use a housing voucher do so within the first quarter of the voucher offer, and over 90 percent lease up within a year of the offer.
As noted above, there are a variety of reasons families may not utilize a housing voucher when offered one. The take-up rates we report here are consistent with those reported in previous studies.26 Columns 3–7 explore the heterogeneity of voucher utilization by regressing an indicator for whether a household ever uses
be violated if the effects of using a voucher depend on the point in calendar time when the voucher is used, as may be the case, for example, if housing market conditions influence housing search outcomes. The staggered rollout of housing vouchers in our case allows us to identify the impact of calendar time on voucher utilization, but still does not allow us to identify the impact of calendar time x voucher use or time of usage (usage intensity) effects without further assumptions. Angrist and Imbens (1995) provide a framework in which one can estimate average causal effects in models with variable treatment intensity, which would be an alternate approach for understanding how voucher effects differ by time since offer. Thanks to Jeffrey Kling for very helpful discussions on this issue.
26 Our estimates in Table 2 imply that around half of families in our treatment group lease up with a voucher. By comparison, Finkel and Buron (2001) study 48 public housing agencies around the country and find an overall voucher lease-up rate of 69 percent in 2000, with lower rates in big cities such as New York (57 percent) and Los Angeles (47 percent); around 15 percent of agencies had lease-up rates under 50 percent. Rubinowitz and Rosenbaum (2000) report that in the Gautreaux mobility program in Chicago, around 19 percent of the public housing families who signed up moved with a voucher. Kling, Liebman, and Katz (2007) report that in the Moving to Opportunity experiment, 47 per-cent of families assigned to the experimental (low-poverty) voucher group lease up, as do 60 percent of those assigned to the regular Section 8 voucher group. See also Olsen (2003). It is possible that the Gautreaux rate is much lower than with other voucher programs because of the restrictions the program placed on mobility outcomes—families were not allowed to use their vouchers to move to racially segregated neighborhoods.

287JACoB ANd LudWig: ThE EFFECTs oF housiNg AssisTANCE oN LABoR suppLyVoL. 102 No. 1
Table 2—The Effect of Voucher Offer and Other Baseline Household Characteristics on Voucher Utilization
Treatment and control households Treatment households only
(1) (2) (3) (4) (5) (6) (7)
HHH received a voucher offer 0.399** in a prior quarter (0.005)HHH ever received 0.425** voucher offer (0.005)HHH male −0.222** −0.128** −0.135** −0.135**
(0.013) (0.014) (0.014) (0.014)Age of HHH −0.021** −0.016** −0.015** −0.015**
(0.003) (0.003) (0.003) (0.003)Age (squared) of HHH 0.000** 0.000** 0.000** 0.000**
(0.000) (0.000) (0.000) (0.000)2 people in HH 0.089** 0.009 0.009 0.007
(0.015) (0.015) (0.015) (0.015)3 people in HH 0.114** 0.024 0.022 0.022
(0.015) (0.016) (0.015) (0.015)4 people in HH 0.108** 0.024 0.019 0.019
(0.016) (0.018) (0.017) (0.017)5 + people in HH 0.096** 0.001 −0.002 −0.002
(0.017) (0.018) (0.017) (0.017)HHH employed 1997:II −0.058** 0.103** 0.107** 0.107**
(0.009) (0.013) (0.012) (0.012)HHH receiving TANF 1997:II 0.230** 0.055** 0.063** 0.063**
(0.009) (0.014) (0.013) (0.013)HHH receiving TANF, Med, or 0.251** 0.133** 0.134** 0.134** FS 1997:II (0.009) (0.013) (0.013) (0.013)HHH wage (2007$) 1997:II −0.028** −0.021** −0.021** −0.021** ($1,000s) (0.001) (0.002) (0.002) (0.002)Combined HH earnings 1997:II −0.006** ($1,000s) (0.00)Poverty rate in census tract 0.277** 0.214** 0.127** 0.130**
(0.035) (0.044) (0.042) (0.042)Census tract violent crime rate 0.227** 0.139** 0.089** 0.086** (crimes per 100,000 residents) (0.035) (0.049) (0.042) (0.042)Census tract property crime 0.011 −0.010 −0.004 −0.003 (crimes per 100,000 residents) (0.07) (0.014) (0.008) (0.007)Census tract social capital −0.070** 0.008 −0.018 −0.018
(0.029) (0.031) (0.029) (0.029)Missing census tract −0.161** −0.051 −0.153 −0.147
(0.016) (0.114) (0.109) (0.108)HHH offered voucher in 2000 −0.054** −0.057**
(0.015) (0.014)HHH offered voucher in 2001 −0.032** −0.033**
(0.012) (0.012)HHH offered voucher in 2002 0.018 0.015
(0.013) (0.012)HHH offered voucher in 2003 −0.060* −0.047
(0.031) (0.031)
(Continued)

288 ThE AMERiCAN ECoNoMiC REViEW FEBRuARy 2012
a voucher over our sample period against a series of baseline covariates, using a dataset with one observation for each of the 11,696 treatment households in our sample. Column 3 presents the results of a series of bivariate regressions in which each baseline characteristic is entered separately, while columns 4–7 show models that condition on multiple covariates simultaneously. Households living in more disadvantaged baseline neighborhoods or receiving TANF at baseline are more likely to lease up if offered a voucher. Older, male, or employed applicants are less likely to lease up. We also see that cohorts offered vouchers in 2000 and 2001 had lease-up rates several percentage points lower than the earlier and later offer cohorts. (Below we explore the degree to which changes in labor or housing market condi-tions explain these cohort differences.)
B. Effects of a Voucher offer on Employment, Earnings, and social program participation
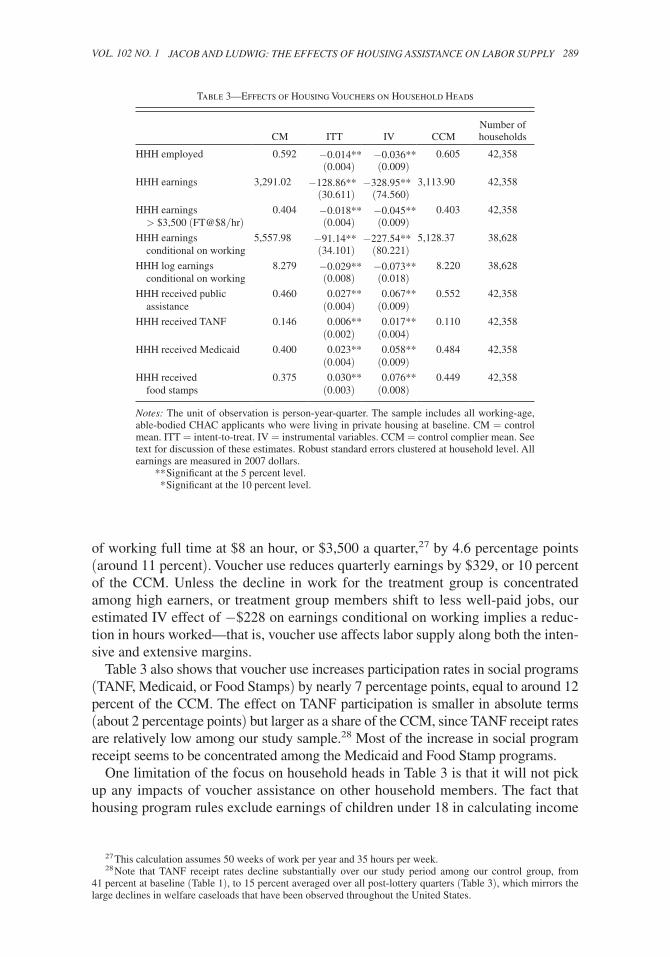
Table 3 presents the main results for our sample of working-age, able-bodied applicants living in private housing at baseline. The table shows both the estimated postoffer ITT and IV estimates on a variety of outcomes. We defer the discussion of preoffer (i.e., anticipation) effects to a later section where we discuss how the impacts vary by time relative to offer.
Voucher use reduces quarterly employment rates by 3.6 percentage points (6 per-cent of the CCM). While we cannot directly measure hours worked, voucher receipt reduces the likelihood that someone earns what would roughly be the equivalent
Table 2—The Effect of Voucher Offer and Other Baseline Household Characteristics on Voucher Utilization (Continued)
Treatment and control households Treatment households only
(1) (2) (3) (4) (5) (6) (7)
Control group mean 0.053 0.076Treatment group mean 0.501 0.501 0.501 0.501 0.501Number of households 42,358 42,358 11,696 11,696 11,696 11,696 11,696Number of observations 1,440,172 42,358 11,696 11,696 11,696 11,696 11,696Census tract fixed effects YesR2 0.262 0.232 varies 0.014 0.155 0.100 0.103F-test (neighborhood characteristics or tract dummies)
7,565.25 7,644.31 34.67 998.30 22.65 22.26
p-value (neighborhood characteristics or tract dummies)
[0.000] [0.000] [0.000] [0.000] [0.000] [0.000]
F-test (person characteristics) 95.08 113.71 114.08p-value (person characteristics) [0.000] [0.000] [0.000]F-test (offer year) 8.71p-value (offer year) [0.000]
Notes: The dependent variable for column 1 is ever used a voucher in prior quarter. For columns 2–7, it is ever used a voucher over the sample period. The unit of observation for column 1 is person-year-quarter, and for columns 2–7, it is person. Column 3 runs separate bivariate regressions. Each of the four census tract bivariate regressions include missing tract. Census tract dummies are included in column 5. For column 1, robust standard errors are clustered at household level. For columns 2–7, robust standard errors are presented. The sample includes all working-age, able-bodied CHAC applicants who were living in private housing at baseline. All earnings are measured in 2007 dollars.
** Significant at the 5 percent level. * Significant at the 10 percent level.
289JACoB ANd LudWig: ThE EFFECTs oF housiNg AssisTANCE oN LABoR suppLyVoL. 102 No. 1
of working full time at $8 an hour, or $3,500 a quarter,27 by 4.6 percentage points (around 11 percent). Voucher use reduces quarterly earnings by $329, or 10 percent of the CCM. Unless the decline in work for the treatment group is concentrated among high earners, or treatment group members shift to less well-paid jobs, our estimated IV effect of −$228 on earnings conditional on working implies a reduc-tion in hours worked—that is, voucher use affects labor supply along both the inten-sive and extensive margins.
Table 3 also shows that voucher use increases participation rates in social programs (TANF, Medicaid, or Food Stamps) by nearly 7 percentage points, equal to around 12 percent of the CCM. The effect on TANF participation is smaller in absolute terms (about 2 percentage points) but larger as a share of the CCM, since TANF receipt rates are relatively low among our study sample.28 Most of the increase in social program receipt seems to be concentrated among the Medicaid and Food Stamp programs.
One limitation of the focus on household heads in Table 3 is that it will not pick up any impacts of voucher assistance on other household members. The fact that housing program rules exclude earnings of children under 18 in calculating income
27 This calculation assumes 50 weeks of work per year and 35 hours per week.28 Note that TANF receipt rates decline substantially over our study period among our control group, from
41 percent at baseline (Table 1), to 15 percent averaged over all post-lottery quarters (Table 3), which mirrors the large declines in welfare caseloads that have been observed throughout the United States.
Table 3—Effects of Housing Vouchers on Household Heads
CM ITT IV CCMNumber of households
HHH employed 0.592 −0.014** −0.036** 0.605 42,358(0.004) (0.009)
HHH earnings 3,291.02 −128.86** −328.95** 3,113.90 42,358(30.611) (74.560)
HHH earnings 0.404 −0.018** −0.045** 0.403 42,358 > $3,500 (FT@$8/hr) (0.004) (0.009)HHH earnings 5,557.98 −91.14** −227.54** 5,128.37 38,628 conditional on working (34.101) (80.221)HHH log earnings 8.279 −0.029** −0.073** 8.220 38,628 conditional on working (0.008) (0.018)HHH received public 0.460 0.027** 0.067** 0.552 42,358 assistance (0.004) (0.009)HHH received TANF 0.146 0.006** 0.017** 0.110 42,358
(0.002) (0.004)HHH received Medicaid 0.400 0.023** 0.058** 0.484 42,358
(0.004) (0.009)HHH received 0.375 0.030** 0.076** 0.449 42,358 food stamps (0.003) (0.008)
Notes: The unit of observation is person-year-quarter. The sample includes all working-age, able-bodied CHAC applicants who were living in private housing at baseline. CM = control mean. ITT = intent-to-treat. IV = instrumental variables. CCM = control complier mean. See text for discussion of these estimates. Robust standard errors clustered at household level. All earnings are measured in 2007 dollars.
** Significant at the 5 percent level. * Significant at the 10 percent level.

290 ThE AMERiCAN ECoNoMiC REViEW FEBRuARy 2012
means a household could reduce its required rent payment by substituting labor supply by teenagers in the home for labor supply by adults. We try to address this issue by replicating our analysis using data on work, earnings, or social program participation by everyone living in the baseline household and get similar results to Table 3 (see online Appendix Table 1). This analysis is imperfect because our data enable us to identify household composition only at baseline, while the Welfare to Work experiment revealed that voucher receipt has the effect of reducing household size (Mills et al. 2006).
Table 4 presents estimates for a variety of additional subgroups. To simplify the presentation we focus on just two outcomes: quarterly labor force participation, shown in the first four columns, and quarterly participation rates in any social pro-gram (TANF, Medicaid, or Food Stamps). The first row replicates the results for our main analytic sample. The second and third rows show that the behavioral responses among those CHAC voucher applicants who were elderly (3 percent of all appli-cants) or disabled (26 percent) are, not surprisingly, smaller in relation to either the standard errors or the control complier means. Interestingly, voucher use increases social program participation among disabled voucher applicants, even though we find no detectable impact on employment rates. It is possible that interaction with voucher program administrators makes disabled participants aware of their eligibil-ity for other social services, although this hypothesis is not directly testable with our data. Estimated voucher effects on labor force participation rates are smaller among male than female household heads, but the men in our sample seem to be unusual, since they have lower average employment rates than the women. The fourth row of Table 4 shows there are also no statistically significant impacts on work or pub-lic assistance receipt for those living in public housing at baseline (all of our other estimates in the article focus on families living in private-market housing when they apply for a voucher).
While there are no significant differences in voucher effects by baseline employ-ment status, there are large and statistically significant differences in the effects by baseline social program participation. Voucher use reduces employment by 6 per-centage points (9 percent) among those who were not receiving benefits at baseline, and by only 2.5 percentage points (4 percent) among those receiving benefits.29 A similar pattern is apparent if one focuses just on TANF receipt. Impacts for both groups seem to persist over time (online Appendix Figure 4). These differences in voucher effects are consistent with the idea that changes in marginal tax rates caused by vouchers are a key mechanism behind these labor supply impacts, since partici-pation in other social programs mitigates the effect of vouchers on marginal tax rates (see online Appendix A). An alternative explanation is families on TANF at baseline have a stronger taste for leisure.30 Our findings that families on TANF exhibit a relatively more muted labor supply response to housing voucher receipt provides a
29 When we conduct an F-test for whether the IV estimates in Table 4 are the same for those receiving versus not receiving some form of public assistance in 1997:II, the 3.5 percentage point difference in estimated voucher effects on employment rates has a p-value of 0.099, while the 4 percentage point difference in the estimated voucher effect on public assistance receipt has a p-value of 0.045.
30 Employment impacts seem to be somewhat smaller among families with relatively more children, but this is not true when we look at social program participation as the outcome. When we split the sample by baseline neighborhood characteristics, we find families living in more affluent census tracts experience a smaller labor sup-ply reduction from using a voucher. But, as above, this pattern does not show up for social program participation.
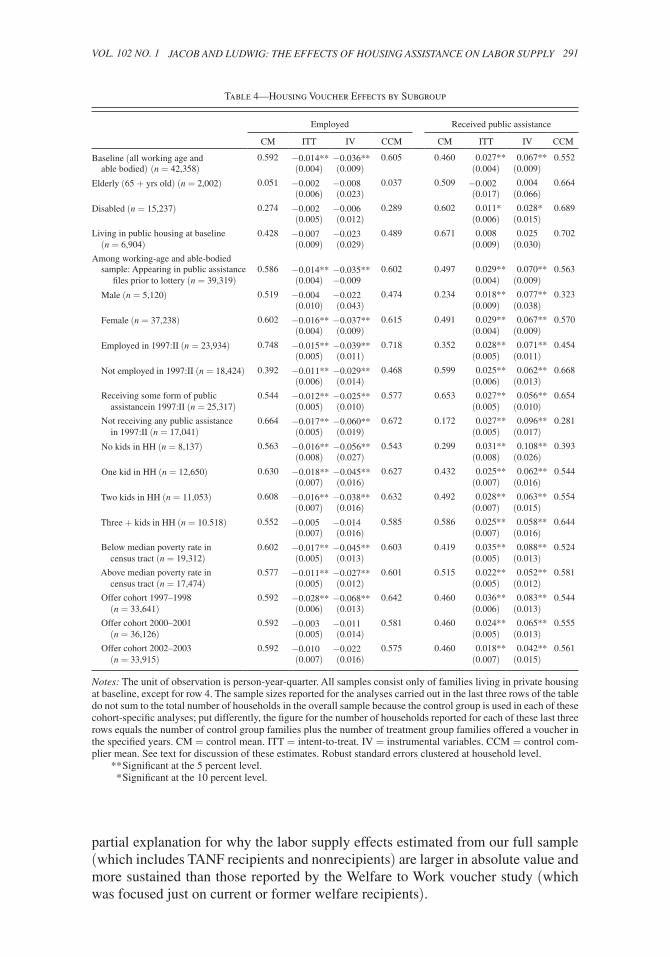
291JACoB ANd LudWig: ThE EFFECTs oF housiNg AssisTANCE oN LABoR suppLyVoL. 102 No. 1
partial explanation for why the labor supply effects estimated from our full sample (which includes TANF recipients and nonrecipients) are larger in absolute value and more sustained than those reported by the Welfare to Work voucher study (which was focused just on current or former welfare recipients).
Table 4—Housing Voucher Effects by Subgroup
Employed Received public assistance
CM ITT IV CCM CM ITT IV CCM
Baseline (all working age and 0.592 −0.014** −0.036** 0.605 0.460 0.027** 0.067** 0.552 able bodied) (n = 42,358) (0.004) (0.009) (0.004) (0.009)Elderly (65 + yrs old) (n = 2,002) 0.051 −0.002 −0.008 0.037 0.509 −0.002 0.004 0.664
(0.006) (0.023) (0.017) (0.066)Disabled (n = 15,237) 0.274 −0.002 −0.006 0.289 0.602 0.011* 0.028* 0.689
(0.005) (0.012) (0.006) (0.015)Living in public housing at baseline 0.428 −0.007 −0.023 0.489 0.671 0.008 0.025 0.702 (n = 6,904) (0.009) (0.029) (0.009) (0.030)Among working-age and able-bodied sample: Appearing in public assistance 0.586 −0.014** −0.035** 0.602 0.497 0.029** 0.070** 0.563 files prior to lottery (n = 39,319) (0.004) −0.009 (0.004) (0.009) Male (n = 5,120) 0.519 −0.004 −0.022 0.474 0.234 0.018** 0.077** 0.323
(0.010) (0.043) (0.009) (0.038) Female (n = 37,238) 0.602 −0.016** −0.037** 0.615 0.491 0.029** 0.067** 0.570
(0.004) (0.009) (0.004) (0.009) Employed in 1997:II (n = 23,934) 0.748 −0.015** −0.039** 0.718 0.352 0.028** 0.071** 0.454
(0.005) (0.011) (0.005) (0.011) Not employed in 1997:II (n = 18,424) 0.392 −0.011** −0.029** 0.468 0.599 0.025** 0.062** 0.668
(0.006) (0.014) (0.006) (0.013) Receiving some form of public 0.544 −0.012** −0.025** 0.577 0.653 0.027** 0.056** 0.654 assistancein 1997:II (n = 25,317) (0.005) (0.010) (0.005) (0.010) Not receiving any public assistance 0.664 −0.017** −0.060** 0.672 0.172 0.027** 0.096** 0.281 in 1997:II (n = 17,041) (0.005) (0.019) (0.005) (0.017) No kids in HH (n = 8,137) 0.563 −0.016** −0.056** 0.543 0.299 0.031** 0.108** 0.393
(0.008) (0.027) (0.008) (0.026) One kid in HH (n = 12,650) 0.630 −0.018** −0.045** 0.627 0.432 0.025** 0.062** 0.544
(0.007) (0.016) (0.007) (0.016) Two kids in HH (n = 11,053) 0.608 −0.016** −0.038** 0.632 0.492 0.028** 0.063** 0.554
(0.007) (0.016) (0.007) (0.015) Three + kids in HH (n = 10.518) 0.552 −0.005 −0.014 0.585 0.586 0.025** 0.058** 0.644
(0.007) (0.016) (0.007) (0.016) Below median poverty rate in 0.602 −0.017** −0.045** 0.603 0.419 0.035** 0.088** 0.524 census tract (n = 19,312) (0.005) (0.013) (0.005) (0.013) Above median poverty rate in 0.577 −0.011** −0.027** 0.601 0.515 0.022** 0.052** 0.581 census tract (n = 17,474) (0.005) (0.012) (0.005) (0.012) Offer cohort 1997–1998 0.592 −0.028** −0.068** 0.642 0.460 0.036** 0.083** 0.544 (n = 33,641) (0.006) (0.013) (0.006) (0.013) Offer cohort 2000–2001 0.592 −0.003 −0.011 0.581 0.460 0.024** 0.065** 0.555 (n = 36,126) (0.005) (0.014) (0.005) (0.013) Offer cohort 2002–2003 0.592 −0.010 −0.022 0.575 0.460 0.018** 0.042** 0.561 (n = 33,915) (0.007) (0.016) (0.007) (0.015)
Notes: The unit of observation is person-year-quarter. All samples consist only of families living in private housing at baseline, except for row 4. The sample sizes reported for the analyses carried out in the last three rows of the table do not sum to the total number of households in the overall sample because the control group is used in each of these cohort-specific analyses; put differently, the figure for the number of households reported for each of these last three rows equals the number of control group families plus the number of treatment group families offered a voucher in the specified years. CM = control mean. ITT = intent-to-treat. IV = instrumental variables. CCM = control com-plier mean. See text for discussion of these estimates. Robust standard errors clustered at household level.
** Significant at the 5 percent level. * Significant at the 10 percent level.

292 ThE AMERiCAN ECoNoMiC REViEW FEBRuARy 2012
The last three rows show the voucher effects separately for individuals offered vouchers in 1997–1998 versus those offered vouchers in later years. Note that the same set of households (i.e., those with lottery numbers 35,000 and higher) serve as the control group for each of the three separate offer cohorts, so the setup of these estimates by offer cohort is not completely analogous to the other rows, where we stratify both the treatment and control samples by baseline characteristics. Accounting for the correlation across offer cohort impacts, we find that there is a statistically significant difference in the IV estimates for employment effects across offer cohorts, but the differences in IV estimates on public assistance receipt are not statistically significant at conventional levels. Online Appendix Figure 5 shows the trends over time in raw employment and public assistance rates separately for the control group and the three offer cohorts, which mirror the differences shown in the impact estimates. The difference in employment effects by offer cohort may reflect differences in macroeconomic conditions over time, a possibility we consider further below.
Our baseline intent-to-treat results are robust to several alternative specifications. For example, our results are qualitatively similar when we condition on person-level fixed effects, which is not surprising given that the distribution of unobserved, time-invariant unobservables should be similar for the treatment and control groups in our study by virtue of random assignment to the voucher program wait list (online Appendix Table 2).31 Our results are also quite similar for our two main binary outcomes (employment and public assistance receipt) when we calculate average marginal effects from logit and probit models32 rather than using linear probability models as in our baseline specification (see online Appendix Table 3). The results are generally similar when we restrict attention to household heads age 60 and younger (online Appendix Table 4). The ITT estimates are also quite similar if we define employment as earning more than $70 per quarter rather than having any nonzero earnings in each quarter, or if we add to the control group those households that were assigned lottery numbers between 18,111 and 35,000.
Our IV estimates for the effects of actually using a voucher are qualitatively simi-lar if we define being “treated” as having used any voucher (rather than just use of a voucher obtained through the July 1997 CHAC wait list), or instead as actually being leased up with a voucher in a given quarter (rather than all post–lease-up quar-ters); see online Appendix Table 5. This is not surprising given the share of treat-ment and control group families who use vouchers obtained through other special voucher allocations besides the CHAC 1997 wait list lottery are relatively low and most families stay leased up with their vouchers.
31 Results for the fixed-effects model were added at the request of the editor. The estimated impact of voucher offer on Medicaid receipt drops significantly with the inclusion of person fixed effects, although the resulting coef-ficient is still statistically significant and qualitatively similar in magnitude. We are able to identify the ITT effect even with person-level fixed effects in the model because most people in our treatment group (i.e., most who are ever offered housing vouchers through the CHAC lottery) were offered vouchers at some point after the first quarter in our analytic sample (1997:III). This means that for most of the sample, we have person-quarter observations where the value of the offer variable takes on values of both 0 and 1 for a given person. Treatment group families offered a housing voucher in the first quarter of our panel (1997:III) will not contribute to the identification of the ITT effect in the model that includes person-level fixed effects.
32 Most of our baseline covariates are dichotomous indicator variables, and so no one in our study sample will actually have covariate values at the sample means. Rather than calculate the marginal effects at the sample average of the baseline covariates, we present the average of the marginal effects of everyone in our sample.

293JACoB ANd LudWig: ThE EFFECTs oF housiNg AssisTANCE oN LABoR suppLyVoL. 102 No. 1
C. Effects of a Voucher offer by Time since offer
Examining how voucher impacts vary with time since offer can inform our under-standing of the mechanisms underlying the impacts. For example, if the labor sup-ply effects were driven by the disruption that vouchers impose on families (e.g., the time required to find a suitable apartment, actually move, and then adjust to the transition), then we would expect any negative labor supply effects to dissipate over time. On the other hand, we might expect the impacts from income and substitution effects to increase over time, if it takes families some time to adjust their employ-ment situations to the new incentives that they face.
To examine the time path of voucher effects, we estimate equation (4) using a series of indicators for the year relative to voucher offer. Figure 2 shows the ITT estimates by time since offer, along with the 95 percent confidence band, for employment, earn-ings, and public assistance receipt. For all of the outcomes, we see that the impacts get larger in absolute value with time since the voucher offer, suggesting our results are not simply due to the disruption of moving. If we limit our sample to the set of families who are on TANF at baseline, we find a similar pattern (see online Appendix Figure 4). In that sense our findings would initially appear to be at odds with the Welfare to Work (WtW) voucher experiment, which found significant reductions in work the first year after random assignment, but not in years two and three (Gubits et al. 2006). Yet our results for TANF families are not inconsistent with the WtW estimate; they are simply more precisely estimated. Our analytic sample includes 25,317 families on public assistance at baseline (Table 4), about three times the sample in the WtW study (N = 8,664). The 95 percent confidence interval around the estimated voucher effects on working at the end of the WtW study period ranges from −5 to +5 percentage points, which spans our estimates for TANF families.33
Our results also provide evidence of some small anticipation effects on employ-ment. In Figure 2 panel A, for example, we see that treatment families seem to be slightly more likely to work (relative to control families) in the years after the wait list lottery but prior to their actual voucher offer. In results not shown here, the coefficient on the single preoffer indicator in equation (1) is 0.006 with a standard error of 0.003, suggesting the voucher offer increases employment by roughly six-tenths of a per-centage point, or 1 percent of the control mean. Note that this statistically significant coefficient is not an indication of model misspecification or improper randomization, since it comes from comparing post-lottery person-quarter observations for treatment families while they are waiting for a voucher to the outcomes of control families in the same calendar quarter. This reflects a real behavioral response and is consistent with families wishing to substitute labor supply from periods when real wages are rela-tively low to those where real wages are relatively high. There is less clear evidence of any anticipation effects on social program participation (Figure 2 panel C).
33 In Table 4 we show that the estimated ITT and IV effects on labor force participation over the entire post–voucher offer period equal −0.011 (0.005) and −0.025 (0.010), respectively. In online Appendix Figure 4, we show the ITT effect the first three years after voucher offer is on the order of around 1 percentage point and grows thereafter. Exhibit 4.8 of Mills et al. (2006) does not present estimates of the voucher effect on quarterly labor force participation rates that pool together the entire postrandomization period. But the ITT and TOT estimates for half-year 6 in their study (the last observation for their full sample) equal 0.004 (0.009) and 0.000 (0.025), respectively. In addition the Mills et al. report uses a different method for calculating TOT estimates compared to the IV method we use in this paper.

294 ThE AMERiCAN ECoNoMiC REViEW FEBRuARy 2012
D. Effects of a Voucher offer on Residential stability and Neighborhood Environment
The results thus far indicate that the in-kind subsidy provided by housing vouch-ers reduces labor supply to a modest degree. This effect is consistent across a variety of subgroups, is robust to several alternative specifications, and does not appear to be due to a short-term disruption effect. In Table 5, we explore some of the potential mechanisms underlying these impacts using the 10 percent random subsample for whom we collected address histories.34
We first consider impacts on residential stability. While it is likely that a housing voucher will induce higher mobility in the short run as families lease new apartments, some observers have hypothesized that rent subsidies will actually decrease residential mobility in the longer run, which may improve labor market outcomes. In row 1 of Table 5, we see that the use of a housing voucher did not have any significant impact
34 In results not shown, we replicate the basic findings shown above on labor supply and social program partici-pation using data just from this 10 percent subsample, which gives us more confidence that we can generalize the address history results found here to our full sample.
Panel A. HHH employed Panel B. HHH real earnings (2007 dollars)
Panel C. HHH receiving any public assistance Panel D. HHH conditional earnings
Years relative to offer−6 −5 −4 −3 −2 −1 0 1 2 3 4 5 6 7 8
Years relative to offer−6 −5 −4 −3 −2 −1 0 1 2 3 4 5 6 7 8
Years relative to offer−6 −5 −4 −3 −2 −1 0 1 2 3 4 5 6 7 8
Years relative to offer−6 −5 −4 −3 −2 −1 0 1 2 3 4 5 6 7 8
HH
H e
mpl
oyed
HH
H r
eal e
arni
ngs
(200
7$)
HH
H r
eceo
ved
TA
NF
HH
H r
eal e
arni
ngs
(200
7$)
−0.12 −800
−600
−400
−200
0
200
400
−0.09
0.09
−0.06
0.06
−0.03
0.03
0
−0.05 −800
−600
−400
−200
0
200
4000.2
0.15
0.1
0.05
0
Figure 2. ITT Effect of Vouchers over Time on Employment and Receipt of Public Assistance
Notes: Dotted lines represent the 95 percent confidence interval. Solid lines represent the point estimate. Estimates come from equation (4) in the text. Year zero is defined as the first full year after an offer, measured at the quarter level and including the quarter of the offer. Sample includes all working-age, able-bodied CHAC applicants who were living in private housing at baseline.

295JACoB ANd LudWig: ThE EFFECTs oF housiNg AssisTANCE oN LABoR suppLyVoL. 102 No. 1
on the number of different addresses at which the household resided. Figure 3, which shows the ITT effects on residential mobility by time relative to offer, makes clear that voucher offers change the timing of moves: treatment families who expect to receive a voucher are less likely to move than controls until they are offered a voucher and then become more likely to move. We assume treatment group families are postponing moves so that they can move into better housing units or areas with a voucher.
The remainder of the results in Table 5 suggests that vouchers have little, if any, impact on a household’s neighborhood environment, another housing-specific mechanism that has been hypothesized to promote work. Each row in Table 5 pres-ents results for a separate neighborhood characteristic, including tract poverty rate, time spent in “low poverty” tracts (poverty rate below 20 percent), tract share black, two measures of neighborhood social functioning—collective efficacy, and social capital, taken from the community survey of the Project on Human Development in Chicago Neighborhoods35—and property and violent crime rates from the Chicago Police Department measured at the beat level. For each neighborhood measure, the estimated voucher effects are small relative to both the standard errors and CCMs. We find little evidence that the neighborhood environments of voucher users are improving relative to controls with time since the voucher offer (Figure 3).
E. implied Wage and income Elasticities
To determine what income and substitution elasticities are consistent with our data, we write down a simple labor supply model and calibrate it using data from our treatment and control groups (see online Appendix E for additional details regarding the calculations). Consider an individual with a CES utility function as in (5), where c is consumption, h is weekly hours worked, and T is total available time, so that T − h reflects weekly hours of leisure.
(5) u (c, h) = [(1 − α) c −μ + α (T − h ) −μ ] − 1 _ μ .
Individuals choose hours to maximize utility given the constraint:
(6) c = wh + V,
where w is the posttax wage and V is nonwage (virtual) income. This setup yields the following labor supply equation (assuming α > 0, μ > −1):
(7) h = Tk w e − V _ w + k w e
k = ( 1 − α _ α ) e , e = 1 _ 1 + μ .
35 These variables come from the 1995 PHDCN community survey, which surveys a random sample of residents within each of the city’s “neighborhood clusters,” which the PHDCN formed on the basis of grouping together census tracts. We focus on collective efficacy (willingness of neighbors to work together to promote shared norms) and social disorder, given claims in previous research for their importance in explaining a variety of behavioral outcomes, including crime (Sampson, Raudenbush, and Earls 1997). Unfortunately, the data from the 2002 PHDCN community survey are not yet publicly available.

296 ThE AMERiCAN ECoNoMiC REViEW FEBRuARy 2012
We calibrate equation (7) using the separate treatment and control group means of h, V, and w in our data, which gives us two equations and two unknowns and implies parameter values equal to μ = 0.7285 and (1 − α)/α = 54.945.
The derivatives of labor supply with respect to wages and income equal (Stern 1976)36:
(8) ∂h _ ∂V = − 1 _
w + k w e = − (T − h) _ V + wT
∂h _ ∂ w = (V − μwh) (T − h) __ w(μ + 1) (V + wT )
.
We then use the Slutsky equation to find the compensated wage effect
(9) ∂ h comp _ ∂ w = ∂h _ ∂ w − h ∂h _ ∂V .
Our simple calibration exercise suggests an income elasticity of −0.09 and a compensated wage elasticity of 0.15. One possible point of comparison is esti-mates for labor supply responses by single female heads in the Negative Income
36 Note that k w e = (wh + V)/(T − h).
Table 5—Effects of a Voucher Offer on Residential Stability and Neighborhood Environment
CM ITT IV CCMNumber of households
Number of different residential 2.668 0.036 0.119 3.181 4,187 addresses (0.047) (0.117)Poverty rate 0.257 −0.004 −0.009 0.275 4,138
(0.004) (0.010)Poverty rate below 20 percent 0.395 0.007 0.015 0.340 4,138
(0.015) (0.035)Fraction black 0.778 0.003 0.007 0.809 4,138
(0.008) (0.018)Collective efficacy score 3.778 −0.000 −0.000 3.771 3,860
(0.007) (0.015)Social capital score 3.501 −0.005 −0.012 3.509 3,860
(0.005) (0.011)Property crime arrest rate 74.774 −0.385 −0.920 71.251 3,862
(0.856) (1.941)Violent crime arrest rate 16.701 −0.026 −0.047 15.628 3,862
(0.235) (0.539)
Notes: The unit of observation is person-year-quarter. The sample includes all working-age, able-bodied CHAC applicants who were living in private housing at baseline. CM = control mean. ITT = intent-to-treat. IV = instrumental variables. CCM = control complier mean. See text for discussion of these estimates. Robust standard errors clustered at household level.
*** Significant at the 1 percent level. ** Significant at the 5 percent level. * Significant at the 10 percent level.

297JACoB ANd LudWig: ThE EFFECTs oF housiNg AssisTANCE oN LABoR suppLyVoL. 102 No. 1
Tax (NIT) experiments, although this is something of an apples-and-oranges comparison because the samples and time periods examined are different and the NIT experiments were of limited duration, while the families receiving a voucher in our study sample should be eligible to keep them for a very long time. With these caveats in mind, our estimates are generally comparable to the income and
Years relative to offer
−6 −5 −4 −3 −2 −1 0 1 2 3 4 5 6 7 8
Years relative to offer
−6 −5 −4 −3 −2 −1 0 1 2 3 4 5 6 7 8
Years relative to offer
−6 −5 −4 −3 −2 −1 0 1 2 3 4 5 6 7 8
Years relative to offer
−6 −5 −4 −3 −2 −1 0 1 2 3 4 5 6 7 8
Years relative to offer
−6 −5 −4 −3 −2 −1 0 1 2 3 4 5 6 7 8
Years relative to offer
−6 −5 −4 −3 −2 −1 0 1 2 3 4 5 6 7 8
Num
ber
of a
ddre
sses
Pov
erty
rat
e
Col
lect
ive
effic
acy
Soc
ial c
apita
l
Pro
pert
y cr
ime
arre
st r
ate
Vio
lent
crim
e ar
rest
rat
e
−0.75
−0.5
0.75
−0.25
0.5
0.25
0
−0.05
−0.03
0.05
−0.01
0.03
0.01
−10
15
−5
10
5
0
−6
−4
4
6
−2
2
0
−0.08
−0.06
0.02
−0.04
0
−0.02
−0.15
−0.1
0.05
−0.05
0
Panel A. Number of different residential addresses Panel B. Neighborhood poverty rate
Panel C. Collective efficacy score Panel D. Social capital score
Panel E. Property crime arrest rate Panel F. Violent crime arrest rate
Figure 3. ITT Effect of Vouchers over Time on Residential Stability and Neighborhood Environment
Notes: Dotted lines represent the 95 percent confidence interval. Solid lines represent the point estimate. Estimates come from equation (4) in the text. Year zero is defined as the first full year after an offer, measured at the quarter level and including the quarter of the offer. Sample includes all working-age, able-bodied CHAC applicants who were living in private housing at baseline.

298 ThE AMERiCAN ECoNoMiC REViEW FEBRuARy 2012
elasticity estimates of −0.16 and 0.13 for single female heads in the NIT experi-ments (Robins 1985).
F. The Relationship between Voucher Effects and the Economy
In Table 4, we presented some evidence indicating that the voucher effects on labor supply may be largest for those CHAC applicants who were offered vouchers relatively earlier during the post-lottery period. In Figure 2, we saw that voucher effects increased with time since offer. While this treatment heterogeneity could be caused by a variety of factors, Herbst (2008) argues that the impact of social policy may vary as a function of the macroeconomy. As noted above, there were indeed large changes in the local Chicago economy over our sample period.
To explore this issue further, we estimate a model similar to equation (4) but that includes a full set of interactions between the quarter-relative-to-offer and the calendar-quarter in which the household was offered a voucher. In total, this model yields 405 separate postoffer ITT effects measured at the level of offer quarter × calendar quarter. We then estimate a series of models with these ITTs as the depen-dent variable. As predictors, we include measures of the unemployment rate both at the time the household was offered a housing voucher as well as at the time in which the outcome was measured, the difference between the treatment and control groups in voucher utilization rates, and the number of years since families in the treatment group had been offered vouchers in each calendar-quarter.37 To improve efficiency, we estimate these via GLS using the covariance matrix from the first-step regression as a weighting matrix in the second-step regression. Because we estimate clustered standard errors at the household level in the first-step, and all households are by construction nested in a particular treatment offer cohort (or in the control group), the resulting covariance matrix of ITT effects captures the serial correlation within offer cohorts over time that one would expect, with larger standard errors on the offer cohort level predictors in our second-step model.38
The top and bottom panels of Table 6 consider employment and social program participation rates, respectively. It is important to note that this analysis does not exploit any experimental variation and thus should be interpreted as a simple associ-ation. It is possible that other unobserved factors correlated with the local economic conditions could be driving the results presented here.
While our estimates are not very precise, several interesting patterns emerge. In general, it appears that a weak economy in the current period exacerbates the work disincentive effect associated with using a housing voucher. For example, the coef-ficient of 0.002 in the bottom panel suggests that a 1 percentage point increase in the current unemployment rate is associated with a 0.002 increase in the ITT effect on public assistance receipt. One possible explanation is that interaction with CHAC may have increased families’ awareness and familiarity with other social service options, so in bad economic times they were better able to access services.
37 Note that the rental market vacancy rate and the unemployment rate are highly correlated in Chicago during this period, so we cannot distinguish effects of housing versus labor market conditions.
38 The bottom row of Table 6 also provides a test of the overidentifying restrictions in this model. The fact that the p-value for every specification is greater than 0.05 provides some evidence that the model is correctly specified.

299JACoB ANd LudWig: ThE EFFECTs oF housiNg AssisTANCE oN LABoR suppLyVoL. 102 No. 1
In contrast, it appears that weak economic conditions at the time of voucher offer might mitigate the work disincentive effects associated with a voucher offer. For example, the coefficient on the offer year unemployment rate of 0.006 in the top panel suggests a 1 percentage point increase in the unemployment rate would lead to a 0.006 increase in the ITT effect (relative to an average ITT of −0.017). It is possible that a weak economy reduces the ability of voucher recipients to change jobs or adjust hours at their current job. In the same way that the economic conditions that exist when one enters the labor market can influence earnings for many years (Oreopoulos, von Wachter, and Heisz 2006), the initial conditions at the time of voucher offer may exert an enduring influence on the labor supply decisions of recipients.
We had also hypothesized that differences in labor market or housing conditions at the time families were offered vouchers could help explain differences in voucher
Table 6—The Effect of Economic Factors on the Magnitude of Voucher Impacts
(1) (2) (3) (4) (5) (6)
panel A. dependent variable = iTT effect of voucher offer on employment
Difference in treatment cohort and control −0.038** −0.038** −0.037** fraction leased up (0.011) (0.011) (0.012)Years since offer −0.002* −0.001 −0.000
(0.001) (0.001) (0.001)Contemporaneous unemployment rate −0.002 −0.001 −0.002 −0.001
(0.001) (0.001) (0.001) (0.001)Unemployment rate in year surrounding 0.006 0.007* 0.005 0.007* offer quarter (0.003) (0.003) (0.004) (0.004)Mean of the dependent variable −0.017 −0.017 −0.017 −0.017 −0.017 −0.017
Number of observations 405 405 405 405 405 405p-value from the test of the overidentifying restrictions
0.1067 0.0630 0.0627 0.1169 0.0669 0.1103
panel B. dependent variable = iTT effect of voucher offer on any public assistance
Difference in treatment cohort and control 0.041** 0.039** 0.022** fraction leased up (0.009) (0.009) (0.010)Years since offer 0.006** 0.006** 0.005**
(0.001) (0.001) (0.001)Contemporaneous unemployment rate 0.002** 0.002* 0.002** 0.002*
(0.001) (0.001) (0.001) (0.001)Unemployment rate in year surrounding −0.005 −0.006* −0.001 −0.002 offer quarter (0.003) (0.003) (0.003) (0.003)Mean of the dependent variable 0.029 0.029 0.029 0.029 0.029 0.029
Number of observations 405 405 405 405 405 405p-value from the test of the overidentifying restrictions
0.2447 0.4420 0.1292 0.2807 0.4820 0.5332
Notes: The estimates in Table 6 are GLS estimates, sometimes referred to as Optimal Minimum Distance (OMD) estimation (see Chamberlain 1982). The dependent variable, the intent-to-treat (ITT) effect of a voucher offer on an outcome, is estimated in a first-stage regression of an indicator for employed-in-the-current-quarter on indicators for each quarter-relative-to-offer interacted with indicators for the quarter-year a voucher was offered, household- and tract-level control variables, and clustered at the household level. The estimates of the 405 treatment indicator coefficients and the associated variance-covariance matrix are used to implement second-stage GLS regressions with the vector of 405 ITT coefficients as the outcome. The reported p-value is from the efficient test of the restric-tions of the second-stage model against the alternative of the fully interacted first-stage model. The sample includes all working-age, able-bodied CHAC applicants who were living in private housing at baseline.
** Significant at the 5 percent level. * Significant at the 10 percent level.

300 ThE AMERiCAN ECoNoMiC REViEW FEBRuARy 2012
effects across voucher offer cohorts (Table 4). In results not shown, however, we show that proxies for the macroeconomic conditions cannot explain much of the difference across voucher offer cohorts.
VII. Discussion
The random assignment of voucher applicants in Chicago during the late 1990s provides us with a unique opportunity to identify the causal effects of a large, under-studied social program (housing vouchers) on labor supply and self-sufficiency. Existing theoretical work yields ambiguous predictions about the sign, much less the magnitude, of any relationship. In contrast to the well-known Moving to Opportunity (MTO) experiment, which offered vouchers to families in public hous-ing at baseline, we focus in our study on people who were living in private-market housing at the time they applied for a voucher, the group that accounts for the vast majority of all voucher applicants in Chicago and other large cities. The treatment we examine, therefore, consists of an increase in both income and marginal tax rates, but not necessarily a change in neighborhood environment. Our estimates cap-ture the effect of expanding the set of people receiving housing assistance by issuing more vouchers and could potentially shed light on labor supply responses to in-kind means-tested transfers more generally.
Our estimates allow us to soundly reject the hypothesis that housing voucher receipt is work enhancing, or even work neutral. We estimate that voucher receipt reduces quarterly employment rates by around 3.6 percentage points (about 6 percent of the control complier mean), reduces earnings by around $329 per quarter (10 per-cent of the CCM), increases TANF receipt rates by around 1.6 percentage points (15 percent of the CCM), and increases receipt of any social program benefits by 6.7 percentage points (12 percent of the CCM). We also find that the treatment group increases labor supply slightly during the periods before they are offered a voucher, consistent with the prediction of the life cycle labor supply model that people may shift work effort towards those periods with relatively higher wage rates (although this effect is quite small—around 0.6 percentage points, or about 1 percent of the control mean).
How do we reconcile our results, which suggest persistent and even growing work disincentive effects from housing vouchers, with those from the Welfare to Work (WtW) voucher experiment, which found short-term negative effects on labor supply that seemed to dissipate after the first year following random assignment? We believe the two sets of findings are not as contradictory as they would initially appear. As noted above, the WtW experiment limited eligibility mostly to families who are on welfare. Our own data, which includes a more general sample of low-income families, shows that the estimated effect of utilizing a voucher on labor force participation may be smaller for families on TANF at baseline than for other fami-lies. Indeed our IV estimates for TANF families are not inconsistent with the WtW estimates; ours are just more precisely estimated given our much larger sample sizes.
While our results have some external validity advantages over the WtW study by including families who were not on welfare, one might worry that Chicago is not exactly like the rest of America. As noted above, while our Chicago sample overrep-resents central city residents and blacks, the characteristics of our sample otherwise seem fairly representative of working-age, able-bodied voucher holders nationwide.

301JACoB ANd LudWig: ThE EFFECTs oF housiNg AssisTANCE oN LABoR suppLyVoL. 102 No. 1
We find little empirical support for two of the main work-enhancing mechanisms that have been hypothesized for housing vouchers, namely significant improvements in neighborhoods or residential stability. Voucher receipt does seem to change the timing of moves, as families on the voucher program wait list seem to defer moving until they are offered a voucher, but does not have much effect on the total number of moves. Moreover, vouchers appear to have no significant impact on a family’s neighborhood environment.
Depending on how important the voucher program’s restrictions on housing con-sumption are for labor supply, our findings could potentially also be relevant for understanding labor supply responses to other social programs as well. Since most CHAC voucher applicants have baseline incomes far below the phase-out range, and so will remain income-eligible for quite some time, our estimates presumably capture how people respond to perceived permanent changes in their budget con-straints. A simple calibration exercise assuming a CES utility function suggests that our reduced-form estimates are consistent with an income elasticity of −0.09 and a compensated wage elasticity of 0.15.
An alternative way to think about the magnitude of our estimates is within the context of what Okun (1975) called the “leaky bucket” that society uses to transfer resources to the poor. How big is the leak? Setting aside for the moment program administration costs and deadweight losses associated with raising tax revenues, there is a difference in the voucher cost to the government ($8,400) and the vouch-er’s equivalent variation ($6,860) that is the inevitable consequence of the voucher program’s goal of promoting housing consumption. But vouchers also have the unintended consequence of reducing annual earnings by around $1,316 among pro-gram participants, around 19 percent of the value of the subsidy to voucher recipi-ents. Using the standard for judging the size of work disincentive effects suggested by Blank (1997), eliminating the housing voucher program altogether would sub-stantially increase the degree of material deprivation among poor families despite the fact that they would work and earn more.
In any case, our results clearly indicate that housing vouchers reduce labor supply to some degree. This finding is relevant to policy debates about the optimal design of housing programs that date back to disagreements in the 1930s about the merits of income-based rents (Hunt 2009). A recent HUD white paper on the housing voucher program notes that when given discretion, local housing agencies seem eager to experiment with different methods of relating tenant incomes to their rent pay-ments, including flat rent systems, stepped rents, or expanding the range of income exclusions and deductions used to calculate adjusted income (HUD 2004). Olsen (2003, 2008) proposes to make housing an entitlement and provide a smaller hous-ing subsidy to all eligible families, which could be modified to reduce the implicit tax rates associated with housing assistance and thus mitigate work disincentive effects facing voucher recipients. Evidence on the sign and magnitude of labor sup-ply responses to the existing housing voucher program is important for assessing these alternatives to current policies.
Our findings are also relevant to debates that go back at least to the 1960s about whether to provide assistance to families through a mix of cash transfer and in-kind benefit programs, or instead through a single negative income tax program (see, for example, Friedman 1962). There are several arguments in favor of in-kind transfers

302 ThE AMERiCAN ECoNoMiC REViEW FEBRuARy 2012
such as housing assistance, including the contention that better housing has positive externalities associated with greater human capital accumulation, and a normative argument for providing a base level of assistance to individuals that is not condi-tioned on work. Our estimates suggest that one downside of housing programs is that they lead to a reduction in work effort, in contrast to the Earned Income Tax Credit (EITC), which has been shown to increase labor force participation rates (Eissa and Hoynes 2005). In principle one could even modify the voucher subsidy formula to operate more like the EITC.
Complicated trade-offs arise in the decision about whether to use in-kind rather than cash subsidies to address housing problems, and how best to structure our exist-ing housing programs to accomplish their various goals. Our study provides new evidence that is relevant to assessing these trade-offs and deciding how to best allo-cate the $40 billion per year currently devoted to helping poor families meet their housing needs.
REFERENCES
Angrist, Joshua D., and Guido W. Imbens. 1995. “Two-Stage Least Squares Estimation of Average Causal Effects in Models with Variable Treatment Intensity.” Journal of the American statistical Association 90(430): 431–42.
Angrist, Joshua D., Guido W. Imbens, and Donald B. Rubin. 1996. “Identification of Causal Effects Using Instrumental Variables.” Journal of the American statistical Association 91(434): 444–55.
Bertrand, Marianne, Esther Duflo, and Sendhil Mullainathan. 2004. “How Much Should We Trust Differences-in-Differences Estimates?” Quarterly Journal of Economics 119(1): 249–75.
Blank, Rebecca M. 1997. it Takes a Nation: A New Agenda for Fighting poverty. New York: Russell Sage Foundation; Princeton: Princeton University Press.
Carlson, Deven, Robert Haveman, Thomas Kaplan, and Barbara Wolfe. 2008. “Long-Term Effects of Public Low-Income Housing Vouchers on Work, Earnings and Neighborhood Quality.” University of Wisconsin-Madison, Institute for Research on Poverty Discussion Paper 1338–08.
Chamberlain, Gary. 1982. “Multivariate Regression Models for Panel Data.” Journal of Econometrics 18(1): 5–46.
Chapin Hall at the University of Chicago. 2005. Illinois Longitudinal Public Assistance Research Database. Chicago, IL. (accessed May 19, 2006, restricted use).
Chicago Housing Authority Corporation, Inc. 1997. Application Files for July 1997 Housing Voucher Program. Chicago, IL. (accessed May 14, 2006, restricted use).
Chicago Housing Authority Corporation, Inc. 1997–2006. US Department of Housing and Urban Development Form HUD-50058 Family Reports. (accessed June 22, 2006, restricted use).
Currie, Janet, and Firouz Gahvari. 2008. “Transfers in Cash and In-Kind: Theory Meets the Data.” Journal of Economic Literature 46(2): 333–83.
Eissa, Nada, and Hilary Hoynes. 2005. “Behavioral Responses to Taxes: Lessons from the EITC and Labor Supply.” National Bureau of Economic Research Working Paper 11729.
Finkel, Meryl and Larry Buron. 2001. study on section 8 Voucher success Rates: Volume i: Quantita-tive study of success Rates in Metropolitan Areas. Cambridge, MA: Abt Associates.
Friedman, Milton. 1962. Capitalism and Freedom. Chicago: University of Chicago Press.Gahvari, Firouz. 1994. “In-Kind Transfers, Cash Grants and Labor Supply.” Journal of public Eco-
nomics 55(3): 495–504.Grotto, Jason, Laurie Cohen, and Sara Olkon. “Public Housing Limbo,” The Chicago Tribune, July 6,
2008.Gubits, Daniel B., Larry L. Orr, Gregory B. Mills, Michelle L. Wood, Bulbul Kaul, David A. Long,
and Judith D. Feins. 2006. The impact of housing Choice Vouchers on Employment, Earnings and Mean-Tested Benefits. Cambridge, MA: Abt Associates, draft report.
Herbst, Chris M. 2008. “Do Social Policy Reforms Have Different Impacts on Employment and Welfare Use as Economic Conditions Change?” Journal of policy Analysis and Management 27(4): 867–94.
Hotz, V. Joseph & John Karl Scholz. 2001. “Measuring Employment and Income for Low-Income Populations with Administrative and Survey Data.” In studies of Welfare populations: data Collec-tion and Research issues. Washington, DC: National Academy Press. 275–315.

303JACoB ANd LudWig: ThE EFFECTs oF housiNg AssisTANCE oN LABoR suppLyVoL. 102 No. 1
Hunt, D. Bradford. 2009. Blueprint for disaster: The unraveling of Chicago public housing. Chi-cago: University of Chicago Press.
Illinois Department of Employment Security. 1990–2005. Unemployment Insurance Records, E and Earnings. Illinois Department of Employment Security (IDES), Chicago, IL. (accessed October 29, 2006, restricted use).
Jacob, Brian A. 2004. “Public Housing, Housing Vouchers, and Student Achievement: Evidence from Public Housing Demolitions in Chicago.” American Economic Review 94(1): 233–58.
Jacob, Brian A. 2012. “The Effects of Housing Assistance on Labor Supply: Evidence from a Voucher Lottery: Dataset.” American Economic Review. http://dx.doi.org/10.1257/aer.102.1.272.
Katz, Lawrence F., Jeffrey R. Kling, and Jeffrey B. Liebman. 2001. “Moving to Opportunity in Boston: Early Results of a Randomized Mobility Experiment.” Quarterly Journal of Economics 116(2): 607–54.
Kling, Jeffrey R., Jeffrey B. Liebman, and Lawrence F. Katz. 2007. “Experimental Analysis of Neigh-borhood Effects.” Econometrica 75(1): 83–119.
Kornfeld, Robert, and Howard S. Bloom. 1999. “Measuring Program Impacts on Earnings and Employment: Do Unemployment Insurance Wage Reports from Employers Agree with Surveys of Individuals?” Journal of Labor Economics 17(1): 168–97.
Leonesio, Michael V. 1988. “In-Kind Transfers and Work Incentives.” Journal of Labor Economics 6(4): 515–29.
MaCurdy, Thomas E. 1981. “An Empirical Model of Labor Supply in a Life-Cycle Setting.” Journal of political Economy 89(6): 1059–85.
Mills, Gregory, Daniel Gubits, Larry Orr, David Long, Judie Feins, Bulbul Kaul, Michelle Wood, Amy Jones & Associates, Cloudburst Consulting, and the QED Group. 2006. The Effects of housing Vouchers on Welfare Families. Washington, DC: US Department of Housing and Urban Develop-ment, Office of Policy Development and Research.
Moffitt, Robert A. 2002. “Welfare Programs and Labor Supply.” In handbook of public Economics, vol. 4, edited by A. J. Auerbach and M. Feldstein, 2393–2430. Handbooks in Economics, vol. 4. Amsterdam: Elsevier Science, North-Holland.
Murray, Michael P. 1980. “A Reinterpretation of the Traditional Income-Leisure Model, with Applica-tion to In-Kind Subsidy Programs.” Journal of public Economics 14(1): 69–81.
National Opinion Research Center at the University of Chicago. 2005. Passive address tracking dataset for housing voucher applicants in Chicago. (accessed June 15, 2005, restricted use).
Newman, Sandra, C. Scott Holupka, and Joseph Harkness. 2009. “The Long-Term Effects of Hous-ing Assistance on Work and Welfare.” Journal of policy Analysis and Management 28(1): 81–101.
Okun, Arthur. 1975. Equality and Efficiency: The Big Tradeoff. Washington, DC: Brookings Institu-tion Press.
Olsen, Edgar O. 2003. “Housing Programs for Low-Income Households.” In Means-Tested Trans-fer programs in the united states, edited by R. A. Moffitt, 365–441. National Bureau of Economic Research Conference Report Series. Chicago: University of Chicago Press.
Olsen, Edgar O. 2008. “Getting More From the Budget for Low-Income Housing Assistance.” Brook-ings Institution Hamilton Project Discussion Paper 2008–13.
Olsen, Edgar O., Catherine A. Tyler, Jonathan W. King, and Paul E. Carrillo. 2005. “The Effects of Different Types of Housing Assistance on Earnings and Employment.” Cityscape: A Journal of pol-icy development and Research 8(2): 163–87.
Oreopoulos, Philip, Till von Wachter, and Andrew Heisz. 2006. “The Short- and Long-Term Career Effects of Graduating in a Recession: Hysteresis and Heterogeneity in the Market for College Grad-uates.” National Bureau of Economic Research Working Paper 12159.
Painter, Gary. 2001. “Low-Income Housing Assistance: Its Impacts on Labor Force and Housing Pro-gram Participation.” Journal of housing Research. 12(1): 1–26.
Reeder, William J. 1985. “The Benefits and Costs of the Section 8 Existing Housing Program.” Journal of public Economics 26(3): 349–77.
Rice, Douglas and Barbara Sard. 2006. “President’s 2007 Budget Renews Same Number of Housing Vouchers Funded in 2006.” Center on Budget and Policy Priorities.
Robins, Philip K. 1985. “A Comparison of the Labor Supply Findings from the Four Negative Income Tax Experiments.” Journal of human Resources 20(4): 567–82.
Rubinowitz, Leonard S., and James E. Rosenbaum. 2000. Crossing the Class and Color Lines: From public housing to White suburbia. With Shirley Dvorin, Marilynn Kulieke, Alicia McCareins, and Susan Popkin, and with a foreword by Alex Kotlowitz. Chicago: University of Chicago Press.
Sampson, Robert J., Stephen W. Raudenbush, and Felton Earls. 1997. “Neighborhoods and Violent Crime: A Multilevel Study of Collective Efficacy.” science 277(5328): 918–924.

304 ThE AMERiCAN ECoNoMiC REViEW FEBRuARy 2012
Schochet, Peter Z., John Burghardt, and Sheena McConnell. 2008. “Does Job Corps Work? Impact Findings from the National Job Corps Study.” American Economic Review 98(5): 1864–86.
Schone, Barbara Steinberg. 1992. “Do Means Tested Transfers Reduce Labor Supply?” Economics Letters 40(3): 353–57.
Shroder, Mark. 2002. “Does Housing Assistance Perversely Affect Self-Sufficiency? A Review Essay.” Journal of housing Economics. 11(4): 381–417.
Sinai, Todd, and Joel Waldfogel. 2005. “Do Low-Income Housing Subsidies Increase the Occupied Housing Stock?” Journal of public Economics 89(11–12): 2137–64.
Stern, N. H. 1976. “On the Specification of Models of Optimum Income Taxation.” Journal of public Economics 6(1–2): 123–62.
Struyk, Raymond J. and Marc Bendick, eds. 1981. housing Vouchers for the poor: Lessons from a National Experiment. Washington, DC: Urban Institute Press.
Susin, Scott. 2005. “Longitudinal Outcomes of Subsidized Housing Recipients in Matched Survey and Administrative Data.” Cityscape: A Journal of policy development and Research 8(2): 189–218.
US Department of Housing and Urban Development. 2004. The Flexible Voucher program: Why a New Approach to housing subsidy is Needed. Washington, DC. http://www.hud.gov/offices/pih/programs/hcv/fvp/wponfvp.pdf. (accessed August 25, 2008).
US House of Representatives, Ways and Means Committee. 2008. Background Material and data on the programs within the Jurisdiction of the Committee on Ways and Means (green Book). Washing-ton, DC. http://democrats.waysandmeans.house.gov/Singlepages.aspx?NewsID=10490 (accessed November 30, 2011).
Yelowitz, Aaron S. 2001. “Public Housing and Labor Supply.” Unpublished.