the effects of excitation waveforms and shaker moving … · one electrodynamic shaker with a force...
TRANSCRIPT

NASA Technical Memorandum 100446
The Effects of Excitation Waveforms and - Shaker Moving Mass on the Measured Modal
Characteristics of a 2- by 5-Foot Aluminum Plate
~ ~~~
David F. Voracek and Adolfo M. Morales Ames Research Center, Dryden Flight Research Facility, Edwards, California
1988
.
NASA National Aeronautics and Space Administration Ames Research Center Dryden FI ig ht Research Faci Ii ty Ed wards, California 93523 - 5000
https://ntrs.nasa.gov/search.jsp?R=19890005738 2018-07-01T12:47:46+00:00Z

CONTENTS SUMMARY 1
NOMENCLATURE 1
INTRODUCTION 1
TEST CONFIGURATION AND EQUIPMENT 2 Excitation Comparison . . . . . . . . . . . . . . . . . . . . . . . . . . . . . . . . . . . . . . . . . . . 2
Impact Test Equipment . . . . . . . . . . . . . . . . . . . . . . . . . . . . . . . . . . . . . . . . 2 Sine-Dwell and Sine-Sweep Test Equipment . . . . . . . . . . . . . . . . . . . . . . . . . . . . .
Impulsive-Sine Test Equipment . . . . . . . . . . . . . . . . . . . . . . . . . . . . . . . . . . . 3
2 Random Test Equipment . . . . . . . . . . . . . . . . . . . . . . . . . . . . . . . . . . . . . . . 3
Shaker Moving Mass . . . . . . . . . . . . . . . . . . . . . . . . . . . . . . . . . . . . . . . . . . . . 3
TEST PROCEDURES 3 Excitation Comparison . . . . . . . . . . . . . . . . . . . . . . . . . . . . . . . . . . . . . . . . . . . 3 Shaker Moving Mass . . . . . . . . . . . . . . . . . . . . . . . . . . . . . . . . . . . . . . . . . . . . 4
Ground Vibration Test . . . . . . . . . . . . . . . . . . . . . . . . . . . . . . . . . . . . . . . . 4 Finite-Element Analysis . . . . . . . . . . . . . . . . . . . . . . . . . . . . . . . . . . . . . . . 4
RESULTS AND DISCUSSION 4 Excitation Comparison . . . . . . . . . . . . . . . . . . . . . . . . . . . . . . . . . . . . . . . . . . . 4 Shaker Moving Mass Effects . . . . . . . . . . . . . . . . . . . . . . . . . . . . . . . . . . . . . . . . 5
CONCLUDING REMARKS 6
REFERENCES 7
TABLES 7
FIGURES 8
i i i

SUMMARY
Ground vibration tests were conducted to compare and to investigate the effects of five excitation waveforms and the shaker moving mass (equipment and armature used to attach the shaker to the structure) on the experimental modal characteristics of a 2- by 5-ft aluminum plate using fast Fourier transform techniques. The five types of excitation waveforms studied were sine dwell, random, impact, sine sweep, and impulsive sine. The results showed that the experimental modal frequencies for all types of excitation were within 3 percent, while the modal damping data exhibited greater scatter. The sets of mode shapes obtained by the five types of excitation were consistent. The results of the shaker moving mass investigation on the 2- by 5-fi aluminum plate showed that modal frequency decreases and modal damping remains relatively constant with an increase in shaker moving mass. The generalized mass of the structure appears to decrease with an increase in shaker moving mass. In addition, it was seen that having a shaker near a node line can reduce some of the effects of the added shaker moving mass on the frequencies and damping.
i
4
NOMENCLATURE
FRF GM GVT
g
k
M MAC
m
PWS 0
w
frequency response function
generalized mass
ground vibration test
gravity constant
stiffness constant
mass matrix
modal assurance criterion
mass
polynomial waveform synthesizer
displacement matrix
frequency
INTRODUCTION
-a Ground vibration tests (GVT) are conducted to identify frequency, damping, and mode shapes of a test structure,
Center (Ames-Dryden), ground vibration testing plays an important role in flight test. Experimental modal data from
structural instabilities, assessing the significance of modifications to research vehicles and helping to resolve in-flight data anomalies (Kehoe, 1987). The experimental modal characteristics of a structure can be affected by excitation technique (Olsen, 1984) and shaker moving mass (Olsen, 1986). To gain a better insight into the effects of these variables, two GVT investigations were conducted on a 2- by 5 4 aluminum test plate.
The first investigation studied the effects of five types of excitation methods on the experimental modal charac- teristics of the test structure. The five types of excitation investigated were impact, sine dwell, random, sine sweep, and impulsive sine. The first four have been used at Ames-Dryden for previous tests, while impulsive sine has not. Impact excitation is used primarily for small structures, such as a component part of an aircraft (Kehoe, 1987). Sine
5J such as a complete aircraft or aircraft components. At the Dryden Flight Research Facility of NASA Ames Research
b these tests are used to correlate and verify the modal test data. Finite-element models are used to predict potential
I

Q
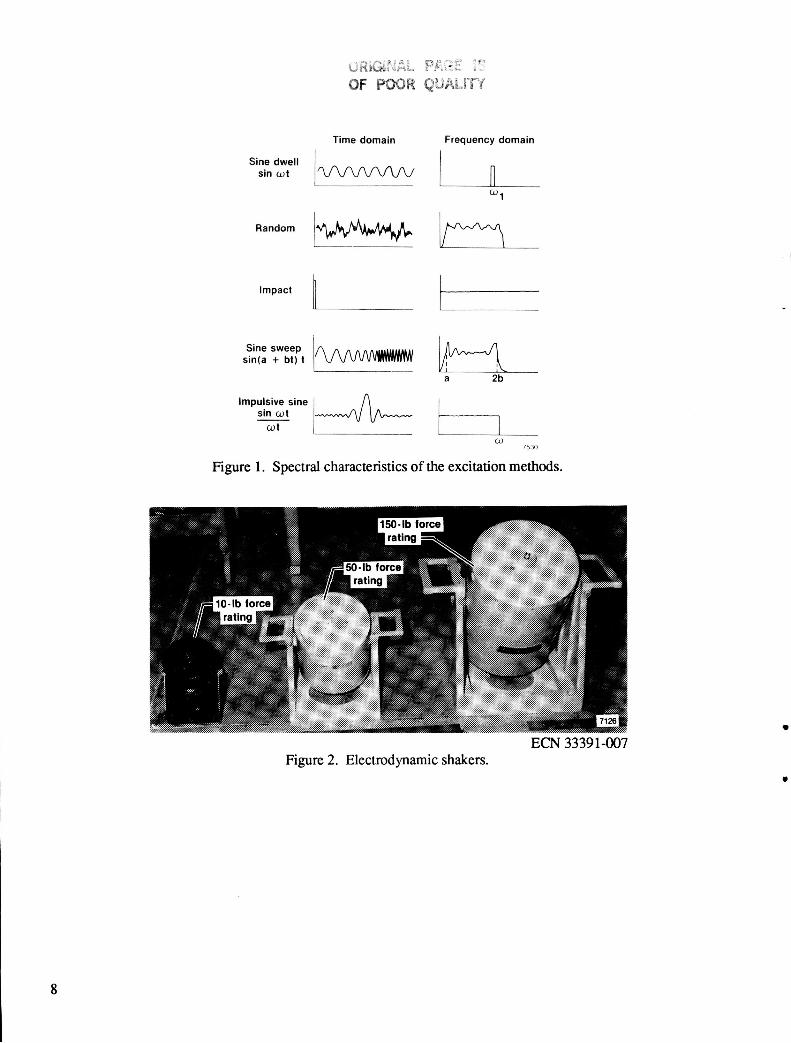
dwell, a constant frequency sine wave; random, a varying amplitude and broadband frequency function; sine sweep, a varying frequency sine wave; and impulsive sine, a function of the form sin( 5 ) /= (Houbolt, 1974) are waveforms that are injected into an electrodynamic shaker to excite the structural modes. The spectral characteristics of these waveforms are shown in figure 1.
The second GVT was designed to investigate the effects of shaker moving mass, which consists of lhc shakcr armature and connecting hardware, on the experimental modal characteristics of the aluminum plate. Three shakcrs with moving masses of 0.789, 1.357, and 2.91 lb (fig. 2) were used for the investigation. This GVT used Ihc sinc- dwell technique to excite the structural modes. A finite-element analysis was done to compare the analytical and experimental changes in the modal characteristics of the structure caused by the additional mass of the shaker. The characteristics investigated were modal frequency, damping, and the generalized mass of the structure.
TEST CONFIGURATION AND EQUIPMENT
Excitation Comparison
The ground vibration tests were performed using a 2- by 5-ft aluminum plate as the test structure. The plate was suspended by two elastic cords (fig. 3) to simulate a free-free structure.
A minicomputer system (fig. 4) was used to analyze the plate's response for each type of excitation by fitting a multiple degree-of-freedom curve to a selected frequency response function (FRF) that exhibited a good response for the structural modes of interest. The system is capable of acquiring, filtering, displaying, and recording seven channels of accelerometer response data and one channel of force data. For the tests in this report, two accelerometers were used. Each accelerometer weighed 0.32 oz and had a sensitivity of 10 mV/g.
One electrodynamic shaker with a force rating of 50 lbf and a force transducer with a battery-operated signal conditioning amplifier were used with each excitation method except impact. The shaker was attached to the plate through a telescoping thrust rod and a mechanical fuse. The fuse was attached to a locking swivel assembly fastened to the plate by a threaded stud. One shaker and its attachment to the plate is shown in figure 5. The overall GVT configuration is shown in figure 6. The equipment that was unique to each type of excitation method is described in the following sections.
I Impact Test Equipment
The impact test equipment consisted of an instrumented hammer instead of a shaker to excite the aluminum plate. The hammer can be equipped with soft or hard heads to excite low and high frequencies, respectively. A soft head was used for this test. The hammer was also equipped with a force transducer to measure the impact force time history. This signal was routed through a battery-powered signal conditioning amplifier. The hammer and amplifier are shown in figure 7.
Sine-Dwell and Sine-Sweep Test Equipment
The GVT equipment is housed in two portable consoles (fig. 8). The system is capable of providing a constant frequency-sine and sine-sweep excitation. A patch panel is used to route signals to several common display and recording devices, such as a stripchart and oscilloscope. The sine-dwell method used a coincident-quadrature (co- quad) analyzer for tuning modes. A logarithmic sweep rate of 0.1 decade/sec was used for the sine-sweep excitation method. The data was then acquired and analyzed on the minicomputer system. "bo accelerometers were used for these tests.

Random Test Equipment
The random test equipment consisted of tape recorder and electrodynamic shaker. A recorded random time history signal was played back through the electrodynamic shaker to excite the plate. Two accelerometers were used to obtain response data from the plate.
Impulsive-Sine Test Equipment
A polynomial waveform synthesizer (PWS) (fig. 9) was used to generate the signal to drive the electrodynamic shaker. An equation of the form (sin z)/% was programmed into the PWS with a frequency of 50 Hz. This signal was then sent to the electrodynamic shaker. Two accelerometers were used in the modal survey to measure plate response. These data were then acquired by the minicomputer system.
Shaker Moving Mass
The shaker moving mass study also used the 2- by 5-ft aluminum test as the test structure. The plate was
The same GVT equipment used in the sine-dwell and sine-sweep tests was used for this analysis.
Three shakers with force ratings of 10.50, and 150 lbf had a moving mass of 0.789, 1.357, and 2.910 lb, re- spectively. All shakers used a force transducer with a battery-operated signal conditioning amplifier. The shakers were attached to the plate through a telescoping thrust rod and a mechanical fuse. The fuse was attached to a locking swivel assembly fastened to the plate by a threaded stud. The same plate attachments were used for all three shakers.
suspended as in the excitation comparison shown in figure 3.
TEST PROCEDURES
Excitation Comparison
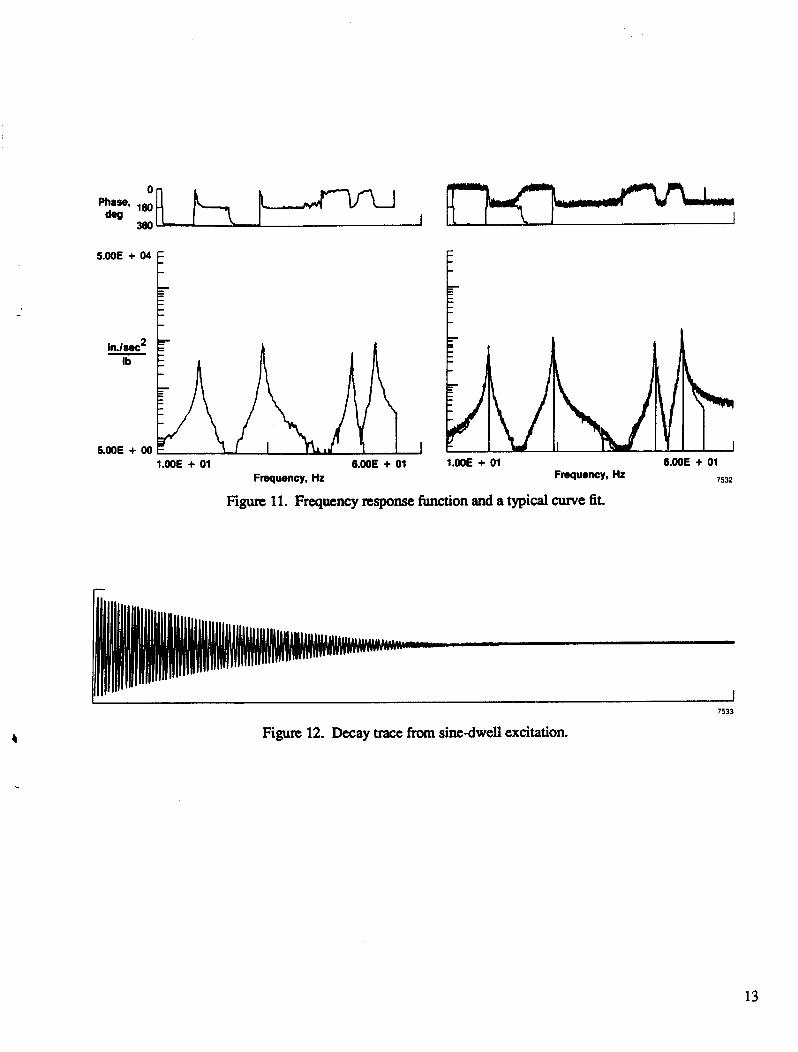
The plate was approximated by 55 grid points in the test procedure shown in figure 10. For all types of exci- tation, a modal survey of the plate was conducted. A modal survey is used to obtain response data by moving the accelerometers to a grid point and then recording data. This process of moving accelerometers and taking data is repeated until all points on the structure have been surveyed. When data acquisition was complete for each type of excitation except sine dwell, the frequency, damping, and mode shape were estimated for each mode by fitting a multiple degree-of-freedom curve to a selected frequency response h c t i o n (FRF) that exhibited a good response for the structural modes of interest (General Electric, 1983). A typical FRF and its curve fit is shown in figure 11. The estimated modal parameters were examined to determine if the curve fit was acceptable. It was necessary to examine several different FFW to obtain a good curve fit for all structural modes. After a good fit was obtained, the modal coefficients for each mode shape were calculated at all points using the amplitude and phase of the experimental response at the selected resonance frequency (General Electric, 1983). Animated mode shapes were then displayed to identify each mode.
The modes excited by the sine-dwell method were tuned by the use of the coincident-quadrature (coquad) analyzer. Each mode is tuned by minimizing the in-phase (coincident) component and maximizing the out-of-phase (quadrature) component of the signals. The purity of the modes was checked by cutting the power to the shaker system and observing the structural response decay for beats. The absence of beats in the decay traces indicates that mode was properly tuned. From the decay, damping was calculated using the log-decrement method. A decay trace is shown in figure 12. A modal survey of the plate was done after the mode was tuned. The amplitudes and phase of the measured response were then used to animate and to identify the mode.
3

Shaker Moving Mass
Ground Vibration Test
For each different moving mass, the corresponding shaker was attached to the plate. Then, using the sine-dwell excitation method, the first three modes were tuned, and thc frcqucncy was recordcd. Next, the power was cut to the shaker, and a stripchart trace (fig. 12) was used to calculate mode damping using the log-decrement method.
Finite-Element Analysis
An interactive finite-element program was used to analyze trends of modal frequencies and generalized mass of the plate due to the addition of the moving mass. The plate was modeled using rectangular elements for the structure with the plate’s mass being distributed in each element. Each of the three moving masses was analyzed, and one run was done with no mass attached. The moving mass was modeled by a lumped mass concentrated at the shaker attachment location. The material properties of aluminum for Young’s modulus, Poisson’s ratio, and density were used in the structural definition for the analysis. Since only trend data were required owing to the addition of the lumped mass, the model was not optimized to match the experimental frequencies and generalized masses. Damping data were not obtained and were assumed to be zero in the finite-element analysis. A more detailed explanation of the finite-element program used in the analysis can be found in Gupta, (1984).
The generalized mass (GM) of a structure is related to the mass of a structure by the following:
where @ is the displacement matrix and M is the mass matrix of the structure. The generalized mass was calculated for the 0.0.0.789, 1.357, and 2.910 lb moving mass in the finite-element analysis using the calculated mode shape and mass data. The generalized masses for the experimental data for the 0.0 and 1.357 lb moving mass were obtained by using the measured mode shapes from the excitation method comparison and the mass matrix that was calculated for the respective moving mass. For comparison, all mode shapes were normalized so that the largest displacement point for that mode had a value of 1 .OO.
RESULTS AND DISCUSSION
Excitation Comparison
The frequency response functions (FRF) were used to estimate modal parameters and to determine the effects of shaker moving mass. The FRF for impact, random, sine sweep, and impulsive sine are shown in figures 13-16. The FRF for the sine-dwell excitation would be a single peak or line at the natural frequency of the mode that was tuned. Because the mode shape data were determined in the time domain, the FRF was not calculated for sine dwell.
The FRF for the random, sine sweep, and impulsive sine show a coupling between the first and second response mode. This coupling is not seen in the impact excitation which does not use a shaker to excite the plate. The coupling therefore could be attributed to the effects of the shaker being attached to the plate.
Thc amplitudes of the first and second mode for random, sine-sweep, and impulsive-sine excitation, which use a shaker, are less than that of the impact excitation. Again, this may be an effect of the shaker’s moving mass. The third mode on each FRF shows less effect. Since the shaker was located near a node line of the third mode (fig. 19), it seems that the effect of the moving mass is minimized where there is less plate motion.
4

Sine-sweep excitation did not excite the modes as well as the other excitation methods because the logarithmic sweep was too fast to excite each mode with enough energy. Further study is needed to find a method to optimize the sweep rate. The third mode, which seems to be affected the most, could show the cumulative effects of the fast sweep rate and the shaker at the node line.
The experimental mode shapes and the mode shapes calculated from the vibration analysis were compared using the modal assurance criterion (MAC) (General Electric 1983). The results of the MAC are shown in table 1. MAC is a scalar value between zero and one. It represents the correlation between two mode shapes. A MAC value close to one indicates a high degree of correlation or consistency between two mode shapes. The mode shapes from the finite-element analysis were chosen as a basis for comparison with the experimental mode shapes. The MAC values are all 0.90 or above, representing consistent mode shapes for all types of excitation. The three mode shapes are shown in figures 17-19.
Experimental frequencies for each different excitation method along with the frequency obtained in the finite- element analysis are compared in table 2. The experimental frequencies for impact excitation had the highest values. This could be the result of no moving shaker mass attached to the plate. However, there is no more than a 3-percent difference between the experimental and calculated values of frequency. The consistency in the frequency data shows that any one of the five excitation methods would give good results. The differences between the corresponding measured and the analytical frequencies could be made less by optimizing the finite-element model.
A comparison of the damping values (table 3) shows some scatter in the damping data. The sine-dwell method has a good signal-to-noise ratio (Olson, 1984) and was used as the reference to compare with the other types of excitation. Sine-dwell excitation has consistently higher damping than the other types of excitation. Scatter in the damping estimates may be the result of how the computer parameter identification algorithms estimate the damping of a lightly damped structure (Kehoe, 1987). Previous GVTs on higher damped structures have shown that the scatter in the damping estimates was not as great (Kehoe, 1987).
Shaker Moving Mass Effects
The natural frequency w is related to mass m and the stifhess k by
w=m Therefore, the modal frequencies should decrease with an increase in shaker moving mass. Figures 20 to 22 show the trend in frequency as different amounts of shaker moving mass were used in exciting the plate both experimentally and analytically for the three modes investigated. The impact test data were used for the zero mass in the experimental plot. The first two modes show that frequency does decrease as the shaker moving mass increases. The third mode shows that the modal frequency remains relatively constant as the moving mass increases. This anomaly could occur because the shaker was attached close to a node line (fig. 19), which seems to reduce the effects of the shaker moving mass on the experimental modal frequency.
Damping as a function of shaker moving mass for each mode is shown in figure 23. Between the 1.357- and 2.910-lb moving masses, there is little variation in the damping values as the mass was increased for all three modes. The 0.789-1b moving mass, associated with the 50-lb shaker, shows the damping value increased from the 0.0-lb mass in all three modes. In the first two modes, the 0.789-1b damping values were higher than the 1.357- and 2.910- Ib moving mass. This added damping that could be caused by the elastomer, used as a support for the shaker armature in the 10-lb shaker. A lighter shaker without this added damping should be used to eliminate the effects. The third mode shows that the damping value is lower than the 1.357- and 2.910-lb shaker but the difference between them is no more than 0.002 g. This relatively consistent value for the third mode damping could be a result of the shaker being near a node line.
5

The generalized mass of a structure, as stated previously, is related to the mass of a structure by the following:
GM = [@Tl[Ml[@l
where 0 is the displacement matrix and M is the mass matrix of the structure. Since mass was added to the structure, the expectation was that the generalized mass of the structure would increase. But figures 24a, b. and c show that for every mode the mass decreased both analytically and experimentally. Since the mass increased in structure, h e cause of the decrease in generalized mass must be the result of a local decrease in displacement of the structure. Since the generalized mass is related to the displacement squared, the decrease in displacement squared is shown at the shaker attachment point for the three modes analytically along with the two experimental data points in figures 25a, b, and c. Displacement does decrease at this location. Also, mode shape contour plots, shown in figures 26,27, and 28 for the experimental data, show the decrease in the mode shape displacement data at almost every point along the structure between the 0.0- and 0.789-lb mode shapes. The decrease in displacement of the third mode is slight compared with displacement of the other modes because the shaker is close to a node line where there is little movement of the structure.
CONCLUDING REMARKS
Ground vibration tests (GVT) were conducted to investigate the differences of five types of excitation and the effects of shaker moving mass on the measurement of the modal characteristics of a 2- by 5-ft aluminum plate. The plate was suspended by elastic cords to simulate a free-free structure. The five types of excitation used were impact, random, sine dwell, sine sweep, and the impulsive sine hction (sin 5 ) /2. From the ground vibration test, it was determined that all five types of excitation yielded consistent modal characteristics. The experimental fre- quencies of the first three modes for each type of excitation were within 3 percent of each other. The damping data showed some scatter between each type of excitation. Based on this ground vibration test, using any of the five types of excitation for a ground vibration test of a structure like the plate would result in consistent modal charac- teristics. Similar studies with diffkrent sizes of test structures would give a better judgment of the benefits of each excitation method.
The GVT conducted on the aluminum test plate also investigated the effects of shaker moving mass on experi- mental modal characteristics of frequency, damping, and generalized mass. The modal frequency tends to decrease with an increase in shaker moving mass, and the damping values for a given mode tend to stay relatively constant as the moving mass increases. The 10-lb shaker added a significant amount of damping to the system; a light shaker without this added damping should be used in further tests. In addition, it was also found that placing the shaker near a node line can reduce some of the effects of the shaker moving mass on the frequency and damping values for the structure. The apparent generalized mass of the structure tends to decrease slightly with the added point mass to the system. The reason for this is the distortion of the mode shape caused a decrease in displacement when mass was added to the system, resulting in a local inertial restraint.
Ames Research Center Dryden Flight Research Facility National Aeronautics and Space Administration Edwardr, California, May 31,1988
6

REFERENCES
General Electric, User Manual for Modal AnalysL 8.0, General Electric CAE International, 1983.
Gupta, K.K., STARS-A General-Purpose Finite Element Computer Program for Analysis of Engineering Structures, NASA RF’-1129,1984.
Houbolt, John C., Subcritical Flutter Testing and System Identification, NASA CR-132480, 1974.
Kehoe, Michael W., Aircrdt Ground Vibration Testing at NASA Ames-Dryden Flight Research Facility, NASA TM-88272,1987.
Olsen, Norman L., “Excitation Functions for Structural Frequency Response Measurements,” Proceedings of the 2nd International Modal Analysis Conference, 1984.
Olsen, Norman L., “Using and Understanding Electrodynamic Shakers in Modal Applications,” Proceedings ofthe 4th International Modal Analysis Conference, 1986.
TABLE 1. RESULTS OF MODAL ASSURANCE CRITERION
Mode Analytical Sine dwell Random Impact Sine sweep Impulsive sine 1 1 .00 0.97 0.97 0.99 0.94 0.92 2 1 .00 0.98 0.98 0.97 0.96 0.97 3 1 .00 0.97 0.99 0.90 0.92 0.92
TABLE 2. COMPARISON OF GROUND VIBRATION TEST FREQUENCIES
Mode Analytical Sine dwell Random Impact Sine sweep Impulsive sine 1 13.42 12.99 13.02 13.55 12.93 13.02 2 20.33 19.58 19.50 20.01 19.33 19.52 3 37.18 36.39 36.61 36.86 36.05 36.66
TABLE 3. COMPARISON OF GROUND VIBRATION TEST DAMPING
Mode Analytical Sine dwell Random Impact Sine sweep Impulsive sine 1 N/A 0.014 0.006 0.012 0.010 0.007 2 NJA 0.014 0.008 0.010 0.008 0.008 3 N/A 0.018 0.006 0.012 0.014 0.008
7
Sine dwell sin u t
Random
Impact
Time domain Frequency domain
I ' W W W V L 0 1
V I
Sine sweep sin(a + bl) I
a 2b
Impulsive sine
W t
sin u t 14 7530
W
Figure 1. Spectral characteristics of the excitation methods.
ECN 33391-007 Figure 2. Electrodynamic shakers.
8

EC87 0123-001 Figure 3. Aluminum test plate configuration.
ECN 33391-008 Figure 4. Ground vibration test minicomputer system.
9

Figure 5. Shaker attachment to aluminum test plate.
EC87 0213-010 Figure 6. Overall GVT configuration.
10

EC87 02 13-002 Figure 7. Impulse hammer and signal amplifier.
EC87 0213-003 Figure 8. Ground vibration test consoles.

12
EC87 02 13-005 Figure 9. Polynomial waveform synthesizer.
1 2 3 4 5 6 7 8 9 10 11
22
33
44
55
7531
Figure 10. Plate grid points.
1 5.WE t 04
1.WE + 01 6.WE + 01 Frequency, Hz
1.WE + 01 6.WE + 01 7532 Frqurncy, Hz
Figure 11. Frequency response function and a typical curve fit.
I I I
7533
Figure 12. Decay trace from sine-dwell excitation.
13

Phase, Phase, /
180 180 I
1.WE + 04 - 1.WE + 04 E - Mode 3 Mode 3: Mode 1: Mode 2:
I
7535 Frequency, Hz
7534 Frequency, Hz
Figure 13. Impact frequency response function. Figure 14. Random frequency response function.
M o d e 1: Mode 2: M o d e 3: 12.93 Hz 19.33 Hz 36-05 Hz
1.WE + 04
in.lsec
1.00E + 00 1.00E + 01 4.WE + 01
7536 Frequency, Hz
Figure 15. Sine-sweep frequency response function.
Mode 1: Mode 2 Mode 3: 36.66 Hz 13.02 Hz 19.52 Hz e n
1.WE + 04
2 in.lsec Ib -
1.00E + 00
7537 Frequency, Hz
Figure 16. Impulsive-sine frequency response function.
Figure 17. Mode shape one, first bending. Figure 18. Mode shape two, first torsion.
14

13.8 14.0 Iz -0- Analytical + Experimental
t-Shaker
Figure 19. Mode shape three, second bending.
20.8 L +3- Analytical + Exmrimental
20.6 20.4 20.2
Frequency, 20.0 HZ
19.8
19.0 19.2 :::: "I\. 0 1 2 3
Moving mass, ib 1542
Figure 21. Mode 2 frequency trends with moving mass.
13.2 - Frequency, 1x0 -
HZ 128 - 126 -
13.2 - Frequency, 1x0 -
HZ 128 - 126 - ::: 1 , , , 12.0
0 1 2 3 Moving mass, Ib
Figure 20. Mode 1 frequency trends with moving mass.
7541
37.6 37.4
-0- Analytical XI- Experimental
36.2
36.0 0 1 2 3
Moving mass, Ib 1543
Figure 22. Mode 3 frequency trends with moving mass.
Modo - 1 + 2 * 3
0 ~ _ _ _ _ _ _
1 2 3 Moving mass, Ib
7%
Figure 23. Experimental damping trends.
15

7 ’: 9 - 8 - 7 -
Generalized 8 -0- Analytical + Experimental
Ib a 3 - 2 - 1 - L-2 1 2 3
0 1
7545 Moving mass, Ib
I I 1
-0- Analytical + Experimental
(a) Generalized mas mode 1. (b) Generalized mass mode 2.
7 t ! -0- Analytical
Generalized 8 -0- Experimental mass, 5 Ib a
3 t -
0 1 2 3
7547 Moving mass, Ib
(c) Generalized mass mode 3.
Figure 24. Generalized mass trend for modes.
16

-0- Analytlcai -€I- Experimental
-
.3
-0- Analytical -0- Experimental
-
(a) Displacement mode 1. (b) Displacement mode 2.
Analytical -i3- Experimental
0 1 2 3
(c) Displacement mode 3.
Figure 25. Displacement-squared trends.
Moving mass, ib 7549
17

Displacement, in.
U 0.789 Ib
I 1 1 1
1
0
i3- 0.789 Ib
Displacement, in.
1
Displacement, in.
0 2 4 6 8 10 12
7551 Grid number
(a)
1
Displacement, in.
-1 2 2 2 4 2 6 2 6 3 0 3 2 3 4
Grid number 7553
-1
7552 Grid number
(b)
-0- 0.0 Ib -0- 0.789 Ib
32 34 36 38 40 42 44 46 Grid number
7554
(dl
1
Displacement, in.
+ 0.789 Ib
-1 4 4 4 6 4 8 5 0 5 2 5 4 5 8
Grid number 7555
(e)
Figure 26. Mode 1 contour plots.
18

Displacement, in. 0 l9
-0- 0.0 Ib -0- 0.789 Ib
-1 0 2 4 6 8 10 12
Grid number 7556
(a)
1
Displacement, in.
-1 2 2 2 4 2 6 2 8 3 0 3 2 3 4
Grid number 7558
(c)
Displacement, in.
lr Displacement,
in.
mass e 0.0 Ib
Msplrcmmt. in.
-0- 0.789 Ib I -
10 12 14 16 18 20 22 24 Grid number
7557
1
0
-1
MovhJ mass
U 0.0 Ib -0- 0.789 Ib
3 2 3 4 3 6 3 8 4 0 4 2 4 4 4 6
7559 Grid number
Moving mass
1
-0- 0.0 Ib -0- 0.789 Ib
0
-1 4 4 4 6 4 8 5 0 5 2 5 4 5 6
Grid number 7560
(e)
figure 27. Mode 2 contour plots.
19

1
Displacement, in.
-1
Moving
-0- 0.0 Ib U 0.789 Ib
I M S S
1 I I I 0 2 4 6 8 10 12
Grid number 7561
(a)
Moving mass 1
-0- 0.0 Ib
Displacement, in.
-1 I 1 1 I 22 24 26 28 30 32 34
Grid number 7563
(c)
Displacement. in.
1
Displacement, In.
Moving mass
-0- 0.0 ib l3- 0.789 Ib
10 12 14 16 18 20 22 24 Glid number
7562
(b)
Moving
0.0 Ib 1 mass
-0- 0.789 Ib
Displacement, in.
-1 3 2 3 4 3 6 3 6 4 0 4 2 4 4 4 6
Grid number 7564
(4 Moving mass
Q- 0.0 Ib -0- 0.789 ib
-1 4 4 4 6 4 8 5 0 5 2 5 4 5 6
Grid number 7565
(e) Figure 28. Mode 3 contour plots.
20

1. Report No. 2. Government Accwrion No.
NASA TM-100446 I I
4. Title and Subtitle I 5. Report Date
3. Recipient's Catalag No.
The Effects of Excitation Waveforms and Shaker Moving Mass on the Measured Modal Characteristics of a 2- by 5-Foot Aluminum Plate
7. Author(sJ
David F. Voracek and Adolfo M. Morales
10. Work Unit No.
December 1988
6. Performing Organization Code
8. Performing Organization Report No.
H-1502
9. Performing Organization Name and Addreas
NASA Ames Research Center Dryden Flight Research Facility I
RTOP 505-63-21 - 11. Contract or Grant No.
13. Type of Report and Period Covered
Technical Memorandum
P.O. BOX 273, Edwards, CA 93523-5000
12. Sponsoring Agency Name and Addma
1. Key Words (Suggested by Author(s))
Excitation waveforms Ground vibration testing Shaker moving mass
National Aeronautics and Space Administration Washington, DC 20546
18. Distribution Statement
Unclassified - Unlimited
14. Sponsoring Agency Code 9
b. Security Clasaif. (of this report) 20. Security Classif. (of this page) 21. No. of pages
Unclassified Unclassified 24
5. Supplementary Not-
22. Price
A02
0. Abstract
Ground vibration tests were conducted to compare and to investigate the effects of five excitation waveforms and the shaker moving mass (equipment and armature used to attach the shaker to the structure) on the experimental modal characteristics of a 2- by 5-ft aluminum plate using fast Fourier transform techniques. The five types of excitation waveforms studied were sine dwell, random, impact, sine sweep, and impulsive sine. The results showed that the experimental modal frequencies for all types of excitation were within 3 percent, while the modal damping data exhibited greater scatter. The sets of mode shapes obtained by the five types of excitation were consistent. The results of the shaker moving mass investigation on the 2- by 5-ft aluminum plate showed that modal frequency decreases and modal damping remains relatively constant with an increase in shaker moving mass. The generalized mass of the structure appears to decrease with an increase in shaker moving mass. In addition, it was seen that having a shaker near a node line can reduce some of the effects of the added shaker moving mass on the frequencies and damping.
rSA FORM 1626 OCT BE *For sale by the National Technical In formation Service, Springfield, VA 221 61 -21 71.