the effects of eating disorders and menstrual irregularity ...thesis.honors.olemiss.edu/709/1/rr...
TRANSCRIPT

THE EFFECTS OF EATING DISORDERS AND MENSTRUAL IRREGULARITY ON BONE MINERAL DENSITY IN SORORITY WOMEN: A CROSS-SECTIONAL
STUDY
by Rachel Robertson
A thesis submitted to the faculty of The University of Mississippi in partial fulfillment of the requirements of the Sally McDonnell Barksdale Honors College.
Oxford May 2016
Approved By
____________________________
Advisor: Dr. Martha Bass
____________________________
Reader: Dr. Melinda Valliant
____________________________
Reader: Dr. John Garner

ii
©2016
Rachel Robertson ALL RIGHTS RESERVED

iii
ACKNOWLEDGMENTS I would like to thank my advisor, Dr. Martha Bass, for her endless dedication, patience, and encouragement throughout this process. My thesis accomplishment would not be what it is without this inspiring mentor and friend. I owe my most sincere thanks to the fifty women who dedicated their time and interest to help me accomplish this feat. Most importantly, I give gratitude to Rebekah Patterson and Caroline Battle, who never once grew weary of constant support through the two years they watched this work finally come to completion. Lastly, I give thanks to the faculty of the Sally McDonnell Barksdale Honors College and the University of Mississippi for four years of rewarding demands and a gratifying undergraduate education. I am forever appreciative of the experiences gained throughout this undergraduate opportunity.
iv
ABSTRACT
RACHEL ROBERTSON: The Effects of Eating Disorders and Menstrual Irregularity on Bone Mineral Density in Sorority Women: A Cross-Sectional Study
(Under the Direction of Dr. Martha Bass)
Past research has reported bone loss among women diagnosed with eating
disorders as a direct result of estrogen imbalance (Cobb et al., 2003; Gibson et al., 1999;
Kim et al., 2012; Zuckerman-Levin et al., 2014). Menstrual irregularity may result from
estrogen imbalance, which is characteristic of an eating disorder and ultimately causes
bone loss. Past studies have focused on this three-way relationship between eating
disorders, menstrual irregularity, and bone mineral density (BMD) specifically in female
athletes (Cobb et al., 2003; Gibson, Mitchell, Reeve, & Harries, 1999) but rarely in
recreationally trained or sedentary females. Previous research has also focused on the
elderly female population due to the estrogen imbalance and high osteoporotic risk
characteristic of menopause (Tella & Gallagher, 2014). Due to the reportedly high risk of
eating disorders among college-age women who are sorority members, this population is
at high risk for developing bone health issues. Therefore, the purpose of this study is to
investigate the relationship between eating disorders, menstrual irregularity, and BMD in
sorority women.
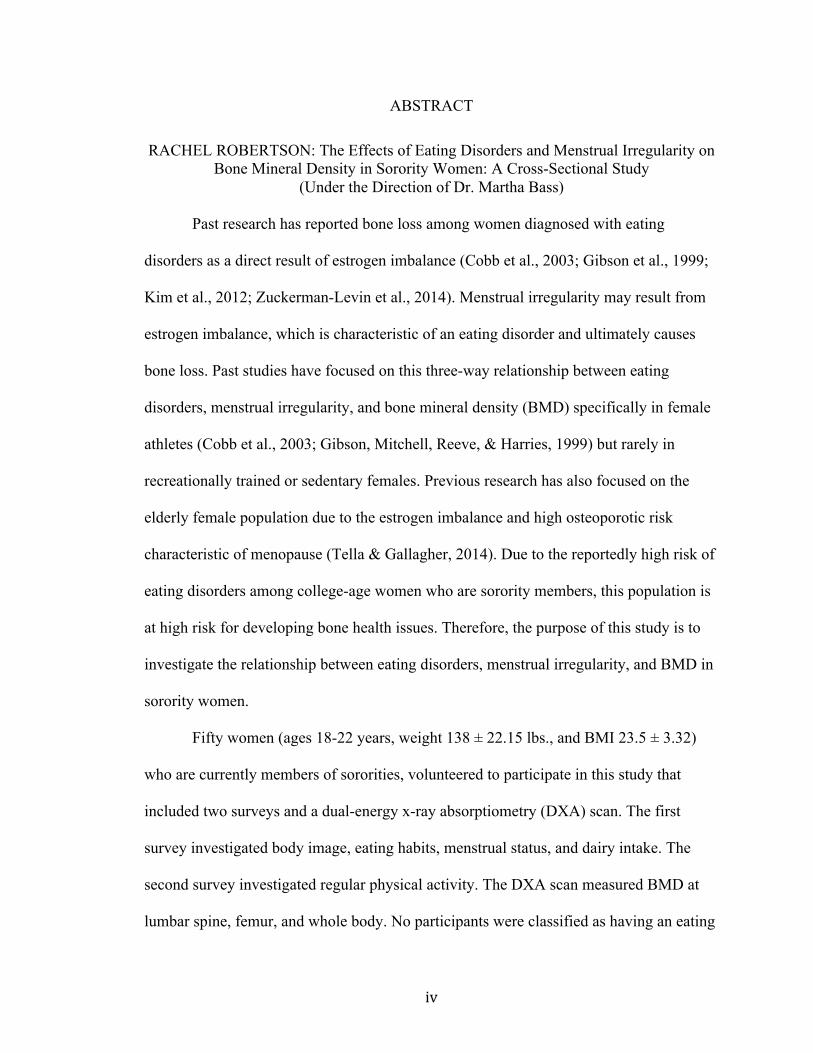
Fifty women (ages 18-22 years, weight 138 ± 22.15 lbs., and BMI 23.5 ± 3.32)
who are currently members of sororities, volunteered to participate in this study that
included two surveys and a dual-energy x-ray absorptiometry (DXA) scan. The first
survey investigated body image, eating habits, menstrual status, and dairy intake. The
second survey investigated regular physical activity. The DXA scan measured BMD at
lumbar spine, femur, and whole body. No participants were classified as having an eating

v
disorder according to EDDS survey answer scoring; however, many answers suggest
body image distortion and poor eating habits such as skipping meals. Statistical analysis
determined that there was no significant relationship (p > .05) between physical activity
and BMD, although further investigation should quantify physical activity intensities.
There was no statistically significant relationship between menstrual irregularity and
BMD (p > .05); however, fifty-two percent of participants were irregular, which may be
the result of poor eating habits. There was a statistically significant relationship between
dairy intake and BMD (p < .05) as well as BMI and BMD (p < .05).
This study did not find a relationship between eating disorders, menstrual
irregularity, and BMD in sorority women. However, we can report that a healthy BMI
(18.5-24.9) and adequate dairy intake (3+ servings/day) has a positive impact on bone
health in college-age women.
vi
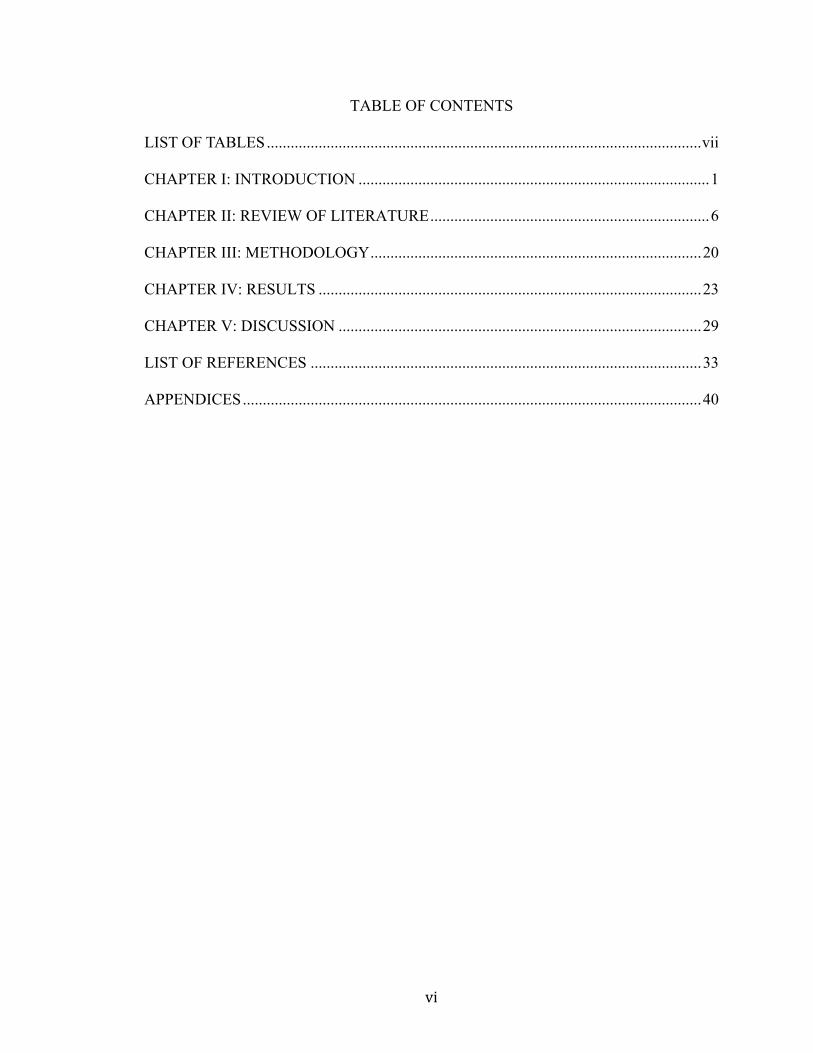
TABLE OF CONTENTS
LIST OF TABLES ............................................................................................................. vii
CHAPTER I: INTRODUCTION ........................................................................................ 1
CHAPTER II: REVIEW OF LITERATURE ...................................................................... 6
CHAPTER III: METHODOLOGY ................................................................................... 20
CHAPTER IV: RESULTS ................................................................................................ 23
CHAPTER V: DISCUSSION ........................................................................................... 29
LIST OF REFERENCES .................................................................................................. 33
APPENDICES ................................................................................................................... 40
vii
LIST OF TABLES
Table 1: Study population characteristics………………………………………………..23 Table 2: Bone mineral density categorizations…………………………………………..24 Table 3: Descriptive statistics………………………………………………….………...24 Table 4: Participant survey results……………………………………………………….26

1
CHAPTER I
INTRODUCTION
Osteoporosis is a debilitating condition that affects 75 million people and is
characterized by reduced bone mineral density. However, osteoporosis is highly
preventable if the risk factors are identified and avoided from an early stage (World
Health Organization [WHO], 2004). Bone, a living tissue of collagen, minerals, and bone
cells, loses its density when bone resorption is greater than bone formation, occurring
when osteoclast activity is greater than osteoblast activity (Kim et al., 2012; Yuan et al.,
2015). Low bone turnover, characteristic of osteoporosis, is affected by diet, hormone
level, and physical activity (National Osteoporosis Foundation [NOF], 2016).
Although research has reported a positive relationship between dairy intake and
bone mineral density due to calcium’s effect on osteoblasts, the presence of an eating
disorder can result in inadequate calcium intake and consequently a reduction in bone
mineral density (NOF, 2106; Sion et al., 2015; Zuckerman-Levin, Hochberg, & Latzer,
2014). Eating disorders, estimated to affect 30 million people in the United States, have
the highest mortality rate among mental illnesses (Central Region Eating Disorder
Service, 2007). Eating disorders, which are classified as anorexia nervosa, bulimia
nervosa, or sub-clinical eating disorders, result in depleted nutrients and can cause bone
loss within 12 months of eating disorder onset (Zuckerman-Levin et al., 2014).
According to the National Association of Anorexia Nervosa and Other Disorders
(2016), women have twice the risk for the development of eating disorders than men.
Research has shown sorority members to be at a higher risk than non-sorority members
due to social pressures to be thin (Basow, Foran, & Bookwala, 2007; Schulken &
2
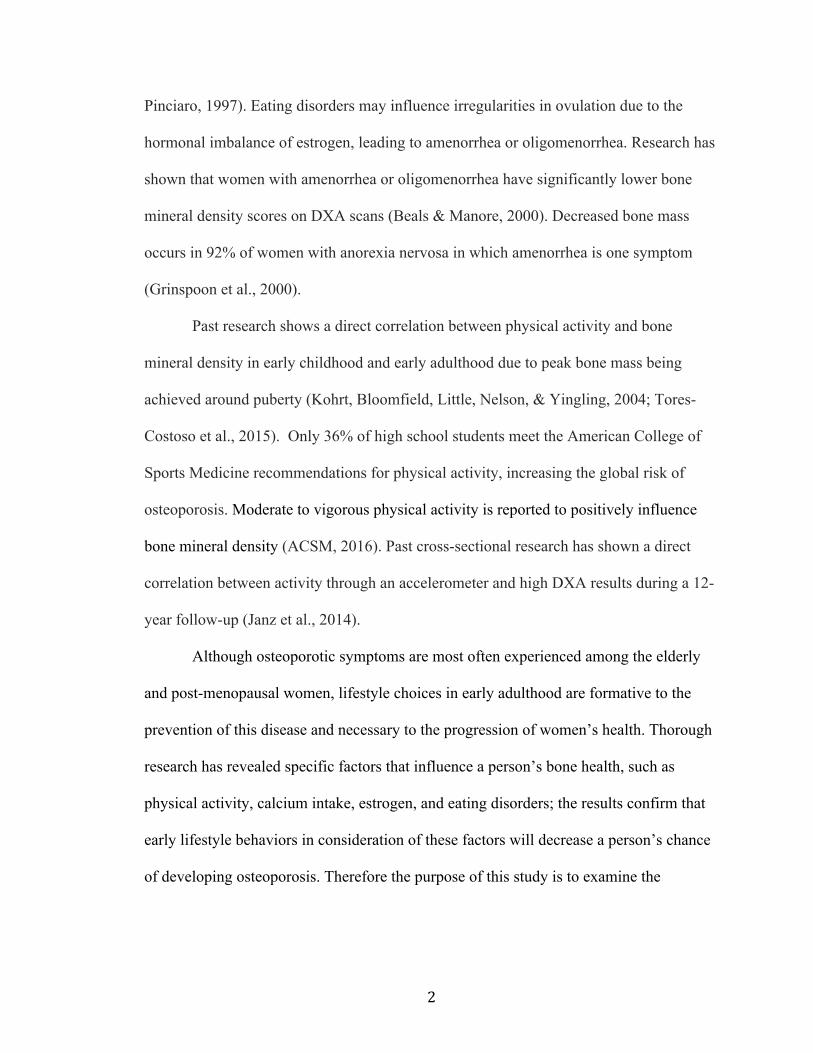
Pinciaro, 1997). Eating disorders may influence irregularities in ovulation due to the
hormonal imbalance of estrogen, leading to amenorrhea or oligomenorrhea. Research has
shown that women with amenorrhea or oligomenorrhea have significantly lower bone
mineral density scores on DXA scans (Beals & Manore, 2000). Decreased bone mass
occurs in 92% of women with anorexia nervosa in which amenorrhea is one symptom
(Grinspoon et al., 2000).
Past research shows a direct correlation between physical activity and bone
mineral density in early childhood and early adulthood due to peak bone mass being
achieved around puberty (Kohrt, Bloomfield, Little, Nelson, & Yingling, 2004; Tores-
Costoso et al., 2015). Only 36% of high school students meet the American College of
Sports Medicine recommendations for physical activity, increasing the global risk of
osteoporosis. Moderate to vigorous physical activity is reported to positively influence
bone mineral density (ACSM, 2016). Past cross-sectional research has shown a direct
correlation between activity through an accelerometer and high DXA results during a 12-
year follow-up (Janz et al., 2014).
Although osteoporotic symptoms are most often experienced among the elderly
and post-menopausal women, lifestyle choices in early adulthood are formative to the
prevention of this disease and necessary to the progression of women’s health. Thorough
research has revealed specific factors that influence a person’s bone health, such as
physical activity, calcium intake, estrogen, and eating disorders; the results confirm that
early lifestyle behaviors in consideration of these factors will decrease a person’s chance
of developing osteoporosis. Therefore the purpose of this study is to examine the

3
relationship of disordered eating, menstrual cycle irregularity, and physical activity on
bone mineral density in college-age women.
Significance of the Study
Past research investigating disordered eating, menstrual cycle, and bone health
has focused on athletes and postmenopausal women. Because this study is investigating
bone health in college-age women, findings could influence the perceptions of
osteoporosis among young women. In addition, this increase of osteoporotic awareness
would lead to an implementation of healthy eating, physical activity, and a reduction of
osteoporotic rates later in life.
Hypotheses
The following hypotheses were made regarding the efficacy of “The Effects of
Eating Disorders and Menstrual Irregularity on Bone Mineral Density in Sorority
Women: A Pilot Study”
1. Eating disorders will have a significant relationship with bone mineral density
in college-age women.
2. Physical activity will have a significant relationship with bone mineral density
in college-age women.
3. Menstrual irregularity will have a significant relationship with bone mineral
density in college-age women.
Research Limitations
Limitations of the study include the fact that all subjects were Caucasian
volunteers with available time for participation. In addition, subjects were not randomly
selected and answered survey questions through self-report measures. This presents the

4
potential to introduce bias into this study through under-reporting or over-reporting
significant variables. In addition, subjects were interested in their health, indicated by the
fact that they volunteered for this study, and this interest influences their activities of
daily living.
Research Delimitations
This study focused on college students who were also sorority members. All
participants fell between the ages of 18-22 years old and were not taking oral
contraceptives.
Definitions
Dual-energy X-ray Absorptiometry (DXA): a three compartment x-ray scan
measuring fat mass, fat free mass, and bone mineral density at specific sites; results are
given in the form of T-scores (NOF, 2016).
T-score: a standardized score comparing the amount of bone the patient has with
that of young adults of the same gender at peak bone mass (Donaldson & Gordon, 2015)
Osteopenia: occurring when a T-score is between -1.1 to -2.5 (Donaldson &
Gordon, 2015)
Osteoporosis: occurring when a T-score is -2.5 or below (WHO, 2004)
One repetition maximum (1 RM): the amount of weight in a given set that can
only be lifted once (ACSM, 2016)
Peak Bone Mineral Density: the point when a person has the greatest amount of
bone he or she will ever have, usually occurring between ages 18-25 (NOF, 2016)
Trabecular bone: the inner part of bone with high porosity and surface area
mainly concerned with vascularity and housing red bone marrow

5
Cortical bone: the outer part of bone with low porosity and high density mainly
concerned with stability and housing yellow bone marrow
6
CHAPTER II
REVIEW OF LITERATURE
The combination of disordered eating, menstrual irregularity, and low bone
mineral density has been identified as the female athlete triad, a distinct syndrome
associated with intensive exercise and a caloric deficiency that affects two thirds of
female athletes (Cobb et al., 2003; Gibson, Mitchell, Reeve, & Harries, 1999). When an
athlete couples excessive physical training with insufficient energy intake, a
physiological alteration of the hormone-controlled menstrual cycle can result. Athlete or
non-athlete, sufficient menstrual cycle is an indicator of good health. When menstrual
cycles become irregular or absent, it is symptomatic of an estrogen deficiency (Birch,
2005). Estradiol is the major natural estrogen responsible for bone health. Amenorrhea,
the absence of a menstrual cycle, has a detrimental effect on bone health at both cortical
and trabecular sites due to the lack of estradiol (Chestnut, 1989). Regular menses are a
sign of healthy ovaries and regular endocrine secretion of estradiol (Nelson, 2010).
Cobb et al. (2003) conducted a study on 91 competitive female long distance
runners, aging from 18-25 years, to examine menstrual irregularity as it related to diet
and bone mineral density. The subjects, who had to run at least 40 miles a week,
completed a questionnaire regarding their training regimen, number of menses in the past
12 months, and dietary intake such as protein, fat, and carbohydrate consumption. The
study focused on subclinical eating disorders (SCED), which were defined as “restrictive
eating behaviors that do not necessarily reach the level of a clinical eating disorder”
(Cobb et al., 2003, p. 711). The Eating Disorder Inventory (EDI), devised from pre-
existing tests to accurately assess psychological characteristics of eating disorders, was
7
used to screen for three subscales of SCED: Drive for Thinness, Bulimic Tendencies, and
Body Dissatisfaction in regards to the subjects’ answers (Garner, Olmstead, & Polivy,
1983). Additionally, body mass index (BMI) was reported as a relationship of height and
weight, and bone mineral density (BMD) was measured at the proximal femur, spine, and
whole body by dual x-ray absorptiometry (DXA).
Results of this study found that 26% of subjects were oligomenorrheic, defined as
4-9 cycles per year, 10% were amenorrheic, defined as 0-3 cycles per year, and the
remaining 64% were eumenorrheic, defined as 10-13 cycles per year (Gibson et al.,
1999). Of 23 women with high EDI scores, 67% had oligo/amenorrhea while 25% of the
67 women with normal EDI scores had oligo/amenorrhea. Further, BMD scores in
women with menstrual irregularity were significantly lower than BMD scores in women
with eumenorrhea (p < .05). Low BMD scores correlated with high EDI scores but not
with normal EDI scores. This three-way relationship between EDI scores, BMD scores,
and menstrual cycles confirmed the existence of the female athlete triad (Beals &
Manore, 2000).
Gibson et al. (1999) examined 34 middle and long-distance runners to determine
the presence of athletic amenorrhea, which occurs when menstrual function is halted due
to intense exercise. Inclusion criteria were that athletes had to run at least 40 km per week
and could not be eumenorrheic. Questionnaires obtained information about menses and
training regimen. Twenty-five of the women were reported amenorrheic, and nine were
oligomenorrheic. BMD results reported that the 34 women had BMD scores significantly
lower than data of age-matched control. The correlation between menstrual irregularity
and low bone mineral density led authors to investigate treatment for athletic amenorrhea,

8
concluding that the “best form of management for this condition is early prevention,
adequate diet, and sensible training” (Gibson et al., 1999, p. 289).
The Diagnostic and Statistical Manual of Mental Disorders (DSM IV) defines
anorexia nervosa (AN) as “a refusal to maintain body weight at or above a minimally
normal weight for age and height, intense fear of gaining weight even though
underweight…and the absence of at least three of more consecutive menstrual cycles”
(Central Region Eating Disorder Service, 2007). The DSM IV defines bulimia nervosa
(BN) as “recurrent episodes of binge eating and recurrent inappropriate compensatory
behavior in order to prevent weight gain, such as self-induced vomiting or use of
laxatives” (Central Region Eating Disorder Service, 2007). However, disordered eating
can occur without meeting diagnostic criterion, which is characterized under the Eating
Disorders Not Otherwise Specified (EDNOS) category reported by the DSM IV.
The DSM IV uses a series of lengthy interviews called the Eating Disorder
Examination (EDE) to diagnose eating disorders. To reduce the time involvement and
expense of the DSM IV, Stice, Telch, and Rizvi (2000) developed the Eating Disorder
Diagnostic Scale. This 22 item instrument has a test-retest reliability of r = .87 as well as
an internal consistency of α = .89. The scale can be scored by hand or by an SPSS
computer algorithm. The items can be standardized and summed to create an overall
composite number for AN or BN (Schulken & Pinciaro, 1997; Stice, Telch, & Rizvi,
2000).
An additional questionnaire, the Eating Disorder Inventory (EDI-2), can be used
for clinical purposes when screening for but not diagnosing an eating disorder. Clausen,
Rokkedal, and Rosenvinge (2009) confirmed its validity in an investigation of two
9
samples of females over the age of 17. The first sample (n = 575) was obtained from an
eating disorder center, and the second group (n = 881) was healthy control obtained from
the Danish Civil Registration. Researchers reported the EDI-2 to be “a valid instrument
for measuring eating disorder related symptoms” (Clausen, Rokkedal, & Rosenvinge,
2009, p. 466).
Woodside et al. (2001) investigated the prevalence of eating disorders from a
sample size of 9,953 men and women. Using the World Health Organization Composite
International Diagnostic Interview, Woodside et al. interviewed participants for 1-2 hours
to determine anxiety disorders, eating disorders, and personality disorders. The results
showed that the incidence of women with eating disorders was twice that of men with
eating disorders. The female-male ratio of AN was 2:1, and the female-male ration of BN
was 2.9:1.Woodside et al. concluded that eating disorders had a higher prevalence in
women than men (2001). It is estimated that only 10-15% of people with an eating
disorder are male (National Association of Anorexia Nervosa and Other Disorders,
2016).
Schulken and Pinciaro (1997) further narrowed the at-risk female population to
specifically women in sororities due to thin body image and social pressure. Sorority
women (n = 627) were surveyed to investigate the risk of sorority members for
developing disordered eating and body image issues. The results revealed that sorority
women scored higher on the EDI subscale’s Drive for Thinness and Body Dissatisfaction
than college women from previous studies. The sorority women had a greater fear of
becoming fat and were more concerned with dieting than non-sorority women. Schulken

10
and Pinciaro state that these findings could be symptomatically related to disordered
eating.
Further, Schulken and Pinciaro (1997) administered a Silhouette Survey, which
consisted of seven silhouettes with designated BMIs. Each subject was asked to select the
silhouette “that best represented her current body size, the size she felt women should be,
and the size she would like to be” (p. 69). The findings indicated that thinness was the
ideal among sorority women, with 62.1% selecting underweight silhouettes as the size
women should be and 81% of subjects selecting an underweight silhouette as the size
they would like to be. It was concluded that this drive for thinness among sorority
members elevated the risk of disordered eating (Schulken & Pinciaro, 1997).
Basow, Foran, and Bookwala (2007) administered a questionnaire to 265 college
women from a small liberal arts college, where sorority membership occurs during their
sophomore year. Of the 265 women, 99 were sorority members, 80 were non-sorority
members not in their first year, 49 were first-years intending to rush a sorority, and 37
were first-years not intending to rush. Participants’ BMIs were determined, and the EDI-2
was administered as well as a body objectification scale (OBCS) with a five-question
survey about social pressure.
Results found that sorority members and those who intended to rush had
significantly higher scores on the Body Surveillance and Body Shame subsections of
OBCS. Sorority members and women who intended to rush also scored significantly
higher on the EDI-2 subscales of Drive for Thinness and Body Dissatisfaction, and
sorority members had the highest scores on the Bulimia subscale. Finally, sorority
members and women who intended to rush reported to be under more social pressure than
11
non-sorority women in regard to low body weight. Basow et al. (2007) concluded that
sorority women were at a higher risk for developing eating disorders than non-sorority
women, and women who intended to join sororities already had indications of disordered
eating.
In the United States, 30 million people suffer from an eating disorder, which has
the highest mortality rate of any mental illness. Crude mortality rate is 4% for AN, 3.5%
for BN, and 5.3% for SCED (National Association of Anorexia Nervosa and Other
Disorders, 2016). Short-term effects, such as dizziness, headaches, cold and nausea, and
long-term consequences, such as osteoporosis, cardiovascular disturbances, diabetes
mellitus, thyroid disorders, and fertility problems can be the results of an eating disorder
(Donaldson & Gordon, 2015; Meczekalski, Podfigurna-Stopa, & Katulski, 2013).
Specifically, AN affects 0.3-3% of women and is the most prevalent chronic disease in
adolescent girls (Smink, van Hoken, & Hoek, 2012). This disease reduces life expectancy
in women by 25 years if diagnosed before 15, and by 14 years if diagnosed by age 20
(Harbottle, Birmingham, & Sayani, 2008 as cited in Meczekalski et al., 2013). Patients
with AN also have a mortality rate six times that of the general population, and cardiac
complications affect 80% of patients with eating disorders (Birch, 2005; Papadopoulos,
Ekbom, Brandt, & Ekselius, 2009).
A depleted nutrient status is primarily the cause of low bone mineral density
found in patients with AN. Bone is living tissue made of collagen, mineral complexes,
and bone cells called osteoclasts and osteoblasts (National Osteoporosis Foundation
[NOF], 2016). Osteoclastic activity results in bone resorption by breaking down tissue
and minerals, while osteoblastic activity results in bone formation (Yuan et al., 2015). An

12
imbalance between bone resorption and bone formation can result in a loss of bone tissue
(Kim et al., 2012). Osteoclastic activity is often greater than osteoblastic activity in a
patient with an eating disorder, and bone loss can occur within 12 months of disease
onset (Zuckerman-Levin, Hochberg, & Latzer, 2014).
Hypercortisolemia is a common response to physical stress of starvation where
cortisol is released by the adrenal glands into the blood as the body tries to maintain
blood glucose levels. However, the presence of cortisol also suppresses the action of
osteoblasts and bone formation. Osteocyte function is regulated by thyroid hormones,
which decrease in patients with eating disorders. Decreases in thyroid hormones can
contribute to a reduction in BMD through interfering with both resorption and formation
of tissue (Tuchendler & Bolanowski, 2014).
Further, human growth hormone is also reduced in the presence of an eating
disorder, consequently stunting liver growth and affecting the body’s glucose storage
system (Donaldson & Gordon, 2015). Diamond, Stiel, Lunzer, Wilkinson, Roche, and
Posen (1990) confirmed the importance of liver function in bone maintenance by
surveying 115 patients with abnormal liver biopsies. Participants were assessed regarding
bone fracture history and menses if female, and obtaining bone mineral densities with
both single and dual x-ray absorptiometry. Osteoporosis was defined as greater than two
standard deviations from the mean of a healthy sex-matched control. Results showed
fractures occurred more often in patients with chronic liver disease than age-matched
controls. Additionally, the rate of osteoporosis at the forearm and spine was double the
rate of osteoporosis in healthy controls (Diamond, Stiel, Lunzer, Wilkinson, Roche, &
Posen, 1990).
13
Secondary amenorrhea is a response to a decrease in gonadotropin-releasing
hormone resulting in elevated levels of follicle stimulating hormone (FSH) and
luteinizing hormone (LH), which prevent ovulation and decrease estrogen levels
(Zuckerman-Levin et al., 2014). The decrease in estrogen results in a loss of bone mass,
as reported in Kim et al.’s study (2012). Kim et al. examined the creep behavior (a
continuous deformation on viscoelastic materials under a load) on vertebral bones of rats
that received a bilateral ovariectomy (OVX) and compared the data with the creep
behavior in rats that received a sham operation. The findings determined that vertebral rat
bone is negatively affected when estrogen is removed from the rat, allowing the bone to
become deformed at an increased rate while under loading (Kim et al., 2012).
Zuckerman-Levin et al. (2013) investigated bone health in eating disorders and supported
the findings of Kim et al. (2012). Their investigation claims that anorexia nervosa causes
amenorrhea due to malnutrition, and this lack of menstrual cycle leads to a decreased
presence of estrogen (Zuckerman-Levin et al., 2013). Women suffering from anorexia
nervosa who had amenorrhea for more than six years were seven times more likely to
experience bone fractures compared with healthy controls. This high fracture risk is a
direct consequence of hormonal imbalance characteristic of malnutrition (Zuckerman-
Levin et al., 2013).
Lastly, Aree-ue and Petlamul (2013) recognized osteoporosis as “one of the major
worldwide public health problems, especially in postmenopausal women” (p. 1051).
Their emphasis on postmenopausal women is due to the estrogen deficiency occurring in
menopause that puts women at an elevated risk of developing osteoporosis. By focusing
specifically on subjects who are lacking estrogen and discovering the lowered bone

14
density associated with the hormone imbalance, these three articles validate the claim that
estrogen is the most influential factor on bone health.
Bearing weight allows muscle to pull on bone, which causes osteoblastic activity
(bone formation) to surpass osteoclastic activity (bone resorption), but when an
individual has little weight to bear, osteoclastic activity exceeds osteoblastic activity,
leading to decreased bone mineral density (Zuckerman-Levin et al., 2013). Decreased
bone mineral density (osteopenia) occurs in up to 92% of young adults with anorexia
nervosa, with 38-50% of young women with AN diagnosed with osteoporosis due to low
body weight as well as hormonal imbalance (Grinspoon et al., 2000).
Risk factors that influence bone health include inadequate calcium intake, high
protein diet, inactivity, and alcohol consumption (NOF, 2016). Sioen et al. (2015)
assessed bone health among children and reported a positive association between dairy
intake and BMD (Sioen et al., 2015). Sufficient dairy intake during childhood may
effectively influence BMD in adulthood. Calcium intake is of valuable importance for
bone health from an early age. High bone mineral density as a result from adequate dairy
intake is evident in adolescence and postmenopausal women (Sioen et al., 2015; Tenta,
Moschonis, Koutsilieris, & Manios, 2011). When the presence of an eating disorder
results in inadequate intake of daily calcium, bone mineral density is reduced and
osteoporotic risk is increased (Zuckerman-Levin et al., 2014).
Paccou et al. (2015) related alcohol consumption to reduced bone mineral density.
After assessing the distal radius and distal tibia in both men and women, Paccou
concluded that alcohol consumption is an independent predictor of fractures and had a
dose response relationship. Alcohol transforms the growth of mesenchymal cells into
15
adipocytes, impairing the production of osteoblasts, creating a bone-remodeling
imbalance (Mikosch, 2014).
Similar findings are reported in Ralston’s (2010) investigation of the role of
genetics in bone mineral density. He investigated the role of Type 1 collagen proteins in
individuals with low bone mineral density. Increased gene transcription is found in
osteoporosis and results in “an abnormal ratio of alpha 1 to alpha 2 protein chains and
reduced bone strength, leading to an increased risk of fracture” (Ralston, 2010, p. 70).
Genetics’ role in bone health is reported to influence 50-90% of osteoporotic cases,
according to twin and family studies (Urano & Inoue, 2014).
Rikkonen et al. (2012) investigated the relationship of muscle strength, lean mass
index, and overall body composition with bone mineral density in 979 postmenopausal
women. After administering a DXA scan for femoral neck BMD, total body BMD, and
total body composition, subjects were given a grip test and isometric knee extension test
to determine muscle strength. Subjects were divided into three groups: osteoporotic
women (OP), osteopenic women (OPN), and normal control (N). The OP group had
significantly weaker muscle strength compared to OPN and N as well as significantly less
lean mass, indicating that a lower amount of muscle mass is an osteoporotic indicator.
Body composition was used as an osteoporotic determinant instead of body mass index
(BMI), which is not representative of “proportional composition characteristics” between
height and weight (Rikkonen et al., 2012, p. 132).
The American College of Sports Medicine recommends 150 minutes of moderate-
intensity exercise per week, training each muscle group 2-3 times per week at no more
than 60% of 1RM, and flexibility exercises 2-3 days per week to enhance range of motion

16
(American College of Sports Medicine [ACSM], 2016). Kohrt, Bloomfield, Little,
Nelson, and Yingling (2004) published a study in ACSM’s journal, Medicine & Science
in Sports & Exercise, detailing the effects of physical activity in maximizing bone mass
during childhood and early adult years. They reported a reduction in trabecular bone mass
as early as the third decade. They concluded that peak bone mineral density occurs
around puberty, and physical activity during adolescents is necessary in order to
maximize peak bone mass (Kohrt, Bloomfield, Little, Nelson, & Yingling, 2004).
Moderate to vigorous physical activity is reported to positively influence bone
mineral density. Torres-Costoso et al. (2015) found a direct correlation between
cardiorespiratory fitness and bone health in a study of 1592 children. Additionally, the
Iowa Bone Development Study (IBDS) collected accelerometer measures from ages 5-17
years in a longitudinal study of bone health in children and adolescents. At age 17,
participants were given a DXA scan. Throughout the objective measure of activity and
bone health within the 12-year follow-up, high levels of physical activity were
persistently associated with greater bone strength at the hip and tibia. Early levels of
physical activity are strong predictors of bone health (Janz et al., 2014).
According to the World Health Organization (WHO, 2004), the basis of bone
mineral density assessments define osteoporosis as occurring “…when BMD lies 2.5
standard deviations or more below the average value for young healthy women (a T-score
of < -2.5 SD).” To obtain BMD (measured in grams per square centimeter), a DXA scan
sends low dose x-rays with two different energies through the bone and soft tissue
(Gibson et al., 1999). The results are given in the form of a standardized T-score. This
compares the amount of bone the patient has with that of young adults of the same gender

17
at peak bone mass. Giving the fracture risk of the patient, a T-score above -1.1 is
considered normal, and -1.1 to -2.5 is classified as osteopenia (Donaldson & Gordon,
2015).
Osteoporosis is “silent until the emergence of fractures” (Alexandraki et al., 2008,
p. 38). Common fracture sites are the spine and hip, and therefore a DXA scan often
assesses the BMD of the lumbar spine, femoral neck, and trochanteric sites (Donaldson &
Gordon, 2015; WHO, 2004). Bone loss often occurs in both trabecular and cortical bone,
although more often in trabecular (Zuckerman-Levin et al., 2014). Osteoporosis is a
debilitating condition that affects 75 million people and is characterized by reduced bone
mineral density, but it is highly preventable if the risk factors are identified and avoided
from an early stage. This disease significantly influences an individual’s physical health
by lessening bone stability and increasing the risk of fracture. The WHO (2004) reports
8.9 million fractures per year due to osteoporosis, which can lead to a decreased quality
of life as well as an increased rate of mortality, especially when the elderly are affected.
By identifying specific risk factors early on and eliminating their prevalence in certain
populations, the high rates of osteoporosis will be reduced and quality of life will
improve (WHO, 2004).
Of the estimated 10 million Americans with osteoporosis, 80% are women. The
disparity in gender related bone health is due to women having smaller bones and the
presence of estrogen (NOF, 2016). In women, “estrogen deficiency is the most eminent
factor leading to osteoporosis” (Mikosch, 2014, p. 16). Most fractures resultant of
osteoporosis occur among women who experience accelerated bone loss after menopause
(Garber et al., 2011). The first five to seven years after menopause, 20% of bone mineral

18
density can be lost (NOF, 2016). Because peak bone mass in the spine and hip is reached
in the mid-twenties, early prevention is necessary to reduce the risk of developing
osteoporosis (Tella & Gallagher, 2014; WHO, 2004).
In a study published by the National Health and Nutrition Examination Study
(NHANES III), only 7% of 393 women who had osteoporosis were aware of their
condition (Garber et al., 2011). Aree-Ue and Petlamul (2013) report that individuals
living in rural areas are lacking in knowledge of osteoporosis and its risk factors. Aree-
Ue and Petlamul (2013) also report a positive correlation between self-efficacy and
osteoporosis prevention behaviors. Their study examined the differences in knowledge,
health beliefs, and behaviors in younger and older women in rural Thailand through
questionnaires, health belief models, and osteoporosis knowledge tests. The authors
concluded that younger women know more about osteoporotic risk factors, but older
women apply preventative behaviors at a higher rate.
Because perceptions of susceptibility are strong indicators of health behavior,
Gerend, Erchull, Aiken, and Maner (2006) investigated the perceived risk of osteoporosis
and its underlying factors in a study of 358 women. Women were asked about the extent
to which they believe they are at risk for osteoporosis and to identify risk factors. Sixty-
three percent perceived themselves to be at a lower risk than other women their age,
contributing that success to personal action such as exercise and calcium intake. Twenty-
two percent estimated that their risk of osteoporosis was the same as women their age,
and sixteen percent estimated that their risk was higher, contributing that mainly to
genetics or family history. Because most of the participants did not view osteoporosis as
19
a threat, the authors identified this invulnerability as “unrealistic optimism” due to
“conceptual holes” in current literature (Gerend, Erchull, Aiken, & Maner, 2006, p. 227).
Alexandraki et al. (2008) stated that knowledge of osteoporotic risk factors can
“prompt medical advice for prevention and treatment” (p. 43). Pharmacists gave
questionnaires regarding demographic data, osteoporosis knowledge, and known risk
factors to 99 Greek females who were undergoing treatment for osteoporosis or
osteopenia. Ninety percent of the subjects knew the definition of osteoporosis, and 47.5%
knew at least one risk factor. The two risk factors most identified were decreased dairy
consumption and exercise, while very few subjects identified age and corticosteroids as
risk factors. Older patients were found to be less aware of osteoporosis, an important
finding considering the disease to be age related. Subjects with more extensive education
were more aware of risk factors, but no statistical significance existed between the
knowledge of subjects undergoing treatment for osteoporosis or osteopenia (Alexandraki
et al., 2008).
Past studies have confirmed menses status, eating disorders, dairy intake, and
physical activity as reliable predictors of bone mineral density (Cobb et al., 2003; Janz et
al., 2014; Sioen et al., 2015). Because previous research on women’s bone health
primarily concerns athletes and postmenopausal women, this study will specifically
evaluate bone health of college-age, sorority women, a population at high risk for eating
disorders but rarely investigated for osteoporotic risk factors. Therefore, the purpose of
this study is to evaluate the eating habits of sorority women, their reported menstrual
cycles, and the overall correlation these two variables have with bone mineral density.
20
CHAPTER III
METHODOLOGY
Past research has focused on osteoporotic risk factors primarily in athletes and
postmenopausal women, but little research investigates the bone health of
premenopausal, college-age women (Cobb et al., 2003; Gibson, Mitchell, Reeve, &
Harries, 1999; Sioen et al., 2015). Due to the scarcity of research focused on bone health
of this age group as well as the high risk of eating disorders reported in college-age
sorority members, this pilot study examines the influence of disordered eating and
menstrual cycle irregularity on bone mineral density in college-age sorority women.
After the University of Mississippi Institutional Review Board approved this
study, participants in this study (n=50) were recruited through sorority meetings, class
meetings, and chapter Facebook pages (Appendix E). Inclusion criteria required
participants to be female sorority members not taking oral contraceptives. Interested
participants were instructed to contact the primary investigator, and a meeting time at
Turner Center was arranged. Upon meeting, participants signed a consent form detailing
the bone scan procedure, risks and benefits, costs, confidentiality, and right to withdraw
from the study (Appendix A).
Participants were given an identification number in order to maintain
confidentiality. The Bone Mineral Density Risk Factor Questionnaire was administered
regarding alcohol intake, body image, diet, menstrual cycle, family history, and dairy
intake (Appendix B). This survey was a modified version of the Eating Disorder
Diagnostic Scale which has a test-retest reliability of r = .87 as well as an internal
consistency of α = .89 (Stice, Telch, & Rizvi, 2000). To investigate if participants were

21
meeting the American College of Sports Medicine (ACSM) physical activity
recommendations, an exercise log recording weekly activity, frequency per week, and
duration per session was administered (Appendix C).
Following administration of the survey, a pregnancy test was conducted on all
participants to eliminate the risk of radiation on an unborn fetus. In case of a positive
pregnancy test, a script was prepared (Appendix D) explaining that the female would not
be able to participate in the study. For non-pregnant participants, height and weight were
collected utilizing a standard physician scale in order to calculate BMI. Participants were
then scanned for bone mineral density using dual-energy x-ray absorptiometry (DXA),
manufactured by Hologic. Utilizing a multi-element digital detector array and fan-beam
dual-energy x-ray absorptiometry, Hologic DXA scans were used to analyze lumbar
spine, femoral neck, trochanter, intertrochanter, and whole body.
Statistical analysis was conducted using SPSS. Univariate analysis was conducted
for descriptive purposes. Using crosstabs, chi-square analysis was conducted to determine
associations between bone mineral density and exercise, dairy intake, and menstrual
irregularities. Pearson correlation was performed to assess the relationship of bone
mineral density with BMI.
A diagnosis of anorexia nervosa or bulimia nervosa was evaluated by DSM IV
standards. The participant was categorized anorexic if (a) calculated BMI was less than
17.5, (b) the participant responded with a 4 or greater on question 4, (c) the participant
responded with a 4 or greater on question 5 or 6, and (d) the participant reported
amenorrhea. The participant was categorized bulimic if (a) the participant responded
“yes” to questions 7 and 8 and responded with a 2 or greater on question 9, (b) the

22
participant responded with an 8 or greater on the sum of questions 10, 11, 12, or 13, and
(c) the participant responded with a 4 or greater on questions 5 and 6 (Stice et al., 2000).
23
CHAPTER IV
RESULTS
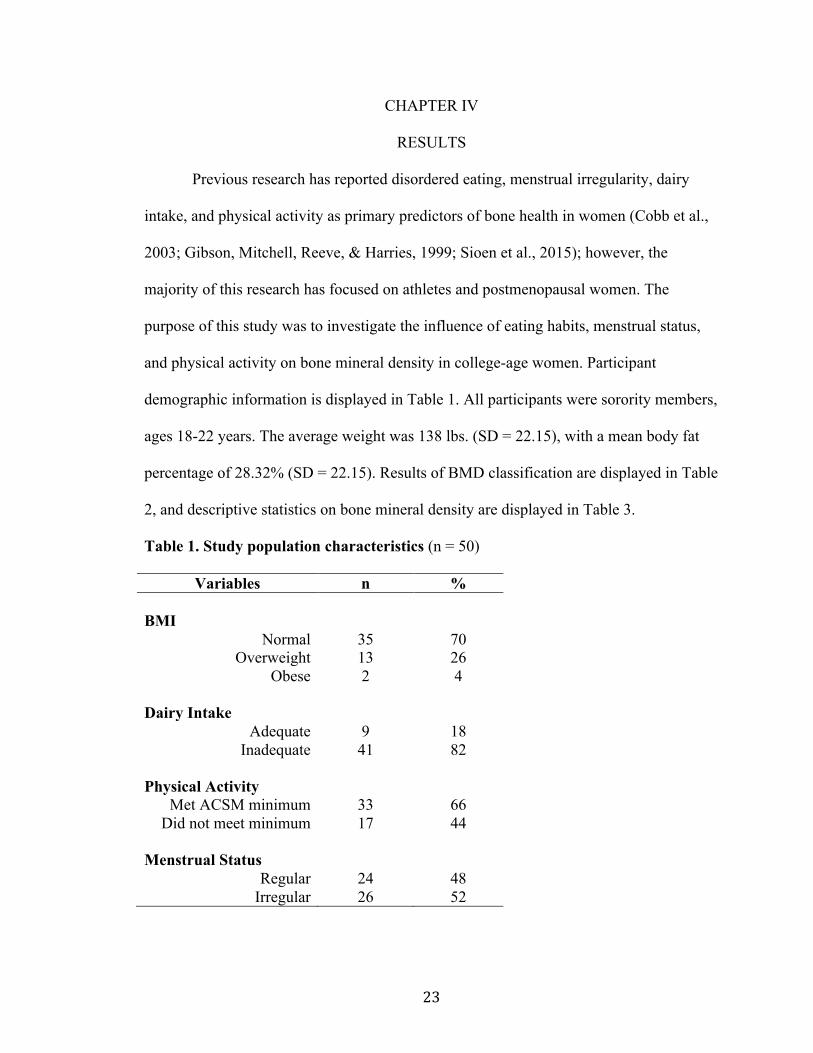
Previous research has reported disordered eating, menstrual irregularity, dairy
intake, and physical activity as primary predictors of bone health in women (Cobb et al.,
2003; Gibson, Mitchell, Reeve, & Harries, 1999; Sioen et al., 2015); however, the
majority of this research has focused on athletes and postmenopausal women. The
purpose of this study was to investigate the influence of eating habits, menstrual status,
and physical activity on bone mineral density in college-age women. Participant
demographic information is displayed in Table 1. All participants were sorority members,
ages 18-22 years. The average weight was 138 lbs. (SD = 22.15), with a mean body fat
percentage of 28.32% (SD = 22.15). Results of BMD classification are displayed in Table
2, and descriptive statistics on bone mineral density are displayed in Table 3.
Table 1. Study population characteristics (n = 50)
Variables n % BMI
Normal 35 70 Overweight 13 26
Obese 2 4
Dairy Intake Adequate 9 18
Inadequate 41 82
Physical Activity Met ACSM minimum 33 66
Did not meet minimum 17 44
Menstrual Status Regular 24 48
Irregular 26 52

24
Table 2. Bone mineral density categorizations (n = 50)
Variables n % Total femur
Osteopenia 0 0 Healthy 50 100
Femoral neck Osteopenia 3 6
Healthy 47 94 Trochanter
Osteopenia 2 4 Healthy 48 96
Intertrochanter Osteopenia 0 0
Healthy 50 100 Lumbar Spine
Osteoporosis 2 4 Osteopenia 8 16
Healthy 40 80 Table 3. Descriptive statistics (n = 50) Mean Std. Deviation Total femur (t score) 1.0160 .88372 Femur neck (t score) .2540 .90356 Trochanter (t score) .3440 .77595 Intertrochanter (t score) .9400 .81115 Lumbar spine (t score) - .1720 1.17422
BMI 23.4757 3.32091
The data for this study were analyzed using SPSS Statistics, Version 22 by IBM
Corporation. Pearson chi-square analysis was used to assess associations between BMD
25
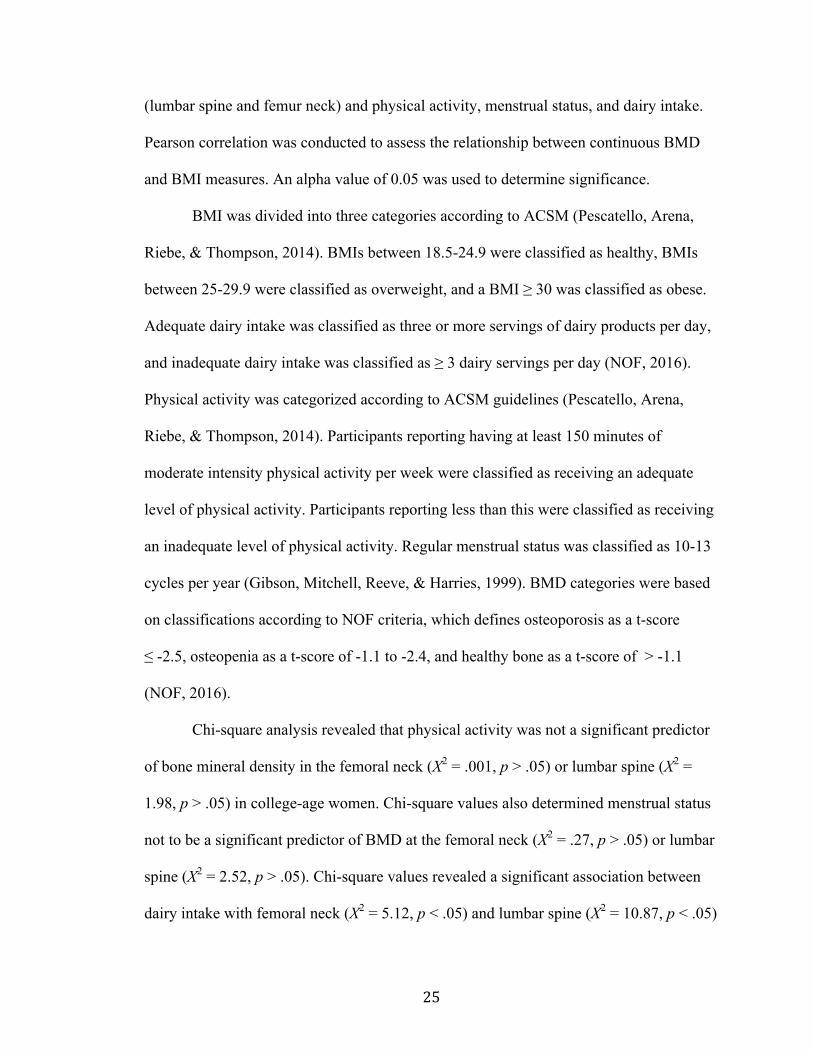
(lumbar spine and femur neck) and physical activity, menstrual status, and dairy intake.
Pearson correlation was conducted to assess the relationship between continuous BMD
and BMI measures. An alpha value of 0.05 was used to determine significance.
BMI was divided into three categories according to ACSM (Pescatello, Arena,
Riebe, & Thompson, 2014). BMIs between 18.5-24.9 were classified as healthy, BMIs
between 25-29.9 were classified as overweight, and a BMI ≥ 30 was classified as obese.
Adequate dairy intake was classified as three or more servings of dairy products per day,
and inadequate dairy intake was classified as ≥ 3 dairy servings per day (NOF, 2016).
Physical activity was categorized according to ACSM guidelines (Pescatello, Arena,
Riebe, & Thompson, 2014). Participants reporting having at least 150 minutes of
moderate intensity physical activity per week were classified as receiving an adequate
level of physical activity. Participants reporting less than this were classified as receiving
an inadequate level of physical activity. Regular menstrual status was classified as 10-13
cycles per year (Gibson, Mitchell, Reeve, & Harries, 1999). BMD categories were based
on classifications according to NOF criteria, which defines osteoporosis as a t-score
≤ -2.5, osteopenia as a t-score of -1.1 to -2.4, and healthy bone as a t-score of > -1.1
(NOF, 2016).
Chi-square analysis revealed that physical activity was not a significant predictor
of bone mineral density in the femoral neck (X2 = .001, p > .05) or lumbar spine (X2 =
1.98, p > .05) in college-age women. Chi-square values also determined menstrual status
not to be a significant predictor of BMD at the femoral neck (X2 = .27, p > .05) or lumbar
spine (X2 = 2.52, p > .05). Chi-square values revealed a significant association between
dairy intake with femoral neck (X2 = 5.12, p < .05) and lumbar spine (X2 = 10.87, p < .05)

26
bone mineral densities. Pearson correlations revealed BMI to have a significant positive
relationship with BMD at the femoral neck (r = .35, p < .05) and lumbar spine (r = .34, p
< .05). As BMI increases, bone mineral density also increases.
None of the participants were categorized as clinically anorexic or bulimic
according to EDDS standards (Stice, Telch, & Rizvi, 2000). However, survey answers
indicate a risk for developing disordered eating. Survey answers and frequency of results
are displayed in Table 4.
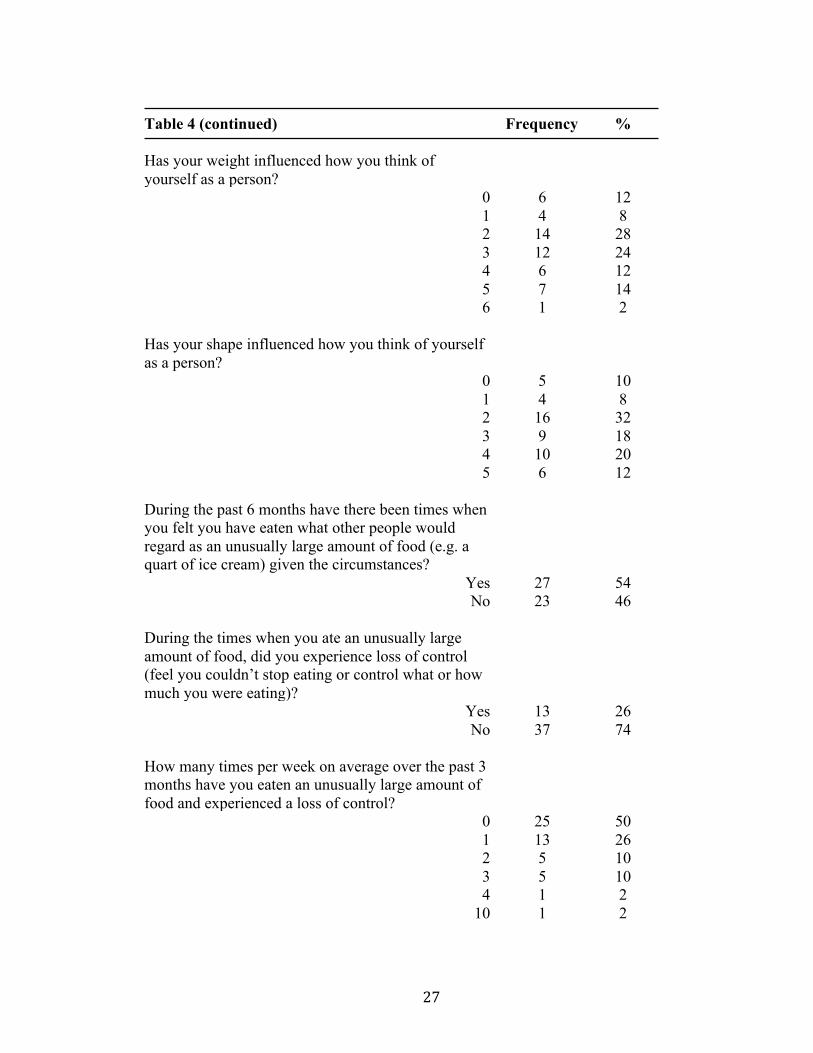
Table 4. Participant survey results (n = 50)
Question Frequency % The following 4 questions are scored from 0 = not at all to 6 = Extremely Have you ever felt fat?
0 4 8 1 5 10 2 14 28 3 9 18 4 9 18 5 9 18
Have you had a definite fear that you might gain weight or become fat?
0 3 6 1 8 16 2 9 18 3 11 22 4 7 14 5 6 12 6 6 12
27
Table 4 (continued) Has your weight influenced how you think of yourself as a person?
Frequency %
0 6 12 1 4 8 2 14 28 3 12 24 4 6 12 5 7 14 6 1 2
Has your shape influenced how you think of yourself as a person?
0 5 10 1 4 8 2 16 32 3 9 18 4 10 20 5 6 12
During the past 6 months have there been times when you felt you have eaten what other people would regard as an unusually large amount of food (e.g. a quart of ice cream) given the circumstances?
Yes 27 54 No 23 46
During the times when you ate an unusually large amount of food, did you experience loss of control (feel you couldn’t stop eating or control what or how much you were eating)?
Yes 13 26 No 37 74
How many times per week on average over the past 3 months have you eaten an unusually large amount of food and experienced a loss of control?
0 25 50 1 13 26 2 5 10 3 5 10 4 1 2
10 1 2
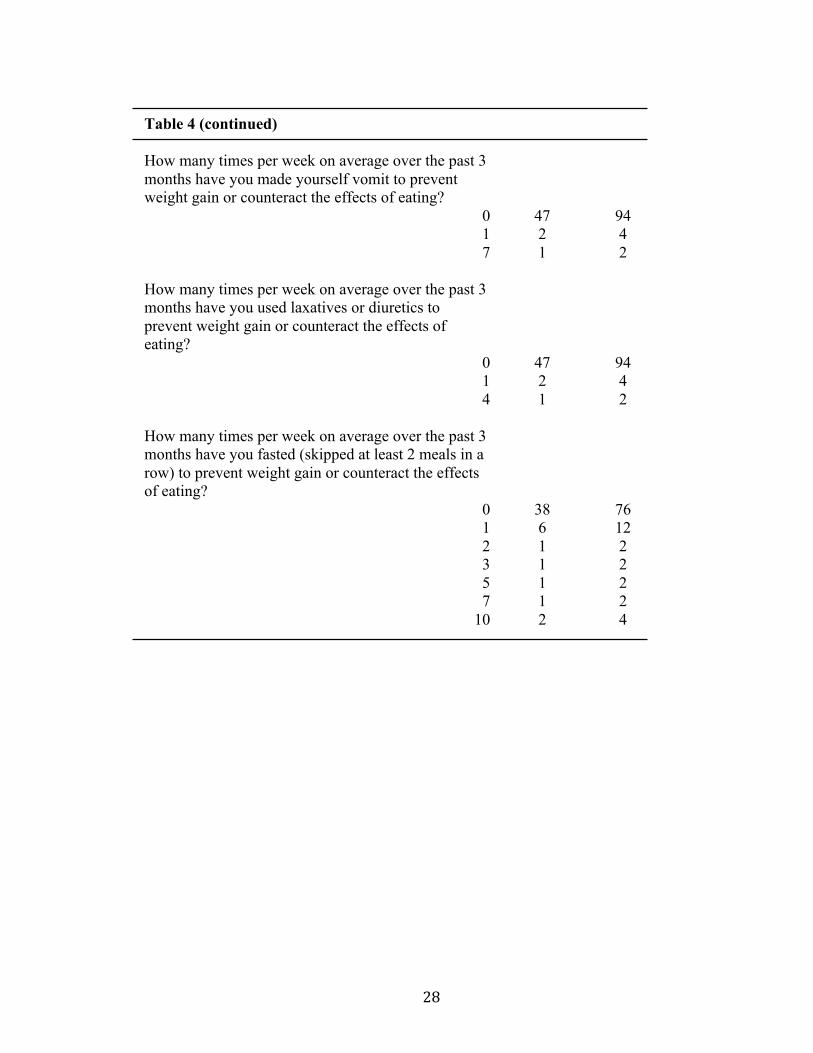
28
Table 4 (continued) How many times per week on average over the past 3 months have you made yourself vomit to prevent weight gain or counteract the effects of eating?
0 47 94 1 2 4 7 1 2
How many times per week on average over the past 3 months have you used laxatives or diuretics to prevent weight gain or counteract the effects of eating?
0 47 94 1 2 4 4 1 2
How many times per week on average over the past 3 months have you fasted (skipped at least 2 meals in a row) to prevent weight gain or counteract the effects of eating?
0 38 76 1 6 12 2 1 2 3 1 2 5 1 2 7 1 2
10 2 4

29
CHAPTER V
CONCLUSION AND DISCUSSION
This study aimed to evaluate the potential relationship between eating disorders,
menstrual irregularity, and bone mineral density in sorority women. Identification of risk
factors for low BMD in premenopausal women is useful for early prevention of
osteoporosis. Findings of this study are crucial to prevention of osteoporosis later in life.
According to the EDDS scoring scale, no participants were classified into the category of
anorexia nervosa or bulimia nervosa. Because of this, the first hypothesis (Eating
disorders will have a significant relationship with bone mineral density in college-age
women) cannot be answered. The data collected in this study can only be scored to
classify a clinical eating disorder. A quantitative method to score the risk for developing
an eating disorder does not exist. Although no participants met the Underweight BMI
classification (BMI < 18.5) or a clinical eating disorder standards based on EDDS
scoring, multiple survey answers suggested poor eating habits and distorted body image.
Eighty-two percent of participants reported feeling slightly to extremely fat,
seventy-eight percent reported a slight to extreme fear of becoming fat, and eighty
percent reported that weight had a slight to extreme influence on how they thought of
themselves. These findings support the claim of Schulken and Pinciaro (1997) and Basow
et al. (2007) that sorority women have high body dissatisfaction and strong drive for
thinness. While the vast majority reported that they did not fast to prevent weight gain,
twenty-four percent reported skipping at least two meals in a row per week to counteract
weight gain. Poor body image, coupled with fasting, may indicate a risk for future
disordered eating or eating disorders.

30
A relationship between physical activity and bone mineral density was not found
in this study. Therefore, the second hypothesis (Physical activity will have a significant
relationship with bone mineral density in college-age women) is rejected. These results
do not agree with the results of previous studies on the influence of physical activity on
bone health. Janz et al. (2014) reported early levels of physical activity to be strong
indicators on bone mineral density later in life. The Iowa Bone Development Study
conducted by Janz et al. (2014) utilized accelerometer data in order to quantify physical
activity level. In this study, only sixty-six percent of participants met the daily minimum
of physical activity recommended by ACSM; however, this information was self
reported, and exercise intensity was not quantified.
Forty-four percent of participants did not meet ACSM minimum physical activity
requirements, which may be the reason that thirty percent of participants were classified
as overweight or obese. Physical activity’s lack of influence on bone health in this study
could be a result of unknown exercise intensities. Further investigation with a more
specific survey for exercise intensity or accelerometer data could be helpful in
determining a relationship between physical activity and bone mineral density.
A relationship between menstrual cycle and bone mineral density was not
determined in this study, and therefore the hypothesis number 3 (Menstrual irregularity
will have a significant relationship with bone mineral density in college-age women) is
rejected. These present findings do not support the findings of Beals and Manore (2000)
that determined women with menstrual irregularity had significantly lower bone mineral
density t-scores than women with menstrual regularity. Although menstrual irregularity
was not a significant predictor of bone health in our participants, fifty-two percent of
31
participants had irregular menstrual cycles that may be the result of poor eating habits
according to Cobb et al. (2003), who determined that restrictive eating habits that do not
reach the clinical level of eating disorders can directly cause a disruption in menstrual
status.
Sioen et al. (2015) reported a positive association between dairy intake and bone
mineral density, and Tenta et al. determined that a dietary intervention based on calcium
significantly increased bone mineral density in postmenopausal women. In support of
these previous findings, a significant association between dairy intake and bone mineral
density was discovered in this study. Results indicate that eighty-two percent of
participants did not consume the daily recommendation of at least three servings of
calcium (NOF, 2016). Although no participants were classified to have eating disorders,
inadequate dairy intake may result from disordered eating.
Findings of this study determined BMI to have a positive relationship with BMD.
This positive correlation supports the hypothesis that an eating disorder would have a
significant effect on bone mineral density because anorexia nervosa is defined by a BMI
less than 17.5 according to EDDS (Stice et al., 2000). As participants lose weight
characteristic of a clinical eating disorder and BMI decreases, they could also lose bone
mineral density according to the results of this study.
In conclusion, this study determined that physical activity and menstrual
irregularity are not significant predictors of bone health in college-age women. The effect
of eating disorders on bone mineral density could not be determined due to the lack of
participants classified as anorexic or bulimic according to EDDS scoring standards.
However, a significant relationship did exist between dairy intake and bone mineral

32
density, and inadequate dairy intake may be a result of an eating disorder. In addition to
this claim, BMI is a significant predictor of bone mineral density in college-age women.
A low BMI may also be a result of an eating disorder. Participants exposed to an eating
disorder may experience a detrimental loss of bone mineral density due to inadequate
dairy intake and low BMI.
Further studies investigating the influence of menstrual irregularities and dietary
intake, as an indicator of disordered eating, on bone mineral density in college age,
sorority women are warranted. Habits formed in early adulthood will continue through
the remainder of life, and therefore it is important to develop healthy eating habits and
ultimate bone mineral density in order to prevent osteoporosis in elderly years.

33
LIST OF REFERENCES
Alexandraki, K. I., Syriou, V., Ziakas, P. D., Apostolopoulos, N. V., Alexandrakis, A. I.,
Piperi, C., & ... Diamanti-Kandarakis, E. (2008). The knowledge of osteoporosis
risk factors in a Greek female population. Maturitas, 59, 38-45.
doi:10.1016/j.maturitas.2007.10.008
Aree-Ue, S., & Petlamul, M. (2013). Osteoporosis Knowledge, Health Beliefs, and
Preventive Behavior: A Comparison Between Younger and Older Women Living
in a Rural Area. Health Care For Women International, 34(12), 1051-1066.
doi:10.1080/07399332.2012.736565
Basow, S. J., Foran, K. A., Bookwala, J. (2007). Body objectification, social pressure,
and disordered eating behavior in college women: The role of sorority
membership. Psychology Of Women Quarterly, 31(4), 394-400.
Beals, K. A., & Manore, M. M. (2000). Behavioral, Psychological, and Physical
Characteristics of Female Athletes With Subclinical Eating Disorders.
International Journal Of Sport Nutrition & Exercise Metabolism, 10(2), 128.
Birch, K. (2005). Female athlete triad. BMJ (Clinical Research Ed.), 330(7485), 244-246.
Central Region Eating Disorder Service. (2007). DSM IV Criteria for Eating Disorders.
Retrieved from eatingdisorders.org.nz.
Chestnut, C. H. (1989). Is Osteoporosis a Pediatric Disease? Peak Bone Mass Attainment
in the Adolescent Female. Public Health Reports (1974), 50-54.
Clausen, L. H., Rokkedal, K., & Rosenvinge, J.H. (2009). Validating the eating disorder
inventory (EDI-2) in two Danish samples: A comparison between female eating
34
disorder patients and females from the general population. European Eating
Disorders Review, 17(6), 462-467.
Cobb, K., Bachrach, L., Greendale, G., Marcus, R., Neer, R., Nieves, J., & ... Kelsey, J.
(2003). Disordered eating, menstrual irregularity, and bone mineral density in
female runners. Medicine & Science In Sports & Exercise, 35(5), 711-719.
Diamond, T., Stiel, D., Lunzer, M., Wilkinson, M., Roche, J., & Posen, S. (1990).
Osteoporosis and skeletal fractures in chronic liver disease. Gut, 31(1), 82-87.
Donaldson, A. A., & Gordon, C. M. (2015). Review: Skeletal complications of eating
disorders. Metabolism, 64, 943-951. doi:10.1016/j.metabol.2015.06.007
Garber, C. E., Blissmer, B., Deschenes, M. R., Franklin, B. A., Lamonte, M. J., Lee, I.
M., Nieman, D. C., & Swain, D. P. (2011). Quantity and quality of exercise for
developing and maintaining cardiorespiratory, musculoskeletal, and neuromotor
fitness in apparently healthy adults: guidance for prescribing exercise. Medicine
and Science in Sports and Exercise, 43(7), 1334-1359.
Garner, D. J., Olmstead M. P., Polivy, J. (1983). DEVELOPMENT AND VALIDATION
OF A MULTIDIMENSIONAL EATING DISORDER INVENTORY FOR
ANOREXIA NERVOSA AND BULIMIA. International Journal Of Eating
Disorders, 2(2), 15-34.
Gerend, M. A., Erchull, M. J., Aiken, L. S., & Maner, J. K. (2006). Reasons and risk:
Factors underlying women's perceptions of susceptibility to osteoporosis.
Maturitas, 55, 227-237. doi:10.1016/j.maturitas.2006.03.003
35
Gibson, J.H., Mitchell, A., Reeve, J., & Harries, M. G. (1999). Treatment of Reduced
Bone Mineral Density in Athletic Amenorrhea: A Pilot Study. Osteoporosis
International, 10, 284-289.
Grinspoon, S., Thomas, E., Pitts, S., Gross, E., Mickley, D., Miller, K., & ... Klibanski,
A. (2000). Prevalence and predictive factors for regional osteopenia in women
with anorexia nervosa. Annals Of Internal Medicine, 133(10), 790-794.
Janz, K. F., Letuchy, E. M., Burns, T. L., Eichenberger Gilmore, J. M., Torner, J. C., &
Levy, S. M. (2014). Objectively measured physical activity trajectories predict
adolescent bone strength: Iowa Bone Development Study. British Journal Of
Sports Medicine, 48(13), 1032-1036.
Kim, D., Navalgund, A.R., Tee, B.C., Noble, G.J., Hart, R.T., Lee, H.R. (November
2012). Increased variability of bone tissue mineral density resulting from estrogen
deficiency influences creep behavior in a rat vertebral body. Bones, 51(5). 868-
875. Retrieved from
http://eds.b.ebscohost.com.umiss.idm.oclc.org/eds/command/detail?sid=20530f35
-8dd1-41f8-b582-8415aec7ae95%40sessionmgr112&vid=5&hid=103
Kohrt, W. M., Bloomfield, S. A., Little, K. D., Nelson, M. E., & Yingling, V. R. (2004).
American College of Sports Medicine Position Stand: physical activity and bone
health. Medicine And Science In Sports And Exercise, 36(11), 1985-1996.
Meczekalski, B., Podfigurna-Stopa, A., & Katulski, K. (2013). Review: Long-term
consequences of anorexia nervosa. Maturitas, 75, 215-220.
doi:10.1016/j.maturitas.2013.04.014

36
Mikosch, P. (2014). Alcohol and bone. Wiener Medizinische Wochenschrift, 164(1/2), 15.
doi:10.1007/s10354-013-0258-5
National Association of Anorexia Nervosa and Associated Disorders. (2016). About
Eating Disorders. Retrieved from anad.org.
National Osteoporosis Foundation. (2016). Prevention and Healthy Living. Retrieved
from nof.org.
Nelson, L. (2010). The menstrual cycle in adolescents:a vital sign of bone health.
Contemporary OB/GYN, 55(3), 32-37 5p.
Paccou, J., Edwards, M. H., Ward, K., Jameson, K., Moon, R., Dennison, E., & Cooper,
C. (2015). Original Full Length Article: Relationships between bone geometry,
volumetric bone mineral density and bone microarchitecture of the distal radius
and tibia with alcohol consumption. Bones, 78122-129.
doi:10.1016/j.bone.2015.05.002
Papadopoulos, F. C., Ekbom, A., Brandt, L., & Ekselius, L. (2009). Excess mortality,
causes of death and prognostic factors in anorexia nervosa. The British Journal Of
Psychiatry, 194(1), 10-17. doi:10.1192/bjp.bp.108.054742
Pescatello, L. S., Arena, R., Rieve, D., Thompson, P. D. (2014). ACSM’s Guidelines for
Exercise Testing and Prescription. Baltimore, MD: American College of Sports
Medicine.
Ralston, S. H. (2010). Osteoporosis as an Hereditary Disease. Clinical Reviews In Bone
& Mineral Metabolism, 8(2), 68-76. doi:10.1007/s12018-010-9073-3. Retrieved
from
37
http://eds.a.ebscohost.com.umiss.idm.oclc.org/eds/command/detail?sid=62ea8b6f
-ff5f-4b7d-b349-97e3d78ea0a2%40sessionmgr4001&vid=5&hid=4111
Rikkonen, T., Sirola, J., Salovaara, K., Tuppurainen, M., Jurvelin, J. S., Honkanen, R., &
Kröger, H. (2012). Muscle strength and body composition are clinical indicators
of osteoporosis. Calcified Tissue International, 91(2), 131-138.
doi:10.1007/s00223- 012 9618-1
Schulken, E. D., & Pinciaro, P. J. (1997). Sorority women's body size perceptions and
their.. Journal Of American College Health, 46(2), 69.
Sioen, I., Michels, N., Polfliet, C., De Smet, S., D'Haese, S., Roggen, I., & ... De
Henauw, S. (2015). The influence of dairy consumption, sedentary behaviour and
physical activity on bone mass in Flemish children: a cross-sectional study. BMC
Public Health, 15(1), 1-10. doi:10.1186/s12889-015-2077-7. Retrieved from
http://eds.a.ebscohost.com.umiss.idm.oclc.org/eds/detail/detail?vid=1&sid=2a584
3af-d926-410d-90af-
77715f1d96ab%40sessionmgr4005&hid=4111&bdata=JkF1dGhUeXBlPWlwLH
VybCx1aWQmc2l0ZT1lZHMtbGl2ZSZzY29wZT1zaXRl#AN=108667297&db=
aph
Smink, F. E., van Hoeken, D., & Hoek, H. W. (2012). Epidemiology of eating disorders:
incidence, prevalence and mortality rates. Current Psychiatry Reports, 14(4), 406-
414. doi:10.1007/s11920-012-0282-y
Stice, E., Telch, C. F., & Rizvi, S. L. (2000). Development and validation of the Eating
Disorder Diagnostic Scale: A brief self-report measure of anorexia, bulimia, and

38
binge-eating disorder. Psychological Assessment, 12(2), 123-131.
doi:10.1037/1040-3590.12.2.123
Tella, S. H., & Gallagher, J. C. (2014). Review: Prevention and treatment of
postmenopausal osteoporosis. Journal Of Steroid Biochemistry And Molecular
Biology, 142(Current Views of Hormone Therapy for Management and Treatment
of Postmenopausal Women), 155-170. doi:10.1016/j.jsbmb.2013.09.008
Tenta, R., Moschonis, G., Koutsilieris, M., & Manios, Y. (2011). Calcium and vitamin D
supplementation through fortified dairy products counterbalances seasonal
variations of bone metabolism indices: the Postmenopausal Health Study.
European Journal Of Nutrition, 50(5), 341-349 9p. doi:10.1007/s00394-010-
0142-7
Torres-Costoso, A., Garcia-Marco, L., Sanchez-Lopez, M., Notario-Pacheco, B., Arias-
Palencia, N., & Martinez-Vizcaino, V. (2015). Physical Activity and Bone Health
in Schoolchildren: The Mediating Role of Fitness and Body Fat. Plos ONE, 10(4),
1-12. doi:10.137/journal.pone.0123797
Tuchendler, D., Bolanowski, M. (2014). The influence of thyroid dysfunction on bone
metabolism. Thyroid Research, 7(1), 12. doi: 10.1186/s13044-014-0012-0
Urano, T., & Inoue, S. (2014). Review: Genetics of osteoporosis. Biochemical And
Biophysical Research Communications, 452(Genomic Aspects of Common
Diseases), 287-293. doi:10.1016/j.bbrc.2014.07.141
Woodside, D. B., Garfinkel, P. E., Lin, E., Goering, P., Kaplan, A. S., Goldbloom, D. S.,
& Kennedy, S. H. (2001). Comparisons of Men With Full or Partial Eating

39
Disorders, Men Without Eating Disorders, and Women. American Journal Of
Psychiatry, 158(4), 570.
World Health Organization. (2004). Proceedings from Summary Meeting Report: WHO
Scientific Group on the Assessment of Osteoporosis at Primary Health Care
Level” (WHO Press). Geneva: Switzerland.
Yuan, Y., Chen, X., Zhang, L., Wu, J., Guo, J., Zou, D., & ... Zou, J. (2015). The roles of
exercise in bone remodeling and in prevention and treatment of osteoporosis.
Progress In Biophysics And Molecular Biology,
doi:10.1016/j.pbiomolbio.2015.11.005
Zuckerman-Levin, N., Hochberg, Z., & Latzer, Y. (2014). Bone health in eating
disorders. Obesity Reviews, 15(3), 215-223. doi:10.1111/obr.12117

40
APPENDICES

41
APPENDIX A
Consent to Participate in an Experimental Study
Title: The Effects of Eating Disorders and Menstrual Irregularity on Bone Mineral Density in Sorority Women: A Cross-Sectional Study
Investigator Advisor Rachel Robertson Martha Bass, Ph.D. Department Health, Exercise Department Health, Exercise Science, and Science, and Recreation Management Recreation Management 232 Turner Center 232 Turner Center The University of Mississippi The University of Mississippi 251-802-4510 662-915-5563
Description The purpose of this research study is to investigate the influence of menstrual irregularity and eating disorders on bone mineral density in sorority women. We will measure your height, weight, and bone mineral density (or BMD). We measure BMD with a Dual Energy X-ray Absorptiometry (DXA), a medical device that exposes you to a low dose of radiation. You will also be given a survey to complete that asks questions about your alcohol consumption, body image perception, eating habits, a brief family medical history, your participation in sports and other physical activities, and your menstrual cycle.
FEMALES: Because the radiation could harm a fetus, we are required to give you a urine pregnancy test before doing a DXA. You will provide your urine sample in a cup in the restroom. The pregnancy test must be negative for you to participate in any part of this study. DXA Scan Procedure (20 minutes): 1) Remove all metal objects, including clothing containing metal 2) Remove at least your outer clothes and change into shorts and a t-shirt or wear a
hospital gown 3) Measure height & weight 4) Lie on the DXA padded table 5) A research technician will position your body on the table 6) Lie still for about 30 seconds during each of two scans (hip and spine) 7) Receive DXA results (and an opportunity to sign a release form to fax results to
your physician) Risks and Benefits The DXA device exposes you (and any unborn fetus) to a low dose of X-ray radiation – about 1/10 of the radiation from a chest x-ray and about as much radiation as you get

42
from the sun from flying coast to coast. Some people experience anxiety during this test, just like any medical test. One benefit is that you will find out if your bone mineral density (a contributor to bone strength) is within normal limits. If your bone mineral density appears to be low, we can fax the DXA results to your physician with your written permission. Cost and Payments The questionnaires will take about 15 minutes to finish and the DXA scan should also take about 15 minutes. There are no costs for helping us with this study. Confidentiality No identifying information will be placed on the surveys. All collected data will be kept under lock and key in Dr. Bass' office and the DXA laboratory (Turner 248A). Right to Withdraw You do not have to take part in this study. If you start the study and decide that you do not want to finish, all you have to do is tell Ms. Robertson. The researchers may terminate your participation in the study without regard to your consent and for any reason, such as protecting your safety and protecting the integrity of the research data. IRB Approval This study has been reviewed by The University of Mississippi's Institutional Review Board (IRB). The IRB has determined that this study fulfills the human research subject protections obligations required by state and federal law and University policies. If you have any questions, concerns, or reports regarding your rights as a participant of research, please contact the IRB at (662) 915-7482. I have read the information above. I have been given a copy of this form. I have had an opportunity to ask questions, and I have received answers. By signing my name below I acknowledge I am 18 or older, and I understand the risks and benefits of this study. I consent to participate in this study. Signature of Date Participant Signature of Date Investigator
NOTE TO PARTICIPANTS: DO NOT SIGN THIS FORM IF THE IRB APPROVAL STAMP ON THE FIRST PAGE HAS EXPIRED.

43
APPENDIX B BMD Risk Factors Questionnaire
Please carefully complete all questions. 1. During the last 12 months, how often did you usually have any kind of drink
containing alcohol? By a drink we mean half an ounce of absolute alcohol (e.g. a 12 ounce can or glass of beer or cooler, a 5 ounce glass of wine, or a drink containing 1 shot of liquor). Choose only one.
1. Every day 2. 5 to 6 times a week 3. 3 to 4 times a week 4. twice a week 5. once a week 6. 2 to 3 times a month 7. once a month 8. 3 to 11 times in the past year 9. 1 or 2 times in the past year
2. During the last 12 months, how many alcoholic drinks did you have on a typical day when you drank alcohol?
1. 9 to 11 drinks 2. 7 to 8 drinks 3. 5 to 6 drinks 4. 3 to 4 drinks 5. 2 drinks 6. 1 drink
Over the past 3 months… Not at all Slightly Moderately Extremely 3. Have you ever felt fat? 0 1 2 3 4 5 6 4. Have you had a definite 0 1 2 3 4 5 6 fear that you might gain weight or become fat? 5. Has your weight 0 1 2 3 4 5 6 influenced how you think about (judge) yourself as a person? 6. Has your shape 0 1 2 3 4 5 6 influenced how you think about (judge) yourself as a person?
44
7. During the past 6 months have there been times when you felt you have eaten what other people would regard as an unusually large amount of food (e.g. a quart of ice cream) given the circumstances?
1. YES 2. NO
8. During the times when you ate an unusually large amount of food, did you experience loss of control (feel you couldn’t stop eating or control what or how much you were eating)?
1. YES 2. NO
9. How many TIMES per week on average over the past 3 months have you eaten an unusually large amount of food and experienced a loss of control? 0 1 2 3 4 5 6 7 8 9 10 11 12 13 14 10. How many times per week on average over the past 3 months have you made yourself vomit to prevent weight gain or counteract the effects of eating? 0 1 2 3 4 5 6 7 8 9 10 11 12 13 14 11. How many times per week on average over the past 3 months have you used laxatives or diuretics to prevent weight gain or counteract the effects of eating? 0 1 2 3 4 5 6 7 8 9 10 11 12 13 14 12. How many times per week on average over the past 3 months have you fasted (skipped at least 2 meals in a row) to prevent weight gain or counteract the effects of eating? 0 1 2 3 4 5 6 7 8 9 10 11 12 13 14 13. How many times per week on average over the past 3 months have you engaged in excessive exercise specifically to counteract the effects of overeating episodes? 0 1 2 3 4 5 6 7 8 9 10 11 12 13 14 14. Choose one category into which your menstrual cycle falls
1. I have missed 3 menstrual cycles in row in the past 12 months 2. I do not have regular monthly periods (e.g. 4-9 cycles per year) 3. I have had 10-13 cycles for the last 12 months

45
15. Was your biological mother or grandmother ever told by a doctor that she had osteoporosis, sometimes called thin or brittle bones?
1. Yes 2. No 3. I don’t know
16. Did your biological mother or grandmother ever fracture her hip?
1. Yes 2. No 3. I don’t know
17. Did you participate in high school sports?
1. Yes 2. No
I am now going to ask you how often you usually eat certain foods and drink certain beverages. When answering think about your usual diet over the past month. Tell me how often you usually ate or drank these foods per week. DO NOT include their use in cooking. 18. How often did you have chocolate milk and hot cocoa? ______ Time(s) per week 19. How often did you have milk to drink or in cereal? (Do not count small amounts of milk added to coffee or tea.) ______ Time(s) per week 20. How often did you have yogurt or frozen yogurt? ______ Time(s) per week 21. How often did you have ice cream, ice milk, and milk shakes? ______ Time(s) per week 22. How often did you have cheese, all types including American, Swiss, cheddar, and cottage cheese? ______ Time(s) per week 23. How often did you have pizza, calzone, and lasagna? ______ Time(s) per week 24. How often did you have cheese dishes such as macaroni and cheese, cheese nachos, cheese enchiladas, and quesadillas? ______ Time(s) per week 25. Have you ever been on a high protein diet (Atkins, South Beach, etc.)?
1. Yes 2. No

46
26. If yes, how long have you been on this diet?
1. More than 1 year 2. 8-12 months 3. 6-8 months 4. 3-6 months 5. 1-3 months
27. During your childhood, approximately how many servings of milk did you drink each day?
1. None (0 servings) 2. 1 serving each day 3. 2 servings each day 4. 3 servings each day 5. 4 or more servings each day

47
APPENDIX C Bone-Specific Physical Activity Questionnaire (BPAQ)
Subject ID: _______________________________ Date: Please list the sports or other physical activities (be as specific as possible) you participated in regularly during the last 12 months and indicate the average frequency (sessions per week) and duration (time of each session). Activity: ______________ Frequency (per week): ______ Duration (per session): _____
Activity: ______________ Frequency (per week): ______ Duration (per session): _____
Activity: ______________ Frequency (per week): ______ Duration (per session): _____
Activity: ______________ Frequency (per week): ______ Duration (per session): _____
Activity: ______________ Frequency (per week): ______ Duration (per session): _____
Activity: ______________ Frequency (per week): ______ Duration (per session): _____
Activity: ______________ Frequency (per week): ______ Duration (per session): _____
Activity: ______________ Frequency (per week): ______ Duration (per session): _____
Activity: ______________ Frequency (per week): ______ Duration (per session): _____

48
APPENDIX D Script for Positive Pregnancy Test The pregnancy test appears to be positive. We cannot do a bone density scan on you because of this positive reading. We recommend that you see your physician. If you find that our pregnancy test was incorrect and can provide a written statement from your physician that you are not pregnant and would like to receive a bone scan, you may contact Rachel Robertson at 251-802-4510 or [email protected].

49
APPENDIX E
Chapter Announcement
I am conducting a study that will relate eating disorders and menstrual irregularity to osteoporosis in sorority women. To be able to participate in this study, you cannot be on any form of birth control. Participants who agree to participate will be given a survey, which asks questions about alcohol intake, diet, body image, menstrual cycle, family medical history, and calcium intake. Participants will also be asked to list the sports or physical activities that they have participated in regularly during the last 12 months. I will be organizing participants into two groups of women: those with regular menstrual cycles and those with irregular menstrual cycles. Following the surveys and grouping, I will measure bone mineral density with a DXA, a medical device that exposes you to a low dose of radiation. Due to this radiation, each subject will be given a pregnancy test prior to the scan to ensure that no harm can be done to an unborn fetus. A DXA scan allows you to see if your bone mineral density is within normal limits. This scan averages $150, but you will receive one free of charge. After collecting this data, I will analyze a correlation between menstrual irregularity and eating disorders and relate them to bone mineral density. You will be informed of all results.
50
APPENDIX F