the effects of early experiences at home and pre-school on gains in english and mathematics in...
TRANSCRIPT

Schwerpunkt
Abstract: Few studies have explored whether learning experiences during the pre-school period differentiate rates of growth in academic skills during primary school. Here, findings are present-ed from a longitudinal study on a representative sample of 2,800 children in the uk. this study examined the contribution of the early years home Learning environment (hLe) and pre-school quality to children’s academic progress between ages 7 and 11 (i.e. years 2 and 6 of primary school) in english and mathematics. results indicate that a rich early hLe leads to accelerated progress in english and mathematics between 7 and 11 years. Quality rather than mere attendance was the pre-school factor which promoted academic progress. children who had a stronger ‘pro-file’ at school accelerated away from other children over the primary period. The benefits of high quality home and pre-school environments appear to be long-lasting and cumulative, improving children’s developmental trajectories by enabling them to make greater learning gains compared to their peers who experienced lower pre-school quality.
Keywords: Academic skills · home learning environment · pre-school quality
Z erziehungswiss (2013) 16:277–301DOI 10.1007/s11618-013-0364-6
The effects of early experiences at home and pre-school on gains in English and mathematics in primary school: a multilevel study in England
Kathy Sylva · Pam Sammons · Lydia L. S. Chan · Edward Melhuish · Iram Siraj-Blatchford · Brenda Taggart
Online publiziert: 09.07.2013 © Springer Fachmedien wiesbaden 2013
prof. k. Sylva, phD () · prof. Dr. p. Sammons, phD · Dr. L. L. S. chanDepartment of education, university of Oxford, 15 norham Gardens, Oxford OX2 6pY, united kingdome-mail: [email protected]
prof. Dr. p. Sammons, phDe-mail: [email protected]
Dr. L. L. S. chane-mail: [email protected]
prof. Dr. e. MelhuishInstitute for the Study of children, Families & Social Issues, Birkbeck, university of London, Malet Street, London wc1e 7hX, united kingdome-mail: [email protected]
prof. Dr. I. Siraj-Blatchford · B. taggartDepartment of early Years and primary education, Institute of education, university of London, 20 Bedford way, London wc1h 0AL, united kingdome-mail: [email protected]
B. taggarte-mail: [email protected]

278 K. Sylva et al.
Die Wirkung früher häuslicher und vorschulischer Erfahrungen auf den Lernerfolg in Englisch und Mathematik in der Grundschule: eine mehrstufige Studie in England
Zusammenfassung: nur wenige Studien haben untersucht, inwiefern vorschulische Lernerfah-rungen das Tempo der Aneignung akademischer Fertigkeiten in der Grundschule beeinflussen. hier werden die ergebnisse einer Langzeitstudie in Großbritannien mit einer repräsentativen Aus-wahl von 2.800 kindern vorgestellt. Diese Studie untersuchte den Beitrag der frühkindlichen häuslichen Lernumgebung und der Vorschulqualität auf den akademischen Fortschritt der kinder in den Fächern englisch und Mathematik in der Altersstufe 7 bis 11 (d. h. in den klassenstu-fen 2 bis 6 der englischen Grundschule). Die ergebnisse legen nahe, dass eine anregende frühe häusliche Lernumgebung zu schnelleren Lernfortschritten in englisch und Mathematik bei sie-ben- bis elf-jährigen kindern führt. Dabei war die Anwesenheit an sich nicht der entscheidende vorschulische Faktor für den akademischen Fortschritt, sondern die Qualität der frühen Lerner-fahrungen. Kinder mit einem stärkeren schulischen „Profil“ ließen die anderen Kinder im Verlauf der Grundschule weit hinter sich. Die Vorteile einer hochwertigen häuslichen und vorschulischen umgebung sind anscheinend dauerhaft und kumulativ, sie fördern den entwicklungsverlauf der kinder und ermöglichen es ihnen, größere Lernerfolge als gleichaltrige kinder zu erzielen, die eine niedrigere Qualität der vorschulischen erfahrungen erlebt haben.
Schlüsselwörter: Akademische Fertigkeiten · häusliche Lernumgebung · Vorschulqualität
1 Introduction
One of the most significant insights about educational attainment in recent years is that educational outcomes in adolescence and even beyond can be traced back to academic skills at school entry…Academic skills at school entry can, in turn, be traced to capabilities seen during the preschool years and the experiences in and out of the home that foster their development (Shonkoff and phillips 2000, p. 125).
At the turn of the Millennium, Shonkoff and phillips (2000) pointed to the powerful and lasting effects of early experiences. Decades of research across a range of disciplines (e.g., neuroscience, genomics, and the behavioural and social sciences) continue to point to the early years as a time of both great opportunity and considerable risk. For this rea-son they provide a window of opportunity with potential to alter children’s trajectories (Shonkoff 2010). while few would disagree with Brooks-Gunn (2003) that it is “magical thinking” to expect the short-term benefits of early interventions to last indefinitely, the promise of early education to combat disadvantage remains enticing. there is growing evidence examining the promotive role of early learning opportunities, especially those provided by centre-based education and care, and a popular avenue of investigation is the presence and persistence of pre-school effects on young children’s development (Anders et al. 2010; Barnett and hustedt 2005; european child care and education Study Group 1999; hall et al. 2009; Magnuson et al. 2007a, b; tietze 1987). The benefits of high qual-ity home and pre-school environments are often apparent at school entry (Magnuson et al. 2004; Magnuson et al. 2007a; Mashburn et al. 2008; nIchD early child care research network 2003; nIchD early child care research network and Duncan 2003; Sammons

279The effects of early experiences at home and pre-school …
et al. 2004a; Shonkoff and phillips 2000), and recent research suggests that children who arrive with stronger pre-academic ‘profiles’ tend to maintain their advantageous posi-tions throughout primary school (claessens et al. 2009). there is much evidence that early achievement predicts later achievement, which is unsurprising as skill acquisition is generally thought to be cumulative, involving mastering new skills and improving exist-ing abilities (Duncan et al. 2007). where studies disagree, however, is whether early education provides children with an initial boost in school readiness skills which tend to “fade-out” as less-skilled peers catch up (Barnett 1985; hamre and pianta 2005; Lazar et al. 1982; Mckey et al. 1985), or alternatively, whether certain pre-school experiences can enhance children’s learning capacity, enabling them to make greater progress during primary school. In other words, the impact of pre-school may be evident in terms of chil-dren’s academic scores in late primary school, but also with respect to their relative gains (progress) over the primary school years.
hindman et al. (2010, p. 238) summarise this well: “Beyond initial status, examining the rate of a child’s growth is important because it shows the child’s success in absorbing what families and schools have to offer”. this paper contributes to the literature by presenting findings from the Effective Pre-school and Primary Education (EPPE) Project, a longitu-dinal study on a representative sample of 3,000 children in england (Sylva et al. 2010a).
there are strong theoretical reasons to believe that the quality of children’s early education experiences will have a long-term impact, and some rigorous research stud-ies have tested this. One of the most well-known longitudinal studies, the u.S. nIchD Study of early child care reported that when predicting cognitive-linguistic functioning, the higher the quality of care, the better the children’s cognitive and language develop-ment at 15 and 24 months, and school readiness at 36 months (nIchD early child care research network 2000). the same pattern of effects was found at age four and a half years (nIchD early child care research network 2002, 2003, 2006), and it was still apparent on standardised tests of maths and until age 8 years (nIchD early child care research network 2005). however, these positive effects eventually disappeared by the fifth grade (around age 11), when the only detectable quality effect was on vocabulary scores (Belsky 2009; Belsky et al. 2007).
Similarly, a recent study on head Start children using the Family and Child Experi-ences Survey (FAceS) found that, after taking into account characteristics of the child and family, classroom factors did not predict children’s initial literacy and mathematics skills or their development over time (hindman et al. 2010). Findings from the Early Childhood Longitudinal Study – Kindergarten Cohort (ecLS-k) were likewise discour-aging: although pre-school (ages 3–4) was associated with higher reading and mathemat-ics skills at school entry, by the spring of first grade, around 70–80 % of the estimated cognitive gains had largely dissipated, though they were generally larger and more endur-ing for disadvantaged children (Magnuson et al. 2007a). Furthermore, most of the initial pre-school advantage was quickly eliminated by placing children in small classrooms and those which provide high levels of reading instruction, thus allowing those who were cared for exclusively by their parents during pre-school to “catch up”. Hence, the authors conclude that subsequent classroom experiences largely determine whether the beneficial effects of pre-school persist through primary school (Magnuson et al. 2007b).

280 K. Sylva et al.
even for studies that have found links between the quality of early education and children’s long-term achievement, the effects are typically small (Magnuson and Shager 2010). For example, it was reported that a one standard deviation increase in programme process quality was associated with only a 0.06 standard deviation increase in cognitive development (nIchD early child care research network and Duncan 2003). In their meta-analysis of 20 studies and secondary analysis of four pre-school datasets, Burchinal et al. (2009) also produced similar findings: for all ages, children in higher quality early care and education programmes tended to have modestly higher academic and language outcomes, controlling for background characteristics. As expected, for those from low-income families, children benefitted most when quality is in the good to high range. Fur-thermore, measures of specific educational practices seem to be better predictors of child outcomes than global quality measures (Burchinal et al. 2009).
the research questions addressed in this paper are:
1. Do early learning experiences at home and pre-school predict children’s academic attainment in english and mathematics at the end of primary school (age 11)?
2. Do early learning experiences at home and pre-school predict children’s academic progress between age 7 and age 11?
3. how does pre-school quality interact with early years learning experiences at home to shape children’s academic achievement?
Although the first question is routinely studied in many papers, the second is not and is important because it tests continuing value-added gains rather than attainment adjusted for demographic variables.
2 Method
the eppe project is europe’s largest longitudinal investigation into the effects of pre-school and primary education on children’s developmental outcomes. It was commis-sioned by the u.k. government and adopts an ‘educational effectiveness’ design using mixed methods (Sammons et al. 2005). using multilevel modelling, the research team sought to establish the contribution of child, family, home environment, pre-school and primary school factors to children’s cognitive and social development and how this varies from ages 3 to 11 years at age 11 (Sammons 2010).
2.1 Sample
A stratified random sample of 141 pre-school centres was drawn in 1997 from five regions across england, covering a range of socioeconomic and geographical areas (including ethnic diversity and rural/urban). equal numbers of centres were randomly sampled from the six most common types of provision at the time: nursery classes in primary schools, voluntary playgroups, local government day nurseries, private day nurseries, and ‘integrated’ centres that combined education, care and health. random sampling led to a broadly representative sample of more than 2,800 children who were recruited at age 3 and followed until school entry at age 5, when they were joined by 310 ‘home’ children
281The effects of early experiences at home and pre-school …
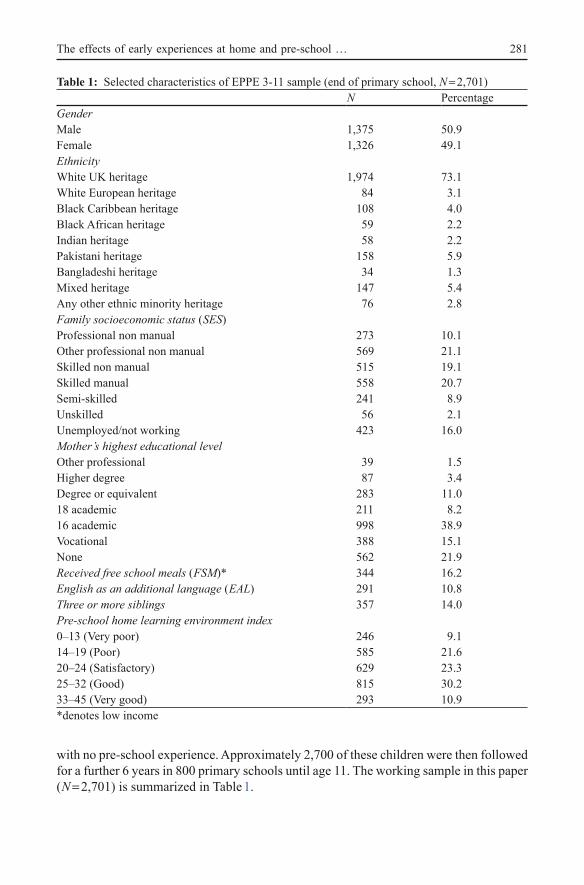
with no pre-school experience. Approximately 2,700 of these children were then followed for a further 6 years in 800 primary schools until age 11. the working sample in this paper ( N = 2,701) is summarized in table 1.
Table 1: Selected characteristics of eppe 3-11 sample (end of primary school, N = 2,701)N percentage
GenderMale 1,375 50.9Female 1,326 49.1Ethnicitywhite uk heritage 1,974 73.1white european heritage 84 3.1Black caribbean heritage 108 4.0Black African heritage 59 2.2Indian heritage 58 2.2pakistani heritage 158 5.9Bangladeshi heritage 34 1.3Mixed heritage 147 5.4Any other ethnic minority heritage 76 2.8Family socioeconomic status ( SES)professional non manual 273 10.1Other professional non manual 569 21.1Skilled non manual 515 19.1Skilled manual 558 20.7Semi-skilled 241 8.9unskilled 56 2.1unemployed/not working 423 16.0Mother’s highest educational levelOther professional 39 1.5higher degree 87 3.4Degree or equivalent 283 11.018 academic 211 8.216 academic 998 38.9Vocational 388 15.1none 562 21.9Received free school meals ( FSM)* 344 16.2English as an additional language ( EAL) 291 10.8Three or more siblings 357 14.0Pre-school home learning environment index0–13 (Very poor) 246 9.114–19 (poor) 585 21.620–24 (Satisfactory) 629 23.325–32 (Good) 815 30.233–45 (Very good) 293 10.9*denotes low income

282 K. Sylva et al.
this sample consisted of equal numbers of boys and girls, and in terms of ethnicity, 74 % of the parents considered themselves of White British heritage. For 11 % of the children, English was an additional language (EAL). For family structure, 14 % of the children lived in large families with 3 or more siblings, and the quality of the pre-school home learning environment (HLE) varied (41 % were in the good or very good range, while 9 % had rather poor home learning according to parents’ self-reports at interview). Family Socioeconomic Status (SES) was diverse, with over 30 % of the families in the two highest (professional) occupational categories and 16 % reported as unemployed or not working. Furthermore, as a low income or poverty indicator, 16 % of the children were eligible for free school meals (FSM) (Sammons et al. 2008).
2.2 Measures
In addition to collecting demographic data through parental interviews and question-naires, a developmental profile was established for each child, which included cogni-tive assessments at key milestones. the quality of the pre-school centres was assessed through observation-based rating scales, and the quality of the home Learning environ-ment (hLe) was assessed through seven interview questions (Melhuish et al. 2008).
English and maths assessments. children’s results on the statutory national curriculum Assessments in english and mathematics were collected at the end of years 2 and 6. In this study of differential progress in primary education, national year 2 tests served as the baseline and outcome measures were test scores in year 6. Although such national assess-ments are usually reported in broad ordinal levels in year 2, data were also collected on individual test scores, which allowed for the creation of more finely differentiated mea-sures (i.e. decimalised levels) for the multilevel analysis (Sammons et al. 2004b). Fur-thermore, to ensure comparability over several child cohorts, an internal standardisation and normalisation procedure was applied to the decimalised data (Mean = 100; SD = 15). this effectively created age-adjusted scores across school years; hence children’s age does not feature as a significant predictor of attainment or progress in the models.
the assessments in years 2 and 6 were highly correlated for english ( r = 0.73) and mathematics ( r = 0.70), as well as (concurrently) between the two subjects ( r = 0.69 in both years).
Home learning environment measures. From parental interviews when the children were three years, an index of the early years home Learning environment (hLe) was constructed, consisting of seven items rated on an eight-point scale (0 = not at all to 7 = very frequent):
1. being read to,2. painting and drawing,3. going to the library,4. playing with letters or numbers,5. learning activities with the alphabet,6. learning activities with numbers or shapes,7. playing with songs, poems or nursery rhymes.

283The effects of early experiences at home and pre-school …
the index had a range of 0–49, and was normally distributed with a mean of 23.42 ( SD = 7.71) (Melhuish et al. 2008). It was significantly correlated r = 0.38 with children’s cognitive ability at pre-school entry, r = 0.32 with family SeS, and r = 0.35 with parents’ educational levels (Melhuish et al. 2001). Despite these moderate correlations consistent with findings from earlier studies, there were highly educated parents with high SES who provided a poor hLe, and there were less educated parents of lower SeS who provided a rich hLe (Siraj-Blatchford 2010; Siraj-Blatchford and Mayo 2013). this means that the study can differentiate the net impact of the HLE while controlling for other influences such as parents’ qualifications and family SES.
the hLe was again surveyed in early primary school via a parental questionnaire, which sought information on activities such as reading with the child, taking the child out on educational outings, computing activities, sport activities, dance, etc. this primary phase hLe measure constituted four factors: Home computing, One-to-one interaction, Expressive play, and Enrichment outings, which were also tested in the hierarchical mod-els; however, the impact of the early years hLe remained a stronger predictor than the hLe measures derived in primary school (year 2 hLe).
Pre-school quality measures. two environmental rating scales were used to assess the quality of all pre-school centres. the early childhood environment rating Scale – revised (ecerS-r) (harms et al. 1998) assessed the global quality of early childhood education and care, ranging from furnishings to the quality of social interactions. each item is rated on a seven point scale (1 = inadequate, 3 = minimal/adequate, 5 = good, 7 = excellent). the psychometric strength of this instrument has been demonstrated in past studies, and high inter-rater reliability was established between research officers in each of the five regions of the eppe study (kappas ranging from 0.75 to 0.90). For details of the ecerS measures see Sylva et al. (2006). the mean score of ecerS-r was 4.34 (SD 1.02) and ecerS-e was 3.12 (SD 1.00).
The EPPE team considered the ECERS-R to be insufficiently focused on educational practices in england. Although ‘Developmentally Appropriate practice’ (Bredekamp and copple 1997) applies in the u.k., the english pre-school curriculum also concentrates on ‘emergent cognitive skills’, especially the emergence of literacy, numeracy, and scientific thinking (Soucacou and Sylva 2010). An english ‘extension’, the ecerS-e (Sylva et al. 2003, 2010b), was developed after wide consultation with experts in early childhood and piloting in the field. The ECERS-E was a supplement to the ECERS-R (Sylva et al. 2007). the ecerS-e contains three curricular subscales: Literacy, Numeracy, and Science, one for each cognitive domain in the english curriculum, and a fourth Diversity subscale to assess the extent to which the first three are differentiated with respect to children of different genders, cultural groups, and levels of ability. Like the ecerS-r, each of the four subscales is comprised of a range of items describing ‘quality’ of the specific type of provision, and the same seven-point rating system is used. high inter-rater reliability was again established in all regions (kappas ranging from 0.83 to 0.97) (Sylva et al. 2006).
together, the two observational measures assessed not only the structural elements (e.g. space and materials) of the pre-school centres, but also the educational and care processes that children experience on a daily basis (Sylva et al. 1999). the total ecerS-r and ecerS-e scores were normally distributed, and met parametric assumptions.

284 K. Sylva et al.
their total scores were strongly correlated ( r = 0.78), although the subscale ‘Personal Care Routines’ showed lower correlations in the cross tabs calculation. Most of the sub-scales were also moderately correlated, although average pre-school centre scores on the ecerS-r tended to be higher than the ecerS-e (Sylva et al. 1999).
Primary school academic effectiveness measures. Measures of primary school academic effectiveness were created for each core curriculum subject: english, mathematics, and Science. these are independently derived contextually value-added measures based upon national assessment data for all primary schools in england linking age 7 and age 11 results (i.e. full national pupil cohorts in years 2 and 6) (Melhuish et al. 2006). the aca-demic success of each individual school in promoting its pupils’ progress for three con-secutive years (2002–2004). the availability of these measures allows us to test the joint impact of both pre-school quality and primary school academic effectiveness on attain-ment at age 11.
2.3 Analytical Strategy
two types of multilevel models were used to analyse pupils’ attainment and their prog-ress. contextualised models take account of the clustering in the data (using the pri-mary school attended as the level 2 identifier, and the child as level1). They partition the variance in pupil attainment between these levels. A comprehensive range of predictors (child, family and hLe) were then tested. the analyses identify the unique (net) contribu-tion of the hLe and pre-school to variation in children’s academic attainment, controlling for other background characteristics (e.g. child’s gender, birth weight, number of siblings, early developmental and behavioural problems, mother tongue, ethnicity, family socio-economic status, parents’ education and income). Value-added multi-level models, on the other hand, were also used to investigate children’s progress between 7 and 11 years by controlling for their prior attainment measured in national assessments at age 7 years, as well as the same set of demographic and environmental covariates. these models also identify the amount of variation in the outcome data that is due to the clustering of chil-dren at the primary school level within schools (Goldstein 2011).
the contextualised models of english and mathematics attainment measured in year 6 are presented first, along with the combined or interaction effects, followed by the value-added models of progress in these subjects between years 2 and 6. Space constraints preclude a detailed discussion of all the individual ‘net’ predictors’ relative effects, those pertinent to the research questions are presented, and the full results can be found in the appendices. note that for categorical predictors, any category can be used as a reference group without affecting the overall calculations (e.g. model’s variance, model fit etc.) For measures such as family SES or parents’ qualification, the lowest or the highest perform-ing group was chosen as a reference category, and in other cases, the largest category would usually be selected (e.g. white uk as the reference group for ethnicity). In testing pre-school quality effects, either the home group or the low pre-school quality group serves as the comparator because these were of special policy interest. In addition, the results suggested that the home and low quality pre-school groups showed more similar results in terms of attainment.

285The effects of early experiences at home and pre-school …
3 Results
3.1 Academic attainment at year 6
The contextualised models first tested the net impact on attainment of different child, fam-ily, and hLe factors (See table 2 and 6). It is recognised that family SeS, for example, is itself related to mother’s educational level and income, and to other child factors such as birth weight. thus in these models we identify the net contribution of the various factors (e.g. family SeS or income) in predicting attainment whilst controlling for all other predic-tors. Likewise, measures of the hLe are also moderately related to the various other fac-tors like SES or qualifications and also the gender of the child (on average girls experience a better quality early years hLe than boys when measured by our scale). the contextual-ised models show which set of factors, taken together, provides the best set of predictors of children’s attainment at age 11 in english and mathematics (not shown here). the results illustrate the equity gap in achievement for different children at age 11 years. For example, parental SES and educational level remain significant predictors of children’s attainment, showing the continuing powerful effects of social disadvantage (previous analyses con-ducted at younger ages for this sample also identified strong effects for these measures during the pre-school period and up to age 7; Sammons et al. 2004a, 2004b).
Demographic effects. In this study, taken together, background factors are found to account for around 24 % of the total variance in English attainment scores at the end of year 6, and approximately 20 % for mathematics scores Gender differences in favour of girls were identified for English (ES = 0.29), but boys took the lead in mathematics (eS = 0.19). children with very low birth weight (i.e. born weighing 1,001–1,500 g) had significantly lower attainments in both subjects (English: ES = 0.47; maths: eS = 0.48) than their normal birth weight peers (i.e. born weighing 2,500 g or above). Although present at younger ages, the effects of large family sizes seem to have disappeared, but children who had early developmental problems (reported at the start of pre-school) still lagged behind in academic attainment (english: eS = 0.38; maths: eS = 0.32; both for more than one developmental problems). The small group of children identified by teachers as still requiring english-as-Additional-Language (eAL) support continued to show lower scores in both subjects, and interestingly, the ‘net’ effect was stronger for mathematics than eng-lish (eS = 0.64 and 0.23 respectively). For ethnicity, the relationships (in comparison with children of White UK heritage) indicated no significant difference amongst the groups, except for children of Indian heritage who showed particularly high attainment in math-ematics (eS = 0.45), again consistent with earlier findings (Sammons et al. 2004b).
In terms of family background, significant net effects on academic attainment were found for family SeS, parents’ education levels, eligibility for FSM (as measure of pov-erty), and family income. their respective effect sizes were generally moderate, as shown in table 2, but mother’s education level had particularly strong and positive effects, (english, eS = 0.76 for degree versus no qualification, and a similar figure ES = 0.71 for mathematics). Although children whose parents belong to the highest occupational social class (as measure of family SES) showed significantly higher attainment levels, parental

286 K. Sylva et al.
comparator coef s.e. Z p eS p < 0.05Gender: boys Gender: girls 3.58 0.51 6.96 0.00 0.29 *Free school meals: none
Missing − 0.54 0.75 − 0.73 0.47 − 0.04FSM − 7.30 1.88 − 3.89 0.00 − 0.59 *
eAL: yes eAL: missing 8.91 1.90 4.69 0.00 0.72 *eAL 2.79 0.77 3.63 0.00 0.23 *
Development problems: none
Missing 3.02 3.53 0.86 0.39 0.24At least one − 2.95 0.82 − 3.59 0.00 − 0.24 *More than one − 4.71 2.46 − 1.92 0.06 − 0.38
Birth weight: normal
Birth weight: missing 0.70 1.99 0.35 0.73 0.06Birth weight: very low ≤ 1,500 g
− 5.78 2.22 − 2.60 0.01 − 0.47 *
Birth weight: low 1,501–2,500 g
− 0.74 1.03 − 0.72 0.47 − 0.06
Income: none Missing 2.74 1.68 1.63 0.10 0.22£ 2,500–14,999 0.88 1.21 0.73 0.46 0.07£ 17,500–29,999 2.20 1.26 1.75 0.08 0.18£ 30,000–37,499 1.85 1.38 1.34 0.18 0.15£ 37,500–67,499 2.83 1.34 2.12 0.03 0.23 *£ 67,500–132,000 + 3.26 1.84 1.77 0.08 0.26
Family socio economic sta-tus: highest
Other professional non manual
− 0.43 1.07 − 0.40 0.69 − 0.03
Skilled non manual − 0.78 1.20 − 0.65 0.52 − 0.06Skilled manual − 4.25 1.25 − 3.40 0.00 − 0.34 *Semi skilled − 3.26 1.44 − 2.26 0.02 − 0.26 *unskilled − 2.97 2.15 − 1.38 0.17 − 0.24unemployed: not working
− 3.08 1.58 − 1.95 0.05 − 0.25
Missing 0.76 2.89 0.26 0.79 0.06Mother’s educational qualification: none
Missing − 2.65 2.12 − 1.25 0.21 − 0.21Vocational 2.93 0.94 3.12 0.00 0.24 *16 academic 2.91 0.77 3.79 0.00 0.23 *18 academic 5.00 1.16 4.30 0.00 0.40 *Degree or equivalent 9.40 1.21 7.80 0.00 0.76 *higher degree 8.18 1.86 4.39 0.00 0.66 *Other professional 7.57 2.26 3.36 0.00 0.61 *
Father’s educational qualification: none
Missing 1.57 0.84 1.88 0.06 0.13Vocational 2.86 1.02 2.80 0.01 0.23 *16 academic 1.56 0.86 1.80 0.07 0.1318 academic 1.99 1.23 1.62 0.11 0.16Degree or equivalent 3.74 1.20 3.13 0.00 0.30 *higher degree 4.87 1.80 2.71 0.01 0.39 *Other professional 2.12 2.68 0.79 0.43 0.17
Table 2: Summary of contextualised model predicting academic attainment in english at year 6 (only the significant variables are shown)

287The effects of early experiences at home and pre-school …
education was a stronger net predictor than either income or SeS for children’s academic outcomes at age 11.
Home learning environment effects. the early years hLe index was a powerful predictor of children’s cognitive skills during pre-school, and maintained its important influence on academic attainment at age 11, even after children had experienced 6 years of primary schooling. the ‘net’ effects for english and mathematics between the highest and the lowest scoring hLe groups were r = 0.69 and r = 0.42 respectively. Interestingly, a high early years hLe had a similar positive effect on child outcomes as having a mother with a university degree (versus one with no qualifications), and as noted previously the correla-tion between the two variables was only modest ( r = 0.33). the early years hLe proved to be a stronger predictor of attainment at age 11 in both subjects than the hLe measures collected later when children were in primary school. this suggests that early learning opportunities are the most influential in shaping subsequent patterns of attainment.
Pre-school effects. After controlling for the impact of background factors, multi level mod-els were used to test whether any pre-school measure continued to predict attainment at age 11. There were significant net effects on academic attainment in English and mathemat-ics in year 6 for the most basic indicator: pre-school attendance (eS = 0.22 and eS= 0.26 respectively for those who had attended a preschool compared with the ‘home’ group; See table 3). This is consistent with previous findings in year 2 (Sammons et al. 2004b).
to test pre-school quality effects, the sample was divided into groups of children whose pre-school experience could be classified as ranging from no quality (i.e. the ‘home’ group, approximately 10 % of the sample) through low (15 %), medium (52 %) and high quality (23 %), based on individual pre-school centres’ ECERS-E scores. Previous analy-ses have shown that ecerS-e scores were better predictors of children’s cognitive out-comes than ecerS-r scores, even on children’s cognitive skills during pre-school. this
comparator coef s.e. Z p eS p < 0.05early years home learning index: lowest
Missing − 0.32 1.96 − 0.16 0.87 − 0.0314–19 1.84 1.01 1.83 0.07 0.1520–24 2.42 1.02 2.37 0.02 0.20 *25–32 4.24 1.02 4.16 0.00 0.34 *33–43 8.53 1.23 6.91 0.00 0.69 *
key stage 1 home learning environment: computers: high
Low 2.08 1.03 2.01 0.04 0.17 *Low–Moderate 2.19 0.93 2.36 0.02 0.18 *Moderate–high 0.59 0.87 0.69 0.49 0.05
key stage 1 home learning environment: interactions: high
Missing − 0.53 1.72 − 0.31 0.76 − 0.04Low 2.22 1.08 2.06 0.04 0.18 *Low–Moderate 2.29 0.93 2.45 0.01 0.18 *Moderate–high 2.26 0.88 2.57 0.01 0.18 *
*Statistically significant at 0.05 level
Table 2: (continued)
288 K. Sylva et al.
may be because the ECERS-E quality assessment focused on specific pedagogical or cur-ricular quality, while the latter assessed more global child care quality (Sylva et al. 2006).
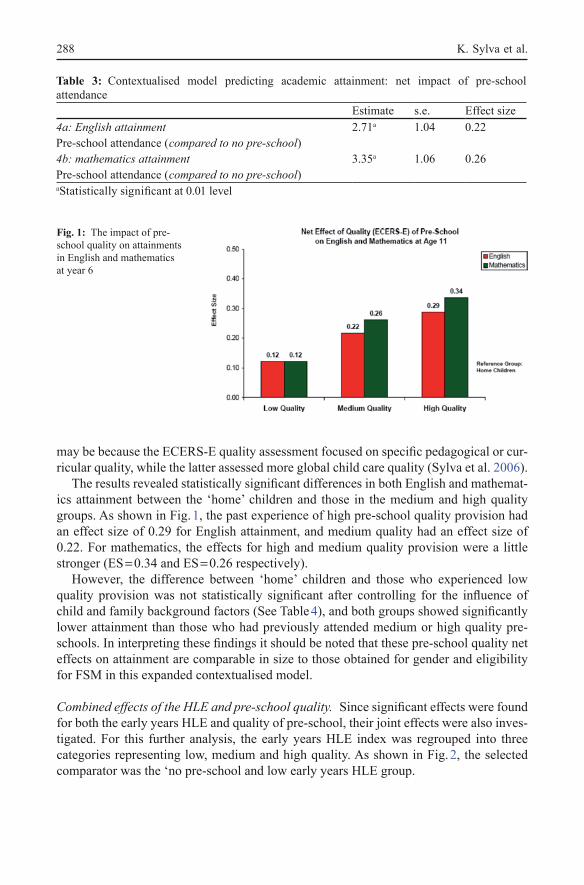
The results revealed statistically significant differences in both English and mathemat-ics attainment between the ‘home’ children and those in the medium and high quality groups. As shown in Fig. 1, the past experience of high pre-school quality provision had an effect size of 0.29 for english attainment, and medium quality had an effect size of 0.22. For mathematics, the effects for high and medium quality provision were a little stronger (eS = 0.34 and eS = 0.26 respectively).
however, the difference between ‘home’ children and those who experienced low quality provision was not statistically significant after controlling for the influence of child and family background factors (See table 4), and both groups showed significantly lower attainment than those who had previously attended medium or high quality pre-schools. In interpreting these findings it should be noted that these pre-school quality net effects on attainment are comparable in size to those obtained for gender and eligibility for FSM in this expanded contextualised model.
Combined effects of the HLE and pre-school quality. Since significant effects were found for both the early years hLe and quality of pre-school, their joint effects were also inves-tigated. For this further analysis, the early years hLe index was regrouped into three categories representing low, medium and high quality. As shown in Fig. 2, the selected comparator was the ‘no pre-school and low early years hLe group.
Table 3: contextualised model predicting academic attainment: net impact of pre-school attendance
estimate s.e. effect size4a: English attainment 2.71a 1.04 0.22pre-school attendance ( compared to no pre-school)4b: mathematics attainment 3.35a 1.06 0.26pre-school attendance ( compared to no pre-school)aStatistically significant at 0.01 level
Fig. 1: the impact of pre-school quality on attainments in english and mathematics at year 6

289The effects of early experiences at home and pre-school …
For english attainment, children with low early years hLe gained an advantage over ‘home’ children who had attended any pre-school, but this was particularly noticeable for those who had attended high quality centres (eS = 0.44). children with medium hLe also enjoyed an additional benefit in terms of attainment at age 11 from previous pre-school attendance, although the extra boost of ‘high quality’ provision was not as great. children who had experienced a high early years hLe and had attended a medium or high quality pre-school showed the strongest positive net long-term benefit (ES = 0.61 and eS = 0.58 respectively). Although the ‘home’ children and those who attended low quality provision were also found to have benefitted from high early years HLE (with comparable net effect sizes of 0.37), their boost in later in attainment at age 11 was not as great as that found for children with low early years hLe who had attended a high quality pre-school. In other words, from this analysis the compensatory mechanism of high quality pre-schools seems to be stronger than that from high quality home learning environments. however, lower quality pre-school experiences did not offer much boost to those with a low early years hLe.
Table 4: contextualised model predicting academic attainment: net impact of pre-school qualityestimate s.e. effect Size
5a: english attainmentpre-school quality ( compared to Low quality)no pre-school − 1.51 1.24 − 0.12Medium quality 1.17 0.82 0.09high quality 2.05a 0.94 0.175b: mathematics attainmentpre-school quality ( compared to Low quality)no pre-school − 1.58 1.25 − 0.12Medium quality 1.82a 0.82 0.14high quality 2.78b 0.95 0.21aStatistically significant at 0.05 levelbStatistically significant at 0.01 level
Fig. 2: combined impact of early years hLe and pre-school quality on english attainment at year 6

290 K. Sylva et al.
For mathematics attainment, a similar pattern of results was found. children with low early years HLE demonstrated significantly higher attainment in year 6 if they had previ-ously attended high quality pre-schools (eS = 0.51), and those with medium early years HLE showed smaller, but significant, long-term pre-school quality effects as well. Fur-thermore, ‘home’ children with medium early years hLe also showed better attainment than their counterparts who experienced low early years hLe (eS = 0.25). In contrast, children in the high Early years HLE group showed greater benefit from medium and high quality pre-schools (eS = 0.54 and 0.51 respectively) compared with ‘home’ children who had experienced a high early years hLe (eS = 0.25).
3.2 Academic progress between years 2 and 6
After the contextualised analyses of children’s attainment at age 11 value-added multi level models were computed to establish which factors also predicted academic progress between years 2 and 6 of primary school (See table 5 and 7). we may interpret differ-ences in children’s cognitive progress over the four-year period as a possible reflection of their individual learning capacity; we suggest that those who make greater progress than predicted by their prior attainment and background characteristics show greater learning capacity while those who make less progress than predicted show reduced capacity.
Demographic and HLE effects. For English, girls made significantly greater progress than boys (eS = 0.23) between years 2 and 6. this was also the case for children with highly qualified mothers (ES = 0.48) and those who had experienced a good hLe in their early years (eS = 0.30). conversely, children with two or more early developmental problems (eS = − 0.37), and those who grew up in low SES families (ES = − 0.29) made significantly less progress over the same time period. Some ethnic differences were also found to be statistically significant (e.g. Bangladeshi pupils made the greatest gains (ES = 0.51). how-ever, due to small numbers, the results should be interpreted with considerable caution.
For mathematics, boys (eS = 0.13), Indian (eS = 0.45), pakistani (eS = 0.31) and Ban-gladeshi children (eS = 0.49), as well as those with highly educated mothers (eS = 0.49 for those with degrees, and eS = 0.66 for those with higher degrees) made greater progress. The family SES effects were smaller and only statistically significant for the ‘skilled non-manual’ group (eS = 0.22). children who still required eAL support in year 6 (eS = 0.38) had also made significantly less progress in mathematics, which indicates that adequate english skills remain important for academic success. Again, children who experienced a high early years hLe also showed better mathematics progress (eS = 0.30), with the same strength of effect as that identified for the analysis of progress in English.
Pre-school effects. Following the same analytical strategy, the impact of different mea-sures of pre-school experience on children’s relative academic progress was investigated. Interestingly, pre-school attendance alone did not predict better progress in either english or mathematics across years 2–6, despite being associated with superior attainment in both subjects in year 6. nevertheless, there is evidence that pre-school quality (again based on ecerS-e scores) did predict differential progress. children who had previ-ously attended a high quality pre-school made significantly greater progress between

291The effects of early experiences at home and pre-school …
Table 5: Summary of value-added model predicting academic progress in english from years 2–6 (only the significant variables are shown)comparator experimental group coef s.e. Z p eS P < 0.05english year 2 continuous variable 0.68 0.02 41.73 0.00 2.12Gender: boys Gender: girls 2.16 0.41 5.25 0.00 0.23 *ethnicity: u.k. white heritage
white european heritage
0.72 1.20 0.60 0.55 0.08
Black caribbean heritage
0.63 1.11 0.57 0.57 0.07
Black African heritage
0.06 1.53 0.04 0.97 0.01
Any other ethnic minority heritage
1.63 1.30 1.25 0.21 0.18
Indian heritage 1.20 1.56 0.77 0.44 0.13pakistani heritage 1.72 1.20 1.44 0.15 0.19Bangladeshi heritage 4.66 2.00 2.32 0.02 0.51 *Mixed race heritage 0.47 0.93 0.50 0.61 0.05 *
Family socio economic sta-tus: highest
Other professional non manual
0.07 0.85 0.08 0.94 0.01
Skilled non manual − 0.56 0.95 − 0.59 0.56 − 0.06Skilled manual − 2.05 0.99 − 2.08 0.04 − 0.22 *Semi skilled − 0.93 1.15 − 0.81 0.42 − 0.10unskilled − 1.56 1.75 − 0.89 0.37 − 0.17unemployed: not working
− 2.70 1.26 − 2.14 0.03 − 0.29 *
Missing 0.90 2.45 0.37 0.71 0.10Mother’s educational qualification: none
Missing − 0.62 1.68 − 0.37 0.71 − 0.07Vocational 1.94 0.75 2.58 0.01 0.21 *16 academic 1.16 0.62 1.88 0.06 0.1318 academic 1.67 0.93 1.79 0.07 0.18Degree or equivalent 4.46 0.98 4.57 0.00 0.48 *higher degree 2.77 1.50 1.85 0.06 0.30Other professional 3.59 1.75 2.06 0.04 0.39 *
early years home learning index: lowest
Missing − 0.61 1.59 − 0.38 0.70 − 0.0714–19 0.30 0.81 0.37 0.71 0.0320–24 0.29 0.83 0.35 0.72 0.0325–32 0.78 0.83 0.94 0.35 0.0833–43 2.80 1.00 2.80 0.01 0.30 *
key stage 1 home learning environment: computers: high
Missing 0.38 1.37 0.28 0.78 0.04Low 2.09 0.81 2.57 0.01 0.23 *Low–Moderate 1.30 0.73 1.78 0.08 0.14Moderate–high − 0.02 0.68 − 0.02 0.98 0.00Low 0.30 0.73 0.41 0.68 0.03Low–Moderate 0.35 0.69 0.51 0.61 0.04Moderate–high 0.68 0.02 41.73 0.00 2.12
*Statistically significant at 0.05 level

292 K. Sylva et al.
years 2 and 6 compared to ‘home’ children for both english (eS = 0.23) and mathematics (eS = 0.20) (Fig. 3).
In short, for the two core academic subjects, after controlling for relevant child and family factors, both the early years hLe and the experience of higher pre-school qual-ity are significant positive factors that predict better absolute attainment in late primary school, as well as greater relative progress between years 2 and 6.
4 Discussion and conclusion
As shown above, the eppe study has provided new evidence that the learning environ-ments in the early years (both at home and in the pre-school) remain important in shaping later cognitive outcomes. they continue to predict both children’s academic attainment and their progress in primary school. children who enjoyed a better early years hLe prior to formal schooling shower higher attainment outcomes and made greater gains in both subjects over the four-year period than those who had experienced less stimulating home environments in the early years. As for the long-term effects of centre-based pre-school education, attendance alone (irrespective of quality) was found to still be associated with superior attainment in english and mathematics at the end of primary school. however, pre-school attendance on its own was not a predictor of greater progress in either subject in primary school. Rather the findings show that only high quality pre-school centres appear to produce what we may interpret as a ‘transformative’ effect of enabling a child to make more academic gains; this conclusion is consistent for both progress in english and mathematics. It must be emphasised that the ecerS-e is quite a precise measure of pre-school classroom process quality, with subscales specifically focused on curricu-lar provision in emergent literacy and numeracy, which may explain why other studies using only the ecerS-r (i.e. a more global or comprehensive measure of instructional quality) report no statistically significant effects of pre-school quality on children’s later learning (hindman et al. 2010). As suggested by Burchinal et al. (2009), it is possible that “existing measures of quality are not detecting adequately the dimensions of interac-tions and the environment that are most strongly linked to children’s outcomes. Refining and strengthening measures of quality using psychometric techniques could result in the
Fig. 3: net effect of pre-school quality on academic progress in english between years 2 and 6 (ages 7–11)

293The effects of early experiences at home and pre-school …
detection of stronger effects, especially if new measures are designed to tap specific prac-tices that align with desired child outcomes” (p. 4). Thus, research findings in this regard are likely to be highly related to the suitability and validity of the quality measures used. those capturing more nuance may reveal a clearer pattern of associations. the ecerS-e measure identifies greater variation in pre-school quality in important areas not covered in other instruments.
The findings on the joint effects of early years HLE and quality of pre-school attended on later attainment outcomes are likewise intriguing, as a high quality early years hLe seems to compensate for the effects of attending poorer quality pre-schools. Moreover high quality pre-school helps support the later attainment of children who had poorer quality of hLe experiences. these ‘promotive’ effects suggest that high quality early education experiences in the home and pre-school not only equip young children with a stronger pre-academic ‘profile’ at school entry, but also enhance their capacity to learn through the primary years. It is difficult to specify the precise components of children’s capacity to learn and eppe did not directly measure these. however, it is likely to consist of both cognitive-linguistic and socio-emotional skills.
It was not possible to use cross-classified multi level models to investigate pre- and primary school effects simultaneously because there were only small numbers of chil-dren in most of the 800 + primary schools to which the pre-school sample transferred. Furthermore, as with most studies of this nature, the research design does not allow causal inferences to be drawn, and the statistical models only offer generalizations about groups that may not hold true for individual children (Sylva et al. 2011). Qualitative case studies of pre-schools and of individual children and families conducted as part of the eppe research complement the quantitative analyses, and the case studies are able to shed light on the rich supportive interactions between adults and children, as well as any ‘local’ circumstances of individual pre-schools and these formed an important part of the mixed methods eppe design (Siraj-Blatchford 2002; Siraj-Blatchford et al. 2002). taken together, the quantitative and qualitative findings from the mixed methods research indi-cate that the benefits of early learning experiences can be long-lasting and cumulative, capable of altering children’s learning trajectories (Sylva et al. 2010a).
Although it is difficult to extrapolate findings from the EPPE sample to other popula-tions outside england, there are a few broad implications for policy and practice that can be considered: Firstly, the results suggest that policy should continue to support universal pre-school education for all children. In england, for example, all three- and four-year-olds are entitled to 15 hours of free nursery education for 38 weeks of the year, until they reach compulsory school age (i.e. their fifth birthday). The U.K. government is now fund-ing free places for ‘disadvantaged’ two-year-olds through the early Intervention Grant. Secondly, both policymakers and leading practitioners in the field should strive to ensure high quality pre-school education, especially in terms of curricular provision. this may be achieved through a myriad of means, most notably by investing in teacher training and professional development, providing statutory guidance on a research-based curriculum (e.g. the uk early Years Foundation Stage), and developing systems to provide ongoing programme review. Apart from being robust research tools, environmental rating scales such as the ecerS-e have also been successfully applied in regional and centre-based formative evaluations to improve practice (Mathers et al. 2007). thus, the ecerS-e

294 K. Sylva et al.
could be used to inform more effective professional development activities for teachers and caregivers of young children. Finally, the consistent beneficial effects of the early years hLe imply that parents and carers should be supported through effective parent-ing programmes and interventions (Melhuish et al. 2008), perhaps with a home-visiting service for those who wish it. clearly, the ideal combination is high quality home learn-ing and high quality pre-school education, which has implications for promoting greater equity in educational attainment. high quality will also raise educational standards and promote inclusion (Sammons 2010).
Of course we cannot expect education to fully compensate for all society’s inequi-ties. It may be too much to expect interventions in the early years to serve as permanent “inoculations” against later poor quality schooling experiences and family disadvantage. nonetheless, the potency of early education seems to depend very much on its quality; these results suggest that high quality home and pre-school environments can have a lasting impact on children’s learning capacity, and thereby subsequent academic achieve-ment. This does not imply, however, that such benefits derived prior to school entry can fully compensate for the adverse influence of other key background factors, such as par-ents’ education, family SeS or low income, so the pre-existing achievement gap may remain, albeit narrowed. nonetheless, the present study demonstrates that the effects of high quality early learning experiences on attainment persist up to age 11 and can also affect progress. hence, although there is no magic bullet to be found in early intervention, there remains evidence that early educational experiences at home and pre-school can have positive effects, even when we control for the negative impact of early childhood disadvantage. thus interventions that support parenting and that raise the quality of pre-school have the potential to mitigate the impact of disadvantage and so transform young lives.
Acknowledgements: the eppe 3-11 project is a major longitudinal study funded by the u.k. Department for education. the research would not be possible without co-operation of six Local Authorities and many pre-school centres, primary schools, children and parents.

295The effects of early experiences at home and pre-school …
Appendix
comparator coef s.e. Z p eS SigAge continuous variable 0.02 0.07 0.34 0.73 0.00Gender: boys Gender: girls 3.58 0.51 6.96 0.00 0.29 *Free school meals: none
Missing − 0.54 0.75 − 0.73 0.47 − 0.04FSM − 7.30 1.88 − 3.89 0.00 − 0.59 *
eAL: yes eAL: missing 8.91 1.90 4.69 0.00 0.72 *eAL 2.79 0.77 3.63 0.00 0.23 *
Development problems: none
Missing 3.02 3.53 0.86 0.39 0.24At least one − 2.95 0.82 − 3.59 0.00 − 0.24 *More than one − 4.71 2.46 − 1.92 0.06 − 0.38
Birth weight: normal
Birth weight: missing
0.70 1.99 0.35 0.73 0.06
Birth weight: very low ≤ 1,500 g
− 5.78 2.22 − 2.60 0.01 − 0.47 *
Birth weight: low 1,501–2,500 g
− 0.74 1.03 − 0.72 0.47 − 0.06
ethnicity: u.k. white heritage
white european heritage
− 2.06 1.48 − 1.39 0.16 − 0.17
Black caribbean heritage
2.17 1.36 1.60 0.11 0.18
Black African heritage
0.42 1.81 0.23 0.82 0.03
Any other ethnic mi-nority heritage
0.34 1.59 0.21 0.83 0.03
Indian heritage 3.11 1.89 1.64 0.10 0.25pakistani heritage 1.77 1.38 1.28 0.20 0.14Bangladeshi heritage
4.47 2.32 1.92 0.06 0.36
Mixed race heritage 1.09 1.14 0.96 0.34 0.09Income: none Missing 2.74 1.68 1.63 0.10 0.22
£ 2,500–14,999 0.88 1.21 0.73 0.46 0.07£ 17,500–29,999 2.20 1.26 1.75 0.08 0.18£ 30,000–37,499 1.85 1.38 1.34 0.18 0.15£ 37,500–67,499 2.83 1.34 2.12 0.03 0.23 *£ 67,500–132,000 + 3.26 1.84 1.77 0.08 0.26
Family socio economic sta-tus: highest
Other professional non manual
− 0.43 1.07 − 0.40 0.69 − 0.03
Skilled non manual − 0.78 1.20 − 0.65 0.52 − 0.06Skilled manual − 4.25 1.25 − 3.40 0.00 − 0.34 *Semi skilled − 3.26 1.44 − 2.26 0.02 − 0.26 *unskilled − 2.97 2.15 − 1.38 0.17 − 0.24unemployed: not working
− 3.08 1.58 − 1.95 0.05 − 0.25
Missing 0.76 2.89 0.26 0.79 0.06
Table 6: Full contextualised model predicting academic attainment in english at year 6

296 K. Sylva et al.
comparator coef s.e. Z p eS SigMother’s educational qualification: none
Missing − 2.65 2.12 − 1.25 0.21 − 0.21Vocational 2.93 0.94 3.12 0.00 0.24 *16 academic 2.91 0.77 3.79 0.00 0.23 *18 academic 5.00 1.16 4.30 0.00 0.40 *Degree or equivalent 9.40 1.21 7.80 0.00 0.76 *higher degree 8.18 1.86 4.39 0.00 0.66 *Other professional 7.57 2.26 3.36 0.00 0.61 *
Father’s educational qualification: none
Missing 1.57 0.84 1.88 0.06 0.13Vocational 2.86 1.02 2.80 0.01 0.23 *16 academic 1.56 0.86 1.80 0.07 0.1318 academic 1.99 1.23 1.62 0.11 0.16Degree or equivalent 3.74 1.20 3.13 0.00 0.30 *higher degree 4.87 1.80 2.71 0.01 0.39 *Other professional 2.12 2.68 0.79 0.43 0.17
early years home learn-ing index: lowest
Missing − 0.32 1.96 − 0.16 0.87 − 0.0314–19 1.84 1.01 1.83 0.07 0.1520–24 2.42 1.02 2.37 0.02 0.20 *25–32 4.24 1.02 4.16 0.00 0.34 *33–43 8.53 1.23 6.91 0.00 0.69 *
key stage 1 home learn- ing environ-ment: comput-ers: high
Low 2.08 1.03 2.01 0.04 0.17 *Low–Moderate 2.19 0.93 2.36 0.02 0.18 *Moderate–high 0.59 0.87 0.69 0.49 0.05
key stage 1 home learn- ing environ-ment: interac-tions: high
Missing − 0.53 1.72 − 0.31 0.76 − 0.04Low 2.22 1.08 2.06 0.04 0.18 *Low–Moderate 2.29 0.93 2.45 0.01 0.18 *Moderate–high 2.26 0.88 2.57 0.01 0.18 *
*Statistically significant at 0.05 level
Table 6: (continued)

297The effects of early experiences at home and pre-school …
comparator experimental group coef s.e. Z Sig eS Sigenglish year 2 continuous variable 0.68 0.02 41.73 0.00 2.12Age continuous variable 0.01 0.06 0.14 0.89 0.00Gender: boys Gender: girls 2.16 0.41 5.25 0.00 0.23 *Free school meals: none
Missing − 0.32 0.61 − 0.52 0.60 − 0.03no FSM − 2.35 1.48 − 1.59 0.11 − 0.26
eAL: yes Missing − 1.99 6.86 − 0.29 0.77 − 0.22no 0.89 0.62 1.44 0.15 0.10
Development problems: none
Missing 1.31 2.85 0.46 0.65 0.14At least one − 0.86 0.65 − 1.32 0.19 − 0.09More than one − 0.37 2.00 − 0.18 0.86 − 0.04
Birth weight: normal
Birth weight: missing − 1.19 1.60 − 0.74 0.46 − 0.13Birth weight: very low ≤ 1,500 g
− 0.03 1.76 − 0.01 0.99 0.00
Birth weight: low 1,501–2,500 g
0.15 0.83 0.17 0.86 0.02
ethnicity: u.k. white heritage
white european heritage 0.72 1.20 0.60 0.55 0.08Black caribbean heritage 0.63 1.11 0.57 0.57 0.07Black African heritage 0.06 1.53 0.04 0.97 0.01Any other ethnic minor-ity heritage
1.63 1.30 1.25 0.21 0.18
Indian heritage 1.20 1.56 0.77 0.44 0.13pakistani heritage 1.72 1.20 1.44 0.15 0.19Bangladeshi heritage 4.66 2.00 2.32 0.02 0.51 *Mixed race heritage 0.47 0.93 0.50 0.61 0.05 *
Income: none Income: Missing 0.34 1.34 0.25 0.80 0.04£ 2,500–14,999 0.35 0.96 0.37 0.71 0.04£ 17,500–29,999 − 0.07 1.00 − 0.07 0.95 − 0.01£ 30,000–37,499 − 0.79 1.09 − 0.72 0.47 − 0.09£ 37,500–67,499 0.55 1.06 0.52 0.61 0.06£ 67,500–132,000 + 0.41 1.46 0.28 0.78 0.04
Family socio economic sta-tus: highest
Other professional non manual
0.07 0.85 0.08 0.94 0.01
Skilled non manual − 0.56 0.95 − 0.59 0.56 − 0.06Skilled manual − 2.05 0.99 − 2.08 0.04 − 0.22 *Semi skilled − 0.93 1.15 − 0.81 0.42 − 0.10unskilled − 1.56 1.75 − 0.89 0.37 − 0.17unemployed: not working − 2.70 1.26 − 2.14 0.03 − 0.29 *Missing 0.90 2.45 0.37 0.71 0.10
Mother’s educational qualification: none
Missing − 0.62 1.68 − 0.37 0.71 − 0.07Vocational 1.94 0.75 2.58 0.01 0.21 *16 academic 1.16 0.62 1.88 0.06 0.1318 academic 1.67 0.93 1.79 0.07 0.18Degree or equivalent 4.46 0.98 4.57 0.00 0.48 *higher degree 2.77 1.50 1.85 0.06 0.30Other professional 3.59 1.75 2.06 0.04 0.39 *
Table 7: Full value-added model predicting academic progress in english from years 2–6

298 K. Sylva et al.
References
Anders, Y., Sammons, p., taggart, B., Sylva, k., Melhuish, e., & Siraj-Blatchford, I. (2010). the influence of child, family, home factors and pre-school education on the identification of spe-cial educational needs at age 10. British Educational Research Journal, 37(3), 421–441.
Barnett, W. S. (1985). Benefit-cost analysis of the Perry Preschool Program and its policy implica-tions. Educational Evaluation and Policy Analysis, 7, 333–342.
Barnett, W. S., & Hustedt, J. T. (2005). Head start’s lasting benefits. Infants & Young Children, 18(1), 16–24.
Belsky, J. (2009). Quality, quantity and type of child care: effects on child development in the uS. In G. Bentley & r. Mace (eds.), Substitute parents: Biological and social perspectives on alloparenting in human societies (pp. 304–324). new York: Berghahn Books.
Belsky, J., Vandell, D. L., Burchinal, M., clarke-Stewart, k. A., Mccartney, k., Owen, M. t., & the nIchD early child care research network (2007). Are there long-term effects of early child care? Child Development, 78(2), 681–701.
Bredekamp, S., & copple, c. (1997). Developmentally appropriate practice in early childhood programs. washington, Dc: national Association for the education of Young children.
comparator experimental group coef s.e. Z Sig eS SigFather’s educational qualification: none
Missing 0.28 0.67 0.43 0.67 0.03Vocational 0.88 0.80 1.09 0.28 0.1016 academic 0.16 0.69 0.23 0.82 0.0218 academic 0.60 0.98 0.61 0.54 0.06Degree or equivalent 0.73 0.95 0.77 0.44 0.08higher degree 1.59 1.44 1.10 0.27 0.17Other professional 0.57 2.15 0.27 0.79 0.06
early years home learning index: lowest
Missing − 0.61 1.59 − 0.38 0.70 − 0.0714–19 0.30 0.81 0.37 0.71 0.0320–24 0.29 0.83 0.35 0.72 0.0325–32 0.78 0.83 0.94 0.35 0.0833–43 2.80 1.00 2.80 0.01 0.30 *
key stage 1 home learning environment: computers: high
Missing 0.38 1.37 0.28 0.78 0.04Low 2.09 0.81 2.57 0.01 0.23 *Low–Moderate 1.30 0.73 1.78 0.08 0.14Moderate–high − 0.02 0.68 − 0.02 0.98 0.00
key stage 1 home learning environment: interactions: high
Missing 0.93 0.85 1.10 0.27 0.10Low 0.30 0.73 0.41 0.68 0.03Low–Moderate 0.35 0.69 0.51 0.61 0.04Moderate–high 0.68 0.02 41.73 0.00 2.12
All the predictors that turned out to be significant predictors or predictors improving model fit of year 6 attainment have been kept in the model*Statistically significant at 0.05
Table 7: (continued)
299The effects of early experiences at home and pre-school …
Bronfenbrenner, u. (1979). The ecology of human development. cambridge: harvard university press.
Brooks-Gunn, J. (2003). Do you believe in magic?: what we can expect from early childhood intervention programs. Social Policy Report, XVII(1), 1–16.
Burchinal, p., kainz, k., cai, k., tout, k., Zaslow, M., Martinez-Beck, I., & rathgeb, c. (2009). Early care and education quality and child outcomes. Washington, DC: Office of Planning, research and evaluation, u.S. Department of health and human Services.
Claessens, A., Duncan, G., & Engel, M. (2009). Kindergarten skills and fifth-grade achievement: evidence from the ecLS-k. Economics of Education Review, 28(4), 415–427.
Duncan, G. J., Dowsett, c. J., claessens, A., Magnuson, k., huston, A. c., klebanov, p., pagani, L. S., Feinstein, L., engel, M., Brooks-Gunn, J., Sexton, h., Duckworth, k., & Japel, c. (2007). School readiness and later achievement. Developmental Psychology, 43(6), 1428–1446.
european child care and education Study Group. (1999). School-age assessment of child develop-ment: Long-term impact of pre-school experiences on school success, and family-school rela-tionships. report written by wolfgang tietze, Jutta hundertmark-Mayser and hans-Günther roßbach. report submitted to: european union DG XII: Science, research and Development. rtD Action: targeted Socio-economic research. Brüssel: eu.
Goldstein, h. (2011). Multilevel Statistical Models (4th ed.). chicester: wiley.hall, J., Sylva, k., Melhuish, e., Sammons, p., Siraj-Blatchford, I., & taggart, B. (2009). the role
of pre-school quality in promoting resilience in the cognitive development of young children. Oxford Review of Education, 35(3), 331–352.
Hamre, B. K., & Pianta, R. (2005). Can instructional and emotional support in the first-grade classroom make a difference for children at risk of school failure? Child Development, 76(5), 949–967.
harms, t., clifford, r. M., & cryer, D. (1998). Early Childhood Environmental Rating Scale, Revised Edition (ECERS-R). new York: teachers college press.
hindman, A. h., Skibbe, L. e., Miller, A., & Zimmerman, M. (2010). ecological contexts and early learning: contributions of child, family, and classroom factors during head start, to literacy and mathematics growth through first grade. Early Childhood Research Quarterly, 25(2), 235–250.
Lazar, I., Darlington, r. B., Murray, h., royce, J., & Snipper, A. (1982). Lasting effects of early education: A report of the consortium for Longitudinal Studies. Monographs of the Society for Research in Child Development, 47, Serial no. 195, 2–3.
Magnuson, k. A., & Shager, h. (2010). early education: progress and promise for children from low-income families. Children and Youth Services Review, 32(9), 1186–1198.
Magnuson, k. A., Meyers, M. k., ruhm, c. J., & waldfogel, J. (2004). Inequality in preschool education and school readiness. American Educational Research Journal, 41(1), 115–157.
Magnuson, k. A., ruhm, c., & waldfogel, J. (2007a). Does prekindergarten improve school prepa-ration and performance? Economics of Education Review, 26(1), 33–51.
Magnuson, k. A., ruhm, c., & waldfogel, J. (2007b). the persistence of preschool effects: Do subsequent classroom experiences matter? Early Childhood Research Quarterly, 22(1), 18–38.
Mashburn, A. J., pianta, r. c., hamre, B. k., Downer, J. t., Barbarin, O. A., Bryant, D., Burchinal, M., early, D. M., & howes, c. (2008). Measures of classroom quality in prekindergarten and children’s development of academic, language, and social skills. Child Development, 79(3), 732–749.
Mathers, S., Linskey, F., Seddon, J., & Sylva, k. (2007). using quality rating scales for profes-sional development: experiences from the uk. International Journal of Early Years Educa-tion, 15(3), 261–274.
Mckey, r. h., condelli, L., Ganson, h., Barnett, B. J., Mcconkey, c., & plantz, M. c. (1985). The impact of head start on children, families and communities. washington, Dc: cSr Incorpo-rated for the head Start Bureau, Administration for children, Youth and Families, u.S. Depart-ment of health and human Services.

300 K. Sylva et al.
Melhuish, e., Sylva, k., Sammons, p., Siraj-Blatchford, I., & taggart, B. (2001). Technical paper 7— The Effective Provision of Pre-School Education (EPPE) Project: Social/behavioural and cognitive development at 3–4 years in relation to family background. London: Dfee & Insti-tute of education, university of London.
Melhuish, e., romaniuk, h., Sammons, p., Sylva, k., Siraj-Blatchford, I., & taggart, B. (2006). The effectiveness of primary schools in England in key stage 2 for 2002, 2003 and 2004: Full report. London: Institute of education, university of London.
Melhuish, e., phan, M. B., Sylva, k., Sammons, p., Siraj-Blatchford, I., & taggart, B. (2008). effects of the home learning environment and preschool center experience upon literacy and numeracy development in early primary school. Journal of Social Issues, 64(1), 95–114.
nIchD early child care research network (2000). the relation of child care to cognitive and language development. Child Development, 71(4), 960–980.
nIchD early child care research network (2002). early child care and children’s development prior to school entry: results from the nIchD study of early child care. American Educational Research Journal, 39(1), 133–164.
nIchD early child care research network (2003). Does quality of child care affect child out-comes at age 4½? Developmental Psychology, 39(3), 451–469.
nIchD early child care research network (2005). early child care and chlidren’s development in the primary grades: Follow-up results from the nIchD study of early child care. American Educational Research Journal, 42(3), 537–570.
nIchD early child care research network (2006). child-care effect sizes for the nIchD study of early child care and youth development. American Psychologist, 61(2), 99–116.
nIchD early child care research network, & Duncan, G. J. (2003). Modeling the impacts of child care quality on children’s preschool cognitive development. Child Development, 74(5), 1454–1475.
Sammons, p. (2010). the eppe research design: An educational effectiveness focus. In k. Sylva, e. Melhuish, p. Sammons, I. Siraj-Blatchford, & B. taggart (eds.), Early childhood matters: Evidence from the effective pre-school and primary education project (pp. 24–43). London: routledge.
Sammons, p., elliot, k., Sylva, k., Melhuish, e., Siraj-Blatchford, I., & taggart, B. (2004a). the impact of pre-school on young children’s cognitive attainments at entry to reception. British Educational Research Journal, 30(5), 691–712.
Sammons, p., Sylva, k., Melhuish, e. c., Siraj-Blatchford, I., taggart, B., elliot, k., & Marsh, A. (2004b). The Effective Provision of Pre-School Education (EPPE) project: Technical paper 11—report on the continuing effects of pre-school education at age 7. London: DfeS & Insti-tute of education, university of London.
Sammons, p., Siraj-Blatchford, I., Sylva, k., Melhuish, e., taggart, B., & elliot, k. (2005). the effects of pre-school provision: using mixed methods in the eppe research. International Journal of Research Methods: Special Issue on Mixed Methods in Educational Research, 8, 207–224.
Sammons, p., Sylva, k., Melhuish, e., Siraj-Blatchford, I., taggart, B., & hunt, S. (2008). Effective Pre-school and Primary Education 3-11 Project (EPPE 3-11): Influences on children’s attain-ment and progress in key stage 2: Cognitive outcomes in year 6. research report no. DcSF-rr048. nottingham: DcSF publications.
Shonkoff, J. p. (2010). Building a new biodevelopmental framework to guide the future of early childhood policy. Child Development, 81(1), 357–367.
Shonkoff J. p., & phillips D. A. (eds.). (2000). From neurons to neighborhoods: The science of early childhood development. washington, D.c: national Academy press.
Siraj-Blatchford, I. (2002). Effective Provision of Pre-School Education: Case studies (EPPE). Technical paper 10. London: DFeS.

301The effects of early experiences at home and pre-school …
Siraj-Blatchford, I. (2010). Learning in the home and in school: how working class children suc-ceed against the odds. British Educational Research Journal, 36(3), 463–482.
Siraj-Blatchford, I., & Mayo, A. (2013). Social class and educational inequality: The impact of parents and schools. cambridge: cambridge university press.
Siraj-Blatchford, I., Sylva, k., Muttock, S., Gilden, r., & Bell, D. (2002). Researching effective pedagogy in the early years, DfES research report 365. London: hMSO, Queens’ printer.
Soucacou, e. p., & Sylva, k. (2010). Developing observation instruments and arriving at inter-rater reliability for a range of contexts and raters: the early childhood environment rating scales. In e. tucker, G. walford, & M. Viswanathan (eds.), The sage handbook of measurement: How social scientists generate, modify, and validate indicators and scales (pp. 61–85). London: Sage publications.
Sylva, k., Siraj-Blatchford, I., Melhuish, e., Sammons, p., taggart, B., evans, e., Dobson, A., Jea-vons. M., Lewis, k., Morahan. M., & Sadler. S. (1999). The Effective Provision of Pre-School Education (EPPE) project: Technical paper 6—characteristics of the centres in the EPPE Sample: Observation profiles. London: Dfee & Institute of education, university of London.
Sylva, k., Siraj-Blatchford, I., & taggart, B. (2003). Assessing quality in the early years: Early Childhood Environment Rating Scale Extension (ECERS-E): Four curricular subscales. Stoke on trent: trentham Books.
Sylva, k., Siraj-Blatchford, I., taggart, B., Sammons, p., Melhuish, e., elliot, k., & totsika, V. (2006). capturing quality in early childhood through environmental rating scales. Early Child-hood Research Quarterly, 21(1), 76–92.
Sylva, k., taggart, B., Siraj-Blatchford, I., totsika, V., ereky-Stevens, k., Gildena, r., & Bell, D. (2007). curricular quality and day-to-day learning activities in pre-school. International Jour-nal of Early Years Education, 15(1), 49–64.
Sylva, k., Melhuish, e., Sammons, p., Siraj-Blatchford, I., & taggart, B. (2010a). Early child-hood matters: Evidence from the effective pre-school and primary education project. London: routledge.
Sylva, k., Siraj-Blatchford, I., & taggart, B. (2010b). Assessing quality in the early years: Cur-ricular extension to the early childhood environment rating scale—revised. Stoke on trent: trentham Books.
Sylva, k., Melhuish, e., Sammons, p., Siraj-Blatchford, I., & taggart, B. (2011). pre-school quality and educational outcomes at age 11: Low quality has little benefit. Journal of Early Childhood Research, 9, 109–124.
tietze, w. (1987). A structural model for the evaluation of preschool effects. Early Childhood Research Quarterly, 2(2), 133–153.