the effects of diabetes induction on the rat heart
TRANSCRIPT

Research ArticleThe Effects of Diabetes Induction on the Rat Heart:Differences in Oxidative Stress, Inflammatory Cells, andFibrosis between Subendocardial and Interstitial Myocardial Areas
Maria C. Guido,1 Alyne F. Marques,1 Elaine R. Tavares,1 Marcelo D. Tavares de Melo,2
Vera M. C. Salemi,2 and Raul C. Maranhão1,3
1Laboratory of Metabolism and Lipids, Heart Institute (InCor) of the Medical School of the University of São Paulo,São Paulo, SP, Brazil2Heart Failure Unit and Clinical Cardiology Division, Heart Institute (InCor) of the Medical School of the University of São Paulo,São Paulo, SP, Brazil3Faculty of Pharmaceutical Sciences, University of São Paulo, São Paulo, SP, Brazil
Correspondence should be addressed to Raul C. Maranhão; [email protected]
Received 1 March 2017; Accepted 8 May 2017; Published 11 July 2017
Academic Editor: Igor A. Sobenin
Copyright © 2017 Maria C. Guido et al. This is an open access article distributed under the Creative Commons Attribution License,which permits unrestricted use, distribution, and reproduction in any medium, provided the original work is properly cited.
Diabetic cardiomyopathy (DCM) is characterized by cardiac remodeling and impaired diastolic function that may lead to heartfailure. The aim of this study was to evaluate oxidative stress, inflammatory cells, and fibrosis in both subendocardial (SEN) andinterstitial (INT) areas of the myocardium. Male Wistar rats were allocated to 2 groups of 9 animals, a control (CT) group andstreptozotocin-induced diabetes (DM). After 8 weeks, echocardiography morphometry, protein expression, and confocalmicroscopy in SEN and INT areas of the left ventricle (LV) were performed. The echocardiographic analysis showed thatdiabetes induction leads to cardiac dilation, hypertrophy, and LV diastolic dysfunction. As compared to CT, the induction ofdiabetes increased inflammatory cells and fibrosis in both SEN and INT areas of DM myocardium and increased ROSgeneration only in SEN. Comparing the SEN and INT areas in the DM group, inflammatory cells and fibrosis in SEN weregreater than in INT. In conclusion, diabetic myocardium SEN area, wherein oxidative stress was more pronounced, is moresusceptible to cardiac dysfunction than INT area. This finding can be important for the understanding of the heartremodeling process occurring in DCM and perhaps to engender targeted therapies to attenuate or revert DCM-relateddiastolic dysfunction.
1. Introduction
Diabetic cardiomyopathy (DCM) is characterized byincreased cell death, myocyte hypertrophy, myocardialfibrosis, and impaired diastolic function that may lead toheart failure (HF) [1]. Hyperglycemia and abnormal insulinsignaling enhance the production of advanced glycationend-products (AGES) and of their receptors (RAGE) inthe heart. AGES bind to slow turnover proteins, such as col-lagen, promoting collagen crosslinking that accounts for theincrease of myocardial stiffness and is directly related toDCM diastolic dysfunction [2, 3].
The AGES-RAGE axis also leads to increase in the myo-cardium of the number of inflammatory cells and of reac-tive oxygen species (ROS). The oxidative stress contributesto endothelial dysfunction, thus diminishing the blood flowto the myocardium [2, 4]. Cardiac remodeling of the dia-betic heart occurs as a result of cellular, structural, andfunctional unbalance among different myocardial areas[5]. A previous strain echocardiography study of the endo-cardial, mesocardial, and epicardial areas of myocardiumshowed that only the function of the endocardial area isimpaired in DCM [6]. Myocyte necrosis and left ventricle(LV) fibrosis were increased in the endocardium [4, 7].
HindawiOxidative Medicine and Cellular LongevityVolume 2017, Article ID 5343972, 11 pageshttps://doi.org/10.1155/2017/5343972

Endothelial dysfunction and regional low perfusion havebeen documented in the endocardial area of the diabeticheart and contribute to HF [8].
Previously, in nondiabetic animal models, it was shownthat the subendocardial area was more vulnerable than theinterstitial area to cardiac dysfunction, due to differences inblood flow between the two areas [9–11]. However, the rela-tionships between the cardiac dysfunction and the markers ofinflammation, oxidative stress, and fibrosis as measured sep-arately in the subendocardial and in the interstitial area werenot described in DCM. Due to the high incidence of cardiaccomplications in patients with diabetes, it is important toinvestigate whether those differences in the two areas alsooccur in the diabetic heart. Thus, the aims of this study wereto evaluate oxidative stress, inflammation, and fibrosis inboth subendocardial and interstitial areas of the myocardiumand to assess possible correlations of these parameters withmyocardial dysfunction occurring in DCM.
2. Methods
2.1. Animals.Male Wistar rats weighing 350–400 g were usedin this experiment. Animals were maintained on standard ratchow and water ad libitum in rooms with controlled temper-ature and light cycle.
Eighteen rats were used in the study; animals were ran-domly allocated to 2 groups, 9 with diabetes (DM), and 9 ani-mals as a control group (CT).
All procedures were performed in accordance with theguidelines of the Brazilian College of Animal Research andconform the NIH guidelines. The study protocol wasapproved by the Ethics Committee of the University of SãoPaulo Medical School Hospital (005/14).
2.2. Induction of Diabetes Mellitus. Diabetes was inducedafter 6 hours of fasting. Animals were anesthetized with keta-mine chlorhydrate (50mg/kg) and xilazin (25mg/kg) intra-peritoneally (IP). The induction was performed by a singleintravenous injection of steptozotocin (STZ) (Sigma, St.Louis, MO) into the tail vein at the of dose 50mg/kg, dilutedin citrate buffer 0.1M (pH 4.5). Nondiabetic control ratsreceived an injection of citrate buffer alone.
2.3. Transthoracic Echocardiography. Transthoracic echocar-diography was performed 8 weeks after DM induction usinga Sequoia 512 machine (Siemens, Mountain View, CA)equipped with a 10–13MHz linear transducer, as previouslydescribed [12]. Rats were anesthetized following the sameprotocol as in the diabetes induction, and the followingmorphometric and functional parameters were obtainedfrom short-axis view at the level of the papillary muscles byM-mode echocardiography [13]. LV mass was calculated byusing the following formula: LV mass = 0.8× {1.04[(LVID+PWTh+ IVSTh)3−LVID3]} + 0.6.
The sequence of echocardiographic examination was Mmode, 2-dimensional color Doppler, and pulsed-wave Dopp-ler of which the variables were measured from the aorticvalve closure to the onset of mitral inflow and LV outflowvelocity measured just below the aortic valve. The average
of 3 consecutive cardiac cycles was used in all echocardio-graphic parameters.
2.4. Blood Biochemistry. Promptly after the final echocardi-ography study, the animals were euthanized using an over-dose (100mg/kg) of sodium thiopental (Cristália, Itapira,Brazil). Blood samples were taken from the superior venacava for determination of glycemia and insulin levels.The analyses were performed using a COBAS c111(Roche, Basileia, Switzerland) and a multiplex immunoas-say through MAP kit (MILLIPLEX®, MERK, Darmstadt,Germany), respectively.
2.5. Morphometry. A slice of the heart was obtained at theequatorial plane and cut into 5μm sections. Tissue sectionsstained with hematoxylin and eosin (HE), and Masson’s tri-chrome underwent morphometric studies using an imageanalysis system (Leica Q500 iW; Leica Imaging Systems,Cambridge, UK). Two areas of the LV were analyzed sepa-rately: subendocardium (SEN) and interstitium (INT). TheSEN area was defined as the inner third of LV area and theINT area as the remaining outer two-thirds [9, 14].
Inflammatory cells were counted in HE-stained sectionsunder 400x magnification. The cells were identified accord-ing to nuclear and cytoplasmic morphological aspects.
Myocyte necrosis was identified in HE-stained sectionsunder 400x magnification by nuclear pyknosis and karyolysisas well as cytoplasmatic changes including vacuolization,contraction bands, and hypereosinophilia.
To measure myocardial fibrosis, collagen volume frac-tion was determined in Masson’s-stained sections under200x magnification. The fibrosis was calculated as the per-centage of blue-stained connective tissue areas per totalmyocardium area.
2.6. Western Blot Analysis. LV was homogenized in RIPAlysis buffer (Thermo Fisher Scientific, Waltham, MA).The proteins were size-fractionated on polyacrylamide/SDS
Table 1: Primary antibodies used in Western blot technique.
Primary antibody Supplier Catalog number Dilution
Anti-BAX Abcam ab7977 1 : 500
Anti-Bcl-2 Abcam ab59348 1 : 1000
Anti-caspase 3 Abcam ab2302 1 : 1000
Anti-catalase Abcam ab16731 1 : 1000
Anti-CD3 Abcam ab5690 1 : 1000
Anti-CD68 Abcam ab125212 1 : 1000
Anti-MCP-1 Abcam ab25124 1 : 1000
Anti-TNF-alpha Abcam ab1793 1 : 1000
Anti-IL-1-beta Abcam ab82558 1 : 1000
Anti-IL-6 Abcam ab83339 1 : 1000
Anti-collagen I Abcam ab90395 1 : 1000
Anti-collagen III Abcam ab7778 1 : 1000
Anti-GAPDH Calbiochem BC1001 1 : 10,000
Anti-HIF1-alpha Abcam ab463 1 : 1000
Anti-SOD1 Abcam ab13498 1 : 1000
2 Oxidative Medicine and Cellular Longevity

gel; the separated proteins were then electrophoreticallytransferred to a nitrocellulose membrane. The membraneswere blocked with 5% nonfat milk. After the primary anti-bodies (Table 1) were incubated overnight, the blots werewashed and incubated with horseradish peroxidase-conjugated secondary antibodies (Calbiochem, San Diego,CA). Bands were visualized using enhanced chemilumines-cence (Amersham, GE, Fairfield, CT), exposed, and analyzedby an image analyzer (Amersham Imager 600, GE, Fairfield,CT). Values were normalized for expression of GAPDH,and results are expressed as percentage of CT group.
2.7. In Situ Reactive Oxygen Species Generation. In situreactive oxygen species microfluorotopography of the LVwas performed with dihydroethidium (DHE, Invitrogen,Carlsbad, CA). LV paraffin sections were deparaffinizedand incubated in PBS Tween 1% for 30 minutes at roomtemperature. Sections were incubated with 5μM DHE for60 minutes at 37°C. Images were detected in a Zeiss Axiovert100M scanning confocal microscope and Axiovision soft-ware (Carl Zeiss, Jena, Germany). Parallel reading of imageswas performed with identical laser acquisition settings.Quantitative analysis of fluorescent images of SEN and INTareas was performed with an image analysis system (LeicaQ500 iW; Leica Imaging Systems, Cambridge, UK) under400x magnification [15].
2.8. Statistical Analysis. Data are expressed as means± SEM.Data were analyzed using the appropriate Student t-test orone-way ANOVA complemented by Bonferroni’s posttest.Pearson’s correlation was used to test potential correlationsbetween E/A wave and inflammatory cells, ROS generation,and myocardial fibrosis in SEN and INT areas. In all analyses,p < 0 05 was considered statistically significant. Statisticalanalyses were carried out using GraphPad Prism v.5 statisti-cal software (GraphPad Software Inc., La Jolla, CA). The data
collection and the analysis of the echocardiographic studywere performed by a single examiner (V.M.S.) that wasblinded to the animal groups.
3. Results
3.1. Body Weight, Glycemia, Serum Insulin, and RAGEExpression. Initial body weight did not differ between DMand CT (360± 12 and 346± 12 g, resp.), but the final bodyweight of DM rats was lower than CT animals (348± 12and 510± 16 g, resp., p < 0 001).
Figure 1 shows the concentration of blood glucose,serum insulin levels, and RAGE expression by Westernblot as determined 8 weeks after diabetes induction.Glycemia (Figure 1(a)) was higher in DM compared toCT (p < 0 001), whereas serum insulin levels (Figure 1(b))were lower in DM (p < 0 01), confirming the effectivenessof the diabetes induction procedure. RAGE expression washigher in DM than in the CT (p < 0 05) (Figure 1(c)).
3.2. Transthoracic Echocardiography. As acquired by trans-thoracic echocardiography performed 8 weeks after the com-mencement of the experiments, the systolic and diastolicdiameters, interventricular septum, LV posterior wall thick-ness (p < 0 01), and E/A wave ratio (p < 0 05) were greaterin DM than in the CT animals. The isovolumetric relaxationtime was lower in DM (p < 0 05). Diastolic and systolic vol-umes, LV mass, deceleration time of E wave, and ejectionand shortening fraction were not different between DM andCT (Table 2).
3.3. Oxidative Stress. Figure 2 depicts the labeled area ofsuperoxide in the diabetic myocardium. ROS generationwas higher in the SEN area of DM (p < 0 05) comparedto the SEN area of CT (Figure 2(a)). Figure 2(b) showsthe images of superoxide labeled tissue acquired by in situ
Gly
cem
ia (m
g/dL
)
500⁎
400
300
200
100
0CT DM
(a)
200
100
150
50
0CT DM
Insu
lin (U
/L)
†
(b)
⁎
400
600
800
1000
RAGE15 kDa
36 kDaGAPDH
200
0CT DM
RAG
E pr
otei
n ex
pres
sion/
GA
PDH
ratio
(%)
(c)
Figure 1: Glycemia (a) and insulin (b) serum concentrations and RAGE protein expression (c) after 8 weeks of diabetes induction.∗p < 0 05 and †p < 0 001 versus the CT group. Data expressed in mean± SEM in all plots.
3Oxidative Medicine and Cellular Longevity

microfluorotopography from confocal microscopy. Sectionsincubated with PEG-SOD showed no reaction, confirmingthat the signal obtained with DHE incubation was specifi-cally from superoxide.
Protein expression of the antioxidant enzyme catalaseand SOD1 is shown in Figures 2(c) and 2(d). DM had ahigher catalase expression compared to CT (p < 0 001)(Figure 2(c)). The SOD1 expression was similar in both ani-mal groups (Figure 2(d)).
3.4. Inflammation. Figure 3(a) shows the number of inflam-matory cells quantified from photomicrographs. In CT, theSEN area showed a higher number of inflammatory cells thanthe INT area (p < 0 001). SEN and INT areas of DM showed ahigher number of inflammatory cells when compared to SENand INT areas of CT, respectively (p < 0 001). Interestingly,the DM SEN area showed higher inflammatory cell numberthan the DM INT area (p < 0 001).
DM animals showed a higher expression of CD68(p < 0 05, Figure 3(b)), CD3 (p < 0 05, Figure 3(c)), MCP-1(p < 0 05, Figure 3(d)), TNF-α (p < 0 01, Figure 3(e)), IL-1β(p < 0 05, Figure 3(f)), and IL-6 (p < 0 05, Figure 3(g))compared to CT.
3.5. Cell Death and Hypoxia. Figure 4(a) shows cell death bynecrosis as observed in typical microscopic images in SENand INT areas of LV myocardium. In DM, the presence ofnecrotic myocytes in SEN and INT areas was greater com-pared to CT.
Figures 4(b), 4(c), and 4(d) show the protein expressionof the proapoptotic factors caspase 3 and BAX and
antiapoptotic factor Bcl-2 by Western blot. Compared withCT, the expression of caspase 3 (Figure 4(b)) and BAX(Figure 4(c)) was higher in DM (p < 0 01 and p < 0 001,resp.), and the expression of the antiapoptotic factorBcl-2 was not different between groups (Figure 4(d)).Regarding the protein expression of the HIF-1α (hyp-oxia factor-1α), DM was higher in comparison withCT (p < 0 01) (Figure 4(e)).
3.6. Fibrosis. The collagen volume fraction (Figure 5(a)) inthe SEN area of DM was greater than in the DM INT area(p < 0 05), showing a twofold increase. Fibrosis in the SENarea of DM was also greater in comparison to the SENarea of CT (p < 0 01), as occurred in the INT area ofDM versus CT animals (p < 0 05).
Figure 5(b) shows the microscopic images of typical find-ings of LV myocardial fibrosis. In the DM, the expression ofboth type I (Figure 5(c)) and type III (Figure 5(d)) collagensin LV was higher (p < 0 05) compared with CT.
3.7. Correlation between ROS Generation, Inflammatory Cellsand Myocardial Fibrosis, and LV Diastolic Dysfunction. Todetermine the parameters that may be involved in thedevelopment of diastolic dysfunction (E/A wave) onDCM, Pearson’s correlation was carried out with ROSgeneration, inflammatory cells, and myocardial fibrosis.
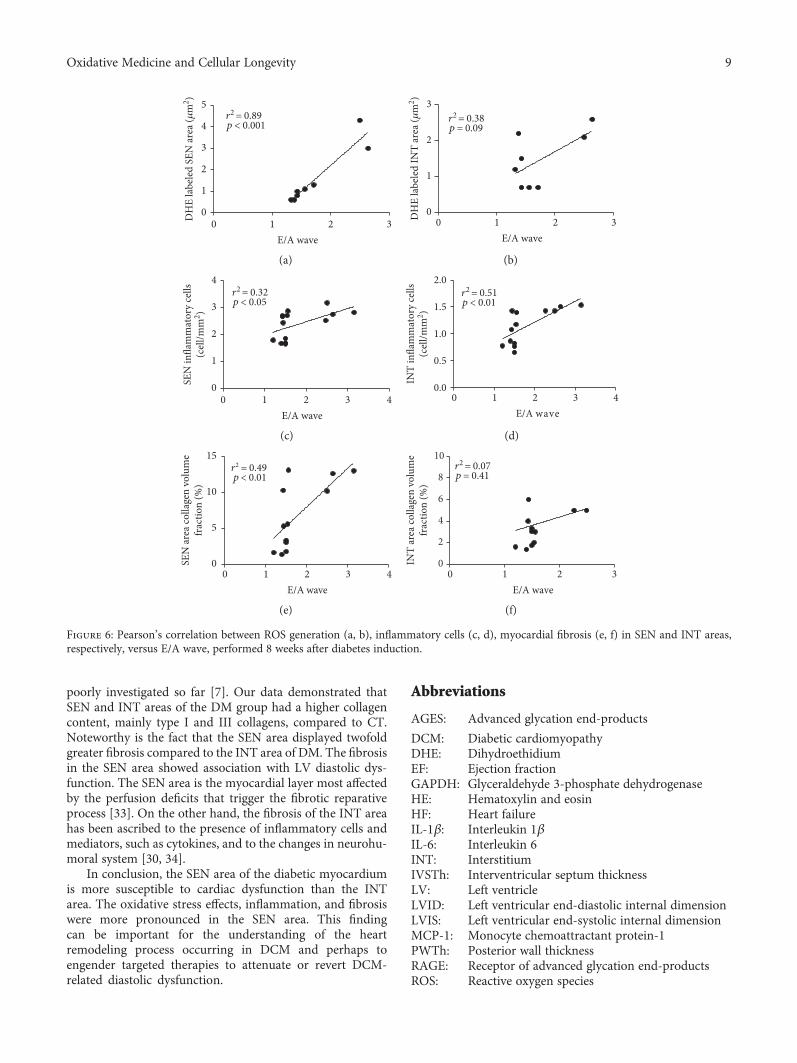
ROS generation in the SEN area correlated positivelywith diastolic dysfunction (r2 = 0 89, p < 0 001, Figure 6(a)),but this correlation was not present in the INT area(r2 = 0 38, p = 0 09, Figure 6(b)).
E/A wave correlation with total inflammatory cell countwas positive in both SEN (r2 = 0 32, p < 0 05, Figure 6(c))and INT (r2 = 0 51, p < 0 01, Figure 6(d)) areas.
Collagen volume fraction correlated positively withdiastolic dysfunction, but only in the SEN area (r2 = 0 49,p < 0 01, Figure 6(e)). In the INT area, there was no correla-tion (r2 = 0 07, p = 0 41, Figure 6(f)).
4. Discussion
In this study, as compared to CT, the induction of diabetesincreased inflammatory cells and fibrosis in both SEN andINT areas of DMmyocardium and increased ROS generationonly in SEN. Comparing the SEN and INT areas in DMgroup, inflammatory cells and fibrosis in SEN were greaterthan in INT. The echocardiographic analysis showed thatdiabetes induction leads to cardiac dilation, hypertrophy,and LV diastolic dysfunction, confirming previous observa-tions in the literature [1, 5–7].
Hyperglycemia and impaired insulin secretion are themain cause of enhanced production of AGES [16]. Theincrease in AGES generation by diabetes induction was indi-rectly shown here by the higher expression of RAGE in theDM group. The overexpression of RAGE is strongly con-nected to myocardial ischemic injury, vascular wall stiffness,and diastolic dysfunction which occur in animals withinduced diabetes [17].
The binding of AGES to RAGE increases ROS generationin DCM myocardium, resulting in endothelium dysfunction
Table 2: Transthoracic echocardiography performed after 8 weeksin CT and DM groups.
CT DM(n = 9) (n = 9)
LVID (mm/mg) 17.7± 0.4 23.4± 0.6†
LVIS (mm/mg) 11.0± 0.3 14.2± 0.4†
LVEDV (mL/mg) 1.2± 0.06 1.4± 0.12LVESV (mL/mg) 1.24± 0.06 1.43± 0.12ISVTh (mm/mg) 3.2± 0.2 4.3± 0.3#
PWTh (mm/mg) 3.1± 0.2 4.3± 0.2#
RWTh (mm/mg) 0.36± 0.02 0.37± 0.03LV mass (mg/mg2) 17.5± 0.9 20.2± 1.2E/A waves 1.4± 0.1 1.9± 0.2*IVRT (mseg) 39.2± 1.7 34.1± 2.5*DT (mseg) 40.8± 3.6 50.3± 5.0EF (%) 73.3± 1.1 74.5± 1.8SF (%) 38.0± 1.2 39.0± 2.0LVID: left ventricular end-diastolic internal dimension; LVIS: leftventricular end-systolic internal dimension; LVEDV: left ventricularend-diastolic volume; LVESD: left ventricular end-systolic volume; IVSTh:interventricular septum thickness; PWTh: posterior wall thickness; RWTh:relative wall thickness; DT: deceleration time of E wave; IVRT:isovolumetric relaxation time; EF: ejection fraction; SF: shortening fraction.∗p < 0 05; #p < 0 01; †p < 0 001 versus CT.
4 Oxidative Medicine and Cellular Longevity

that contributes to alterations in the microcirculation andoxidative status of diabetic rats [18]. A higher in situ genera-tion of ROS was observed here in the SEN area of DM andwas associated with LV diastolic dysfunction. Probably theincrease of hypoxia and RAGE contributed to the higherROS generation in the SEN area, since it was not observedin the INT area of the DM group.
After 8 weeks following diabetes induction, the expres-sion of SOD1 was unchanged; however, the catalase expres-sion was higher compared to CT. Some studies showedthat overexpression of antioxidant enzymes is associatedwith a significant reduction in apoptosis and ROS generation[19, 20]. However, the hyperglycemic state impairs important
cofactors that influence the antioxidant defenses [21].Therefore, the higher catalase expression may not havebeen sufficient to control ROS generation in the SEN areaof the DM group.
DCM increases microvascular permeability, impairedblood flow, ischemia, and subsequent cell death [22]. Ina study with diabetic and nondiabetic patients with hiber-nating myocardium, Mizuno et al. [23] showed that, aftercomplete revascularization, the subendocardial perfusionimproved only in nondiabetic patients, which contributedto persistent HF. In addition, other studies showed thatthe SEN area is more vulnerable than the INT area toeffects of hypoxia and ischemia and are directly correlated
CT
DH
E la
bele
d ar
ea (�휇
m2 )
INT areaSEN area
DM CT DM0
1
2
3
4⁎
(a)IN
T ar
eaSE
N ar
ea
CT DM
(b)
Cata
lase
pro
tein
expr
essio
n/G
APD
H ra
tio (%
)
CT DM0
500
1000
1500
2000 †
GAPDH36 kDa
Catalase60 kDa
(c)
SOD
1 pr
otei
n ex
pres
sion/
GA
PDH
ratio
(%)
CT DM0
50
100
150
SOD115 kDa
GAPDH36 kDa
(d)
Figure 2: (a) Quantitative analysis of microfluorotopography of DHE oxidation products performed 8 weeks after diabetes induction.∗p < 0 01 versus the CT SEN area. Data expressed in mean± SEM. (b) Representative photomicrograph of SEN and INT areas,showing microfluorotopography of DHE oxidation products. Red staining indicates the fluorescence signal by DHE under 400xmagnification. Bars: 50μm. Western blot protein expression analysis depicting antioxidant enzymes catalase (c) and SOD1 (d)performed 8 weeks after diabetes induction. †p < 0 001 versus the CT group. Data expressed in mean± SEM.
5Oxidative Medicine and Cellular Longevity

DM CTCT DM0.0
0.5
1.0
1.5
2.0
2.5
3.0 ⁎
⁎#
�휃#†
INT areaSEN area
Infla
mm
ator
y ce
lls(c
ells/
mm
2 )
(a)
CT DM0
100
200
300
400
500
CD6835 kDa
GAPDH36 kDa
CD68
pro
tein
expr
essio
n/G
APD
H ra
tio (%
)
⁎
(b)
100
200
300
400
GAPDH36 kDa
CD323kDa
CD3
prot
ein
expr
essio
n/G
APD
H ra
tio (%
)
CT DM0
⁎
(c)
CT DM0
50
100
150
200
250
MCP-114 kDa
GAPDH36 kDa
MCP
-1 p
rote
in ex
pres
sion/
GA
PDH
ratio
(%)
⁎
(d)
TNF-�훼
pro
tein
expr
essio
n/G
APD
H ra
tio (%
)
CT DM0
100
200
300
400
500
TNF-�훼52 kDa
GAPDH36 kDa
†
(e)
L-1�훽
pro
tein
expr
essio
n/G
APD
H ra
tio (%
)
IL-1�훽17 kDa
GAPDH36 kDa
CT DM0
50
100
150⁎
(f)
IL-6
pro
tein
expr
essio
n/G
APD
H ra
tio (%
)
IL-670 kDa
GAPDH36 kDa
0
50
100
150
CT DM
⁎
(g)
Figure 3: (a) Total inflammatory cell count in SEN and INT areas. HE-stained sections, under 400x magnification. θp < 0 05 versusthe DM SEN area; ∗p < 0 01 versus the CT SEN area, #p < 0 01 versus the DM SEN area; †p < 0 01 versus the CT INT area. Dataexpressed in mean± SEM. Western blot protein expression analysis depicting CD68 (b), CD3 (c), MCP-1 (d), TNF-α (e), IL1-β(f), and IL-6 (g) was performed 8 weeks after diabetes induction. ∗p < 0 05 and †p < 0 001 versus the CT group. Data expressed inmean± SEM in all plots.
6 Oxidative Medicine and Cellular Longevity

CT DM
SEN
area
INT
area
(a)
CT DM0
500
1000
1500#
Casp
ase 3
pro
tein
expr
essio
n/G
APD
H ra
tio (%
)
Caspase 317 kDa
GAPDH36 kDa
(b)
GAPDH36 kDa
BAX26 kDa
CT DM0
100
200
300
400 †
BAX
prot
ein
expr
essio
n/G
APD
H ra
tio (%
)
(c)
Bcl-2
pro
tein
expr
essio
n/G
APD
H ra
tio (%
)
CT DM0
50
100
150
200
Bcl-226 kDa
GAPDH36 kDa
(d)
#
HIF
1-�훼
pro
tein
expr
essio
n/G
APD
H ra
tio (%
)
CT DM0
50
100
150
HIF1-�훼100 kDa
GAPDH36 kDa
(e)
Figure 4: (a) Representative photomicrograph of myocardial necrosis in SEN and INT areas. HE-stained sections under 400x magnification.Arrows indicate nuclear pyknosis, karyolysis, cytoplasmatic changes, and hypereosinophilia. Bars: 50 μm. Western blot protein expressionanalysis depicting proapoptotic caspase 3 (b) and BAX (c) and antiapoptotic Bcl-2 (d) and HIF1-α (e) performed 8 weeks after diabetesinduction. #p < 0 01 and †p < 0 001 versus the CT group. Data expressed in mean± SEM.
7Oxidative Medicine and Cellular Longevity

to cardiac dysfunction [24]. In our study, DM was moreprone to cell death, probably due to hypoxia, as showedby the higher expression of HIF1-α in the DM group.
The inflammatory process that occurs in DCM is cru-cial for the adaptive anatomical and functional changes ofthe heart. ROS upregulation contributes to increase proin-flammatory cytokines, chemokines, and activation of mac-rophages [25]. Some studies showed that the increase ofIL-1β and IL-6 in DCM is associated with the impairmentof the cardiac function [26–29]. Lymphocytes and macro-phages infiltrated in the myocardium tissue increased cyto-kine expression and reduced the insulin signaling [30, 31].Here, the expression of all cytokines was higher in DM,especially TNF-α expression that was about fourfold
higher. MCP-1 expression also increased, suggesting mac-rophage recruitment to the myocardium. We showed forthe first time the number of inflammatory cells distributedin SEN and INT areas of DCM. Both SEN and INT areasof the DM group showed a higher number of inflamma-tory cells compared to CT, and this increase in both myo-cardial areas was associated with LV diastolic dysfunction.Interestingly, in the DM group, the SEN area presentedtwofold higher number of cells when compared to theINT area.
Myocardial fibrosis leads to impairment of LV relaxation,which subsequently compromises the efficiency of LV con-traction [32]. The differences in the distribution of fibrotictissues between SEN and INT areas of DCM have been
Colla
gen
volu
me f
ract
ion
(%)
CT DM CT DM0
3
6
9
12
SEN area INT area
†�휃
⁎
(a)
SEN
area
INT
area
CT DM
(b)
CT DM0
Colla
gen
I pro
tein
expr
essio
n/G
APD
H ra
tio (%
)
50
100
150
200
Collagen I130 kDa
GAPDH36 kDa
⁎
(c)
CT DM0
100
200
300
Collagen III138 kDa
GAPDH36 kDa
Colla
gen
III p
rote
in ex
pres
sion/
GA
PDH
ratio
(%)
⁎
(d)
Figure 5: (a) Quantitative analysis of collagen volume fraction in SEN and INT areas, performed 8 weeks after diabetes induction. θp < 0 05versus the DM SEN area; ∗p < 0 01 versus the CT SEN area; †p < 0 01 versus the CT INT area. Data expressed in mean± SEM. (b)Representative photomicrograph of SEN and INT areas, showing myocardial fibrosis in Masson’s trichrome stain. Blue stainingindicates the myocardial fibrosis under 200x magnification. Bars: 100μm. Western blot protein expression analysis depicting collagenI (c) and collagen III (d), performed 8 weeks after diabetes induction. ∗p < 0 05 versus the CT group. Data expressed in mean± SEMin all plots.
8 Oxidative Medicine and Cellular Longevity
poorly investigated so far [7]. Our data demonstrated thatSEN and INT areas of the DM group had a higher collagencontent, mainly type I and III collagens, compared to CT.Noteworthy is the fact that the SEN area displayed twofoldgreater fibrosis compared to the INT area of DM. The fibrosisin the SEN area showed association with LV diastolic dys-function. The SEN area is the myocardial layer most affectedby the perfusion deficits that trigger the fibrotic reparativeprocess [33]. On the other hand, the fibrosis of the INT areahas been ascribed to the presence of inflammatory cells andmediators, such as cytokines, and to the changes in neurohu-moral system [30, 34].
In conclusion, the SEN area of the diabetic myocardiumis more susceptible to cardiac dysfunction than the INTarea. The oxidative stress effects, inflammation, and fibrosiswere more pronounced in the SEN area. This findingcan be important for the understanding of the heartremodeling process occurring in DCM and perhaps toengender targeted therapies to attenuate or revert DCM-related diastolic dysfunction.
Abbreviations
AGES: Advanced glycation end-products
DCM: Diabetic cardiomyopathyDHE: DihydroethidiumEF: Ejection fractionGAPDH: Glyceraldehyde 3-phosphate dehydrogenaseHE: Hematoxylin and eosinHF: Heart failureIL-1β: Interleukin 1βIL-6: Interleukin 6INT: InterstitiumIVSTh: Interventricular septum thicknessLV: Left ventricleLVID: Left ventricular end-diastolic internal dimensionLVIS: Left ventricular end-systolic internal dimensionMCP-1: Monocyte chemoattractant protein-1PWTh: Posterior wall thicknessRAGE: Receptor of advanced glycation end-productsROS: Reactive oxygen species
0 1 2 30
1
2
3
4
5r2 = 0.89p < 0.001
E/A wave
DH
E la
bele
d SE
N ar
ea (�휇
m2 )
(a)
0 1 2 30
1
2
3
DH
E la
bele
d IN
T ar
ea (�휇
m2 )
r2 = 0.38p = 0.09
E/A wave
(b)
0 1 2 3 40
4
1
2
3r2 = 0.32p < 0.05
E/A wave
SEN
infla
mm
ator
y ce
lls(c
ell/m
m2 )
(c)
0 1 2 3 40.0
0.5
1.0
1.5
2.0
E/A wave
r2 = 0.51p < 0.01
INT
infla
mm
ator
y ce
lls(c
ell/m
m2 )
(d)
0 1 2 3 40
5
10
15
E/A wave
SEN
area
colla
gen
volu
me
frac
tion
(%)
r2 = 0.49p < 0.01
(e)
0 1 2 30
2
4
6
8
10
INT
area
colla
gen
volu
me
frac
tion
(%)
E/A wave
r2 = 0.07p = 0.41
(f)
Figure 6: Pearson’s correlation between ROS generation (a, b), inflammatory cells (c, d), myocardial fibrosis (e, f) in SEN and INT areas,respectively, versus E/A wave, performed 8 weeks after diabetes induction.
9Oxidative Medicine and Cellular Longevity

SEN: SubendocardiumSF: Shortening fractionTNF-α: Tumor necrosis factor-α.
Conflicts of Interest
None are declared.
Acknowledgments
The authors thank Deborah L. Bispo for the help with theexperiments and Dr. Ana L. Garippo for the assistance withthe confocal microscopy imaging. This work was supportedby a grant from the State of São Paulo Research SupportFoundation (Grant no. 2014/03742-0), FAPESP, São Paulo,Brazil. Drs. Maranhao and Salemi have Research CareerAwards from the National Council for Scientific and Techno-logical Development (CNPq, Brasília, Brazil).
References
[1] S. Rubler, J. Dlugash, Y. Z. Yuceoglu, T. Kumral, A. W.Branwood, and A. Grishman, “New type of cardiomyopathyassociated with diabetic glomerulosclerosis,” The AmericanJournal of Cardiology, vol. 30, no. 6, pp. 595–602, 1972.
[2] D. Aronson, “Cross-linking of glycated collagen in the patho-genesis of arterial and myocardial stiffening of aging and dia-betes,” Journal of Hypertension, vol. 21, no. 1, pp. 3–12, 2003.
[3] C. J. Li, L. Lv, H. Li, and D. M. Yu, “Cardiac fibrosis and dys-function in experimental diabetic cardiomyopathy are amelio-rated by alpha-lipoic acid,” Cardiovascular Diabetology,vol. 11, no. 1, p. 73, 2012.
[4] M. Ali, A. Mehmood, M. S. Anjum, M. N. Tarrar, S. N. Khan,and S. Riazuddin, “Diazoxide preconditioning of endothelialprogenitor cells from streptozotocin-induced type 1 diabeticrats improves their ability to repair diabetic cardiomyopathy,”Molecular and Cellular Biochemistry, vol. 410, no. 1-2,pp. 267–279, 2015.
[5] P. K. Battiprolu, C. Lopez-Crisosto, Z. V. Wang, A. Nem-chenko, S. Lavandero, and J. A. Hill, “Diabetic cardiomyopa-thy and metabolic remodeling of the heart,” Life Sciences,vol. 92, no. 11, pp. 609–615, 2013.
[6] Y. Y. Qiao, M. Zeng, R. J. Li, Z. T. Leng, J. Yang, and Y. Yang,“Layer-specific myocardial strain analysis: investigation ofregional deformation in a rabbit model of diabetes mellitusduring different stages,” Medical Ultrasonography, vol. 18,no. 3, pp. 339–344, 2016.
[7] M. Kawaguchi, M. Techigawara, T. Ishihata et al., “A compar-ison of ultrastructural changes on endomyocardial biopsyspecimens obtained from patients with diabetes mellitus withand without hypertension,” Heart and Vessels, vol. 12, no. 6,pp. 267–274, 1997.
[8] D. Popov, A. Sima, D. Stern, and M. Simionescu, “The patho-morphological alterations of endocardial endothelium inexperimental diabetes and diabetes associated with hyperlipid-emia,” Acta Diabetologica, vol. 33, no. 1, pp. 41–47, 1996.
[9] M. K. Koike, C. De Carvalho Frimm, and M. Curi, “Lowcoronary driving pressure early in the course of myocardialinfarction is associated with subendocardial remodelling andleft ventricular dysfunction,” International Journal of Exper-imental Pathology, vol. 88, no. 4, pp. 279–290, 2007.
[10] M. C. Guido, C. De Carvalho Frimm, M. K. Koike, F. F.Cordeiro, A. I. Moretti, and L. C. Godoy, “Low coronarydriving pressureis associated with subendocardial remodellingand left ventricular dysfunction in aortocaval fistula,” Clinicaland Experimental Pharmacology & Physiology, vol. 34, no. 11,pp. 1165–1172, 2007.
[11] F. G. Soriano, M. C. Guido, H. V. Barbeiro, E. G. Caldini,C. B. Lorigados, and A. C. Nogueira, “Endotoxemic myocar-dial dysfunction: subendocardial collagen deposition relatedto coronary driving pressure,” Shock, vol. 42, no. 5,pp. 472–479, 2014.
[12] R. A. Sirvente, M. C. Irigoyen, L. E. Souza et al., “Cardiacimpairment evaluated by transesophageal echocardiographyand invasive measurements in rats undergoing sinoaorticdenervation,” PloS One, vol. 9, no. 5, article e87935, 2014.
[13] V. M. Salemi, A. M. Bilate, F. J. Ramires et al., “Referencevalues from M-mode and Doppler echocardiography for nor-mal Syrian hamsters,” European Journal of Echocardiography,vol. 6, pp. 41–46, 2005.
[14] J. Kajstura, W. Cheng, K. Reiss et al., “Apoptotic and necroticmyocyte cell deaths are independent contributing variables ofinfarct size in rats,” Laboratory Investigation, vol. 74, pp. 86–107, 1996.
[15] F. C. de Carvalho, M. K. Koike, and M. Cúri, “Subendocardialfibrosis in remote myocardium results from reduction of coro-nary driving pressure during acute infarction in rats,” ArquivosBrasileiros de Cardiologia, vol. 80, pp. 509–520, 2003.
[16] S. F. Yan, G. R. Barile, V. D'Agati, S. Du Yan, R. Ramasamy,and A. M. Schmidt, “The biology of RAGE and its ligands:uncovering mechanisms at the heart of diabetes and its com-plications,” Current Diabetes Reports, vol. 2, no. 3, pp. 146–153, 2007.
[17] L. G. Bucciarelli, R. Ananthakrishnan, Y. C. Hwang et al.,“RAGE and modulation of ischemic injury in the diabeticmyocardium,” Diabetes, vol. 57, no. 7, pp. 1941–1951,2008.
[18] R. H. Ritchie, J. M. Quinn, A. H. Cao et al., “The antioxidanttempol inhibits cardiac hypertrophy in the insulin-resistantglut4-deficient mouse in vivo,” Journal of Molecular and Cellu-lar Cardiology, vol. 42, no. 6, pp. 1119–1128, 2007.
[19] W. Cong, D. Ruan, Y. Xuan et al., “Cardiac-specific overex-pression of catalase prevents diabetes-induced pathologicalchanges by inhibiting NF-κB signaling activation in the heart,”Journal of Molecular and Cellular Cardiology, vol. 89, Part B,pp. 314–325, 2015.
[20] X. Sun, R. C. Chen, Z. H. Yang et al., “Taxifolin prevents dia-betic cardiomyopathy in vivo and in vitro by inhibition of oxi-dative stress and cell apoptosis,” Food and ChemicalToxicology, vol. 63, pp. 221–232, 2014.
[21] D. Bonnefont-Rousselot, J. P. Bastard, M. C. Jaudon, and J.Delattre, “Consequences of the diabetic status on the oxi-dant/antioxidant balance,” Diabetes & Metabolism, vol. 26,no. 3, pp. 163–176, 2000.
[22] A. Frustaci, J. Kajstura, C. Chimenti et al., “Myocardial celldeath in human diabetes,” Circulation Research, vol. 87,no. 12, pp. 1123–1132, 2000.
[23] R. Mizuno, S. Fujimoto, Y. Saito, and S. Nakamura, “Depressedrecovery of subendocardial perfusion in persistent heartfailure after complete revascularization in diabetic patientswith hibernating myocardium,” Heart, vol. 95, no. 10,pp. 830–834, 2009.
10 Oxidative Medicine and Cellular Longevity

[24] E. Toyota, Y. Ogasawara, O. Hiramatsu et al., “Dynamics offlow velocities in endocardial and epicardial coronary arteri-oles,” American Journal of Physiology. Heart and CirculatoryPhysiology, vol. 288, no. 4, pp. H1598–H1603, 2005.
[25] G. Jia, J. Habibi, B. P. Bostick et al., “Uric acid promotes leftventricular diastolic dysfunction in mice fed a Western diet,”Hypertension, vol. 65, no. 3, pp. 531–539, 2015.
[26] H. Bahrami, D. A. Bluemke, R. Kronmal et al., “Novelmetabolic risk factors for incident heart failure and theirrelationship with obesity: the MESA (multi-ethnic study ofatherosclerosis) study,” Journal of the American College ofCardiology, vol. 51, no. 18, pp. 1775–1783, 2008.
[27] M. Y. Donath and S. E. Shoelson, “Type 2 diabetes as aninflammatory disease,” Nature Reviews. Immunology, vol. 11,no. 2, pp. 98–107, 2011.
[28] F. Haubner, K. Lehle, D. Münzel, C. Schmid, D. E. Birnbaum,and J. G. Preuner, “Hyperglycemia increases the levels ofvascular cellular adhesion molecule-1 and monocyte-chemoattractant-protein-1 in the diabetic endothelial cell,”Biochemical and Biophysical Research Communications,vol. 360, pp. 560–565, 2007.
[29] Z. Liu, N. Zhao, H. Zhu et al., “Circulating interleukin-1βpromotes endoplasmic reticulum stress-induced myocytesapoptosis in diabetic cardiomyopathy via interleukin-1receptor-associated kinase-2,” Cardiovascular Diabetology,vol. 14, p. 125, 2015.
[30] Q. Yu, R. Vazquez, S. Zabadi, R. R. Watson, and D. F. Larson,“T-lymphocytes mediate left ventricular fibrillar collagencross-linking and diastolic dysfunction in mice,” MatrixBiology, vol. 29, pp. 511–518, 2010.
[31] Y. Cao, W. Xu, and S. Xiong, “Adoptive transfer of regulatoryT cells protects against Coxsackievirus B3-induced cardiacfibrosis,” PloS One, vol. 8, no. 9, article e74955, 2013.
[32] C. Passino, A. Barison, G. Vergaro et al., “Markers of fibrosis,inflammation, and remodeling pathways in heart failure,”Clinica Chimica Acta, vol. 443, pp. 29–38, 2015.
[33] K. T. Weber and C. G. Brilla, “Pathological hypertrophyand cardiac interstitium. Fibrosis and renin-angiotensin-aldosterone system,” Circulation, vol. 83, pp. 1849–1865, 1991.
[34] E. Riva, G. Andreoni, R. Bianchi et al., “Changes in diastolicfunction and collagen content in normotensive and hyperten-sive rats with long-term streptozotocin-induced diabetes,”Pharmmacological Research, vol. 37, no. 3, pp. 233–240, 1998.
11Oxidative Medicine and Cellular Longevity

Submit your manuscripts athttps://www.hindawi.com
Stem CellsInternational
Hindawi Publishing Corporationhttp://www.hindawi.com Volume 2014
Hindawi Publishing Corporationhttp://www.hindawi.com Volume 2014
MEDIATORSINFLAMMATION
of
Hindawi Publishing Corporationhttp://www.hindawi.com Volume 2014
Behavioural Neurology
EndocrinologyInternational Journal of
Hindawi Publishing Corporationhttp://www.hindawi.com Volume 2014
Hindawi Publishing Corporationhttp://www.hindawi.com Volume 2014
Disease Markers
Hindawi Publishing Corporationhttp://www.hindawi.com Volume 2014
BioMed Research International
OncologyJournal of
Hindawi Publishing Corporationhttp://www.hindawi.com Volume 2014
Hindawi Publishing Corporationhttp://www.hindawi.com Volume 2014
Oxidative Medicine and Cellular Longevity
Hindawi Publishing Corporationhttp://www.hindawi.com Volume 2014
PPAR Research
The Scientific World JournalHindawi Publishing Corporation http://www.hindawi.com Volume 2014
Immunology ResearchHindawi Publishing Corporationhttp://www.hindawi.com Volume 2014
Journal of
ObesityJournal of
Hindawi Publishing Corporationhttp://www.hindawi.com Volume 2014
Hindawi Publishing Corporationhttp://www.hindawi.com Volume 2014
Computational and Mathematical Methods in Medicine
OphthalmologyJournal of
Hindawi Publishing Corporationhttp://www.hindawi.com Volume 2014
Diabetes ResearchJournal of
Hindawi Publishing Corporationhttp://www.hindawi.com Volume 2014
Hindawi Publishing Corporationhttp://www.hindawi.com Volume 2014
Research and TreatmentAIDS
Hindawi Publishing Corporationhttp://www.hindawi.com Volume 2014
Gastroenterology Research and Practice
Hindawi Publishing Corporationhttp://www.hindawi.com Volume 2014
Parkinson’s Disease
Evidence-Based Complementary and Alternative Medicine
Volume 2014Hindawi Publishing Corporationhttp://www.hindawi.com