the effects of absence on student performance: an
TRANSCRIPT

P. Nyatanga, S. Mukorera and C.Ifeacho
(School of Accounting Economics and Finance, University of KwaZulu Natal)
September 27, 2014
THE EFFECTS OF ABSENCE ON STUDENT PERFORMANCE: AN
ECONOMETRIC ANALYSIS

Presentation Outline
General Introduction.
Discussion of Attendance Policy at UKZN
Discussion of Estimated Results
Data Set and Discussion of the Models (Logit and Probit Models )
Summary and Conclusions.
2

General Introduction
Student performance is mostly measured as school examinations outcome (Simmons & Alexander, 1978: 342). completion of particular years of study completion of an entire programme of study (Birch & Miller, 2005: 3).
All contribute to the national higher education challenge of increasing throughput
Study conducted by the Council on Higher Education (CHE) through VitalStats Public Higher Education, showed that in 2011 only 938,200 of about 52million of the South African population enrolled for higher education studies.
Only 29% of these students completed their degrees in the minimum regulation time.
This indeed raises a lot of questions on the throughput rates of HEIs in South Africa and the quality of the graduates.
3

General Introduction
The Council on Higher Education’s (CHE) core goal is to develop and strengthen the quality of educational offerings
and practices of Higher Education Institutions (HEI) in South Africa. – quality of the throughput
Quality Assurance- 2004-2011 principally seeks to ensure that minimum standards are met in the
programme offerings in HEI thereby safeguarding students against poor quality programmes.
Quality Enhancement- 2011 to date focuses on improving teaching and learning with a view to boost student
success/ performance and ultimately promoting capacity development (Institutional Audits Directorate, 2013).
4

General Introduction
The Council on Higher Education’s (CHE) core goal is to develop and strengthen the quality of educational offerings
and practices of Higher Education Institutions (HEI) in South Africa. – quality of the throughput
Quality Assurance- 2004-2011 principally seeks to ensure that minimum standards are met in the
programme offerings in HEI thereby safeguarding students against poor quality programmes.
Quality Enhancement- 2011 to date focuses on improving teaching and learning with a view to boost student
success/ performance and ultimately promoting capacity development (Institutional Audits Directorate, 2013).
5

General Introduction
Same goal has been adopted in HEI both at college and school
level.
SAEF Strategies to Improve throughput rates by 5% annually o Improve module pass rates by 5% annually to reach 85% o Academics to achieve 75% positive responses in student evaluations o Achieve above 90% pass rate in professional body examinations o Improve SAICA accreditation from level two to level one in 2015
Not possible if student performance cannot be improved
6
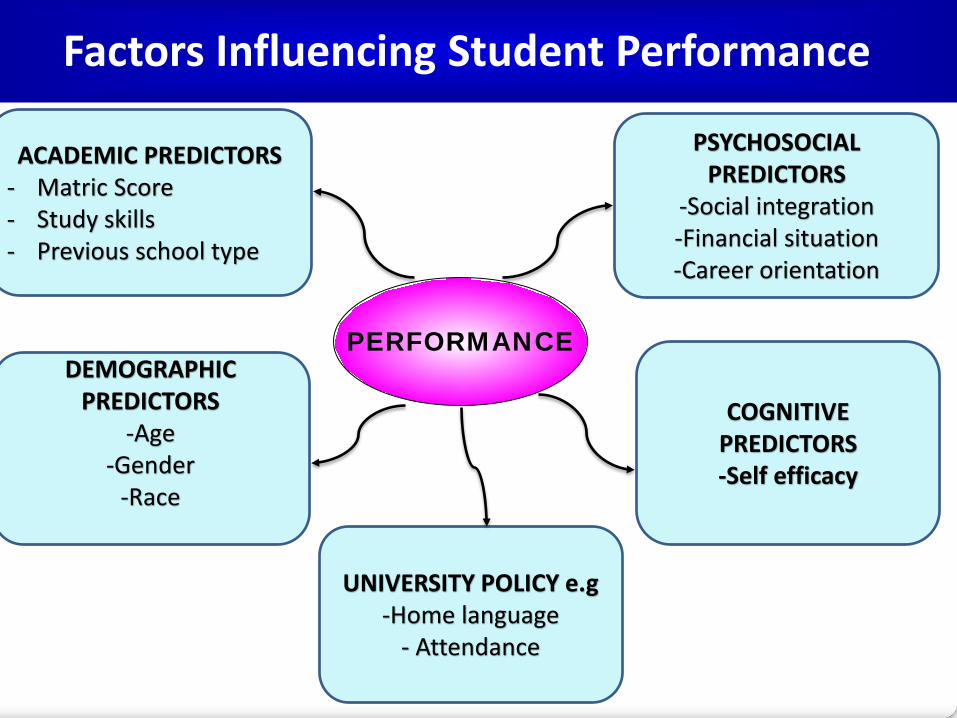
Factors Influencing Student Performance
PERFORMANCE
ACADEMIC PREDICTORS - Matric Score - Study skills - Previous school type
DEMOGRAPHIC PREDICTORS
-Age -Gender
-Race
PSYCHOSOCIAL PREDICTORS
-Social integration -Financial situation -Career orientation
COGNITIVE PREDICTORS -Self efficacy
UNIVERSITY POLICY e.g -Home language
- Attendance

Attendance Policy at the University
Attendance is left to the discretion of each College or School
oDP requirement
No way of monitoring attendance, other institutions use swiping of cards at entrance points
In the same school have different attendance policies for different programs e.g Main stream and BCOM4 students
8
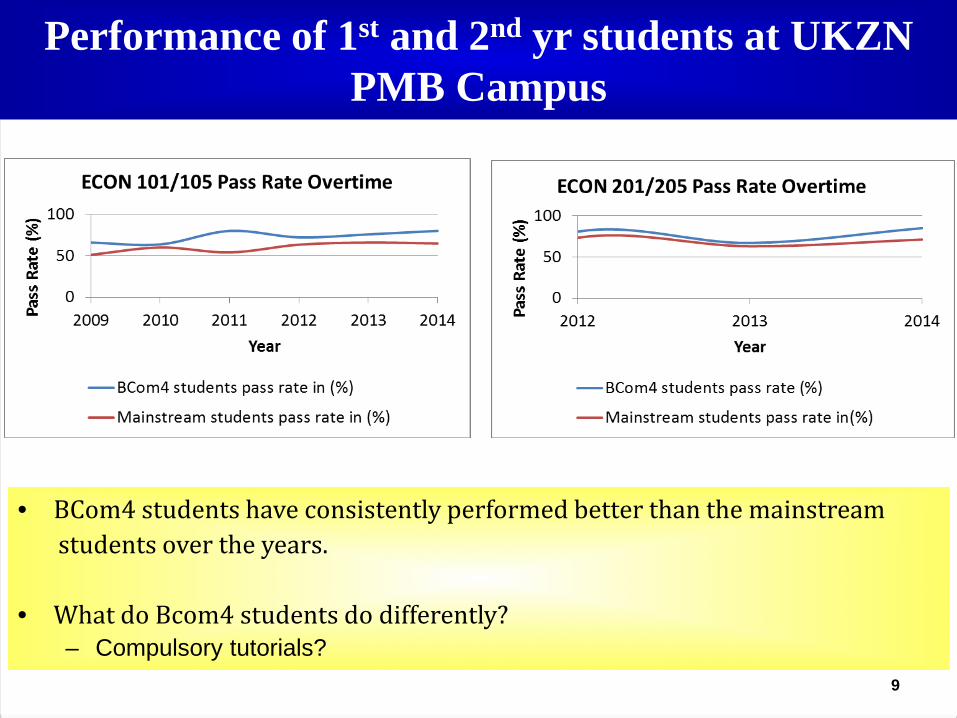
Performance of 1st and 2nd yr students at UKZN
PMB Campus
9
• BCom4 students have consistently performed better than the mainstream students over the years.
• What do Bcom4 students do differently?
– Compulsory tutorials?

Study Objectives
To measure the effect and significance of absenteeism from lectures and tutorials to
student performance.
To determine whether individual heterogeneity has any effect on student performance.
10
To evaluate and compare these effects on student performance in first and second year
economics courses

Research Questions-
• Is attendance related to performance?
• What is acceptable absence?
• Do the results change when individual heterogeneity is considered? – Gender – Age -demographic predictors – Race – Matric Score - academic predictors – South African vs. Foreign educated – Program - psychosocial predictor – Home Language/Mother Tongue – Attendance -policy predictors
11
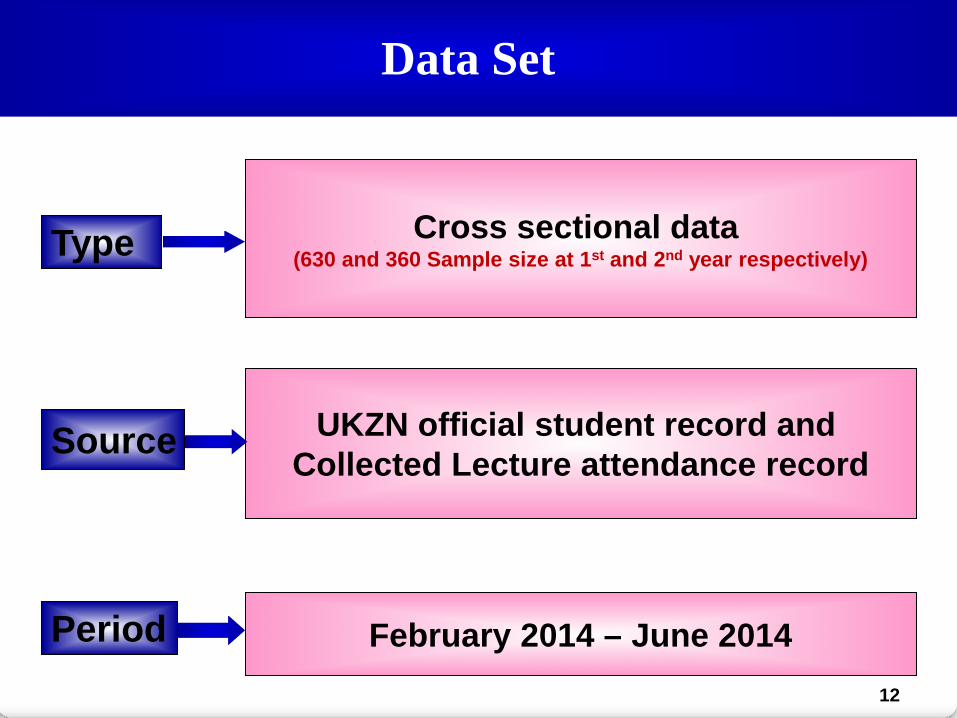
Data Set
Period February 2014 – June 2014
Source UKZN official student record and Collected Lecture attendance record
Type Cross sectional data (630 and 360 Sample size at 1st and 2nd year respectively)
12

Data Set - Variables Variables Definition of Variables
Y 1 if student pass with a 50% or more, and 0 otherwiseLEC Percentage of Lectures AttendedTUT Percentage of Tutorials AttendedAGE Student's Age
METRIC Metric Score
Dummy VariablesPROG 1 is student belong to the Bcom4 program, and 0 otherwiseWhite 1 if student is White, and 0 if African student
Coloured 1 if student is Coloured, and 0 if African studentIndian 1 if student is Indian, and 0 if African student
Foreign 1 if student is foreign educated, and 0 if SA educatedEnglish 1 if English is main language at home, and 0 if another language
Zulu 1 if Zulu is main language at home, and 0 if another languageMale 1 if male, and 0 if female
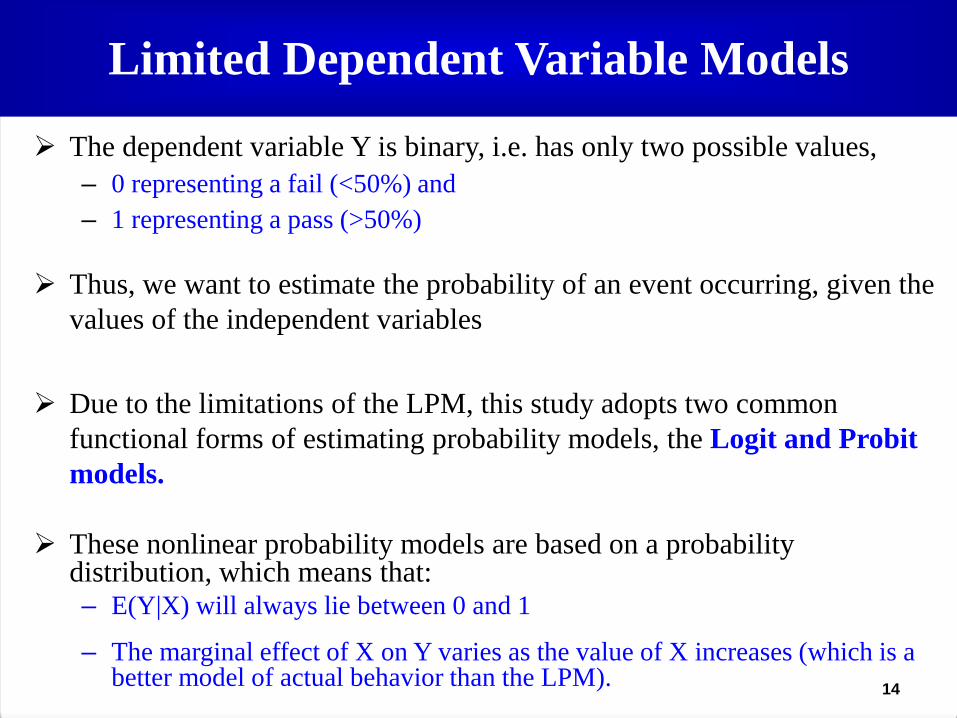
Limited Dependent Variable Models
The dependent variable Y is binary, i.e. has only two possible values,
– 0 representing a fail (<50%) and
– 1 representing a pass (>50%)
Thus, we want to estimate the probability of an event occurring, given the values of the independent variables
Due to the limitations of the LPM, this study adopts two common functional forms of estimating probability models, the Logit and Probit models.
These nonlinear probability models are based on a probability distribution, which means that: – E(Y|X) will always lie between 0 and 1
– The marginal effect of X on Y varies as the value of X increases (which is a better model of actual behavior than the LPM). 14

Logit Model
The Logit model is based on the cumulative logistic probability distribution:
𝑷𝑷𝑷𝑷 𝒀 = 𝟏 𝑿𝒌 = 𝑭(𝜷𝟎 + 𝜷𝟏𝑿𝟏 + 𝜷𝟐𝑿𝟐 + ⋯
= 𝒆(𝜷𝟎+𝜷𝟏𝑿𝟏+𝜷𝟐𝑿𝟐+⋯+𝜷𝒌𝑿𝒌) 𝟏+𝒆(𝜷𝟎+𝜷𝟏𝑿𝟏+𝜷𝟐𝑿𝟐+⋯+𝜷𝒌𝑿𝒌)
o Here we are estimating the log of the odds that Y = 1 (ratio of
likelihood of event occurring to not occurring) o 𝛽s are the effect of a unit change in the Xs on ln{odds(Y = 1)}
15
(1)
Probit Model
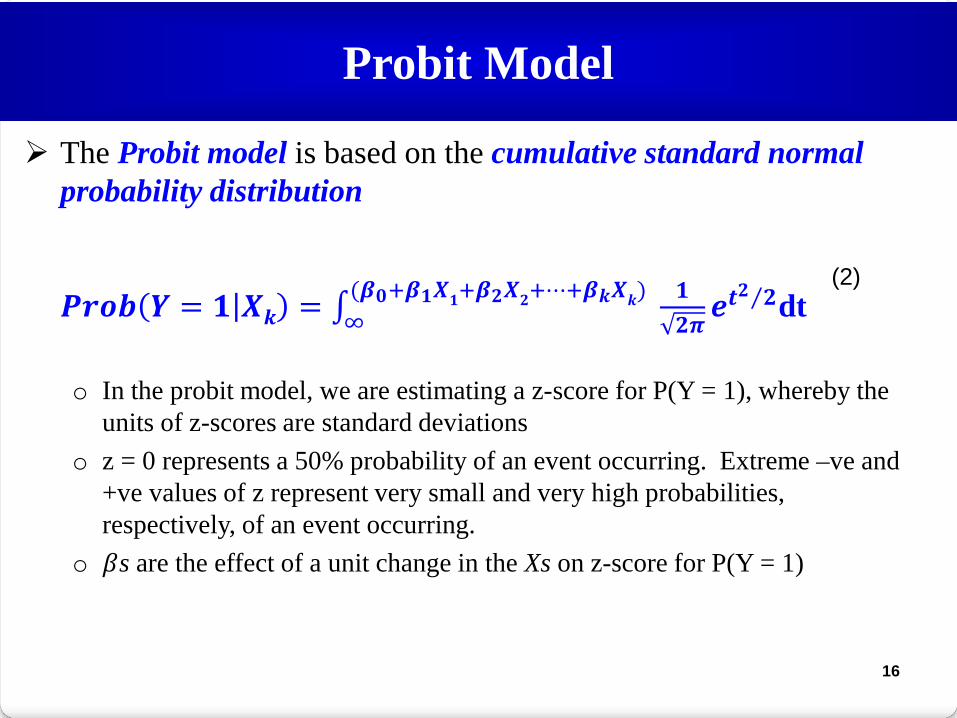
The Probit model is based on the cumulative standard normal probability distribution
𝑷𝑷𝑷𝑷 𝒀 = 𝟏 𝑿𝒌 = ∫ 𝟏𝟐𝝅
(𝜷𝟎+𝜷𝟏𝑿𝟏+𝜷𝟐𝑿𝟐+⋯+𝜷𝒌𝑿𝒌) ∞ 𝒆𝒕𝟐 𝟐⁄ dt
o In the probit model, we are estimating a z-score for P(Y = 1), whereby the
units of z-scores are standard deviations o z = 0 represents a 50% probability of an event occurring. Extreme –ve and
+ve values of z represent very small and very high probabilities, respectively, of an event occurring.
o 𝛽s are the effect of a unit change in the Xs on z-score for P(Y = 1)
16
(2)

Logit and Probit Models
The logit and probit models [Prob(Y = 1)], are non-linear models, and estimated using Maximum Likelihood (ML) method of Estimation.
For both models, we focus more on the signs of the coefficients than on their magnitudes: – If β > 0 (+) : means that as X increases, the probability of Y = 1 also increases, c.p. – If β < 0 (-) : means that as X increases, the probability of Y = 1 decreases, c.p.
The size of βk is hard to interpret because the change in probability for a change in XK is non-linear, depends on all X1;X2;….,Xk
Special case: – We can interpret the size of coefficients in the logit model, after transforming
them: – When Xk increases by one unit, the odds that Y = 1 change by the
percentage 𝟏𝟎𝟎(𝒆𝜷𝒌 − 𝟏)
17

Discussion of Estimated Results
• 𝜷lecture > 0: As the student’s lecture attendance increases, both at 1st and 2nd year level, the probability that the student will perform better increases, c.p.
100(𝑒1.035 − 1) =181.51 ← odds of passing increase by 181.5% for every attendance above 60% for 1st year level
100(𝑒0.634 − 1) = 88.51← odds of passing increase by 88.5% for every attendance above 60% at 2st year level
• At least a 60% of lecture attendance has a positive impact on student Performance. 18
VariableLogit Probit Logit Probit
LEC 1.035*** 0.634*** 0.456* 0.267*[5.47] [5.64] [1.71] [1.71]
TUT -0.135 -0.066 - -[-0.72] [-0.55] - -
1st Year Students 2nd Year Students
Discussion of Estimated Results
19
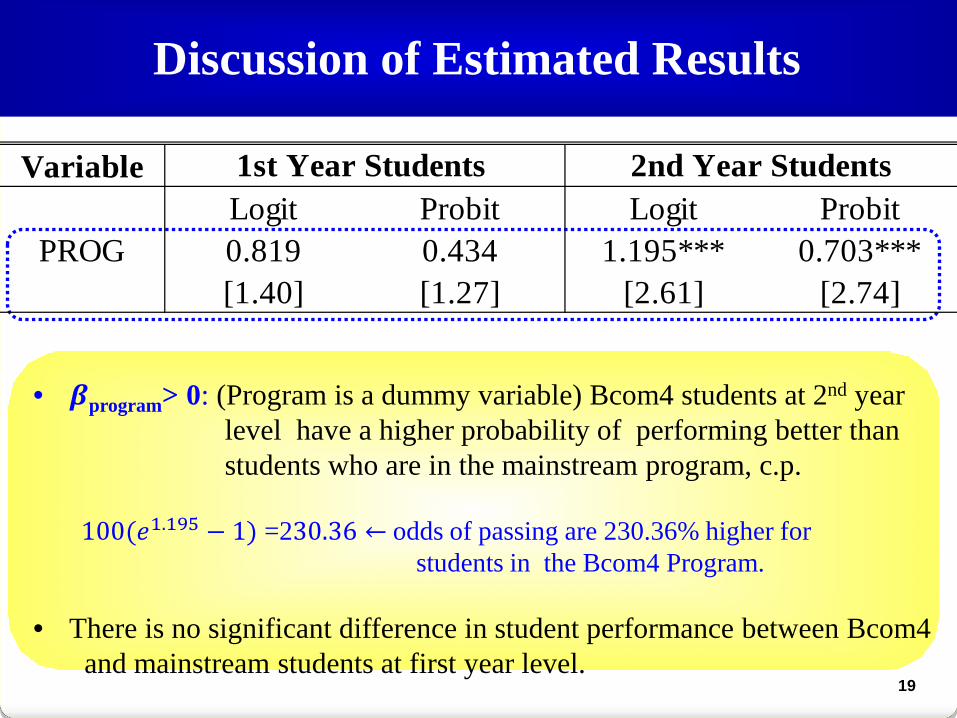
• 𝜷program> 0: (Program is a dummy variable) Bcom4 students at 2nd year level have a higher probability of performing better than students who are in the mainstream program, c.p.
100(𝑒1.195 − 1) =230.36 ← odds of passing are 230.36% higher for students in the Bcom4 Program.
• There is no significant difference in student performance between Bcom4 and mainstream students at first year level.
VariableLogit Probit Logit Probit
PROG 0.819 0.434 1.195*** 0.703***[1.40] [1.27] [2.61] [2.74]
1st Year Students 2nd Year Students

Discussion of Estimated Results
• 𝜷Metric> 0: the higher the student’s metric score, the higher the probability of them performing better in Economics. There is a direct relationship between student performance and their Metric Score. ( the odds of passing increases by 23.37% and 8.33% at 1sta nd 2nd year level , respectively)
20
• Age has a positive, but diminishing impact on student performance at first year level and insignificant at second year
VariableLogit Probit Logit Probit
METRIC 0.210*** 0.111*** 0.080** 0.045**[6.90] [7.26] [2.08] [2.03]
AGE 1.660** 0.995** 0.257 0.155[2.02] [1.99] [0.23] [0.22]
AGE2 -0.037* -0.023* -0.009 -0.005[-1.90] [-1.88] [-0.35] [-0.34]
1st Year Students 2nd Year Students
Discussion of Estimated Results
VariableLogit Probit Logit Probit
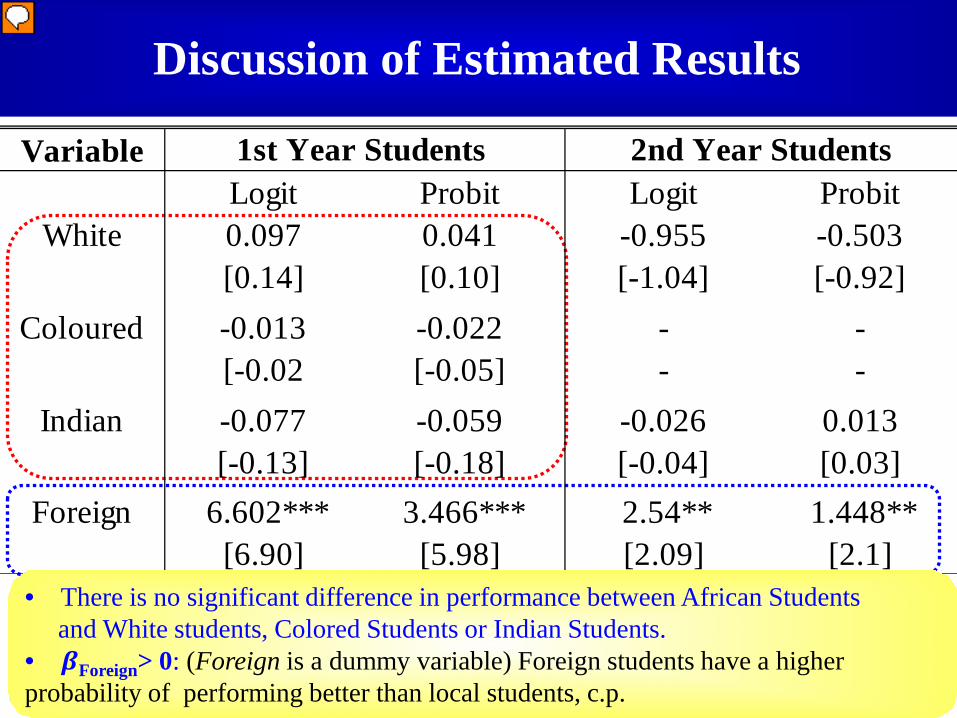
White 0.097 0.041 -0.955 -0.503[0.14] [0.10] [-1.04] [-0.92]
Coloured -0.013 -0.022 - -[-0.02 [-0.05] - -
Indian -0.077 -0.059 -0.026 0.013[-0.13] [-0.18] [-0.04] [0.03]
Foreign 6.602*** 3.466*** 2.54** 1.448**[6.90] [5.98] [2.09] [2.1]
1st Year Students 2nd Year Students
• There is no significant difference in performance between African Students and White students, Colored Students or Indian Students. • 𝜷Foreign> 0: (Foreign is a dummy variable) Foreign students have a higher probability of performing better than local students, c.p.
Discussion of Estimated Results
22
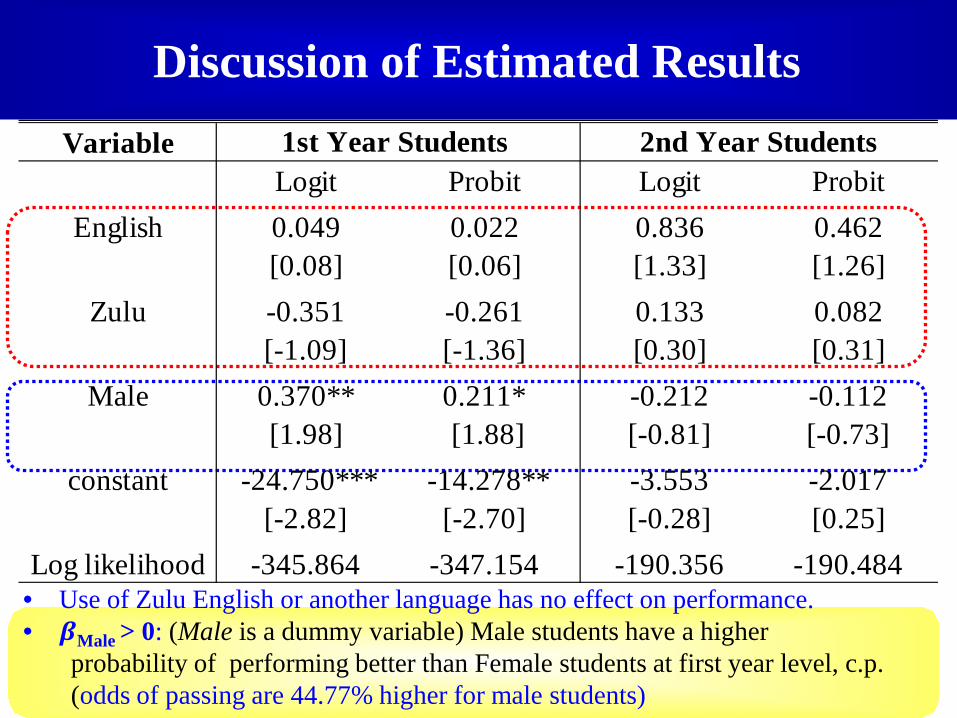
• Use of Zulu English or another language has no effect on performance. • 𝜷Male > 0: (Male is a dummy variable) Male students have a higher
probability of performing better than Female students at first year level, c.p. (odds of passing are 44.77% higher for male students)
VariableLogit Probit Logit Probit
English 0.049 0.022 0.836 0.462[0.08] [0.06] [1.33] [1.26]
Zulu -0.351 -0.261 0.133 0.082[-1.09] [-1.36] [0.30] [0.31]
Male 0.370** 0.211* -0.212 -0.112[1.98] [1.88] [-0.81] [-0.73]
constant -24.750*** -14.278** -3.553 -2.017[-2.82] [-2.70] [-0.28] [0.25]
Log likelihood -345.864 -347.154 -190.356 -190.484
1st Year Students 2nd Year Students

1st Year Proportion Correctly Predicted:
At 1st year level, model correctly predicts 70% (83+358)/630) of the observed outcomes.
However, while it correctly predicts 86.06% (358/416) of students who pass this module, it only correctly predicts the behaviour of 38.79% (83/214) of students who fail.
Therefore, the model is better at predicting who will pass, than who will not. 23
• Using the frequency values in this table, we calculated the proportion correctly predicted at 1st year level for: i. The sample as a whole ii. The sub-sample in which
Pass= 0 (the first column) iii. The sub-sample in which
Pass= 1 (the second column)
pred 0 1 Total0 83 58 1411 131 358 489
Total 214 416 630
Pass Dummy (0=fail,1=pass)
1st Year Proportion Predicted
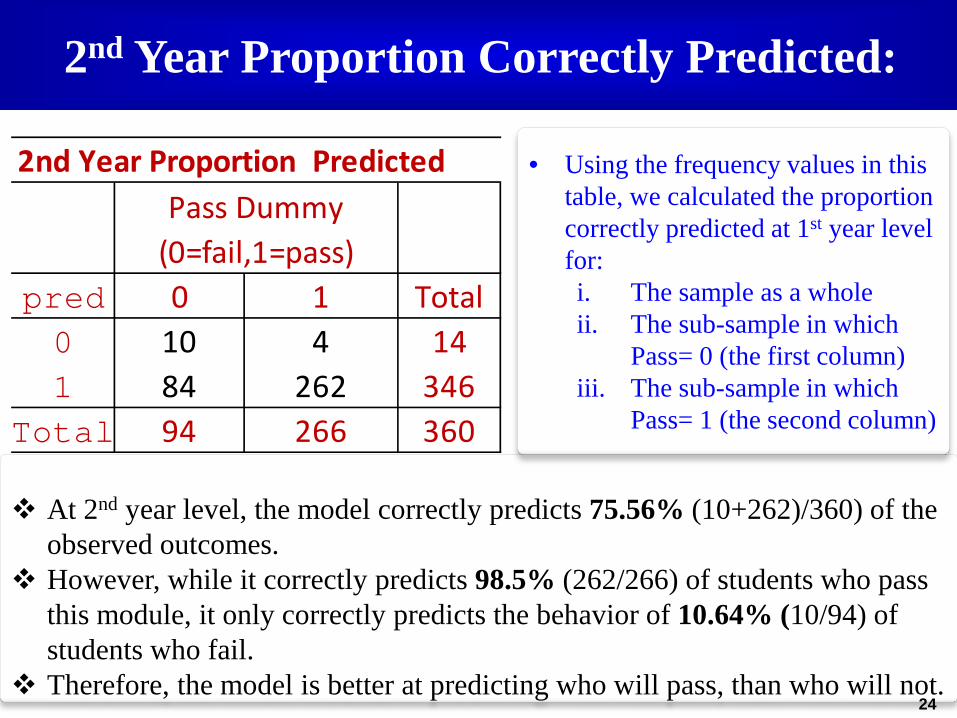
2nd Year Proportion Correctly Predicted:
At 2nd year level, the model correctly predicts 75.56% (10+262)/360) of the
observed outcomes. However, while it correctly predicts 98.5% (262/266) of students who pass
this module, it only correctly predicts the behavior of 10.64% (10/94) of students who fail.
Therefore, the model is better at predicting who will pass, than who will not. 24
• Using the frequency values in this table, we calculated the proportion correctly predicted at 1st year level for: i. The sample as a whole ii. The sub-sample in which
Pass= 0 (the first column) iii. The sub-sample in which
Pass= 1 (the second column)
pred 0 1 Total0 10 4 141 84 262 346
Total 94 266 360
Pass Dummy (0=fail,1=pass)
2nd Year Proportion Predicted

Conclusions and recommendations
Attendance plays a significant role in determining student performance, which is consistent with previous studies.
There is need to adopt a compulsory attendance policy across board of at-least 60% to enhance throughput.
The quality of students the university accepts significantly impacts
performance.
There is need to improve university entry requirements.
There is need for educational reform at secondary level to ensure our students are internationally competitive.
Demographic factors such as race, gender, home language and age
do not have much impact on performance. This is a reflection on improvements in equality in South Africa 25

Thank You!
26