the effectiveness of the flipped classroom for students
TRANSCRIPT

Rowan University Rowan University
Rowan Digital Works Rowan Digital Works
Theses and Dissertations
5-12-2017
The effectiveness of the flipped classroom for students with The effectiveness of the flipped classroom for students with
learning disabilities in an Algebra I resource setting learning disabilities in an Algebra I resource setting
Ashley Butterick Rowan University
Follow this and additional works at: https://rdw.rowan.edu/etd
Part of the Science and Mathematics Education Commons, and the Special Education and Teaching
Commons
Recommended Citation Recommended Citation Butterick, Ashley, "The effectiveness of the flipped classroom for students with learning disabilities in an Algebra I resource setting" (2017). Theses and Dissertations. 2410. https://rdw.rowan.edu/etd/2410
This Thesis is brought to you for free and open access by Rowan Digital Works. It has been accepted for inclusion in Theses and Dissertations by an authorized administrator of Rowan Digital Works. For more information, please contact [email protected].

THE EFFECTIVENESS OF THE FLIPPED CLASSROOM FOR STUDENTS
WITH LEARNING DISABILITIES IN AN ALGEBRA I RESOURCE SETTING
by
Ashley M. Butterick
A Thesis
Submitted to the
Department of Interdisciplinary and Inclusive Education
College of Education
In partial fulfillment of the requirement
For the degree of
Master of Arts in Special Education
at
Rowan University
May 1, 2017
Thesis Chair: Amy Accardo, Ed.D.

© 2017 Ashley M. Butterick
Dedications
I would like to dedicate this thesis to my husband, Franklin R. Butterick and my
son, Landon John Butterick. To my husband, thank you for being my best friend, my rock
and my number one fan. Without your endless love, support, encouragement and
proofreading this dream would not have become a reality. To my precious son, thank you
for listening to more research articles than children’s books in the first few months of
your life. You inspired me throughout this study to preserve and demonstrate to you,
through my actions, that anything is possible if you are willing to work for it.

iv
Acknowledgment
I would like to express my deepest appreciation and gratitude to Dr. Amy
Accardo for her words of wisdom and encouragement when I needed them most along
with her endless patience and guidance throughout this study.

v
Abstract
Ashley M. Butterick
THE EFFECTIVENESS OF THE FLIPPED CLASSROOM FOR STUDENTS WITH
LEARNING DISABILITIES IN AN ALGEBRA I RESOURCE SETTING
2016-2017
Amy Accardo, Ed.D
Master of Arts in Special Education
The purpose of this study was: (a) to examine the effectiveness of using the
flipped classroom model to improve the academic scores of students with a specific
learning disabilities (SLD), (b) to examine the effectiveness of using the flipped
classroom to improve rates of homework completion by students with a SLD and (c) to
evaluate student satisfaction and perception of the flipped classroom intervention. Five
high school students, four males and one female, with a SLD participated in the study. A
single subject ABAB design was used. During the baseline phases, students received
Algebra I instruction through a traditional classroom model. Class time was utilized for
direct instruction and practice problems were assigned for homework. During the
intervention, students received Algebra I instruction through the flipped classroom
model. Instructional videos and guided note sheets were assigned for homework and class
time was used for collaborative practice activities. Homework completion and daily
assessment scores were recorded across all phases. Results show that students improved
their rate of homework completion during the intervention phases. The student
satisfaction survey suggests that students enjoyed the flipped classroom and preferred it
to traditional instruction models. Further research is suggested investigating the academic
outcomes of the flipped classroom for students with SLD.

vi
Table of Contents
Abstract ............................................................................................................................v
List of Figures ..................................................................................................................ix
List of Tables ...................................................................................................................x
Chapter 1: Introduction ....................................................................................................1
Statement of the Problem ...........................................................................................1
Significance of the Study ...........................................................................................4
Purpose of the Study ..................................................................................................5
Research Questions ....................................................................................................5
Hypotheses .................................................................................................................6
Key Term ...................................................................................................................6
Chapter 2: Review of the Literature .................................................................................7
Technology Integration ..............................................................................................8
Student-Centered Education ......................................................................................10
The Flipped Classroom ..............................................................................................13
Community Impact ..............................................................................................16
Social and Emotional Development.....................................................................17
Academic Achievement .......................................................................................20
Conclusion .................................................................................................................26
Chapter 3: Methodology ..................................................................................................29
Setting ........................................................................................................................29
School ..................................................................................................................29
Classroom ............................................................................................................29

vii
Table of Contents (Continued)
Participants .................................................................................................................30
Participant 1 .........................................................................................................31
Participant 2 .........................................................................................................32
Participant 3 .........................................................................................................32
Participant 4 .........................................................................................................33
Participant 5 .........................................................................................................33
Research Design.........................................................................................................34
Materials ....................................................................................................................35
Measureable Materials ...............................................................................................35
Homework assignments .......................................................................................35
Daily assessments ................................................................................................35
Procedures ..................................................................................................................35
Measureable Procedures ............................................................................................36
Homework assignments .......................................................................................36
Academic grades ..................................................................................................36
Survey ..................................................................................................................37
Data Analysis .............................................................................................................38
Chapter 4: Results ............................................................................................................40
Academic Scores ........................................................................................................40
Homework Completion Rates ....................................................................................47
Survey Results ...........................................................................................................53
viii
Table of Contents (Continued)
Chapter 5: Discussion ......................................................................................................56
Findings......................................................................................................................56
Limitations .................................................................................................................59
Implications and Recommendations ..........................................................................60
Conclusions ................................................................................................................61
References ........................................................................................................................63

ix
List of Figures
Figure Page
Figure 1. Student satisfaction survey ...............................................................................38
Figure 2. Daily assessment scores Student A ..................................................................42
Figure 3. Daily assessment scores Student B...................................................................43
Figure 4. Daily assessment scores Student C...................................................................44
Figure 5. Daily assessment scores Student D ..................................................................45
Figure 6. Daily assessment scores Student E ...................................................................46
Figure 7. Homework completion rates Student A ...........................................................48
Figure 8. Homework completion rates Student B ............................................................49
Figure 9. Homework completion rates Student C ............................................................50
Figure 10. Homework completion rates Student D .........................................................51
Figure 11. Homework completion rates Student E ..........................................................52
x
List of Tables
Table Page
Table 1. General Information of Participating Students ..................................................31
Table 2. Mean and Standard Deviation of Daily Assessments across Phases .................41
Table 3. Mean and Standard Deviation of Homework Completion Rates across
Phases .................................................................................................................47
Table 4. Student Satisfaction Survey Percentage Results ................................................54

1
Chapter 1
Introduction
The Millennials, born between the years 1982 and 2002, occupy the seats and
desks in our high school classrooms today, and live in a world of instant gratification
with technology integrated into every aspect of their daily lives (Roehl, Reddy, &
Shannon, 2013; Webel & Otten, 2016). For example, high school students no longer need
to pull out a dictionary to look up an unknown word or leaf through an encyclopedia to
find the answer to a puzzling question; they simply reach for their iPhone to find the
answer. Socially, today’s high school students can hold multiple conversations at the
same time via text message, and academically they may have access to speech-to-text
technology that allows them to write an entire paper without ever holding a pen or
touching a keyboard (Bain, Basson, & Wald, 2002). Furthermore, apps exist that students
may use to complete their math homework simply by taking a picture of the posed
problem (Webel & Otten, 2016). With students likes these, teachers are faced with the
challenge of developing engaging and motivating lessons that incorporate the skills and
tools that high school students are confident with and proficient in using. It is the drive to
meet students’ needs, increase 21st century skills, and incorporate technology into daily
instruction that has led to the evolution of the flipped classroom model (Bishop &
Verleger, 2013; Lage, Platt, & Treglia, 2000; Roehl et al., 2013).
Statement of the Problem
There is undeniably an increased initiative to incorporate technology into the
classroom (Beldarrain, 2006; Carver, 2016; Satsangi & Bouck, 2015). A concern,
however, is how to effectively make a transition from traditional instruction to

2
technology rich instruction. Today’s students may be well versed in using technology for
social purposes, e.g. through Instagram, Twitter, SnapChat, and many other apps, but
may need to be taught how to use technology for academic purposes, and teachers and
educational staff need to play a critical role (Bain et al., 2002; Beldarrain, 2006; Carver,
2016).
The flipped classroom (also referred to as the inverted classroom) provides
students with video lectures that can be accessed from home and paired with
collaborative, student-centered activities during class time to aid mastery of concepts and
skills (e.g., Bishop & Verleger, 2013; Fulton, 2012; Gilboy, Heinerichs, & Pazzaglia,
2015). The flipped classroom design assigns video lectures for homework to replace the
instructional lectures that traditionally take place during class time. During class time,
teachers provide students with the opportunity to practice and explore new concepts and
skills through engaging, student-centered activities that focus on skill application and
productive collaboration (e.g., Bishop & Verleger, 2013; Fulton, 2012; Gilboy, et al.,
2015). The advantage of the flipped classroom is that students no longer need to depend
solely on peers or parents for support completing homework. They are able to watch the
instructional video provided by their teacher at any time and any place internet is
accessible to establish basic content knowledge. Then, students may receive support from
peers and teachers in the classroom setting where they further develop their skills through
application (e.g., Bishop & Verleger, 2013; Gilboy et al., 2015; Roehl et al., 2013).
A flipped classroom may meet the needs of high school students in the specific
content area of mathematics. Algebra 1 students may be quick to give up on homework
assignments when they begin to struggle because they are accustomed to having the

3
answers to all their questions in the time it takes to complete a google search (Marlowe,
2012; Westermann, 2014). Exceptional learners in a resource Algebra I classroom may
struggle to recall and retain procedural steps necessary to solve a given math problem
(Geary, 2004; Hallahan, Kauffman, & Pullen, 2015; Harrison, 2013). When students
must rely on peer support for homework assignments because the content being taught
exceeds their parents’ knowledge, students may become frustrated, see little value in the
assignment, and as a result, may not benefit from the additional practice (Marlowe,
2012).
Furthermore, many students with learning disabilities struggle to accurately copy
notes, listen to verbal explanations, and process procedural steps all at once (Geary, 2004;
Hallahan et al., 2015). Additionally, some students with learning disabilities struggle to
maintain focus for the duration of a lecture or demonstration of a mathematical process
(Geary, 2004; Hallahan et al., 2015). As a result, students may only comprehend the first
couple steps of mathematical procedures. Gilboy et al. (2015) report that a student’s
attention will likely decrease after the first 10 minutes of class, and students only recall
20% of the material taught during a given class period. This lack of attention and recall is
likely to have a negative impact on student outcomes, including test scores. It may also
result in gaps in content knowledge as students progress through subsequent mathematics
units (Geary, 2004). By utilizing the flipped classroom, students are able to learn at their
own pace (Fulton, 2012) For example, students can rewind detailed portions of a video
lecture, take breaks, and refer back to videos for future support as needed (Fulton, 2012).
Moreover, high school is a time when many parents struggle to relate to their
children who are quickly transitioning into young adults (Fulton, 2012; Marlowe, 2012).
4
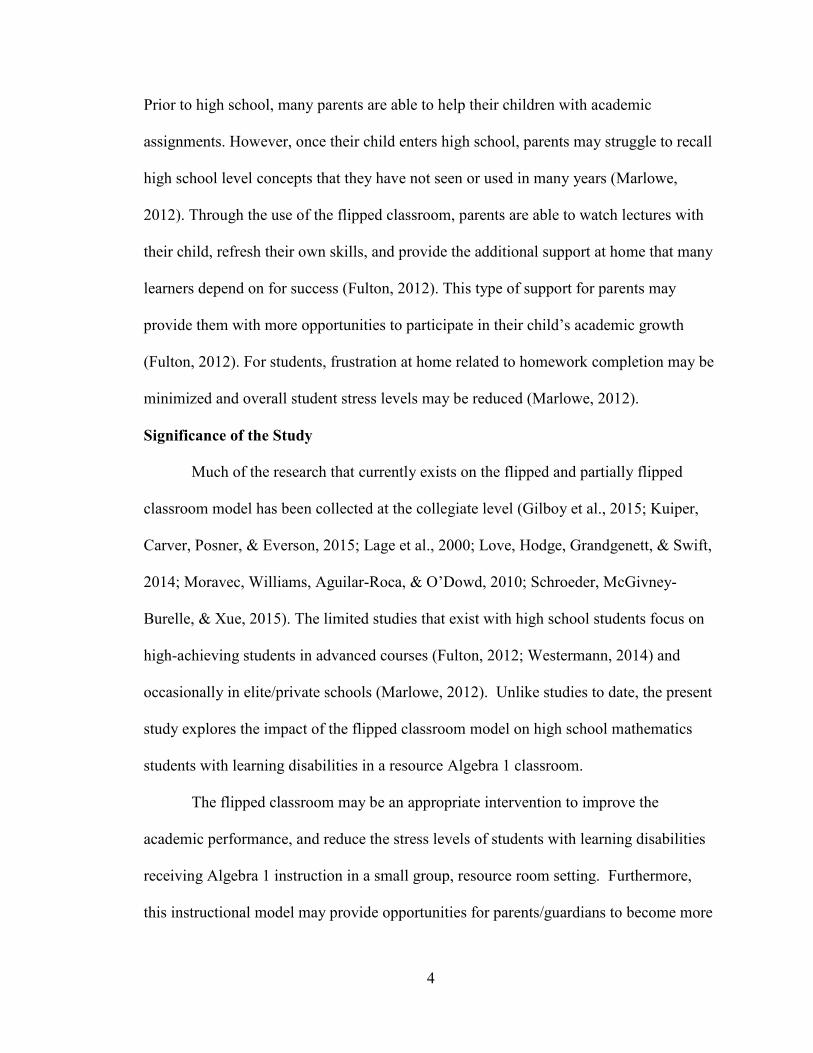
Prior to high school, many parents are able to help their children with academic
assignments. However, once their child enters high school, parents may struggle to recall
high school level concepts that they have not seen or used in many years (Marlowe,
2012). Through the use of the flipped classroom, parents are able to watch lectures with
their child, refresh their own skills, and provide the additional support at home that many
learners depend on for success (Fulton, 2012). This type of support for parents may
provide them with more opportunities to participate in their child’s academic growth
(Fulton, 2012). For students, frustration at home related to homework completion may be
minimized and overall student stress levels may be reduced (Marlowe, 2012).
Significance of the Study
Much of the research that currently exists on the flipped and partially flipped
classroom model has been collected at the collegiate level (Gilboy et al., 2015; Kuiper,
Carver, Posner, & Everson, 2015; Lage et al., 2000; Love, Hodge, Grandgenett, & Swift,
2014; Moravec, Williams, Aguilar-Roca, & O’Dowd, 2010; Schroeder, McGivney-
Burelle, & Xue, 2015). The limited studies that exist with high school students focus on
high-achieving students in advanced courses (Fulton, 2012; Westermann, 2014) and
occasionally in elite/private schools (Marlowe, 2012). Unlike studies to date, the present
study explores the impact of the flipped classroom model on high school mathematics
students with learning disabilities in a resource Algebra 1 classroom.
The flipped classroom may be an appropriate intervention to improve the
academic performance, and reduce the stress levels of students with learning disabilities
receiving Algebra 1 instruction in a small group, resource room setting. Furthermore,
this instructional model may provide opportunities for parents/guardians to become more

5
involved in their child’s learning through the instructional videos that can be viewed and
reviewed together at any time (Bishop & Verleger, 2013; Fulton, 2012; Marlowe, 2012).
Students with learning disabilities, especially those with processing difficulties and
ADHD, can successfully utilize mathematical procedures with scaffolding support but
may struggle to replicate the necessary steps when working independently or outside of
the classroom setting (Hallahan et al., 2015). This study will build on the
recommendations of Bishop and Verleger (2013) and Zainuddin and Halili (2016) to
evaluate the potential effect of the flipped classroom on the academic achievement and
homework completion of students with learning disabilities in a resource Algebra I
classroom.
Purpose of the Study
The purpose of this study is to investigate the effect of using a flipped classroom
on (1) academic performance and (2) homework completion of students with learning
disabilities receiving special education Algebra I instruction in a high school resource
mathematics classroom. In addition, the study will investigate student satisfaction with
the flipped classroom.
Research Questions
Research questions investigated in this study follow:
1. Will implementation of the flipped classroom increase the academic scores of
students receiving special education instruction in a high school resource Algebra I
classroom?

6
2. Will implementation of the flipped classroom increase homework completion
rates of students receiving special education instruction in a high school resource Algebra
I classroom?
3. Will students with learning disabilities be satisfied with the use of the flipped
classroom for instruction and practice in a high school resource Algebra I classroom?
Hypotheses
I hypothesize that Algebra 1 scores and frequency of homework completion will
improve with the use of the flipped classroom.
I hypothesize that students will be satisfied with the use of the flipped classroom
for instruction and practice in Algebra 1.
Key Term
For purposes of this study, the flipped classroom will be defined as “an
educational technique that consists of two parts: interactive group learning activities
inside the classroom, and direct computer-based individual instruction outside the
classroom” (Bishop & Verleger, 2013, p. 5).

7
Chapter 2
Review of the Literature
Approximately 13% of children and youth between the ages of 3 and 21 are
eligible for special education services under the regulations of IDEA and roughly 35% of
this population is found eligible for special services under the classification learning
disabled (U.S. Department of Education, 2016) making it by far the largest category of
special education (Hallahan et al., 2015). This equates to just under 5% of public school
children being serviced for one or more of the eight specific learning disability categories
(Hallahan et al., 2015; U.S. Department of Education, 2016; U.S. Department of
Education Office of Special Education Programs, 2006). Two of the eight specific
learning disability categories are directly related to mathematics: mathematics calculation
and mathematics problem solving (U.S. Department of Education Office of Special
Education Programs, 2006).
Mathematics is a core content subject in secondary education and a required area
of mastery for high school graduation in the United States. Success within this field of
study, measured by mastery of the Common Core State Standards, is believed to have a
direct effect on success in college, on future careers, and on today’s global economy
(Common Core State Standards Initiative, 2016; Satsangi & Bouck, 2015). For students
with a learning disability in mathematics, academic difficulties can range from basic
arithmetic skills to critical thinking and real-world application skills (Geary, 2004;
Satsangi & Bouck, 2015).
Given the significant population of students with learning disabilities needing
additional support and services in mathematics, it is important for teachers to provide
8
instruction that is highly engaging and rich in both computation skill and problem-solving
skill development (Geary, 2004). The flipped classroom has been found to increase levels
of engagement through a combination of technology integration and student-centered
learning (e.g., Bishop & Verleger, 2013; Gilboy et al., 2015; Marlowe, 2012) and may be
an effective instructional strategy for students with a learning disability in mathematics.
This chapter provides a review of the research related to the impact of the flipped
classroom, a strategy that integrates both technology and student-centered instruction,
and its implications for students with learning disabilities (LD).
Technology Integration
The findings of Satsangi and Bouck (2015) suggest that the integration of
technology may improve academic performance for students with learning disabilities. In
a study conducted with the purpose of investigating the effectiveness of virtual
manipulatives on acquisition, maintenance, and generalization for the concepts of area
and perimeter, concrete manipulatives were replaced with virtual online manipulatives
from the National Library of Virtual Manipulatives for three high school male students
with learning disabilities (Satsangi & Bouck, 2015). Results of this study indicate that all
three students increased math scores when finding area and perimeter, and all three
students were satisfied with the use of the online tool. The study suggests student
mathematics skills may be improved by the use of technology.
Mbugua, Kiboss, and Tanui (2015) found similar results conducting an
international study designed to evaluate teacher perceptions of the influence of
information communication technology (ICT) on students’ academic achievement.
Mbugua et al. surveyed and interviewed 486 teachers in 274 public secondary schools in

9
Nakuru County, Kenya (2015). Study findings reveal that teachers believe ICT is a vital
component of student achievement and has a positive influence on improving students’
academic performance. Mbugua et al. also found that teachers’ age and highest degree of
education influences the frequency of technology usage in both planning and delivery of
instructional material (2015). These significant findings suggest that frequently
integrating ICT throughout instructional planning, instructional delivery, and student
practice actively correlates with higher levels of students’ achievement. In addition,
academic performance may be influenced by the frequency and confidence teachers
express when using technology in the secondary schools (Mbugua et al., 2015).
Carver (2016) suggests that technology integration improves student engagement
and higher levels of engagement may contribute to improved academic performance.
Carver (2016) surveyed 68 graduate students in an education program to explore the
benefits and barriers of technology integration for teachers and students. All of the
graduate students participating in this study were current K-12 teachers (Carver, 2016). A
significant finding of this study was that the main barrier teachers and students are faced
with is technology availability (Carver, 2016). Without reliable tools, such as dependable
internet access and working electronic devices, teachers do not feel confident integrating
technology into their instruction (Carver, 2016). As a result, students may be less likely
to use the internet, assistive technology, and virtual manipulatives for educational
purposes when they are not modeled in the classroom (Carver, 2016). Students from low-
income households are often identified as “at risk” and are statistically more likely to be
classified with LD (Talbott, Fleming, Karabatsos, & Dobria, 2011). Therefore, many
students with LD may have limited accessibility and experiences with technology. This

10
can be another challenge when using technology for educational purposes with this
identified population (Talbott et al., 2011).
When integrated effectively, technology may lead to high levels of engagement
(Carver, 2016), meet the needs of students for educational opportunities not limited to
time or location (Beldarrain, 2006), and correlate with high levels of academic
performance (Mbugua et al., 2015; Satsangi & Bouck, 2015; Talbott et al., 2011) for
students with and without LD. Technology integration alone, however, is not enough to
lead to academic improvement. Carefully planned instruction that incorporates
scaffolding, encourages collaboration, and improves social interactions are also critical
for improving students’ academic performance (Beldarrain, 2006; Geary, 2004).
Student-Centered Education
Education has slowly but surely been making the transition from a large,
impersonal setting to an environment composed of small, caring communities (Aslan &
Reigeluth, 2016). This evolving educational atmosphere is geared towards self-directed
learning approaches and intrinsic motivation (Aslan & Reigeluth, 2016). In a student-
centered education model, students build their own knowledge through exploring
situations and analyzing real world problems (Saragih & Napitupulu, 2015). Supported
by the beliefs of current socio-constructivists, student-centered classrooms emphasize the
construction of knowledge obtained by individuals through social interactions with peers
and teachers (Ambrose, Bridges, DiPietro, Lovett, & Norman, 2010; Aslan & Reigeluth,
2016; Kogan & Laursen, 2014). Harrison (2003) suggests that student-centered learning
approaches may be particularly beneficial for students with LD because they
deemphasize literacy and language skills and increase the focus on activity-based

11
assignments with hands-on manipulation of concepts, areas of academic strength for
students with LD. While the student-centered learning environment may look different
across disciplines, in mathematics, students are engaged by exploring realistic
mathematical problems, hypothesizing and testing conjectures, constructing possible
solutions, and presenting discoveries through the explanation of their ideas and
procedures (Kogan & Laursen, 2014).
Saragih and Napitupulu (2015) believe that mathematics is not a ready-made
product and acquisition cannot be obtained by imitation, repetitive practice, or
memorization. In a study of private and public seventh grade students in North Sumatera,
Indonesia, a three step process was implemented to measure the effectiveness of a
student-centered approach on improving higher order mathematical thinking skills. First,
current levels of critical thinking abilities were assessed, then classroom instruction was
designed using a constructivist approach, and finally collected data was analyzed
(Saragih & Napitupulu, 2015). To evaluate the effectiveness of the student-centered
approach, Saragih and Napitupulu (2015) utilized high level mathematics thinking ability
tests, questionnaires to access students’ attitudes toward the learning model, and
observation sheets to measure the degree of application of higher order thinking skills in
classroom activities. Study results suggest that student-centered education may
significantly improve math competencies in the areas of problem solving, reasoning
ability, and concept connection identification (Saragih & Napitupulu, 2015). In addition,
students’ attitudes and motivation towards mathematics may be enhanced through the
student-centered approach to teaching (Saragih & Napitupulu, 2015).

12
Kogan and Laursen (2014) conducted a study to examine the impact of student-
centered learning in college mathematics on undergraduates’ grades and course selection
at two institutions. Specifically, this study analyzed the implications of student-centered
learning for two subpopulations: (1) low-achieving students based on grades from previous
mathematics courses, and (2) women compared to male peers. Reported findings suggest
that both men and women enrolled in a student-centered mathematics course earn grades
as good as or better than their peers in a traditional lecture course (Kogan & Laursen, 2014).
While Kogan and Laursen (2014) found similar academic results between genders, women
in the student-centered courses were more likely to report feelings of confidence and
concept mastery than their peers in the traditional lecture courses. There was no significant
difference seen in the grades of high achieving students in the student-centered and
traditional courses, but low-achieving students in the student-centered courses earned
consistently higher grades than their low-achieving peers in the traditional courses. These
results were maintained in subsequent mathematics courses. Low-achieving students from
the study’s original student-centered courses earned an average grade of a C+ in subsequent
courses while low-achieving students from the traditional courses earned an average grade
of a C. Therefore, the findings suggest the impact of student-centered learning is long-
lasting for low-achievers due to its potential to strengthen problem solving strategies and
study skills which can be generalized for subsequent courses (Kogan & Laursen, 2014).
Contrary to these findings, Aslan and Reigeluth (2016) found student-centered
education may not be appropriate or effective for mathematics instruction at the
secondary level. A study was designed with the purpose of examining the challenges of
student-centered instruction. Aslan and Reigeluth (2016) conducted a study at the

13
Minnesota New Country School. This school, providing education to secondary students
in grades 6-12, was ranked in the top eight charter schools in 2006 by the U.S.
Department of Education for its student-centered, project-based approach to education
(Aslan & Reigeluth, 2016). At this school, students design their own projects to meet
state standards and teacher advisors approve, monitor, and assess individual students’
progress. Aslan and Reigeluth (2016) interviewed nine teacher advisors, the school
principal, a co-founder, and a founding member to identify the challenges of learner-
centered education. One of the top three challenges identified was the school’s inability
to implement the project-based approach into mathematics classes because state standards
require students to move quickly through the curricula in order to meet all mathematics
graduation requirements (Aslan & Reigeluth, 2016). In addition, students often enter
mathematics classes at various levels of competency and bridging gaps through project-
based learning may be too time consuming within the constraints of a high school
mathematics course scope and sequence (Aslan & Reigeluth, 2016). Since students with
LD often require instruction that is highly structured, repetitive, and predictable
(Hallahan et al., 2015), student-centered learning alone may not be a successful strategy
for students with LD.
The Flipped Classroom
As defined by Bishop and Verleger the flipped classroom is “an educational
technique that consists of two parts: interactive group learning activities inside the
classroom, and direct computer-based individual instruction outside the classroom”
(2013, p. 5). This unique design evolved from the technology movement, an effort to
over-come physical barriers through the distribution of information in large quantities at a

14
low price, and the ideological movement, an effort to over-come man-made barriers by
addressing existing problems and ineffective approaches with open-mindedness and
creativity (Bishop & Verleger, 2013). In the flipped classroom model, instructional
lectures, which would typically occur during class time in the traditional classroom, are
recorded as video lectures and assigned for homework. The practice of new skills, which
traditionally is assigned for homework as a worksheet, takes place in the classroom in the
form of collaborative, student-centered activities (e.g., Fulton, 2012; Gilboy et al., 2015;
Westermann, 2014; Zainuddin & Halili, 2016). This instructional approach is geared to
the millennials who thrive in an educational environment that supports multi-tasking,
encourages group work, and focuses on the social aspects of learning (Roehl et al., 2013).
Lectures and the delivery of instruction which traditionally consumed the majority
of class time, are assigned for homework through video lectures utilizing technology
sources such as YouTube, Google Docs, Google Hangout, Khan Academy, and personal
blogs (Bishop & Verleger, 2013; Zainuddin & Halili, 2016). Appealing to the millennials
that make up today’s high school population, these lectures can be accessed 24/7 and
provide educational opportunities unrestricted by time and location (Beldarrain, 2006;
Fulton, 2012). In some cases, existing videos match the needs of the course and can be
utilized with few or no modification. Other times, teachers may wish to create their own
video lectures designed to meet the specific needs of the diverse learners in their
classrooms (Fulton, 2012).
With instruction occurring outside the classroom walls in a flipped classroom,
group class time can be used for “active learning” activities which Bishop and Verleger
(2013) identify as problem-solving learning, peer-assisted learning, cooperative learning,

15
and collaborative learning. This learning environment allowed for instantaneous
feedback, an important factor supporting today’s youth to build confidence and maintain
motivation (Fulton, 2012). These in-class activities also provide teachers the opportunity
to teach higher-order thinking skills and to integrate creativity, a component of education
that has gradually diminished as teachers have been placed under greater pressure to
prepare students for high-stakes tests (Roehl et al., 2013).
Direct instruction, a teacher-centered approach, and constructivist instruction, a
student-centered approach, are opposite instructional models. The flipped classroom, a
“unique combination of learning theories once thought to be incompatible” (Bishop &
Verleger, 2013, p. 2), addresses the technology integration concerns and the student-
centered education concerns of other researchers. When integrating technology for
educational purposes, Beldarrain (2006) warns that student-student and teacher-student
relationships could be negatively impacted due to the replacement of social interactions
with a technological interface. However, by utilizing a student-centered approach in the
classroom focused on group collaboration and peer-assisted assignments, social
interactions are considered and preserved (e.g., Gilboy et al., 2015; Lage et al., 2000;
Westermann, 2014).
In regard to student-centered education, Aslan and Reigheluth (2016) warned that
the problem-based instructional model may not be suitable for all students because it
requires students to alter their mindset from passive learners to self-directed learners
which can be both frustrating and difficult for low-achieving students. However, when
direct instruction is still provided through video lectures and active learning activities
driven by students but scaffolded by teachers, struggling and reluctant learners are

16
provided the necessary support and structure they need to succeed (Fulton, 2012;
Harrison, 2003; Kogan & Laursen, 2014)
As societal demands for improved instruction increase and financial resources are
less readily available and distributed to public schools, the flipped classroom may be an
effective and economical solution given the free accessibility to online tools (Bishop &
Verleger, 2013; Fulton, 2012; Lage et al., 2000). In a meta- analysis of twenty academic
journals between the years 2013 and 2015, Zainuddin and Halili (2016) aimed to identify
trends and commonalities in the research conducted on flipped classrooms. They found
numerous researchers identified positive impacts related to student learning in the areas
of communication, social-emotional development, and academic achievement.
Community impact. When discussing education, there are multiple
“communities” that exist. One type of community, a professional learning community
(PLC), exists within the district and is comprised of teachers who teach common courses
or who share groups of students as seen in middle school teams. The flipped classroom
may strengthen a PLC when teachers who teach similar courses share or collaborate as a
team to create video lectures, design active learning assignments, and compare student
progress scores to reflect upon and enhance instruction (Fulton, 2012).
Another type of community that is often referred to in education is the community
comprised of key stakeholders, namely parents and guardians, who are personally
invested in their children’s education and the daily outcomes of instruction. The flipped
classroom provides caregivers with a window into the classroom (Fulton, 2012). In
addition, when parents and students watch instructional videos together, they have the
opportunity to bond and parents are given the opportunity to help students with school
17
work especially when children are learning content that parents do not recall from their
own educational experiences (Fulton, 2012; Marlowe, 2012). In a voluntary parent survey
conducted by Fulton (2012) at the conclusion of a study in a high school setting using the
flipped classroom, 84% of parents reported that they preferred the flipped classroom
model over traditional instruction due to the frequent opportunities they were provided
with to participate in their child’s academic growth.
The third community that is impacted by the flipped classroom is the community
built within the classroom comprised of students, para-educators, and teachers. Supported
by Maslow’s hierarchy of needs theory, for this community to thrive and foster
productive learning, students must feel safe, secure, and confident to take academic risks
(Wininger, 2010). Since the vast majority of class time is designated for collaborative,
team-building activities and assignments within the flipped classroom framework,
positive teacher-student and student-student relationships are formed and strengthened
which cultivates an environment of trust and open-mindedness (Westermann, 2014). This
growth within the flipped classroom may lead to future success as students become better
prepared for the work place through the development and enhancement of critical
thinking skills, creativity, communication, collaboration, and adaptability to new
technology (Roehl et al., 2013).
Social and emotional development. While academic achievement is a high
priority goal of education, a child’s social and emotional growth is equally important
especially for students with LD who may need additional support and specific instruction
when it comes to social interactions with peers and teachers (Hallahan et al., 2015). Since
the flipped classroom is an interactive and engaging environment, students are provided

18
with multiple opportunities to socialize with peers in a supervised setting where teachers
can intervene and guide appropriate interactions as needed (Fulton, 2012).
In addition to face-to-face interactions, millennials are frequently presented with
scenarios that require appropriate interactions through digital forums such as emails,
discussion boards, and social media sites (Roehl et al., 2013). In a study of a high school
history class using the flipped classroom model, Westermann (2014) required students to
post questions and/or summaries to a discussion board following the video introduction
of primary sources. Reported findings suggest that when discussion boards are utilized as
a component of the flipped classroom, teachers can oversee and encourage effective,
productive and appropriate socialization in the digital world (Westermann, 2014).
Marlowe (2012) surveyed nineteen students in their second year of the
Baccalaureate Standard Level Environmental Systems and Societies program at the
Dubai American Academy in Dubai, United Arab Emirates to analyze student stress
levels when receiving instruction in the flipped classroom. Students were asked to rank
their level of stress on a Likert scale of 1 through 5. Students gave an average stress level
ranking of 2 out of 5 on the Likert scale for their flipped classrooms compared to their
non-flipped classrooms which they gave an average stress level ranking of 5 out of 5
(Marlowe, 2012). In addition, through surveys and interviews prior to the flip of the
classroom, Marlowe (2012) found that many students became very frustrated at home
while completing homework because they had to rely on peers since course material
exceeded their parents’ knowledge level in the content area. After the classroom was
flipped, students reported that they were much less frustrated with homework
assignments (Marlowe, 2012). The study findings suggest that there are emotional

19
benefits for all learners, but especially for low-achieving students because the flipped
classroom may lower stress levels.
While researchers have found mixed results when measuring student satisfaction
with the flipped classroom, the research overwhelming supports that the majority of
students are highly satisfied with the flipped classroom (e.g., Bishop & Verleger, 2013;
Gilboy et al., 2015; Lage et al., 2000). In a comprehensive study of prior and current
research of the flipped classroom, Bishop and Verleger (2013) report that most students
prefer in-person lectures to video lectures but also prefer interactive classrooms over in-
class lectures. Students reported that they were more likely to watch optional videos than
complete optional readings and by completing optional videos prior to class, students
were better prepared to participate in discussions and group collaboration (Bishop &
Verleger, 2013).
In contradiction to Bishop and Verleger’s findings, Gilboy et al. (2015) found that
76% of the 142 students who voluntarily took a survey to assess their perspectives of the
flipped classroom from two undergraduate nutrition courses preferred the video lectures
to in-person lectures. Similarly to Bishop and Verleger’s findings, Gilboy et al. (2015)
found that over half of students surveyed would rather participate in collaborative
activities during class sessions than sit through lectures. In addition, the majority of
students expressed positive feelings towards their mastery of content, confidence with the
materials used, and connection with their instruction when learning in a flipped
classroom course.
Lage et al. (2000) found similar results from a study of the use of the flipped
classroom in a microeconomic courses at Miami University. Lage and colleagues

20
conducted student surveys and interviews, and report that students were in favor of the
flipped classroom model, preferred the format of instruction and practice, believed they
learned better, enjoyed working with peers, felt more engaged, and believed their time
was well spent through meaningful video lectures and in-class activities (Lage et al.,
2000). In addition, instructors reported satisfaction with the flipped classroom and
reported observing students learning from their peers through discussions and
collaborative interactions (Lage et al., 2000)
Academic achievement. When it comes to emerging educational practices such
as the flipped classroom, investigating academic benefits and potential academic
improvement is essential. While there is a lack of research investigating student learning
outcomes objectively, anecdotal evidence strongly suggests academic achievement is
positively correlated with the utilization of the flipped classroom (e.g., Bishop &
Verleger, 2013; Fulton, 2012; Moravec et al., 2010). This may be due to the fact that the
flipped classroom allows for learning experiences to be individually matched to students’
unique learning styles and needs (Bishop & Verleger, 2013). The flipped classroom also
allows for more material to be covered either by the introduction of additional topics or a
deeper exploration of topics taught in the traditional classroom model (Kuiper et al.,
2015).
Video lectures, assigned for homework in the flipped classroom to replace
traditional in-class lectures, allow students to learn at their pace (Fulton, 2012). In many
content areas, but especially in mathematics, students enter the classroom at various
preparation levels and require a wide range of instructional time for mastery (Kuiper et
al. 2015). Video lectures allow quick learners to move rapidly through content, provide
21
struggling learners with the accessibility to review examples and instructional
explanations as many times as necessary, and allow all students to enter the classroom
with similar exposure to content topics (Fulton, 2012; Kuiper et al., 2015).
Contradictory to these findings, Gilboy et al. (2015) suggest, based on survey
results, that students may be dissatisfied with video lectures due to the inability to ask
questions in real-time. Despite the ability to re-watch lectures and learn at their own pace,
when students have questions, they cannot be asked and answered immediately as they
could be in a traditional learning setting and students may become frustrated,
unmotivated and give up (Gilboy et al., 2015; Kuiper et al., 2015).
Similarly, Herreid, Schiller, Herreid, and Wright (2014), warn that the flipped
classroom’s success hinders on high quality videos. When videos are recorded with poor
quality or the content and design of the videos are unattractive to the intended audience,
students may not be motivated to watch the videos or may find them difficult to follow
along with and understand (Kuiper et al., 2015; Zainuddin & Halili, 2016).
To address these valid concerns, Westermann (2014) suggests integrating a
discussion board with video lectures. This provides students with the opportunity to ask
questions as they arise and although questions may not be answered immediately, peers
can provide clarification and additional explanations on this forum prior to class
(Westermann, 2014). While content itself cannot always be altered to be more interesting
to adolescent learners, when teachers create their own videos, they can use examples that
appeal to students’ interests (Fulton, 2012). In addition Bishop and Verleger (2013),
found that shorter, rather than longer videos were more appealing to learners, especially
for low-achieving students who struggle to maintain attention and focus. They also found

22
positive results when classes began with an opportunity for students to ask question about
the video lectures for clarification followed by a brief quiz on the video material because
this provided students with the extrinsic motivation that some need to actively watch
lectures on a regular basis (Bishop & Verleger, 2013).
Fulton (2012) and Kuiper et al. (2015) suggest the flipped classroom may
improve classroom management as quick learners will be less likely to become bored and
behavioral problems during class lectures and struggling learners will be less likely to
become overwhelmed, confused, and act out during class lectures. With instruction taking
place outside of the classroom, additional class time is available for struggling learners to
receive one-on-one instruction and for all learners to ask questions as they receive
additional practice that the traditional classroom would not have allowed for due to time
constraints (Fulton, 2012; Kuiper et al., 2015; Westermann, 2014). Not only are students
receiving additional practice, but this practice is designed using a comprehensive
approach which allows students to build a deeper understanding through experience with
hands-on learning conclusive to the academic needs of students with LD and practical for
21st century skills development (Fulton, 2012; Kuiper, 2015).
The flipped classroom may also be academically beneficial for the student who is
frequently absent because, as long as the child has internet access, he can keep up-to-date
with classroom instruction through the online video lectures and practice worksheets can
be supplemented as needed for additional practice and skill acquisition (Fulton, 2012).
Fulton (2012) does warn that technology devices or internet access may not be available
at home, especially for “at-risk” populations. If this is the case, teachers should make an
effort to create CDs, DVDs, or flash drives of the lectures and have extra devices in the

23
classroom as well as provide time before, during, or after school for students to watch the
video lectures to ensure all students have the opportunity and tools to succeed (Fulton,
2012).
In Gilboy et al.’s study (2015) of the effectiveness of the flipped classroom for
two undergraduate nutrition courses consisting of 196 students, researchers aimed to
address all levels of Bloom’s taxonomy and evaluate students’ levels of engagement
through voluntary surveys. Before class, students were assigned video lectures which
satisfied the lower levels of Bloom’s taxonomy. During class, assignments were designed
to achieve high levels of Bloom’s taxonomy such as application, analysis and synthesis.
After class, students built upon higher level thinking skills through formative and
summative assessments (Gilboy et al., 2015). Survey results suggest that students were
pleased with the flipped classroom model, felt more engaged in the course, and had a
better understanding of the material taught through video lectures and applied practice in
class.
Marlowe (2012) found similar results in a study of high school seniors at the
Dubai American Academy enrolled in year 2 of the Baccalaureate Standard Level
Environmental Systems and Societies course. The 19 students in this course received
traditional instruction for the first semester and then the flipped classroom was used
during the second semester. In the second semester, students were assigned video lectures
for homework and required to post any question they had on the material presented or a
summary of the lecture to demonstrate their understanding if they did not have any
questions (Marlowe, 2012). These questions and summaries were then used at the
beginning of class periods to initiate large group discussions which lead into group

24
projects, lab activities, relevant readings, and student research. Most students showed an
increase in homework and assignment completion and on average, students’ grades
improved by 3 points from semester one to semester two with lower-achieving students
showing the most academic improvement (Marlowe, 2012). While academic
improvement was significant within the course, academic improvement across career
science courses was not significantly relevant (Marlowe, 2012).
Unlike Marlowe (2012), Day and Foley (2006) suggest the flipped classroom
results in significantly higher scores for all learners. Day and Foley studied the effect of a
flipped classroom on student grades using two sections of an introductory human-
computer interaction course, with 46 students taking part in this study. The same
instructor taught both sections but used the traditional lecture model for one section and
the flipped classroom for the other section (Day & Foley, 2006). To avoid bias, blind
grading was utilized. Results from this study showed students receiving instruction in the
flipped classroom scored significantly higher on all homework assignments, projects and
exams compared to their peers in the traditional lecture course (Day & Foley, 2006).
Moravec et al. (2010) conducted a study using the flipped classroom for three
lectures in an introductory biology course. Students watched PowerPoint lectures and
completed supplementary worksheets for homework. In class, students received 10
minute mini-lectures and 5-7 minutes of mini-active learning exercises. Researchers
found a 21% increase on student responses to exam questions (Moravec et al., 2010).
However, there were many short-comings of this study suggesting the results may not
entirely correlate to the flipped classroom. Limitations of this study included an

25
extremely short time frame that the intervention was used and the fact that a true flip did
not happen since students were still receiving in-class lectures (Moravec et al., 2010).
Love et al. (2014) conducted a study on the flipped classroom specific to
mathematics and aimed to evaluate the academic effectiveness of this intervention in the
content areas. In the Spring 2012 semester, sophomore level applied linear algebra
courses were used to compare the academic impact of the flipped classroom compared to
the traditional classroom. Twenty-seven students agreed to participate in this study from
the flipped sections and twenty-eight students participated from the traditional sections.
While researchers did not find any significant differences in academic performance when
comparing final exam scores, students in the flipped classroom reported a more favorable
experience in the course and were better able to identify real-world applications of the
concepts taught in their perspective careers (Love et al., 2014). These findings suggest
that the flipped classroom may be suitable for introductory level courses to spark
academic interest in STEM and other in-demand fields (Love et al., 2014).
Unlike Love et al. (2014), Schroeder et al. (2015) found strong evidence to
suggest the flipped classroom may have a positive impact on academic achievement in
mathematics. At a mid-sized, private university in the northeastern United States during
the Fall 2012 semester, all ten sections of the university’s Calculus I classes participated
in the study. Half of the classes were taught using the flipped classroom model and the
other half received instruction in a tradition lecture format (Schroeder et al., 2015).
Significant findings of this study suggest that students in the flipped classroom scored
higher than students in the traditional classroom (Schroeder et al., 2015). In addition the
DFW rate, identified as grades of a D, F, or withdraw, were significantly lower in the

26
flipped courses compared to the traditional course and furthermore, the DFW rates of the
flipped courses were lower than the university’s historical average rates for Calculus I
(Schroeder et al., 2015). This study continued into the Spring 2013 semester with willing
participants enrolled in Calculus II. All students in the Calculus II classes received
instruction in a non-flipped class but, the students who were taught in the flipped
classrooms for Calculus I continued to score higher on the Calculus II final exam
compared to the students who received instruction in the non-flipped Calculus I courses
(Schroeder et al., 2015). This finding suggests that the flipped classroom model may have
long-term academic benefits in mathematics (Schroeder et al., 2015). It is suggested that
the flipped classroom instruction may lead to higher levels of concept retention in
mathematics, content connections in subsequent courses, and improved study habits
which may lead students to be better prepared to participate in class (Schroeder et al.,
2015).
Conclusion
The integration of technology into classroom instruction has been found to be a
motivating and engaging tool for millennials who thrive in the digital world (Mbugua et
al., 2015; Carver, 2016; Beldarrain, 2006; Geary, 2004) and shows potential for
improving academic performance in the area of mathematics for students with LD
(Satsandi & Bouck, 2015; Talbott et al., 2011). However, technology integration does
have limitations and may result in diminished socialization which could be harmful to the
overall growth and development of students with LD (Beldarrain, 2006; Westermann,
2014). In addition, for “at risk” populations who come from low-income families,

27
exposure and accessibility to technology outside of the classroom may be limited or non-
existent (Fulton, 2012).
Student-centered instruction is an educational approach that has gained popularity
due to the potential to engage and motivate students, to improve academic performance,
and to encourage appropriate social skill acquisition (e.g., Ambrose et al., 2010; Aslan &
Reigeluth, 2016; Kogan & Laursen, 2014). For students with LD this educational model
may be particularly beneficial because it puts a strong emphasis on activity-based
learning and hand-on activities, a learning style that is successful for many students with
LD (Harrison, 2003). While some research suggests student-centered learning is a
suitable learning model for mathematics instruction (Kogan & Laursen, 2014; Saragih &
Napitupulu, 2015) others warn that mathematical gaps cannot be adequately bridged and
the rigorous mathematics curricula cannot be mastered through project-based student-
centered education within the time constraints of an academic school year (Aslan &
Reigeluth, 2016).
Therefore, a possible solution to the specific concerns of technology integration
and student-centered education is the careful and deliberate merging of these two
evolving movements in the flipped classroom model (e.g., Bishop & Verleger, 2013;
Gilboy et al., 2015; Zainuddin & Halili, 2016). It has been suggested that the flipped
classroom which utilizes video lectures for direction instruction as homework and
preserves class time for activity-based learning assignments (e.g., Fulton, 2012; Lage et
al., 2000; Westernmann, 2014) may be especially beneficial for today’s learners due to its
flexibility and focus on group work (Roehl et al., 2013). In addition, the flipped
classroom may have positive impacts on educational communities made up of teachers,
28
caregivers, and students (Fulton, 2012; Marlowe, 2012; Wininger, 2010; Westermann,
2014; Roehl et al., 2013), students’ social and emotional development (e.g., Fulton, 2012;
Roehl et al., 2013; Marlowe, 2012), and academic achievement (e.g., Bishop & Verleger,
2013; Gilboy et al., 2015; Marlowe, 2012) specifically in the area of mathematics (Love
et al., 2014; Schroeder et al., 2015).
While there is some research discussing the academic, social, and emotional
impact of the flipped classroom on low-achieving and struggling learners, there is a
significant lack of empirical research targeting students with learning disabilities.
Following the recommendations of other researchers (Bishop & Verleger, 2013;
Zainuddin & Halili, 2016), this study aims to investigate the effectiveness of the flipped
classroom in improving academic scores and homework completion of students with
learning disabilities in an Algebra I resource setting.

29
Chapter 3
Methodology
Setting
School. The study was conducted in a public high school in a southern New
Jersey school district. The school district consists of three high schools servicing students
from six different townships. Each high school in the district houses one of the following
magnet programs: Engineering and Environmental Science, Homeland Security and
Public Safety, or Biomedical Sciences. All three schools operate on an eight period
schedule with each period lasting forty-five minutes.
The high school consists of approximately 905 students in grades nine through
twelve. Approximately 16% of these students have IEPs and receive special education
services. The high school has a diverse student population. According to the New Jersey
Performance Report (New Jersey Department of Education, 2016), 65.9% of the students
are Caucasian, 17.3% are Hispanic, 12.9% are African American, and 3.9% are of Asian,
Pacific Island, Native American, or Multi-Racial decent.
Classroom. The classroom where the study took place is used by two special
education teachers for all mathematics resource classes. The classroom consists of two
teacher desks and nine student tables. There is one teacher computer and ELMO that sync
with the LED projector. The classroom has an interactive ENO smartboard. In addition,
there are two computers in the classroom designated for student use.
The study was conducted in the school’s two Algebra I resource classes taught by
the same teacher. The two Algebra I classes in this study are held daily during third and

30
sixth period. There is a paraprofessional in both sections of this course. None of the
participants in this study have a one-on-one aid.
Participants
This study included five ninth grade high school students, one female and four
males. All students in this study were classified with a specific learning disability (SLD).
They were found eligible for special services under a wide variety of sub-classifications
including: reading fluency (RF), written expression (WE), reading comprehension (RC),
listening comprehension (LC), mathematics problem solving (MPS), and mathematical
calculations (MC). All participants in this study have an IEP to meet their individualized
needs. Table 1 presents the general participation information.

31
Table 1
General Information of Participating Students
Student Age
(years)
Grade SLD Sub-
Classification
A 14 9 RF
WE
MPS
B 14 9 RC
MPS
C 14 9 LC
D 15 9 WE
MPS
MC
E 15 9 MPS
MC
Participant 1. Student A is a 14-year-old Caucasian male. He is eligible for
special education services under the classification SLD. He struggles to interact
appropriately with peers and to take responsibility for his behaviors. As a result, he is part
of the school’s dynamic learning group where professional counseling is provided during
the school day. Academically, this student is strong and picks up new concepts quickly.
Although he struggles to socialize with peers, he is very polite to teachers and eager to
participate in the Algebra I classroom. He is inconsistent with his work patterns and does
32
not always complete homework or turn in classwork assignments. He also struggles with
organization and has a difficult time finding assignments and notes. He aspires to attend
college after graduation and major in criminal justice. His ultimate goal is to be a police
officer.
Participant 2. Student B is a 14-year-old Caucasian female. She is eligible for
special education under the classification SLD. This student is frequently absent and
struggles to make up her missed work. She is polite to teachers and peers. She is reluctant
to participate in the large group, Algebra I classroom but works well with a partner or in a
small group. This student is most successful when opportunities for one-on-one
instruction are provided. In addition, she has a second mathematics class, Math Lab,
which aims to bridge gaps in mathematical concepts, support the students with current
mathematics curricula, and provide support for math homework and out-of-class
assignments. This student plans to graduate high school and attend college.
Participant 3. Student C is a 14-year-old Caucasian male who is eligible for
special education under the classification SLD. He is a focused student and usually
completes homework and classwork assignments. He works well independently and with
peers. This student is enrolled in a supportive class, Academic Foundations, which
teaches study strategies, organization techniques, and provides students with the
opportunity to work on homework and assignments from all classes with the support of a
special education teacher. He attends the school where this study was held through the
magnet program. He is an avid hockey player and a member of the school crew team.
This student plans to graduate high school and would like to continue his education at a
four-year university.

33
Participant 4. Student D is 15-year-old African American male and is eligible for
special education under the classification SLD. He is a social young man, well-liked by
teachers, and makes friends easily. He enjoys helping others in the classroom. In Algebra
I he often participates by answering questions and volunteering to put problems on the
board. He works well independently and with a partner but often needs scaffolding
support from the teacher or paraprofessional when a new skill is taught. This students has
a second mathematics class, Math Lab, which aims to bridge gaps in mathematical
concepts, support the students with current mathematics curricula, and provide support
for math homework and out-of-class assignments. This student was a member of the
wrestling team. After graduation he would like to attend college or learn the trade of
construction.
Participant 5. Student E is a 15-year-old Caucasian male. He is eligible for
special education under the classification SLD. Teachers describe him as hardworking,
dedicated, and polite. He gets along well with teachers and peers. Mathematics is his
most challenging subject and he often relies on peer support. This student benefits from
one-on-one instruction and frequent opportunities for re-teaching. This student is also
enrolled in a supportive class, Academic Foundations, which teaches study strategies,
organization techniques, and provides students with the opportunity to work on
homework and assignments from all classes with the support of a special education
teacher. This student would like to attend college after graduation. His interests include
instrumental music, writing music, creative writing, and stage crew.

34
Research Design
A single subject design with ABAB phases was used for this study. This study
explored the effect of the independent variable, the flipped classroom model, on the
dependent variables of homework completion and academic achievement. Homework
completion and academic achievement on daily assessments were measured throughout
the study. During Phase A, baseline data was collected for five sessions over one week by
the researcher. Instruction during this phase modeled a traditional classroom. Class time
was utilized for instructional lectures and practice. Each night a homework worksheet
was assigned for additional practice. At the beginning of the next class, homework was
scored for completion and students took a daily assessment regarding the previous day’s
instruction.
During Phase B, the flipped classroom model was introduced. Data was collected
for eight days, over two weeks. Students were assigned a video lecture ranging from six
to thirteen minutes accompanied by a guided note sheet for homework each night. The
following day, the guided note sheet was checked for completion and given a homework
score. Students then had the opportunity to ask questions before transitioning into a
student-centered activity to practice the new skill in a collaborative setting. At the end of
each class, students were given a daily assessment.
During the second Phase A, students returned to a traditional classroom model.
This phase included five sessions over one week. Two sessions took place on one day due
to a schedule change for PARCC testing. During the second Phase B, students returned to
the flipped classroom model and data was collected for eight additional days over two
weeks.

35
Materials
Two sets of materials were used during this study. During phase A, materials used
included guided note sheets, homework worksheets, and daily assessments. During the
intervention phases, materials used included video lectures, guided video lecture note
sheets, student-centered classroom activities, and daily assessments.
Measureable Materials
Homework assignments. Homework was assigned each night and checked for
completion at the beginning of the following class period. During phase A, homework
was assigned as practice problems that related to the class instruction. During phase B,
the intervention phases, students were assigned to watch instructional video lectures and
complete guided note sheets. Homework scores were assessed through the completion of
the guided note sheets.
Daily assessments. Each day students were given ten minutes to complete a short
assessment. During phase A, daily assessments were given as a warm-up activity. During
phase B, the intervention phase, daily assessments were given as a closure activity.
Procedures
This study took place over six weeks. Week 1 baseline data was collected on
participants’ homework completion rates and academic grades on daily assessments. At
the end of week 1, students were trained on how to access video lectures that would be
used during the intervention phases. Students were also introduced to the guided note
sheets that would accompany the video lectures and would be checked for completion as
homework grades. Weeks 2 and 3 were intervention weeks. Students watched video
lectures and completed guided note sheets for homework each night. The following class

36
period guided note sheets were checked for completion, student questions were
addressed, students participated in collaborative practice activities, and a daily
assessment was administered. Week 4 returned to baseline conditions. Week 5 and 6
returned to intervention conditions. At the end of week 6, participants were asked to
complete a voluntary, anonymous student satisfaction survey regarding the flipped
classroom intervention.
Measurement Procedures
Homework assignments. Throughout the study, homework was checked at the
beginning of the following class period for completion and given a score of 0-5: 0
indicated the homework was not attempted at all, 1 indicated the homework was
attempted but less than a quarter completed, 2 indicated a quarter of the homework was
completed, 3 indicated half the homework was completed, 4 indicated three-quarters of
the homework was completed, and 5 indicated the assignment was fully completed.
Academic grades. Academic grades were monitored each day through a short,
daily assessment. Assessments were always administered following instruction and a
practice activity. During the first and second A Phase, daily assessments were given as
warm-up activities; Instruction occurred the previous class period and practice problems
were completed for homework the previous evening. During the first and second B
Phases, daily assessments were given as closure activities; Instruction occurred the
previous evening through the homework video lecture and practice took place during
class time in the form of a collaborative activity. Each daily assessment was given a score
0-10. Points were earned for following procedural steps, showing mathematical work,
and finding the correct solution. A zero indicated the assessment was not attempted. One

37
through eight points were given for each of the eight procedural steps that were
accurately attempted. One point was given for showing mathematical work throughout
the problem and one point was given for accurate mathematical computations resulting in
the correct solution.
Survey. At the conclusion of the study, participants were asked to complete a
student satisfaction survey using a Likert Scale. Participants answered eight questions
regarding their satisfaction with the flipped classroom. The researcher read each question
aloud and paused to give participants the opportunity to circle the number that best
represented their perceptions of the flipped classroom intervention. Participants
answered each question with a rating of 1-5: 1 representing strongly disagree, 2
representing disagree, 3 representing neutral, 4 representing agree, and 5 representing
strongly agree. The questions inquired about participants’ preferences to video lectures,
to class activities and peer interactions, and to learning styles. Participants were
instructed to not put their names on the survey so they would remain anonymous. Figure
1 shows the survey participants were asked to complete.

38
Statement Strongly
Agree
Agree Neutral
Disagree
Strongly
Disagree
I prefer the video lectures to
in-class lectures.
5 4 3 2 1
I prefer video
lectures/guided note sheets
to practice worksheets for
homework assignments.
5 4 3 2 1
I prefer practice activities to
lectures during class time.
5 4 3 2 1
I enjoyed working with
peers during class time.
5 4 3 2 1
I felt frustrated when
watching video lectures and
completing guided note
sheets for homework.
5 4 3 2 1
I believe I had more
opportunities to ask
questions when the
classroom was flipped.
5 4 3 2 1
I believe I learned better
when the classroom was
flipped.
5 4 3 2 1
I enjoyed learning Algebra I
with the flipped classroom
model.
5 4 3 2 1
Figure 1. Student satisfaction survey
Data Analysis
Survey results were compiled, recorded as percentages, and reported in a table.
Homework completion scores and daily assessment scores were both converted into
percentages. The data from these two variables were displayed in visual line graphs. In
addition, results were compared and contrasted for each phase. The data points were used

39
to identify changes in mean performance between conditions. Mean and standard
deviations for homework completion rates and academic scores are reported in tables. A
comparison of results between phases helped to determine the effects of the flipped
classroom in an Algebra I resource setting for students with LD.

40
Chapter 4
Results
This single-subject design study utilized ABAB phases to examine the effect of
the flipped classroom model on academic grades and homework completion rates for
students with LD. Five high school freshman, receiving Algebra 1 instruction in a
resource room setting, participated in this study. Research questions investigated in this
study follow:
1. Will implementation of the flipped classroom increase the academic scores of
students receiving special education instruction in a high school resource
Algebra I classroom?
2. Will implementation of the flipped classroom increase homework completion
rates of students receiving special education instruction in a high school
resource Algebra I classroom?
3. Will students with learning disabilities be satisfied with the use of the flipped
classroom for instruction and practice in a high school resource Algebra I
classroom?
Data was collected throughout all phases. Homework was checked daily for
completion and academic grades were measured through daily assessments. At the
conclusion of the study, participants completed a voluntary Likert scale survey regarding
their satisfaction with the flipped classroom model.
Academic Scores
Academic scores were obtained through daily warm-up assignments and exit
tickets. These assessments were graded on a ten point scale with points being award for
showing work, using appropriate procedural steps, and accurate mathematical
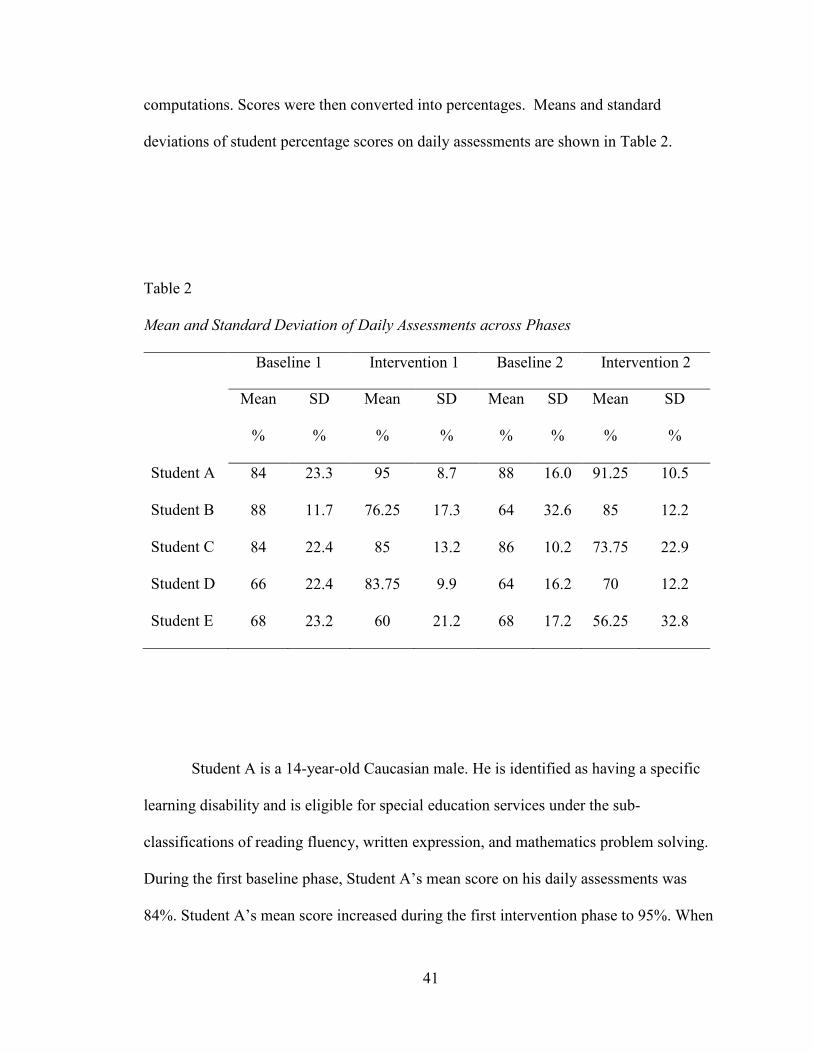
41
computations. Scores were then converted into percentages. Means and standard
deviations of student percentage scores on daily assessments are shown in Table 2.
Table 2
Mean and Standard Deviation of Daily Assessments across Phases
Baseline 1 Intervention 1 Baseline 2 Intervention 2
Mean
%
SD
%
Mean
%
SD
%
Mean
%
SD
%
Mean
%
SD
%
Student A 84 23.3 95 8.7 88 16.0 91.25 10.5
Student B 88 11.7 76.25 17.3 64 32.6 85 12.2
Student C 84 22.4 85 13.2 86 10.2 73.75 22.9
Student D 66 22.4 83.75 9.9 64 16.2 70 12.2
Student E 68 23.2 60 21.2 68 17.2 56.25 32.8
Student A is a 14-year-old Caucasian male. He is identified as having a specific
learning disability and is eligible for special education services under the sub-
classifications of reading fluency, written expression, and mathematics problem solving.
During the first baseline phase, Student A’s mean score on his daily assessments was
84%. Student A’s mean score increased during the first intervention phase to 95%. When
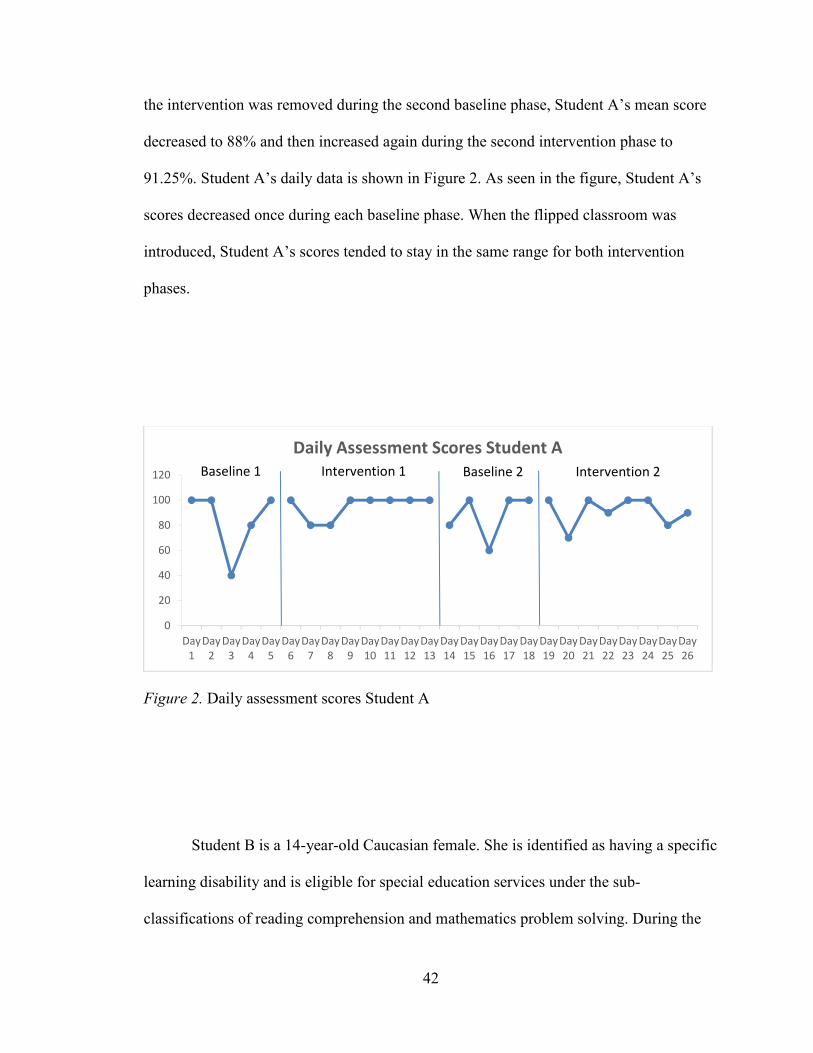
42
the intervention was removed during the second baseline phase, Student A’s mean score
decreased to 88% and then increased again during the second intervention phase to
91.25%. Student A’s daily data is shown in Figure 2. As seen in the figure, Student A’s
scores decreased once during each baseline phase. When the flipped classroom was
introduced, Student A’s scores tended to stay in the same range for both intervention
phases.
Figure 2. Daily assessment scores Student A
Student B is a 14-year-old Caucasian female. She is identified as having a specific
learning disability and is eligible for special education services under the sub-
classifications of reading comprehension and mathematics problem solving. During the
0
20
40
60
80
100
120
Day
1
Day
2
Day
3
Day
4
Day
5
Day
6
Day
7
Day
8
Day
9
Day
10
Day
11
Day
12
Day
13
Day
14
Day
15
Day
16
Day
17
Day
18
Day
19
Day
20
Day
21
Day
22
Day
23
Day
24
Day
25
Day
26
Daily Assessment Scores Student A
Baseline 1 Baseline 2 Intervention 1 Intervention 2
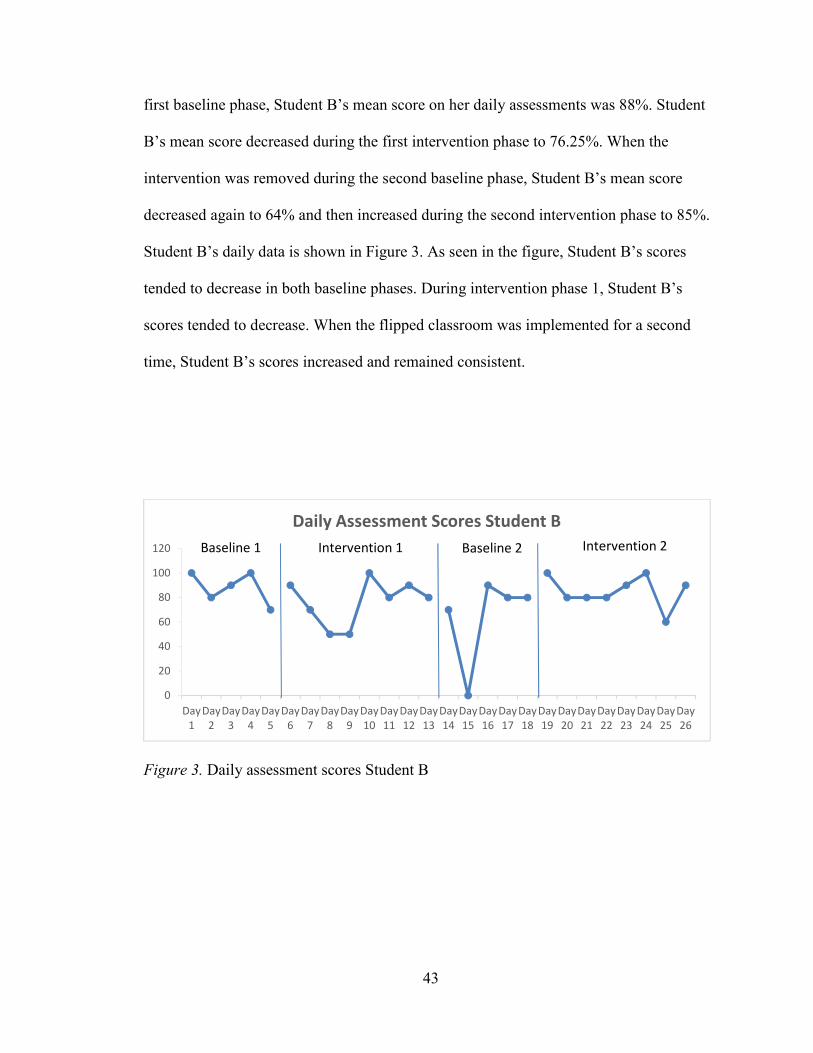
43
first baseline phase, Student B’s mean score on her daily assessments was 88%. Student
B’s mean score decreased during the first intervention phase to 76.25%. When the
intervention was removed during the second baseline phase, Student B’s mean score
decreased again to 64% and then increased during the second intervention phase to 85%.
Student B’s daily data is shown in Figure 3. As seen in the figure, Student B’s scores
tended to decrease in both baseline phases. During intervention phase 1, Student B’s
scores tended to decrease. When the flipped classroom was implemented for a second
time, Student B’s scores increased and remained consistent.
Figure 3. Daily assessment scores Student B
0
20
40
60
80
100
120
Day
1
Day
2
Day
3
Day
4
Day
5
Day
6
Day
7
Day
8
Day
9
Day
10
Day
11
Day
12
Day
13
Day
14
Day
15
Day
16
Day
17
Day
18
Day
19
Day
20
Day
21
Day
22
Day
23
Day
24
Day
25
Day
26
Daily Assessment Scores Student B
Baseline 1 Baseline 2 Intervention 1 Intervention 2

44
Student C is a 14-year-old Caucasian male. He is identified as having a specific
learning disability and is eligible for special education services under the sub-
classification of listening comprehension. During the first baseline phase, Student C’s
mean score on his daily assessments was 84%. Student C’s mean score increased slightly
during the first intervention phase to 85%. When the intervention was removed during the
second baseline phase, Student C’s mean score increased slightly again to 86%. During
the second intervention phase, Student C’s mean score decreased to 73.75%. Student C’s
daily data is shown in Figure 4. As seen in the figure, Student C’s scores fluctuated
during both intervention phases but ended at a consistent level.
Figure 4. Daily assessment scores Student C
0
20
40
60
80
100
120
Day
1
Day
2
Day
3
Day
4
Day
5
Day
6
Day
7
Day
8
Day
9
Day
10
Day
11
Day
12
Day
13
Day
14
Day
15
Day
16
Day
17
Day
18
Day
19
Day
20
Day
21
Day
22
Day
23
Day
24
Day
25
Day
26
Daily Assessment Scores Student C
Baseline 1 Baseline 2 Intervention 1 Intervention 2

45
Student D is a 15-year-old African American male. He is identified as having a
specific learning disability and is eligible for special education services under the sub-
classifications of mathematical computations and mathematics problem solving. During
the first baseline phase, Student D’s mean score on his daily assessments was 66%.
Student D’s mean score increased during the first intervention phase to 83.75%. When
the intervention was removed during the second baseline phase, Student D’s mean score
decreased to 64% and then increased again during the second intervention phase to 70%.
Student D’s daily data is shown in Figure 5. As seen in the figure, Student D’s scores
increased during the first baseline phase and decreased during the second baseline phase.
Student D’s scores increased during both flipped classroom intervention phases.
Figure 5. Daily assessment scores Student D
0
20
40
60
80
100
120
Day
1
Day
2
Day
3
Day
4
Day
5
Day
6
Day
7
Day
8
Day
9
Day
10
Day
11
Day
12
Day
13
Day
14
Day
15
Day
16
Day
17
Day
18
Day
19
Day
20
Day
21
Day
22
Day
23
Day
24
Day
25
Day
26
Daily Assessment Scores Student D
Baseline 1 Baseline 2 Intervention 1 Intervention 2

46
Student E is a 15-year-old Caucasian male. He is identified as having a specific
learning disability and is eligible for special education services under the sub-
classifications of mathematical computations and mathematics problem solving. During
the first baseline, Student E’s mean score on his daily assessments was 68%. Student E’s
mean score decreased during the first intervention phase to 60%. When the intervention
was removed during the second baseline phase, Student E’s mean score increased to 68%
and then decreased again during the second intervention phase to 56.25%. Student E’s
daily data is shown in Figure 6. As seen in the figure, Student E’s scores initially
decreased and then increased at the end of each phase. Student E’s scores were variable
across all phases.
Figure 6. Daily assessment scores Student E
0
20
40
60
80
100
120
Day
1
Day
2
Day
3
Day
4
Day
5
Day
6
Day
7
Day
8
Day
9
Day
10
Day
11
Day
12
Day
13
Day
14
Day
15
Day
16
Day
17
Day
18
Day
19
Day
20
Day
21
Day
22
Day
23
Day
24
Day
25
Day
26
Daily Assessment Scores Student E
Baseline 1 Baseline 2 Intervention 2 Intervention 1

47
Homework Completion Rates
Homework completion rates were obtained through daily homework checks.
Homework was graded on a five point scale to reflect the level of completion. Homework
scores were then converted into percentages. Means and standard deviations of student
percentage scores on homework completion rates are shown in Table 3.
Table 3
Mean and Standard Deviation of Homework Completion Rates across Phases
Baseline 1 Intervention 1 Baseline 2 Intervention 2
Mean
%
SD
%
Mean
%
SD
%
Mean
%
SD
%
Mean
%
SD
%
Student A 80 17.9 92.5 13.9 20 40 87.5 13.9
Student B 68 37.1 85 32.8 68 37.1 85 19.4
Student C 20 40.0 95 13.2 12 24 62.5 33.8
Student D 72 29.9 82.5 33.8 36 44.5 82.5 33.8
Student E 44 40.8 75 43.3 8 16 82.5 33.8

48
During the first baseline phase, Student A’s mean score for homework completion
was 80%. Student A’s mean score increased during the first intervention phase to 92.5%.
During the second baseline phase, Student A’s mean score decreased to 20% and then
increased again during the second intervention phase to 87.5%. Student A’s daily data is
shown in Figure 7. As seen in the figure, Student A’s rate of homework completion
tended to decrease during both baseline phases. During both flipped classroom
intervention phases, Student A’s rate of homework completion stayed in a more
consistent range.
Figure 7. Homework completion rates Student A
0
20
40
60
80
100
120
Day
1
Day
2
Day
3
Day
4
Day
5
Day
6
Day
7
Day
8
Day
9
Day
10
Day
11
Day
12
Day
13
Day
14
Day
15
Day
16
Day
17
Day
18
Day
19
Day
20
Day
21
Day
22
Day
23
Day
24
Day
25
Day
26
Homework Completion Rates Student A
Baseline 1 Baseline 2 Intervention 1 Intervention 2
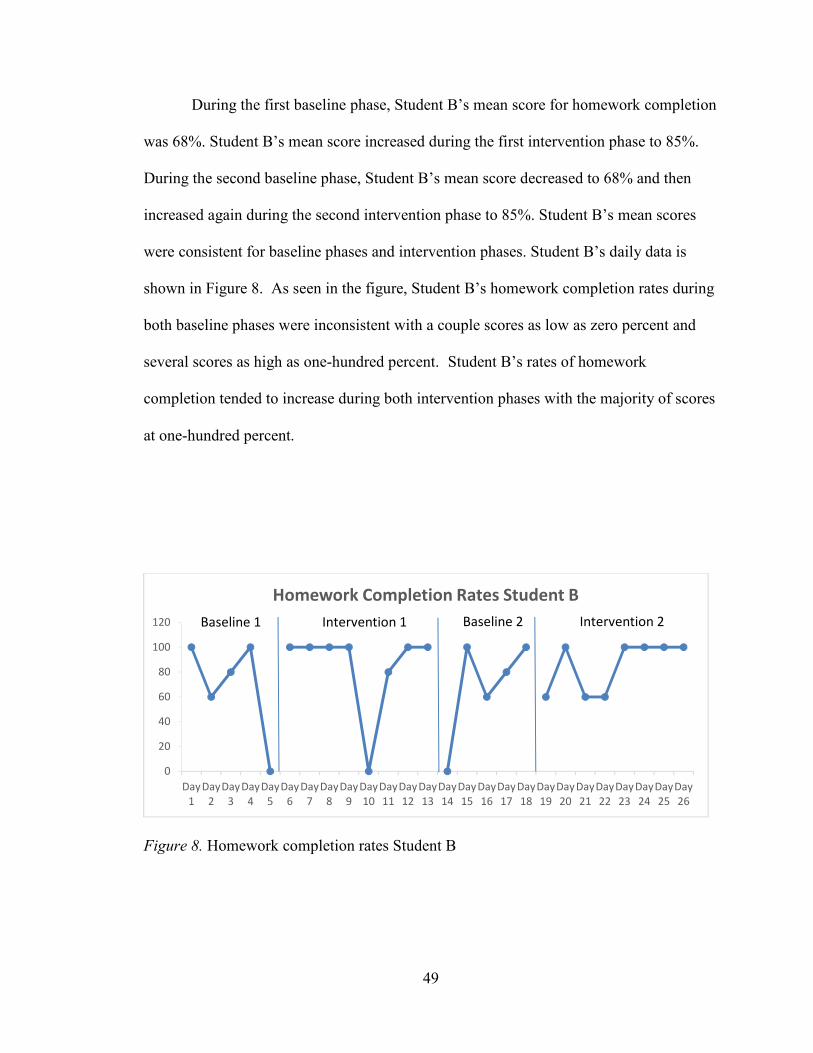
49
During the first baseline phase, Student B’s mean score for homework completion
was 68%. Student B’s mean score increased during the first intervention phase to 85%.
During the second baseline phase, Student B’s mean score decreased to 68% and then
increased again during the second intervention phase to 85%. Student B’s mean scores
were consistent for baseline phases and intervention phases. Student B’s daily data is
shown in Figure 8. As seen in the figure, Student B’s homework completion rates during
both baseline phases were inconsistent with a couple scores as low as zero percent and
several scores as high as one-hundred percent. Student B’s rates of homework
completion tended to increase during both intervention phases with the majority of scores
at one-hundred percent.
Figure 8. Homework completion rates Student B
0
20
40
60
80
100
120
Day
1
Day
2
Day
3
Day
4
Day
5
Day
6
Day
7
Day
8
Day
9
Day
10
Day
11
Day
12
Day
13
Day
14
Day
15
Day
16
Day
17
Day
18
Day
19
Day
20
Day
21
Day
22
Day
23
Day
24
Day
25
Day
26
Homework Completion Rates Student B
Baseline 1 Baseline 2 Intervention 1 Intervention 2
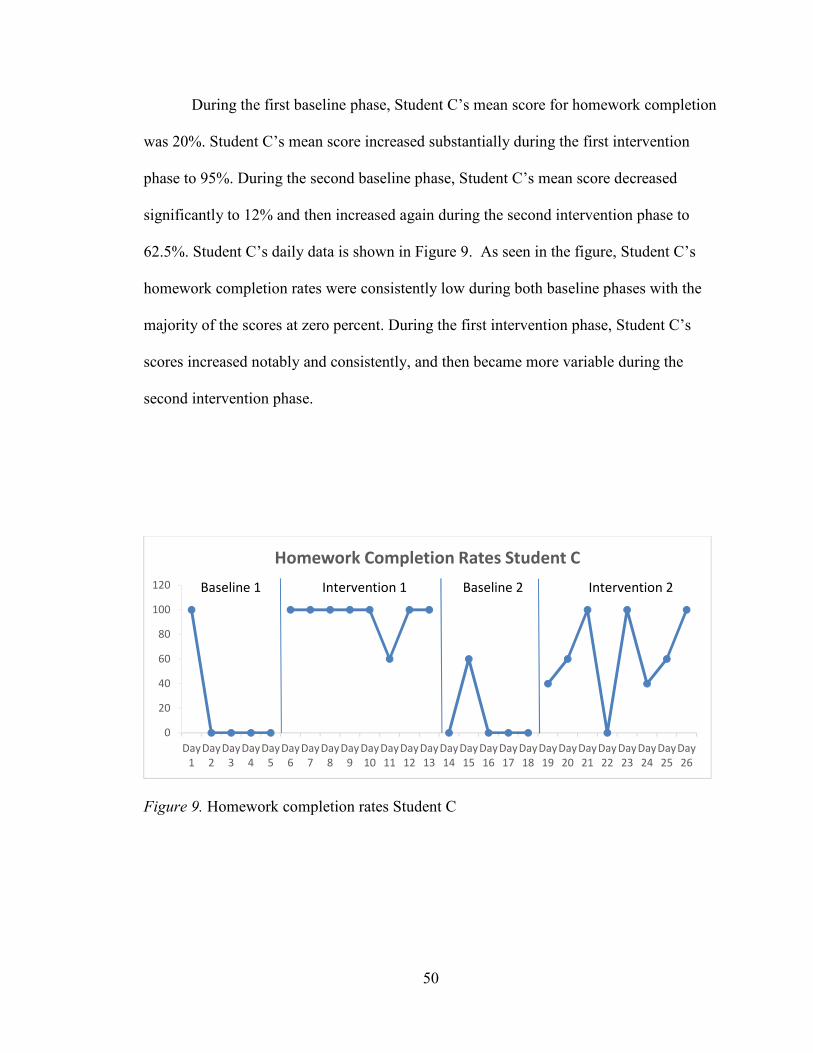
50
During the first baseline phase, Student C’s mean score for homework completion
was 20%. Student C’s mean score increased substantially during the first intervention
phase to 95%. During the second baseline phase, Student C’s mean score decreased
significantly to 12% and then increased again during the second intervention phase to
62.5%. Student C’s daily data is shown in Figure 9. As seen in the figure, Student C’s
homework completion rates were consistently low during both baseline phases with the
majority of the scores at zero percent. During the first intervention phase, Student C’s
scores increased notably and consistently, and then became more variable during the
second intervention phase.
Figure 9. Homework completion rates Student C
0
20
40
60
80
100
120
Day
1
Day
2
Day
3
Day
4
Day
5
Day
6
Day
7
Day
8
Day
9
Day
10
Day
11
Day
12
Day
13
Day
14
Day
15
Day
16
Day
17
Day
18
Day
19
Day
20
Day
21
Day
22
Day
23
Day
24
Day
25
Day
26
Homework Completion Rates Student C
Baseline 1 Baseline 2 Intervention 1 Intervention 2

51
During the first baseline phase, Student D’s mean score for homework completion
was 72%. Student D’s mean score increased during the first intervention phase to 82.5%.
During the second baseline phase, Student D’s mean score decreased significantly to 36%
and then increased again during the second intervention phase to 82.5%. Student D’s
mean scores were consistent across the two intervention phases. Student D’s daily data is
shown in Figure 10. As seen in the figure, Student D’s rate of homework completion was
variable across all phases. Student D’s homework completion scores during the
intervention phases increased and ended consistently.
Figure 10. Homework completion rates Student D
0
20
40
60
80
100
120
Day
1
Day
2
Day
3
Day
4
Day
5
Day
6
Day
7
Day
8
Day
9
Day
10
Day
11
Day
12
Day
13
Day
14
Day
15
Day
16
Day
17
Day
18
Day
19
Day
20
Day
21
Day
22
Day
23
Day
24
Day
25
Day
26
Homework Completion Rates Student D
Baseline 1 Baseline 2 Intervention 1 Intervention 2

52
During the first baseline phase, Student E’s mean score for homework completion
was 44%. Student E’s mean score increased during the first intervention phase to 75%.
During the second baseline phase, Student E’s mean score decreased significantly to 8%
and then increased substantially during the second intervention phase to 82.5%. Student
E’s daily data is shown in Figure 11. As seen in the figure, Student E’s rate of homework
completion was low during both baseline phases with a few scores as low as zero percent.
During both flipped classroom intervention phases, Student E’s scores increased and
remained consistent at one-hundred percent with fewer decreased scores.
Figure 11. Homework completion rates Student E
0
20
40
60
80
100
120
Day
1
Day
2
Day
3
Day
4
Day
5
Day
6
Day
7
Day
8
Day
9
Day
10
Day
11
Day
12
Day
13
Day
14
Day
15
Day
16
Day
17
Day
18
Day
19
Day
20
Day
21
Day
22
Day
23
Day
24
Day
25
Day
26
Homework Completion Rates Student E
Baseline 1 Baseline 2 Intervention 1 Intervention 2

53
Survey Results
All students voluntarily completed a Likert scale satisfaction survey after the
completion of the second intervention phase. Results were tallied and converted into
percentages. The student response percentages for each category in the eight survey
statements is presented in Table 4.

54
Table 4
Student Satisfaction Survey Percentage Results
Statement 5
Strongly
Agree
(%)
4
Agree
(%)
3
Neutral
(%)
2
Disagre
e
(%)
1
Strongly
Disagree
(%)
I prefer the video lectures to
in-class lectures.
80 20 0 0 0
I prefer video
lectures/guided note sheets
to practice worksheets for
homework assignments.
60 20 20 0 0
I prefer practice activities to
lectures during class time.
60 20 20 0 0
I enjoyed working with
peers during class time.
60 40 0 0 0
I felt frustrated when
watching video lectures and
completing guided note
sheets for homework.
0 0 20 20 60
I believe I had more
opportunities to ask
questions when the
classroom was flipped.
60 20 20 0 0
I believe I learned better
when the classroom was
flipped.
40 40 20 0 0
I enjoyed learning Algebra I
with the flipped classroom
model.
40 40 20 0 0
As seen in Table 4, a rating of 5 or 4 indicated the students agreed to some degree
with the statement. A rating of 3, indicated a neutral position on the statement. A rating
of 2 or 1, indicated the students disagreed to some degree with the statement. Table 4
shows that all students agreed or strongly agreed with the statements “I prefer the video

55
lectures to in-class lectures” and “I enjoyed working with peers during class time”. Most
students agreed that they preferred video lectures and guided note sheets to practice
worksheets for homework assignments and preferred practice activities to lectures during
class time. Most students believed they had more opportunities to ask questions and
learned better when the classroom was flipped. Most students disagreed or strongly
disagreed with the statement, “I felt frustrated when watching video lectures and
completing guided note sheets for homework”. Overall, the majority of students reported
enjoying learning Algebra 1 with the flipped classroom model.

56
Chapter 5
Discussion
The purpose of this study was to determine the effectiveness of the flipped
classroom model as an intervention for improving academic grades and homework
completion rates for Algebra I students with LD. At the end of the study, participants
were asked to complete a voluntary satisfaction survey to assess their perceptions of the
flipped classroom model.
Findings
Research suggests that the flipped classroom is an effective intervention for
improving homework completion rates among high school students (Marlowe, 2012).
The results of all five participants in the present study corroborate the research of
Marlowe (2012) in which students improved their rates of homework completion when
using the flipped classroom. In addition, survey results support the findings of Gilboy et
al. (2015) which found most students preferred homework video lectures paired with in-
class collaborative activities, to in-class lectures with individual practice homework
assignments.
Previous research also suggests that the flipped classroom may results in
significantly higher academic scores for all students (Day & Foley, 2006) specifically in
the area of mathematics (Schroeder et al., 2015). The results of the present study for
Students A and D support these findings. During the first baseline-intervention cycle,
Student A’s mean daily assessment percentage increased from 84% to 95%. In the second
cycle similar results were found with an increase from 88% to 91.25%. Student D also
demonstrated improved academic scores between baseline and intervention phases. From
the first baseline phase to the first intervention phase Student D’s mean daily assessment
57
score increased by 17.75 percentage points and increased 6 percentage points from the
second baseline phase to the second intervention phase. Interestingly, Student A and D
were the only two students with a SLD sub-classification identifying weakness in the area
of written expression.
Contradictory to the findings of Schroeder et al. (2015) and in support of the
research conducted by Love and colleagues (2014), Students B and C exhibited no
significant increase in academic performance and actually showed mixed results between
baseline-intervention cycles. Between the first baseline phase and first intervention phase,
Student B’s mean daily assessment score decreased by 11.75 percentage points but,
between the second baseline and intervention phase, her mean daily assessment score
increased by 21 percentage points. Student B’s decrease in academic performance during
the first intervention phase may be explained by inconsistent attendance. During that time
frame, this student often missed class entirely or came to class late missing out on the full
benefits of the collaborative in-class activities. As a result, her first intervention phase
mean daily assessment percentage is solely a representation of her understanding of the
video lectures.
Student C’s mean daily assessment score remained relatively consistent during the
first cycle increasing 1 percentage point from the first baseline phase to the first
intervention phase. During the second cycle, Student C had a mean daily assessment
score of 86% during the baseline phase and then dropped 12.25 percentage points to
73.75% when the flipped classroom intervention was implemented again. Student C’s
inconsistency between phases may be explained in part by his recent participation on the
crew team. During the second intervention phase Student C was noticeably more tired
58
and less engaged during class time which he contributed to exhaustion from late practices
and staying up late working on homework for his classes. During this period, it appeared
Student C was having a particularly difficult time balancing his extracurricular activities
with his academic work.
Contradictory to much of the research regarding academic improvement, Student
D’s mean daily assessment scores decreased during both intervention phases. Fulton
(2012) warned that flipped classroom could be problematic for students in the “at risk”
population due to limited technology devices and internet access. It is believed that
Student D falls into this category. Although Student D’s homework completion rates did
increase during both intervention phases, access to the internet was not available at home
and video lectures (when completed) were done at school during his supportive study hall
period or after school during tutoring and library hours. Therefore, Student D did not
benefit from having 24/7 access to instruction which Fulton (2012) noted as a significant
benefit and contributing factor to academic improvement within the flipped classroom
model. Lastly, although not classified, Student D has been observed to have
communication and language difficulties. As a result, he struggled to collaborate
effectively with peers during in-class activities.
The present study reinforced many of the findings of Lage and colleagues (2000)
regarding student perspectives of the flipped classroom. Lage et al. (2000) found that
students favored the flipped classroom and believed they learned better when the flipped
classroom intervention was implemented. Eighty percent of students in the present study
agreed or strongly agreed with the statement “I believed I learned better when the
classroom was flipped.” Lage et al. (2000) also found that students preferred the format

59
of instruction and practice. These findings were also supported in the presented study
with 80% of participants expressing a preference of homework video lectures over
traditional homework assignments (worksheet practice problems) and 80% of participants
expressing a preference for in-class collaborative activities over in-class lectures. In
addition, 80% of students reported that the video lectures and guided note sheets which
were assigned for homework during intervention phases did not cause them to become
frustrated. This corroborates the research of Marlowe (2012) with findings that suggest
the flipped classroom reduces the level of stress and frustration at home related to
homework assignments.
Limitations
This study has several possible limitations. One limitation may have been the time
frame in which the study was conducted. This study was a master’s thesis conducted
during the spring semester. Due to the researcher’s maternity leave, this study could not
begin until March and had to be completed in a six week time frame. In the beginning of
the study, March, students were readjusting to the procedures and expectations of their
classroom teacher, the researcher. As the study progressed, they became more
comfortable and confident in their classroom.
Another limitation may have been the grouping of students during collaborative
activities in the intervention phases. Some days students worked well with their assigned
partner. Other days, personalities clashed or students were distracted and lacked focused.
However, with the support of the classroom paraprofessional, the researcher was able to
redirect participants to foster successful collaboration.

60
A third limitation of this study was the disruption of the building schedule. During
the second Phase A, PARCC testing took place during the first three sessions. As a result,
classes did not meet every day and multiple days of data collection took place during one
class session. In addition, on the last day of the second Phase A, classes were shortened
and class periods were shuffled to accommodate the school’s spring pep rally. On this
particular day, less time was allotted for instruction and classes met at atypical times.
Lastly, a single subject design lends itself to the limitation of a small sample size.
This study was conducted with five participants. The data may not be generalized beyond
these five students.
Implications and Recommendations
This study adds to the existing research on the effectiveness of the flipped
classroom in which academic performance on daily assessments and rates of homework
completion for students with a SLD were investigated individually. The implementation
of the instructional package in this research may lead educators to consider alternative,
non-traditional homework assignments to improve rates of homework completion. A
practical implication of this research is that homework video lectures paired with guided
note sheets appears effective in improving rates of homework completion. However, the
intervention may not be effective in improving academic outcomes on daily assessments
for all students with a SLD.
Although the study has its limitations, the data does suggest that the flipped
classroom helped students improve their rates of homework completion and may improve
academic performance for some students. Prior research, such as the study conducted by
Schroeder and colleagues (2015), has yielded much more promising results for the

61
academic outcomes in mathematics when the flipped classroom is utilized. Therefore,
there is a demand for research to continue on the use of the flipped classroom to improve
the academic performance of mathematics students. Most the research available on the
flipped classroom has been conducted with high achieving high school students (Fulton,
2012; Westermann, 2014) or college students (Gilboy et al., 2015; Kuiper et al., 2015;
Lage et al., 2000; Love et al., 2014; Moravec et al., 2010; Schroeder et al., 2015) so, there
is a demand for more research with the special education population.
In this study, all five of the participants with LD improved their rates of
homework completion during the flipped classroom intervention phases. Research should
be conducted with a larger sample size to included students with a variety of special
education classifications to determine if these findings can be generalized to all
exceptional learners.
From survey results, it seems that students liked the flipped classroom
intervention in Algebra 1. More research should be done in other content areas to
evaluate the effects of the flipped classroom in different academic settings. Students also
reported enjoying working with peers and participating in class activities. Research
should be done to determine if the flipped classroom has an effect on social interactions
and the development of pragmatic skills.
Conclusions
Overall, it appears that the flipped classroom will help students with LD to
increase their rates of homework completion. In addition, it seems that students with LD
were satisfied using the flipped classroom model. Further research, with a larger number
of participants, is needed to generalize these findings to high school students with

62
learning disabilities and to determine if the use of the flipped classroom may positively
impact high school students with other classifications. While this study attempted to
demonstrate the effectiveness of the flipped classroom intervention in improving
academic outcomes for students with LD, more research is needed with a larger sample
size, over an increased time frame, to draw more conclusive findings.

63
References
Ambrose, S. A., Bridges, M. W., DiPietro, M., Lovett, M. C., & Norman, M. K. (2010).
How learning works: Seven research-based principles for smart teaching. San
Francisco, CA: Jossey-Bass
Aslan, S., & Reigeluth, C. M. (2016). Examining the challenges of learner-centered
education. Phi Delta Kappan, 97(4), 63-68
Bain, K., Basson, S. H., & Wald, M. (2002). Speech recognition in university classrooms:
Liberated learning project. In Proceedings of the fifth international ACM
conference on Assistive technologies (pp. 192-196). ACM.
Beldarrain, Y. (2006). Distance education trends: Integrating new technologies to foster
student interaction and collaboration. Distance Education, 27(2), 139-153.
Bishop, J. L., & Verleger, M. A. (2013). The flipped classroom: A survey of the research.
In ASEE National Conference Proceedings, Atlanta, GA (Vol. 30, No. 9).
Carver, L. B. (2016). Teacher perception of barriers and benefits in K-12 technology
usage. Turkish Online Journal of Educational Technology - TOJET, 15(1), 110-
116
Common Core State Standards Initiative (Ed.). (2016). Mathematics Standards. Retrieved
from Common Core State Standards Initiative: Preparing America's Students for
College & Careers website: http://www.corestandards.org/Math/
Day, J. A., & Foley, J. D. (2006). Evaluating a web lecture intervention in a human–
computer interaction course. IEEE Transactions on Education, 49(4), 420-431.
Fulton, K. P. (2012). 10 reasons to flip: A southern Minnesota school district flipped its
math classrooms and raised achievement and student engagement. Phi Delta
Kappan, 94(2), 20.
Geary, D. C. (2004). Mathematics and learning disabilities. Journal of Learning
Disabilities, 37, 4–15.
Gilboy, M. B., Heinerichs, S., & Pazzaglia, G. (2015). Enhancing student engagement
using the flipped classroom. Journal of Nutrition Education and Behavior, 47(1),
109-114.
Hallahan, D. P., Kauffman, J. M., & Pullen, P. C. (2015). Exceptional Learners an
Introduction to Special Education (13th ed.). Upper Saddle River, NJ: Pearson.

64
Harrison, S. (2003). Creating a successful learning environment for postsecondary
students with learning disabilities: policy and practice. Journal of College
Reading and Learning, 33(2), 131-45.
Herreid, C. F., Schiller, N. A., Herreid, K. F., & Wright, C. B. (2014). A chat with the
survey monkey: Case studies and the flipped classroom. Journal of College
Science Teaching, 44(1), 75-80.
Kogan, M., & Laursen, S. L. (2014). Assessing long-term effects of inquiry-based
learning: A case study from college mathematics. Innovative Higher Education,
39(3), 183-199.
Kuiper, S. R., Carver, R. H., Posner, M. A., & Everson, M. G. (2015). Four perspectives
on flipping the statistics classroom: Changing pedagogy to enhance student-
centered learning. Primus, 25(8), 655-682.
Lage, M. J., Platt, G. J., & Treglia, M. (2000). Inverting the classroom: A gateway to
creating an inclusive learning environment. Journal of Economic Education,
31(1), 30-43.
Love, B., Hodge, A., Grandgenett, N., & Swift, A. W. (2014). Student learning and
perceptions in a flipped linear algebra course. International Journal of
Mathematical Education in Science and Technology, 45(3), 317-324.
Marlowe, C. A. (2012). The effect of the flipped classroom on student achievement and
stress. (Master’s Thesis), Montana State University, Bozeman, MT.
Mbugua, S. N., Kiboss, J., & Tanui, E. (2015). Influence of integration of information
communication technology in teaching on students' academic performance.
Journal of Education and Practice, 6(24), 7-13.
Moravec, M., Williams, A., Aguilar-Roca, N., & O'Dowd, D. K. (2010). Learn before
lecture: a strategy that improves learning outcomes in a large introductory biology
class. CBE-Life Sciences Education, 9(4), 473-481.
New Jersey Department of Education. (2016). In Cedar Creek High School Demographic
(pp. 1-19). Retrieved from NJ School Performance Report database. (Accession
No. 01-1790-060)
Roehl, A., Reddy, S. L., & Shannon, G. J. (2013). The flipped classroom: An opportunity
to engage millennial students through active learning strategies. Journal of Family
and Consumer Sciences, 105(2), 44-49.
Saragih, S., & Napitupulu, E. (2015). Developing student-centered learning model to
improve high order mathematical thinking ability. International Education
Studies, 8(6), 104-112.

65
Satsangi, R., & Bouck, E. C. (2015). Using virtual manipulative instruction to teach the
concepts of area and perimeter to secondary students with learning disabilities.
Learning Disability Quarterly, 38(3), 174-186
Schroeder, L. B., McGivney-Burelle, J., & Xue, F. (2015). To flip or not to flip? An
exploratory study comparing student performance in calculus I. Primus, 25(9-10),
876-885.
Talbott, E., Fleming, J., Karabatsos, G., & Dobria, L. (2011). Making sense of minority
student identification in special education: School context matters. International
Journal of Special Education, 26(3), 150-170.
U.S. Department of Education. (2016). Students with Disabilities. Retrieved from
National Center for Education Statistics website:
https://nces.ed.gov/fastfacts/display.asp?id=64
U.S. Department of Education Office of Special Education Programs. (2006).
Identification of Specific Learning Disabilities. Retrieved from Building the
Legacy: IDEA 2004 website:
http://idea.ed.gov/explore/view/p/%2Croot%2Cdynamic%2CTopicalBrief%2C23
%2C
Webel,C., & Otten, S. (2016). Teaching in a world with PhotoMath. The Mathematics
Teacher, 109(5), 368-373. doi:10.5951/mathteacher.109.5.0368
Westermann, E. B. (2014). A half-flipped classroom or an alternative approach?: Primary
sources and blended learning. Educational Research Quarterly, 38(2), 43-57.
Wininger, S. R., & Norman, A. D. (2010). Assessing coverage of Maslow's theory in
educational psychology textbooks: A content analysis. Teaching Educational
Psychology, 6(1), 33-48.
Zainuddin, Z., & Halili, S. H. (2016). Flipped classroom research and trends from
different fields of study. International Review of Research in Open and
Distributed Learning, 17(3), 313-340.