the effectiveness of magnesium oxide- based additives … · the effectiveness of magnesium...
TRANSCRIPT

THE EFFECTIVENESS OF MAGNESIUM OXIDE-
BASED ADDITIVES IN MITIGATING FOULING
PROBLEMS IN KRAFT RECOVERY BOILERS
by
Liming Zhao
A thesis submitted in conformity with the requirements
for the degree of Master of Applied Science
Department of Chemical Engineering and Applied Chemistry
University of Toronto
© Copyright by Liming Zhao 2011

ii
The Effectiveness of Magnesium Oxide-Based Additives in Mitigating
Fouling Problems in Kraft Recovery Boilers
Liming Zhao
Master of Applied Science
Department of Chemical Engineering and Applied Chemistry
University of Toronto
2011
ABSTRACT
Magnesium oxide-based additives have been used in kraft recovery boilers to minimize deposit
accumulation on superheater and generating bank tubes. Due to inconclusive results observed in
boilers and claims made for additive effectiveness backed by little scientific evidence, only a few
mills still use the additives for fouling control. A systematic study was performed to examine the
effect of MgO-based additives on deposit accumulation and removal under controlled laboratory
conditions, and to evaluate the additive effect in a kraft recovery boiler. The results show that
while the additive coating has no effect on deposition, it could ease deposit removal if a coating
greater than 5 µm can be applied on the tube surface effectively. Separate injection of additive
and black liquor had insignificant effect on deposition and removal. Results of the field study
show that the amount of additive collected on the tube is too small to have an impact.

iii
ACKNOWLEDGEMENTS
I would like to express my sincere gratitude to my thesis supervisor, Professor Honghi Tran, for
his excellent supervision throughout my M.A.Sc. study and research. With his enthusiasm,
inspiration, and professional guidance, he helped me to learn and grow from plenty opportunities
and challenges.
I would also like to thank my committee members, Professors Markus Bussmann and Mark
Kortschot, for their insightful comments and valuable advice.
I wish to thank Irving Pulp & Paper, Limited in Saint John, New Brunswick for supporting my
field study. My special thanks are due to Don McCabe for his help in providing me with test
samples as well as his assistance during the field study.
I am grateful to Sue Mao and Ameya Pophali for their helpful suggestions and valuable
discussions. My special gratitude goes to Anna Ho. Many thanks are due to my dear friends:
Tasnuva, Xiaofei, Monica, Fariba, Anton, Ivan, and Daniel for the stimulating discussions, for
the time we worked together, and for all the fun we have had in the last two years.
I would like to acknowledge members from the research program on “Increasing Energy and
Chemical Recovery Efficiency in the Kraft Pulping Process” for their financial support. This
research program is jointly supported by the Natural Sciences and Engineering Research Council
of Canada (NSERC) and the following pulp and paper related companies: Abitibi-Bowater Inc.,
Andritz Inc., Babcock & Wilcox Company, Boise Inc., Carter Holt Harvey, Celulose Nipo-
Brasileira S.A., Clyde-Bergemann Inc., Daishowa-Marubeni International Ltd., Fibria,
International Paper Company, Irving Pulp & Paper Limited, MeadWestvaco Corporation, Metso
Power Oy, Stora Enso Research, and Tembec Inc.
I am grateful to Dr. Mike Gorton from the Department of Geology for his help on analytical
work.
Last but not the least, I wish to thank my parents, Yi Zhao and Jun Cai, for their unconditional
love, passionate encouragement, and continuous support throughout my life. To them I dedicate
this thesis.

iv
TABLE OF CONTENTS
ABSTRACT................................................................................................................................... ii
ACKNOWLEDGEMENTS ........................................................................................................ iii
TABLE OF CONTENTS ............................................................................................................ iv
LIST OF TABLES ....................................................................................................................... vi
LIST OF FIGURES .................................................................................................................... vii
1. INTRODUCTION.............................................................................................1
1.1 Statement of Problem ................................................................................................... 1
1.2 Objectives....................................................................................................................... 5
2. LITERATURE REVIEW ................................................................................6
2.1 Kraft Recovery Boiler Fouling .................................................................................... 6
2.1.1 Chemical Properties of Fireside Deposits............................................................... 7
2.1.2 Fouling and Plugging.............................................................................................. 8
2.1.3 Fireside Deposit Removal....................................................................................... 9
2.2 Fireside Additives........................................................................................................ 11
2.2.1 Review of Additives in Utility Boilers ................................................................. 11
2.2.2 Additives Used in Kraft Recovery Boilers ........................................................... 12
2.2.3 Mechanisms of Additives in Kraft Recovery Boilers ........................................... 14
2.3 Surface Treatment with MgO-Based Additives in Kraft Recovery Boilers .......... 16
2.4 Additive In-furnace Injection for Fouling Control in Kraft Recovery Boilers ..... 17
PART 1: LABORATORY STUDY......................................................................19
3. METHODOLOGY .........................................................................................19
3.1 Material........................................................................................................................ 19
3.2 Experimental Setup .................................................................................................... 21
3.3 Experimental Procedure ............................................................................................ 24
3.3.1 Reactions Between MgO-Based Additives and Deposits ..................................... 24
3.3.2 MgO-Based Additive Coating .............................................................................. 24
3.3.3 MgO-Based Additive Injection............................................................................. 25
3.4 Air Jet Peak Impact Pressure (PIP) vs. Distance Correlation ................................ 28
4. LABORATORY RESULTS AND DISCUSSION .......................................31
4.1 Experimental Reproducibility ................................................................................... 31
4.2 Reactions Between MgO-Based Additives and Deposits ......................................... 32
4.3 Effect of MgO-Based Additive Coating .................................................................... 35
4.4 Effect of MgO-Based Additive Mixed with Black Liquor Slurry........................... 37

v
4.5 Effect of Mechanical Mixing of MgO-Based Additive and Black Liquor Particles . ....................................................................................................................................... 41
4.6 Effect of Separate Injection of MgO-Based Additives and Black Liquor Particles . ....................................................................................................................................... 44
PART 2: FIELD STUDY ......................................................................................48
5. METHODOLOGY .........................................................................................48
5.1 Boiler Operating Data ................................................................................................ 48
5.2 Experimental Procedure ............................................................................................ 49
5.3 Analytical Method....................................................................................................... 50
6. FIELD STUDY RESULTS AND DISCUSSION .........................................51
6.1 Effect of MgO-Based Additive on Deposit Accumulation ....................................... 51
6.2 Chemical Compositions of Deposits and Process Materials ................................... 52
6.3 Effect of Additive Injection on A Hypothetical MgO Layer Thickness................. 54
7. IMPLICATIONS ............................................................................................58
8. CONCLUSIONS .............................................................................................60
REFERENCES............................................................................................................................ 61
APPENDICES ............................................................................................................................. 65

vi
LIST OF TABLES
Table 2-1.As-fired black liquor elemental composition (wt% of black liquor dry solids) ............ 6
Table 3-1.Chemical composition of additives on dry basis (wt%) .............................................. 21
Table 3-2.EFR conditions for combustion of dried black liquor particles with additives ........... 28
Table 4-1.Deposition and PIP obtained from one set of experimental conditions....................... 32
Table 4-2.Physical and thermal properties of MgO-based additives and deposits ...................... 32
Table 5-1.Experiments conducted during boiler operation using a probe ................................... 50
Table 5-2.Samples collected and sampling locations in the recovery boiler ............................... 50
Table 6-1.Percent of MgO by weight coated on the probe surface at left and right access ports 57

vii
LIST OF FIGURES
Figure 1-1. Kraft recovery process ............................................................................................... 1
Figure 1-2. Severe accumulation of deposits in the superheater region of a kraft recovery boiler
.................................................................................................................................... 3
Figure 2-1. Schematic diagram of a kraft recovery boiler ............................................................ 7
Figure 2-2. Air cooled probe coated with Mg(OH)2 (A) before the test and (B) after exposing at
the boiler bank inlet for 1.5 h................................................................................... 17
Figure 2-3. Comparison of regressions of baseline to treated runs............................................. 18
Figure 3-1. TGA profile of dry Mg(OH)2 powder ...................................................................... 20
Figure 3-2. TGA profile of dried commercial additive............................................................... 20
Figure 3-3. Experimental setup of Entrained Flow Reactor (EFR) ............................................ 22
Figure 3-4. Air jet blow-off apparatus coupled with EFR .......................................................... 24
Figure 3-5. Sample preparation and particle feeding methods ................................................... 28
Figure 3-6. Peak impact pressure (PIP) of the air jet as a function of distance from nozzle exit
(300 psig inlet pressure; nozzle size: 4.7 mm throat diameter, 9.2 mm exit diameter)
.................................................................................................................................. 29
Figure 3-7. Peak impact pressure (PIP) of the air jet as a function of distance from nozzle exit
(800 psig inlet pressure; nozzle size: 3.25 mm throat diameter, 7.35 mm exit
diameter) .................................................................................................................. 30
Figure 4-1. XRD results of solid residues from (a) 0 wt% MgO in oxidized smelt and (b) 35
wt% MgO in oxidized smelt heated at 900°C for 30 minutes ................................. 34
Figure 4-2. Effect of additive coating thickness on deposit accumulation (EFR conditions:
800°C and gas velocity=1.8 m/s; probe: 470°C; particle size: 90-300 µm, 10.5
mol% Cl/(Na+K), feed rate: 5 g/min) ...................................................................... 35
Figure 4-3. Appearance of deposit on the probe surface ............................................................ 36
Figure 4-4. Effect of additive coating thickness on deposit removal (300 psig inlet pressure;
nozzle size: 4.7 mm throat diameter, 9.2 mm exit diameter)................................... 37
Figure 4-5. Appearance of deposit on the probe surface for additive mixed with black liquor
slurry at different weight percent of MgO in feed (EFR conditions: 800°C and gas
velocity=1.8 m/s; probe: 400°C; particle size: <600 µm, feed rate: 10 g/min) ....... 38

viii
Figure 4-6. Effect of pure Mg(OH)2 additive on deposition for additive mixed with black liquor
slurry (EFR conditions: 800°C and gas velocity=1.8 m/s; probe: 400°C; particle
size: <600 µm, feed rate: 10 g/min) ......................................................................... 39
Figure 4-7. Comparison of measured and calculated Mg/Na weight ratios of deposits obtained
from additive mixed with black liquor slurry .......................................................... 40
Figure 4-8. Effect of pure Mg(OH)2 additive on deposit removal for additive mixed with black
liquor slurry (800 psig inlet pressure; nozzle size: 3.25 mm throat diameter, 7.35
mm exit diameter) .................................................................................................... 41
Figure 4-9. Appearance of deposit on the probe surface for mechanical mixing at different
weight percent of MgO in feed (EFR conditions: 800°C and gas velocity=1.8 m/s;
probe: 400°C; particle size: 150-600 µm, feed rate: 10-13 g/min).......................... 42
Figure 4-10. Effect of pure Mg(OH)2 additive on deposition for mechanical mixing (EFR
conditions: 800°C and gas velocity=1.8 m/s; probe: 400°C; particle size: 150-600
µm, feed rate: 10-13 g/min) ..................................................................................... 43
Figure 4-11. Comparison of measured and calculated Mg/Na weight ratios of deposits obtained
from mechanical mixing .......................................................................................... 43
Figure 4-12. Effect of pure Mg(OH)2 additive on deposit removal for mechanical mixing (800
psig inlet pressure; nozzle size: 3.25 mm throat diameter, 7.35 mm exit diameter) 44
Figure 4-13. Appearance of deposit on the probe surface for separate injection at different weight
percent of MgO in feed (EFR conditions: 800°C and gas velocity=1.8 m/s; probe:
400°C; particle size: 150-600 µm, feed rate: 10-13 g/min) ..................................... 45
Figure 4-14. Effect of additives on deposition for separate injection (EFR conditions: 800°C and
gas velocity=1.8 m/s; probe: 400°C; particle size: 150-600 µm, feed rate: 10-13
g/min) ....................................................................................................................... 46
Figure 4-15. Comparison of measured and calculated Mg/Na weight ratios of deposits obtained
from separate injection............................................................................................. 46
Figure 4-16. Effect of additives on deposit removal for separate injection (800 psig inlet
pressure; nozzle size: 3.25 mm throat diameter, 7.35 mm exit diameter) ............... 47
Figure 5-1. Kraft recovery boiler and additive injection system ................................................ 49
Figure 6-1. Appearance of deposits collected on the probe on Day 1 at left and right access
ports (ON- additive on; OFF- additive off).............................................................. 51
Figure 6-2. Deposit accumulation on the probe at left and right access ports (ON- additive on;
OFF- additive off) .................................................................................................... 52
Figure 6-3. Mg/Na weight ratios of deposits collected on the probe at left and right access ports
(ON- additive on; OFF- additive off)....................................................................... 53
ix
Figure 6-4. Mg/Na weight ratios of process materials and deposits ........................................... 54
Figure 6-5. Thickness of a hypothetical MgO layer formed in a base time of 1 minute in probe
deposits at left and right access ports (ON- additive on; OFF- additive off)........... 55
Figure 6-6. Maximum thickness of a hypothetical MgO layer formed on the superheater tube
surface, in a base time of 1 minute, as a function of additive loading and bulk
density ...................................................................................................................... 56

1
1. INTRODUCTION
1.1 Statement of Problem
Kraft pulping plays an important role in chemical pulping process for conversion of wood into
wood pulp with an annual pulp production of 120 million metric tons. Kraft process is able to
pulp a broad range of wood species and produce high strength pulp; in addition, its chemical
recovery efficiency can reach a maximum of 98 % [1]. In the kraft pulping process, wood is
cooked with white liquor, which is an aqueous solution of sodium hydroxide (NaOH) and
sodium sulfide (Na2S) mixture. The fiber is separated to make pulp; the waste material called
black liquor contains water, inorganics, and organics. A simplified schematic of the kraft
recovery process is shown in Figure 1-1. The main functions of this closed loop are to eliminate
the waste material (black liquor), recover the pulping chemicals (NaOH and Na2S), and produce
steam and generate electricity.
Figure 1-1.Kraft recovery process [1]
The wood chips, which consist of fiber and lignin, are cooked with white liquor in a digester
within a temperature range from 155 to 175°C and under a pressure of 900 kPa [1, 2]. Following
the digestion, the fiber is separated and washed to produce the pulp. The residue from the brown

2
stock washers is called weak black liquor. The weak black liquor contains the chemically
dissolved lignin and the spent cooking chemicals and washing water, about 15 % of solids. After
processing through a series of multiple effect evaporators and concentrators, the weak black
liquor solids content is increased to between 65 % and 85 % to form heavy black liquor [2, 3].
For a kraft pulp mill with a production capacity of 1000 metric tons/day, approximately 1500
metric tons of black liquor dry solids are produced [1]. This large amount of black liquor is
eliminated by incineration in a recovery boiler to produce steam and power from the combustion
of the organic constituents, and to form inorganic molten smelt under reducing conditions in the
lower furnace. Molten smelt that is mostly made up of sodium carbonate (Na2CO3) and sodium
sulfide (Na2S) flows by gravity through water-cooled spouts to a dissolving tank where it is
dissolved in water to form green liquor. Causticizing green liquor with reburned lime (CaO)
produces white liquor that is reused in the pulping process.
The recovery boiler is the most important and expensive piece of equipment in the kraft recovery
process. The heavy black liquor is sprayed into the boiler and burned at high temperatures to
produce molten smelt. Hot flue gases are drawn through large induced-draft fans. After the flue
gases reach the top of the furnace, they cool as they pass sequentially through screen tubes,
superheater, generating bank, and economizer sections. The gases eventually pass through an
electrostatic precipitator, which recovers dust particles. The dust particles from the flue gas are
collected by ash hoppers and mixed with the heavy black liquor stream. The remaining gases are
scrubbed prior to being sent to the atmosphere.
In order to prevent the ash and fume from adhering to the heat transfer surface and forming an
insulating layer, it is important that the entrained particles in the hot flue gases are cooled
sufficiently before they come in contact with the superheater tubes [2]. However, due to the
boiler design limitations and operation conditions, most of the recovery boilers suffer from the
deposit formation and accumulation. Deposits consist of a mixture of carryover, intermediate
sized particles, and fume. In the lower superheater region, the deposits are hard, sintered, and
smelt-like. In the upper superheater and the region close to upstream of the generating bank,
where the flue gas temperature is lower, formation of a white and soft layer of deposits usually
occurs. Since the flue gas temperature is low enough, the generating bank and economizer have
much less sticky deposits [4, 5].

3
The degree of recovery boiler fouling is characterized by the amount of deposit formation and
the accumulation rate of the deposits. The fouling decreases the boiler heat transfer to the water
and steam, creates corrosive problems at the tube surfaces, and increases the flue gas exit
temperature, thus reducing the thermal efficiency of the recovery boiler [4, 6]. In severe cases,
the massive accumulation of fireside deposits on the superheater and generating bank tubes in the
kraft recovery boilers may block the passage of flue gas and cause a plugging problem, leading
to unscheduled shutdowns [5]. Figure 1-2 shows the extensive deposit accumulation in the
superheater region of a recovery boiler in a kraft mill.
Figure 1-2.Severe accumulation of deposits in the superheater region of a kraft recovery boiler
To maintain the normal operation, effective removal of deposits from the tubes in recovery
boilers is extremely important. The deposit removal is often performed by sootblowers that
follow a prescribed sequence, depending on the severity of the deposit accumulation in the

4
boiler. The sootblowers rotate and discharge superheated steam as they travel into the boiler [2].
The effectiveness of deposit removal by a sootblower depends on three factors: characteristics of
sootblower, chemical and thermal properties of deposits, and jet/deposit interaction and removal
mechanisms. Two main factors have been found to affect sootblowing efficiency, which are peak
impact pressure (PIP) and the strength of deposits. In order to remove a deposit, the PIP of the jet
must be greater than the strength of that deposit [6, 7].
Fireside additives are introduced into recovery boilers to mitigate fouling problems. The
additives were initially used to combat slagging in oil fuel combustion, and later have been used
to deal with problems associated with deposits in coal-fired boilers and recovery boilers. They
are intended to reduce the formation of deposits and the corrosiveness of the ash. The most
commonly used additives are mixtures of materials with high melting points, such as magnesium
oxide (MgO), calcium oxide (CaO), silicon dioxide (SiO2), and aluminum oxide (Al2O3).
Minerals have also been used, such as calcite (CaCO3), magnesite (MgCO3), dolomite
(CaMg(CO3)2), brucite (Mg(OH)2), and kaolinite (Al2Si2O5(OH)4) [8-10].
MgO-based additives are considered as the most promising additives that can minimize sodium
and vanadium related fouling problems in utility boilers. Additives that fall into this category
include MgO, Mg(OH)2, MgCO3, and dolomite. The additives have been used in recovery
boilers to minimize deposit buildup on superheater and generating bank tubes. In addition, the
additive treatments are intended to prolong the boiler operating time between washouts. In order
to minimize fouling problems, the additives are usually continuously injected into recovery
boilers. The additives were claimed to work either by forming a thin coating on the tube surface
to prevent deposits from building up, or by forming a loosely bonded layer between deposits and
the tube surface, facilitating deposit removal by sootblowers. However, these claims have never
been verified nor supported by scientific evidence. Nonetheless, several kraft mills have been
using the additives for years. They believe that the additives have helped to alleviate fouling
problems in their recovery boilers.
In an earlier field study, the effectiveness of additive coating was investigated using an air-
cooled probe coated with a Mg(OH)2 layer in an operating recovery boiler [10, 11]. It was
indicated that MgO (or Mg(OH)2 that has been dehydrated) could be effective in controlling
deposit accumulation in recovery boilers, if the coating layer is sufficiently thick. It is therefore

5
important to determine whether an additive coating layer could be formed on a tube surface in a
recovery boiler, and how thick the coating would be. The conditions in a kraft recovery boiler are
rather complex since many operating parameters could have an impact on the experimental
results. Moreover, the earlier field study only focused on the effect of additive on deposit
accumulation, not on deposit removal.
1.2 Objectives
The objectives of this work are to systematically study the effect of MgO-based additives on
deposit accumulation and removal. The work consists of two parts:
• To determine the effect of MgO-based additives on deposition and removal under
controlled laboratory conditions using different additive application methods.
• To evaluate the MgO-based additive effect in a kraft recovery boiler.
The thesis consists of four major sections. Relevant literature survey is discussed in Chapter 2,
which covers a fundamental understanding of kraft recovery boiler fouling, fireside additive
types and alleged mechanisms, followed by a review of previous studies on additives. Laboratory
work is described in Chapters 3 and 4. Chapter 3 presents the methodology, and Chapter 4
presents and discusses the results. These two chapters focus on the effect of additive on the
deposit accumulation and removal. The field study is discussed in Chapters 5 and 6 where the
methodology and results are presented; this work investigates the additive effect in a kraft
recovery boiler. Chapters 7 and 8 summarize and conclude the key findings of the entire work.

6
2. LITERATURE REVIEW
2.1 Kraft Recovery Boiler Fouling
In a kraft pulp mill, the heavy black liquor stream is mixed with precipitator ash prior to being
burned in the recovery boiler. This precipitator ash containing black liquor is called ‘as-fired’
black liquor, which consists of approximately one third organic content, one third inorganic
material, with the balance being water [2, 4]. Table 2-1 summarizes the elemental composition of
the as-fired black liquor based on 750 liquor samples from different wood species [1]. As a fuel,
the black liquor is unique due to its high volatile matter and ash content, but low melting point of
ash and heating value [12].
Table 2-1.As-fired black liquor elemental composition (wt% of black liquor dry solids) [1]
Element Typical Range
Carbon 33.9 30-40
Hydrogen 3.4 3.2-4.0
Oxygen 35.8 34-38
Sodium 19.6 17-22
Sulfur 4.6 3.6-5.6
Potassium 2.0 1-3
Chloride 0.5 0.1-4
The as-fired black liquor is sprayed into the recovery boiler furnace (Figure 2-1), forming
droplets in the size range of 0.5 to 5 mm [12]. Black liquor combustion follows three stages: 1)
drying, 2) devolatilization (pyrolysis and combustion of the pyrolysis gases), and 3) char burning
and reactions of inorganic residue [12-15]. The drying process evaporates most of the water in
the droplets, while the droplets swell by a factor of 1.5 in diameter [12]. Devolatilization
involves the pyrolysis of the organic content of the black liquor and the combustion of the
volatile matter. At this stage, the droplets expand significantly to three times of their initial
diameter, which results in a 30-fold increase in volume [12]. Hupa et al. [13, 14] reported that,
during devolatilization, the maximum droplet swollen volumes are typically between 20 and 50
cm3/g black liquor dry solids. Furthermore, they indicated that much of the fume may be
generated in the devolatilization stage. During the char burning stage, the fume is also formed. In
addition, small particles are often released during char burning. In the recovery boiler, the drying
and devolatilization stages mostly occur in flight. The smaller droplets usually burn completely
in flight; for this reason, they are most likely entrained in the flue gas as the ‘carryover’ particles

7
[12]. Upon combustion, a large quantity of fume is formed and entrained in the flue gas with
carryover particles. Deposits are formed by two different mechanisms: inertial impaction of
carryover particles of black liquor droplet residue on the heat transfer surfaces, and condensation
of the fume or dust vaporized from the lower furnace [5, 16]. The accumulation of deposits, or
fouling, greatly reduces the boiler thermal efficiency, accelerates corrosion of tubes, and in
severe cases may completely block the passage of the flue gas, leading to unscheduled boiler
shutdowns [5, 6].
Black liquor
Smelt
Superheater
tubes
Generating
bank tubes
Economizer tubes
Air
FlueGas
Screen tubes
Black liquor
Smelt
Superheater
tubes
Generating
bank tubes
Economizer tubes
Air
FlueGas
Screen tubes
Figure 2-1.Schematic diagram of a kraft recovery boiler [1]
2.1.1 Chemical Properties of Fireside Deposits
Fireside deposits contain the inorganic constituents of the black liquor, mainly sodium sulfate
and sodium carbonate, with small amounts of sodium chloride, potassium salts, and reduced

8
sulfur. There are three sources that govern the formation of deposits: carryover, intermediate
sized particles (ISP), and fume [4-6].
Carryover: The particles are smelt and partially burned black liquor particles entrained in the
flue gas with a size between 100 µm and 3 mm [17]. A typical carryover deposit contains
approximately 45 wt% sodium sulfate (Na2SO4), 50 wt% sodium carbonate (Na2CO3), and rest is
composed of potassium and chloride salts. The carryover deposits are pink, sintered, and very
hard [6].
Intermediate sized particles (ISP): This type of particles has a size range of 1 to 100 µm; they
are primarily the molten or partially molten smelt particles in the flue gas [6, 17]. The ISP
deposits are grey and believed to have a composition close to the carryover deposits [6].
Fume: The fume particles are inorganic aerosols with a size of 0.1-1 µm, which form through
the condensation of the vaporized sodium and potassium species during the black liquor
combustion [4, 17-20]. Fume deposits mainly consist of Na2SO4 and Na2CO3, and are white and
often soft [6, 18].
In the recovery boiler, the chemical composition of the deposits varies widely with location,
depending on the relative proportion of the above mentioned particle types. In the superheater
region, the carryover and ISP are the primary sources of deposits, thus the composition of
deposits is similar to the carryover deposits. In the generating bank and back side of the boiler,
where the flue gas temperature is lower, the fume deposits become dominant [5, 6, 17].
2.1.2 Fouling and Plugging
In recovery boilers, the degree of fouling is measured by the amount of deposits formed and the
accumulation rate. Tran et al. [21, 22] studied the fireside deposit accumulation in an operating
boiler. It was suggested that the deposition rates vary widely with many operating parameters,
such as black liquor firing load, air flow, black liquor solids content, etc. Previous studies also
indicated that the primary factor that determines whether or not the particles are sticky and form
deposits is the liquid content of the particles, which in turn is a function of the temperature and
composition (i.e. chloride and potassium contents) of the deposits [5, 23]. It has been reported
that for particles to become sticky, 15-20 % liquid phase is required. On the other hand, 70 %
liquid content in the deposit is high enough to make the deposit flow [5, 11, 23, 24]. Shenassa et
9
al. [25] also examined the effect of chloride content on the deposition rate using synthetic
carryover particles in an entrained flow reactor. The results indicated that particles that had less
than 2.5 mol% Cl/(Na+K) did not form deposit, whereas the particles that contained more than 5
mol% Cl/(Na+K) accumulated readily. Furthermore, the observations showed that the deposition
rate stopped increasing as the chloride content was higher than 10 mol% Cl/(Na+K).
The plugging of the flue gas passage varies with location in the recovery boiler and depends on
the flue gas temperature, how the deposits form and accumulate, and how the deposits are
removed by the sootblowers [4, 6]. In the lower superheater region, the carryover particles in
form of molten droplets impact on the tubes and form sintered and hard deposits. The growth of
deposits in the lower superheater is self-controlled and there is no plugging [5, 26]. In the upper
superheater and the region near to the inlet of generating bank, the carryover particles impact on
the tube and adhere to the surface. The deposits are not self-controlled and severe accumulation
of deposits that leads to plugging usually occurs in this region [5, 6]. At the boiler bank inlet, the
carryover particle may or may not be sticky, which depends on its chemical composition and
fume content. However, the occurrence of plugging in boiler bank inlet region is very common
due to the narrower spacing between tubes and insufficient sootblowing [6]. The carryover
particles are usually not sticky downstream the boiler bank and the economizer. Moreover, the
fume deposits are dominant and easy to remove. Plugging due to the stickiness of carryover
particles unlikely occurs in this region [5].
2.1.3 Fireside Deposit Removal
In order to maintain uninterrupted operation of the boiler, the deposit removal is primarily
controlled by sootblower systems that periodically blast deposits with high pressure steam.
During the boiler shut-downs, hot water is used to clean up the deposits [6, 27-31].
A sootblower consists of a long lance tube, which rotates and discharges high pressure steam as
it advances into the boiler [2]. The full-expansion nozzles are designed to minimize the
occurrence of shock waves and provide greater jet energy for deposit removal. The sootblower
performance is characterized by measuring the peak impact pressure (PIP) of the nozzle jet; this
pressure is measured by a Pitot tube along the centerline of the nozzle outlet. Due to the
deceleration of the surrounding fluid and the decay of the jet energy, PIP decreases at increasing
distances from the nozzle exit [6, 28-30].

10
There are three categories of factors affecting the sootblowing efficiency. The first category is
associated with the sootblower, including PIP in terms of nozzle design and steam properties,
nozzle blowing sequence and frequency, distance between the nozzle and the deposit, and the jet
arrangement [7, 17]. The second category of factors that have impact on the sootblower
performance includes deposit adhesion strength (i.e. deposit composition and temperature),
deposit particle size and thickness, and tube temperature [17]. In their study of the effects of
chemical composition on the deposit removability, Mao et al. [32] concluded that the required
PIP to remove a deposit increases sharply with an increasing of chloride content in the deposit.
The study by Piroozmand et al. [33] suggested that the deposit strength is strongly related to the
particle size. Mao et al. [24] investigated the effect of particle size and liquid content on deposit
removability. It was suggested that the deposits formed from smaller particles are much stronger
compared to those formed from larger particles at a fixed liquid content. In addition, their results
showed that particles that contained high liquid content form stronger deposits than those with
low liquid content. The third category of factors relates to the jet/deposit interaction and the
deposit removal mechanisms [7]. For a brittle deposit, there are at least four removal
mechanisms.
Brittle fracture: Brittle and weak deposits are removed by sootblowers through the brittle
fracture mechanism. These types of deposits are usually formed where the flue gas temperature
is low, such as the region downstream of the generating bank [34]. In this mechanism, the jet hits
the deposit surface and makes the flaws enlarged, which causes the deposit to break [35].
Debonding: The deposit debonding mechanism is controlled by the adhesion strength at the
deposit-tube interface. The adhesion strength is highly dependent on the tube surface temperature
and the deposit size. It was found that the smaller deposit-tube interface results in easier removal
of the deposit from the surface. In addition, thicker deposits are easier to remove than thinner
deposits [7].
Vibrations: In the recovery boiler, tube and platen vibrations may happen as the flue gas flows
and the sootblowers blast. Kaliazine et al. [7] believed that vibrations are unlikely to have a
significant contribution to the deposit removal by the sootblowers in the boiler.
Thermal shock: An uneven thermal expansion at the deposit-tube interface can lead to thermal
stress. The sudden cooling of a deposit decreases the adhesion strength at the interface, which

11
may result in the crack of the deposit [35]. The thermal shock is often practiced in the mill by
turning off the black liquor flow to achieve a rapid cooling of the deposits, which makes the
deposits easy to remove by the sootblowers [6, 7].
2.2 Fireside Additives
Extensive studies investigating problems related to fireside deposits have been conducted in oil-
and coal-fired utility boilers. When fuel oil or coal is burned, severe deposits are formed on heat
transfer tubes, leading to significant load reductions and inefficient boiler performance. These
deposits are a mixture of carbonaceous material, corrosive by-products, soot, and metal slag. The
common operational problems in utility boilers include fouling, corrosion, steam superheat
temperature control, and acidic emissions [36-41]. In order to maintain boiler operating
availability and reliability, sootblowers are used to remove the deposits. Fireside additives are
also used to mitigate the fouling problems.
2.2.1 Review of Additives in Utility Boilers
Numerous additives are being marketed with the aim of minimizing the formation of deposits in
utility boilers. These additives are intended to increase the melting temperature of deposits,
decrease the amount of materials with low melting points in deposits, reduce the strength of
deposits for easier removal by sootblowers, and reduce the corrosiveness of fly ash. The most
commonly used additives include magnesium oxide (MgO) [8-10, 40-45], calcium oxide (CaO)
[8, 10, 42-44], silicon dioxide (SiO2) [10, 42-45], aluminum oxide (Al2O3) [10, 41-45], calcite
(CaCO3) [10, 43-45], magnesite (MgCO3) [10, 45], dolomite (CaMg(CO3)2) [10, 43, 45], brucite
(Mg(OH)2) [10, 42, 43, 45], kaolinite (Al2Si2O5(OH)4) [9, 10, 46], and vermiculite [10, 43-45].
Most of research investigating the effectiveness of fireside additives has been performed in
utility boilers. According to Radway [47], most of additive applications were primarily based on
trial and error rather than a scientific understanding of the mechanisms. For this reason, they
were often misapplied, leading to undesirable results. However, under appropriate conditions,
additives can help improve combustion efficiency, mitigate fouling and plugging problems, and
reduce the acidic emissions [48].
In oil-fired boilers, magnesium and manganese additives are mostly effective in controlling
fouling and corrosion problems due to the presence of vanadium and sodium in fuel oil. Fichera

12
et al. [40] investigated the corrosion problems in oil-fired boilers by adding magnesium oxide in
the fuel oil. They observed that the addition of MgO increased the melting point of the
superheater deposits due to the reaction of MgO with vanadium oxides. The effect of MgO was
also confirmed in the laboratory by measuring the melting points of synthetic mixtures V2O5-
Na2SO4 with various amounts of MgO addition. The laboratory work concluded that the melting
points of the synthetic mixtures could increase by 150°C to 200°C depending on the amount of
MgO addition.
In coal-fired boilers, additives are not as effective as they are in oil-fired boilers since the ash
quantity and composition are significantly different from fuel oil. Oil usually contains 0.01 to 0.1
wt% of ash, whereas coal contains about 10 wt% of ash. On the other hand, oil typically has
higher vanadium content compared to that of coal [10, 47]. Nevertheless, successful cases of
using additives to combat coal fouling still exist. Engstrom [44] studied the additive effect on
fouling control in coal combustion. In order to evaluate the effect of the additives, a sintering test
was used to predict the ash fouling tendency of the mixtures of a coal sample and different types
of additives. The results showed that a number of tested additives had the potential for reducing
the sintering strength of ash, such as magnesium oxide, calcium oxide or carbonate, wollastonite
and vermiculite.
Extensive studies in utility boilers suggest that the feasibility of additives highly depends on the
circumstances and the additive performance is boiler specific. In addition, magnesium-based
additives are considered as the most promising additives that can minimize vanadium and
sodium related fouling problems in flue gases [48].
2.2.2 Additives Used in Kraft Recovery Boilers
The positive results of using additives in utility boilers led to the application of additives in black
liquor recovery boilers. In order to prolong boiler operating time between washouts, additive
treatments are introduced to mitigate fouling and plugging problems. Most of additives used in
utility boilers have been tried in recovery boilers, such as Mg, Ca, and Mn additives, and silicates
[10]. The commonly used additives in recovery boilers are summarized in five categories.
Magnesium oxide-based additives: This category of additives include magnesium oxide (MgO),
magnesium hydroxide (Mg(OH)2), dolomite (CaMg(CO3)2), and magnesite (MgCO3). MgO is

13
used in a wide range of utility and recovery boilers. It may appear in the form of powder or a
suspension in oil or black liquor slurry [42, 45, 47]. This chemical is an ionic material, which is
water insoluble but hygroscopic [49]. MgO is often found as one of the ingredients of many
combustion additives. In some conditions involving high temperatures, the use of MgO as an
additive can be replaced by a stabilized form Mg(OH)2. In this situation, Mg(OH)2 decomposes
at 350°C into the highly reactive form of MgO [45].
Mg(OH)2 � MgO + H2O (Reaction 2-1)
Dolomite (CaMg(CO3)2) and magnesite (MgCO3) also contain a relatively high portion of MgO.
At high temperatures, they are converted to MgO that is considered to minimize the fouling and
corrosion problems due to the presence of vanadium oxides [10, 43, 45].
Calcite and Calcium oxide: Calcite, also know as limestone, consists of large amount of calcium
carbonate (CaCO3) [45]. Similar to dolomite and magnesite, limestone undergoes decomposition
during combustion. Limestone is often used to modify the deposition. It is also used to reduce the
viscosity of slag and facilitate the deposit removal [43, 45].
Silicon dioxide: The mineral silica (SiO2) is derived from a number of natural sources, such as
sand, clay, and other silicates. It is generally in a form of fine powder, which makes it suitable as
an additive due to its large specific surface area. SiO2 can be used to modify the deposit
characteristics through dilution [10, 43, 45, 47].
Aluminium-based additives: Aluminium additives typically include alumina (Al2O3), aluminium
hydroxide (Al(OH)3), clay, and other aluminosilicates. These additives are usually used to
modify slag [10, 45].
Manganese-based additives: This category of additives includes a range of manganese
compounds, such as manganese oxide (MnO), manganese chloride (MnCl2) and manganese
sulfate (MnSO4). Manganese-based additives claim not only to improve the combustion
efficiency but also to reduce the fouling and slagging problems [45].
Additives applied in recovery boilers can be either liquid or solid. Liquid additives are often
added continuously into the black liquor mixing tank or directly mixed to the black liquor
stream. On the other hand, solid additives, usually in a form of slurry, are continuously injected
14
into the boiler with air flow. In recovery boilers, the typical additive injection rate of either liquid
or solid is controlled at 0.1-0.5 g of additive per kg of black liquor dry solids [10].
2.2.3 Mechanisms of Additives in Kraft Recovery Boilers
In recovery boilers, additives claim to reduce the amount of materials with low melting points in
deposits, thus decrease the deposit strength and yield an easier deposit removal by sootblowers.
Based on claims made by various additives, Tran [10] defined three mechanisms that may apply:
dilution, combustion catalysis, and cleavage plane formation.
Dilution: The additives classified under this category are typically compounds with high melting
points. The additives act as dilution agents for decreasing or reducing the liquid content in the
deposits. As a result of dilution, the deposits become less sticky and more easily removable [10].
In recovery boilers, deposits mainly contain alkali salts with low melting temperatures, viscosity,
and surface tensions, which create problems [4, 10]. By comparing the ash content in fuels and
alkali compound content in deposits, Tran [10] suggested that the thermal properties of deposits
in recovery boilers are more difficult to modify than those in utility boilers.
Tran [10] also examined the dilution effect of additives on deposits in a recovery boiler at the
typical additive injection rate (i.e. 0.1-0.5 g of additive per kg of black liquor dry solids). The
theoretical calculation indicated that the deposits would yield an approximate additive content of
0.5-3 wt%. However, it was found that the additive contents in deposit samples from various
recovery boilers using additive treatment were less than 0.05 wt%. The sticky temperature of
deposits that contained additive had also been estimated. For a typical deposit with a 1.5 mol%
Cl/(Na+K), it was determined that an additive content below 0.05 wt% increased the deposit
sticky temperature by less than 0.1°C. It was concluded that the typical dose of additives applied
in recovery boilers was too small to have an impact on the sticky temperature. Therefore, the
dilution effect unlikely occurs in recovery boilers.
Combustion catalysis: Combustion catalysts, which are typically metals or metal compounds,
are often used to accelerate the decomposition of fuels by decreasing the required energy for
each of the intermediate reactions. Therefore, they are capable of ensuring complete combustion
and improving the boiler efficiency [50].

15
In recovery boilers, manganese-based additives are usually used to improve the black liquor
combustion efficiency. Tran [10] discussed the feasibility of Mn-based additive as a combustion
catalyst. It was suggested that in theory Mn could help achieve the complete combustion of the
black liquor and lower the Na2S concentration in carryover particles and deposits by the
oxidization of Na2S to Na2SO4. As a result, the oxidation of Na2S elevates the melting point of
deposits and decreases the stickiness of deposits. However, it was pointed that the use of Mn
might be impractical in recovery boilers because i) Mn is unlikely to modify deposits under the
reducing conditions in the lower furnace in a short reaction time; ii) Na2S has insignificant effect
on the sticky temperature compared to chloride and potassium contents in the regions where the
flue gas temperatures are below the minimum melting point of Na2S-Na2SO4-Na2CO3 system at
740°C; iii) the portion of Na2S in superheater deposits is very small; iv) it is difficult to examine
the effect of ‘added’ Mn and the effect of ‘native’ Mn from wood separately; v) since no Na2S is
present in the fume, Mn is unable to modify the fume deposits.
Cleavage plane formation: In this mechanism, chemicals with high melting temperatures such
as MgO, CaO, and MnO are coated on the tube surface. The additives work either by forming a
thin layer on the tube surface to prevent deposits from building up, or by forming a loosely
bonded layer between deposits and the tube surface so that it can facilitate deposit removal [10].
Tran examined the theoretical maximum thickness of a hypothetical layer that an additive may
form in deposits [10]. This maximum thickness in an ideal case is estimated based on the
following assumptions: i) the additive is injected and uniformly distributed in the superheater
region; ii) the surface of the superheater region tubes is smooth; iii) hypothetical layer is formed
(no mixing of the additive and the deposits); iv) additive all lands on the tube surface.
It was determined that for a typical additive loading, i.e., 0.13 g of additive per kg of black liquor
dry solids, the theoretical maximum thickness of a hypothetical layer formed was 5 µm with a
bulk density at 2.5 g/cm3. It was also indicated that in practice the thickness should be much less
because i) the additive injection rate in recovery boiler is relatively small compared to the large
amount of carryover particles and fume generated during black liquor combustion; ii) it tends to
mix with the deposits as opposed to forming a uniform layer; iii) it is more difficult to obtain a
uniform coating thickness; iv) more additive is required to cover a rough surface than a smooth

16
surface. It was therefore suggested that the thin layer formation may not be effective for fouling
control [10].
Since a certain amount of skepticism does exist regarding the mechanism mentioned above, it is
important to understand the interactions between carryover particles and additive particles in
recovery boilers, particularly the effects of additive on the carryover stickiness and deposition.
2.3 Surface Treatment with MgO-Based Additives in Kraft
Recovery Boilers
When a material with high melting point such as MgO is coated onto an exposed tube surface, it
forms a thin layer that can reduce the liquid content in deposits and raise the melting temperature
of deposits [10, 11]. This is one of the alleged benefits presented by additives in recovery boilers.
In their study of the effect of surface treatment with an additive, Isaak et al. [11] confirmed the
validity of above statement in a laboratory environment. They examined the MgO effect on the
adhesion strength of deposits obtained on a smooth surface. In the experiments, they coated
metal surface with various thicknesses of MgO powder. It was determined that the increase of
the thickness of MgO coating increases the sticky temperature of the deposits. The MgO layer
coated on the metal surface could increase the sticky temperature of the deposits by 30°C to
70°C. It was therefore concluded that the amount of additive used could have a strong impact on
the effectiveness in controlling deposition in recovery boilers.
An earlier field study using an air-cooled probe coated with a 1 mm thick Mg(OH)2 layer showed
the positive effect of coating. In the study, a section of the hot end of the probe was painted with
the 1 mm thick Mg(OH)2 layer as shown in Figure 2-2 A. The probe was then inserted into a
recovery boiler near boiler bank inlet. The flue gas temperature at this location was about 670°C,
which is above the minimum decomposition temperature of Mg(OH)2. Under such conditions,
Mg(OH)2 coated on the probe surface would decompose to the form of MgO. After exposing the
probe in the recovery boiler for 1.5 h, the windward side of the coated section of the probe was
covered with a thin layer of deposits, whereas a thick and hard deposit was observed at the
uncoated section of the probe (Figure 2-2 B). Through this test, there was clear evidence that
sootblowers blew off some of the deposits on the thick Mg(OH)2 coating surface. It was also
found that the MgO powder and the deposits were mixed together at the inner surface of deposits

17
at the deposit-probe interface. On the other hand, in the tests in which a thin Mg(OH)2 coating
(<0.2 mm) was applied, there was no significant difference between deposits on the coated and
uncoated surfaces of the probe. These results suggested that MgO (or Mg(OH)2 that has been
dehydrated) could be effective in controlling deposit accumulation in recovery boilers, if the
coating layer is sufficiently thick. This means that either a large amount of additive to be injected
is required, or the additive must be effectively delivered to the tube surface [10, 11].
Figure 2-2.Air cooled probe coated with Mg(OH)2 (A) before the test and (B) after
exposing at the boiler bank inlet for 1.5 h [10]
The above field study focused on the effect of additive on deposit accumulation only, not on
deposit strength and removal. Hence, the investigation of additive effect on deposit removability
is valuable.
2.4 Additive In-furnace Injection for Fouling Control in Kraft
Recovery Boilers
Additive in-furnace injection is intended to minimize slag buildup and maximize time between
boiler washouts. This is achieved through injecting an aqueous slurry of additive with air directly
into recovery boiler at a location above black liquor spray guns, or into the upper furnace (i.e.
superheater region) [10, 51].
Marshall et al. [51] from Nalco Fuel Tech (an additive supplier) conducted field experiments,
where a small amount of Mg(OH)2 water slurry was continuously injected into a recovery boiler.
In their work, pressure drops (or flue gas draft loss) across the generating bank for untreated and
treated production runs were measured. Pressure drop across generating bank refers to the
pressure difference between the bank inlet and outlet, indicating the degree of fouling of a boiler.

18
These pressure drops can be used to predict the maximum operation time before the boiler has to
be shut down for a water wash. However, the measurement of pressure drop is not sensitive
enough to indicate the plugging [22]. Figure 2-3 shows the comparison between the pressure
drops of baseline and treated runs as a function of time. It was shown that both of the treated runs
(Run#2 and #3) have less pressure drop increase than the untreated run (Run#1), indicating less
fouling occurred with additive injection. It was also observed that a greater additive injection
dose (Run#3) gives the least increase in the pressure drop. It was therefore suggested that the
additive in-furnace injection can prolong the boiler operating time between shutdowns and
improve boiler efficiency [51].
0
1
2
3
4
5
6
7
8
0 50 100 150Days
Pre
ss
ure
dro
p,
mm
H2O
Run#1
(baseline)
Run#2
(treated)
Run#3
(treated)
0
1
2
3
4
5
6
7
8
0 50 100 150Days
Pre
ss
ure
dro
p,
mm
H2O
Run#1
(baseline)
Run#2
(treated)
Run#3
(treated)
Figure 2-3.Comparison of regressions of baseline to treated runs [51]
On the other hand, Tran [10] reported a set of chemical and thermal properties of deposits
collected at various locations in a recovery boiler with a MgO additive injection. It was found
that all the deposit samples have a Mg concentration less than 51 ppm, which is equivalent to a
MgO concentration of 0.01 wt% or less. It was also observed that the additive injection has no
impact on the first melting temperature of all the deposits. However, the fume deposits have the
highest concentration of Mg compared to those of the carryover deposits and the mixture of
carryover and fume deposits. Therefore, it was suggested that most of Mg is probably carried by
the flue gas to the precipitator, and the effectiveness of such additive is not clearly addressed.

19
PART 1: LABORATORY STUDY
3. METHODOLOGY
In practice, MgO-based additives are often continuously sprayed into recovery boilers. The most
common mechanism by which the additives work in recovery boilers is through cleavage plane
formation, which can prevent deposits from adhering to the tube surface and make the deposits
less sticky and easier to remove [10]. In order to validate this mechanism, the effect of additive
coating on deposit accumulation and removal was studied in an Entrained Flow Reactor (EFR)
coupled with an air jet blow-off apparatus. In addition, additive injection in recovery boilers was
simulated by either feeding mixtures of the additive and dried black liquor particles, or injecting
additive into the EFR while burning dried black liquor particles. In total, four additive
application methods were examined in this study:
1) MgO-based additive coating;
2) MgO-based additive injection:
a. Additive mixed with black liquor slurry;
b. Mechanical mixing;
c. Separate injection.
3.1 Material
The additives studied in this work were i) analytical grade Mg(OH)2 powder from Fisher
Scientific, and ii) slurry of a commercial additive obtained from a kraft pulp mill. Both additives
were completely dried in an oven at 110°C. Thermal behaviours of dried Mg(OH)2 powder and
commercial additive were examined using a simultaneous Thermogravimetric Analysis/
Differential Scanning Calorimetry (TGA/DSC) apparatus. The samples were individually heated
from room temperature to 800°C at a heating rate of 20°C/min in air at a gas flow rate of 100
mL/min. In Figure 3-1, a major endothermic peak is observed at 400°C, which is characteristic of
Mg(OH)2. The decomposition of Mg(OH)2 is indicated by the significant weight loss between
350°C and 420°C, as shown by the solid line on the weight loss curve. In Figure 3-2, an
exothermic peak is observed between 200°C and 350°C, while an endothermic peak is observed
at 400°C. The weight loss associated with the exothermic peak results from the organic material

20
burning, which suggests that the commercial additive possibly contains polymers to keep the
slurry suspended. The weight loss associated with the endothermic peak is due to the conversion
of Mg(OH)2 into MgO, indicating that the commercial additive contains Mg(OH)2.
60
70
80
90
100
0 200 400 600 800
Temperature (°C)
Weig
ht
(%)
-16
-14
-12
-10
-8
-6
-4
-2
0
2
4
Heat
Flo
w (
W/g
)
Weight
Heat Flow
Figure 3-1.TGA profile of dry Mg(OH)2 powder
60
70
80
90
100
0 200 400 600 800
Temperature (°C)
Weig
ht
(%)
-16
-14
-12
-10
-8
-6
-4
-2
0
2
4
Heat
Flo
w (
W/g
)
Weight
Heat Flow
Figure 3-2.TGA profile of dried commercial additive

21
From above TGA profiles, the weight losses associated with the endothermic peaks were used to
determine the Mg(OH)2 content in the samples. The results are shown in Table 3-1.
Table 3-1.Chemical composition of additives on dry basis (wt%)
Pure Mg(OH)2
Additive
Commercial
Additive (Dry)
Mg(OH)2 98.3 96.5
Others 1.7 3.5
TOTAL 100 100
Black liquor and smelt samples were obtained from a kraft pulp mill. The black liquor sample
was placed in a drying oven controlled at 110°C for overnight or until it was dried. The average
solids content of the black liquor samples was measured about 73 wt%.
Analytical grade Na2CO3, Na2SO4, and NaCl powder with a purity of >99.9 % from Fisher
Scientific were also used.
3.2 Experimental Setup
The experimental setup used for this study consists of an Entrained Flow Reactor (EFR) and an
air jet blow-off apparatus. The test particles were introduced into the EFR to simulate the
conditions that carryover particles may experience during their passage with hot flue gas across a
kraft recovery boiler. Impaction of these particles on an air-cooled probe at the bottom of the
EFR was used to simulate the deposition process. The collected deposits on the probe were
blasted with an air blow-off jet to determine the removability or adhesion strength of the
deposits.
Entrained Flow Reactor (EFR): The EFR at the University of Toronto, shown in Figure 3-3, is a
9 meter-high, laminar down-flow reactor.

22
SampleFeeder
Gas burner
Probe
Furnace
Particles
9 m
SampleFeeder
Gas burner
Probe
Furnace
Particles
9 m
Gas burner
Probe
Furnace
Particles
9 m
Figure 3-3.Experimental setup of Entrained Flow Reactor (EFR) [32]
The major components of the reactor include a sample feeder, a natural gas combustion chamber,
a long vertical heated section, a non-heated sampling section, a gas exhaust system, and a data
acquisition and control system. Auxiliary equipment includes an electromagnetic force
compensation weight cell and an air-cooled probe. The detailed design description and operating
procedure of the EFR have been discussed by Shenassa [4]. This section gives a brief review of
the EFR.
The sample feeder is designed for particle injection, consisting of a 0.3 m wide by 1.2 m long
speed-controlled belt conveyor, a double-layered stainless steel tube injector cooled with water,
and a metal funnel that is attached to the top of the injector. The particle feed rate is controlled
by the speed of the conveyor belt and the length of particles distributed on the belt. As the belt
moves toward the injector opening, the particles fall down into the funnel with a flow of
pressurized carrier air that is to ensure the flow of particles into the injector [4].
The natural gas combustion chamber, located on the top of the vertical heated section, generates
combustion gases that are mixed with dilution air to produce a hot gas stream with a temperature
of up to 1200°C. The hot gas stream at the exit of the combustion chamber passes through a

23
ceramic honey comb to provide a uniform gas through the EFR. After exiting the combustion
chamber, the hot gas stream, carrying the sample particles, flows down and is exhausted from the
reactor by an induced draft fan [4].
The vertical heated section consists of five independently controlled tubular furnaces that can be
electrically heated to a maximum temperature of 1350°C. Each furnace consists of a mullite tube
that is supported by insulating fiber bricks placed between adjacent furnaces. This heated section
is used to provide a hot environment for particles to be burned [4].
The non-heated sampling section is located at the bottom of the heated section for deposit
collection and optical visualization and measurements. The internal diameter of the non-heated
section is 18 cm. Insulation bricks are available to provide coverage around the non-heated
section to minimize heat loss by convection. In the non-heated section, the burned particles
impact on the air-cooled probe surface and form deposits. The mass of the deposits is monitored
through the weight cell, and transmitted to a Labview data acquisition system. The weight cell
has a precision of ± 0.1 g. The data acquisition system also monitors the burner combustion gas
temperature and flow rate, furnace temperatures, and the probe surface temperature [4].
Air jet blow-off apparatus: The air blow-off jet was used to determine the minimum peak impact
pressure (PIP) required to remove deposits obtained in the EFR. In the air jet blow-off apparatus,
the air jet is mounted on a manual elevating table that sits on a travel-measured slide close to the
test probe. This assembly is constructed to enable nozzle and the probe positioning in any desired
manner. Compressed air is supplied to the nozzle from two compressed air cylinders. The
supplied air pressure at the nozzle inlet is controlled through a pressure regulator, while the
nozzle outlet pressure is at atmosphere pressure. The PIP of the air jet is increased by moving the
nozzle closer to the probe. A schematic diagram of the air jet blow-off apparatus coupled with
the EFR is shown in Figure 3-4.

24
Figure 3-4.Air jet blow-off apparatus coupled with EFR [32]
3.3 Experimental Procedure
3.3.1 Reactions Between MgO-Based Additives and Deposits
To determine the reactions between the additive and deposits, a smelt sample and a mixture of
smelt and MgO were individually placed in a platinum crucible and heated in a muffle furnace at
900°C for 30 minutes. The solid residues after the heat treatment were characterized by X-ray
diffraction (XRD) for their compound structure.
The diffractometer with a CuKα X-ray source, operated at 40 kV and 40 mA, was used to
identify the compounds in the residues. The XRD pattern was recorded from 20° to 60° with a 2θ
step size of 0.02°. The scanning rate was at 0.02° per second.
3.3.2 MgO-Based Additive Coating
The synthetic carryover particles with a fixed chloride content of 10.5 mol% Cl/(Na+K) were
prepared for the tests. Analytical grade Na2CO3, Na2SO4, and NaCl were first well mixed at a
fixed ratio (i.e. 50 wt%, 40 wt%, and 10 wt%, respectively). The mixture placed in a platinum

25
crucible was melted in a muffle furnace at 900°C, cooled, ground (using a mechanical grinder),
and sieved (using test sieves) to a size of 90 to 300 µm.
A section (18 cm in length) of 304 stainless steel probe with 1.6 cm outer diameter (O.D.) was
coated with various amounts of additive slurry using a brush. For tests using the pure Mg(OH)2
powder, the known composition of slurry was prepared by mixing the Mg(OH)2 powder in
distilled water. On the other hand, the slurry of commercial additive was applied on the probe
surface either directly or after diluting it with distilled water. The thickness of the additive
coating would depend on the amount of slurry painted on the probe. The probe with coating was
then placed horizontally at the non-heated section of EFR (Figure 3-3). The EFR temperature
was controlled at 800°C. The gas velocity at the EFR exit was approximately 1.8 m/s while the
average particle velocity was estimated to be approximately 2 m/s. The air-cooled probe surface
temperature was controlled at about 470°C. After the probe temperature was stabilized, 50 g of
synthetic carryover particles were introduced continuously into the top of the EFR via the sample
feeder at a feed rate of 5 g/min.
After the deposits had been collected, the probe was disconnected from the weight cell, and then
turned 90° to allow the deposits to face the air jet nozzle. To avoid any vibrations that may affect
the deposit removal during the jet blow, the probe was anchored rigidly on the bottom of heated
section of EFR. A brass nozzle with a throat diameter of 4.7 mm and an exit diameter of 9.2 mm
was used in this set of experiments. Compressed air at 300 psig pressure was supplied to the
nozzle to produce an air jet. Each blow was controlled by a control valve for about 2 seconds.
The PIP was increased by moving the nozzle closer to the deposit until a sign of deposit removal
was observed. The PIP value at that point was considered to be the minimum PIP required to
remove the deposit. The correlation between PIP and distance from the nozzle exit at 300 psig
supplied pressure was examined using a pitot probe in the laboratory.
3.3.3 MgO-Based Additive Injection
This set of experiments focused on three additive application methods. The sample preparation
and particle feeding method of these additive application types, and the experimental conditions
are described in this section.

26
Additive mixed with black liquor slurry: Dried black liquor particles containing various amounts
of pure Mg(OH)2 powder were prepared. The black liquor sample was first heated in a 90°C
water bath to decrease its viscosity and make it flow. The black liquor sample with an average
solids content of 73 wt% was poured into a beaker, and diluted to 62 wt% of solids content with
addition of boiled distilled water. This was necessary to make the black liquor sample fluid so
that it can be mixed readily with the Mg(OH)2 powder. The diluted black liquor slurry and the
weighed Mg(OH)2 powder were well mixed in an aluminum dish at desired composition, and
dried in an oven. Brittle and dried black liquor remained in the dish. The sample was ground
using a manual screw grinder, and sieved to a size less than 600 µm by test sieves. Figure 3-5a
shows a schematic diagram of sample preparation and particle feeding method.
Mechanical mixing: The dried black liquor sample was obtained using a method similar to that
described above. After drying, the sample was ground using a manual screw grinder, and sieved
to a size in the range of 150 to 600 µm. The test sample was prepared by physically mixing
various amounts of Mg(OH)2 powder with a fixed amount of dried black liquor particles (Figure
3-5b).
Separate injection: A fixed amount of pulverized black liquor (150-600 µm) and various
amounts of Mg(OH)2 or dried commercial additive powder were fed separately into the EFR
(Figure 3-5c).

27
Black liquor slurry + Mg(OH)2
powder
Drying Grinding Sample
a. Additive mixed with black liquor slurry
Sample: mixture of additive
particles inside black liquor
particles
Black liquor slurry + Mg(OH)2
powder
Drying Grinding Sample
a. Additive mixed with black liquor slurry
Sample: mixture of additive
particles inside black liquor
particles
Black liquor slurry
Drying GrindingPulverized
black liquor
Sample
Sample: solid mixture of additive particles and
black liquor particles
b. Mechanical mixing
+ Mg(OH)2
powder
Black liquor slurry
Drying GrindingPulverized
black liquor
Sample
Sample: solid mixture of additive particles and
black liquor particles
b. Mechanical mixing
+ Mg(OH)2
powder
Figure 3-5. Sample preparation and particle feeding methods

28
Black liquor particles
Additive particles
c. Separate injection
Pulverized black liquor and additive powder are loaded separately on belt.
Black liquor particles
Additive particles
Black liquor particles
Additive particles
c. Separate injection
Pulverized black liquor and additive powder are loaded separately on belt.
Figure 3-5.Sample preparation and particle feeding methods
The EFR test procedure was similar to that described for MgO-based additive coating (Section
3.3.2). The EFR conditions of these experiments are summarized in Table 3-2. After deposition,
the probe with deposits was removed from the EFR. The deposits were scraped from the probe
surface, collected, and analyzed for the compositions using X-ray fluorescence (XRF).
Table 3-2.EFR conditions for combustion of dried black liquor particles with additives
Parameter Additive mixed with
black liquor slurry
Mechanical
mixing
Separate
injection
Particle size, µm < 600 150-600 150-600
EFR temperature, °C 800 800 800
Gas flow rate, m/s 1.8 1.8 1.8
Probe temperature, °C 400 400 400
Particle feed rate, g/min 10 10-13 10-13
In this set of experiments, an air jet nozzle with a throat diameter of 3.25 mm and an exit
diameter of 7.35 mm was used. The supplied inlet pressure to the nozzle was kept at 800 psig.
The correlation between PIP and distance from nozzle exit was calculated from the supplied air
inlet pressure and the nozzle geometry.
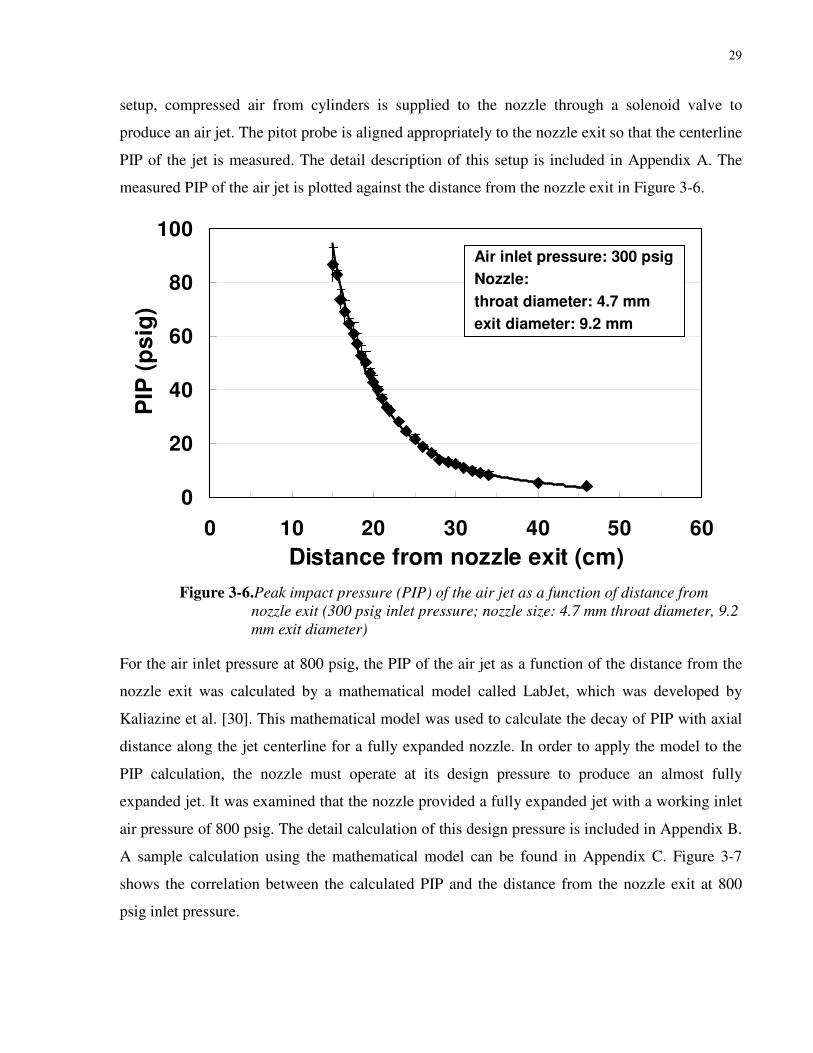
3.4 Air Jet Peak Impact Pressure (PIP) vs. Distance Correlation
The PIP of the air jet as a function of the distance from the nozzle exit at 300 psig inlet pressure
was determined using a pitot probe in a laboratory setup described by Pophali et al. [52]. In the
29
setup, compressed air from cylinders is supplied to the nozzle through a solenoid valve to
produce an air jet. The pitot probe is aligned appropriately to the nozzle exit so that the centerline
PIP of the jet is measured. The detail description of this setup is included in Appendix A. The
measured PIP of the air jet is plotted against the distance from the nozzle exit in Figure 3-6.
0
20
40
60
80
100
0 10 20 30 40 50 60
Distance from nozzle exit (cm)
PIP
(p
sig
)
Air inlet pressure: 300 psig
Nozzle:
throat diameter: 4.7 mm
exit diameter: 9.2 mm
0
20
40
60
80
100
0 10 20 30 40 50 60
Distance from nozzle exit (cm)
PIP
(p
sig
)
Air inlet pressure: 300 psig
Nozzle:
throat diameter: 4.7 mm
exit diameter: 9.2 mm
Figure 3-6.Peak impact pressure (PIP) of the air jet as a function of distance from
nozzle exit (300 psig inlet pressure; nozzle size: 4.7 mm throat diameter, 9.2
mm exit diameter)
For the air inlet pressure at 800 psig, the PIP of the air jet as a function of the distance from the
nozzle exit was calculated by a mathematical model called LabJet, which was developed by
Kaliazine et al. [30]. This mathematical model was used to calculate the decay of PIP with axial
distance along the jet centerline for a fully expanded nozzle. In order to apply the model to the
PIP calculation, the nozzle must operate at its design pressure to produce an almost fully
expanded jet. It was examined that the nozzle provided a fully expanded jet with a working inlet
air pressure of 800 psig. The detail calculation of this design pressure is included in Appendix B.
A sample calculation using the mathematical model can be found in Appendix C. Figure 3-7
shows the correlation between the calculated PIP and the distance from the nozzle exit at 800
psig inlet pressure.

30
0
50
100
150
200
0 10 20 30 40 50 60
Distance from nozzle exit (cm)
PIP
(P
sig
)Air inlet pressure: 800 psig
Nozzle:
throat diameter: 3.25 mm
exit diameter: 7.35 mm
0
50
100
150
200
0 10 20 30 40 50 60
Distance from nozzle exit (cm)
PIP
(P
sig
)Air inlet pressure: 800 psig
Nozzle:
throat diameter: 3.25 mm
exit diameter: 7.35 mm
Figure 3-7.Peak impact pressure (PIP) of the air jet as a function of distance from
nozzle exit (800 psig inlet pressure; nozzle size: 3.25 mm throat diameter,
7.35 mm exit diameter)

31
4. LABORATORY RESULTS AND DISCUSSION
The effect of MgO-based additives on deposit accumulation and removal varies with the
application method and the additive amount. In the laboratory study, experiments were carried
out using four additive application methods to examine the effect of additives on deposition and
removal.
In this work, the additive amount coated on the probe surface is expressed as an estimated MgO
coating thickness since the probe surface temperature (470°C) is much higher than the
decomposition temperature of Mg(OH)2 (350°C) and the coated layer is expected to be converted
into MgO. On the other hand, to determine if the Mg(OH)2 was converted into MgO after
passing through the EFR at 800°C, an experiment was conducted by collecting material on a tray
after feeding pure Mg(OH)2 powder. The thermal behaviour of the collected material was
analyzed by TGA/DSC. The result suggests that >80 wt% of the fed Mg(OH)2 powder was
converted into MgO. Due to the conversion of Mg(OH)2 to MgO, the amount of additive (both
pure Mg(OH)2 and commercial additives) in dried black liquor sample feed is expressed as
weight percent of MgO in feed.
The deposition is expressed in milligram of deposit per centimeter square of the projected area
on the probe per gram of sample fed into the EFR.
4.1 Experimental Reproducibility
The experimental reproducibility of the EFR was examined by measuring the deposit mass
collected on a clear probe surface from the combustion of the dried black liquor particles at the
same chemical composition and size distribution under the same EFR operating conditions. The
deposit mass of seven samples of dried black liquor particles in a size range of 150 to 600 µm
that were burned at 800°C in the EFR has an average of 0.55 ± 0.05 mg/cm2/g-feed with a
coefficient of variation of 8.6 %.
The reproducibility of experiments using the air jet blow-off apparatus was determined by
measuring the PIP of the deposits using the same nozzle at the same supplied inlet pressure. Five
deposits, which were produced by burning the black liquor particles in the same size distribution
(150-600 µm) at 800°C in the EFR, were blasted using a nozzle with a throat diameter of 3.25

32
mm and an exit diameter of 7.35 mm at an inlet pressure of 800 psig. The average PIP of the
deposits was 73.8 ± 11.5 psig with a coefficient of variation of 15.6 %.
Table 4-1 summarizes the test conditions and results of the experiments conducted for
reproducibility study. The coefficient of variation was used to examine the reliability of the
equipment, determine the error associated with each measurement, and explain the results
obtained.
Table 4-1.Deposition and PIP obtained from one set of experimental conditions
Run
1
Run
2
Run
3
Run
4
Run
5
Run
6
Run
7 Mean
Standard
Deviation
Coefficient
of variation
(%)
Test Conditions
EFR
Temp., °C 800 800 800 800 800 800 800 800 0 0
Probe
Temp., °C 403 400 400 399 400 400 399 400 1 0.3
Air
supplied
pressure,
psig
800 800 800 800 800 800 800 800 0 0
Measurements
Deposition,
mg/cm2/g-
feed
0.60 0.48 0.56 0.58 0.54 0.49 0.59 0.55 0.05 8.6
PIP, psig 85.5 N/A 72.9 N/A 62.5 62.5 85.5 73.8 11.5 15.6
4.2 Reactions Between MgO-Based Additives and Deposits
Some of the physical and thermal properties of MgO-based additives and deposits are shown in
Table 4-2.
Table 4-2.Physical and thermal properties of MgO-based additives and deposits
Parameter Mg(OH)2 MgO Deposits
Bulk density, g/cm3 0.68 0.62 1.5
Median particle size, µm 14 5 -
Decomposition temperature, °C 350 [53] - -
Melting temperature, °C - 2800 [53] 520-800

33
In order to examine the reactions between the additive and deposits, a smelt sample was used
since its chemical composition is similar to that of the deposits. The XRD scanning results of the
solid residues from the two oxidized smelt samples containing 0 wt% and 35 wt% of MgO are
shown in Figure 4-1 (a) and (b), respectively. After the smelt sample with no MgO was heated at
900°C for 30 minutes, Na2CO3, Na2SO4, and Na2S2O3 hydrate were found in its solid residue
(Figure 4-1a). On the other hand, the residue of the MgO containing smelt sample contained
mostly Na2CO3, Na2SO4, Na2S2O3 hydrate, and MgO (Figure 4-1b), which suggests that no new
compounds were formed after the heat treatment. The results indicate that there are no reactions
between smelt and MgO.

34
A-
MgO
B-
Na
2C
O3
C-
Na
2S
O4
D-
Na
2S
2O
3h
ydra
te
B
B
B
BB
BB
CC
CC
CD
DD
DD
DD
D
B
DC
D
a.
0 w
t% M
gO
in o
xid
ized
sm
elt
co
un
ts
DD
800
600
400
200 0
30
40
50
2θ
(°)
A
AB
B
B
B
B
B
BB
CC
CC
CD
DD
DD
DD
D
b.
35
wt%
Mg
Oin
oxid
ize
d s
me
lt
co
un
ts
DD
800
600
400
200 0
30
40
50
2θ
(°)
A-
MgO
B-
Na
2C
O3
C-
Na
2S
O4
D-
Na
2S
2O
3h
ydra
te
B
B
B
BB
BB
CC
CC
CD
DD
DD
DD
D
B
DC
D
a.
0 w
t% M
gO
in o
xid
ized
sm
elt
co
un
ts
DD
800
600
400
200 0
800
600
400
200 0
30
40
50
30
40
50
2θ
(°)
A
AB
B
B
B
B
B
BB
CC
CC
CD
DD
DD
DD
D
b.
35
wt%
Mg
Oin
oxid
ize
d s
me
lt
co
un
ts
DD
800
600
400
200 0
800
600
400
200 0
30
40
50
30
40
50
2θ
(°)
Figure 4-1.XRD results of solid residues from (a) 0 wt% MgO in oxidized smelt and (b) 35
wt% MgO in oxidized smelt heated at 900°C for 30 minutes

35
4.3 Effect of MgO-Based Additive Coating
Figure 4-2 shows the amount of deposits collected on the probe as a function of MgO coating
thickness for both pure Mg(OH)2 and commercial additives. For pure Mg(OH)2, without coating
or at 0 µm coating thickness, the deposition rate is about 1.25 mg/cm2/g-feed. As MgO coating
thickness increases, the deposition rate appears to have an insignificant change. Similarly, the
commercial additive also has no effect on the deposit accumulation. It was therefore concluded
that the MgO coating thickness did not have significant effect on deposit accumulation.
0
0.5
1
1.5
2
0 20 40 60 80 100 120 140 160 180
Estimated MgO Coating Thickness (µm)
De
po
sit
(m
g/c
m2/g
fe
ed
)
Commercial Additive
Pure Mg(OH)22
0
0.5
1
1.5
2
0 20 40 60 80 100 120 140 160 180
Estimated MgO Coating Thickness (µm)
De
po
sit
(m
g/c
m2/g
fe
ed
)
Commercial Additive
Pure Mg(OH)22
Figure 4-2.Effect of additive coating thickness on deposit accumulation (EFR
conditions: 800°C and gas velocity=1.8 m/s; probe: 470°C; particle size:
90-300 µm, 10.5 mol% Cl/(Na+K), feed rate: 5 g/min)
Figure 4-3 shows the appearance of deposits on a probe surface with and without MgO coating.
The surface without coating (Figure 4-3a) had a dense and sintered deposit, which could not be
removed by the air jet. In Figure 4-3b, the probe surface was coated with a 15 µm MgO layer.
Partial removal of the deposit was observed after blowing. In Figure 4-3c, the probe surface was
coated with a thicker, 110 µm MgO layer. The deposit, along with the coating layer, fell off by
gravity as the probe was turned 90°, even without blowing.
The results clearly show that the coating layer acts as a barrier and dramatically decreases the
adhesion strength at the deposit-probe interface, making the deposit easier to remove.

36
After blowing
After deposition
Before deposition
After blowing
After deposition
Before deposition
a. No Coating
After blowing
After deposition
Before deposition
After blowing
After deposition
Before deposition
b. MgO Coating (15 µm)
After removal
After deposition
Before deposition
After removal
After deposition
Before deposition
c. MgO Coating (110 µm)
Figure 4-3.Appearance of deposit on the probe surface

37
Figure 4-4 shows the effect of additive coating thickness on deposit removal at a probe
temperature of 470°C. For both pure Mg(OH)2 and commercial additives, the PIP required for
removing the deposit decreases with an increase in MgO coating thickness. For coatings thinner
than 35 µm, the PIP required to remove deposits decreases dramatically from 20 psig at about 5
µm to 2 psig at 35 µm. For the coating thicknesses greater than 80 µm, the PIP was zero, since
deposits fell off while rotating the probe, even before the air jet was used.
0
5
10
15
20
25
0 20 40 60 80 100 120 140 160 180
Estimated MgO Coating Thickness (µm)
PIP
(P
sig
)
Commercial Additive
Pure Mg(OH)22
0
5
10
15
20
25
0 20 40 60 80 100 120 140 160 180
Estimated MgO Coating Thickness (µm)
PIP
(P
sig
)
Commercial Additive
Pure Mg(OH)22
Figure 4-4.Effect of additive coating thickness on deposit removal (300 psig inlet
pressure; nozzle size: 4.7 mm throat diameter, 9.2 mm exit diameter)
In an earlier study, the PIP required to remove the same type of deposits on a clear probe surface
was measured to be about 156 psig (1.2 MPa) [32]. Results in Figure 4-4 suggest that the PIP
required for removing a deposit built on a 5 µm MgO coating was less than one-seventh of that
needed to remove a deposit built on a surface without coating.
4.4 Effect of MgO-Based Additive Mixed with Black Liquor Slurry
The experiments were conducted in which pure Mg(OH)2 containing dried black liquor particles
were burned in the EFR at 800°C. This is to simulate the condition in the recovery boiler where
Mg-containing precipitator ash is mixed with black liquor stream.

38
Figure 4-5 shows the appearance of deposit obtained on the probe at different wt% of MgO in
feed. The blank sample, which did not contain Mg(OH)2, was used as a baseline to compare with
samples that contained Mg(OH)2.
11
7
3.5
2
0
Pure Mg(OH)2 AdditiveMgO in
feed (wt%)
11
7
3.5
2
0
Pure Mg(OH)2 AdditiveMgO in
feed (wt%)
Figure 4-5.Appearance of deposit on the probe surface for additive mixed with black liquor
slurry at different weight percent of MgO in feed (EFR conditions: 800°C and gas
velocity=1.8 m/s; probe: 400°C; particle size: <600 µm, feed rate: 10 g/min)
As shown in Figure 4-5, the blank feed sample (0 wt% MgO in feed) formed a brown colour
deposit, which is often seen from burning black liquor sample in the EFR. Deposits obtained
from the Mg(OH)2 containing black liquor contained some unburned black particles (char). This
suggests that samples that contain Mg(OH)2 may not have sufficient heat for a complete
combustion.
The effect of pure Mg(OH)2 additive on deposit accumulation are shown in Figure 4-6. For a
feed that contained no Mg(OH)2 (0 wt% of MgO in feed), a deposit mass of about 0.5 mg/cm2/g-
BL was collected on the probe surface. It was found that the deposition slightly increased as the
amount of MgO in the feed increased.

39
0
0.5
1
1.5
0 5 10 15
MgO in feed (wt%)
De
po
sit
(m
g/c
m2/g
BL
)Pure Mg(OH)2
0
0.5
1
1.5
0 5 10 15
MgO in feed (wt%)
De
po
sit
(m
g/c
m2/g
BL
)Pure Mg(OH)2Pure Mg(OH)2
Figure 4-6.Effect of pure Mg(OH)2 additive on deposition for additive mixed with black
liquor slurry (EFR conditions: 800°C and gas velocity=1.8 m/s; probe: 400°C;
particle size: <600 µm, feed rate: 10 g/min)
It is worthwhile to examine the Mg content in the deposits in order to understand the combustion
of the Mg(OH)2 containing black liquor particles in the EFR. The composition of deposits (i.e.
Mg and Na contents) was analyzed by XRF. The results are expressed as Mg/Na weight ratio
while Na is used as an internal standard. Figure 4-7 establishes the relationship between the
calculated values and the measured values. In the graph, the calculated values were obtained
based on the mass of MgO (dehydration of Mg(OH)2) in the feed sample and the Na content of
the dried black liquor assuming that the particles were well distributed and completely burned
inside the EFR. The dotted line represents the case that the actual measurements are exactly the
same as the calculated values. From the results, it can be said that the measured values fit well
with the dotted line, indicating that the Mg(OH)2 that was mixed with the black liquor slurry
tends to deposit on the probe surface along with black liquor particles.

40
0
100
200
300
400
0 100 200 300 400
Calculated Mg/Na Weight Ratio (x10-3
)
Me
as
ure
d M
g/N
a W
eig
ht
Ra
tio
(x
10
-3)
Pure Mg(OH)2
0
100
200
300
400
0 100 200 300 400
Calculated Mg/Na Weight Ratio (x10-3
)
Me
as
ure
d M
g/N
a W
eig
ht
Ra
tio
(x
10
-3)
0
100
200
300
400
0 100 200 300 400
Calculated Mg/Na Weight Ratio (x10-3
)
Me
as
ure
d M
g/N
a W
eig
ht
Ra
tio
(x
10
-3)
Pure Mg(OH)2Pure Mg(OH)2
Figure 4-7.Comparison of measured and calculated Mg/Na weight ratios of deposits
obtained from additive mixed with black liquor slurry
In order to examine the effect of pure Mg(OH)2 additive on deposit removability, such deposits
were blasted with the air jet blow-off apparatus at an inlet pressure of 800 psig. The correlation
between the amount of MgO in the black liquor sample and the minimum PIP required to remove
the deposits on the probe surface at 400°C is illustrated in Figure 4-8. The results showed that
the minimum PIP required to remove the deposits appeared to decrease with the increase of MgO
amount in the black liquor sample. It was suggested that the Mg(OH)2 present in the black liquor
particles could weaken the deposits and make the deposits easier to remove. This was probably
due to the reduction effect of Mg(OH)2 on the liquid content of the black liquor particles, making
the deposits less tenacious and debond easier from the probe surface.

41
0
50
100
150
200
0 5 10 15
MgO in feed (wt%)
PIP
(p
sig
)Pure Mg(OH)2
0
50
100
150
200
0 5 10 15
MgO in feed (wt%)
PIP
(p
sig
)Pure Mg(OH)2Pure Mg(OH)2
Figure 4-8.Effect of pure Mg(OH)2 additive on deposit removal for additive mixed with black
liquor slurry (800 psig inlet pressure; nozzle size: 3.25 mm throat diameter, 7.35
mm exit diameter)
4.5 Effect of Mechanical Mixing of MgO-Based Additive and Black
Liquor Particles
In this set of experiments, a fixed amount of dried black liquor particles in a size range of 150 to
600 µm and various amounts of pure Mg(OH)2 powder were added in a sample bottle and shaken
vigorously to mix them well. The mechanical pre-mixing of Mg(OH)2 powder and dried black
liquor particles was done in order to simulate an extreme situation that the injected additive is
well mixed with the carryover particles inside a recovery boiler before impacting on the tube
surface.
Figure 4-9 shows the appearance of deposits on the probe surface at different wt% of MgO in
feed. As shown in the photographs, the brown colour of the deposits obtained from the blank
sample (0 wt% MgO in feed) became lighter as the MgO amount introduced to the dried black
liquor sample was increased.

42
17
13
9
6
3
0
Pure Mg(OH)2 AdditiveMgO in
feed
(wt%)
17
13
9
6
3
0
Pure Mg(OH)2 AdditiveMgO in
feed
(wt%)
Figure 4-9.Appearance of deposit on the probe surface for mechanical mixing at different
weight percent of MgO in feed (EFR conditions: 800°C and gas velocity=1.8 m/s;
probe: 400°C; particle size: 150-600 µm, feed rate: 10-13 g/min)
The effect of pure Mg(OH)2 additive on deposits collected on the probe surface is shown in
Figure 4-10. In all the experiments, the amount of dried black liquor in the sample is fixed, but
the amount of Mg(OH)2 powder varies. As shown in the figure, the depositions were relatively
the same regardless of the amount of MgO. The results suggest that Mg(OH)2 may have little
impact on the deposition of dried black liquor particles.
The Mg content of deposits obtained from the solid mixture samples was analyzed by XRF.
Figure 4-11 shows the comparison between the calculated and actual Mg/Na weight ratios. The
calculated values were obtained based on the same assumptions made for the case where the
additive was mixed with black liquor slurry (Section 4.4). The dotted line shows the case where
the measured values and the calculated values are the same. All the square dots were observed

43
below the dotted line, which indicates a low concentration of Mg in the deposits. It suggests that
the mechanical mixing results in a low capture efficiency of Mg in deposits.
0
0.5
1
1.5
0 5 10 15 20
MgO in feed (wt%)
De
po
sit
(m
g/c
m2/g
BL
)
Pure Mg(OH)2
0
0.5
1
1.5
0 5 10 15 20
MgO in feed (wt%)
De
po
sit
(m
g/c
m2/g
BL
)
Pure Mg(OH)2Pure Mg(OH)2
Figure 4-10.Effect of pure Mg(OH)2 additive on deposition for mechanical mixing (EFR
conditions: 800°C and gas velocity=1.8 m/s; probe: 400°C; particle size: 150-
600 µm, feed rate: 10-13 g/min)
0
200
400
600
800
0 200 400 600 800
Calculated Mg/Na Weight Ratio (x10-3
)
Me
as
ure
d M
g/N
a W
eig
ht
Ra
tio
(x
10
-3)
Pure Mg(OH)2
0
200
400
600
800
0 200 400 600 800
Calculated Mg/Na Weight Ratio (x10-3
)
Me
as
ure
d M
g/N
a W
eig
ht
Ra
tio
(x
10
-3)
0
200
400
600
800
0 200 400 600 800
Calculated Mg/Na Weight Ratio (x10-3
)
Me
as
ure
d M
g/N
a W
eig
ht
Ra
tio
(x
10
-3)
Pure Mg(OH)2Pure Mg(OH)2
Figure 4-11.Comparison of measured and calculated Mg/Na weight ratios of deposits
obtained from mechanical mixing

44
Figure 4-12 shows the effect of pure Mg(OH)2 amount on deposit removal. In the experiments,
deposits that contained various amounts of Mg(OH)2 were blown by the air jet blow-off
apparatus to examine their minimum required PIP. It was found that the PIP appeared to have an
insignificant change with the increase of MgO content in the feed.
0
50
100
150
200
0 5 10 15 20
MgO in feed (wt%)
PIP
(P
sig
)
Pure Mg(OH)2
0
50
100
150
200
0 5 10 15 20
MgO in feed (wt%)
PIP
(P
sig
)
Pure Mg(OH)2Pure Mg(OH)2
Figure 4-12.Effect of pure Mg(OH)2 additive on deposit removal for mechanical mixing (800
psig inlet pressure; nozzle size: 3.25 mm throat diameter, 7.35 mm exit
diameter)
4.6 Effect of Separate Injection of MgO-Based Additives and Black
Liquor Particles
Similar to mechanical mixing (Section 4.5), separate injection is also used to simulate the
injection of additive in recovery boilers. However, separate injection experiments were
conducted in which the dried black liquor particles and additive particles (i.e. pure Mg(OH)2
powder and commercial additive) were fed separately into the EFR at 800°C.
Figure 4-13 shows the appearance of deposits obtained on the probe surface at different wt% of
MgO in feed. The brown colour of the deposits obtained at 0 wt% MgO became lighter as the
additive content in the feed was increased, and the results were similar for both pure Mg(OH)2
and commercial additives.

45
Pure Mg(OH)2 Additive Commercial Additive
MgO in
feed (wt%)
9
13
0
3
17
6
Pure Mg(OH)2 Additive Commercial Additive
MgO in
feed (wt%)
9
13
0
3
17
6
Figure 4-13.Appearance of deposit on the probe surface for separate injection at different
weight percent of MgO in feed (EFR conditions: 800°C and gas velocity=1.8 m/s;
probe: 400°C; particle size: 150-600 µm, feed rate: 10-13 g/min)
Figure 4-14 shows the amount of deposits collected on the probe surface as a function of MgO
content. For both pure Mg(OH)2 and commercial additives, the amount of deposit with no
additive injection (0 wt% MgO in feed) was about 0.5 mg/cm2/g-BL. No significant change in
deposit accumulation with MgO content was observed.
The comparison between the calculated and measured Mg/Na weight ratios is summarized in
Figure 4-15. The calculated values were obtained with a method similar to that explained in
Section 4.4. As shown in the figure, for both pure Mg(OH)2 and commercial additives, the
measured Mg/Na weight ratios are all less than their corresponding calculated values. It was
suggested that the capture efficiency of additive particles in deposits is low. This may be due to
the size difference between additive and black liquor particles; that is, smaller additive particles
have lower momentum than black liquor particles, and tend to follow the streamline and not
deposit on the probe.

46
0
0.5
1
1.5
0 5 10 15 20MgO in feed (wt%)
De
po
sit
(m
g/c
m2/g
BL
)Commercial AdditivePure Mg(OH)22
0
0.5
1
1.5
0 5 10 15 20MgO in feed (wt%)
De
po
sit
(m
g/c
m2/g
BL
)Commercial AdditivePure Mg(OH)22
Figure 4-14.Effect of additives on deposition for separate injection (EFR conditions: 800°C
and gas velocity=1.8 m/s; probe: 400°C; particle size: 150-600 µm, feed rate: 10-
13 g/min)
0
200
400
600
800
0 200 400 600 800
Calculated Mg/Na Weight Ratio (x10-3
)
Me
as
ure
d M
g/N
a W
eig
ht
Ra
tio
(x
10
-3)
Commercial AdditivePure Mg(OH)22
0
200
400
600
800
0 200 400 600 800
Calculated Mg/Na Weight Ratio (x10-3
)
Me
as
ure
d M
g/N
a W
eig
ht
Ra
tio
(x
10
-3)
Commercial AdditivePure Mg(OH)22
Figure 4-15.Comparison of measured and calculated Mg/Na weight ratios of deposits
obtained from separate injection

47
Figure 4-16 shows the effect of the additives on deposit removability. For both pure Mg(OH)2
and commercial additives, the minimum PIP requirement appeared to have no significant change
with an increase of the MgO content.
0
50
100
150
200
0 5 10 15 20
MgO in feed (wt%)
PIP
(p
sig
)
Commercial Additive
Pure Mg(OH)22
0
50
100
150
200
0 5 10 15 20
MgO in feed (wt%)
PIP
(p
sig
)
Commercial Additive
Pure Mg(OH)22
Figure 4-16.Effect of additives on deposit removal for separate injection (800 psig inlet
pressure; nozzle size: 3.25 mm throat diameter, 7.35 mm exit diameter)

48
PART 2: FIELD STUDY
5. METHODOLOGY
To complement the laboratory results, a field study was conducted in a kraft recovery boiler. As
discussed earlier, the additive is usually injected continuously into recovery boilers at a low rate.
This field study was intended to determine whether an additive coating layer could be formed on
a tube surface in the recovery boiler and how thick the coating would be. In addition, it was
important to examine how effectively could the deposits capture the additive, or how effective
could the additive be delivered to the deposits.
In this field study, a probe was used to collect carryover deposits from the superheater region
during boiler operation. Deposit samples were collected at various locations during boiler outage.
Samples of virgin black liquor, as-fired black liquor, smelt, and precipitator ash were also
collected. The compositions of all the samples were analyzed.
5.1 Boiler Operating Data
During the study, the recovery boiler was firing at 1.8 million kg per day of black liquor dry
solids (BLDS). A commercial additive has been used in the boiler for over 15 years due to severe
accumulation of deposits on the surface of superheater and generating bank tubes. The chemical
and thermal properties of the commercial additive are discussed in Section 3.1.
The additive injection system consists of six additive injectors: two on the front wall, two on the
right wall and two on the left wall on the 6th
floor of the boiler (Figure 5-1). The additive, in the
form of a water slurry, was injected into the recovery boiler at a rate of 660 kg per day, which is
equivalent to an injection rate of 0.37 kg of additive slurry per ton of BLDS fired in the boiler.

49
Figure 5-1.Kraft recovery boiler and additive injection system
5.2 Experimental Procedure
The field study was performed over 2 days: July 27 (Day 1) and July 28 (Day 2), 2010. During
this study, the mill was on softwood and the boiler was firing at its full firing capacity. The study
was carried out using a steel probe, 4.6 m (15 ft) long and 2.1 cm outer diameter (O.D.). The
probe was inserted 1.8 m (6 ft) into the boiler through two access ports (left and right) on the
front wall, on the 9th
floor (Figure 5-1), which was about 9.4 m above the additive injection. Four
tests, replicated on each of the two days, were performed at left and right access ports with
additive ON and OFF modes. For each test, the probe was inserted into the boiler for 1 minute.

50
During the ON mode, the additive slurry was sprayed into the boiler at its normal rate, while
during the OFF mode, the additive injection was turned off. All of the experiments conducted
during boiler operation are summarized in Table 5-1. After the exposure, the probe was removed
from the boiler. The deposits were scraped from the probe surface, collected, and weighed.
Table 5-1.Experiments conducted during boiler operation using a probe
Sampling
location
Exposure
time
Additive
On
Additive
Off
Left port 1 min X X Day 1
Right port 1 min X X
Left port 1 min X X Day 2
Right port 1 min X X
In Figure 5-1, deposit sampling locations during boiler outage in December 2010 are marked
with alphabetic letters A-I. Table 5-2 summarizes the locations in the boiler where deposit
samples and samples of black liquor, smelt, and precipitator ash were collected.
Table 5-2.Samples collected and sampling locations in the recovery boiler
Sampling location I.D. shown in
Figure 5-1 Sample
Furnace A As-fired black liquor
Superheater region B, C, and D Deposit
Generating bank inlet E Deposit
Generating bank F Deposit
Economizer G Deposit
Precipitator H Precipitator ash
Smelt spouts I Smelt
5.3 Analytical Method
Virgin black liquor and as-fired black liquor samples were dried in an oven controlled at 110°C
for overnight or until the samples were dried. The deposits, dried virgin black liquor, dried as-
fired black liquor, smelt, and precipitator ash were analyzed for magnesium (Mg) and sodium
(Na) contents using XRF.

51
6. FIELD STUDY RESULTS AND DISCUSSION
The mass of deposit samples collected from the probe surface were measured using an analytical
balance. The Mg and Na contents of all the dried samples collected from the recovery boiler
were analyzed. The results are presented and discussed in this chapter.
6.1 Effect of MgO-Based Additive on Deposit Accumulation
The effect of the additive on the deposition rate was studied by collecting deposits using a steel
probe in an exposing time of 1 minute under both additive ON and OFF modes. Such deposits
were photographed and their appearances are shown in Figure 6-1.
OFF
ONRight
Port
OFF
ONLeft
Port
OFF
ONRight
Port
OFF
ONLeft
Port
Figure 6-1.Appearance of deposits collected on the probe on Day 1 at left and right access
ports (ON- additive on; OFF- additive off)
Figure 6-2 shows the amount of deposit collected under the boiler operating conditions with
additive ON and OFF cases on Day 1 and Day 2 at left and right access ports.

52
0
50
100
150
200
250
1 2 3 4De
po
sit
ion
Ra
te (
g/m
2/m
in)
Day 1
Day 2
ON OFF ON OFF
Left Port Right Port
0
50
100
150
200
250
1 2 3 4De
po
sit
ion
Ra
te (
g/m
2/m
in)
Day 1
Day 2
ON OFF ON OFF
Left PortLeft Port Right PortRight Port
Figure 6-2.Deposit accumulation on the probe at left and right access ports (ON-
additive on; OFF- additive off)
It was expected that the additive ON situation would result less deposit built up since additive
supposedly helped reduce the formation of deposits. In Figure 6-2, the results at the right access
port showed that the deposition rates for the additive ON situation were lower compared to those
for the OFF situation on both Day 1 and Day 2, which was consistent with the expectation.
However, the opposite trends were observed at the left access port, where the deposition rates for
the additive ON mode were higher than those for the OFF mode. It was therefore concluded that
the effect of additive on the deposition rates was not conclusive.
6.2 Chemical Compositions of Deposits and Process Materials
The deposits were collected on the probe in an exposing time of 1 minute under both additive
ON and OFF modes. The Mg content in the deposits is expressed as a weight ratio of Mg to Na
and illustrated in Figure 6-3. It was noted that the deposits obtained for both additive ON and
OFF cases contained Mg content. Nevertheless, the difference in Mg contents between the ON
and OFF situations may be used to indicate how effectively the deposits could capture the
additives. As shown in the figure, on Day 1, the Mg/Na weight ratios in deposits were similar for
the additive ON and OFF situations at the left access port, whereas the Mg/Na weight ratio in the
deposits for the additive ON situation was lower than that for the OFF situation at the right

53
access port. On Day 2, the Mg/Na weight ratios for the additive ON situation were significantly
higher compared to those for the additive OFF situation at both access ports. For the additive ON
situation on both days, the average Mg/Na weight ratio in deposits obtained on the probe in 1
minute exposure time at both access ports was about 3.5 × 10⁻³
.
0
1
2
3
4
5
1 2 3 4
Mg
/Na
We
igh
t R
ati
o (
x1
0-3) Day 1
Day 2
ON OFF ON OFF
Left Port Right Port
0
1
2
3
4
5
1 2 3 4
Mg
/Na
We
igh
t R
ati
o (
x1
0-3) Day 1
Day 2
ON OFF ON OFF
Left PortLeft Port Right PortRight Port
Figure 6-3.Mg/Na weight ratios of deposits collected on the probe at left and right access
ports (ON- additive on; OFF- additive off)
The large deposit samples obtained at various locations in the recovery boiler during boiler
outage were also analyzed for their compositions. Figure 6-4 shows the Mg/Na weight ratios of
these deposit samples, along with the process materials. As a comparison, the Mg/Na weight
ratios of deposits obtained on the probe in 1 minute exposure time are also included in the figure.
The results indicate that the virgin black liquor, the as-fired black liquor, and the precipitator ash
obtained from the kraft mill had a similar Mg/Na ratio. This is plausible because i) the dose of
additive is small compared to that of black liquor, ii) the amount of the precipitator ash is
typically about 5% of the as-fired black liquor by weight, and iii) the ash is recycled and mixed
with the virgin black liquor stream to produce the as-fired black liquor. The deposits, on the
other hand, showed a higher Mg/Na weight ratio than those of virgin black liquor, as-fired black
liquor, smelt, and precipitator ash. Deposits obtained at various locations during boiler outage
had a higher Mg/Na ratio compared to the probe deposits obtained in 1 minute exposure time.
This happens probably due to the different temperatures and surface properties observed at the

54
test probe and the heat transfer tubes in the superheater, generating bank, and economizer
sections. Since the temperature of the probe is higher than that of the heat transfer tubes, it is
very likely to have more Na deposited on the probe surface. In addition, the probe surface is
much smoother compared to the heat transfer surfaces, so fewer Mg additives would be captured
on the probe surface. It was observed that the Mg/Na weight ratio of the deposits from the
superheater region was about 10.2 × 10⁻³
.
0
2
4
6
8
10
12
1 2 3 4 5 6 7 8 9 10 11 12
Mg
/Na
We
igh
t R
ati
o (
x1
0-3)
Virgin As- Smelt Precip. SH GB GB EcoBL fired Ash Probe inlet
Deposit Deposit BL
0
2
4
6
8
10
12
1 2 3 4 5 6 7 8 9 10 11 12
Mg
/Na
We
igh
t R
ati
o (
x1
0-3)
Virgin As- Smelt Precip. SH GB GB EcoBL fired Ash Probe inlet
Deposit Deposit BL
Figure 6-4.Mg/Na weight ratios of process materials and deposits
6.3 Effect of Additive Injection on A Hypothetical MgO Layer
Thickness
The effect of additive on a hypothetical MgO layer thickness was examined using the data of the
probe deposits obtained in 1 minute exposure time. The thickness of a hypothetical MgO layer
formed in a base time of 1 minute was calculated from the Mg content in the collected probe
deposits (Figure 6-5). All the thickness values of the hypothetical layer formed, obtained from
the additive ON mode, are lower than 2.5 µm. In reality, this thickness should be much less
because i) the additive is usually injected continuously into the recovery boiler at a small rate; ii)
it tends to mix with the deposits as opposed to forming a uniform layer; iii) it is more difficult to
obtain a uniform coating thickness; and iv) more additive is required to cover a rough surface
compared to a smooth surface [10]. The MgO contents in the probe deposits were also found
between 0.12 to 0.25 wt%, which were rather small.
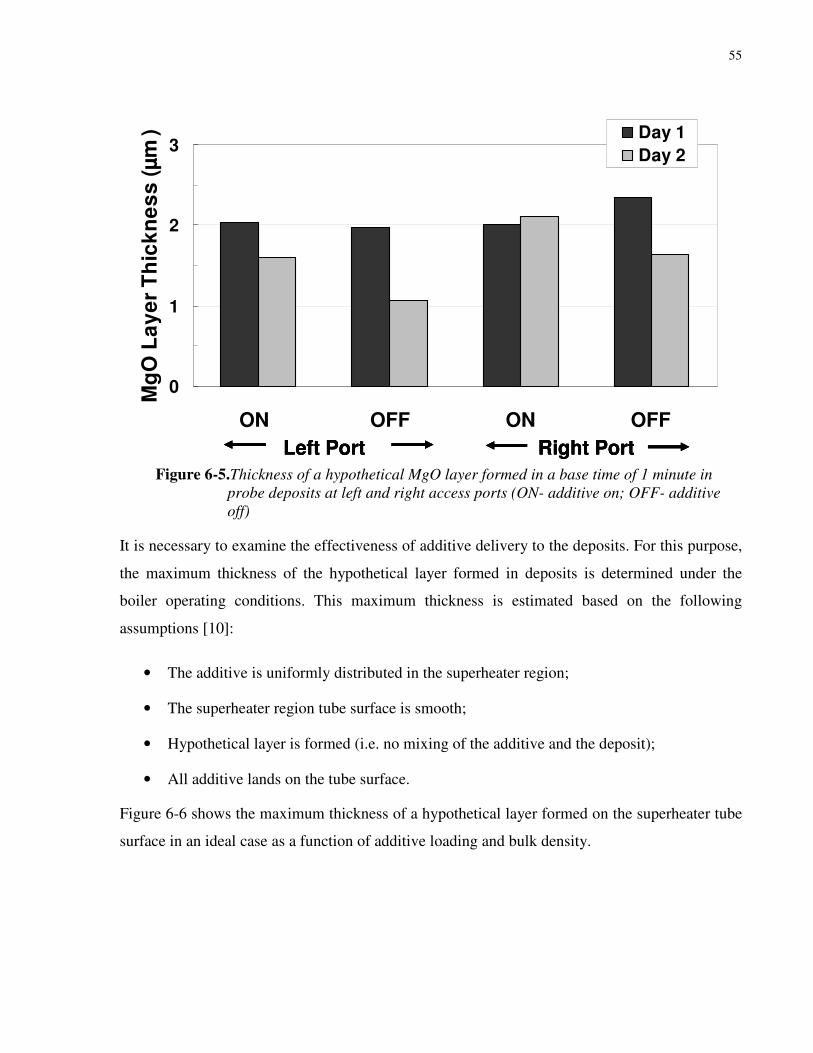
55
0
1
2
3
1 2 3 4
Mg
O L
ay
er
Th
ick
ne
ss
(µ
m) Day 1
Day 2
ON OFF ON OFF
Left Port Right Port
0
1
2
3
1 2 3 4
Mg
O L
ay
er
Th
ick
ne
ss
(µ
m) Day 1
Day 2
ON OFF ON OFF
Left PortLeft Port Right PortRight Port
Figure 6-5.Thickness of a hypothetical MgO layer formed in a base time of 1 minute in
probe deposits at left and right access ports (ON- additive on; OFF- additive
off)
It is necessary to examine the effectiveness of additive delivery to the deposits. For this purpose,
the maximum thickness of the hypothetical layer formed in deposits is determined under the
boiler operating conditions. This maximum thickness is estimated based on the following
assumptions [10]:
• The additive is uniformly distributed in the superheater region;
• The superheater region tube surface is smooth;
• Hypothetical layer is formed (i.e. no mixing of the additive and the deposit);
• All additive lands on the tube surface.
Figure 6-6 shows the maximum thickness of a hypothetical layer formed on the superheater tube
surface in an ideal case as a function of additive loading and bulk density.

56
0
10
20
30
40
50
0 1 2 3 4
Bulk Density (g/cm3)
Max.
Mg
O L
ayer
Th
ickn
ess (
µm
)
0.44
0.16
0.06
Additive loading, g MgO/kg
black liquor dry solids
SH cross section area = 68 m2
0
10
20
30
40
50
0 1 2 3 4
Bulk Density (g/cm3)
Max.
Mg
O L
ayer
Th
ickn
ess (
µm
)
0.44
0.16
0.06
Additive loading, g MgO/kg
black liquor dry solids
SH cross section area = 68 m2
Figure 6-6.Maximum thickness of a hypothetical MgO layer formed on the superheater
tube surface, in a base time of 1 minute, as a function of additive loading and
bulk density
Consider the case in which the recovery boiler burned 74,000 kg/h of BLDS and has a cross
section area of the superheater of 68 m2. The additive slurry was sprayed continuously at a rate
of 27.5 kg/h or 0.37 g/kg of BLDS. At the high flue gas temperature in the superheater region,
additive slurry must have been dewatered and Mg(OH)2 would have decomposed quickly into
MgO. Hence, the additive loading could be estimated and expressed in 0.16 g of MgO/kg of
BLDS. For this case, the maximum thickness of the hypothetical MgO layer formed in 1 minute
would be 3.7 µm with the bulk density of MgO in the commercial additive measured at 0.8
g/cm3.
At the same location with the same length of exposure time on the same day, the difference in
MgO amount between a deposit for the additive ON and OFF situations would result from the
sprayed commercial additive. This difference in the total amount of MgO injected into the boiler
for the same length of time indicates the percentage of MgO from additive coated on the probe
surface (Table 6-1).

57
Table 6-1.Percent of MgO by weight coated on the probe surface at left and right access ports
Time Location
wt% of MgO from the
sprayed additive coated
on the probe surface
Left access port 2 Day 1
Right access port -9
Left access port 14 Day 2
Right access port 13
On Day 1, the results obtained were meaningless. As the additive ON mode would result in more
MgO in the deposits compared to the OFF mode, it is impossible to have a negative weight
percent of MgO value. One of the possible reasons is that the additive injectors might be
forgotten to turn off for the additive OFF mode. On the other hand, the results from Day 2
suggest that 13-14 wt% of MgO from the sprayed additive tends to stay on the probe surface at
both access ports. In the recovery boiler, the additive particles are randomly dispersed; each
particle has a different momentum, which could vary with many parameters, such as time,
location, flue gas temperature, etc. In addition, different tube surface properties may result in
different interactions between carryover and additive particles.

58
7. IMPLICATIONS
The results obtained from the laboratory and field studies provide a systematic understanding of
the effectiveness of MgO-based additives used in mitigating fouling problems in recovery
boilers. By examining the effect of additives on deposit accumulation and removal with surface
coating and injection, and identifying the relationship between deposition/deposit strength and
amount of additive used, several relevant and practical implications are noted.
The results obtained from additive coating show that while the additive has no effect on deposit
accumulation, it may facilitate deposit removal if 5 µm or more of the additive can be applied
effectively on the tube surface. Therefore, it is important to deliver such additive coating to the
tube surface; this may not be practical in recovery boilers. As the field study indicated, the
additive is more likely to mix with the deposits as opposed to forming a uniform layer. In
addition, the thickness of a hypothetical layer that may form in the deposits in a base time of 1
minute at the mill additive injection rate is less than 2.5 µm. This suggests that in mills that inject
additive continuously into the recovery boiler at a small rate, the amount of additive may be too
small to form a uniform layer at the required thickness.
The results also indicate that the additive, which is contained inside the black liquor, tends to
form unburned char particles and slightly increase the amount of deposits. However, it may
reduce the liquid content of black liquor, which makes the deposits less sticky and easier to
remove. This is not applicable in a recovery boiler because the amount of the Mg-containing
precipitator ash is typically about 5 % of the as-fired black liquor by weight, and Mg
concentration in the ash is relatively low. The estimated amount of MgO that is recycled to the
virgin black liquor stream is less than 0.01 wt% of the dried as-fired black liquor, which may not
be able to reduce the liquid content of the black liquor.
Laboratory experiments were to simulate the conditions at which the additive was sprayed into
the recovery boiler. The results showed that the additive had insignificant effect on deposit
accumulation and removal since the amount of Mg collected in the deposits was too small. This
is possibly due to the size difference between the additive and black liquor particles. Tests were
also performed on an operating recovery boiler using a probe, and large mill deposits were
obtained during the boiler outage. The results indicated that the deposits all had a Mg/Na weight
ratio less than 12 × 10-3
(Figure 6-4), which was relatively small compared to the Mg/Na weight

59
ratios of deposits obtained from the laboratory study (Figure 4-15). This implies that the capture
of additive on the tube surface is not effective in the recovery boiler, which indicates that the
amount of additive injected is too small to have an impact.
The results of some laboratory experiments show that the additive may slightly reduce the
deposit strength at large additive dose, i.e. greater than 20 % by weight if expressed as MgO in
black liquor dry solids. However, it is not practical to introduce such large amount of the additive
into the recovery boiler.

60
8. CONCLUSIONS
A systematic study was performed to examine the effectiveness of MgO-based additives in
mitigating fouling problems in kraft recovery boilers. This thesis work consists of two parts:
laboratory study using an entrained flow reactor (EFR) and an air blow-off apparatus, and field
study performed on a recovery boiler during operation and boiler outage. The main conclusions
are summarized as follows:
Laboratory study:
• Additive coating has no effect on deposit accumulation. However, it greatly facilitates the
deposit removal by an air blow-off jet if a coating thickness of greater than 5 µm can be
applied on the tube surface.
• Additive mixed in the black liquor slurry results in unburned char formation and slightly
increases the deposition, but the deposit strength decreases with an increase in the
additive amount in black liquor.
• Mechanical mixing and separate injection of additive and black liquor have insignificant
effect on deposit accumulation and removal since the amount of Mg deposited on the
probe is too small.
Field study:
• The additive effect on the deposition rates in the recovery boiler is not conclusive.
• The capture of additive by deposits is not effective, and the amount of additive collected
on the tube surface is too small to have an impact.

61
REFERENCES
1. Tran, H.N., “The Kraft Recovery Process”, Tappi Kraft Recovery Short Course, St.
Petersburg, Florida (2006).
2. Smook, G.A., Handbook for Pulp and Paper Technologists, 3rd
edition, Angus Wilde
Publications, Vancouver, pp75-84 and pp134-163 (2002).
3. Verrill, C.L., “Black Liquor Properties Evaporation Principles”, Tappi Kraft Recovery Short
Course, St. Petersburg, Florida (2006).
4. Shenassa, R., “Dynamic Carryover Deposition in an Entrained Flow Reactor”, Ph.D. Thesis,
University of Toronto (2000).
5. Tran, H.N., “How Does A Kraft Recovery Boiler Become Plugged?”, Tappi Journal, 69
(11): 102-106 (1986).
6. Tran, H.N., “Recovery Boiler Fireside Deposits and Plugging Prevention”, Tappi Kraft
Recovery Course 2007, St. Petersburg, Florida, pp 537-572 (2007).
7. Kaliazine, A., Pophali, A., Bussmann, M., and Tran, H.N., “Mechanics of Deposit Removal”,
Research Consortium Meeting, 1: 1-12 (2008).
8. Raak, E., Mineral Impurities in Coal Combustion, Hemisphere Publishing Corp., New York,
pp 282-311 (1985).
9. Lowe, A.J., McCaffrey, D.J.A., and Richard, D.G., “An Investigation into the Effectiveness
of Fireside Fuel Additives”, Fuel Processing Technology, 36: 47-53 (1993).
10. Tran, H.N., “A Critical Review of the Use of Fireside Additives for Deposit Control in Kraft
Recovery Boilers”, Tappi Journal, 82(1): 212-219 (1999).
11. Isaak, P., Tran, H.N., Barham, D., and Reeve, D.W., “Stickiness of Fireside Deposits in Kraft
Recovery Units. Part II. The Effects of Potassium and Surface Treatment”, Journal of Pulp
and Paper Science, 13 (5): 154-158 (1987).
12. Hupa, M., “Combustion of Black Liquor Droplets”, Tappi 1995 Kraft Recovery Short
Course, Orlando, Florida, 5.2: 1-17 (1995).
13. Hupa, M., Solin, P., and Hyöty, P., “Combustion Behaviour of Black Liquor Droplets”,
Journal of Pulp and Paper Science, 13 (2): 67-72 (1987).
14. Frederick, W.J., and Hupa, M., “The Effects of Temperature and Gas Composition on
Swelling of Black Liquor Droplets During Devolatilization”, Journal of Pulp and Paper
Science, 20 (10): 274-280 (1994).
15. Frederick, W.J., Noopila, T., and Hupa, M., “Swelling of Spent Pulping Liquor Droplets
During Combustion”, Journal of Pulp and Paper Science, 17 (5): 164-170 (1991).

62
16. Tran, H.N., “A Study of Superheater Fireside Deposits in Kraft Recovery Boilers”, Ph.D.
Thesis, University of Toronto (1982).
17. Tran, H.N., “Recovery Boiler Deposit Formation and Plugging Prevention”, Tappi Kraft
Recovery Short Course, St. Petersburg, Florida (2006).
18. Verrill, C.L., Grace, T.M., and Nichols, K.M., “The significance of Sodium Release During
Devolatilization on Fume Formation in Kraft Recovery Furnaces”, Journal of Pup and Paper
Science, 20 (12): 354-360 (1994).
19. Tamminen, T., Kiuru, J., Kiuru, R., Janka, K., and Hupa, M., “Dust and Flue Gas Chemistry
During Rapid Changes in the Operation of Black Liquor Recovery Boilers: Part 1- Dust
Formation”, Tappi Journal, 1 (5): 27-31 (2002).
20. Tavares, A., and Tran, H.N., “Field Studies on Fume Chemistry and Deposition in Kraft
Recovery Boilers”, Tappi Journal, 80 (12): 117-122 (1997).
21. Tran, H.N., Pryke, D.C., and Reeve, D.W., “Control of Fireside Deposit Formation in Kraft
Recovery Units”, Pulp and Paper Canada, 87 (12): 435-439 (1986).
22. Tran, H.N., Thompson, S.L., Pryke, D.C., and Reeve, D.W., “On-line Measurement of
Fireside Deposit Accumulation in Kraft Recovery Boilers”, Tappi Journal, 70 (1): 75-79
(1987).
23. Issak, P., Tran, H.N., Barham, D., and Reeve, D.W., “Stickiness of Fireside Deposits in Kraft
Recovery Units”, Journal of Pulp and Paper Science, 12 (3): 84-88 (1986).
24. Mao, X., Lee, S., and Tran, H.N., “Effects of Carryover Liquid Content and Particle Size on
Deposit Removability in Kraft Recovery Boilers”, Journal of Pulp and Paper Science, 35
(2): 41-45 (2009).
25. Shenassa, R., Tran, H.N., and Kuhn, D.C.S., “Dynamic Study of Carryover Deposition in
Kraft Recovery Boilers Using an Entrained Flow Reactor”, Pulp and Paper Canada, 100
(10): 56-62 (1999).
26. Backman, R., Hupa, M., and Uppstu, E., “Fouling and Corrosion Mechanisms in the
Recovery Boiler Superheater Area”, Tappi Journal, 70 (6): 123-127 (1987).
27. Avallone, E.A., Baumeister, T., and Sadegh, A.M., Marks’ Standard Handbook for
Mechanical Engineers, 11th
edition, McGraw-Hill, pp 9.32 (2007).
28. Moskal, T.E., Bunton, M.A., and Patel, R.L., “Sootblower Advancements Improve Recovery
Boiler Operations”, Power Engineering, 101 (6): 51-54 (1997).
29. Jameel, M.I., Cormack, D.E., Tran, H.N., and Moskal, T.E., “Sootblower Optimization- Part
1: Fundamental Hydrodynamics of a Sootblower Nozzle and Jet”, Tappi Journal, 77 (5):
135-142 (1994).
63
30. Kaliazine, A., Cormack, D.E., Ebrahimi-Sabet, A., and Tran, H.N., “The Mechanics of
Deposit Removal in Kraft Recovery Boilers”, International Chemical Recovery Conference
2, pp 641-654 (1998).
31. Kaliazine, A.L., Piroozmand, F., Cormack, D., and Tran, H.N., “Sootblower Optimization-
Part 2: Deposit and Sootblower Interaction”, Tappi Journal, 80 (11): 201-207 (1997).
32. Mao, X., Tran, H.N., and Cormack, D.E., “Effects of Chemical Composition on the
Removability of Recovery Boiler Fireside Deposits”, Tappi Engineering Conference, pp 921-
931 (2000).
33. Piroozmand, F., Tran, H.N., Kaliazine, A., and Cormack, D.E., “Strength of Recovery Boiler
Fireside Deposits at High Temperatures”, Engineering Conference, pp 169-179 (1998).
34. Ebrahimi-Sabet, S.A., “A Laboratory Study of Deposit Removal by Debonding and Its
Application to Fireside Deposits in Kraft Recovery Boilers”, Ph.D. Thesis, University of
Toronto (2001).
35. Zbogar, A., Frandsen, F., Jensen, P.A., and Glarborg, P., “Shedding of Ash Deposits”,
Progress in Energy and Combustion Science, 35: 31-56 (2009).
36. Locklin, D.W., Krause, H.H., Anson, D., and Reid, W., “Electric Utility Use of Fireside
Additives”, Electric Power Research Institute, Coal Combustion Systems Division, (Report)
EPRICS, issue 1318 (1980).
37. Bryers, R.W., “Fireside Slagging, Fouling, and High-temperature Corrosion of Heat-transfer
Surface Due to Impurities in Steam-raising fuels”, Progress in Energy and Combustion
Science, 22: 29-120 (1996).
38. Cramer, S.D. and Covino, B.S., Jr., ASM Handbook, Volume 13C- Corrosion: Environments
and Industries, ASM International, pp 479-481 (2006).
39. Hatt, R.M., “Fireside Deposits in Coal-fired Utility Boilers”, Progress in Energy and
Combustion Science, 16 (4): 235-241 (1990).
40. Fichera, M., Leonardi, R., and Farina, C.A., “Fuel Ash Corrosion and Its Prevention with
MgO Addition”, Electrochimica Acta, 32 (6): 955-960 (1987).
41. Cowan, J.C. and Weintritt, D.J., Water-Formed Scale Deposits, Knovel, pp 414 (1976).
42. Frayne, C., Boiler Water Treatment- Principles and Practice, Volume I-II, Chemical
Publishing Company Inc, pp 678-693 (2002).
43. Radway, J.E., Corrosion and Deposits from Combustion Gases- Abstracts and Index,
Hemisphere Publishing Corp., New York (1985).
44. Engstrom, G.G., “Research on Additives for the Control of Fouling”, Slagging and Fouling
Due to Impurities in Combustion Gases, edited by Barrett, R.E., United Engineering
Trustees, Inc., pp 615-636 (1989).

64
45. Bott, T.R., Fouling of Heat Exchangers, Amsterdam, Elsevier, pp 347-356 (1995).
46. Kyi, S. and Chadwick, B.L., “Screening of Potential Mineral Additives for Use as Fouling
Preventatives in Victorian Brown Coal Combustion”, Fuel, 78: 845-855 (1999).
47. Radway, J.E., “The Selection and Use of Fireside Additives on Industrial Boilers”,
Proceedings from the Third Industrial Energy Technology Conference, Houston, TX, pp 18-
23 (1981).
48. Marner, W.J. and Suitor, J.W., “A Survey of Gas-Side Fouling in Industrial Heat-transfer
Equipment”, Jet Propulsion Laboratory Final Report, California Institute of Technology, pp
6.3-6.12 (1984).
49. Roessler, D.M. and Huffman, D.R., Magnesium Oxide (MgO), Handbook of Optical
Constants of Solids, edited by Palik, E.D., Elsevier, pp 919-955 (1998).
50. Wulfinghoff, D.R., Energy Efficiency Manual, Energy Institute Press, pp 178-180 (1999).
51. Marshall, M.D., Michels, W.F., and Smyrniotis, C.R., “CFD Targeted In-furnace Injection
for Slag/fouling Inhibition in Black Liquor Recovery Boilers”, Tappi 1996 Engineering
Conference Proceedings, Tappi Press, Atlanta, Book 2, pp 765-767 (1996).
52. Pophali, A., Bussmann, M., and Tran, H.N., “Interaction between Sootblower Jet and
Generating Bank Tubes”, Annual Progress Report, Research Consortium on Increasing
Energy and Chemical Recovery Efficiency in the Kraft Pulping Process, University of
Toronto, 1: 1-7 (2009).
53. Green, D.W. and Perry, R.H., “Physical and Chemical Data”, Perry’s Chemical Engineers’
Handbook, 8th
edition, McGraw-Hill, pp 2.17 (2008).
54. Wilcox, D.C., Basic Fluid Mechanics, 2nd
edition, DCW Industries, pp 299-308 (2003).

65
APPENDICES
Appendix A: Air Jet PIP vs. Distance Correlation Using A Pitot Probe
The pitot probe is used to measure the centerline peak impact pressure (PIP) of the air jet
described by Pophali et al [52]. Figure A-1 shows a schematic of the experimental setup. The
pitot probe is 33 cm long, and its tip has an outer diameter (O.D.) of 0.32 cm and inner diameter
(I.D.) of 0.20 cm. Compressed air from air cylinders is supplied to the nozzle through a solenoid
valve to produce an air jet. The pitot probe is mounted on a 3D traversing arrangement, while the
nozzle is on a 2D arrangement; this could allow the pitot probe to align appropriately with the
centerline of the nozzle exit at any position. The PIP measured by pitot probe is transmitted to a
data acquisition system.
solenoid
valvecompressed air
pressuretransducer
DAQ System
pitot
probenozzle
solenoid
valvecompressed air
pressuretransducer
DAQ System
pitot
probenozzle
Figure A-1. Experimental setup of PIP measurement using a pitot probe [52]

66
Appendix B: Determination of Nozzle Design Pressure
The nozzle used in the study of additive injection has a throat diameter of 3.25 mm and an exit
diameter of 7.35 mm. Figure B-1 shows a schematic of the nozzle.
7.35 mm 3.25 mm7.35 mm 3.25 mm
Figure B-1. Schematic of the nozzle
Total pressure (Pt) as a function of Mach number (M) for isentropic flow is given by the
following equation [54]:
12
2
11
−
×
−+×=
γ
γ
γMPPt (Equation B-1)
In addition, the area ratio is a function of Mach number, which can be used to obtain the Mach
number for specific nozzle dimensions and fluid [54].
( )12
1
2
2
11
1
21
*
−
+
−+
+=
γ
γ
γ
γM
MA
A (Equation B-2)
where
Pt – total pressure (operational design pressure)
P – static pressure (atmosphere ~1 bar)
γ – specific-heat ratio
M – Mach number
A – area at nozzle exit
A* – area at throat
For air, γ = 1.4, the Mach number of this nozzle for isentropic flow is approximately 3.26, and its
design pressure is approximately 54 bar (~ 800 psig).

67
Appendix C: Data Input and Output of LabJet Calculation
Table C-1. Data input of LabJet Calculation INPUT DATA
'SPECIFIED CONDITIONS:
P0 'upstream nozzle pressure, bars 54
Pamb 'ambient pressure, bars 1
T0 'upstream nozzle temperature, K 295
Tamb 'ambient temperature, K 295
k 'polytropic index of jet gas (steam-1.32, air-1.4) 1.4
Dth 'nozzle throat diameter, m 0.00325
Dex 'nozzle exit diameter, m 0.00735
Mass 'molecular mass of jet gas, g/mol (air-29,steam-18) 29
MassAmb 'molecular mass of the ambient gas, g/mol 29
'jet profile presentation:
Xstart 'the start point: recommended xstart>10*Dex 0.05
Xfin 'the last point 0.8
Xstep 'step:recommended xstep from Dex to 5*Dex 0.01
Table C-2. Data output of LabJet Calculation Exit parameters for a fully expanded nozzle: Pexit=Pamb
T, K Dex, mm V, m/s Flow,kg/s Mach Density DensAmb
94 7.59 628 0.11 3.27 3.79 1.21
X,m V, m/s PIP, bars T, K Jet dia,mm Mach PIP (psig)
0.05 628 13.20 94 7.59 3.27 191.33
0.06 628 13.20 94 7.59 3.27 191.33
0.07 628 13.20 94 7.59 3.27 191.33
0.08 628 13.20 94 7.59 3.27 191.33
0.09 628 13.20 94 7.59 3.27 191.33
0.1 628 13.17 94 7.60 3.26 190.80
0.11 628 12.92 96 7.66 3.23 187.28
0.12 628 12.46 100 7.80 3.18 180.55
0.13 626 11.79 104 8.01 3.09 170.91
0.14 619 10.77 111 8.36 2.96 156.07
0.15 606 9.48 120 8.89 2.79 137.33
0.16 587 8.15 130 9.55 2.60 118.09
0.17 566 6.94 141 10.29 2.41 100.56
0.18 543 5.90 151 11.10 2.23 85.50
0.19 521 5.03 160 11.94 2.07 72.90
0.2 499 4.31 169 12.81 1.93 62.48
0.21 478 3.72 177 13.69 1.81 53.85
0.22 458 3.22 185 14.58 1.70 46.69
0.23 439 2.81 192 15.48 1.60 40.70
0.24 422 2.46 198 16.38 1.51 35.68
0.25 405 2.17 203 17.28 1.43 31.43
0.26 390 1.92 208 18.19 1.36 27.81