the effect of wellness knowledge on physical activity and
TRANSCRIPT
Eastern Illinois UniversityThe Keep
Masters Theses Student Theses & Publications
2003
The Effect of Wellness Knowledge on PhysicalActivity and Nutrition Behaviors of College AgeStudentsShecanna R. WoomerEastern Illinois UniversityThis research is a product of the graduate program in Physical Education at Eastern Illinois University. Findout more about the program.
This is brought to you for free and open access by the Student Theses & Publications at The Keep. It has been accepted for inclusion in Masters Thesesby an authorized administrator of The Keep. For more information, please contact [email protected].
Recommended CitationWoomer, Shecanna R., "The Effect of Wellness Knowledge on Physical Activity and Nutrition Behaviors of College Age Students"(2003). Masters Theses. 1502.https://thekeep.eiu.edu/theses/1502

THESIS REPRODUCTION CERTIFICATE
TO: Graduate Degree Candidates (who have written formal theses)
SUBJECT: Permission to Reproduce Theses
The University Library is receiving a number of request from other institutions asking permission to reproduce dissertations for inclusion in their library holdings. Although no copyright laws are involved, we feel that professional courtesy demands that permission be obtained from the author before we allow these to be copied.
PLEASE SIGN ONE OF THE FOLLOWNG STATEMENTS:
Booth Library of Eastern Illinois University has my permission to lend my thesis to a reputable college or university for the purpose of copying it for inclusion in that institution's library or research holdings.
Author's Signature Date
I respectfully request Booth Library of Eastern Illinois University NOT allow my thesis to be reproduced because:
Author's Signature Date
This form must be submitted in duplicate.

DATE
The Effect of Wellness Knowledge on Physical Activity
and Nutrition Behaviors of College Age Students (TITLE)
BY
Shecanna R. Woomer
THESIS
SUBMITTED IN PARTIAL FULFILLMENT OF THE REQUIREMENTS FOR THE DEGREE OF
Masters Degree in Physical Education
IN THE GRADUATE SCHOOL, EASTERN ILLINOIS UNIVERSITY CHARLESTON, ILLINOIS
2003 YEAR
I HEREBY RECOMMEND THAT THIS THESIS BE ACCEPTED AS FULFILLING THIS PART OF THE GRADUATE DEGREE CITED ABOVE
DATE I I

ABSTRACT
The purpose of this study was to compare college age students' knowledge about
wellness to their physical activity and nutrition attitudes and behaviors. This study tested
the knowledge of 202 college age students at Eastern Illinois University and gathered
data on their physical activity and nutrition attitudes and behaviors. A modified Wellness
Knowledge, Attitude, and Behavior Instrument (WKABI) questionnaire was used for data
collection (Dinger, 1994). The main focus of the study was to relate the score on the
knowledge test to the score on the attitude survey and to the score on the behavior survey.
Subgroup comparisons by major and gender were also conducted. Students were
grouped into two groups for comparison, wellness majors (WM) which included physical
education, health, and nutrition/dietetics majors (n=95) and secondly all other majors
(OM), (n=l07). It was hypothesized that students who scored higher on the knowledge
test would also score higher on the behavior scale and attitude scale. It was further
hypothesized that WM students would not demonstrate healthier lifestyle behaviors than
OM students. The third hypothesis stated that gender would cause no difference in
knowledge, behavior, or attitude scores.
Correlation analysis showed a significant, but low relationship (significant at the
.01 level) between knowledge score and attitude score (r = .44), knowledge score and
behavior score (r = .36), and attitude score and behavior score (r = .46). Therefore,
hypothesis one was supported by results.
WM scored significantly higher on the knowledge test, the attitude survey, and
the behavior survey. Consequently, hypothesis two was not supported, as WM had a
higher behavior score than OM.
ii
Simple t-test analysis showed that there were no significant differences found
between males' and females' knowledge scores or behavior scores. However, there was a
significant difference (p = .029) in attitude scores with females (n=120) having a higher
score than males (n=82). Hence, hypothesis three was not fully supported.
This study showed positive relationships between wellness knowledge and actual
physical activity and nutrition attitudes and behaviors. Further findings supported the
positive effect of education as those in the WM scored higher on all three scales
(knowledge, attitudes, and behaviors) than did the OM group. Gender did not play a role
in knowledge or behaviors; however, the female subjects had a slightly more positive
attitude score. These results show that wellness education had a positive influence on
the attitudes and behaviors of college age students.
iii
ACKNOWLEDGEMENTS
I would like to express my appreciation to the Eastern Illinois University Physical
Education Department faculty and staff for the unconditional support and guidance
throughout my educational career here.
I especially want to recognize Dr. Jill Owen, my academic advisor and thesis
advisor, for the professional and personal advise, support, and genuine care. Her always
positive support and encouragement carried me through all aspects of my undergraduate
and graduate pursuits at EIU. Dr. Jake Emmett and Dr. Brian Pritschett also deserve
great thanks for their assistance through all my classes and projects.
Also, a thank you is due to Dr. Doug Bower for his assistance and direction with
the statistical analysis for this thesis, and Mickey Carrell for personally making time to
run my data.
iv
TABLE OF CONTENTS
Abstract...................................................................................................................... ii
Acknowledgments...................................................................................................... iv
List of Tables ............................................................................................................. viii
List of Figures ............................................................................................................ ix
Chapter I: Introduction .............................................................................................. 1
Purpose of the Study ............................................................................................. 4
Hypotheses ............................................................................................................ 4
Limitations ............................................................................................................ 5
Assumptions .......................................................................................................... 5
Significance of the Study ...................................................................................... 5
Definition of Terms ............................................................................................... 6
Chapter II: Review of Literature ............................. : .................................................. 8
Exercise and Nutrition Practices of College Students
Exercise and ·Nutrition ........................................................................................ 8
Exercise ............................................................................................................... 12
Nutrition .............................................................................................................. 15
Effects of Wellness Education on Lifestyle Behavior
Positive Effect of Education ............................................................................... 16
Neutral Effect of Education ................................................................................ 22
Summary ............................................................................................................... 26
v
Chapter III: Methods
Subjects ................................................................................................................. 27
Instrument ............................................................................................................. 28
Procedures ............................................................................................................. 28
Data Analysis .............................................................................. " .......................... 29
Chapter IV: Results and Discussion
Results ................................................................................................................... 30
Descriptive Characteristics ................................................................................. 31
Knowledge Scores ............................................................................................... 31
Nutrition and Physical Activity Attitude Scores ................................................. 34
Nutrition and Physical Activity Behavior Scores ............................................... 36
Relationships Among Knowledge and Attitude and Behavior .......................... .41
Discussion ............................................................................................................. 41
Descriptive Characteristics ................................................................................ .41
Knowledge Score Results ................................................................................... 42
Nutrition and Physical Activity Attitude Scores ................................................ .42
Nutrition and Physical Activity Behavior Scores .............................................. .43
Relationships Among Knowledge and Attitude and Behavior .......................... .44
Gender ................................................................................................................. 44
Comparison to Previous Research Literature ........................................................ 44
Exercise and Nutrition ........................................................................................ 44
Effects of Education ............................................................................................ 45
Gender ................................................................................................................. 46
vi

Chapter V: Summary and Conclusions
Summary ............................................................................................................... 47
Conclusions ........................................................................................................... 48
Recommendations ................................................................................................. 48
References .................................................................................................................. 49
Appendix A: Original WKABI Survey ..................................................................... 53
Appendix B: Modified WKABI Survey .................................................................... 65
Appendix C: Frequency and Percentages of the Responses to the WKABI.. ............ 75
vii

LIST OF TABLES
Table I: Descriptive Characteristic Frequency of all Subjects .................................. 32
Table 2: Responses to "I exercise aerobically for at least 20 minutes,
3 times per week .......................................................................................... 3 7
Table 3: Responses to "I engage in some sort of physical activity most
Every day" ............................ ; ...................................................................... 38
Table 4: Responses to" My daily diet follows the RDA of the Food
Guide Pyramid" ........................................................................................... 3 9
viii
LIST OF FIGURES
Figure 1: Mean Knowledge Scores for All Groups .................................................. .33
Figure 2: Mean Attitude Scores for All Groups ........................................................ .35
Figure 3: Mean Behavior Scores for All Groups ...................................................... .40
ix
1
CHAPTER I
INTRODUCTION
Education is used to form a knowledge base necessary to make decisions and
choices regarding behavior. The benefits of a good diet and physical activity have been
highly promoted. Unfortunately, the health of Americans has been on a decline (Kennedy
& Offutt, 2000). Wellness education is provided to students throughout their school
years. Many extend their opportunity for wellness knowledge by continuing their
education at the college level, with some students choosing a wellness related major.
Therefore, college students should be among the better-educated as well as the most
fortunate in opportunity to be healthy. They have access to multiple forms of physical
activity and a variety of foods to eat. However, physical activity is reduced as people age
and so, the risk of obesity increases (Surgeon General, 2002). Sixty-one percent of adults
in the United States were overweight or obese in 1999. Overweight and obesity result
from an imbalance involving excessive caloric consumption and/or inadequate physical
activity. An estimated 300,000 deaths per year may be attributable to obesity.
Increased physical activity and a healthy diet have been recommended to help
reverse the increasing prevalence of overweight adults in the United States. Being
overweight or obese greatly increases the risk of illness, disease, and death (Surgeon
General, 2002). Researchers have found that behaviors started early in life continue or
are repeated into adulthood. However, few studies have researched the effects of wellness
education on healthy attitudes and behaviors. Elementary students demonstrated a
healthier body image after participating in an altered curriculum (Kater, Rohwer, &

Londre, 2002). However, more studies show that the level of education does not increase
healthy living habits. For example, it was found that children that had received extra
physical education time in primary school were not more physically active as adults than
those who received the standard physical education. They did not show greater habitual
physical activity nor did they show more intention to exercise (Trudeau, Laurencelle, &
Tremblay, 1999). When future teachers were questioned, despite being educated on
physical activity and nutrition, many females in the study still reported using potentially
harmful weight control practices. Thirty three percent of those future educators also
skipped breakfast. Overall, those who should have more knowledge of benefits did not
show better nutrition habits compared to statistics from the general population (O'Dea &
Abraham, 2001). Dietetics majors over-estimated their own placement on a BMI scale
30% of the time (McArthur & Howard, 2001). Knowledge scores tended to decrease
after time ( 10 weeks) following a nutrition education course, but positive behaviors
tended to increase over time (Edwards, Acock, & Johnston, 1985).
2
When compared to other students and to health standards, Cardinal (1995) found
that physical education majors were equal to the other college students in physical
activity, but well below standards for exercise, which are associated with cardiovascular
disease prevention. College students were putting their health at risk with insufficient
activity and unhealthy food choices. Thirty-five percent of the students in this study were
overweight, while 50% were trying to lose weight. Strength training activity fell in a
middle level, being less than high school students but more than older adults. The
consumption of fruits and vegetables was high for college students but, also high was the
consumption of high-fat foods (Lowry, Galuska, Fulton, Wechsler, Kann, & Collins,
3
2000). Only one of five types of education positively affected college students' behavior,
Welle and Kittleson (1994) concluded an attitude change must be instilled to be effective.
Many students do read nutrition labels, which is a positive finding, however, they tend to
focus on certain numbers and do not take into account the use of the label as a whole
(Marietta, Welshimer, & Anderson, 1999). About one-third of female students exercised
regularly and none consumed the minimum requirements for servings of fruits and
vegetables in the food guide pyramid (Anding, Suminski, & Boss, 2001). On the positive
side, Levy and Heaton (1993) found that in a national telephone survey of adults, 71 % of
women and 62% of men reported both changing their diets and exercising more, which is
more effective than one alone. Other research has shown that adults have difficulty
incorporating physical activity and nutrition changes into their lifestyle. Patterson,
Haines, and Popkin (1994) found that adults who were physically active tended to have
unhealthy dietary habits. Also, those who had good dietary habits neglected physical
activity. A wellness course positively affected the attitudes of college students, but did
not test behavior (Moode & Finkenberg, 1994). McWhorter, Wallmann, and Tandy
(2002), looked at graduate level physical therapy students and found no difference in
lifestyle choices compared to other college students.
To what can we contribute the disconnection between wellness knowledge and a
lack of health? Is the education lacking in effectiveness, or do lifestyle behaviors reflect
other influences that induce inactivity and nutritionally deficient diets (Noring, 2000)?
Physical activity tends to decrease as people age, despite knowledge that should
support more positive attitudes and behaviors. Studies are conflicting on the relationship
of education to actual attitudes and behaviors, and many do not compare multiple aspects
4
of behavior such as physical activity and nutrition to knowledge level. Also, many young
children and adults have been studied, but studies are limited on college age students and
physical activity, nutrition, attitudes, and behaviors.
Purpose
The purpose of this study was to compare college-age students' knowledge about
physical activity and nutrition to their actual attitudes and behaviors. This study tested
the knowledge of college age students at Eastern Illinois University and examined by
survey, their attitudes and behaviors towards physical activity and nutrition. This study
related the score on the knowledge test to the score on the attitude survey and the
behavior survey. Subgroup comparisons by major and gender were also conducted.
Hypotheses
1. It was hypothesized that students who scored higher on the knowledge test would also
score higher on the attitude scale and the behavior scale.
2. It was hypothesized that students in wellness focused majors (physical education,
health, and nutrition) would not demonstrate healthier lifestyle behaviors than other
college students.
3. It was hypothesized that there would be no significant differences found between the
males' and females' knowledge, attitude, and behavior scores.

Limitations
1. The data for this study was based on student attitude and behavior self-reports,
therefore accuracy may be affected by self-bias.
2. The sample was limited to students from Eastern Illinois University.
Asswnptions
1. This sample was representative of most college students.
2. Participants answered the questions honestly and to the best of their ability.
5
3. The Wellness, Behavior, Attitude, and Knowledge Instrwnent (WBAKI) questionnaire
was a valid measure of the subject's knowledge, attitudes, and behaviors.
Significance of the Study
To lead a healthy life, it has been shown that a nutritious diet and adequate
exercise must be included in the lifestyle. In the United States, wellness education has
been increased in hopes of improving the overall health of the population (Surgeon
General, 2002). This study compared college age students' knowledge about wellness
to their activity and nutrition attitudes and behaviors. The results will also show the
effect of wellness education on healthy behaviors. Educators can use the findings to
refine education to have a more positive effect on individuals' attitudes and behaviors.
Colleges may use the results to initiate education programs and promote healthy
behaviors to their students, leading to a valid attempt to reverse the trend of 18-24 year
olds having the highest decline in physical activity (Grubbs & Carter, 2002). Many
researchers have studied the nutrition and physical activity behaviors of college age
students, but this study looks at both factors in relation to their knowledge and attitudes.
Definition of Terms
Body Mass Index (BMI) - an assessment of body weight determined by dividing weight
in kilograms by height in meters squared. (Wilmore, J. & Costill, D., 1999)
Health-related fitness - one aspect of fitness that is focused on areas affecting overall
health and energy and the ability to perform daily tasks and activities. Its' components
include cardiorespiratory fitness, body composition, and musculoskeletal fitness.
(Jackson, Morrow, Hill, & Dishman, 1999)
Calories - Also known as Kilocalories, units of heat that measure the energy in food.
Equal to the amount of heat required to raise lg of water 1°C. (Jackson et al., 1999)
Overweight - Body weight that exceeds the normal or standard weight for a particular
individual based on sex, height, and frame size. A BMI of 25-30 or a weight that is 20%
more than ideal body weight. (Wilmore, J. & Costill, D., 1999)
Obesity- An excessive amount of body fat, generally defined as more than 25% body
weight in men and 35% in women, or a BMI over 30. (Wilmore, J. & Costill, D., 1999)
6
7
Recommended Dietary Allowance (RDA) - The recommended levels of intake for certain
nutrients. The RDA's are set at levels high enough to take care of the nutrient needs of
almost all healthy people. (Jackson et al., 1999)
8
CHAPTER II
REVIEW OF LITERATURE
It was the purpose of this study to compare college age students' knowledge about
physical activity and nutrition to their actual attitudes and behaviors. Specifically, did
group knowledge scores correlate with attitude scores or with behavior scores, did
Wellness Majors (WM) have a greater knowledge of general wellness information, more
positive attitude scores, or higher behavior scores than Other Majors (OM), and finally,
were there gender differences in knowledge, attitude, or behavior scores.
This chapter presents a review of current literature in the areas of college
students' lifestyle behaviors and the effects of education. Past studies have investigated
the nutritional and physical activity behaviors of college students and how they effect the
lives of those students.
Exercise and Nutrition Practices of College Students
Exercise and Nutrition
The physical activity, food choices, weight management goals and practices of
college students was studied in 2000 using a national mail survey (Lowery et al., 2000).
The researchers obtained data from the 1995 National College Health Risk Behavior
Survey. Representative samples of US undergraduate college students (n = 4609) were
analyzed to examine associations of physical activity and food choices with weight
management goals and practices. The researchers used eleven questions from a 96-item
questionnaire, which was voluntarily completed and returned. Participation in vigorous
physical activity, muscle strengthening and toning, and moderate physical activity were
assessed using three questions. Consumption of fruits and vegetables was measured by
four questions, and weight management practices were taken from four questions. Body
Mass Index (BMI) was calculated by self-reported weight and height. The authors
compared their results to national health objectives and recommendations for physical
activity and healthy diet.
9
Among all undergraduate college students, 37.6% participated in vigorous
physical activity three or more days a week, and 29.9% participated in muscle
strengthening exercises three or more days a week. Only 19.5% had 30 minutes of
moderate activity five or more days a week. One in four students ate five or more
servings of fruits and vegetables a day, and 3 of every 4 students consumed two or more
servings of high-fat foods a day. Thirty-five percent of the students were overweight
based on BMI, but 42% considered themselves to be overweight, while 46% were trying
to lose weight. More than half (53.6%) reported using exercise and 30.8 % reported using
diet to control weight. Fifty-four percent of females and 40.9% of males reported using
both diet and exercise. Food choices and physical activity behaviors did not vary by type
of institution attended. However, it was found that students from two-year colleges were
more likely than students attending four-year institutions to be overweight or obese, to
perceive themselves to be overweight, and to use diet pills. Perhaps this was due to the
greater age and socioeconomic status variations at two-year institutions. Regardless of
10
institution, female students were more likely than male students to report using exercise
to lose or maintain weight.
Lowry and his colleagues came to several conclusions. Compared to surveys
conducted by others, the prevalence of college age participation in vigorous activity fell
between that of high school students and the adult population. Strengthening exercises
were less common for college students than for high school students, but were noticeably
more common than in the adult population (US Department of Health and Human
Services, 1996). College students ate more fruits and vegetables than adults but also
consumed 2 servings/day more of high fat foods than high school students (Sedula,
Coates, Byers, Simoes, Mokdad, & Suhar, 1995). In summary, they found many of the
nation's undergraduate college students were putting their health at risk through lifestyle
choices that include insufficient physical activity and unhealthy food choices, which
result in a high prevalence of overweight students.
This study compared many variables; however, the survey they used specifically
for college students had only 11 questions for data collection. The results showed that
college students varied widely on their healthy behaviors, and that although their physical
activity fell near the national average, their diet choices were poor (Lowery et al., 2000).
College student's diet and exercise behaviors were gathered from the University
of Pittsburgh in March, 1996. Random classes were used to conduct the Survey of
Selected Nutritional Health Practices of College Students. Three hundred and two
surveys were analyzed and compared to the standards listed in Healthy People 2000
(Haberman & Luffey, 1998). Results showed that only 39% of the subjects reported
regular exercise that met the Healthy People 2000 goal (minimum of walking for 30
\

11
minutes a day) for activity. However, only 10.6% of men and 6.6% of women were
overweight as defined by BMI, which is well under the set goal of no more than 20% of
people aged 20 years and older. The percentage of students who perceived themselves to
~e overweight (61 %) was much higher than the actual number of overweight students
(17%). Many of the students (76%) reported eating the same foods daily, indicating a
lack of variety of nutrients.
The conclusions drawn by Haberman and Luffey were that college students need
more education to establish ideal weight goals. More so than clinical consultations, it
was felt that nutritional education would affect more students and help encourage
nutritional variety that was not displayed by students. Limitations to the study included
using only students from the University of Pittsburgh, and the use of self-reported height,
weight, and nutritional habits, and participation statistics.
Anding, Suminski, and Boss (2001) looked at the exercise and nutritional
behaviors of 60 female students enrolled in three university aerobics classes at a
university in the United States. The authors collected self-reported physical activity, a
three-day food record, and anthropometrical measurements. They then compared the ·
results to seven of the Dietary Guidelines for Americans (DGA) and the Self Reported
Physical Activity Scale (SRP A). One third of the students exercised regularly based on
the SRP A scale. The students met the minimum recommended number of servings for
meat, but failed to consume the minimum servings for grains, fruits, vegetables, and dairy
products. Sixty-six percent of the participants exceeded recommended levels for fat
consumption. Thirteen percent reported drinking alcohol during the 3-day period, but
only 2% consumed in excess of recommendations (loz of pure alcohol/day). Daily sugar

intake averaged 19. 7% of total calories for the group, and over half reported sodium
intakes in excess of2400 mg per day.
The authors found that nearly all students complied with at least one DGA
recommendation, and 32% complied with two. Only 10% complied with three of the
seven DGA. Mean BMI (23 .1 ± 5.1 kg/m2) was within healthy levels for adults but
slightly higher than average for college-age women. This study found that students fell
short on most nutritional guidelines and only 33% of the subjects were considered
physically active despite being emolled in aerobic classes.
12
A study by Birkimer, Johnston, and Berry (1992) also found that 60% of their
participants reported more than two mild exercise sessions per week. They studied 185
American college students by self-report questionnaire. Results showed that 80% of the
students did not smoke. Most (>50%) reported moderate consumption of fats,
cholesterol, and salt. Students reported that they were informed about health benefits and
risks addressed in the questionnaire. The authors used a general questionnaire and
reported many results, however, only the results pertaining to health were reviewed.
Exercise
Corbin, Nielsen, Borsdorf, and Laurie (1987) studied 450 college students
emolled in a mandatory university physical education class. Subjects voluntarily
completed a commitment to activity questionnaire that reported physical activity type and
duration. They found that only 23% of students were considered highly active with 300
or more minutes of activity per week. The values reported were higher than typical

American adults but were comparable to young adults (high school age). The results
showed no difference in activity levels between genders.
Like other studies, (Haberman and Luffey, 1998; Anding et al., 2001) this study
found that students enrolled in physical education classes were not more active than the
average young adult. However, the authors did not look at education or motivation for
those who did exercise compared to those who did not, nor did they look at nutritional
behaviors.
13
Motivation was included in a study by Grubbs and Carter (2002). They studied
147 (121 female, 26 male) university undergraduates and their exercise habits as well as
the perceived benefits and barriers associated with activity. The researchers used a four
part questionnaire to gather data. Section one contained demographic questions; section
two assessed exercise habits; section three was a 43-item exercise benefits/barriers scale;
and section four gave the subject an opportunity to make comments. The results showed
that 69% of students met the criteria to be an "exerciser" (exercise habits involving large
muscle groups for 20 or more minutes, 3 or more times per week, at an intensity of at
least 60% Maximum Heart Rate). For benefits from activity, subjects agreed most
strongly with the statement "Exercise improves my level of physical fitness." The second
most agreed upon statement was that exercise improved the look of their body and
muscle tone. Barriers to exercise most frequently identified included time constraints and
embarrassment. Grubbs and Carter did find that the amount and types of benefits and
barriers were not the same between the exercisers and the non-exercisers, exhibiting an
attitude difference. They also noted that men met the requirements of an exerciser more
14
so than women. However, gender results could be skewed due to the imbalance of males
to females.
This study did not find a decline in activity during the college years. The authors
felt that the critical years are those that follow college when new responsibilities consume
more time and promote the development of less healthy behaviors.
Behavior of knowledgeable students was compared in a study, using only physical
education (n=41), health (n=44), and leisure studies (n=46) students (Huddleston,
Mertesdorf, & Araki, 2002). Their purpose was to determine the difference in the
behaviors and attitudes of students from the three related curricula. Modifiable Activity
Questionnaires (MAQ) were completed by 131 subjects to assess physical activity,
exercise intensity, and attitude/reasons for exercise. They found that weight training was
the most popular activity with 66% of individuals reporting participation. Other activities
frequently selected were walking/jogging, aerobic machines, and running.
Leisure studies students reported the highest participation levels for walk/jog,
while physical education and health major students preferred weight training. Significant
differences were found for exercise intensity but not for balance of feeling (attitudes
towards activity) by major. Physical education majors' average exercise intensity was
significantly higher than that of the leisure studies and health majors. Males tended to
exercise at a higher intensity and for a longer period of time than females. All three
balance of feeling results indicated a good to excellent attitude toward leisure time
physical activity participation. No gender differences were found for balance of feeling.
The main reason for involvement in exercise reported by students was
health/fitness. Fun/enjoyment ranked higher than appearance and challenge/achievement
15
was chosen least often. When compared by major, the researchers found several
interesting results. Leisure and health majors ranked reason for activity as "competition"
more often than physical education majors. This is possibly explained in that physical
education majors viewed activity as a goal and leisure and health majors viewed it as a
means to accomplish a goal. Physical education majors' chose for fun/enjoyment as a
reason to exercise more often than leisure and health majors. Surprisingly, females also
chose competition for reason for activity more :frequently than males, as males picked
fun/enjoyment and challenge/achievement. The main conclusion drawn from this study
was that although behavior and attitude seemed affected by major, the overall focus for
students was health and fitness.
This is one of the few studies that directly examines wellness majors, however the
results were difficult to interpret and discussion was limited. Also, this study was
conducted within one university so diversity of education was also small.
Nutrition
Nutrition of college students was addressed by Marietta, Welshimer, and
Anderson in 1999. Two hundred eight undergraduate students were surveyed on their
· knowledge of nutrition labels. The survey assessed knowledge, attitudes, and behaviors
regarding the Nutrition Labeling Education Act of 1990. Results showed that the mean
knowledge score about the nutrition label was 48.4% correct. No differences were found
by gender or age. Ninety-five percent of the students felt the labeling was useful, but half
thought that nutrition claims (low fat, high fiber) were not truthful. The researchers also
found that 70% looked, at least sometimes, at nutrition facts on products before purchase.

16
Most (72%) responded that they would purchase a product with a health claim over a
similar product without a claim. Less than half of the subjects (43%) used label nutrition
information to fit a food into their diet, with women being more likely to use nutrition
label facts than men. Approximately half of the students reported previous education
regarding food labeling. Increased knowledge of the nutrition label was found to be
positively associated to both behavior and attitude toward using the label. Also students
tended to focus on certain facts such as calories, calories from fat, and total fat, more than
information about vitamin and mineral content. This study concluded that less than half
of college students used education on nutrition labels in their regular diet choices and
therefore they are not likely to be following the RDA for a healthy diet.
Effects of Wellness Education on Lifestyle Behaviors
Positive Effect of Education
The effect of education on body image, eating, and weight concerns of elementary
school children was studied by Kater, Rohwer, and Londre (2002). The purpose of this
study was to see if the education system could work to counteract the effects of
socioculture pressure that causes dissatisfaction with body size and shape that often leads
to unhealthy behavior. Previous research has shown that it is better to curb behavior
before it begins than to change a negative habit once developed. Subjects included 415
boys and girls from five elementary schools. Students were from the 4th, 5t11, and 6th
grades and were split equally into a study group and a control group. The study group
received a "Healthy Body Image"(HBI) curriculum with 8 majn lessons including 1)
17
appearance changes during puberty; 2) genetic diversity; 3) internal weight regulation
(how the body controls weight); 4) biology of hunger deprivation (hazards of dieting); 5)
satisfaction of hunger with wholesome food; 6) limiting sedentary entertainment and
increasing physical activity; 7) balanced attention to aspects of identity; and 8) choosing
realistic role models. These lessons were intended to motivate children to make healthy
choices that influence health and weight~ Comparative data was obtained from a pretest
and posttest consisting of a 103-question survey given to both groups.
The investigators found several significant results. Knowledge level for both girls
and boys increased dramatically after the three years of education. The boys also showed
better choices regarding eating and physical activity. The girls reflected a positive trend
towards self-image, body size prejudices, and lifestyle behaviors endorsed. In conclusion,
the authors found that the HBI intervention had a positive effect, which supports the
belief that if children acquire a knowledge base as they enter the critical and often more
vulnerable middle school years, future unhealthy behaviors may be avoided (Kater et al.
2002). A limitation to this study was that it only assesses short-term effects and showed
no proof of long-term effects. The authors also did not look at actual dietary habits. The
authors suggest that the HBI curricula should continue on into the following grades to be
most effective.
Welle and Kittleson (1994) conducted research on the impact of college health
and physical education courses on personal wellness. The intention of the researchers
was to identify the impact of college level courses on individual wellness. Students were
required to complete a three-hour course in health education and three 1 credit hour
physical education courses. Five classes were selected from health education department
18
as were five classes from the physical education department. Two of the health courses
had a curriculum in which the students identify one health risk that they were to attempt
to reduce during the course, and the remaining three lectured on a variety of health topics.
Two of the physical education courses were jogging classes, two were non-impact
exercise, and one was a general conditioning course. Each student subject completed the
"Stevens Point Wellness Assessment" (SPWA) the first day of the quarter and the last
day of the quarter, IO weeks later. The SPWA was a 70-item survey that assessed the
students' current level of wellness. Students were grouped by class for analysis (Lecture
n=l09, goal n=68,jogging n=40, non-impact n=33, general n=l2, and control group n=
18).
Data was compared by ANOVA with post-hoc descriptive analysis. Of the five
instructive methods studied, only the lecture and goal courses significantly improved
wellness scores. To achieve wellness, one must either provide strong content
(knowledge, attitude, and behaviors) or provide content with some ancillary approach
(goals, physical activity). Activity classes, in and of themselves, failed to significantly
improve overall wellness. The researchers concluded that to affect wellness, one must go
beyond being physically active. With the numerous dimensions of wellness one cannot
focus on just one dimension and improve wellness as a whole. Welle and Kittleson found
that in order to achieve optimal wellness, a certain life-long attitude must be instilled, the
focus on one activity for one term was insufficient to develop such attitudes, where as the
health education courses tended to focus on life-long preparation. College students also
had many other topics of concern such as stress, alcohol, and drug use that may be better
addressed in the health courses.

19
This study was slightly biased in the comparison of physical education and health
education since it looked at health in a classroom setting but physical education in a field
setting. The results would have been more valid if the two education areas were assessed
in the same setting. Most research has already shown that to improve wellness, education
must be provided on several topics not just one (Welle and Kittleson, 1994).
The effect of education on the average population was studied by testing the
effect of an American Red Cross educational class on nutrition behavior. The class was
offered to the general public and covered nutritional knowledge, positive beliefs, and
improved dietary behavior. Participants were surveyed at three points in time: prior to
the class (n=1461), immediately following the class (n=1031), and approximately 10
weeks following completion (n=248). A control group who did not complete the class,
completed the first survey (n=212) and second survey (n=133) for comparison. The
questionnaire items each reflected a major knowledge, belief, or behavior objective of the
class (Edwards, Acock, and Johnston, 1985).
Results showed that the course had substantial positive cognitive, belief, and
behavioral effects on the participants. They found no differences among subgroups of
participants such as gender, race, or income. Age played only a small role in the
improvement. For example, all age groups increased in each area with the exception of
the 19 year old or younger group, who did not gain in terms of nutritional beliefs.
Previous education and marital status also affected the level of change. Ten weeks after
the completion of the course, the final survey showed a significant loss of nutritional
knowledge, and a slight loss of positive beliefs, which was not statistically significant.
Healthy behaviors were most significantly improved.

20
The authors concluded that although some knowledge was lost after the course,
the participants still were more knowledgeable than they were prior to the education and
showed improvements over the control group. The improvement of beliefs and behaviors
was most noted after 10 weeks. The authors felt that behavior may become a self
reinforcing behavior. The results of this study show that education can lead to improved
behavior, however, the participants in the study were volunteers and possibly wanted to
change more than individuals with no motivation. While it may be discouraging to find
there was a loss of knowledge over time following the course, it is reassuring that beliefs
and behaviors can withstand time.
Moode and Finkenberg (1994) tested 70 women and 46 men enrolled in a
university wellness course. An Attitude Toward Physical Activity survey was
administered before and after completion of the course. The authors found that both male
and female positive attitudes toward exercise increased after the course. Females chose
health and fitness as the reason for the increase in physical activity after the course while
males chose aesthetic experience. This study shows that education in addition to physical
activity may improve students' exercise attitudes and behaviors.
Current physical activity patterns of college alumni were analyzed by Sparling
and Snow (2002). Physical activity (PA) was assessed with a validated questionnaire
asking about frequency of activity in three PA categories. Vigorous aerobic, moderate
aerobic, and strengthening activities were the three categories covered in a modified
National College Health Risk Behavior Survey. Additional questions addressed previous
PA participation, attitude, and awareness. Recent university alumni (1988-1996), were
contacted by mail and phoned to complete the survey. All alumni had completed at least
21
two semester hours of health and wellness courses as required by the university for the
baccalaureate degree. Also, excellent fitness programs and facilities were available while
the students were in attendance. Of the 1,000 mailed, 367 valid surveys were returned
and used for the study. No differences in responses were found based on year of
graduation, course taken, or gender, so the responses were combined for analyses
(n=367).
Results were organized into four main areas. Reponses in. section one concluded
that only two percent of students earned high school varsity letters; 66% enjoyed
exercise, 28% neither enjoyed nor disliked, and 5.5% disliked exercise; while a high
proportion (79%) felt confident in setting up their own fitness program. Section two
demonstrated that 32% of the subjects engaged in vigorous PA three or more days a
week, six percent participated in moderate intensity PA on 5 days or more, and 21 %
lifted weights or performed calisthenics on 3 or more days a week. Similar responses
were reported for both male and female subjects. Section three compared college activity
to current activity and found, compared to their college years, that 23% felt they were
more active now, 33% were about the same, and 44% were less active at the time of the
survey. Cross analysis of this section showed a significant association between exercise
patterns as college seniors and later as alumni. Those who exercised regularly in college
were more likely to meet recommended levels of PA as alumni. In the final category,
alumni reported their current weights to be 5.0 kg higher than when they were age 21, but
those who engage in sufficient levels of vigorous or moderate PA had a significantly
lower weight gain compared to other alumni.
22
The main findings for Sparling and Snow were the positive relationship between
college and alumni levels of PA, the lack of gender differences in types of PA, and the
significantly less weight gain among regular exercisers. Also, it was interesting that they
found that 79% felt capable of setting up a fitness program but only 34% engaged in
recommended level of PA. The limitations to the study were that the subjects were from
only one university, the possible self-report bias, and that there was a self-selection bias
of alumni interested in wellness.
Neutral Effect of Education
Cardinal (1995) researched the effects of physical educators' behavior and found
that those who were more fit had a more positive effect on their students and were more
successful in their careers. However, very few institutions have regulations or guidelines
on the fitness of their students or their professors in the physical education departments.
In 1995, more research was done to examine the cardiorespiratory fitness and physical
activity behavior of physical education (PE) majors. Cardinal collected data by using a
questionnaire, height and weight measurements, and a submaximal cycling load test to
estimate volume of maximum oxygen consumption (V02 max). Subjects were physical
education majors who had completed at least 12 semester hours in the major. The test
group included 26 females and 40 males from one of three PE tracks (teacher, athletic
training, or exercise science). Cardinal compared predicted V02 max results to norms for
freshman college students, to health-related criterion-reference standards, and to age- and
gender-adjusted normative standards.
23
Results showed no significant difference between PE female subjects and
freshman female college norms. Males in the PE major had a significantly higher V02
max scores than the average freshman male. Both the PE females' and males' mean V02
max were significantly lower than the health-related criterion-reference value. This value
is related to risk for cardiovascular disease (CVD), and only 21 % of PE majors are on
track for low CVD risk at middle age. Results showed men had a higher estimated V02
max than the females, which follows the normative standards. Those subjects in the
exercise science track had significantly higher V02 max values than those in the athletic
training track, which could be due to different requirements for their programs.
This study also found that those who should be educated in the benefits of healthy
behaviors, do not differ from the average college student in tests of cardiorespiratory
fitness level. Limitations of this study included selecting students from only one college,
not testing the actual knowledge level of the students, and using estimated V02 max,
which evaluates only one aspect of physical fitness.
The behavior of knowledgeable students was studied by McWhorter, Wallmann,
and Tandy (2002). Their research looked at the behaviors of graduate level physical
therapy students. The purpose was to determine the effect of a graduate school
curriculum on physical fitness parameters. They found that although physical therapy
(PT) students are taught the principles of fitness for their professional lives, they fail to
implement these into their own lives. Thirty-seven students from three consecutive
classes were tested at the beginning of their academic program and again in the last two
weeks of their final semester. Subjects were tested for body fat, handgrip strength,
isokinetic muscle strength and endurance, and cardiovascular. Results were compared to

the American College of Sport Medicine's (ACSM) recommendations and to Healthy
People 2010.
24
Results showed that male students had significant differences in two of seven
variables from pretest to posttest. Grip strength increased and isokenetic strength
decreased. Women showed changes in three of seven variables. A small but significant
increase was noted in percent body fat and significant increases were observed in two
isokenetic strength tests. Cardiorespiratory endurance was in the fair-to-good range
initially and showed only slight (2%) increase in the posttest. Body composition showed
no significant change in males while females demonstrated an increase of eight percent.
The authors felt that the improvements for females may have been mostly from carrying
backpacks and walking between classes and up and down stairs. Men increased grip
strength by 39% and women gained 12%, which was attributed to hands-on academic
experiences (practicing therapy techniques).
This research shows that although the students should be knowledgeable of
physical fitness behaviors, they do not necessarily portray them in their lifestyle choices.
However, if the students had a high level of fitness prior to school, it would be difficult to
show great improvements. It would be interesting to see if any changes occurred once
they left the college setting. A post-school test could determine if the rigorous school
schedule actually detoured healthy lifestyles.
Another study by Trudeau, Laurencelle, and Tremblay (1999) looked at the long
term effects of physical education. The authors recalled experimental subjects who had
been involved in the Trois-Rivieres longitudinal study on growth and development.
(During six years of primary education, experimental group = 5 hours of PE a week with

25
professional physical educators and control group = one 40 minute a week PE class by
home-room teacher.) The contact produced 149 questionnaires returned (experimental
subjects) which were compared to a matched control group who had not had the extended
education. Results showed no significant difference in self-reported frequency of physical
activity. Preferred physical activity was similar for both groups in selection but varied in
amount of participation. There was no stronger intention to practice in the experimental
group, nor did they have a more positive attitude toward activity. The experimental
subjects did not feel that they had more opportunity for physical activity when compared
to the control group. No significant differences were noted between groups for perceived
support for physical activity from relatives and friends. No significant BMI differences
were found. However, males in the experimental group smoked less than the control.
The authors concluded that daily physical education at the primary school level
did not produce a long-term positive effect on exercise habits. They found that females
who had more physical education were slightly more active than controls, and a higher
percentage of experimental women selected intense forms of physical activity, but neither
was statistically significant. For men, the only positive influence of the primary school
physical education program was a reduced risk of regular cigarette smoking. The
limitations to this study included that the original education did not include information
on intention, benefits, or attitudes toward exercise. The students simply had more
opportunity for physical activity.
26
Summazy
From this review of literature, it has been shown that college age adults exhibit
moderate physical activity and poor nutritional habits. Education may play a role in
improved behavior when it includes sufficient information in many areas of wellness, not
just one activity. The literature was mixed for the behavior of knowledgeable students.
Some had improved behavior compared to the average student while others found no
benefit. It is difficult to determine the relationship among the physical activity and
nutrition knowledge of college age people. It is also challenging to determine the
relationship of that knowledge to actual attitudes and behaviors. Therefore, this study
looked at all these aspects as well as gender.

27
CHAPTER III
METii ODS
It was the purpose of this study to compare college age students' knowledge about
physical activity and nutrition to their actual attitudes and behaviors. Specifically, did
group knowledge scores correlate with attitude scores or with behavior scores, did WM
have a greater knowledge of general wellness information, more positive attitude scores,
or higher behavior scores than OM, and finally were there gender differences in
knowledge, attitude, or behavior scores.
Subjects
Two hundred thirty-one college-aged students were recruited for this study from
Eastern Illinois University, a mid-sized university in East-Central Illinois. Subjects
voluntarily completed the modified Wellness Knowledge, Attitude, and Behavior
Instrument (WKABI). Surveys were considered invalid if several items ( 10 items or
more) were incomplete. Removal of 29 incomplete surveys resulted in 202 total surveys
with 82 males and 120 ferilales from a variety of majors, all of whom were age 19 years
or older. The subjects were compared as a whole and then broken into two groups for
additional analysis. WM (n= 95) was considered the wellness group including students
with majors in physical education, health, and dietetics/nutrition. OM (n=107) were
students from all other majors.

28
Instrument
The instrument used in this study was a modified form of the WKABI originally
developed and tested by Dinger, Watts, and Barnes (1998). The original WKABI
contained 64 items in three scales; knowledge, attitude, and behavior (Appendix A).
Within these three scales were three subscales that included items concerning physical
activity, nutrition education, and stress management. For the purposes of this study, the
stress management items were removed and some additional items were added for
demographic and general information. The revised survey is f01md in Appendix B.
Items in the final survey consisted of six demographic inquiries and 24 knowledge
questions that were multiple choice with one correct answer and 3 incorrect foils. The
scoring for the knowledge questions consisted of one point for a correct answer and zero
points for incorrect responses. Attitude (IO items) and behavior (15 items) were scored on
a five point Likert scale. The scoring scheme for the entire survey is also included in
AppendixB.
Procedures
Faculty who taught nutrition, health, physical education, and senior seminar
courses in the spring and sUJllliler of 2003, were contacted for permission to enter their
classrooms to survey students. Students from three PE classes, three nutrition classes,
four health classes, and four senior seminars were selected. The seminar classes were
considered non-wellness classes. The students were instructed by the researcher to read
the introduction to the study and the instructions carefully and to complete the W ABK.I
questionnaire. They were allowed to ask questions and to use calculators. In the
introduction, the students were informed of the general purpose of the study, who the

researcher and research committee were, and contact information. The students
completed the survey using no. 2 pencils and scantron forms. The scantrons were read
and scored by the Eastern Illinois University testing services.
Data Analysis
29
Statistics (mean± standard deviation) were calculated for average knowledge,
attitude, and behavior scores. Frequency counts were obtained to compare descriptive
characteristic (i.e. age, gender) as well as number of responses to each question.
Comparisons of between group means were performed using 2-tailed independent t-tests.
Pearson Product Moment correlations were used to examine possible relationships
between knowledge, attitude, and behavior scores. An alpha level ofp<.05 was chosen
for significance in this study. Data analysis was performed using SPSS (10.0) software.

30
CHAPTER IV
RESULTS AND DISCUSSION
RESULTS
It was the purpose of this study to compare college age students' knowledge about
physical activity and nutrition to their actual attitudes and behaviors. Specifically, did
group knowledge scores correlate with attitude scores or with behavior scores, did WM
have a greater knowledge of general wellness information, more positive attitude scores,
or higher behavior scores than OM, and finally were there gender differences in
knowledge, attitude, or behavior scores. It was hypothesized that students who scored
higher on the knowledge test would also score higher on the attitude scale and behavior
scale. It was further hypothesized that students in wellness-focused majors (physical
education, health, and nutrition) would not demonstrate healthier lifestyle behaviors than
students in other majors. The third hypothesis stated that gender would not influence
knowledge, attitude, or behavior scores.
Descriptive results included frequency counts for age, gender, class standing,
major, housing, and ethnicity. Means and standard deviations were calculated for
knowledge, attitude, and behavior scores and responses. Differences between group
means were evaluated using an independent t-test. Pearson Product-Moment correlations
were performed to determine if there were significant relationships between knowledge
scores and attitude scores, knowledge scores and behavior scores, and attitude scores and
behavior scores with p< .05.
Descriptive Characteristics of Subjects
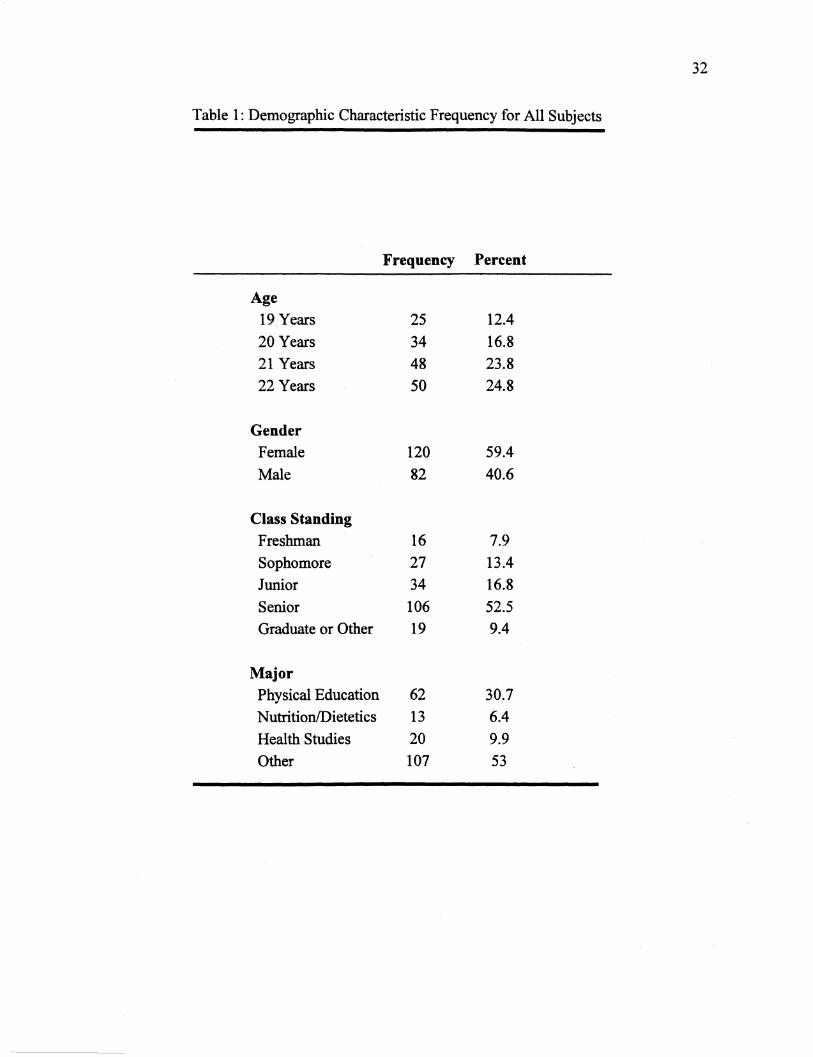
This study utilized a modified version of the WKABI questionnaire. A total of
231 questionnaires were completed with 29 being excluded due to incomplete data. A
total of202 valid surveys were analyzed for this study. Subject demographics for age,
gender, class standing, major, housing, and ethnicity are shown in Table 1.
31
Ninety-five of the 202 subjects (47%) were the WM group, while 107 (53%)
subjects were in the OM group. The WM group consisted of 62 physical education
majors, 13 nutrition majors, and 20 health studies majors. OM represented students with
all other non-wellness majors.
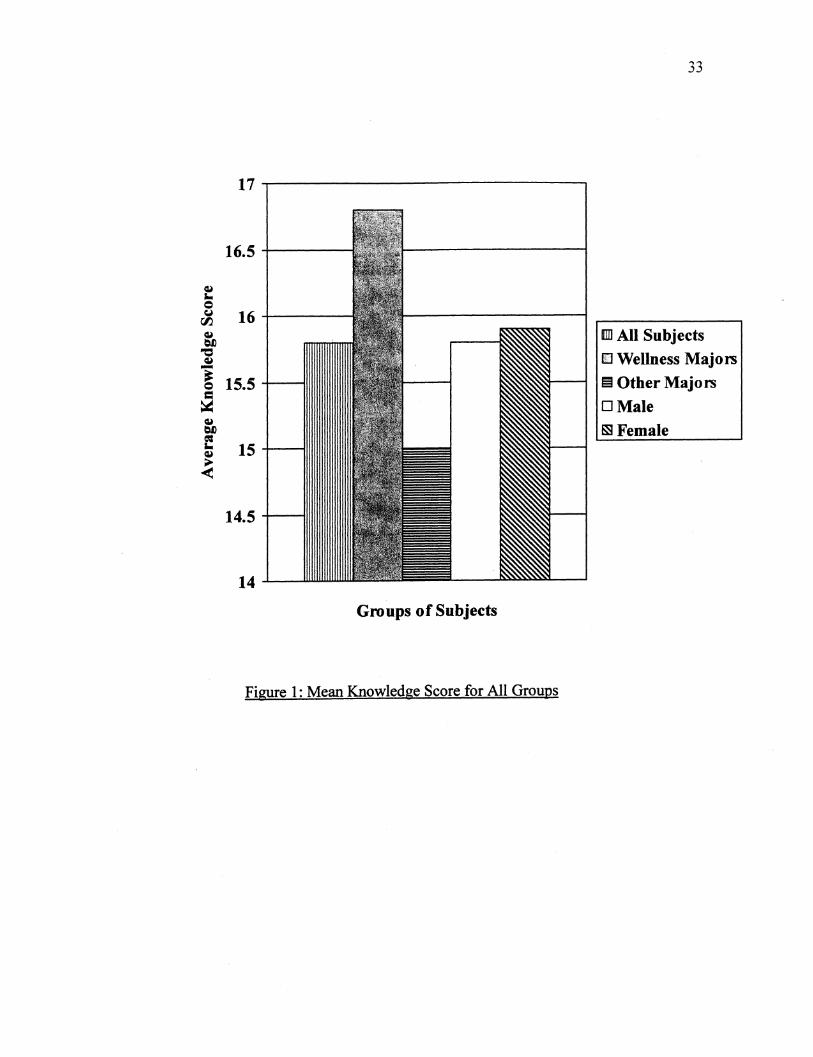
Knowledge Scores
There were a total of 24 knowledge questions. The knowledge responses were
scored 1 point for a correct response and 0 points for any incorrect responses. Possible
test scores ranged from 0 to 24. The lowest score on the knowledge section was three
correct responses and the highest score was 24 correct. The mean score for all subjects
was 15.8 (± 3.34). WM had a mean score of 16.8 (± 3.23) compared to OM having a
mean score of 15.04 (±3.23). WM had a significantly higher mean knowledge score, than
OM, p = .000. There were no significant gender differences in knowledge scores. Male
mean scores of 15.8 (± 3.5) were similar to the females' mean score of 15.92 (± 3.24) p =
.816. A comparison of knowledge score means is shown in Figure 1. The frequency
counts for all responses to knowledge questions are included in Appendix C.
32
Table 1: Demographic Characteristic Frequency for All Subjects
Frequency Percent
Age 19 Years 25 12.4
20 Years 34 16.8
21 Years 48 23.8
22 Years 50 24.8
Gender Female 120 59.4
Male 82 40.6
Class Standing Freshman 16 7.9
Sophomore 27 13.4
Junior 34 16.8
Senior 106 52.5
Graduate or Other 19 9.4
Major Physical Education 62 30.7
Nutrition/Dietetics 13 6.4
Health Studies 20 9.9
Other 107 53
Groups of Subjects
Figure 1: Mean Knowledge Score for All Groups
33
llill All Subjects 0 Wellness Majors
E3 Other Majors
DMale
~Female
34
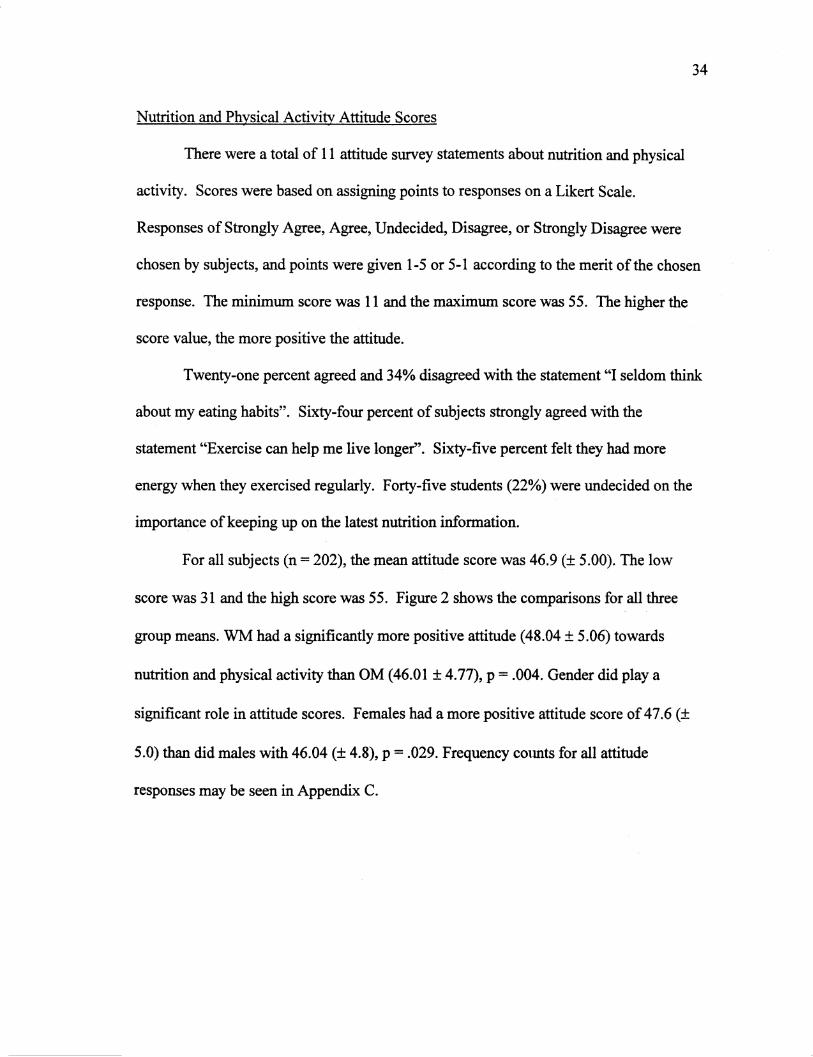
Nutrition and Physical Activity Attitude Scores
There were a total of 11 attitude survey statements about nutrition and physical
activity. Scores were based on assigning points to responses on a Likert Scale.
Responses of Strongly Agree, Agree, Undecided, Disagree, or Strongly Disagree were
chosen by subjects, and points were given 1-5 or 5-1 according to the merit of the chosen
response. The minimum score was 11 and the maximum score was 55. The higher the
score value, the more positive the attitude.
Twenty-one percent agreed and 34% disagreed with the statement "I seldom think
about my eating habits". Sixty-four percent of subjects strongly agreed with the
statement "Exercise can help me live longer". Sixty-five percent felt they had more
energy when they exercised regularly. Forty-five students (22%) were undecided on the
importance of keeping up on the latest nutrition information.
For all subjects (n = 202), the mean attitude score was 46.9 (± 5.00). The low
score was 31 and the high score was 55. Figure 2 shows the comparisons for all three
group means. WM had a significantly more positive attitude (48.04 ± 5.06) towards
nutrition and physical activity than OM ( 46.01 ± 4. 77), p = .004. Gender did play a
significant role in attitude scores. Females had a more positive attitude score of 4 7.6 (±
5.0) than did males with 46.04 (± 4.8), p = .029. Frequency counts for all attitude
responses may be seen in Appendix C.
35
~ 47.5 ... e u
00 IID All Subjects ~
47 "C ii Wellness Majors = ..... .... el Other Majors :;:
< DMale ~ 46.5 ~ e ~Female ~
< 46
Groups of Subjects
Figure 2: Mean Attitude Score for All Groups

36
Nutrition and Physical Activity Behavior Scores
Behavior response scores were also based on a Likert scale point system with
choices of Always, Most of the time, Some of the time, Not very often, or Never, which
were assigned points 1-5 or 5-1 based on the merit of the statement. The minimum score
possible was 14 and the maximum score was 70. The higher the behavior score, the
healthier the behaviors.
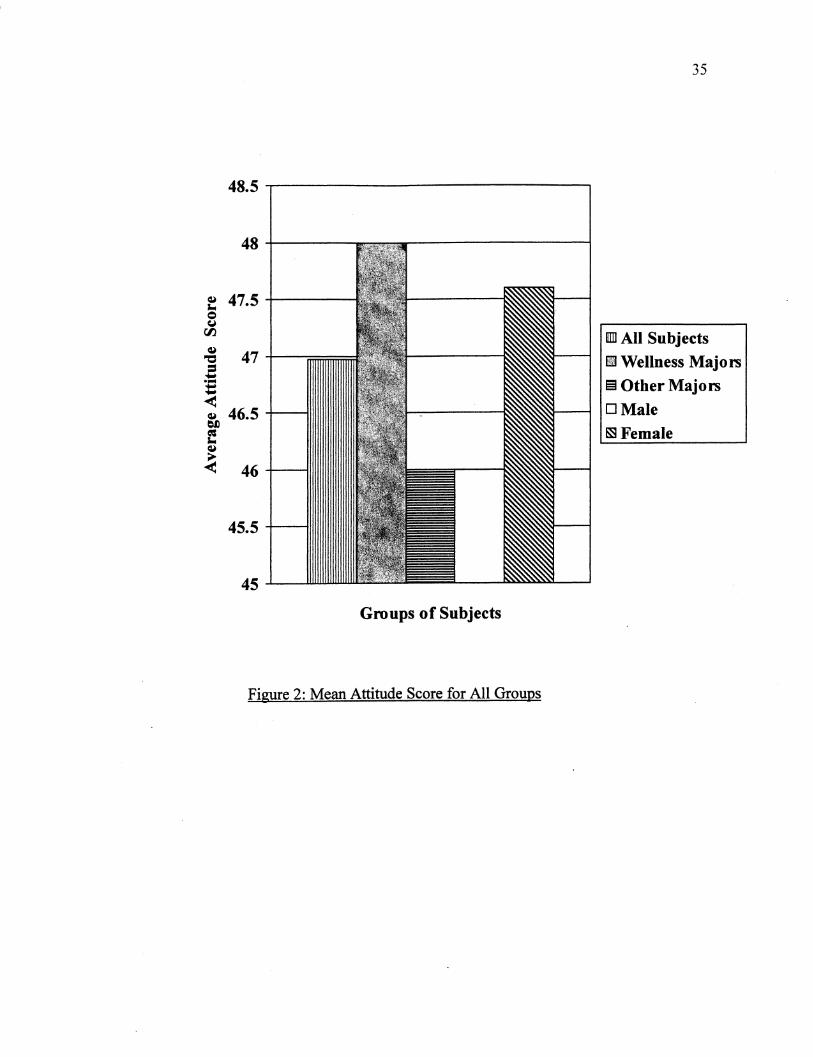
Responses to the statement "I exercise aerobically for at least 20 minutes, 3 times
per week" are shown in Table 2. Thirty-one percent of students sometimes stretch 3
times per week. Twenty-three percent of subjects engage in physical activity most every
day (Table 3), and 35% do so most of the time. Over half(57%) of students choose foods
based on how they taste most of the time. Seventy-eight percent of students always, most
of the time, or sometimes try to minimize their intake of fat. Fifty-six students (28%)
responded that they always or nearly always read nutrition labels. Twenty-six percent
never eat fast food or do not do so very often. Ninety-one percent feel they eat enough
vegetables and 90% eat enough fruit at least some of the time. Eighty-five subjects
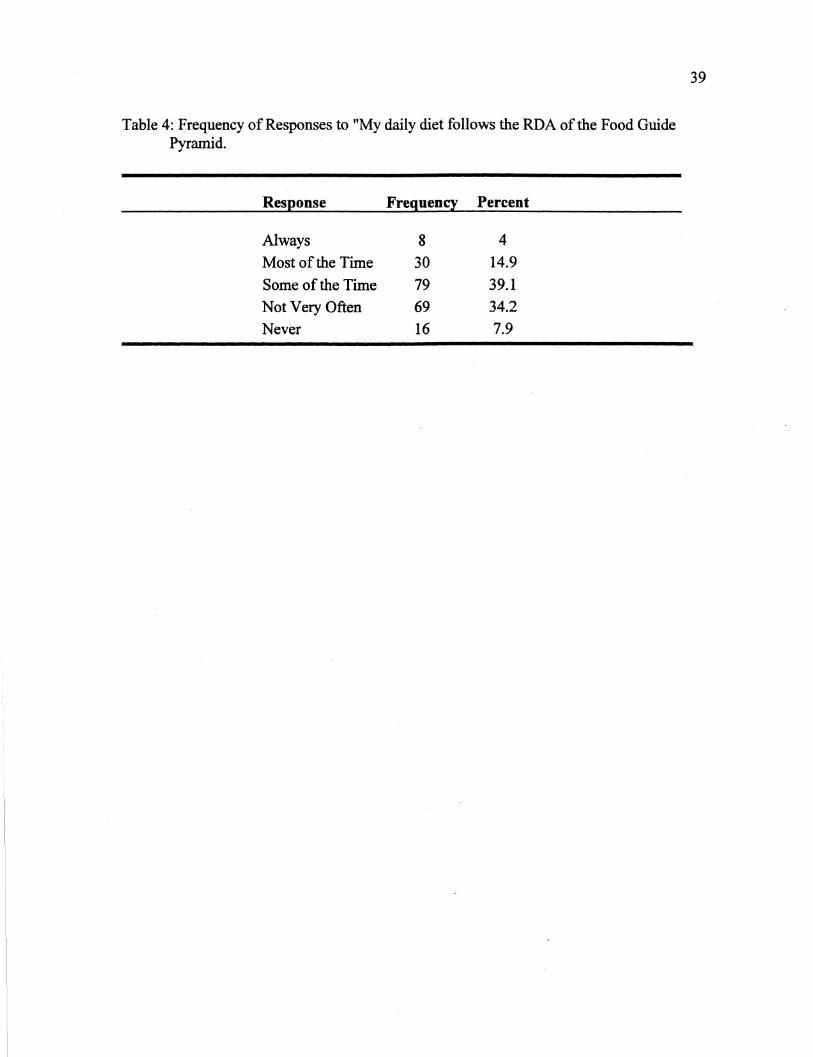
(42%) feel that their diets did not often or never met the RDA (Table 4), for example,
those listed on the food guide pyramid.
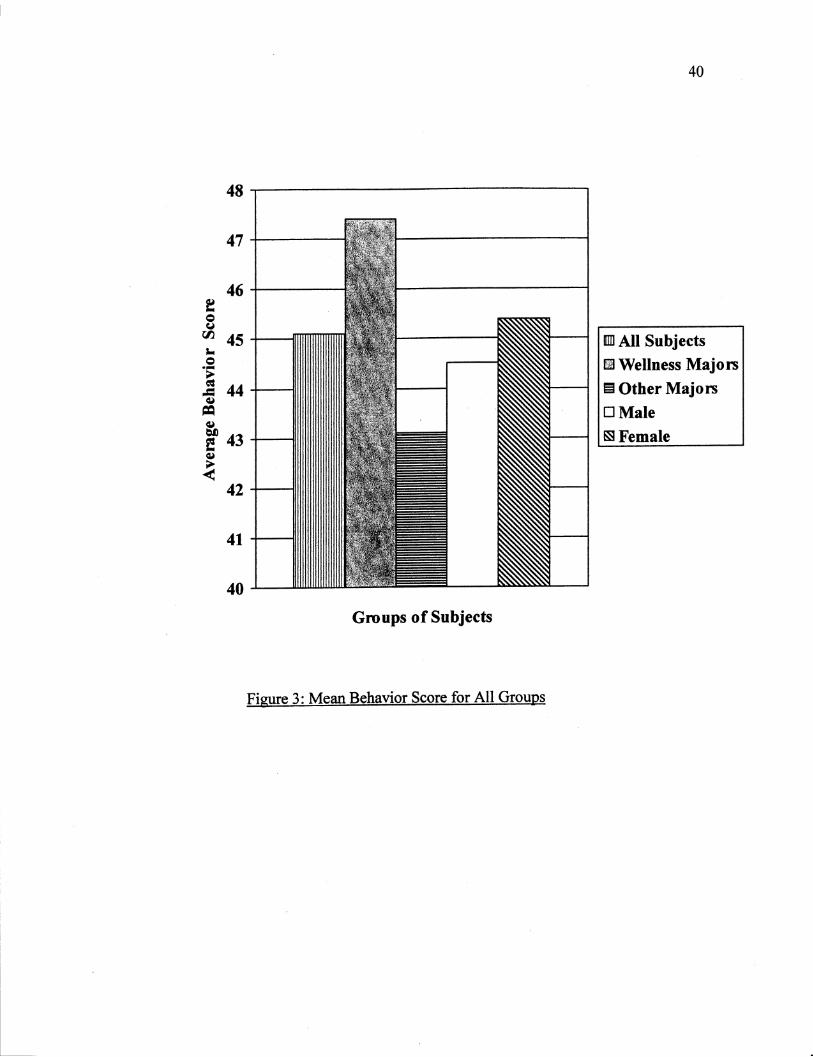
The mean behavior score for all subjects (n = 202) was 45.11(±8.55). The WM
(n = 95) mean score was 47.38 (± 8.23), and the OM (n = 107) mean score was 43.09 (±
8.36) (Figure 3). Contrary to hypothesis two, WM did have a significantly higher
behavior score than OM, p = .000. Gender did not significantly affect behavior scores.
The mean score for females was 45.54 (± 8.76) was similar to the mean score for males
Table 2: Frequency of Responses to "I exercise aerobically for at least 20 minutes, 3 times per week.
Response Frequency Percent
Always 48 23.8
Most of the Time 47 23.3
Some of the Time 52 25.7
Not Very Often 44 21.8
Never 11 5.4
37
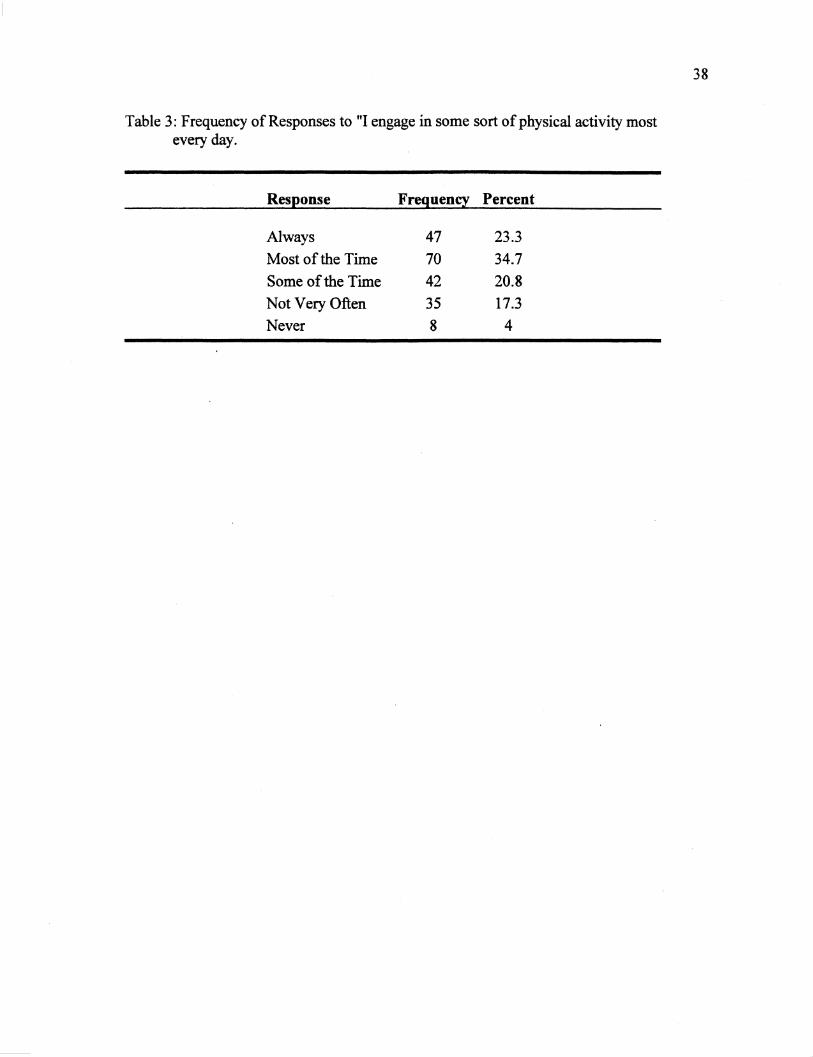
Table 3: Frequency of Responses to "I engage in some sort of physical activity most every day.
Response Frequency Percent
Always 47 23.3
Most of the Time 70 34.7
Some of the Time 42 20.8
Not Very Often 35 17.3
Never 8 4
38
I_
Table 4: Frequency of Responses to "My daily diet follows the RDA of the Food Guide Pyramid.
Response Frequency Percent
Always 8 4 Most of the Time 30 14.9 Some of the Time 79 39.1 Not Very Often 69 34.2
Never 16 7.9
39
48
47
46 f Q u
rJ'J. 45 a.. Q ... ;;;.. ~ 44 ,.c:; ~ = ~ e 43 ~
< 42
41
40
Groups of Subjects
Figure 3: Mean Behavior Score for All Groups
40
llil All Subjects fl Wellness Majors E!1 Other Majors DMale ~Female
41
of 44.48 (±8.26) p =.386. Response frequencies for all 14 behavior items are included in
Appendix C.
Relationships Among Knowledge and Attitude and Behavior
Knowledge scores were significantly correlated (r = .44, p <.01) with attitude
scores and were also significantly correlated (r = .36, p <.01) with behavior score. Total
attitude scores were significantly (r = .46, p<.01) correlated with behavior scores. The
results indicate a positive relationship in all three comparisons.
DISCUSSION
It was the purpose of this study to compare college age student's knowledge about
wellness with their actual physical activity and nutrition attitudes and behaviors. WM had
a greater knowledge of general wellness information, more positive nutrition and physical
activity attitude scores, and higher behavior scores than did OM. Also, a low but
significant correlation was found among all three scores, knowledge, attitude, and
behavior. Finally, gender did not affect knowledge or behavior scores, but had a minor
effect on attitude scores.
Descriptive Characteristics
Over half ( 59%) of the subjects were seniors, which gave a good representation of
college level education and college age attitudes and behaviors. The majority of the
students (67%) lived on their own in off-campus housing, leaving them in charge of their
nutrition and physical activity decisions. WM (n = 95) and OM (n = 107) were well
balanced, with little difference between groups other than major.
42
Knowledge Score Results
The mean score for all subjects was 15.8, with the WM scoring an average of one
point higher with 16.8 and OM scoring an average of .8 lower with an average of 15.
The two scores were significantly different but only two questions separated groups. The
results for the more knowledgeable group (WM) was lower than expected. An average
score of70% (16.8 out of24) correct on a general nutrition and physical activity
knowledge test is not acceptable. This could be due to the different curriculum content
specific to each particular major (PE, Health, and Dietetics). They are not in the same
department and therefore the contents are not correlated. Perhaps each major learns more
about nutrition or physical activity but not both. Health majors would be most likely to
cover both topics but they only accounted for 10% of the subjects. The average score for
OM was 63% (15 out of24) correct. This could be due to an increase in general
education and promotion of nutrition and physical activity information available outside
of the classroom and a greater interest by the population, but is still a poor score. Gender
did not affect knowledge scores.
Nutrition and Physical Activity Attitude Scores
There was an average of two points difference between mean group scores for
attitude towards nutrition and physical activity, WM ( 48) and OM ( 46). This significant
difference is expected due to the education provided to the WM of the benefits of good
diet and regular exercise. The attitudes expressed by the more knowledgeable person
would be more positive than that of a less knowledgeable person. Gender did make a
small but significant difference in attitude scores. Females (n = 120) had a slightly higher
L
43
average score (1.6 points higher) than males (n = 82). This could be due to the higher
number of females participating in this study, or to the willingness of females to use both
diet and exercise for weight control.
Nutrition and Physical Activity Behavior Scores
The finding that at least 90% of students felt that they eat enough fruits and
vegetables, but 42% felt their diets did not meet RDA of the Food Guide Pyramid was
conflicting responses of students. Perhaps the students are not familiar with the Food
Guide Pyramid's recommendations or they 3:fe over-estimating-their consumption of
fruits and vegetables. They may be taking into account other categories of RD As. A
positive result was that WM scored an average of four points higher on nutrition and
physical activity behaviors than did OM. This is supportive of education promoting
behavior changes. This did not support hypothesis two. The author based this hypothesis
on past research (Cardinal, 1995, McWhorter et al., 2002, and Trudeau et al., 1999) )that
found that the knowledgeable people did not differ from the behavior of similar, less
knowledgeable people. The results of the present study showed that education does
indeed influence behavior choices. The students are using what they have learned in their
lifestyle choices. Gender did not significantly affect behavior scores. Possibly female
students are becoming more comfortable with using facilities. Also, physical activity was
measured generally. Gender may make a difference in type or motivation of activity.
However, since this comparison was made among all students, the effect of knowledge
cannot be determined.

44
Relationships between Knowledge and Attitude and Behavior
The low but significant correlation was found between knowledge and behavior
and attitude, was supportive of hypothesis one. If a student knew more about nutrition
and physical activity, they scored higher on the attitude and behavior surveys. This also
supports the effect of education on attitudes and behaviors. The education of the students
positively affected the attitudes and behaviors of those students. However, results could
be skewed by self-reports, with students overestimating positive attitudes and behaviors.
Gender
Hypothesis three was mostly supported by the results of this study. Gender did
not affect knowledge or behavior scores and only slightly affected attitude scores. The
attitude score could have been affected by motivation behind diet and exercise. Women
are becoming more comfortable in the fitness setting and are taking advantage of
education and facilities available.
Comparison to Previous Research Literature
Exercise and Nutrition
In comparison to recent literature, the findings of the present study were similar to
those of others. Lowery et al. (2002) used a questionnaire to examine activity
participation, and found that 3 7% of college students participated in vigorous physical
activity three or more days a week, where 25 % of the subjects in this study were above
average and 10 % were extremely active for a total of35%. That also exceeds findings by
Corbin et al. (1987) where only 23% were highly active. The 4 7% of subjects who
45
usually or always exercise at least 3 times a week exceeds the 33% found by Anding,
Suminski, and Boss (2001). Twenty-three percent of the subjects engage in physical
activity most every day, meeting the Surgeon General's guidelines. This exceeds the
findings of Lowery et al., but falls short of those of Haberman and Luffey (1998).
Birkimer et al. (1992) found that 60% reported more than 2 mild exercise sessions per
week, and the present study exceeded that result, finding that 72% sometimes exercise at
least 3 times a week. The mean score of 45.11(±8.55) (out of a possible 70, 64%) for
all subjects concurs with most studies that college students fall short on healthy behaviors
(Anding et al., Lowery et al., and Haberman and Luffey).
Nutrition results were also comparable to other studies. Marietta et al. (1999)
found that most students tend to focus on one aspect of the nutrition label, where 78% of
the students in the present study at least sometimes try to minimize fat intake. The results
fell short of Marietta's data that 43% regularly used the nutrition label for their daily diet,
having only 28% of subjects in this study. Interestingly, 91 % and 90% feel they eat
enough vegetables and fruit, respectively, which is similar to Lowery et al. and contrary
to Anding et al. However, 42% still feel their diet falls short of RDA, which agrees with
the most previous findings.
Effects of Education
The results in this study were affected by education. The WM produced a higher
score in all three areas. Similar results were found by Kater, Rohwer, and Londre (2002),
Welle and Kittleson (1994), Edwards, Acock, and Johnston (1985), Moode and
Finkenberg (1994), and also Sparling and Snow (2002), in that those educated and
46
experienced with healthy behaviors had a more positive attitude and/or behavior. The
statistical correlation study also found a direct relationship between all three scores,
which also supports the findings that education positively affects attitude and behavior.
This direct correlation supports hypothesis one of this study that higher knowledge scores
will result in higher behavior scores. The results of the WM knowing more, and
engaging in more positive behaviors did not support the second hypothesis for this study.
This also contradicted the findings of Cardinal (1995) who found that those educated did
not differ from the average college student, as did Trudeau and others (1999).
Gender
This study found no difference for gender in knowledge or behavior scores. These
results are comparable to Birkimer et al. and Huddleston et al. There was a slight
difference in attitude scores with females having a 1.56 higher mean score. This could be
due to a greater number of females participating in this study or to the tendency for
females to focus on looks and weight and the eagerness of males to weight train and
participate in competitive leisure activities (Grubbs & Carter, 2002 and Huddleston et al.,
2002).

47
CHAPTERV
SUMMARY AND CONCLUSIONS
Summary
The purpose of this study was to compare college age students' knowledge about
wellness to their actual nutrition and physical activity attitudes and behaviors. The
present study surveyed the knowledge of college age students at Eastern Illinois
University regarding their physical activity, attitudes, and nutritional behaviors.
Specifically, the author looked at 1) group knowledge scores relationship to attitude
scores or to behavior scores, 2) if WM had a greater knowledge of general wellness
information, more positive attitude scores, or higher behavior scores than OM, and 3) if
gender affected knowledge, attitude, or behavior scores.
Subgroup comparisons by major and gender were conducted. Students with
wellness knowledge scored significantly higher on all three aspects of the study. Gender
did not affect knowledge or behavior score, and caused a small difference in attitude
scores with females attaining a slightly higher score. Specifically; it was hypothesized
that students who score higher on the knowledge test would score higher on the behavior
scale. This was supported with the positive correlation found between knowledge and
behavior. It was further found that knowledge was also related to attitude, as was attitude
related to behavior. It was further hypothesized that students in physical education,
health, and nutrition would not demonstrate healthier lifestyle behaviors than other
college students. The findings of this study did not support this hypothesis. The WM, as

expected, scored higher on the knowledge test than OM. They also had more positive
attitude scores as well as higher behavior scores. These results reinforce the positive
effects of education on attitude and lifestyle behavior.
Conclusions
The following conclusions were drawn from the findings of this study:
1. Wellness knowledge is positively related to physical activity and nutrition
attitudes and behaviors, but the wellness knowledge of college students is low.
2. Wellness education has a positive effect on physical activity and nutrition
attitudes and behaviors.
3. Gender had no effect on knowledge or behaviors and little effect on attitudes.
Recommendations
48
This study could be enhanced by more carefully studying the responses of
students by major. Being limited to responses of all students together made it difficult to
find the effects of knowledge and education on attitudes and behaviors. Also, significant
differences could be possibly found if gender results were divided into majors. Another
subject to be inquired about would include the topics covered in each wellness major
program to uncover the differences in education. Gathering more data from students from
different universities would also create a better representation of college age students. It
would be effective to also test these students again as alumni to see if any changes occur.

49
REFERENCES
Anding, J ., Suminski, R., & Boss, L. (200 I). Dietary intake, body mass index, exercise and
alcohol: are college women following the dietary guidelines for Americans?. Journal of
American College Health. 49 (4), 167-71.
Birkimer, J., Johnston, P., & Berry, M. (1992). Guilt and Help from Friends: Variables Related
to Healthy Behavior. The Journal of Social Psvchology, 133 (5), 683-692.
Cardinal, B. (1995). Cardiorespiratory Fitness and Physical Activity Behavior of Physical
Education Majors. Physical Educator, 52 (4) 211-19.
Corbin, C., Nielsen, A., Borsdorf, L., & Laurie, D. (1987). Commitment to PhysicalActivity.
International Journal of Sport Psychology. 18. 215-22.
Dinger, M., Watts, P., & Barnes, J. (1998). Development of the wellness knowledge, attitude,
and behavior instrument. Measurement in Physical Education and Exercise Science, 2
(2), 69-83.
Edwards, P ., Acock, A., & Johnston, R. (1985). Nutrition Behavior Change; Outcomes of an
Educational Approach. Evaluation Review. 9 (4), 441-59.
Grubbs, L. & Carter, J. (2002). The relationship of perceived benefits and barriers to reported
exercise behaviors in college undergraduates. Family and Community Health, 25 (2),
76;.9,
Haberman, S. & Lu:ffey, D. (1998). Weighing in College Students' Diet and Exercise
Behaviors. Journal of American College Health. 46 (4), 189-91.

Huddleston, S., Mertesdorf, J., & Araki, K. (2002). Physical Activity Behavior and Attitudes
toward Involvement among Physical Education, Health, and Leisure Services Pre
professionals. College Student Journal, 36 ( 4), 555-72.
Jackson, A., Morrow, J., Hill, D., & Dishman, R. (1999). Physical Activity for Health and
Fitness. Illinois: Human Kinetics.
50
Kater, K., Rohwer, J., & Londre, K. (2002). Evaluation of an upper elementary school program
to prevent body image, eating, and weight concerns. Journal of School Health, 72 (5),
199-204.
Kennedy, E. & Offutt, S. (2000). Healthy lifestyles for healthy Americans: report on USDA's
year 2000 behavioral nutrition roundtable. Nutrition Today, 35 (3), 84-8.
Levy, A. & Heaton, A. (1993). Weight control practices of US adults trying to lose weight.
Annual Internal Medicine, 119, 661-6.
Lowry, R., Galuska, D., Fulton, J., Wechsler, H., Kann, L., & Collins, J. (2000). Physical
Activity, Food Choice, and Weight Management Goals and Practices Among U.S.
College Students. American Journal of Preventive Medicine, 18 (1), 18-27.
Marietta, A., Welshimer, K., & Anderson, S. (1999). Knowledge, attitudes, and behaviors of
college students regarding the 1990 Nutrition Labeling Education Act food labels.
American Dietetic Association. 99 (4), 445-49.
McArthur, L. & Howard, A. (2001). Dietetics majors' weight-reduction beliefs, behaviors, and
information sources. Journal of American College Health, 49 (4), 175-81.
McWhorter, J., Wallmann, H., & Tandy, R. (2002). An Evaluation of Physical Fitness
Parameters for Graduate Students. Journal of American College Health, 51 (1), 32-7.
Moode, F. & Fink:enberg, M. (1994). Participation in a wellness course and attitude toward
physical education. Perceptual and Motor Skills. 79, 767-70.
51
Noring, S. (2000). Promoting Healthy Behavior: How Much Freedom? Whose Responsibility?
American Journal of Public Health, 90 (8), 1320-1321.
O'Dea, J. & Abraham, S. (2001). Knowledge, beliefs, attitudes, and behaviors related to weight
control, eating disorders, and body image in Australian trainee home economics and
physical education majors. Journal of Nutrition Education, 33 (6), 332-40.
Patterson, R., Haines, P., & Popkin, B. (1994). Health lifestyle patterns of US adults.
Preventive Medicine, 23, 453-60.
Sedula, M., Coates, R. Byers, T., Simoes,E., Mokdad, A., &Suhar, A. (1995). Fruit and
vegetable intake among adults in 16 states: results of a brief telephone survey.
American Journal of Public Health, 85, 236-9.
Sparling, P. & Snow, T. (2002). Physical activity patterns in recent college alumni. Research
Quarterly for Exercise & Sport, 73 (2), 200-05.
Surgeon General (2002). www.surgeongeneral.gov/topic/obesity (2002, October, 25).
Trudeau, F., Laurencelle, L., & Tremblay, J. (1999). Daily primary school physical education:
effects on physical activity during adult life. Medicine and Science in Sports and
Exercise. 31(1),111-17.
L
US Department of Health and Hwnan Services. Physical activity and health: a report of the
surgeon general. Atlanta FA: US Dept of Health and Hwnan Services, Centers of
Disease Control and Prevention, National Center for Chronic Disease Prevention and
Health Promotion, 1996.
Wilmore, J. & Costill, D. (1999). Physiology of Sport and Exercise (2nd ed.). illinois: Hwnan
Kinetics.
52
Welle, H. & Kittleson, M. (1994) Impact of College Health Education and Physical Education
Courses on Personal Wellness. Wellness Perspectives. 10 (3), 3-14.
53
APPENDIX A
ORIGINAL
WELLNESS KNOWLEDGE, ATTITUDE, AND BEHAVIOR INSTRUMENT
MARY K. DINGER, 1994
L_ -
THE WELLNESS KNOWLEDGE, ATTITUDE, AND BEHAVIOR INSTRUMENT
©1994
Mary K. Dinger
All Rights Reserved
54
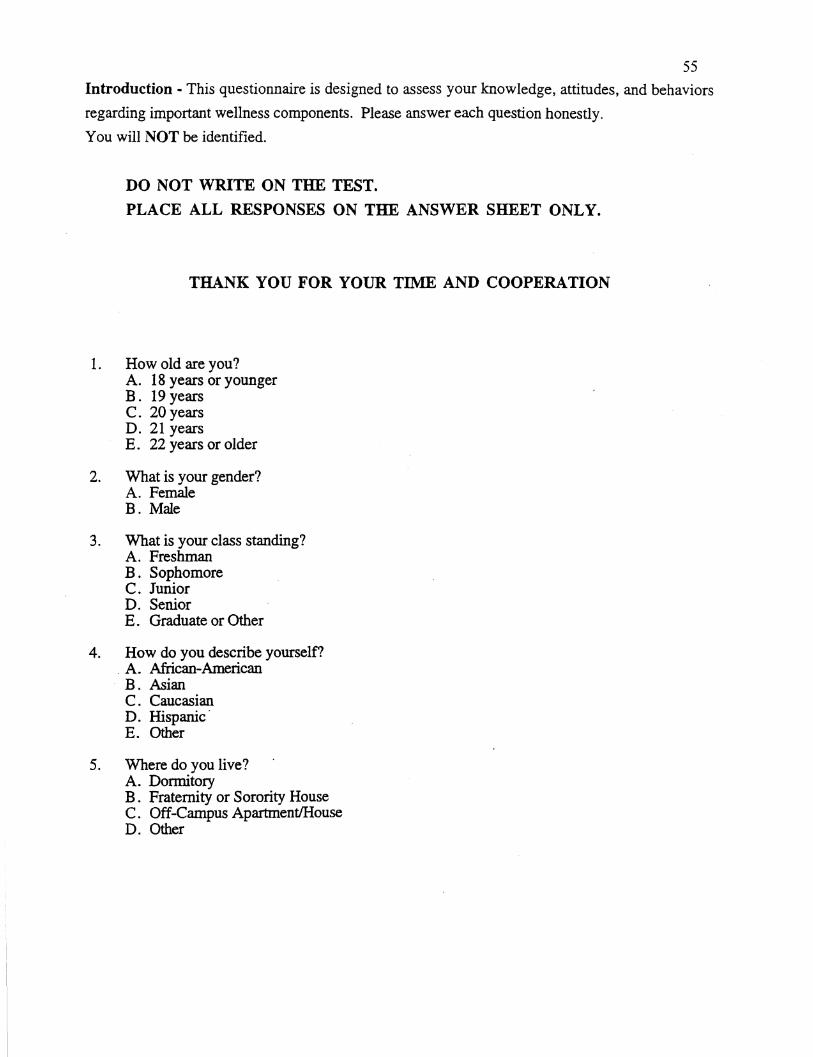
I_
55 Introduction - This questionnaire is designed to assess your knowledge, attitudes, and behaviors
regarding important wellness components. Please answer each question honestly.
You will NOT be identified.
DO NOT WRITE ON THE TEST.
PLACE ALL RESPONSES ON THE ANSWER SHEET ONLY.
THANK YOU FOR YOUR TIME AND COOPERATION
1. How old are you? A. 18 years or younger B. 19 years C. 20 years D. 21 years E. 22 years or older
2. What is your gender? A. Female B. Male
3. What is your class standing? A. Freshman B . Sophomore C. Junior D. Senior E. Graduate or Other
4. How do you describe yourself? . A. African-American B. Asian C. Caucasian D. Hispanic· E. Other
5. Where do you live? A. Dormitory B. Fraternity or Sorority House C. Off-Campus Apartment/House D. Other

56 Part I - Read each statement or question carefully. Select the BEST response and fill in the corresponding circle on your answer sheet.
6. When lifting weights for general physical fitness it is best to: A. lift as much weight as possible. B . hold your breath during the lifting phase. C. emphasize the lifting phase rather than the lowering phase. D. move the joint through it's entire range of motion.
7. An individual who desires to improve flexibility should: A. stretch to the point of pain and hold the stretch. B . use bouncing movements throughout the stretch. C. attempt to hold stretches for 10-30 seconds. D. quickly stretch to the point of pain and then relax.
8. Which of the following is an example of anaerobic activity? A. Jogging B. Tennis C. Lap Swimming D. Cross-country skiing
9. What is the recommended minimum number of days per week to exercise in order to improve or maintain cardiorespiratory fitness? A. 2 B. 3 c. 4 D. 5
10. What advantage does dieting and moderate exercise have over dieting alone with regards to weight loss? A. Exercise causes fat to change into muscle. B . Exercise causes additional muscle fiber formation. C. Exercise is an easier method of weight loss. D. Exercise maintains muscle tissue.
11. Aerobic exercise conditioning has been shown to increase: A. high density lipoprotein cholesterol (HDL). B. low density lipoprotein cholesterol (LDL). C. very low density lipoprotein cholesterol (VLDL). D. none of the above types of cholesterol.
12. Wendy, a 20 year old female, wants to begin an exercise program. Calculate her target heart rate using 60% and 75% of maximum heart rate. What is Wendy's target heart rate? A. 110 - 140 beats/minute B. 120 - 150 beats/minute C. 132 - 165 beats/minute D. 140 - 160 beats/minute
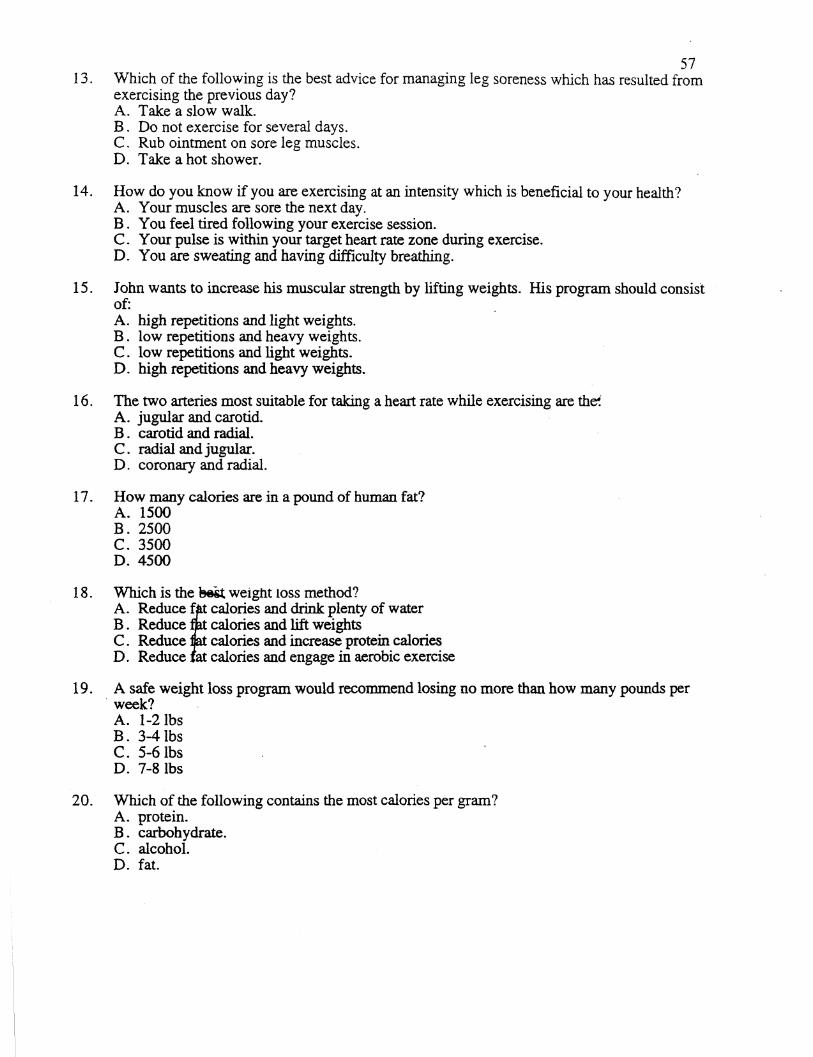
I
L---
57 13. Which of the following is the best advice for managing leg soreness which has resulted from
exercising the previous day? A. Take a slow walk. B. Do not exercise for several days. C. Rub ointment on sore leg muscles. D. Take a hot shower.
14. How do you know if you are exercising at an intensity which is beneficial to your health? A. Your muscles are sore the next day. B . You feel tired following your exercise session. C. Your pulse is within your target heart rate zone during exercise. D. You are sweating and having difficulty breathing.
15. John wants to increase his muscular strength by lifting weights. His program should consist of: A. high repetitions and light weights. B. low repetitions and heavy weights. C . low repetitions and light weights. D. high repetitions and heavy weights.
16. The two arteries most suitable for taking a heart rate while exercising are th~ A. jugular and carotid. B . carotid and radial. C. radial and jugular. D. coronary and radial.
17. How many calories are in a pound of human fat? A. 1500 B. 2500 c. 3500 D. 4500
18. Which is the~ weight loss method? A. Reduce ~t calories and drink plenty of water B . Reduce calories and lift weights C. Reduce calories and increase protein calories D. Reduce at calories and engage in aerobic exercise
19. A safe weight loss program would recommend losing no more than how many pounds per week? A. 1-2 lbs B. 3-4 lbs C. 5-6 lbs D. 7-8 lbs
20. Which of the following contains the most calories per gram? A. protein. B. carbohydrate. C. alcohol. D. fat.
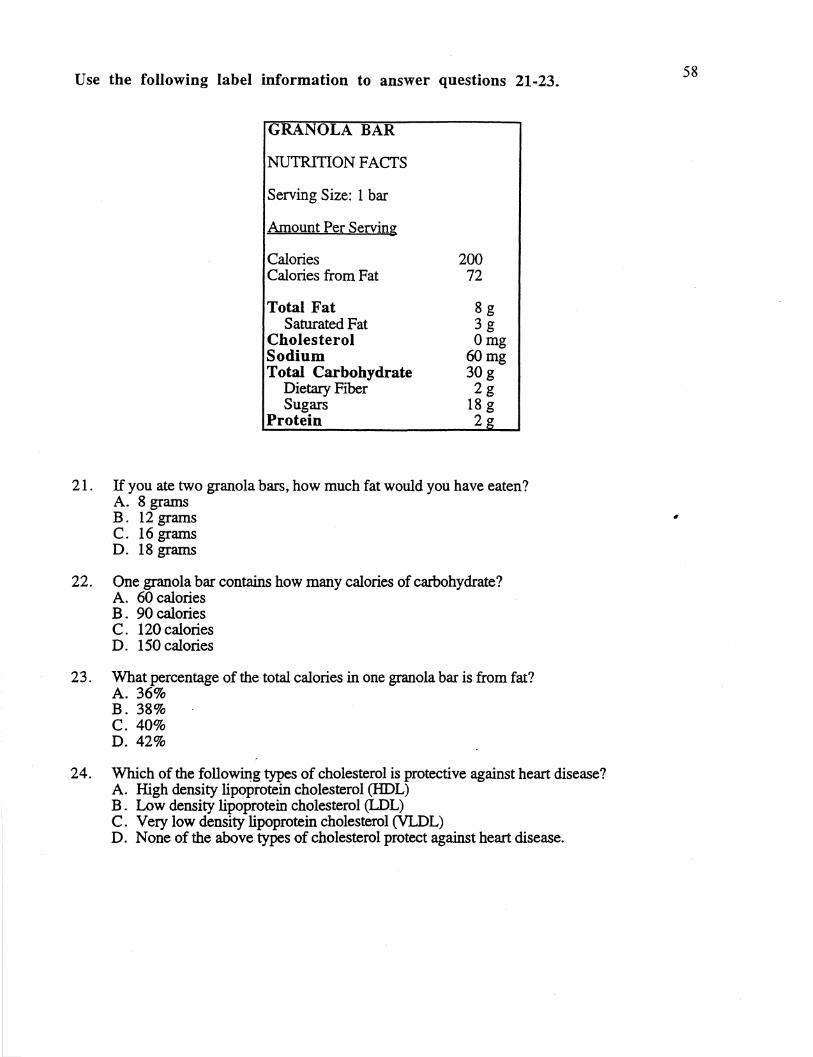
Use the following label information to answer questions 21-23.
GRANOLA BAR
NUTRITION FACTS
Serving Size: I bar
Amount Per Serving
Calories Calories from Fat
Total Fat Saturated Fat
Cholesterol Sodium Total Carbohydrate
Dietary Fiber Sugars
Protein
200 72
8g 3g Omg
60mg 30g 2g
18 g 2g
21. If you ate two granola bars, how much fat would you have eaten? A. 8 grams B. 12 grams C. 16 grams D. 18 grams
22. One granola bar contains how many calories of carbohydrate? A. 60 calories B . 90 calories C. 120 calories D. 150 calories
23. What percentage of the total calories in one granola bar is from fat? A. 36% B. 38% c. 40% D. 42%
24. Which of the following types of cholesterol is protective against heart disease? A. High density lipoprotein cholesterol (HDL) B. Low density lipoprotein cholesterol (LDL) C. Very low density lipoprotein cholesterol (VLDL) D. None of the above types of cholesterol protect against heart disease.
58
"
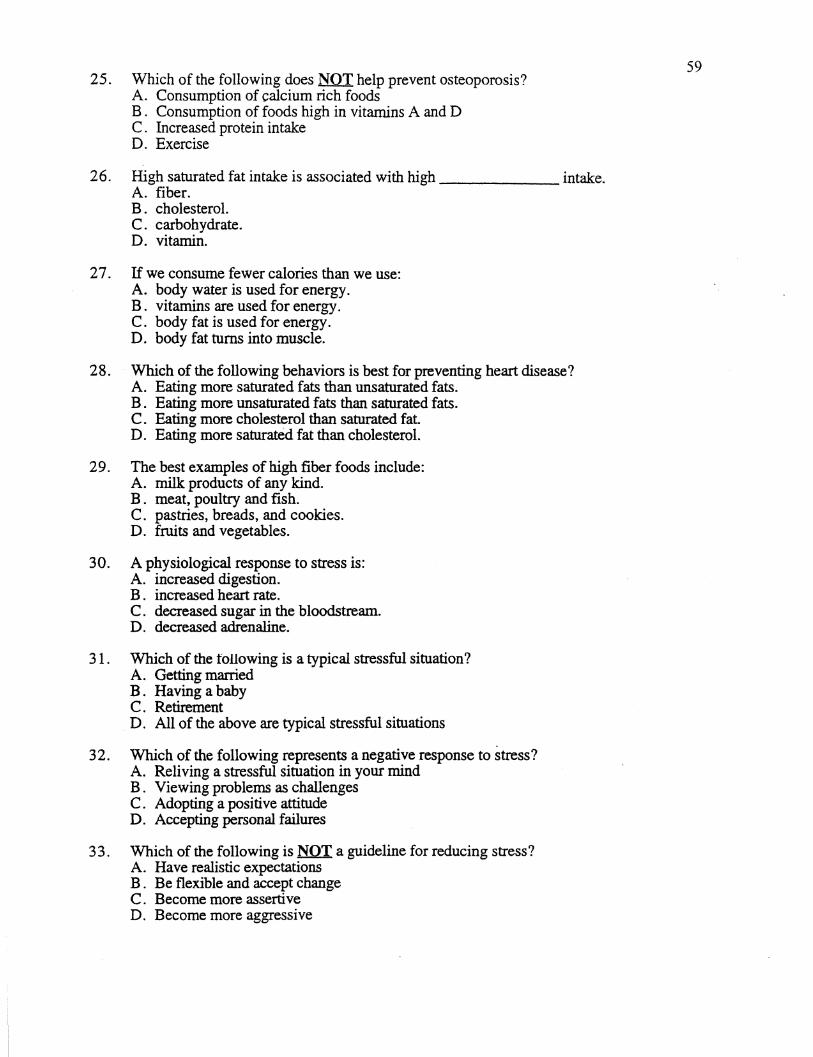
25. Which of the following does NOT help prevent osteoporosis? A. Consumption of calcium rich foods B . Consumption of foods high in vitamins A and D C. Increased protein intake D. Exercise
26. High saturated fat intake is associated with high------- intake. A. fiber. B . cholesterol. C. carbohydrate. D. vitamin.
27. If we consume fewer calories than we use: A. body water is used for energy. B . vitamins are used for energy. C. body fat is used for energy. D. body fat turns into muscle.
2 8. Which of the following behaviors is best for preventing heart disease? A. Eating more saturated fats than unsaturated fats. B . Eating more unsaturated fats than saturated fats. C. Eating more cholesterol than saturated fat. D. Eating more saturated fat than cholesterol.
29. The best examples of high fiber foods include: A. milk products of any kind. B . meat, poultry and fish. C. pastries, breads, and cookies. D. fruits and vegetables.
30. A physiological response to stress is: A. increased digestion. B . increased heart rate. C. decreased sugar in the bloodstream. D. decreased adrenaline.
3 1. Which of the following is a typical stressful situation? A. Getting married B. Having a baby C. Retirement D. All of the above are typical stressful situations
3 2. Which of the following represents a negative response to stress? A. Reliving a stressful situation in your mind B . Viewing problems as challenges C. Adopting a positive attitude D. Accepting personal failures
3 3. Which of the following is NQ'.I a guideline for reducing stress? A. Have realistic expectations B . Be flexible and accept change C. Become more assertive D. Become more aggressive
59
34. Which of the following can be defined as "the body's non-specific response to any dem~~ placed on it?" A. Stress B. Stressor C. Muscle tension D. Adrenaline release
35. Which of the following is NOT a benefit of stress management? A. Decreased muscular tension B . Increased levels of physical energy C. Decreased attention span D. Decreased resting heart rate
36. Worrying about things that are out of our control and letting anxiety interfere with our performance are examples of: A. neustress. B. distress. C. eustress. D. stress.
3 7. Which of the following is NOT a result of chronic stress? A. Decreased blood platelet formation B. Weakening of the immune system C. Increased blood pressure D. Increased risk for cardiovascular disease
38. Which of the following stress management techniques involves tightening muscle groups and releasing them upon command? A. Meditation B. Visual imagery C. Biofeedback D. Progressive relaxation
L
. 61 Part II - Read each statement carefully. Select the response that best describes the way you FEEL about the statement. Fill in the corresponding circle on your answer sheet, using the choices stated below:
A - Strongly Agree B - Agree c - Undecided D - Disagree E - Stron I Disa ree
3 9. Exercise can help me control my weight.
40. Regular exercise can help Ihe stay healthy.
41. · I feel better about myself when I exercise.
42. Exercise can help me live longer.
43. I have more energy when I exercise on a regular basis.
44. I seldom think about my eating habits.
45. The information on a nutrition label is important.
46. As long as my weight remains constant, I do NOT need to worry about my diet.
4 7. It is important for me to keep up with the latest nutrition information.
48. I do NOI need to be concerned about my diet if I supplement it with vitamins.
49. When under pressure one should try to remain calm.
50. A person should make time to relax every day.
51. Exercise can help me reduce my stress level.
52. Relaxation exercises are a waste of time.

62 Part III - Read each statement carefully. Select the response that best describes your BEHAVIOR relative to the statement. Fill in the corresponding circle on your answer sheet, using the choices stated below:
A =Always B = Most of the Time c = Some of the Time D =Not Very Often E =Never
53. I exercise aerobically for at least 20 minutes, three times per week.
54. I do some form of stretching exercises at least three times per week.
5 5. I engage in some sort of physical activity every weekend.
56. I engage in some sort of physical activity every day.
57. I engage in exercises to enhance my muscular strength and/or endurance (for example, weight lifting or calisthenics) at least two times per week.
5 8. I choose foods based on how they may affect my future health.
59. I choose foods based on how they taste.
60. I minimize my intake of fats.
61. I read the nutritional labels of the foods I eat.
62. I eat fast foods.
63. I eat vegetables.
64. I eat fruit.
65. I make time to relax daily.
66. I skip meals in order to complete my work or other responsibilities.
67. Whenever possible I try to do two things at once, such as eating and driving,
68. I cram for exams.
69. I procrastinate. ---------------------------------------
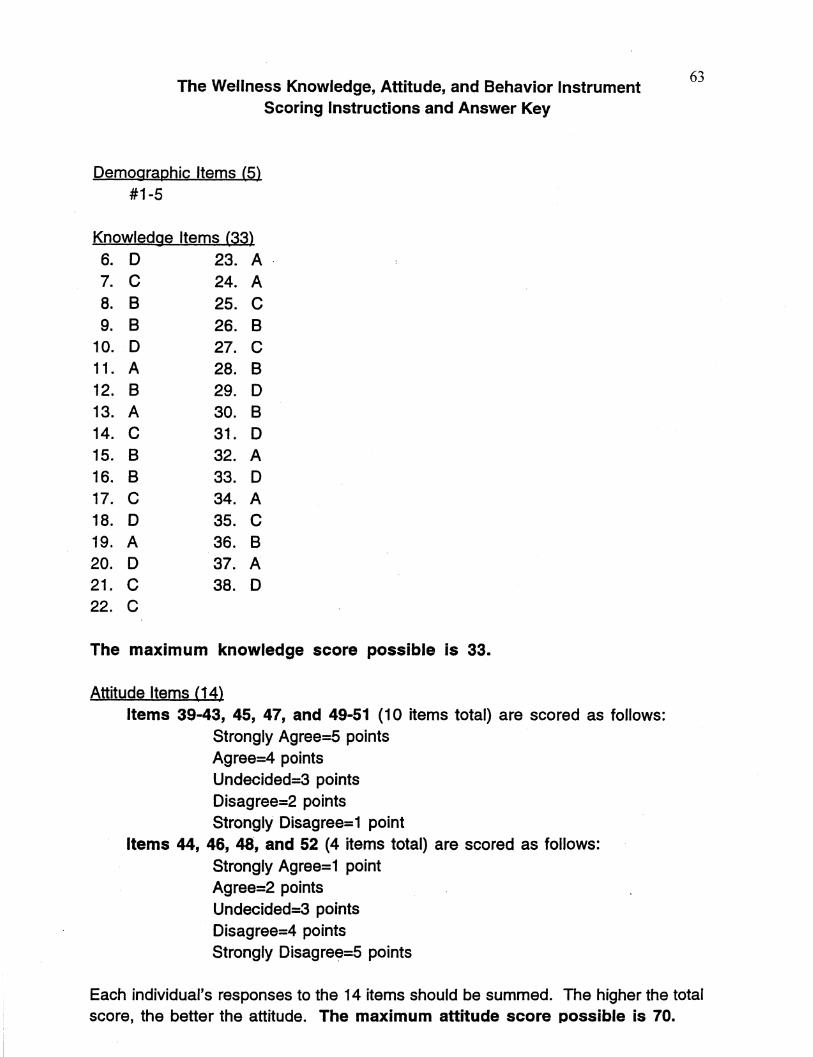
' I
L
The Wellness Knowledge, Attitude, and Behavior Instrument Scoring Instructions and Answer Key
Demographic Items (5) #1-5
Knowledge Items (33) 6. D 23. A 7. c 24. A 8. B 25. c 9. 8 26. 8
10. D 27. c 11. A 28. B 12. B 29. D 13. A 30. B 14. c 31. D 15. B 32. A 16. B 33. D 17. c 34. A 18. D 35. c 19. A 36. 8 20. D 37. A 21. c 38. D 22. c
The maximum knowledge score possible Is 33.
Attitude Items ( 14) Items 39-43, 45, 47, and 49-51 (1 O items total} are scored as follows:
Strongly Agree=5 points Agree=4 points Undecided=3 points Disagree=2 points Strongly Disagree=1 point
Items 44, 46, 48, and 52 (4 items total} are scored as follows: Strongly Agree=1 point Agree=2 points Undecided=3 points Disagree=4 points Strongly Disagre~=5 points
63
Each individual's responses to the 14 items should be summed. The higher the total score, the better the attitude. The maximum attitude score possible is 70.
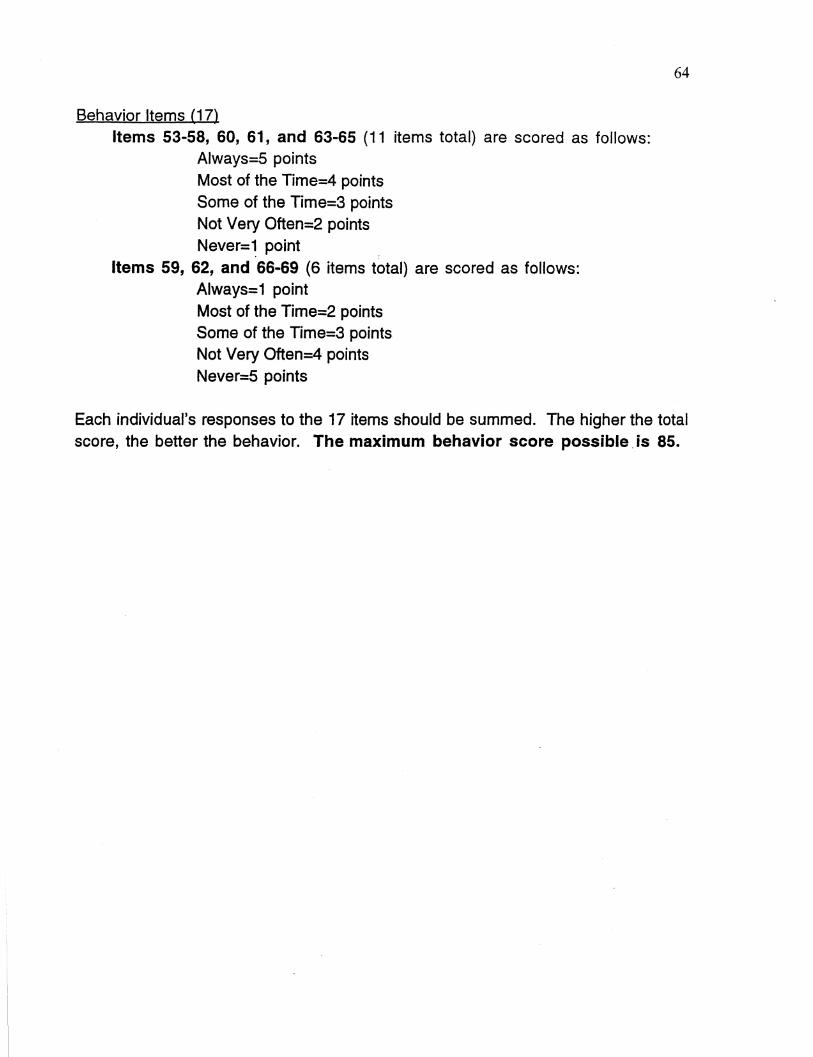
Behavior Items (17) Items 53-58, 60, 61, and 63-65 (11 items total) are scored as follows:
Always=5 points Most of the Time=4 points Some of the Time=3 points Not Very Often=2 points Never=1 point
Items 59, 62, and 66-69 (6 items total) are scored as follows: Always=1 point Most of the Time=2 points Some of the Time=3 points Not Very Often=4 points Never=5 points
64
Each individual's responses to the 17 items should be summed. The higher the total score, the better the behavior. The maximum behavior score possible. is 85.

65
APPENDIXB
MODIFIED
WELLNESS KNOWLEDGE, ATTITUDE, AND BERA VIOR INSTRUMENT

Collegiate Survey
This questionnaire has been designed to gather data for a Masters level thesis project. The study is looking at the relationship between knowledge and behaviors of undergraduate college students.
Your participation in this study is completely volunteer and is confidential. You will not be identified in any way. The completion of this questionnaire will not reflect you or your present class. Data will only be shared with those involved in the study.
Completion of this survey conveys your consent that: • You will allow your data to be included in this study • You understand the purpose of the data collection • Your participation is strictly volunteer and completely anonymous.
If you have questions now or after research is complete you may contact:
Researcher: Shecanna Woomer, B.S., A.T.C. Eastern Illinois University, Physical Education (217) 345-9366
Research Committee Head: Dr. Jill Owen, Ell (217)581-5380
THANK YOU FOR YOUR TIME AND EFFORT!!!
66
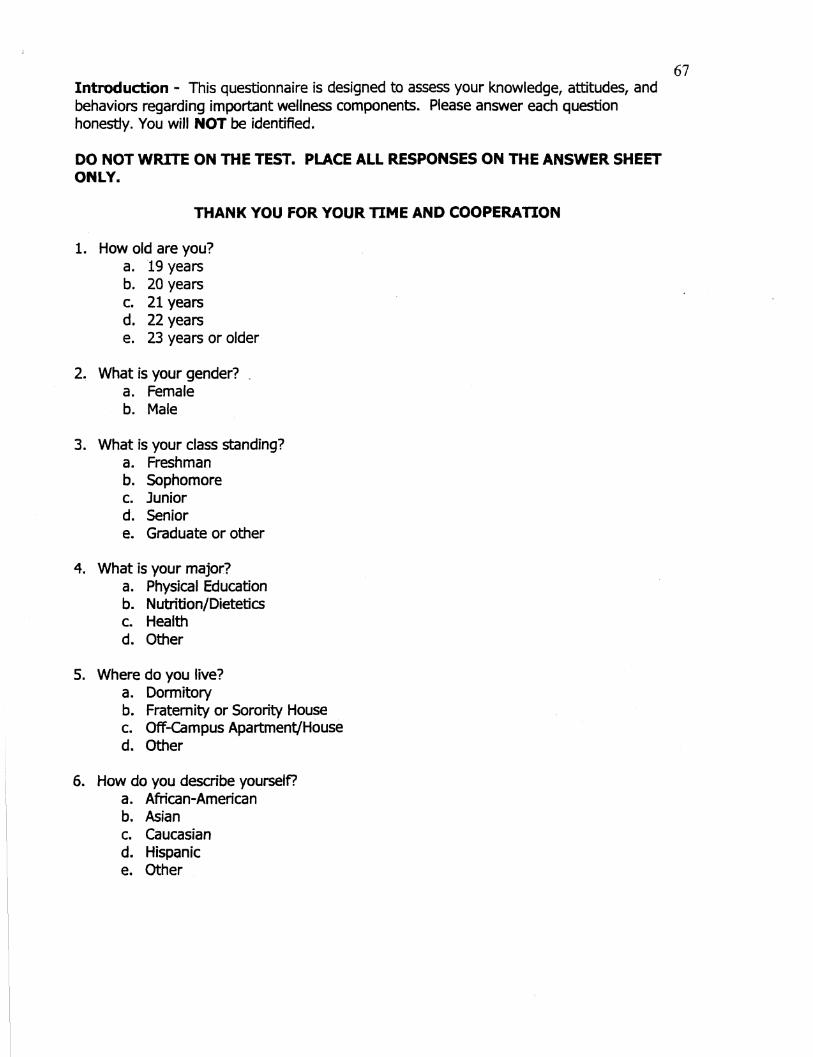
Introduction - This questionnaire is designed to assess your knowledge, attitudes, and behaviors regarding important wellness components. Please answer each question honestly. You will NOT be identified.
DO NOT WRITE ON THE TEST. PLACE ALL RESPONSES ON THE ANSWER SHEET ONLY.
THANK YOU FOR YOUR TIME AND COOPERATION
1. How old are you? a. 19 years b. 20 years c. 21 years d. 22 years e. 23 years or older
2. What is your gender? a. Female b. Male
3. What is your class standing? a. Freshman b. Sophomore c. Junior d. Senior e. Graduate or other
4. What is your major? a. Physical Education b. Nutrition/Dietetics c. Health d. Other
5. Where do you live? a. Dormitory b. Fraternity or Sorority House c. Off-campus Apartment/House d. Other
6. How do you describe yourself? a. African-American b. Asian c. caucasian d. Hispanic e. Other
67
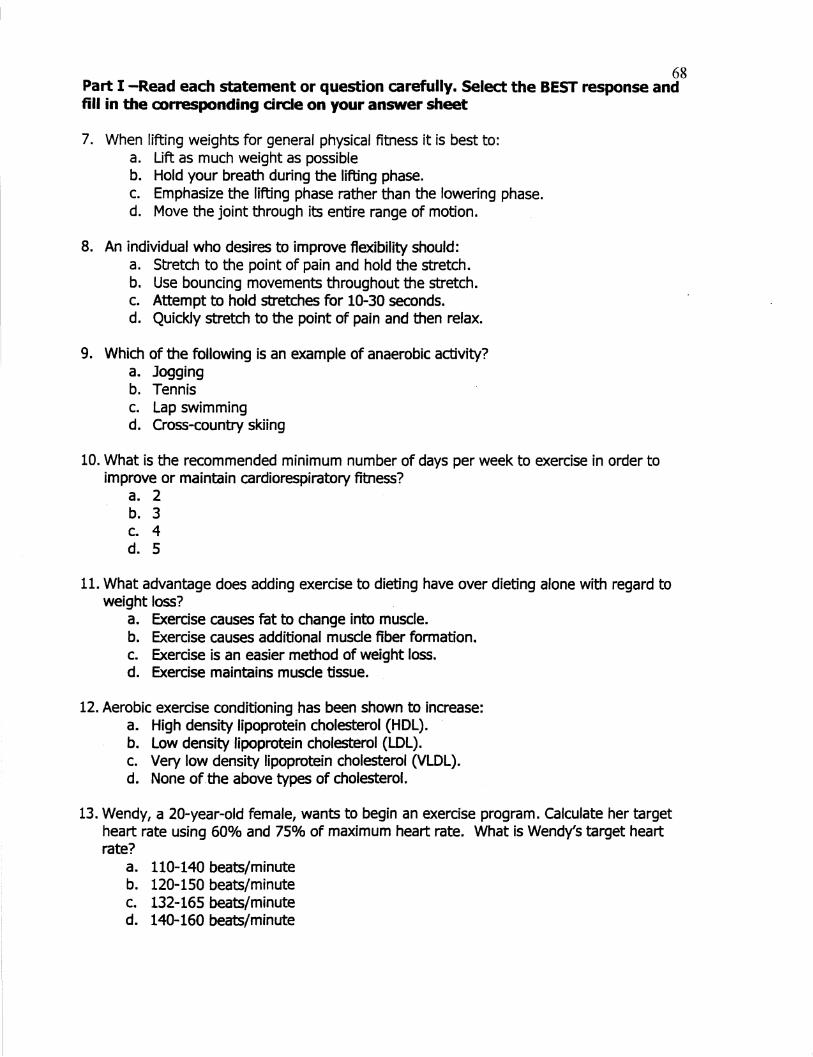
68 Part I -Read each statement or question carefully. Select the BEST response and fill in the a>rresponding drcle on your answer sheet
7. When lifting weights for general physical fitness it is best to: a. Lift as much weight as possible b. Hold your breath during the lifting phase. c. Emphasize the lifting phase rather than the lowering phase. d. Move the joint through its entire range of motion.
8. An individual who desires to improve flexibility should: a. Stretch to the point of pain and hold the stretch. b. Use bouncing movements throughout the stretch. c. Attempt to hold stretches for 10-30 seconds. d. Quickly stretch to the point of pain and then relax.
9. Which of the following is an example of anaerobic activity? a. Jogging b. Tennis c. Lap swimming d. Cross-country skiing
10. What is the recommended minimum number of days per week to exercise in order to improve or maintain cardiorespiratory fitness?
a. 2 b. 3 c. 4 d. 5
11. What advantage does adding exercise to dieting have over dieting alone with regard to weight loss?
a. Exercise causes fat to change into muscle. b. Exercise causes additional muscle fiber formation. c. Exercise is an easier method of weight loss. d. Exercise maintains muscle tissue.
12. Aerobic exercise conditioning has been shown to increase: a. High density lipoprotein cholesterol (HDL). b. Low density lipoprotein cholesterol (LDL). c. Very low density lipoprotein cholesterol (VLDL). d. None of the above types of cholesterol.
13. Wendy, a 20-year-old female, wants to begin an exercise program. Calculate her target heart rate using 60% and 75% of maximum heart rate. What is Wendy's target heart rate?
a. 110-140 beats/minute b. 120-150 beats/minute c. 132-165 beats/minute d. 140-160 beats/minute
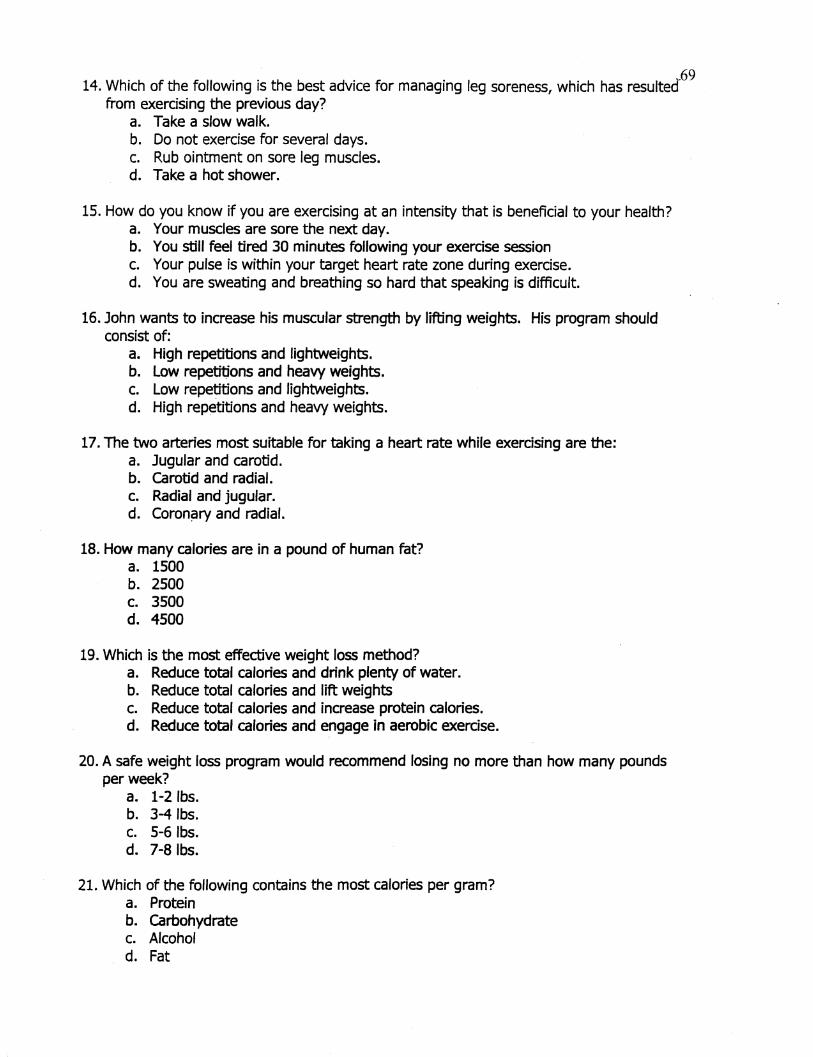
14. Which of the following is the best advice for managing leg soreness, which has resultea69
from exercising the previous day? a. Take a slow walk. b. Do not exercise for several days. c. Rub ointment on sore leg muscles. d. Take a hot shower.
15. How do you know if you are exercising at an intensity that is beneficial to your health? a. Your muscles are sore the next day. b. You still feel tired 30 minutes following your exercise session c. Your pulse is within your target heart rate zone during exercise. d. You are sweating and breathing so hard that speaking is difficult.
16. John wants to increase his muscular strength by lifting weights. His program should consist of:
a. High repetitions and lightweights. b. Low repetit;ions and heavy weights. c. Low repetitions and lightweights. d. High repetitions and heavy weights.
17. The two arteries most suitable for taking a heart rate while exercising are the: a. Jugular and carotid. b. carotid and radial. c. Radial and jugular. d. Coron~ry and radial.
18. How many calories are in a pound of human fat? a. 1500 b. 2500 c. 3500 d. 4500
19. Which is the most effective weight loss method? a. Reduce total calories and drink plenty of water. b. Reduce total calories and lift weights c. Reduce total calories and increase protein calories. d. Reduce total calories and engage in aerobic exercise.
20. A safe weight loss program would recommend losing no more than how many pounds per week?
a. 1-2 lbs. b. 3-4 lbs. c. 5-6 lbs. d. 7-8 lbs.
21. Which of the following contains the most calories per gram? a. Protein b. carbohydrate c. Alcohol d. Fat
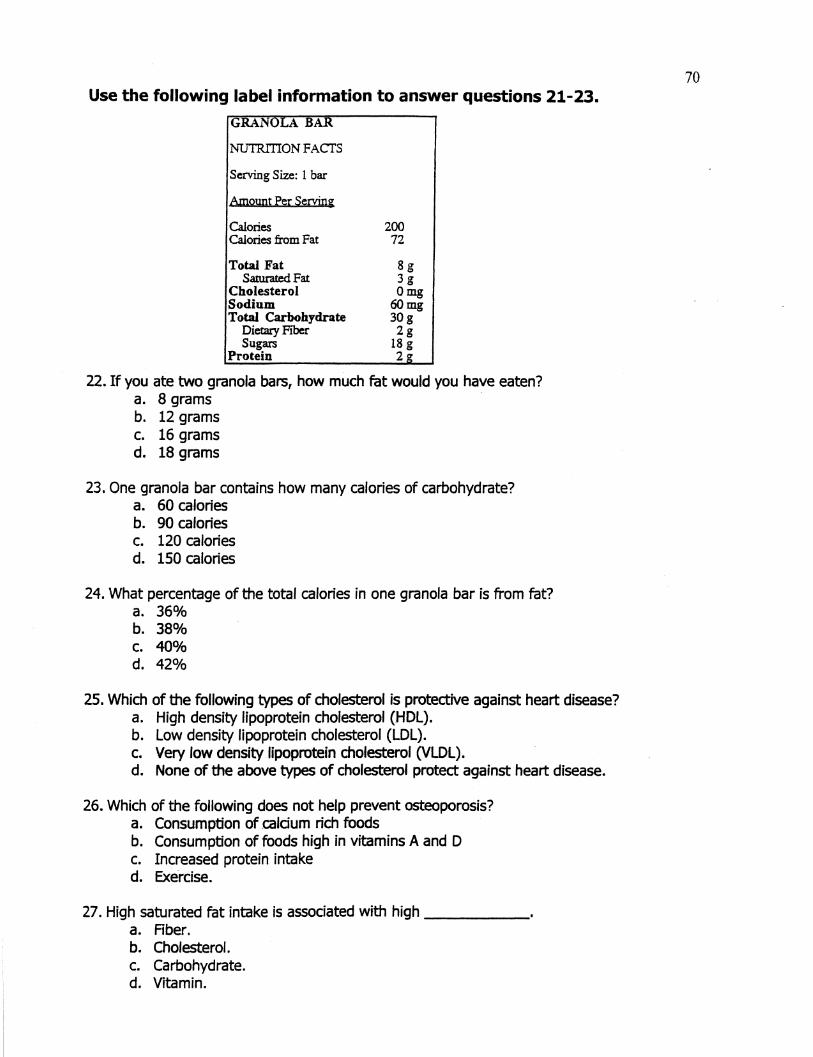
Use the following label information to answer questions 21-23.
GRA
NUTRITION FACTS
Serving Size: 1 bar
An10untPerSeryjn~
Calories Calories from Fat
Total Fat Saturated Fat
Cholesterol Sodium Total Carbohydrate
Dietary Fiber Sugars
Protein
200 72
Sg 3g Omg
60mg 30g 2g
18 g 2
22. If you ate two granola bars, how much fat would you have eaten? a. 8 grams b. 12 grams c. 16 grams d. 18 grams
23. One granola bar contains how many calories of carbohydrate? a. 60 calories b. 90 calories c. 120 calories d. 150 calories
24. What percentage of the total calories in one granola bar is from fat? a. 36% b. 38% c. 40% d. 42%
25. Which of the following types of cholesterol is protective against heart disease? a. High density lipoprotein cholesterol (HDL). b. Low density lipoprotein cholesterol (LDL). c. Very low density llpoprotein cholesterol (VLDL). d. None of the above types of cholesterol protect against heart disease.
26. Which of the following does not help prevent osteoporosis? a. Consumption of calcium rich foods b. Consumption of foods high in vitamins A and D c. Increased protein intake d. Exercise.
27. High saturated fat intake is associated with high ____ _ a. Fiber. b. Cholesterol. c. Carbohydrate. d. Vitamin.
70
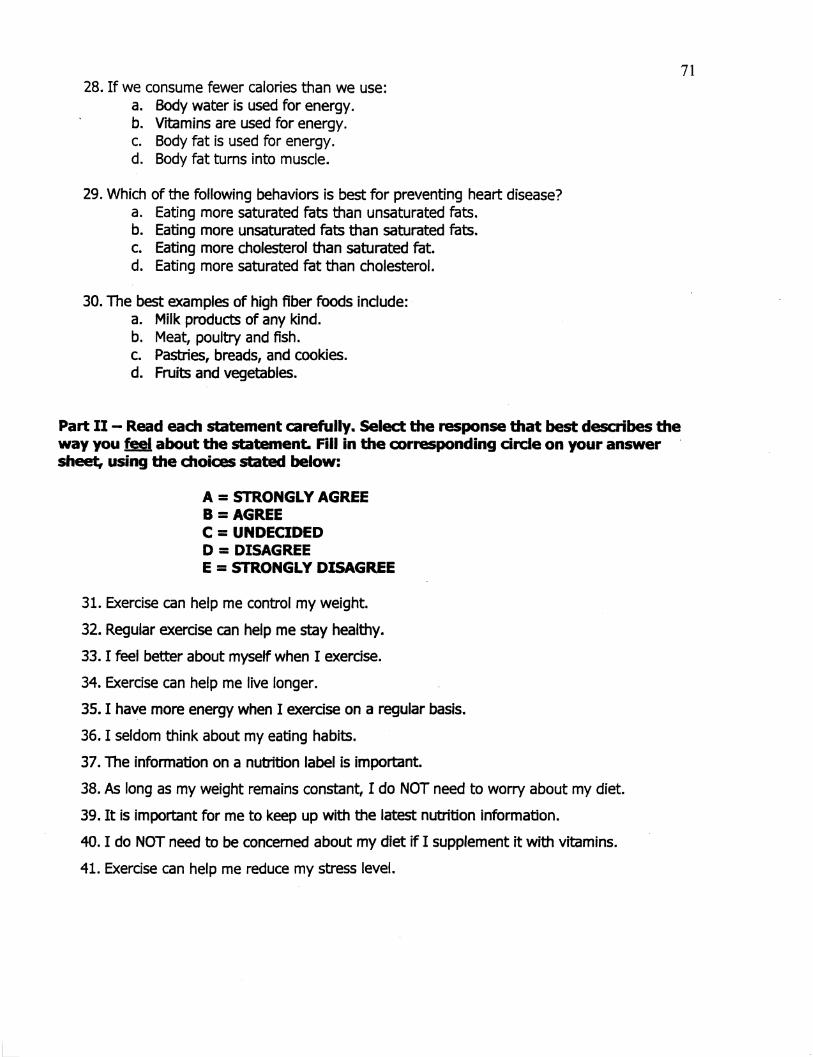
28. If we consume fewer calories than we use: a. Body water is used for energy. b. Vitamins are used for energy. c. Body fat is used for energy. d. Body fat turns into muscle.
29. Which of the following behaviors is best for preventing heart disease? a. Eating more saturated fats than unsaturated fats. b. Eating more unsaturated fats than saturated fats. c. Eating more cholesterol than saturated fat. d. Eating more saturated fat than cholesterol.
30. The best examples of high fiber foods include: a. Milk products of any kind. b. Meat, poultry and fish. c. Pastries, breads, and cookies. d. Fruits and vegetables.
Part II - Read each statement carefully. Select the response that best describes the way you ~ about the statement. Fill in the corresponding circle on your answer sheet, using the choices stated below:
A = STRONGLY AGREE B =AGREE C = UNDECIDED D =DISAGREE E = STRONGLY DISAGREE
31. Exercise can help me control my weight.
32. Regular exercise can help me stay healthy.
33. I feel better about myself when I exercise.
34. Exercise can help me live longer.
35. I have more energy when I exercise on a regular basis.
36. I seldom think about my eating habits.
37. The information on a nutrition label is important.
38. As long as my weight remains constant, I do NOT need to worry about my diet.
39. It is important for me to keep up with the latest nutrition information.
40. I do NOT need to be concerned about my diet if I supplement it with vitamins.
41. Exercise can help me reduce my stress level.
71
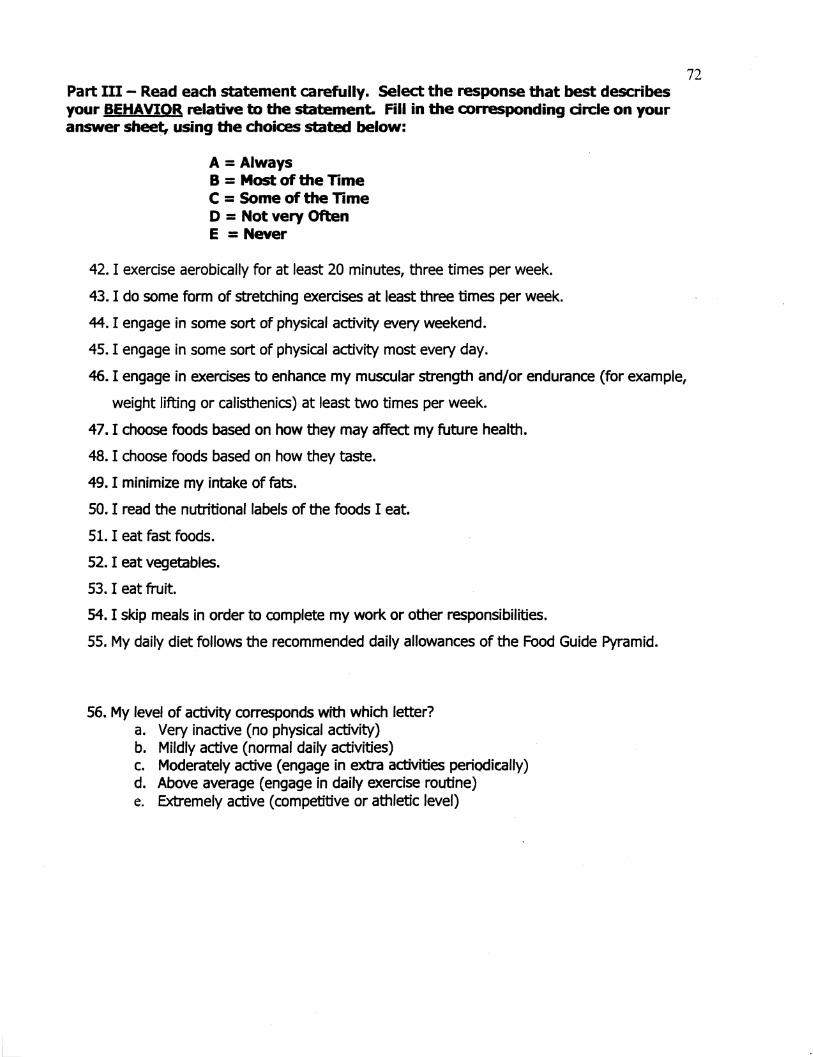
Part III- Read each statement carefully. Select the response that best describes your BEHAVIOR relative to the statement. Fill in the corresponding circle on your answer sheet, using the choices stated below:
A= Always B = Most of the Time C = Some of the Time D = Not very Often E =Never
42. I exercise aerobically for at least 20 minutes, three times per week.
43. I do some form of stretching exercises at least three times per week.
44. I engage in some sort of physical activity every weekend.
45. I engage in some sort of physical activity most every day.
46. I engage in exercises to enhance my muscular strength and/or endurance (for example,
weight lifting or calisthenics) at least two times per week.
47. I choose foods based on how they may affect my future health.
48. I choose foods based on how they taste.
49. I minimize my intake of fats.
SO. I read the nutritional labels of the foods I eat.
51. I eat fast foods.
52. I eat vegetables.
53. I eat fruit.
54. I skip meals in order to complete my work or other responsibilities.
55. My daily diet follows the recommended daily allowances of the Food Guide Pyramid.
56. My level of activity corresponds with which letter? a. Very inactive (no physical activity) b. Mildly active (normal daily activities) c. Moderately active (engage in extra activities periodically) d. Above average (engage in daily exercise routine) e. Extremely active (competitive or athletic level)
72

k
l
The Modified Wellness Knowledge, Attitude, and Behavior Instrument Scoring Instructions and Answer Key
Demographic Items (6) #1-6
Knowledge Items (24)
7.D 8. c 9.B
10.B 11. D 12.A 13.B 14.A
15. c 16. B 17. B 18. c 19.D 20.A 21. D 22.C
23. c 24.A 25.A 26.C 27.B 28.C 29.B 30.D
Maximum Knowledge score possible is 24.
Attitude Items (11)
Items 31-35, 37, 39, 41 are scored as follows: Strongly Agree = 5 points Agree = 4 points Undecided = 3 points Disagree = 2 points Strongly Disagree = 1 point
Items 36, 38, 40 are scored as follows: Strongly Agree = 1 point Agree = 2 points Undecided = 3 points Disagree = 4 points Strongly Disagree = 5 points
Each individual's responses are summed, the higher the score, the better the attitude. Maximum Attitude score possible is 55.
Behavior Items (14)
Items 42-46,49, 50, 52, 53, 55 are scored as follows: Always = 5 points Most of the time = 4 points Some of the time = 3 points Not very often = 2 points Never= 1 point
73
Items 48, 51, 54 are scored as follows: Always = 1 point Most of the time = 2 points Some of the time = 3 points Not very often = 4 points Never = 5 points
74
Each individual's responses are summed, the higher the score, the better the behavior. Maximum Behavior score possible is 70.
APPENDIXC
FREQUENCY AND PERCENTAGES OF
THE RESPONSES TO THE
WELLNESS KNOWLEDGE, ATTITUDE, AND BEHAVIOR INSTRUMENT
75

76
Question =Frequency of Response-percentage
1. How old are you? a. 19years =25-12.4 8/o b. 20years =34-16.8% c. 21 years =48-23.8% d. 22 years =45-22.3% e. 23 years or older =50-24.8%
2. What is your gender? a. Female =120-59.4% b. Male =82-40.6%
3. What is your class standing? a. Freshman =16-7.9% b. Sophomore =27-13.4% c. Junior =34-16.8% d. Senior =106-52.5% e. Graduate or other =19-9.4%
4. What is your major? a. Physical Education =62-30.7% b. Nutrition/Dietetics =13-6.4% c. Health =20-9.9% d. Other =107-53%
5. Where do you live? a. Dormitory =35-17.36% b. Fraternity or Sorority House =9-4.5% c. Off-Campus Apartment/House =136-67.3% d. Other =22-10.9%
6. How do you describe yourself? a. African-American =10-5% b. Asian =0-0% c. Caucasian =184-91.1% d. Hispanic =4-2% e. Other =4-2%

Part I-Knowledge Test
7. When lifting weights for general physical fitness it is best to: a. Lift as much weight as possible b. Hold your breath during the lifting phase. c. Emphasize the lifting phase rather than the lowering phase. d. Move the joint through its entire range of motion.
8. An individual who desires to improve flexibility should: a. Stretch to the point of pain and hold the stretch. b. Use bouncing movements throughout the stretch. c. Attempt to hold stretches for 10-30 seconds. d. Quickly stretch to the point of pain and then relax.
9. Which of the following is an example of anaerobic activity? a. Jogging =21-10.4% b. Tennis =111-55% c. Lap swimming =37-18.3% d. Cross-country skiing =33-16.3%
77
=4-2% =6-3% =25-12.4% =166-82.2%
=14-6.9% =6-3% =178-88.1% =4-2%
10. What is the recommended minimum number of days per week to exercise in order to improve or maintain cardiorespiratory fitness?
a. 2 =4-2% b. 3 =153-75. 7% c. 4 =29-14.4% d. 5 =16-7.9%
11. What advantage does adding exercise to dieting have over dieting alone with regard to weight loss?
a. Exercise causes fat to change into muscle. b. Exercise causes additional muscle fiber formation. c. Exercise is an easier method of weight loss. d. Exercise maintains muscle tissue.
12. Aerobic exercise conditioning has been shown to increase: a. High density lipoprotein cholesterol (HDL). b. Low density lipoprotein cholesterol (LDL). c. Very low density lipoprotein cholesterol (VLDL). d. None of the above types of cholesterol.
=80-39.6% =37-18.3% =21-10.4% =64-31.7%
=97-48% =55-27.2% =13-6.4% =36-17.8%
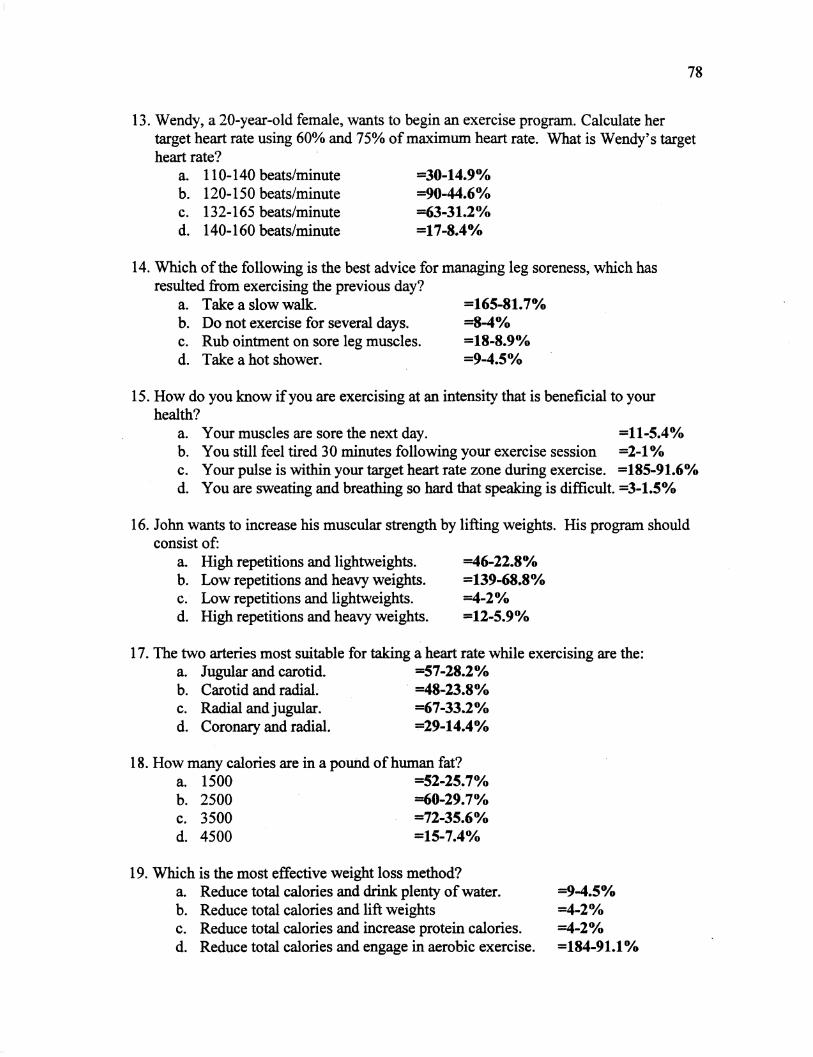
78
13. Wendy, a 20-year-old female, wants to begin an exercise program. Calculate her target heart rate using 60% and 75% of maximum heart rate. What is Wendy's target heart rate?
a. 110-140 beats/minute b. 120-150 beats/minute c. 132-165 beats/minute d. 140-160 beats/minute
=30-14.9°/o =90-44.6% =63-31.2°/o =17-8.4%
14. Which of the following is the best advice for managing leg soreness, which has resulted from exercising the previous day?
a. Take a slow walk. b. Do not exercise for several days. c. Rub ointment on sore leg muscles. d. Take a hot shower.
=165-81.7% =8-4% =18-8.9% =9-4.5%
15. How do you know if you are exercising at an intensity that is beneficial to your health?
a. Your muscles are sore the next day. =11-5.4% b. You still feel tired 30 minutes following your exercise session =2-1 % c. Your pulse is within your target heart rate zone during exercise. =185-91.6% d. You are sweating and breathing so hard that speaking is difficult. =3-1.5%
16. John wants to increase his muscular strength by lifting weights. His program should consist of:
a. High repetitions and lightweights. b. Low repetitions and heavy weights. c. Low repetitions and lightweights. d. High repetitions and heavy weights.
=46-22.8% =139-68.8% =4-2% =12-5.9%
17. The two arteries most suitable for taking a heart rate while exercising are the: a. Jugular and carotid. =57-28.2% b. Carotid and radial. =48-23.8% c. Radial and jugular. =67-33.2% d. Coronary and radial. =29-14.4%
18. How many calories are in a pound of human fat? a. 1500 =52-25.7% b. 2500 =60-29. 7% c. 3500 =72-35.6% d. 4500 =15-7.4%
19. Which is the most effective weight loss method? a. Reduce total calories and drink plenty of water. b. Reduce total calories and lift weights c. Reduce total calories and increase protein calories. d. Reduce total calories and engage in aerobic exercise.
=9-4.5% =4-2% =4-2% =184-91.1%
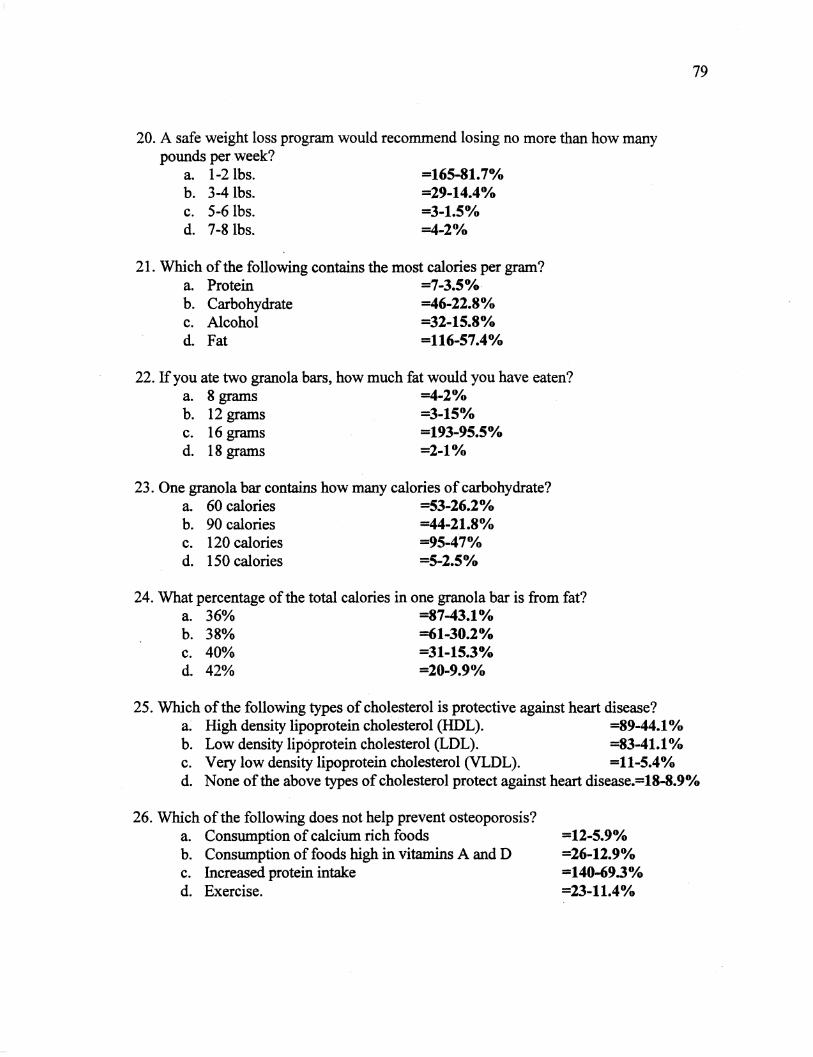
20. A safe weight loss program would recommend losing no more than how many pounds per week?
a. 1-2 lbs. b. 3-4 lbs. c. 5-6 lbs. d. 7-8 lbs.
=165-81.7% =29-14.4% =3-1.5% =4-2%
21. Which of the following contains the most calories per gram? a. Protein =7-3.5% b. Carbohydrate =46-22.8% c. Alcohol =32-15.8% d. Fat =116-57.4%
22. If you ate two granola bars, how much fat would you have eaten? a. 8 grams =4-2 °/o b. 12 grams =3-15% c. 16 grams =193-95.5% d. 18 grams =2-1 %
23. One granola bar contains how many calories of carbohydrate? a. 60 calories =53-26.2% b. 90 calories =44-21.8% c. 120 calories =95-47% d. 150 calories =5-2.5%
24. What percentage of the total calories in one granola bar is from fat? a. 36% =87-43.1 % b. 38% =61-30.2% c. 40% =31-15.3% d. 42% =20-9.9%
25. Which of the following types of cholesterol is protective against heart disease? a. High density lipoprotein cholesterol (HDL). =89-44.1 % b. Low density lipoprotein cholesterol (LDL). =83-41.1 % c. Very low density lipoprotein cholesterol (VLDL). =11-5.4%
79
d. None of the above types of cholesterol protect against heart disease.=18-8.9%
26. Which of the following does not help prevent osteoporosis? a. Consumption of calcium rich foods b. Consumption of foods high in vitamins A and D c. Increased protein intake d. Exercise.
=12-5.9% =26-12.9% =140-69.3% =23-11.4%
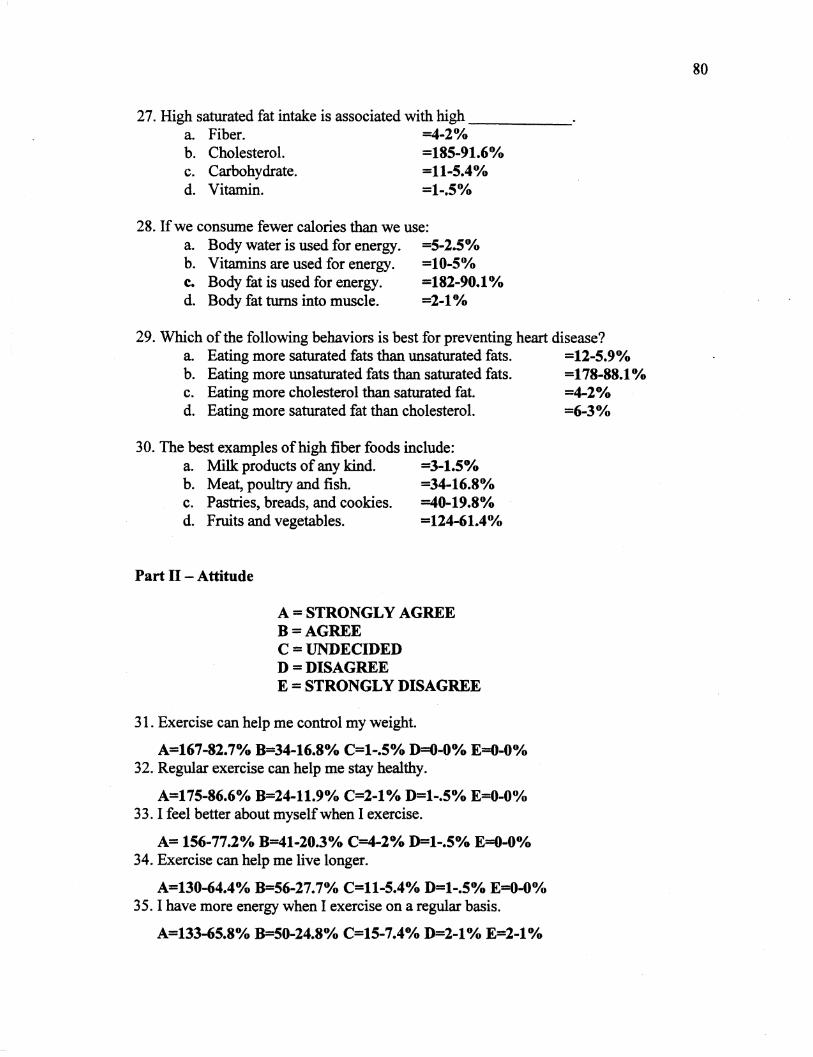
27. High saturated fat intake is associated with high _____ _ a. Fiber. =4-2% b. Cholesterol. =185-91.6% c. Carbohydrate. =11-5.4 % d. Vitamin. =1-.5%
28. Ifwe consume fewer calories than we use: a. Body water is used for energy. =5-2.5% b. Vitamins are used for energy. =10-5% c. Body fat is used for energy. =182-90.1 % d. Body fat turns into muscle. =2-1 %
29. Which of the following behaviors is best for preventing heart disease? a. Eating more saturated fats than unsaturated fats. =12-5.9% b. Eating more unsaturated fats than saturated fats. =178-88.1 % c. Eating more cholesterol than saturated fat. =4-2°/o d. Eating more saturated fat than cholesterol. =6-3%
30. The best examples of high fiber foods include: a. Milk products of any kind. =3-1.5% b. Meat, poultry and fish. =34-16.8% c. Pastries, breads, and cookies. =40-19.8% d. Fruits and vegetables. =124-61.4%
Part II - Attitude
A=STRONGLY AGREE B=AGREE C =UNDECIDED D=DISAGREE E =STRONGLY DISAGREE
31. Exercise can help me control my weight.
A=167-82.7% B=34-16.8% C=l-.5% D=0-0% E=0-0% 32. Regular exercise can help me stay healthy.
A=l 75-86.6% B=24-11.9% C=2-1 % D=l-.5% E=0-0% 33. I feel better about myself when I exercise.
A= 156-77.2% B=41-20.3% C=4-2% D=l-.5% E=0-0% 34. Exercise can help me live longer.
A=130-64.4% B=56-27.7% C=ll-5.4% D=l-.5% E=0-0% 35. I have more energy when I exercise on a regular basis.
A=133-65.8% B=S0-24.8% C=15-7.4% D=2-1% E=2-1%
80

36. I seldom think about my eating habits.
A=l0-5% B=43-21.3% C=31-15.3% D=69-34.2% E=49-24.3% 3 7. The information on a nutrition label is important.
A=69-34.2% B=9346% C=2210.9% D=ll-5.4% E=7-3.5% 38. As long as my weight remains constant, I do NOT need to worry about my diet.
A=6-3% B=19-9.4% C=209.9% D=112-55.4% E=45-22.3% 39. It is important for me to keep up with the latest nutrition information.
A=43-21.3% B=8341.1 % C=45-22.3% D=23-ll.4% E=S-4% 40. I do NOT need to be concerned about my diet ifl supplement it with vitamins.
A=7-3.5% B=9-4.5% C=13-6.4% D=107-53% E=66-32.7% 41. Exercise can help me reduce my stress level.
81
Part Ill-Read each statement carefully. Select the response that best describes your BEHAVIOR relative to the statement. Fill in the corresponding circle on your answer sheet, using the choices stated below:
A=Always B = Most of the Time C = Some of the Time D =Not very Often E =Never
42. I exercise aerobically for at least 20 minutes, three times per week.
A=48-23.8% B=47-23.3% C=52-25. 7% D=4421.8% E=ll-5.4% 43. I do some form of stretching exercises at least three times per week.
A =38-18.8% B=39-19.3°/o C=63-31.2% D=47-23.3% E=15-7.4% 44. I engage in some sort of physical activity every weekend.
A=56-27.7% B=54-26.7% C=69-34.2% D=20-9.9% E=3-1.5% 45. I engage in some sort of physical activity most every day.
A=47-23.3% B=70-34.7% C=42-20.8% D=45-17.3% E=S-4% 46. I engage in exercises to enhance my muscular strength and/or endurance (for example
weight lifting or calisthenics) at least two times per week.
A=50-24.8% B=46-22.8% C=40-19.8% D=4823.8°/o E=18-8.9% 4 7. I choose foods based on how they may affect my future health.
A=20-9.9% B=5527.2% C=73-36.1 D=43-21.3% E=ll-5.4%
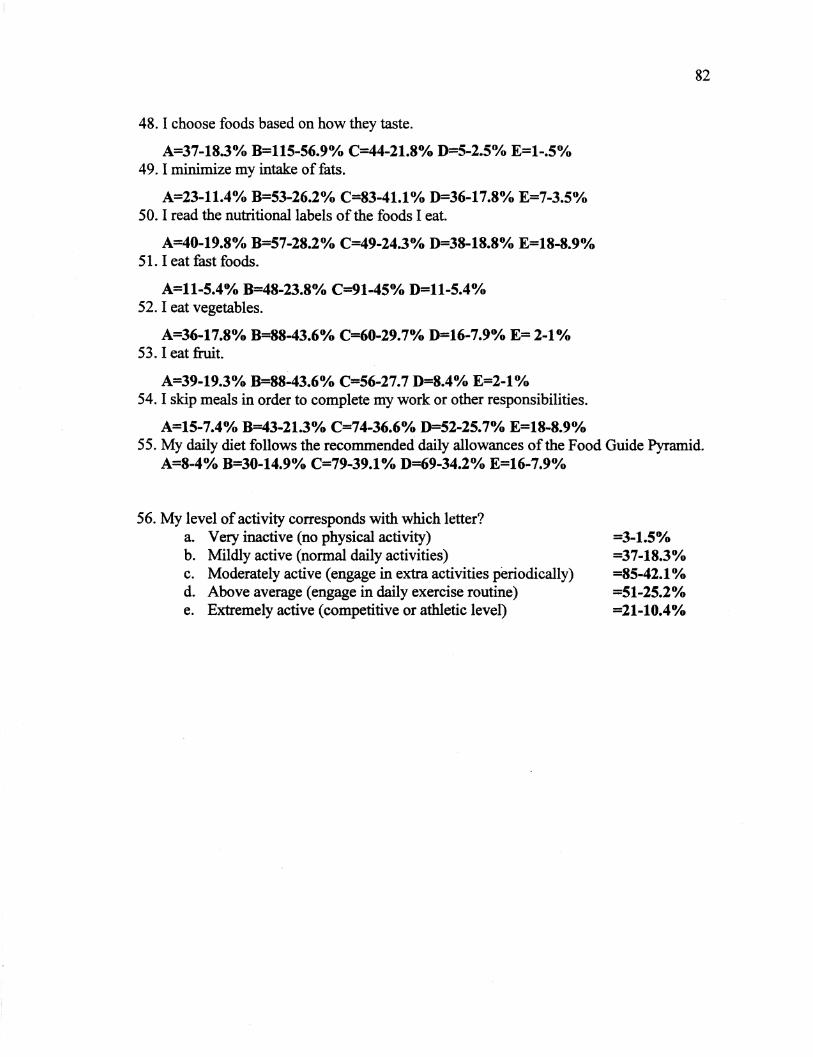
82
48. I choose foods based on how they taste.
A=37-18.3% B=115-56.9°/o C=44-21.8% D=5-2.5% E=l-.5% 49. I minimize my intake of fats.
A=23-11.4% B=53-26.2% C=83-41.1 % D=36-17.8% E=7-3.5% 50. I read the nutritional labels of the foods I eat.
A=40-19.8% B=57-28.2% C=49-24.3% D=38-18.8% E=18-8.9% 51. I eat fast foods.
A=ll-5.4% B=48-23.8% C=91-45% D=ll-5.4% 52. I eat vegetables.
A=36-17.8% B=88-43.6% C=60-29.7% D=16-7.9% E=2-1% 53. I eat fruit.
A=39-19.3% B=88-43.6% C=56-27.7 D=8.4% E=2-1 % 54. I skip meals in order to complete my work or other responsibilities.
A=15-7.4% B=43-21.3% C=74-36.6% D=52-25.7% E=18-8.9% 55. My daily diet follows the recommended daily allowances of the Food Guide Pyramid.
A=8-4% B=30-14.9% C=79-39.1% D=69-34.2% E=16-7.9%
56. My level of activity corresponds with which letter? a. Very inactive (no physical activity) b. Mildly active (normal daily activities) c. Moderately active (engage in extra activities periodically) d. Above average (engage in daily exercise routine) e. Extremely active (competitive or athletic level)
=3-1.5% =37-18.3% =85-42.1% =51-25.2% =21-10.4%