the effect of visual cues in listening comprehension
TRANSCRIPT

St. Cloud State UniversitytheRepository at St. Cloud State
Culminating Projects in English Department of English
12-2015
The Effect of Visual Cues in ListeningComprehension: Pedagogical Implications forNon-Native Speakers of EnglishSoraya FolleySaint Cloud State University
Follow this and additional works at: https://repository.stcloudstate.edu/engl_etds
This Thesis is brought to you for free and open access by the Department of English at theRepository at St. Cloud State. It has been accepted forinclusion in Culminating Projects in English by an authorized administrator of theRepository at St. Cloud State. For more information, please [email protected].
Recommended CitationFolley, Soraya, "The Effect of Visual Cues in Listening Comprehension: Pedagogical Implications for Non-Native Speakers of English"(2015). Culminating Projects in English. 39.https://repository.stcloudstate.edu/engl_etds/39

The Effect of Visual Cues in Listening Comprehension: Pedagogical
Implications for Non-Native Speakers of English
by
Soraya Folley
A Thesis
Submitted to the Graduate Faculty of
St. Cloud State University
in Partial Fulfillment of the Requirements
for the Degree
Master of Arts in
English: Teaching English as a Second Language
December, 2015
Thesis Committee:
James Robinson, Chairperson
Ramon Serrano
Masha Mikolchak

2
Abstract
Rubin (1994) stresses the value of visual support in listening comprehension and cites
several studies including her own in favor of using videos in language classrooms. Hoven
(1999) correlates listening comprehension to visual comprehension and argues that LC and
VC are complementary and should both be incorporated in teaching listening and speaking in
L2. Furthermore, gestures play a significant role of mediator in the language learning process
(McCafferty, 2004), and technology offers multiple ways to introduce input in language
classrooms (Rost, 2007). A listening comprehension task was designed to compare three
different modes of input in a listening and speaking class among a group of 33 English
language learners. All three groups wrote a recall after listening twice to the same audio-text.
The control group did not benefit from any visual support, while experimental 1 could see the
video of the speaker using gestures and facial cues. Experimental 2 group watched a
PowerPoint presentation where the oral input was enhanced with pictures and some text. The
pictures represented each example cited in the presentation. The analysis comprised in a T-test
to compare the recall students wrote individually in each group, and a Chi-square test to
compare the number of examples cited in students’ recalls per group. The T-test did not show
any significant results to form a claim in favor of one mode of input over the other. However,
a Chi-square tests which compared the number of examples cited per group indicated that
there is a relationship between the number of examples and the various groups according to
each treatment. This study strongly suggests that supporting oral input with pictures is highly
recommended. In fact, the results show that students who were given specific examples

3
accompanied with pictures, were the only group where some participants successfully cited all
the examples mentioned in the presentation.

4
Acknowledgments
I would like to thank all the people who helped me and supported me throughout this
research project. All the people who made graduate school a great experience. Friends I will
cherish for life, professors who opened my eyes and mind to new ways of thinking, my
committee members, Dr. Robinson who had the patience to guide me and answer my 101
questions, my mom who values education beyond limits, my family who always believed in
me, and my daughter Rayja who gives me the strength to reach beyond my limits. Carol,
Richard, David, Doris, Salim, Betsy, Emily, Leah, James, and many more to cite them all,
your names are not mentioned here fortuitously, I thank you for being the beautiful people
you are.

5
❝Please listen carefully and try to hear what I am not saying.❞
Finn, 1966
6
Table of Contents
Page
List of Tables ..................................................................................................................... 8
List of Chart ..................................................................................................................... 9
Chapter
I. Introduction ............................................................................................................ 10
Introduction ...................................................................................................... 10
II. Literature Review ................................................................................................... 13
Second Language Listening Comprehension Research Review ...................... 13
Listening Comprehension versus Visual Comprehension ................................ 14
The Role of Gestures and Facial Cues in Listening Comprehension ............... 14
Technology in the Language Classroom .......................................................... 16
Research Question ............................................................................................ 21
III. Methodology ........................................................................................................... 22
Participants ....................................................................................................... 22
Materials ........................................................................................................... 22
IV. Analysis and Results ............................................................................................... 25
T-test ................................................................................................................. 25
V. Discussion ............................................................................................................... 35
Summary of Results ......................................................................................... 35
Pedagogical Implications .................................................................................. 37
Limitations ........................................................................................................ 38

7
Chapter Page
Conclusion ........................................................................................................ 39
References .......................................................................................................................... 41
Appendices
A. Informed Consent Letter ......................................................................................... 44
B. Text Used as Oral Presentation .............................................................................. 46
C. PowerPoint Used in Experimental 2 ....................................................................... 48
D. Directions ............................................................................................................... 52
8
List of Tables
Table Page
1. Group Statistics ...................................................................................................... 25
2. Independent Samples Test ...................................................................................... 26
3. Independent Samples Test ...................................................................................... 26
4. Independent Samples Test ...................................................................................... 26
5. Group Statistics ...................................................................................................... 27
6. Independent Samples Test ...................................................................................... 27
7. Independent Samples Test ...................................................................................... 28
8. Independent Samples Test ...................................................................................... 28
9. Group Statistics ...................................................................................................... 29
10. Independent Samples Test ...................................................................................... 29
11. Independent Samples Test ...................................................................................... 29
12. Independent Samples Test ...................................................................................... 30
13. Case Processing Summary ..................................................................................... 31
14. Group * Example Crosstabulation .......................................................................... 31
15. Group * Examples Crosstabulation ........................................................................ 32
16. Chi-square Tests ..................................................................................................... 33

9
List of Chart
Chart Page
1. Bar Chart Comparing Number of Examples Cited by Group Category ................. 34

10
Chapter I: Introduction
Introduction
There are many different ways to think about listening in L2, as there are many
different ways to acquire the skills of listening in second language acquisition; thus, the
permanent and crucial need to use multiple strategies in second language instruction in order
to meet students’ needs.
Indeed, as complex as language acquisition may be, listening falls under the same type
of complexity, and it is difficult to isolate it from the entire process of acquiring a new
language. Listening occurs in various situations and at different levels. Speech is often
delivered using multiple ways of communication and comes from different speakers using
their own personal way of communicating and interacting with others. Therefore, learners
may be passive listeners in some situations such as lectures, watching movies, etc.; while they
act as active participants in a conversation or a debate. In order to be able to communicate
efficiently, or at least to understand what is being said, learners need to acquire the tools to
decode what they hear and infer meaning regardless of the setting in which they may be. From
a language teaching perspective, listening has been a challenging skill to teach, and remained
ignored for a long time. It was considered a tool to convey content in the classroom, but never
a tool in itself. Learners who lacked listening proficiency were not identified and their lack of
comprehension hindered their language acquisition (Field, 2008).
Fortunately, listening comprehension status has evolved and is recognized as one of
the major components in learning a second language. As a matter of fact, it is also equally

11
important in first language acquisition and literacy. In his analysis of the listening skill,
Buttery (1980) describes listening as follows:
Listening, the recognition and interpretation of auditory stimuli is accepted as one of
the most important features of children’s learning…Listening skills are generally
considered one of the four major components of language arts (the others being
speaking reading, and writing). However, it is widely recognized that the ability to
listen attentively and critically is generic to children achieving success in all academic
areas as well as life in general. (p. 181)
Similarly, listening is just as important in the language classroom and as crucial for language
learners as it is for children. As technology has evolved, teaching listening and speaking has
also evolved drastically. While technology has made its way in classrooms, the means to
introduce oral input to students has shifted from the standard audio input to a more elaborate
mode, mixing videotaped lectures and video clips, along with PowerPoint presentations and
so on. With a growing interest towards listening comprehension and what type of oral input
serves best language learners, this research answers the following question: In a listening
comprehension task, do visuals help or rather hinder learners listening comprehension and
recall abilities?
To answer this question I used three distinctive mediums in language classrooms to
introduce oral input to students in order to assess their listening comprehension proficiency
and recall abilities. So, the first step in this research was to present students with a
listening/recall task among three different groups who listened to the same audio content
presented in three different way:
1. Group 1 (Control group): simple recording with no text or images.

12
2. Group 2 (Experimental 1): same recording + video of speaker using facial cues and
gestures.
3. Group 3 (Experimental 2): same recording + PowerPoint presentation that included
text and pictures.
The first section of this paper discusses the current and not as current, yet relevant literature
and research findings in L2 listening comprehension. It is followed by a methodology section
in which I explain how this research was conducted, who the participants are, in which setting
and under what conditions the data was collected, analyzed, and interpreted. Section 3 will
present the results and the analysis of the findings, and the final component of this paper is the
discussion section which includes limitations and conclusion. The materials used to conduct
this project are added in the appendices section.

13
Chapter II: Literature Review
This study will investigate the relevance of visual support in a listening
comprehension classroom among English second language learners. Listening occurs in
different settings, but for a long time, oral information was presented via audio input solely in
language classrooms; however, attention is growing about the effect of visual cues whether
they comprise authentic communicative style involving facial cues and gestures, or the use of
technology with pictures, videos, text to go along with the oral input. This literature review
will start with a Listening comprehension research review, and then will extend to three
different aspects of listening comprehension strategies used in language classrooms:
Listening Comprehension Versus Visual Comprehension
The role of gestures and facial cues in Listening Comprehension
Technology in The Language Classroom
Second Language Listening Comprehension Research Review
The interest of language experts in L2 listening comprehension has generated a large
body of research, and several factors involved in listening have been investigated. In a review
of Second Language Listening Comprehension Research, Rubin (1994) cites several studies
and constructs her article around some major factors involved in listening comprehension and
the characteristics of each one of them. The first point of interest Rubin describes is related to
speech and its features. She highlights the importance of speech and how it is conveyed to
allow comprehension and retention of information. Another aspect described in this literature
review is about listeners and how their level of proficiency can affect their listening abilities
along with few studies dealing with working memory, age, and background knowledge. More

14
challenging yet very interesting is language processing during a listening task. At last, and for
the purpose of this study, it is important to mention that in this article, Rubin (1994) stresses
the value of visual support in listening comprehension and cites several studies including her
own in favor of using videos in language classrooms.
Listening Comprehension versus Visual Comprehension
Making reference to Rubin’s article, Hoven (1999) correlates listening comprehension
to visual comprehension and argues that LC and VC are complementary and should both be
incorporated in teaching listening and speaking in L2. Technology has evolved and the use of
visual media will bridge visual comprehension to listening comprehension to help learners
listen to oral input while negotiating meaning from visual cues. She also makes reference to
gestures and body language as a significant part of the visual input learners receive while
listening (Hoven, 1999). For instance, in a study conducted by Driskell and Radke (2003),
which involved eighty participants who were all native speakers of English, the results
showed that albeit the fact that gestures helped speakers produce effective speech, they also
undeniably assisted listeners in perceiving more indicative information to access better
understanding.
The Role of Gestures and Facial Cues in Listening Comprehension
Furthermore, McCafferty (2004) studied the case of a second language learner of
English and videotaped several interactions of a Taiwanese student with a native speaker of
English over a period of 8 months. The results clearly suggested that gestures played a
significant role of mediator in the language learning process (McCafferty, 2004). It is
difficult to ignore the role of gestures and body language and how it serves a communicative

15
function and central role in second language learning. As a matter of fact, Gullberg and
McCafferty (2008) argue that for a long time, the study of gestures fell under the umbrella of
a “paralinguistic mode of interaction, with the paralinguistic label given on the assumption
that gesture is not part of the core meaning of what is rendered linguistically” (Gullberg &
McCafferty, 2008, p. 133). However, based on factual research, a growing number of
language specialists now consider body language as one the most crucial and essential part of
authentic speech (Gullberg & McCafferty, 2008).
Moreover, Sueyoshi and Hardison (2005) urged for the need to investigate further the
role of body language in communication, and called for more studies on gestures and facial
cues as they established a strong correlation between listening comprehension and gestures.
In their study, they compared the scores of 42 language learners during a listening
comprehensions task. First, they videotaped a lecture choosing carefully an unfamiliar topic
in order to eliminate the possibility that the participants may draw meaning from their
background knowledge to answer the comprehension questions. The participants were
randomly assigned to three groups. They all listened to the same oral input in three different
modes of presentation: audio, video showing the speaker talk without using any type of
gestures and video with gestures and facial cues. The results indicated that the group who
watched the video with gestures scored higher than the two other groups. The scores also
showed that the lower level participants benefited the most from gestures and visual cues.
These findings suggest that gestures and facial cues are significantly important in helping
language learners infer meaning from speech, and most importantly, they are crucial for
lower level learners who rely on those cues to attain better comprehension (Sueyoshi &

16
Hardison, 2005). Gestures and body language are very closely related to listening and
language learning. For example, TPR (Total Physical Response) is based on the correlation
between gestures and listening comprehension. The purpose is to be able de understand oral
input and demonstrate comprehension of the direction trough physical response (Nunan,
1999).
Technology in the Language Classroom
From a teacher’s perspective it is crucial to be informed and to be attentive to all
aspects of language acquisition. Becoming aware of the contributing factors and strategies
second language learners rely on during the process of acquiring their L2 are part of teachers’
role and responsibilities towards the students. Learners use strategies to interpret the oral
input they listen to in a classroom (Field, 2008). Defining those strategies is beyond the scope
of this research; however, taking into account the features that may be strategically used by
second language learners in a listening activity is directly related to this study. If research on
body language suggests that gestures and facial cues assist learners in understanding and
making sense of what they hear (Cassell, McNeill, & McCullough, 1998), it would also be
interesting to investigate the use of videos during a listening comprehension activity in the
language classroom from a broader perspective. In 1974, Weston and Friedlander conducted
a study among 247 young children between the ages of five to nine to compare the effect of
using several modes of delivering oral input, and how it would affect children’s
comprehension. The results showed a clear advantage for using videos to aid students’
comprehension while the mode of presentation that had the least impact and scored the
lowest among the three groups was the use of audio input alone without any visual support.

17
The use of technology in a listening comprehension classroom is beyond crucial and goes
back to the invention of the cassette in the 1960s (Sha, 2010).
With the technological evolution, teachers have more tools at hand in today’s world
than they did 40 years ago. Computers have revolutionized many aspects of our lives and
have made a significant contribution to education and language learning. Multimedia learning
environments as described by Jones and Plass (2002) have the potential to assist learners
during listening comprehension activities by adding written text and images to oral input to
create more connections in the learners’ mind to build and retrieve information. For instance,
Hulstijn (2003) compared two major movements in the cognitive science: connectionism and
symbolism to show the link between “the connectionist models of language processing and
listening skills” (Hulstijn, 2003, p. 413). He argued that besides the importance of both types
of language processing that learners need to develop to be able to infer meaning; multimedia
components add to the value of input by allowing dual modes of processing and help learners
connect linguistic features in their minds.
In many aspects, listening comprehension has become strongly tied to technology. For
example, most standardized tests such as the TOEFL have become computerized or at least
offer a computerized version of what used to be the traditional paper based exams. Therefore,
it is safe to think that the listening comprehension component would be the most affected by
the use of technology. Indeed, the listening comprehension section of these tests consists of
visual information along with oral input. It combines still pictures, such as charts and graphs
related to the content, or videos of people interacting in normal settings to introduce
conversations and dialogues for the purpose of the listening comprehension task (Ginther,

18
2002). As a matter of fact, Wagner (2007) argues that the inclusion of non-verbal input in
listening tests serves two functions. Those two functions reside in the fact that they provide
authentic situations in which speech may have occurred. They also help test takers infer
meaning from visual input rather than oral input alone. He argues that since listening in L2
has evolved with technology and since the use of videos in language classrooms has become
more predominant, researchers have established that when oral input is introduced with
visual input, listeners are more likely to infer greater meaning. So hence, the lack of visual
input during a listening task seems to hinder comprehension or at least puts more limitations
on learners’ ability to infer meaning using several sources as it is the case when non-verbal
communication is introduced (Wagner, 2007). From a similar perspective, Ockey (2007)
conducted a research to investigate the effect of Still Image and Video in Computer-Based
Listening Tests. Although, the results of the study did not indicate a significant effect of still
image on listening comprehension in the context of testing, it did not deny the importance of
visuals in listening comprehension. In fact, the results indicated that non-verbal cues are
highly significant and that listeners use non-verbal communication such as “lip movements,
facial gestures, and other body language to construct meaning.”(Ockey, 2007, p. 532).
Another interesting aspect researchers have questioned in second language listening
comprehension is the use of digital stories and their effect on language learners. Verdugo and
Belmonte (2007) obtained significant results supporting the positive effect of digital input
and the use of images to accompany oral input in order to gain comprehension. They
concluded their study with the following suggestion: “lesson plans and didactic guidelines
based on digital content would be very useful for full-time school teachers and instructors.

19
Multimedia content can be integrated with the dynamics of conventional methodologies and
instructional practices.” (Verdugo & Belmomte, 2007, p. 97). On the same note, Grgurovic
and Hegelheimer (2007) made a clear recommendation towards designing materials for
teaching listening comprehension incorporating new technologies and multimedia
components. Their investigation focused on the use of help by language learners in a
listening task and showed that those who used subtitles performed better than those who did
not. However, they also underlined the fact that language learners may benefit from a broader
type of help based on their learning styles (Grgurovic & Hegelheimer, 2007). Given this
insight, it is crucial to highlight that the use of videos during a listening comprehension
activity offers multiple choices. One single help option may not benefit all students at once.
However, using diverse modes of non-verbal cues such as still images, gestures and body
language, and so on may present better results on a long term, if the needs of learners are met
in terms of learning styles. Another important matter is the use of authentic material.
Technology does not exclude the importance of presenting learners with authentic oral input
(Robin, 2007). It helps learners develop listening strategies by inferring meaning using
different channels and associating visual resource to oral input. Seo (2002) studied the effect
of visuals on listening comprehension and the results he obtained revealed that learners who
are presented with visuals during a listening comprehension activity are more likely to use
top-down processing, while those presented with audio input alone tend to rely on their
bottom-up processing (Seo, 2002). This might be highly important for more advanced
students who already have basic knowledge of the target language and need to develop their
listening skills.

20
Of course there are many other studies in second language acquisition that investigated
the role of visual input in listening comprehension. It is quite difficult to include all of them
in this review; however, it appears that there is a consensus about the effectiveness of visual
input and technology in language learning in general and listening comprehension in
particular. Teachers have several options to choose from using videos in language
classrooms. The best way to describe the advantages of technology is to borrow Rost (2007)
words:
One of the very exciting aspects of teaching listening is that so many aspects of
instruction, both classroom instruction and self-access instruction, can be enhanced by
technology. We are now better able to offer learners the most suitable kinds of input
and provide effective forms of presentation and scaffolding. We can isolate, slow
down, and manipulate listening processes in order to provide specific interventions
that will actually help our learners become better – more motivated and more curious–
listeners. (p. 106)
It is quite subsequent that researchers have argued that visual cues play a crucial role
in helping listeners grasp more meaning and attain a better interpretation of what they hear.
Visual comprehension has become inherent to listening comprehension with the development
of technology and visual media (Hoven, 1999). With this in mind, it would be interesting to
investigate the effect of visual comprehension on listening comprehension using three
different modes of oral input.
Audio texts were used for a long time before technology offered other ways to
introduce sound files to listeners in language classrooms. Computers have revolutionized
education as much as they have changed almost every aspect of the modern life. For the
purpose of this study, and in order to investigate the effect of visual input learners may
receive during a listening comprehension task, the same text will be used in three different

21
ways. The “old fashioned” way of oral input as it was introduced in language classrooms in
the mid-1960s (Sha, 2010), in other words, audio text without any visuals. On the other hand,
the same text will be used in combination with visual information. The visual input will be of
course significantly related to the acoustic text for the purpose of a listening comprehension
activity. This visual information should help assist learners in building meaning from what
they see as they listen.
As this literature review suggests, a large body of research in the field of second
language listening comprehension recommends using several means of oral input (Rost, 2007)
in order to improve learners’ abilities. For further investigation on this matter, this study
compares three different means of input in a second language listening and speaking
classroom in order to understand how each mode supports students’ comprehension and recall
abilities.
Research Question
1. In an L2 listening comprehension classroom, does visual support to verbal content
improve or rather hinder learners listening comprehension and recall abilities?

22
Chapter III: Methodology
Participants
All the participants in this study are non-native speakers of English. They come from
different cultural and ethnical backgrounds, and are between the ages of 18 and 25. All
students have had significant instruction in English as a second language, and are considered
advanced language learners. Nevertheless, these students have not passed the proficiency
English test to be fully admitted at a North American university without having to satisfy
specific language requirements in order to develop the areas in which they need to improve.
In this instance, these students are required to take and pass an English speaking and
listening class offered through College ESL. The total number of participants for this study is
33 divided into three groups:
Control group = 10
Experimental group 1 = 9
Experimental group 2 = 14
Materials
In order to answer the research question, a quantitative method was used to measure
the effect of three different types of oral input on students’ comprehension and recall skills.
Students were divided into three groups.
The control group listened to a presentation about the role of social media in
marketing. They listened to the presentation twice, and were directed to write a recall as
detailed and complete as possible about the content of the presentation. The control group did
not benefit from any type of visual support during this task.

23
Experimental group 1 listened to the same presentation twice and students were
instructed to complete the exact same written assignment. This group however, received the
information in a form of a video where the presenter could be seen. The presenter used
noticeable facial cues and gestures while delivering the content of the presentation to
emphasize its content.
Experimental group 2 followed the same instructions. First, listening twice to the
presentation, then, wrote a recall, however, this time, the lecture was in a PowerPoint
presentation format, and text as well as images were projected on the screen for students to
follow along with the listening part.
Needless to say that the voice behind all three presentations was the same. In fact, the
audio from the video presented to Experimental group 1 was used in the control group setting,
and likewise, used to create the PowerPoint for Experimental group 2.
Also, all 3 groups were given the same amount of time to complete the task in
identical classroom settings within the same week.
The text used for this listening activity was retrieved from a website
“www.about.com”, and the main reason for choosing it is that:
- One, it was used in previous semesters in similar classroom settings and has
proven to be effective and at the level of our students,
- The topic is familiar to our learners, as research suggests that background
knowledge is key for L2 learners in any type of language learning activity.
Once collected, the data analysis focused on 2 different aspects:

24
The first part of the analysis, compared the writing samples in each group by scoring
them based on the number of T-Units. A T-unit is a linguistic term first introduce by Hunt
(1965) to describe “each unit that is grammatically capable of being considered a sentence”
(p. 37). For this part of the research, a T-test was run, and we will discuss the result in the
section below.
This study also looked into more specific details, and focused on the number of
examples of people and companies who use social media for their marketing approach who
were mentioned in the presentation. A count of the number of examples students were able to
cite in each group allowed for more specific information about students’ comprehension and
recall abilities based on the type of oral input they received. There was a total of four
examples mentioned in the presentation. A Chi-square test was run for this section of the
study to compare the number of examples cited in each group.

25
Chapter IV: Analysis and Results
A number of statistical tests were run in order to examine the differences between the
three different modes of oral input at two different levels:
First, a T-Test to compare the number of T-units in each group,
Two, Chi-square tests to draw analysis from the number of examples cited by students
in each group, and what significance this may have based on the type of visual support during
the listening task.
T-test
The goal for running this test is to compare the means between groups based on a level
of confidence of 95%. My expectation is that there may be a significant difference in the
means based on the condition for each group. The hypothesis for the T-Test is established as
follows:
Condition 1: Control group vs. Experimental 1:
Ho: C = E1
HA ≠
t = -.436 sig = .668
Table 1
Group Statistics
Group N Mean Std.
Deviation
Std. Error
Mean
Tunits
controlGroup 10 8.30 4.373 1.383
Experimental
1
9 9.11 3.655 1.218

26
Table 2
Independent Samples Test
Levene's Test for Equality of
Variances
t-test for Equality
of Means
F Sig. t df
Tunits
Equal variances
assumed
.253 .622 -.436 17
Equal variances not
assumed
-.440 16.924
Table 3
Independent Samples Test
t-test for Equality of Means
Sig. (2-
tailed)
Mean
Difference
Std. Error
Difference
95% Confidence
Interval of the
Difference
Lower
Tunits
Equal variances
assumed
.668 -.811 1.861 -4.738
Equal variances not
assumed
.665 -.811 1.843 -4.701
Table 4
Independent Samples Test
t-test for Equality of Means
95% Confidence Interval of the Difference
Upper
Tunits Equal variances assumed 3.116
Equal variances not assumed 3.079

27
After running the T-test, the results show no significant difference at the 95%
confidence level between the mean score 8.30 and 9.11
t = -.-.436, sig = .668
Condition 2: Control group vs. Experimental 2:
Ho: C = E2
HA ≠
t = -1.16 sig = .258
Table 5
Group Statistics
Group N Mean Std.
Deviation
Std. Error
Mean
Tunits
controlGroup 10 8.30 4.373 1.383
Experimental
2
14 10.07 3.125 .835
Table 6
Independent Samples Test
Levene's Test for Equality of
Variances
t-test for Equality
of Means
F Sig. t df
Tunits
Equal variances
assumed
.931 .345 -1.160 22
Equal variances not
assumed
-1.097 15.349

28
Table 7
Independent Samples Test
t-test for Equality of Means
Sig. (2-
tailed)
Mean
Difference
Std. Error
Difference
95%
Confidence
Interval of the
Difference
Lower
Tunits
Equal variances
assumed
.258 -1.771 1.526 -4.937
Equal variances not
assumed
.290 -1.771 1.615 -5.208
Table 8
Independent Samples Test
t-test for Equality of Means
95% Confidence Interval of
the Difference
Upper
Tunits Equal variances assumed 1.394
Equal variances not assumed 1.665
After running the T-test, the results show no significant difference at the 95%
confidence level between the mean score 8.30 and 10.07.
t = -.-1.160, sig = .258
Condition 3: Experimental 1 vs. Experimental 2:
Ho: E
HA ≠
t = -1.16 sig = .258
29
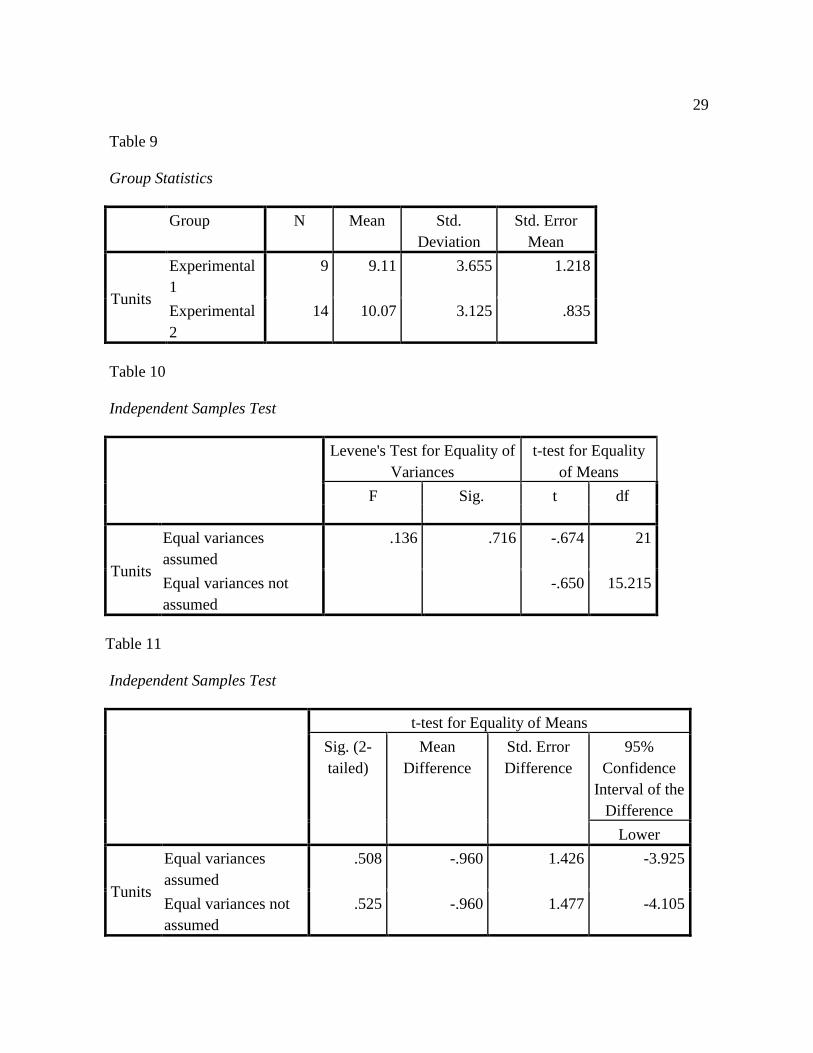
Table 9
Group Statistics
Group N Mean Std.
Deviation
Std. Error
Mean
Tunits
Experimental
1
9 9.11 3.655 1.218
Experimental
2
14 10.07 3.125 .835
Table 10
Independent Samples Test
Levene's Test for Equality of
Variances
t-test for Equality
of Means
F Sig. t df
Tunits
Equal variances
assumed
.136 .716 -.674 21
Equal variances not
assumed
-.650 15.215
Table 11
Independent Samples Test
t-test for Equality of Means
Sig. (2-
tailed)
Mean
Difference
Std. Error
Difference
95%
Confidence
Interval of the
Difference
Lower
Tunits
Equal variances
assumed
.508 -.960 1.426 -3.925
Equal variances not
assumed
.525 -.960 1.477 -4.105
30
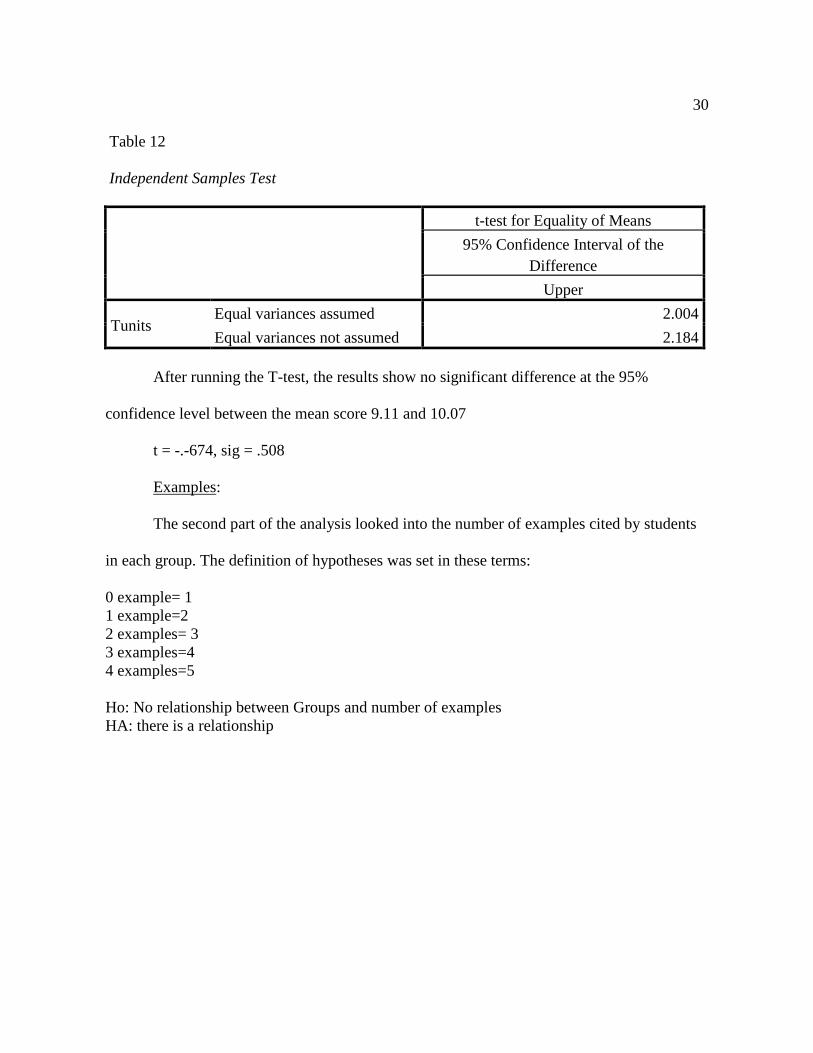
Table 12
Independent Samples Test
t-test for Equality of Means
95% Confidence Interval of the
Difference
Upper
Tunits Equal variances assumed 2.004
Equal variances not assumed 2.184
After running the T-test, the results show no significant difference at the 95%
confidence level between the mean score 9.11 and 10.07
t = -.-674, sig = .508
Examples:
The second part of the analysis looked into the number of examples cited by students
in each group. The definition of hypotheses was set in these terms:
0 example= 1
1 example=2
2 examples= 3
3 examples=4
4 examples=5
Ho: No relationship between Groups and number of examples
HA: there is a relationship

31
Table 13
Case Processing Summary
Cases
Valid Missing Total
N Percent N Percent N Percent
Group *
Examples 33 100.0% 0 0.0% 33 100.0%
Table 14
Group * Example Crosstabulation
Examples
No examples used 1 example 2 examples 3 examples
Group controlGroup Count 3 4 2 1
Expected Count 1.8 2.7 1.5 2.1
% within Group 30.0% 40.0% 20.0% 10.0%
% within Examples 50.0% 44.4% 40.0% 14.3%
% of Total 9.1% 12.1% 6.1% 3.0%
Experimental1 Count 2 2 3 2
Expected Count 1.6 2.5 1.4 1.9
% within Group 22.2% 22.2% 33.3% 22.2%
% within Examples 33.3% 22.2% 60.0% 28.6%
% of Total 6.1% 6.1% 9.1% 6.1%
Experimental2 Count 1 3 0 4
Expected Count 2.5 3.8 2.1 3.0
% within Group 7.1% 21.4% 0.0% 28.6%
% within Examples 16.7% 33.3% 0.0% 57.1%
% of Total 3.0% 9.1% 0.0% 12.1%

32
Total Count 6 9 5 7
Expected Count 6.0 9.0 5.0 7.0
% within Group 18.2% 27.3% 15.2% 21.2%
% within Examples 100.0% 100.0% 100.0% 100.0%
% of Total 18.2% 27.3% 15.2% 21.2%
Table 15
Group * Examples Crosstabulation
Examples
Total 4 or more examples
Group controlGroup Count 0 10
Expected Count 1.8 10.0
% within Group 0.0% 100.0%
% within Examples 0.0% 30.3%
% of Total 0.0% 30.3%
Experimental1 Count 0 9
Expected Count 1.6 9.0
% within Group 0.0% 100.0%
% within Examples 0.0% 27.3%
% of Total 0.0% 27.3%
Experimental2 Count 6 14
Expected Count 2.5 14.0
% within Group 42.9% 100.0%
% within Examples 100.0% 42.4%
% of Total 18.2% 42.4%
Total Count 6 33
Expected Count 6.0 33.0
% within Group 18.2% 100.0%
% within Examples 100.0% 100.0%
% of Total 18.2% 100.0%

33
Table 16
Chi-square Tests
Value df
Asymp. Sig.
(2-sided)
Pearson Chi-Square 15.978a 8 .043
Likelihood Ratio 19.932 8 .011
Linear-by-Linear
Association 8.729 1 .003
N of Valid Cases 33
a. 15 cells (100.0%) have expected count less than 5. The
minimum expected count is 1.36.
After running a Chi-square test, the results indicate that there is a relationship between
the number of examples and the various groups according to each treatment as explained here
below.
X2 = 15.978 sig = .043
At 95% confidence level,
If sig > .05, Ho
If sig ≤ .05, HA
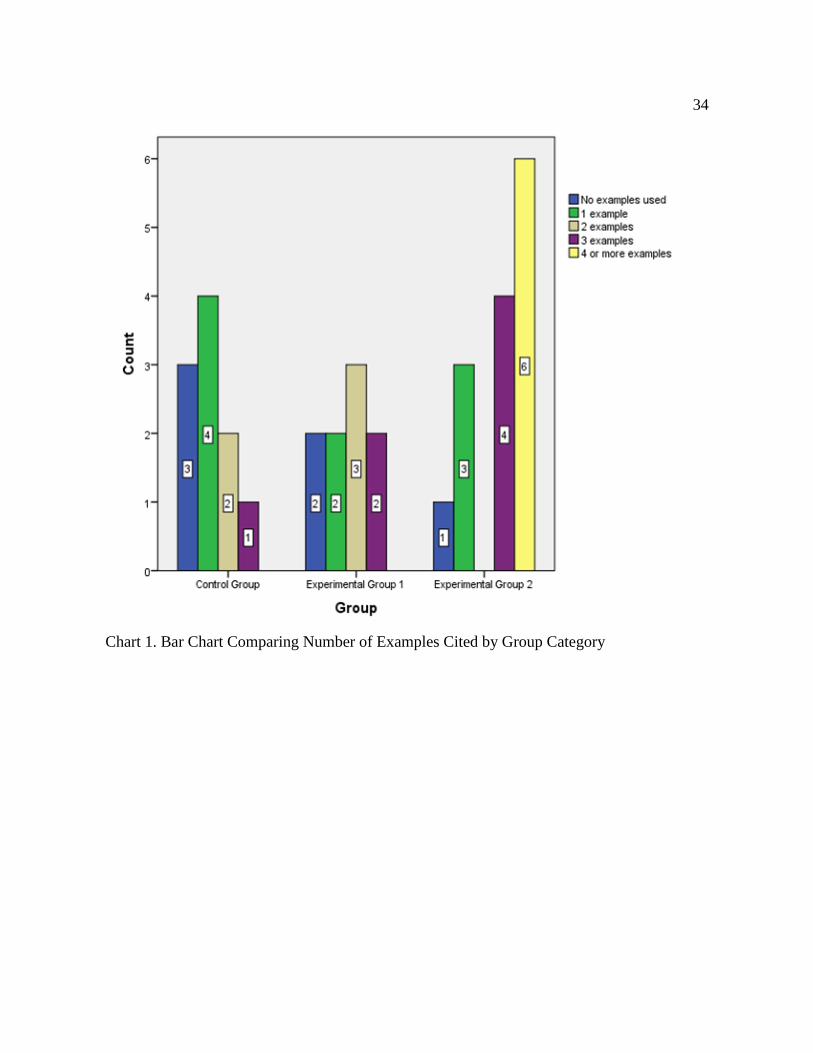
The results not only show a significance of .043, but they also reveal that E2 was the
only group who cited all 4 examples (6 students out of 14). This may have a direct incidence
with the fact that this group benefited from visual images for each example cited.
The results, also indicate that participants in E1 cited between 2 and 3 examples, while
the majority of the participants in the control group only cited 1 example, which accounts for
4 participants while 3 out of 10 participants in the same group cited 0 examples. The Bar chart
below shows these results per group and per number of examples in each group.
34
Chart 1. Bar Chart Comparing Number of Examples Cited by Group Category
35
Chapter V: Discussion
This section reviews the research question, study results, and probable reasons for the
outcomes. The results are then applied to the pedagogical implication for teachers in a
classroom context. Finally, the various limitations of this study are addressed and suggestions
for future research are provided.
Summary of Results
The first part of the analysis of results related to whether or not introducing oral input
using different means would make a significant difference in students’ recall did not indicate
that the use of sole oral input (Control Group), gestures and facial cues (Experimental 1) or
text and images added to the oral content (Experimental 2) had any incidence on the amount
of information students managed to recall. As indicated in the T-tests, at a 95% confidence
level, results showed no significant differences between the mean scores in each group.
For instance, between the control group and experimental group 1, the results showed
no significance with a mean score of 8.30 and 9.11 in table 1, (t = -.436, sig = .668) as shown
in Tables 2. And 3.
The comparison between the control group and experimental 2 in Table 5 had a mean
score of 8.30 and 10.07 (t = -.-1.160, sig = .258) (table 6, 7). Again, there is no significant
difference to mention for this experiment, where the PowerPoint presentation with images and
text did not seem to make a difference in the amount of information students retained and
recalled in their writing assignment compared to their peers who only had voice recording
with no visual input.

36
The data analysis also looked into a comparison of results between both experimental
groups to discuss possible significant differences between these 2 modes, yet at this level,
there were no significant differences in students recall to report either. Table 9 shows a mean
score between the two groups of 9.11 for experimental group 1 and 10.07 for experimental
group 2, (t = -.-674, sig = .508) in tables 10 and 11.
On the other hand, the second analysis showed a significant relationship between the
number of examples cited and the type of oral input for each group. Indeed, there was a total
of four examples mentioned in the presentation of people or companies who use or used social
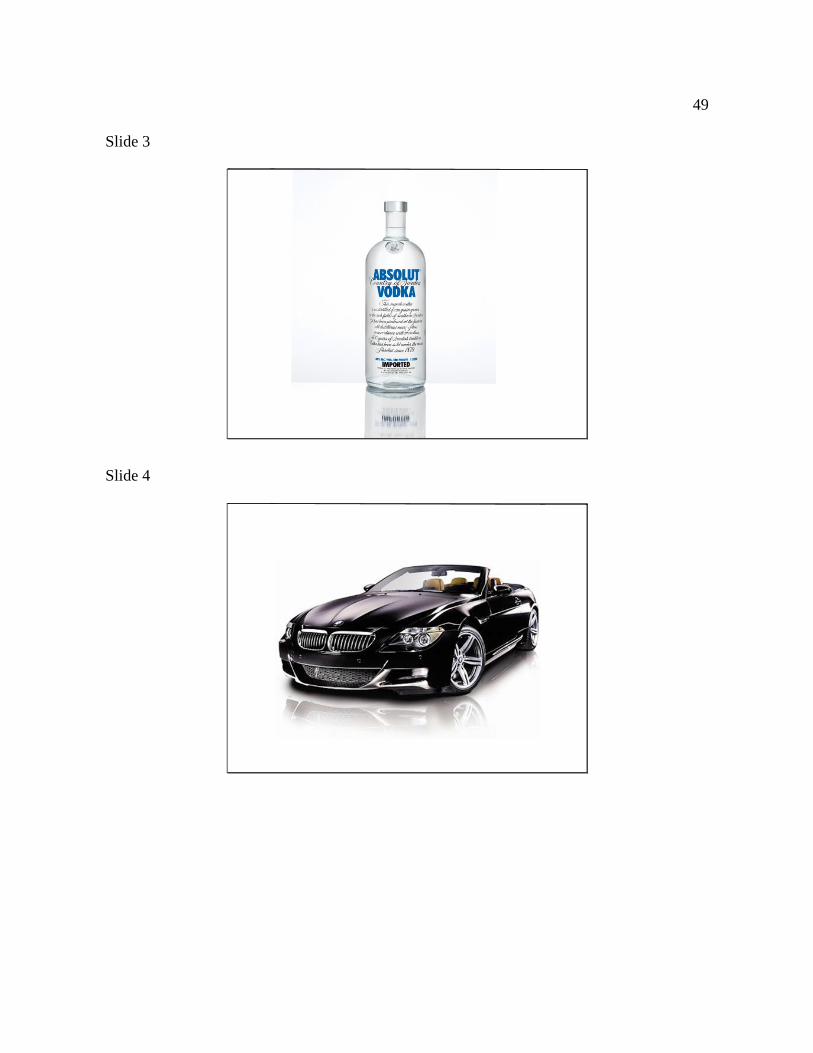
media to promote their image and their business. These examples are: Absolut Vodka, BMW,
Dunkin Donuts, and Barak Obama, in this particular order. In Control Group 2, a directly
related picture to the topic was showed in the PowerPoint presentation when each example
was mentioned. This group seemed to be able to cite the highest number of examples; with 6
participants out of 14 citing all four of them. As a matter of fact, this was the only group
where all four examples were recalled. With a significance of .041 (Table 16), it appears that
adding images to support the oral presentation helped students retain and pay more attention
to specific information they listened to in the classroom. However, in this instance, the text
did not seem to have any significant relevance. Another interesting aspect was the fact that the
example of Barak Obama in the presentation was the example students cited the most across
all groups. The results also indicate the E1, the group who watched the video of the speaker
cited more examples than the control group, yet did not reach the count of all four examples.
These results show a relationship between the outcome and the mode of input, and indicate
that visual support has an incidence on how well students retain information. Furthermore,

37
they indicate that images have the strongest impact on how well students manage to recall
detailed information.
Pedagogical Implications
Second language teachers are always looking for more effective ways to instruct and
help their students acquire strong language skills and advance in their second language
acquisition. In a listening comprehension classroom, teachers often struggle between keeping
students focused on “what they hear” and helping them gain more meaning from what they
hear.
Rubin (1994) stresses the value of visual support in listening comprehension and cites
several studies including her own in favor of using videos in language classrooms. This study
compared three settings in a listening comprehension classroom to analyze the effect of visual
support versus no visual support on students recall abilities. The comparison of visual support
was made at two different levels, one comparing gestures and visual cues and the other
images and text in a PowerPoint presentation. Making reference to Rubin’s article, Hoven
(1999) correlates listening comprehension to visual comprehension and argues that LC and
VC are complementary and should both be incorporated in teaching listening and speaking in
L2. With this in mind, this study did not report significant differences in terms of performance
in the recall process among advanced language learners in either setting, though for
educational purposes, diversifying modes of oral input and supporting it with different types
of visuals does not hinder learners’ comprehension and clearly exposes them to diversified
ways to receive language. Nevertheless, this study strongly suggests that supporting oral input
with pictures is highly recommended. In fact, the results show that students who were given

38
specific examples accompanied with pictures, managed to recall most of those examples. So,
for educational purposes, if teachers want their students to pay specific attention to certain
details, supporting the oral input with a visual is highly recommended.
Limitations
Though the results of this study are encouraging, some limitations are worth
mentioning such as the sample size. Class sizes in College ESL at this Central Minnesota
University is fairly small ranging from 10 to 20 students per class. Although class sizes is
larger during fall semester, spring semester seems to attract less students, so hence the fairly
small number of participants in this study. It would be interesting to replicate this study with a
larger number of participants in each group for more significant results and a better
comparison.
Also, there are some questions on the reliability of the outcome of the Chi-square
Tests because of the violation of the assumption that 15 cells (100.0%) have expected count
less than 5. The minimum expected count is 1.36 (table 16). However, it shows significance
as indicated in Table 15 as the number of examples cited exceeded the number expected per
groups.
Another limitation worth discussing is the use of a video rather than a live presenter in
experimental group 1. Language specialists now consider body language as one the most
crucial and essential part of authentic speech (Gullberg & McCafferty, 2008), the question is
where does a video of a presenter stand in terms of authenticity in comparison with an
individual being physically present in the room? Maybe it is worth considering running

39
similar tests using a live presentation in the classroom with a person using gestures and visual
cues in the presence of students rather than through a videotaped presentation.
Also, in order to have a better understanding of how visual support in a listening
comprehension classroom affects students’ performances, not only would it be judicial to run
similar studies with a larger sample of participants, but also at multiple levels of language
proficiency. This would help identify the role of visual cues and technology among beginners
versus advanced language learners. Gestures and facial cues are significantly important in
helping language learners infer meaning from speech, and most importantly, they are crucial
for lower level learners who rely on those cues to attain better comprehension (Sueyoshi &
Hardison, 2005). This study was conducted among advanced language learners, it would be
interesting to conduct similar research among groups of students who are at a low or
intermediate levels of language proficiency.
Conclusion
This study sought to find how visual cues and technology play a role in listening
comprehension among English second language learners in comparison with delivering
instruction for listening comprehension purposes using oral input alone. Though there are
some limitations that were clearly identified, this study shed some light on the correlation
between the use of images to support oral input when attention to details is needed. In fact,
this study showed that when students receive visual support (images) in a listening
comprehension task, their chances of retaining specific details are greater, even though from a
general aspect of recall of information, there were no significant differences. The attention
was given to details rather than mass information.

40
It is quite subsequent that researchers have argued that visual cues play a crucial role
in helping listeners grasp more meaning and attain a better interpretation of what they hear.
Visual comprehension has become inherent to listening comprehension with the development
of technology and visual media (Hoven, 1999). Listening comprehension does not occur via
oral input alone, but supported by visuals, students seem to retain more information and pay
attention to details they would have missed without the visual support they can receive from
the use of technology in its multiple forms in the language classroom.

41
References
Buttery, T. J. (1980). Listening: A skill analysis. Education, 101(2), 181.
Cassell, J., McNeill, D., & McCullough, K. (1998). Speech-gesture mismatches: Evidence for
one underlying representation of linguistic & nonlinguistic information. Pragmatics &
Cognition, 6(2).
Driskell, J. E., & Radtke, P. H. (2003). The effect of gesture on speech production and
comprehension. Human Factors, 45(3), 445-454.
Field, J. (2008). Listening in the language classroom. Cambridge University.
Finn, C. (1966). The workaholic story. 1st Book Library.
Ginther, A. (2002). Context and content visuals and performance on listening comprehension
stimuli. Language Testing, 19(2), 133-167.
Grgurovic, M., & Hegelheimer, V. (2007). Help options and multimedia listening: Student’s
use of subtitles and the transcript. Language Learning & Technology, 11(1), 45-66.
Gullberg, M., & McCafferty, S. (2008). Introduction to gesture and SLA toward and
integrated approach. Cambridge University Press, 30(02).
Hoven, D. (1999, July). A model for listening and viewing comprehension in multimedia
environments. Language Learning and Technology, 3(1), 88-103.
Hulstijn, J. (2003). Connectionist models of language processing and the training of listening
skills with the aid of multimedia software. Computer Assisted Language Learning,
16(5), 413-425.
Hunt, K. (1965). Grammatical structures written at three grade levels. NCTE Research Report
No. 3. ERIC ED113735.

42
Jones, L., & Plass, J. (2002). Supporting listening comprehension and vocabulary acquisition
in French with multimedia annotations. The Modern Language Journal, 86, 546-561.
Lake, L. (n.d.). Understanding the role of social media in marketing. Retrieved from
http://marketing.about.com/od/strategytutorials/a/socialmediamktg.htm.
McCafferty, S. G. (2004). Space for cognition: gesture and second language learning.
International Journal of Applied Linguistics, 14(1), 148-165. doi:10.1111/j.1473-
4192.2004.00057.x
Nunan, D. (1999). Second language teaching & learning. Boston: Heinle & Heinle
Publishers.
Ockey, G. (2007). Construct implications of including still image or video in computer-based
listening tests. Language Testing, 24(4), 517-537.
Robin, R. (2007). Commentary: Learner-based listening and technological authenticity.
Language Learning & Technology, 11(1), 109-115.
Rost, M. (2007). Commentary: I’m only trying to help. Language Learning & Technology,
11(1), 102-108.
Rubin, J. (1994). A review of second language listening comprehension research. The Modern
Language Journal, 78(2), 199-221.
Seo, K. (2002). Research note: The effect of visuals on listening comprehension.
International Journal of Listening, 16, 57-81.
Sha, G. (2010). Using tts voices to develop audio materials for listening comprehension: A
digital approach. British Journal of Educational Technology, 41(4), 632-641.

43
Sueyoshi, A., & Hardison, D. (2005). The role of gestures and facial cues in second language
listening comprehension. Language Learning, 55(4), 661-699.
Verdugo, D., & Belmonte, I. (2007). Using digital stories to improve listening comprehension
with Spanish young learners of English. Language Learning & Technology, 11(1), 87-
101.
Wagner, E. (2007). Are they watching?: Test-taker viewing behavior during an l video
listening test. Language Learning & Technology, 11(1), 67-86.
Westone, H., & Friedlander, B. (1974). The effect of live, tv, and audio story narration on
primary grade children's listening comprehension. The Journal of Educational
Research, 68(1), 32-35.

44
Appendix A: Informed Consent Letter
Title: The effect of Gesture and Body Language in Listening Comprehension
You are invited to participate in a research study to investigate listening comprehension in
second language acquisition. You were selected as a possible participant because you are a
member of the ESL learners’ community within this university, and you are enrolled in a
listening and speaking course.
This research project is being conducted by:
Soraya Folley, to satisfy the requirements of a Master’s Degree in Teaching English as a
Second Language at St. Cloud State University.
Background Information and Purpose
The purpose of this study is to learn more about listening comprehension among second
language learners. Technology has influenced the traditional way of teaching listening
comprehension. This study will investigate the effect of technology in the language classroom
and how it can be used in a listening comprehension activity.
Procedures
If you decide to participate, you will be asked to complete a listening comprehension test after
listening to a lecture twice. This will reflect your listening and comprehension skills in your
second language.
Risks
There will be minimal risks involved for you in this study. Although your name will be kept
confidential, there is always a slight possibility for your name or personal information to be
revealed. However, the results will not affect your grade by any mean, nor will they affect
your rapport with your teacher or the person conducting this research project.
Benefits
This study will allow us to learn more about listening comprehension, in which case, it will
give teachers more insight on how to help more efficiently language learners. The more tools
teachers may use to benefit language learners, the better they can serve them.
Confidentiality
The confidentiality of the information gathered during your participation in this study will be
maintained. Your personal identity will remain confidential. You will not be identified by
your name in any published material. You will be given a code number and referred to by that
code only. All data will be kept confidential, until the completion of this project. Afterwards,
all data will be destroyed and the only way to refer to it will be the final version of this
project, the Thesis.

45
Research Results
Upon completion, my thesis will be placed on file at St. Cloud State University’s Learning
Resources Center. At your request, I will be happy to provide a summary of the research
results when the study is completed.
Voluntary Participation/Withdrawal
Your participation in this study is voluntary. You may decide not to participate or to withdraw
your consent to participate in this study at any time, for any reason, without penalty. Your
decision whether or not to participate will not affect your current or future relations with St.
Cloud State University, or the researcher.
The study investigator may stop your participation at any time without your consent for the
following reasons: if you fail to follow directions for participating in the study, or for reasons
deemed appropriate by the research to maintain the integrity of the study.
I have read all of the information on this consent form and received satisfactory answers to
my questions. I will give my consent to participate in this study.
Subject Signature______________________________________________________
Date_________________________________________________________________

46
Appendix B: Text Used as Oral Presentation
“Understanding the Role of Social Media in Marketing
By Laura Lake, About.com Guide
What is social media and what role does it play in my marketing? This is probably a
question I wouldn't have received two years ago, but yet today it's the most common question
that enters my inbox.
First off, let's talk about what social media is. Social media represents low-cost tools
that are used to combine technology and social interaction with the use of words. These tools
are typically internet or mobile based. A few that you have probably heard of include Twitter,
Facebook, MySpace and YouTube.
Social media gives marketers a voice and a way to communicate with peers, customers
and potential consumers. It personalizes the "brand" and helps you to spread your message in
a relaxed and conversational way.
The downfall to social media, if you could call it that is that it must be a part of your
everyday life in order to keep the momentum and attention you need for it to be successful.
If you think that social media is only for the small business owners that are trying out an
experiment, I have to correct you. Here are just a few companies that have become involved
in social media:
Absolut Vodka - Online Video on YouTube and Using Facebook to house their Top
Bartender fan page.
BMW - Utilizing Facebook to promote their 1-Series Road Trip and they have created
a Rampenfest Page for fans.
Dunkin Donuts - That's right they've found value in social media and have set up a
microblogging Twitter account.
Barack Obama - In my examples, I can't leave out future President Barack Obama. He
has been seen as a leader in the use of Twitter during the Presidential Election. He has over
170,000 followers and is following over 165,000. Personally I remember the "twitter buzz"
during the Presidential Debates as well as the election.
As you can see we have adult beverage companies, exotic automobile manufacturers,
pastry shops and our future President using social media tool, it's not too hard to figure out
that there is something to it.
What role should it play in your marketing? As most of you know my view of
marketing is it's a tool we use to inform consumers about our products, who we are and what
we offer. Social media does that. Here is how:
We can use social media to provide an identity to who we are and the products or
services that we offer.
We can create relationships using social media with people who might not otherwise
know about our products or service or what our companies represent.
Social media makes us "real" to consumers. If you want people to follow you don't just
talk about the latest product news, but share your personality with them.
We can use social media to associate ourselves with our peers that may be serving the
same target market.

47
We can use social media to communicate and provide the interaction that consumers
look for.
As you can see social media carries with it a lot of value, but how do you do it right?
You cannot just depend on social media, you must integrate it with other vehicles of
marketing. While social media will create awareness, I'm not convinced that in the beginning
it will sell a million dollars worth of product. That's not to say that one day once you've built
up your social media "stardom" that it won't, but it probably won't happen tomorrow.
Be yourself, reflect personality. There are no written "right" or "wrong" rules when it
comes to social media, only you can determine what will work for you.
Be consistent, if you do not plan on being consistent don't do it at all - it's a waste of
everyone's time.
Success stories are abundant when it comes using social media from headhunters that
find job applicants to new businesses that want to introduce a new product as well as already
established Fortune 500 companies that want to strengthen their brand. The role of social
media in your marketing is to use it as a communication tool that makes you accessible to
those interested in your product and makes you visible to those that don't know your product.
Use it as a tool that creates a personality behind your brand and creates relationships that
you otherwise may never gain. This creates not only repeat-buyers, but customer loyalty. Fact
is social media is so diversified that it can be used in whatever way best suits the interest and
the needs of your business”.

48
Appendix C: PowerPoint Used in Experimental 2
Slide 1
Understanding the Role of Social Media in Marketing
By Laura Lake
About.com Guide
Slide 2
Social Media
49
Slide 3
Slide 4

50
Slide 5
Slide 6

51
Slide 7
How Social Media Works for Marketing
• Establishes company’s identity
• Creates relationships with potential customers
• Shares the company’s personality with customers
• Allows companies to associate with peers
• Allows companies to interact with consumers
Slide 8
How to Do Social Media Right
• Integrate social media with other marketing methods
• Be yourself, reflect personality
• Be consistent

52
Appendix D: Directions
Directions for participants:
Recall
You will listen twice to a presentation about “Understanding the Role of Social Media in
Marketing.
Pay attention and do not take notes while listening.
You will have 25 minutes to write a recall. This is not a summary. This means that you need
to write as much information as you remember from the presentation, and as many details as
possible.
When you finish, please wait for everyone else to finish as well. If you remember more details
after you thought you were done, and wish to add that information, feel free to do so until the
time is up.
I will not collect your papers until 25 minutes from now.
You may start now.