the effect of variations of crack geometry on the stress ... · the effect of variations of crack...
TRANSCRIPT

1
The Effect of Variations of Crack Geometry on the Stress
Concentration Factor in a Thin Plate
Using Finite Element Method
Mxolisi L. MBANDEZI1, Raymond B. MABUZA
1,
1Department of Non Destructive Testing and Physics,
Vaal University of Technology, Vanderbijlpark, South Africa
Phone: +27 16 950 9824, Fax: +27 866516744,[email protected], [email protected]
Abstract
The study is a preliminary effort which investigates the effect of variations of crack geometry
on the stress concentration factor on a simple thin plate subjected to a constant, uniform, uni-
axial tensile load. The geometry of the central crack is varied to produce rectangular models
ranging from circular, elliptical to sharp cracks. Due to symmetry, the models are reduced to
quarter symmetric, meshed and refined at the edges of the cracks for clearer, detailed analysis
and solution accuracy. Finally, a uniform pressure is applied at the top and the model is
constrained with symmetric boundary conditions at the left and bottom. These numerical
results are compared to those obtained from analytic fracture mechanics procedures and are
found to be consistent.
Keywords: crack geometry, finite element method, crack propagation, stress concentration factor.
1. Introduction
Non-destructive testing (NDT) is mainly used as a diagnostic tool to test complex engineering
components and structures to locate, size and characterize defects in engineering components
and structures. It is very important for the preventive maintenance, failure analysis, and post-
treatment of damages [1, 2]. However, there is a need to determine whether NDT will be able
to give the correct information on the defectiveness of a component and structure [2]. This
prior information regarding the defective components and structures creates an appropriate
platform for structural integrity assessment, obtained through the implementation of fracture
mechanics approach. Fracture mechanics approach can be used as a quantitative failure
analysis tool for predicting the propagation and the failure of the surface of a component or
structure with a pre-existing crack [3]. Failures in engineering components and structures
begin with cracks caused either by material cracks, discontinuities in geometry or damages in
whilst in operation [4]. The presence of these cracks severely impact on the structural
integrity of a component or structure in service [3].
Crack free materials do not exist, cracks are everywhere, and they initiate and propagate from
the locations of stress and strain concentration factors [4].
Prior to the advent of the appropriate of mathematical models for computation, the effect of
simple and complex stress geometries was investigated experimentally and analytically, and
the large number of charts which are currently available were developed from these
18th World Conference on Nondestructive Testing, 16-20 April 2012, Durban, South Africa

2
experimental results [5]. For example, Inglis [6] used the theory of elasticity and analytically
determined the stress concentration factor for a thin infinitely large plate subjected to bi-
axially tensile loading. He concluded that the major applied stress field disturbances occur at
the crack boundary and the largest stress gradients are seen localized around regions of
maximum stress. He further concluded that the only geometric factor which had a remarkable
impact on the stress concentration factor were the ones with highly curved regions [6].
Broek’s [7], experiments with plates and holes showed that for thin plates the crack originates
at the corner where the holes joins the free surface of the plate or at the centre of the plate.
Sobey [8] computed the stress concentration factors for unreinforced rounded rectangular
slots and square holes in infinite sheets subjected to tension or shear loading using the
complex variable methods from Muskelishvili [9], and presented comprehensive charts from
which maximum stress for any type of rounded practical holes can be interpolated.
However, with the recent advances in computer technology, hardware, software and
numerical methods; such as finite element, finite difference and boundary integral equation
methods, computational models and schemes were developed and improved to characterize
materials to analyse the design of complex engineering systems [1, 10].
Jain and Mittal [11] used the finite element commercial package, ANSYS to analyse the effect
of the ratio of the diameter D and the width W of the hole on the stress concentration factor
and the deformation of an isotropic, orthotropic laminated composite plate subjected to
various transverse static loading conditions. They found, that the peak stress concentration
factor occurs on the boundary of the hole and that the stress concentration factor was also
strongly influenced by the uniformly distributed normal and equivalent stresses.
1.2 Rationale
This study, first and foremost applies quantitative numerical finite element method to
investigate the variation of circular centre crack geometry in a rectangular thin, isotropic steel plate. Finite element method provides approximate solution to many science and engineering
problems. It has the capability and flexibility of handling diverse problems with complex geometry’s as compared to traditional experimental and analytic fracture mechanics
procedures which rely heavily on major simplification assumptions which may lead to unrealistic results [12].
Secondly, this work derives its motivation from the original analytic work done on plane
stress and stress concentration factor by Inglis [6] using the radius of curvature method.
Thirdly, two dimensional finite element models are easier to develop, and easier to solve and
can be applied in a wide variety of practical situations, and the behaviour of the component is
represented realistically under loading [5].
Fourthly, the stress concentrations around holes have a great practical importance because
they are normally the cause of failure. Finite element analyses of holes are imperative because
the holes are used in engineering components and structures for bolts, rivets etc., and we need
to know the stresses and the deformation which occur near them [5,11].
3
Finally, reliable information about the structural deformation, distribution of stresses and
stress concentration factors is needed to design plates with holes [5, 11].
2. Finite Element method and Model Setup
The finite element method has the advantage of coupling results from NDT with fracture
mechanics. This coupling analysis extracts data from NDT, and changes it accurately to
resemble the characteristics of the test components and input it into the finite element model.
The finite element analysis predicts the performance of the component in the service
environment. This permits the development of a predicted margin of safety, which is a
quantitative measure of the component acceptance criteria [1].
Finite element method possesses the flexibility of discretizing problems with complex
geometries, or in which media is heterogeneous or anisotropic and it is capable of providing
solutions throughout the problem domain [1, 12].
2.1 Model Setup
2.1.1 Model type
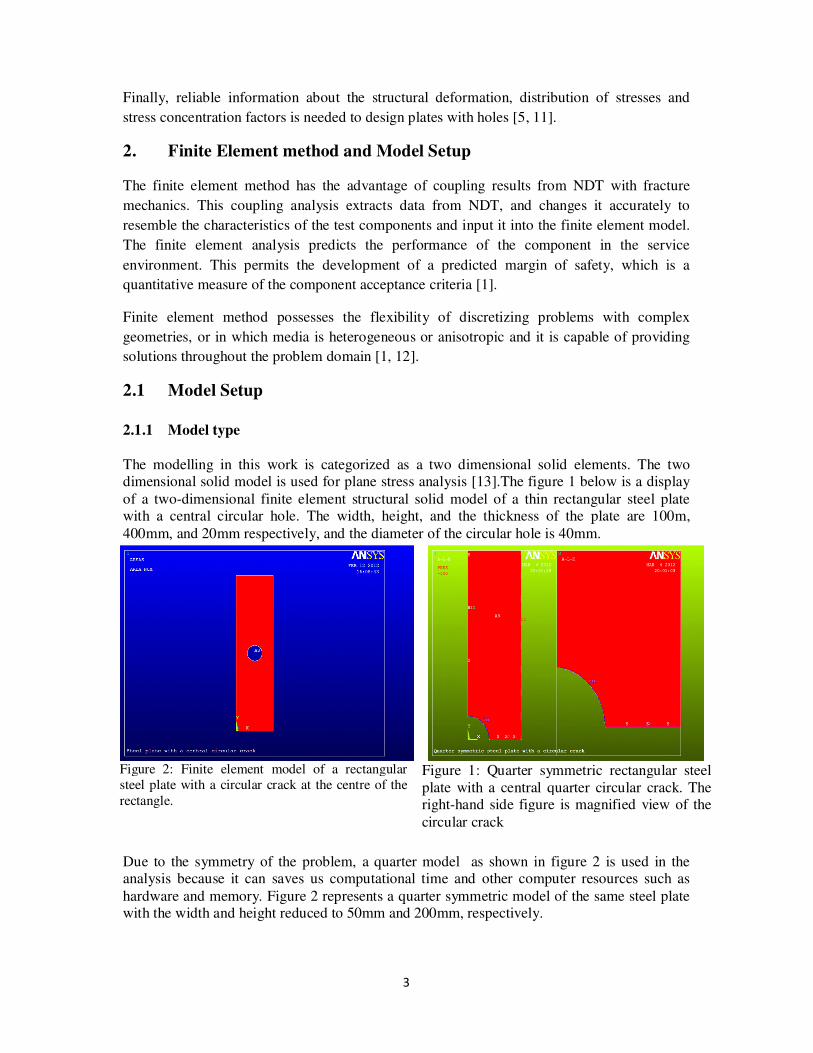
The modelling in this work is categorized as a two dimensional solid elements. The two dimensional solid model is used for plane stress analysis [13].The figure 1 below is a display
of a two-dimensional finite element structural solid model of a thin rectangular steel plate with a central circular hole. The width, height, and the thickness of the plate are 100m,
400mm, and 20mm respectively, and the diameter of the circular hole is 40mm.
Due to the symmetry of the problem, a quarter model as shown in figure 2 is used in the analysis because it can saves us computational time and other computer resources such as
hardware and memory. Figure 2 represents a quarter symmetric model of the same steel plate with the width and height reduced to 50mm and 200mm, respectively.
Figure 2: Finite element model of a rectangular
steel plate with a circular crack at the centre of the
rectangle.
Figure 1: Quarter symmetric rectangular steel
plate with a central quarter circular crack. The right-hand side figure is magnified view of the
circular crack
4
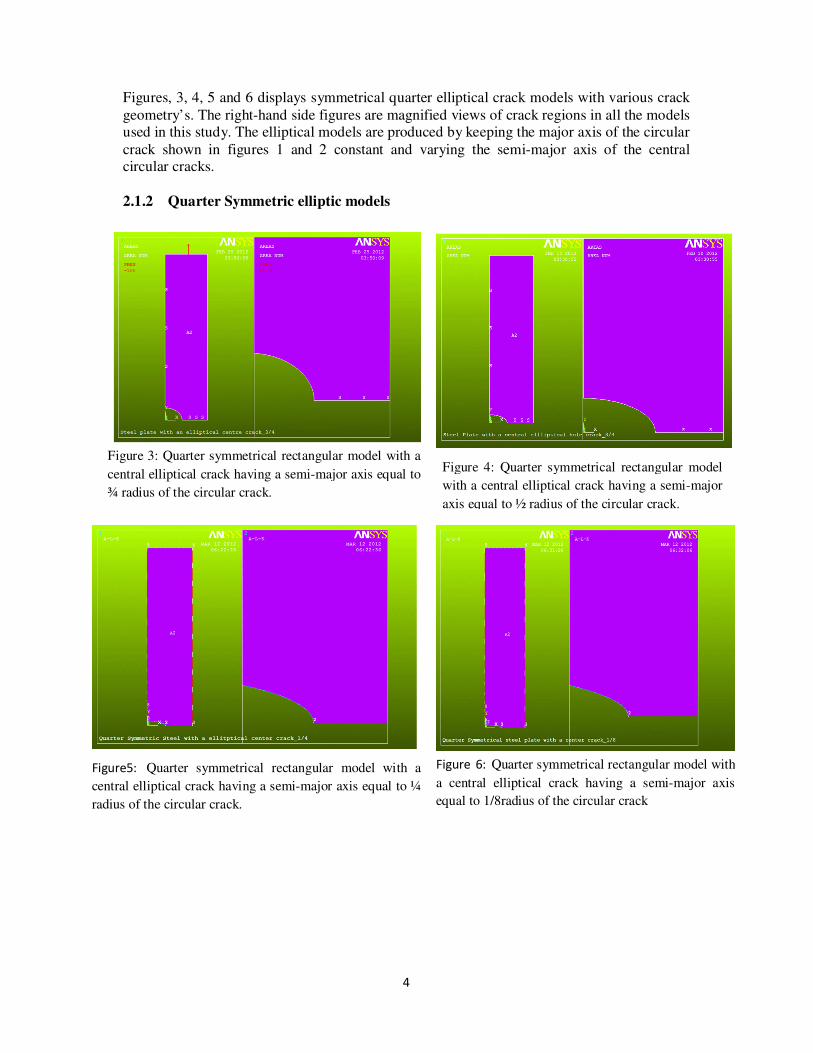
Figures, 3, 4, 5 and 6 displays symmetrical quarter elliptical crack models with various crack
geometry’s. The right-hand side figures are magnified views of crack regions in all the models used in this study. The elliptical models are produced by keeping the major axis of the circular
crack shown in figures 1 and 2 constant and varying the semi-major axis of the central circular cracks.
2.1.2 Quarter Symmetric elliptic models
Figure 4: Quarter symmetrical rectangular model
with a central elliptical crack having a semi-major
axis equal to ½ radius of the circular crack.
Figure 3: Quarter symmetrical rectangular model with a
central elliptical crack having a semi-major axis equal to
¾ radius of the circular crack.
Figure5: Quarter symmetrical rectangular model with a
central elliptical crack having a semi-major axis equal to ¼
radius of the circular crack.
Figure 6: Quarter symmetrical rectangular model with
a central elliptical crack having a semi-major axis
equal to 1/8radius of the circular crack

5
2.1.3 Material properties
The thin steel plate with a centre hole used in this study was modelled as a static, solid,
structural, linear and isotropic material model. The material models had the following
material properties as input parameters [13].
Young’s modulus ( )E Poisson ratio ( )υ
1107.2 E 0.3
The element behaviour is a plane stress with thickness.
2.1.4 Element types
Crack meshes usually use 8-node quadratic elements for two problems. The figures 7 and 8
shown below represents the 8 node-quadrilateral and the six-node element types used to
model the two-dimensional static plane stress problem.
Figure 7 above, is extracted from Anderson [10] to serve as an illustration of a representation
of an 8-node; quadrilateral type. A degenerate six node triangular element is constructed from
an 8-noded quadrilateral element type by collapsing nodes 1, 4, and 8. These element types
have an orderly arrangement of displacement shapes which make them appropriate for
modelling curved boundaries [5, 13].
2.2 Mesh generation
The production of a finite element mesh during modelling is one of the uttermost challenging
tasks [10]. Recently; most finite element codes in the modelling market are capable of
Figure 7: Shows 8-node quadrilateral element. This
picture is taken from Anderson [10].The mid-side
nodes are moved to quarter points.
Figure 8: Represents a triangular element
with mid-side nodes collapsed to quarter
points [10].

6
producing automatic meshes [10]. The art of designing a suitable finite element mesh still
needs constant human intervention, especially to problem associated with cracks [10.15].
2.2.1 Mesh and mesh refinement
The creation of meshing in finite element models is the most important step in the entire
analysis since the decision made at this point will affect the accuracy and the economy of the
solid model. Figure 9 shows a meshed model of a quarter symmetric rectangular plates. The
meshing was manually setup manually by picking up lines and discretizing them, and finally
an automatic free mesh was applied to the entire the model. The latter meshing method is
similar to the one done by [14] except that the numbers of division for the lines were doubled
to produce more elements. The spider web configuration as shown in figure 10 was also
produced in the same manner as in [14].
The figure 9 shows a spider web configuration which is produced from the collapse of an 8
node quadrilateral into a six-node degenerate triangular element [13]. A well-constructed
mesh consists of quadrilateral elements near the crack-tip, a search algorithm using the
connectivity matrix results into regular, concentric integration domains for evaluating the J-
integral [10,15]. Figure 10 shows the same spider web configuration produced using Ansys
Figure 10: Spider web design at the crack tip produced from
Ansys educational version 10.0
Figure 9: Shows the collapse of quadrilateral
element type and triangular element into a spider
web design. Taken from Anderson [10].

7
Figure 12: Shows a mesh refined quarter symmetric model. The meshed model
shows more refinement at the crack tip and the edges of the circular crack.
Figure 11: Shows a meshed quarter symmetric rectangular model with a quarter circular
crack at the centre.
educational version 10.0. The spider web configuration are illustrations of meshes which
need large amount of mesh refinement at the crack tips and such meshes are known as
focused meshes. Focussed meshes are good for non-moving cracks [10].
The spider web configuration shown in figure 10 above was produced by concentrating the
key points and dividing the crack-length with 8 for number of elements around the circular
circumference and the mid-side position was skewed to ¼ point. For example, the skewing to
¼ point is shown in figures in 7 and 8 above. Figure 10, indicates a refined meshed model of
the model shown in figure 9. The meshed is refined, particularly, at the areas of the interest,

8
that is, at the crack tips and the edges of the crack because these are the most important region
to model in fracture mechanics [16].
Figures 11 and 12 serves as an illustration of the meshing procedure which was done to all of
the models used in this study.
2.3 Loads and Boundary conditions
The figure 13 shows a uniform and constant a uni-axial tensile load of 100MPa applied to the
top of the rectangular model. This is indicated with the arrow labelled 1. The model was
further constraint at the left and the bottom edges with zero structural displacement symmetric
boundary conditions. The arrow label 2 as shown in the figure 13 indicates the zero
displacement boundary conditions. This condition is also shown in the figure by smalls
yellow to green arrows.
The red arrows at the bottom of the rectangular model show the symmetric arrangement of the
tensile loads at the edge of the crack. The same the procedure for loads and boundary
conditions was performed to all the other models used in the study. Finally, all these finite
element models were solved. .
2 1
Figure 13: Shows a model of a quarter symmetrical rectangular steel with a quarter
elliptical crack with uni-axial tensile load of 100MPa. Fixed boundary conditions
applied at the left edge and the edge of the elliptical crack.

9
3. Results and Discussions
3.1 Nodal Stress distribution in the y-direction Sy: for circular crack model
The results shown in figure 14 depict the normal stress distribution contours in the y-direction
before mesh refinement. The red colours at the crack tip indicate the maximum normal stress
distribution and the dark blue minimum stress. The value for the computed maximum normal
stress is MPa739.411 . However, figure 15 shows that the value of the maximum stress
contour drops to MPa588.373 after mesh refinement. The difference in maximum stress
normal is about 9 percent.
The numerical values for the maximum normal stress determined in this study are compared
to the experimental work done by [17] on the rectangular plate with a central hole. The
formula below indicate the following normal stress are compared with calculations done using
experimental data derived from the method the ratio of the average stress avσ is
net
avA
F=σ
Where, F is the applied load, and netA is the net cross-sectional area of rectangular plate.
The above equation is re-written in the following manner
( )tdW
Fav
−=σ
where,W is the width of the rectangular plate and d is the diameter of the centre hole and t is
the thickness of the plate. Hence the application of the above equation to the present works
leads to:
( ) mmm
Fav
02.0*02.005.0 −=σ
Figure 15: The stress distribution of a quarter
symmetrical rectangular steel plates with centre
circular crack after mesh refinement
Figure 14: The stress distribution of a quarter
symmetrical rectangular steel plates with centre
circular crack before mesh refinement
10
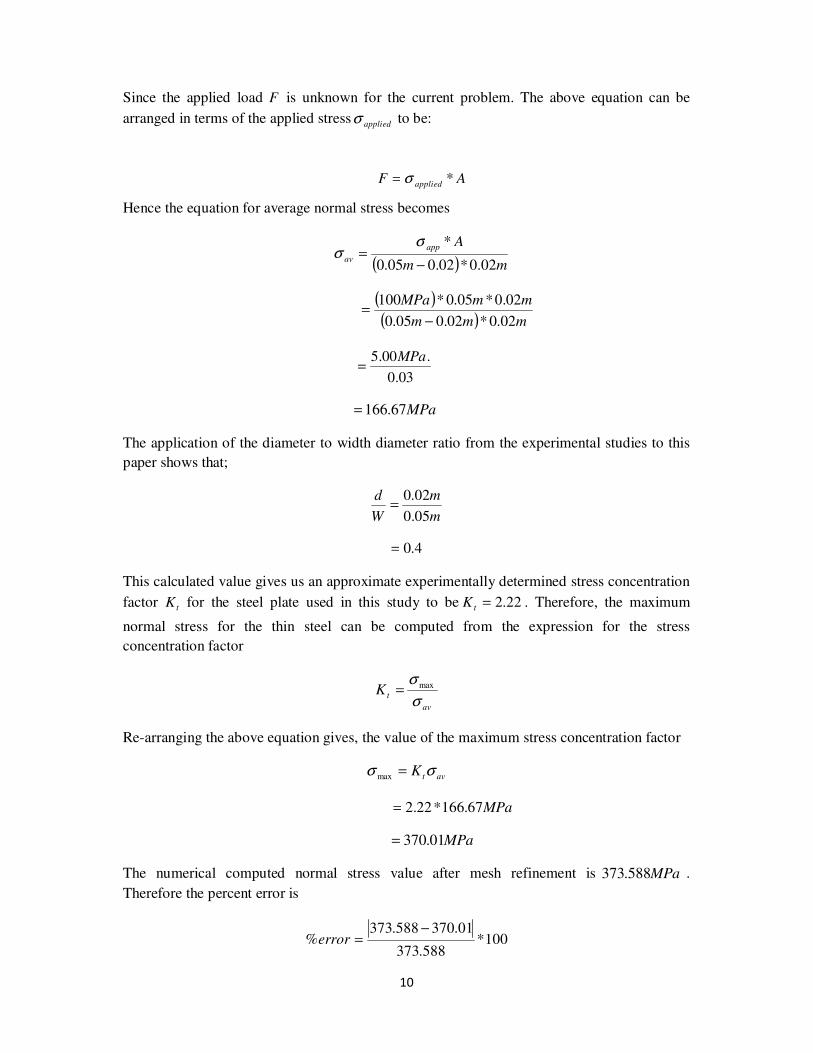
Since the applied load F is unknown for the current problem. The above equation can be
arranged in terms of the applied stress appliedσ to be:
Hence the equation for average normal stress becomes
( ) mm
Aapp
av02.0*02.005.0
*
−=
σσ
( )
( ) mmm
mmMPa
02.0*02.005.0
02.0*05.0*100
−=
03.0
.00.5 MPa=
MPa67.166=
The application of the diameter to width diameter ratio from the experimental studies to this
paper shows that;
m
m
W
d
05.0
02.0=
4.0=
This calculated value gives us an approximate experimentally determined stress concentration
factor tK for the steel plate used in this study to be 22.2=tK . Therefore, the maximum
normal stress for the thin steel can be computed from the expression for the stress
concentration factor
av
tKσ
σ max=
Re-arranging the above equation gives, the value of the maximum stress concentration factor
avtK σσ =max
MPa67.166*22.2=
MPa01.370=
The numerical computed normal stress value after mesh refinement is MPa588.373 .
Therefore the percent error is
100*588.373
01.370588.373%
−=error
AFapplied
*σ=

11
100*588.373
01.370588.373%
−=error
%95.0=
%0.1≈
This means that the normal maximum stress calculated using the finite element method is
99% accurate to the expected value. The result before mesh refinement is found to have %10
error, which means that the computed stress was out of range by a factor ten.
3.2 Nodal Stress distribution in the y-direction Sy: for elliptical crack model
Figure 16: The stress distribution contours of a
quarter symmetrical rectangular steel plate with
an elliptical centre crack before mesh refinement.
The semi-major axis is reduced to 3/4 the radius
of the circular crack.
Figure 17: The stress distribution contours of a
quarter symmetrical rectangular steel plate with
an elliptical centre crack after mesh refinement.
The semi-major axis is reduced to ¾ the radius of
the circular crack

12
Figure18: The stress distribution contours of a
quarter symmetrical rectangular steel plate with an
elliptical centre crack before mesh refinement. The
semi-major axis is reduced to ½ the radius of the
circular crack.
Figure 19: The stress distribution contours of a quarter
symmetrical rectangular steel plate with an elliptical
centre crack after mesh refinement. The semi-major
axis is reduced to ½ the radius of the circular crack.
Figure 21: The stress distribution contours of a
quarter symmetrical rectangular steel plate with an
elliptical centre crack after mesh refinement. The
semi-major axis is reduced to ¼ the radius of the
circular crack.
Figure 20: The stress distribution contours of a quarter
symmetrical rectangular steel plate with an elliptical
centre crack before mesh refinement. The semi-major
axis is reduced to ¼ the radius of the circular crack.
13
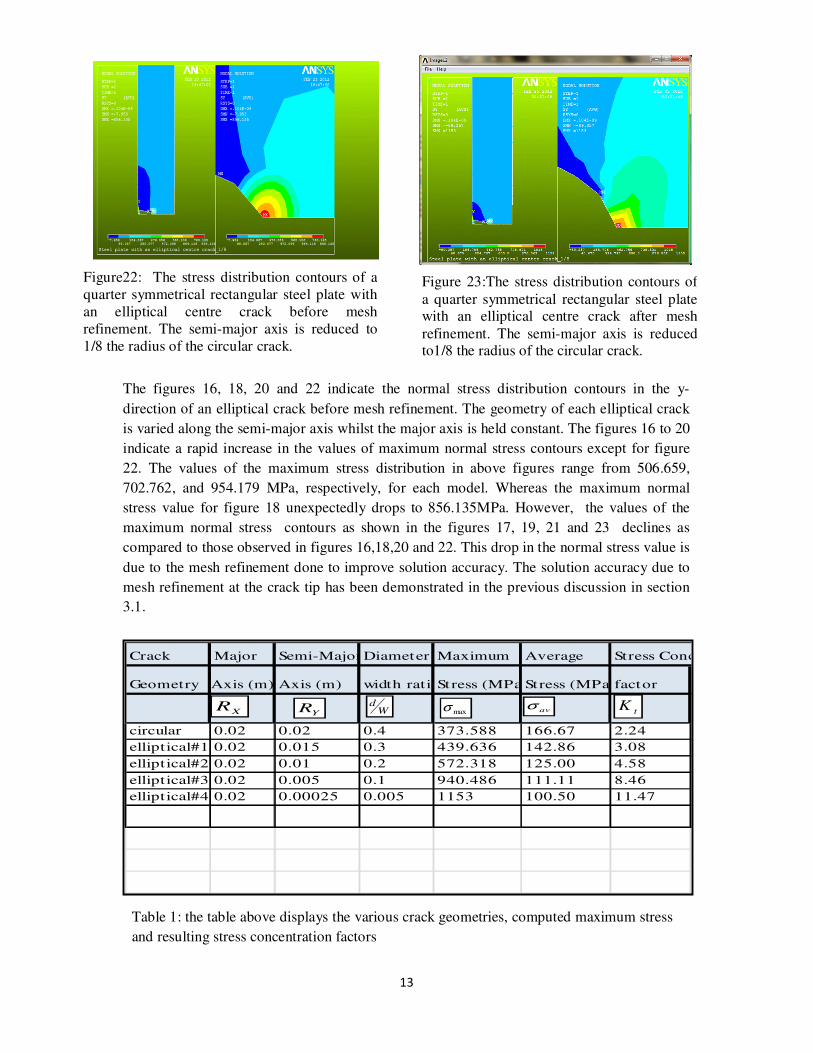
The figures 16, 18, 20 and 22 indicate the normal stress distribution contours in the y-
direction of an elliptical crack before mesh refinement. The geometry of each elliptical crack
is varied along the semi-major axis whilst the major axis is held constant. The figures 16 to 20
indicate a rapid increase in the values of maximum normal stress contours except for figure
22. The values of the maximum stress distribution in above figures range from 506.659,
702.762, and 954.179 MPa, respectively, for each model. Whereas the maximum normal
stress value for figure 18 unexpectedly drops to 856.135MPa. However, the values of the
maximum normal stress contours as shown in the figures 17, 19, 21 and 23 declines as
compared to those observed in figures 16,18,20 and 22. This drop in the normal stress value is
due to the mesh refinement done to improve solution accuracy. The solution accuracy due to
mesh refinement at the crack tip has been demonstrated in the previous discussion in section
3.1.
Figure22: The stress distribution contours of a
quarter symmetrical rectangular steel plate with
an elliptical centre crack before mesh
refinement. The semi-major axis is reduced to
1/8 the radius of the circular crack.
Figure 23:The stress distribution contours of
a quarter symmetrical rectangular steel plate
with an elliptical centre crack after mesh
refinement. The semi-major axis is reduced
to1/8 the radius of the circular crack.
Table 1: the table above displays the various crack geometries, computed maximum stress
and resulting stress concentration factors
Crack Major Semi-MajorDiameter to Maximum Average Stress Conc
Geometry Axis (m) Axis (m) width ratioStress (MPa)Stress (MPa)factor
circular 0.02 0.02 0.4 373.588 166.67 2.24
elliptical#1 0.02 0.015 0.3 439.636 142.86 3.08
elliptical#2 0.02 0.01 0.2 572.318 125.00 4.58
elliptical#3 0.02 0.005 0.1 940.486 111.11 8.46
elliptical#4 0.02 0.00025 0.005 1153 100.50 11.47
tK
maxσ avσXR
YR Wd
14
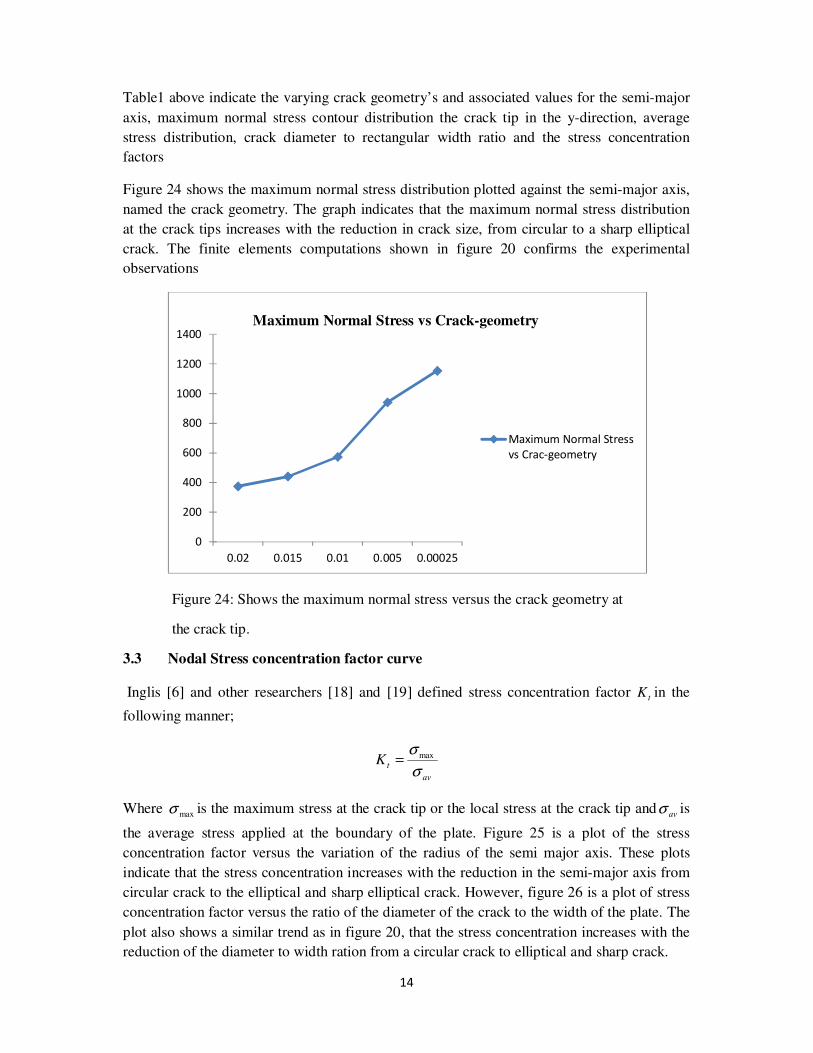
Table1 above indicate the varying crack geometry’s and associated values for the semi-major
axis, maximum normal stress contour distribution the crack tip in the y-direction, average
stress distribution, crack diameter to rectangular width ratio and the stress concentration
factors
Figure 24 shows the maximum normal stress distribution plotted against the semi-major axis,
named the crack geometry. The graph indicates that the maximum normal stress distribution
at the crack tips increases with the reduction in crack size, from circular to a sharp elliptical
crack. The finite elements computations shown in figure 20 confirms the experimental
observations
Figure 24: Shows the maximum normal stress versus the crack geometry at
the crack tip.
3.3 Nodal Stress concentration factor curve
Inglis [6] and other researchers [18] and [19] defined stress concentration factor tK in the
following manner;
av
tKσ
σ max=
Where maxσ is the maximum stress at the crack tip or the local stress at the crack tip and avσ is
the average stress applied at the boundary of the plate. Figure 25 is a plot of the stress
concentration factor versus the variation of the radius of the semi major axis. These plots
indicate that the stress concentration increases with the reduction in the semi-major axis from
circular crack to the elliptical and sharp elliptical crack. However, figure 26 is a plot of stress
concentration factor versus the ratio of the diameter of the crack to the width of the plate. The
plot also shows a similar trend as in figure 20, that the stress concentration increases with the
reduction of the diameter to width ration from a circular crack to elliptical and sharp crack.
0
200
400
600
800
1000
1200
1400
0.02 0.015 0.01 0.005 0.00025
Maximum Normal Stress vs Crack-geometry
Maximum Normal Stress
vs Crac-geometry

15
0.00
2.00
4.00
6.00
8.00
10.00
12.00
14.00
0.4 0.3 0.2 0.1 0.005
Stress concentration factor vs d/W ratio
Stress
concentration
vs d/W ratio
0.00
2.00
4.00
6.00
8.00
10.00
12.00
14.00
0.02 0.015 0.01 0.005 0.00025
Stress concentration factor vs Semi-major
Axis
Stress
concentration
factor vs Semi-
major Axis
4. Conclusions
The finite element computational results give good predictions of the expected normal stress
distribution and subsequently the stress concentration factors compared to the experimental
results. This study shows that:
(a) Numerical computations of the maximum stress distribution contours in figure 15
after the finite element model mesh has been refined show that the numerical results
are 99 % accurate when compared to observed data when a rectangle with a circular
crack is used. However, before mesh refinement was done the results are 90%
accurate compared to experimental analysis.
(b) The maximum normal stress distribution at the crack tip of an elliptical hole shows
that the value of the maximum normal stress contours increases with the reduction of
the crack geometry from circular, elliptical to a sharp elliptical crack
(c) The computed stress concentration factor increase increases with the reduction in the
geometry of the crack and also the crack diameter to width ratio.
Generally, the results of the above simulation results show that the normal stress distribution
increases at the crack tip with a reduction in crack geometry. However, the computation of the
stress concentration factor in the curves shown in figure 25 and 26 also indicates a similar
trend, that the stress concentration factor increases with the reduction in semi-major axis and
Figure 25; Shows the stress concentration factors
versus the semi-major axis at the crack tip.
Figure 26: Shows the stress concentration factors
versus the crack diameter and the width of the plate
ratio.
16
the crack diameter to width ratio. The effect of the W
d ratio on the stress concentration
factor is in agreement with the previous work done by Jain and Mittal [11].
This work clearly demonstrates the robustness of the finite element method in handling real
life problems. The numerical results obtained using the finite element meshed are in good
agreement with previous experimental work on done on crack geometry.
5. Acknowledgements
First of all, the authors would like to thank God almighty for making this possible. We would
also like to thank Dr. I. Sikakana, the head of Department of Non-Destructive Testing at Vaal
University of Technology for encouraging this work, and Vaal University of Technology for
the funding the conference attendance. Mr Jay Nkuna, Professor Alufayo Alugongo, and
Professor Leornard Masu from the faculty of engineering and technology are hereby
acknowledged for the Ansys educational version of the DVD and for encouraging future
interdisciplinary collaborative work. Mr Dion Agostinho and Mr Tumelo Machacha for
inviting and assisting me to work at their Modelling centre at Rotek Engineering. Lastly, I
would like to thank all who have been instrumental in helping me get this work off the ground
and they know who they are.
References
[1]. Abdul-Aziz et al (2006), IntegratingNDT with Computational Methods such as Finite
Element. American Society of Non-Destructive testing, Inc.
[2]. Reale, S., Tognarelli, L., and Crutzen, S.,(1993). The Use of Fracture Mechanics
Methodologies for NDT Results Evaluation and Comparison: SMiRT-12/K.
Kussmaul(Editor), © Elsevier Science Publishers B.V. All rights reserved.
[3]. Ingraffea, A.R., and Wawrzynek, P.A., (2004). Computational Fracture Mechanics: A
survey of the field. European Congress on Computational Methods in Applied
Sciences and Engineering, ECCOMAS.
[4]. Ahmad Zaidi, A.M., MdAsif, M.M., AbdulRahman, I, RasoolMohideen, S., Ahmad
Zaidi, A.F., Ahmad Zaidi, N.H., and Yusof, M.S (unclear); Finite Element Simulation
on Crack Analysis of Analysis of a Thick Tube. International Journal of Integrated
Engineering(Issue on Mechanical, Materials and Manufacturing Engineering)
[5]. Lawrence, K.L. (2006), Ansys Tutorial, Release 10. Schroff Development Corporation
(SDC) Publications.
[6]. Inglis, C.E., (1913), Stresses in a plate due to the presence of cracks and sharp corners.
Proc Inst Naval of Arch, 55, 219-30.
[7]. Broek, D., (1974), Elementary engineering fracture mechanics. Plates with holes.
Groningen Nordhoff: 361-70 [Chapter 4].

17
[8]. A.J. Sobey, M.A.,(1965)., Stress Concentration Factors for Rounded Rectangular
Holes in Infinite Sheets: London: Her Majesty’s Stationary Office, Ministry of
Aviation, Aeronautical Research Council Reports and Memoranda, R&M. No.3407.
[9]. Muskhelishvili, N.I., (1953), Some basic problems of the mathematical theory of
elasticity. 3rd edition, Moscow-Leningrad. 1949. (Translated by J.R.M Radok,
Noordhoff).
[10]. Anderson, T.L. (2005), Fracture Mechanics Fundamentals and Applications, 3rd
Edition: CRC press, Taylor & Francis Group, 6000 Broken Sound Parkway NW,
Suite 300, Boca Raton, FL 33487-2742.
[11]. Jain, N.K., and Mittal, N.D.,(2008), Finite element analysis for stress concentration
and deflection in isotropic orthotropic and laminated composite plates with central
circular hole under transverse static loading. Material Science and Engineering, A498,
115-124.
[12]. Bathe, K.J.,(1996), Finite Element Procedures, Prentice Hall, Englewood Cliffs, New
Jersey 07632.
[13] Ansys (2005), Release 10.0, documentation for Ansys. Ansys, Inc. Southpointe, 275
Technology Drive, Canonsburg, PA15317
[14] Lawrence, K.L. (2002), Ansys Tutorial, Release 7.0. Schroff Development
Corporation (SDC) Publications.
[15]. Roland, W.L., Perumal, N., and Kankanhalli, N.S. (2004), Fundamentals of the Finite
Element Method for Heat and Fluid Flow: John Wiley & Sons Ltd, Southern Gate,
Chichester, West Sussex PO19 8Q, England.
[16]. Claudio, R.A., Baptista, R., Infante, V., andBranco, C.M. (2002), Life Prediction
Using Finite Elements in Complex Geometries. 8as JORNADAS DE FRACTURA
[17]. Collins, J.A. (1993), Failure of materials in mechanical design analysis, prediction,
prevention. 2nd
edition, John Wiley& Sons, Inc., New York, USA .
[18] Yhang, Z.(2009), Stress and strain concentration factors for tension bars of circular
cross section with semicircular groove. Engineering Fracture Mechanics, 76, 1683-
1690.
[19]. Troyani, N, Hernandez, S.I., Villarroel, G., Pollonias, Y., and Gomes, C.,(2004),
Theoretical stress concentration factors for short flat bars with opposite U-shaped
notches subjected to in-plane bending. International Journal of Fatigue, Vol., 26,
1303-1310.

18