the effect of the colour of light on the growth of ...slowacki.kielce.eu/ib/pslusarczyk.pdf · the...
TRANSCRIPT
003679 - 0027
The effect of the colour of light
on the growth of fruiting bodies in
Pleurotus ostreatus
EXTENDED ESSAY
BIOLOGY
MAY 2015
WORD COUNT: 3 923
003679 - 0027
2
ABSTRACT
The aim of this experiment is to investigate the effect of the colour of light on the growth of
fruiting bodies in Pleurotus ostreatus. The most significant role that light plays for mushrooms
is in the phototropic responses and in the formation of reproductive structures. To test
the hypothesis, 4 cultivation media (substrates) were prepared and inoculated with Pleurotus
ostreatus spawn. Once the mycelium colonisation was completed and primordia appeared on
the top layers of the substrates, the samples were exposed to light of different colours: blue,
green, red, yellow for fruiting induction. Lengths of stipes and diameters of pilei of 15 fruiting
bodies, chosen randomly, were measured in each sample for 7 days. The lengths of stipes and
the diameters of pilei were the greatest in the sample exposed to blue light. Irradiation with red
light resulted in the smallest values for both measurements. The lengths of stipes and the
diameters of pilei in the sample grown under yellow light were similar to those of subjected to
green light. The yellow light exposure, nevertheless, promoted slightly greater growth
compared to the green one. The partial inhibition of pilei development, construed as
disagreement with the range of values from the literature, could be justified by high CO2
concentration in the cultivation place. These findings were taken into consideration when
assessing the significance of the differences between the results. The outcomes of the study
could contribute to the development of a new, more efficient method to cultivate oyster
mushrooms for industrial production.
Word count: 251
003679 - 0027
3
TABLE OF CONTENTS
1. Research question ................................................................................................................. 4
2. Introduction .......................................................................................................................... 4
2.1 Key terms .......................................................................................................................... 5
2.2 Characteristics of Pleurotus ostreatus .............................................................................. 6
2.3 Effect of light .................................................................................................................... 9
3. Hypothesis ........................................................................................................................... 10
4. Variables ............................................................................................................................. 10
4.1 Independent variable ....................................................................................................... 10
4.2 Dependent variable ......................................................................................................... 10
4.3 Controlled variables and the means of monitoring ......................................................... 11
5. Materials ............................................................................................................................. 13
6. Method ................................................................................................................................. 14
6.1 LED growth chambers .................................................................................................... 14
6.2 Mushroom cultivation ..................................................................................................... 15
7. Data collection and processing .......................................................................................... 17
8. Data analysis ....................................................................................................................... 22
9. Conclusion ........................................................................................................................... 26
10. Evaluation ......................................................................................................................... 27
11. Cited references ................................................................................................................ 28
12. Appendix ........................................................................................................................... 31
12.1 Qualitative data ............................................................................................................. 31
12.2 Quantitative data ........................................................................................................... 35
12.3 Normal distribution curves ........................................................................................... 39
12.4 T-test ............................................................................................................................. 43

003679 - 0027
4
1. RESEARCH QUESTION
How does the colour of light inducing the formation of Pleurotus ostreatus
fruiting bodies affect their growth?
2. INTRODUCTION
Last summer I visited my uncle for a couple of days. Because the property was located in
a rural area, he had the conditions to boost his experience in amateur agriculture. It came to me
as a surprise to learn he cultivated oyster mushrooms in his garage. Far from being a specialist,
my uncle harvested the mushrooms for his own use exclusively. What intrigued me the most
was the technique he applied. Neither temperature-humidity chambers nor special light
installations were present. It made me wonder under what conditions he would obtain
a richer harvest. Although oyster mushrooms are of great economic importance, relatively few
attempts have been made to enhance their cultivation and yield performance commercially.
It directly encouraged me to pursue the topic of my extended essay in more depth. I have
decided to investigate the factor affecting growth of Pleurotus ostreatus – the colour of light
inducing the development of fruiting bodies. The results of the study might reveal that the
treatment with certain colours of light could be used as a more efficient method to cultivate
oyster mushrooms for industrial production.
003679 - 0027
5
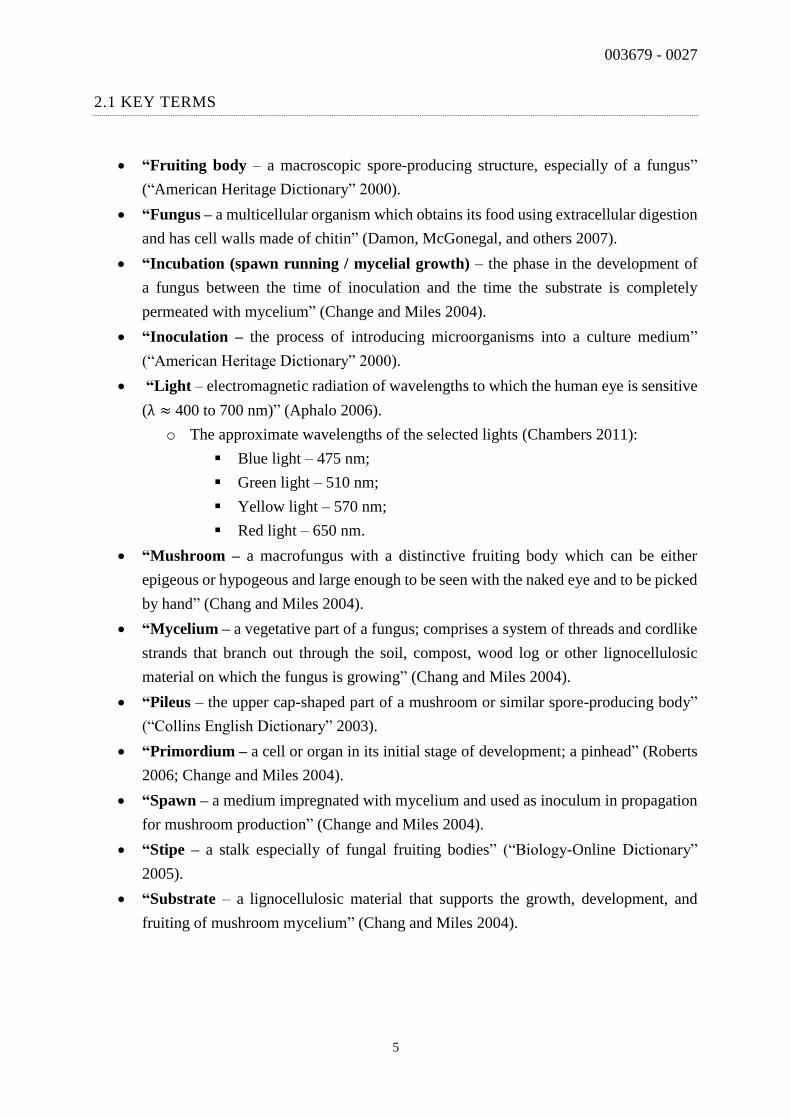
2.1 KEY TERMS
“Fruiting body – a macroscopic spore-producing structure, especially of a fungus”
(“American Heritage Dictionary” 2000).
“Fungus – a multicellular organism which obtains its food using extracellular digestion
and has cell walls made of chitin” (Damon, McGonegal, and others 2007).
“Incubation (spawn running / mycelial growth) – the phase in the development of
a fungus between the time of inoculation and the time the substrate is completely
permeated with mycelium” (Change and Miles 2004).
“Inoculation – the process of introducing microorganisms into a culture medium”
(“American Heritage Dictionary” 2000).
“Light – electromagnetic radiation of wavelengths to which the human eye is sensitive
(λ ≈ 400 to 700 nm)” (Aphalo 2006).
o The approximate wavelengths of the selected lights (Chambers 2011):
Blue light – 475 nm;
Green light – 510 nm;
Yellow light – 570 nm;
Red light – 650 nm.
“Mushroom – a macrofungus with a distinctive fruiting body which can be either
epigeous or hypogeous and large enough to be seen with the naked eye and to be picked
by hand” (Chang and Miles 2004).
“Mycelium – a vegetative part of a fungus; comprises a system of threads and cordlike
strands that branch out through the soil, compost, wood log or other lignocellulosic
material on which the fungus is growing” (Chang and Miles 2004).
“Pileus – the upper cap-shaped part of a mushroom or similar spore-producing body”
(“Collins English Dictionary” 2003).
“Primordium – a cell or organ in its initial stage of development; a pinhead” (Roberts
2006; Change and Miles 2004).
“Spawn – a medium impregnated with mycelium and used as inoculum in propagation
for mushroom production” (Change and Miles 2004).
“Stipe – a stalk especially of fungal fruiting bodies” (“Biology-Online Dictionary”
2005).
“Substrate – a lignocellulosic material that supports the growth, development, and
fruiting of mushroom mycelium” (Chang and Miles 2004).
003679 - 0027
6
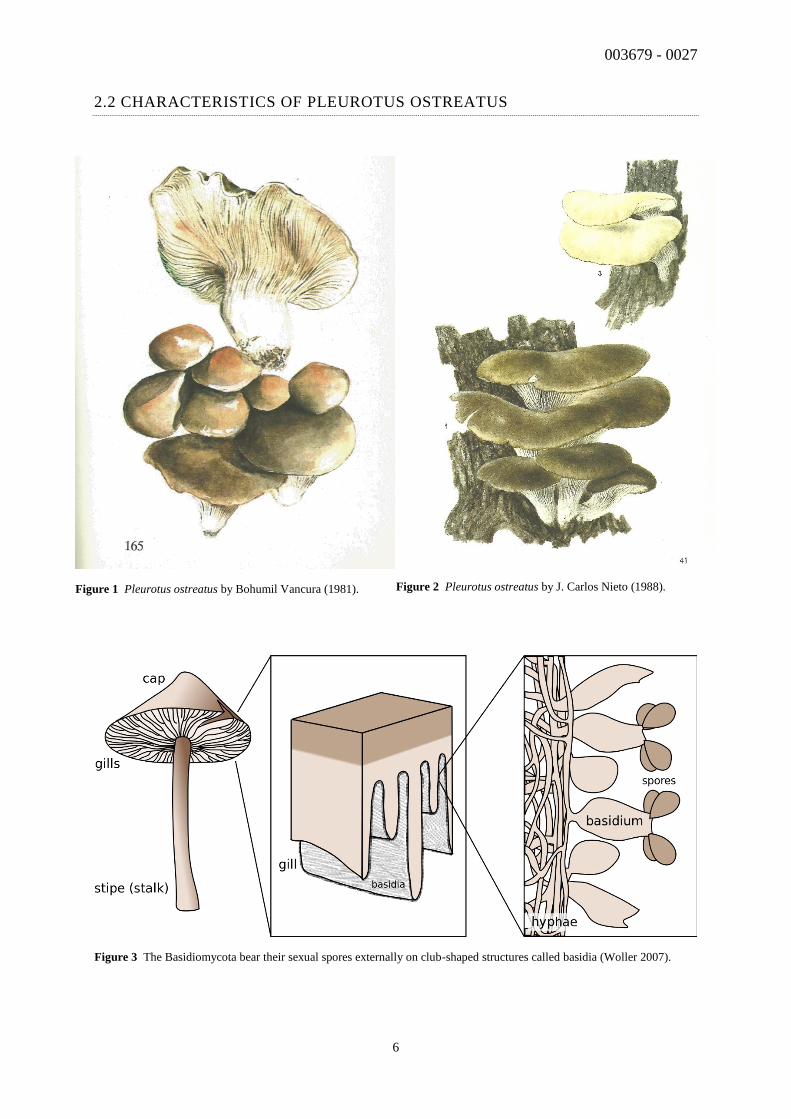
2.2 CHARACTERISTICS OF PLEUROTUS OSTREATUS
Figure 1 Pleurotus ostreatus by Bohumil Vancura (1981). Figure 2 Pleurotus ostreatus by J. Carlos Nieto (1988).
Figure 3 The Basidiomycota bear their sexual spores externally on club-shaped structures called basidia (Woller 2007).

003679 - 0027
7
Table 1 Scientific classification of Pleurotus ostreatus (Woller 2007).
The Pleurotus ostreatus is named the oyster mushroom as the pileus is shell-like, spatulate, and
the stipe eccentric or lateral. The species is used as food, for medical purposes and it plays an
important role as a commercial edible mushroom. One reason is that oyster mushrooms are the
easiest and least expensive to grow of all cultivated edible mushrooms. There is an opportunity
for cultivation under different climatic conditions too (Chang and Miles 2004).
Oyster mushrooms are saprotrophs, meaning “organisms that live on or in non-living organic
matter, secreting digestive enzymes into it and absorbing the products of digestion” (Damon,
McGonegal, and others 2007). “Pleurotus ostreatus secretes the enzymes through tips of root-
like extensions called hyphae. The enzymes hydrolyse cellulose leaving a space filled with
nutrients the hyphae can absorb. The hyphae branch and form a thicker mass – mycelium, which
maximizes the surface area through which feeding can occur” (Woller 2007).
“They grow naturally in temperate zones on rotting trees such as oak, elm, maple, bass, poplar,
holly, and laburnum” (Chang and Miles 2004). There are many methods for the cultivation of
oyster mushrooms. Some are cultivated by using wood logs, some are cultivated on culture
media contained in jars or plastic bags, and others are cultivated by placing the culture
substrates on the surface of the ridge, bed frame. The substrates used for cultivation include
“plant wastes, such as sawdust, paddy straw, bagasse, cornstalks, waste cotton, stalks and leaves
of bananas” (Chang and Miles 2004).
Taxa Oyster mushroom
Kingdom Fungi
Phylum Basidiomycota
Class Agaricomycetes
Order Agaricales
Family Pleurotaceae
Genus Pleurotus
Species ostreatus
003679 - 0027
8
The oyster mushrooms are diversely coloured, including dark blue, white, brownish, yellow.
The pileus is shell and tongue-shaped. The colour intensity can alter due to changes in
environmental factors, e.g. light and temperature. The colour is darker in conditions of more
light and cold weather, and it is lighter in weak light and hot weather. “The size can vary from
5 to 30 cm in diameter. The gills are whitish or grey. The stipe is usually eccentric or lateral”
(Chang and Miles 2004). Its size can vary from 2-5 (length) × 1-2 cm (thickness) (Grzywacz
1988).
“The life cycle of Pleurotus consists of the vegetative stage and the reproductive growth stage.
Some kinds of stimuli are needed to shift from mycelial growth to the fruiting body formation
phase. It includes abrupt changes in temperature, humidity, gas concentration, light and nutrient
reserves, and physical stimuli” (Kong 2004).
Although the mycelium of Pleurotus ostreatus can tolerate a high concentration of CO2,
the fruiting body of the oyster mushroom cannot endure high CO2. When the CO2 concentration
is higher than 600 ppm, the stipe elongates and the growth of the caps is prevented (Chang and
Miles 2004). The optimal temperature for the development of fruiting bodies ranges from 15 to
20℃ and the optimal humidity – 80 to 95% (Gupta 2013).

003679 - 0027
9
2.3 EFFECT OF LIGHT
The most significant role light plays for fungi is in the phototropic responses of reproductive
structures and in their formation. The positioning of the stipe and pileus has been shown to be
controlled by phototropic responses. “Phototropism is a growth response causing a bending
toward or away from light” (Chang and Miles 2004). Not only is light required for the normal
expansion of the pileus, but phototropism plays also a prominent role in spore dissemination
(Chang and Miles 2004).
The light requirements are different for various stages of growth. Mycelium growth does not
need light, and cultivation of the oyster mushroom in darkness is better than in a bright place.
The formation of primordia and the growth of fruiting bodies requires light, however.
The former requires light of 200 lux intensity for about 12 hours a day. The growth of the
fruiting body requires light of 50 – 500 lux intensity (Chang and Miles 2004).
The fact that light “induces the development of fruiting bodies including stipe elongation and
cap formation” has been confirmed in ordinary mushroom cultivations (Miyazaki, Masuno, and
others 2011).
To induce the formation of fruiting bodies in Pleurotus ostreatus after mycelia growth, Light
Emitting Diodes (LEDs) are recommended. “LEDs have longer life and greater energy
efficiency than fluorescent lamps, and they do not emit heat rays” (Jang, Lee, and others 2013).

003679 - 0027
10
3. HYPOTHESIS
Considering the light stimuli essential to initiate fruiting body formation, sensory factors such
as photoreceptors are believed to be necessary (Miyazaki, Masuno, and others 2011). A study
suggests (Light-stimulative effects on the cultivation of edible mushrooms by using blue LED)
that a blue-light photoreceptor was identified as a resident protein containing a photo-reactive
domain responding to light stimuli essential for fruiting development. Furthermore, the results
of another investigation (Jang, Lee, and others 2013) reported that “in mushrooms cultivated
under 340~520 nm light there was an increase in the yield of fruit body because of activation
of ATP synthase”. An additional factor to be taken into account is the natural habitat of
Pleurotus ostreatus. The forest environment entails varying degrees of light penetration. Tree
foliage acts as a selective filter and blue light, estimatedly, predominates in the vicinity of the
forest floor, so mushrooms respond particularly to blue light (Gupta 2013). Therefore, I assume
the lengths of stipes and the diameters of pilei will be greatest in the fruiting bodies of the
sample subject to blue light. The remaining sizes will be decreasing in the following order
(according to the colour of light inducing the formation of fruiting bodies):
green > yellow > red.
4. VARIABLES
4.1 INDEPENDENT VARIABLE
Colour of light inducing the formation of Pleurotus ostreatus fruiting bodies after
mycelia growth (blue, green, red, yellow).
4.2 DEPENDENT VARIABLE
Growth of Pleurotus ostreatus fruiting bodies expressed as:
o length of stipes;
o diameter of pilei.
003679 - 0027
11
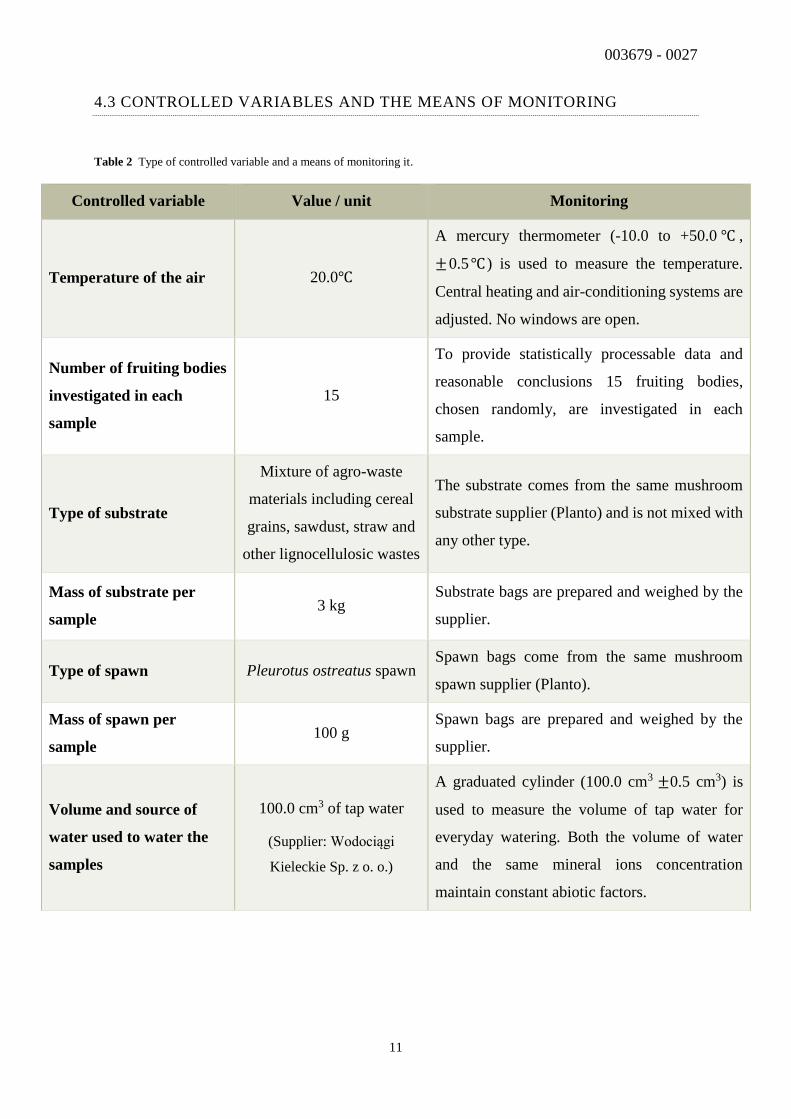
4.3 CONTROLLED VARIABLES AND THE MEANS OF MONITORING
Table 2 Type of controlled variable and a means of monitoring it.
Controlled variable Value / unit Monitoring
Temperature of the air 20.0℃
A mercury thermometer (-10.0 to +50.0 ℃ ,
±0.5 ℃ ) is used to measure the temperature.
Central heating and air-conditioning systems are
adjusted. No windows are open.
Number of fruiting bodies
investigated in each
sample
15
To provide statistically processable data and
reasonable conclusions 15 fruiting bodies,
chosen randomly, are investigated in each
sample.
Type of substrate
Mixture of agro-waste
materials including cereal
grains, sawdust, straw and
other lignocellulosic wastes
The substrate comes from the same mushroom
substrate supplier (Planto) and is not mixed with
any other type.
Mass of substrate per
sample 3 kg
Substrate bags are prepared and weighed by the
supplier.
Type of spawn Pleurotus ostreatus spawn Spawn bags come from the same mushroom
spawn supplier (Planto).
Mass of spawn per
sample 100 g
Spawn bags are prepared and weighed by the
supplier.
Volume and source of
water used to water the
samples
100.0 cm3 of tap water
(Supplier: Wodociągi
Kieleckie Sp. z o. o.)
A graduated cylinder (100.0 cm3 ±0.5 cm3) is
used to measure the volume of tap water for
everyday watering. Both the volume of water
and the same mineral ions concentration
maintain constant abiotic factors.

003679 - 0027
12
Controlled variable Value / unit Monitoring
Frequency and time of
watering the samples
Twice a day;
8:00 a.m. and 8:00 p.m.
Each sample receives 50.0 cm3 of tap water at
8:00 a.m. and 50.0 cm3 of tap water at 8:00 p.m.
using a spray bottle.
Light intensity (power of
LEDs; distance between the
bulbs and the samples)
1 W; 15.00 cm
The light bulbs taken from the same distributor
(elektrykon.pl) are arranged 15.00 cm above the
samples. The distance is measured using a ruler
(20.00 cm ±0.05 cm). The cardboard installation
is used to separate the samples.
Time of light exposure
(after mycelia growth;
incubation under dark
conditions)
12 hours / 7 days The exposure starts at 8:00 a.m. and ends at 8:00
p.m. to maintain the same abiotic factors.
Place of cultivation Basement The investigation is conducted in the same place.
Humidity High
(about 80-95%)
High humidity is achieved using a plastic vapour
barrier. Everyday watering coupled with open
water containers maintain the optimal level.
Central heating and air-conditioning systems are
adjusted. No windows are open.
Time of incubation 21 days
The substrates are inoculated with Pleurotus
ostreatus spawn on the same day. The samples
are left for 21 days for the mycelial growth.
Ruler used for measuring
the sizes 200.0 mm ±0.5 mm
The same ruler is used throughout the
experiment.
003679 - 0027
13
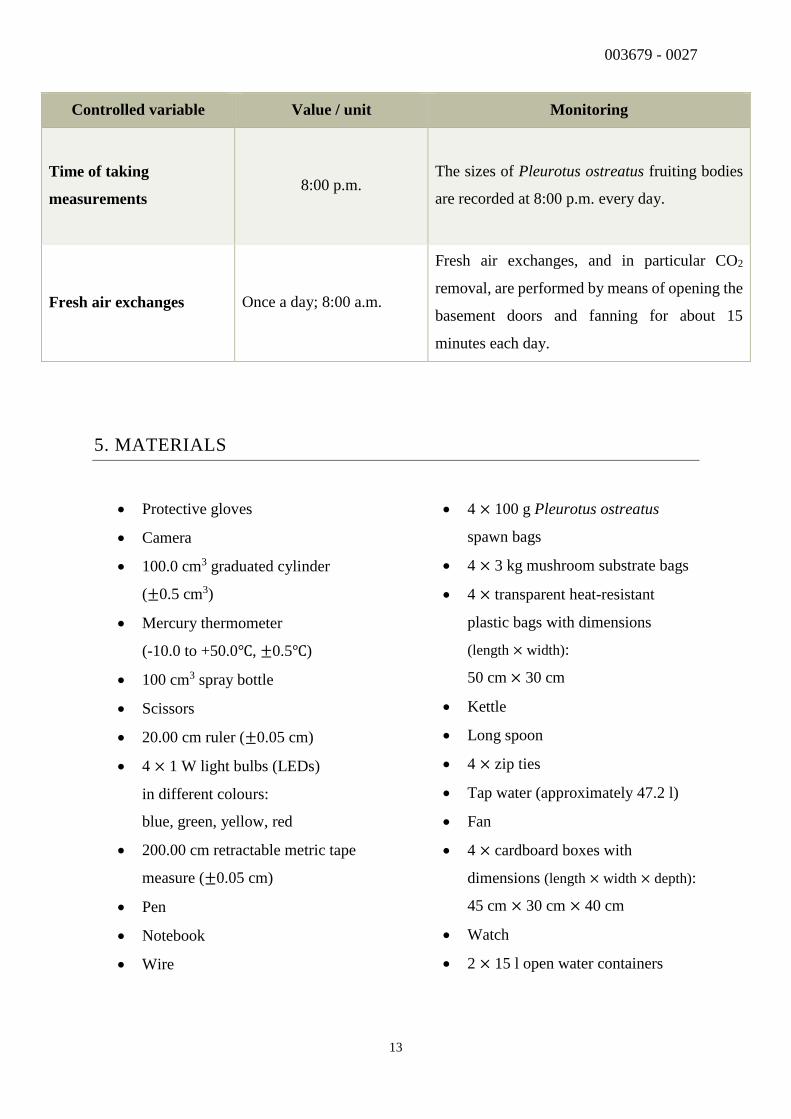
Controlled variable Value / unit Monitoring
Time of taking
measurements 8:00 p.m.
The sizes of Pleurotus ostreatus fruiting bodies
are recorded at 8:00 p.m. every day.
Fresh air exchanges Once a day; 8:00 a.m.
Fresh air exchanges, and in particular CO2
removal, are performed by means of opening the
basement doors and fanning for about 15
minutes each day.
5. MATERIALS
Protective gloves
Camera
100.0 cm3 graduated cylinder
(±0.5 cm3)
Mercury thermometer
(-10.0 to +50.0℃, ±0.5℃)
100 cm3 spray bottle
Scissors
20.00 cm ruler (±0.05 cm)
4 × 1 W light bulbs (LEDs)
in different colours:
blue, green, yellow, red
200.00 cm retractable metric tape
measure (±0.05 cm)
Pen
Notebook
Wire
4 × 100 g Pleurotus ostreatus
spawn bags
4 × 3 kg mushroom substrate bags
4 × transparent heat-resistant
plastic bags with dimensions
(length × width):
50 cm × 30 cm
Kettle
Long spoon
4 × zip ties
Tap water (approximately 47.2 l)
Fan
4 × cardboard boxes with
dimensions (length × width × depth):
45 cm × 30 cm × 40 cm
Watch
2 × 15 l open water containers

003679 - 0027
14
6. METHOD
6.1 LED GROWTH CHAMBERS
LED growth chambers were constructed as diagrammed below. For this purpose 4 cardboard
boxes with dimensions (length × width × depth): 45 cm × 30 cm × 40 cm were used.
4 LEDs of 1 W power were applied: blue, green, yellow, red. To install LED lighting, the light
bulbs were connected by a wire and placed in the boxes. The distance between the light bulbs
and the samples equalled 15.00 cm (measured with a ruler, ±0.05 cm).
The following picture shows LEDs installation.
Figure 4 Cardboard arrangement – the framework for LED growth chambers.
The black circles at the top indicate LEDs placement (cut with scissors) and the black crosses indicate the location of the samples.
Picture 1 LEDs installation suitably designed for mushroom cultivation.
003679 - 0027
15
6.2 MUSHROOM CULTIVATION
The method for preparation of the substrate was based on Oei’s instructions (2005) and
modified by the experimenter.
The content of each mushroom substrate package was transferred to the transparent heat-
resistant plastic bags with dimensions (length × width): 50 cm × 30 cm before heat treatment.
To kill competing microorganisms and dispose of soluble nutrients, pasteurisation by
immersion in hot water was undertaken. After reaching the boiling point, the water was left for
3 minutes to make it slightly colder. Approximately 1.5 l of prepared hot water was poured into
each heat-resistant plastic bag containing the substrate. The bags were tightened using zip ties
in the upper parts (the hot water increased the volume) and left to cool down for 2 hours.
The bags were then opened and the excess water was drained from the heat-treated substrates.
In order to facilitate the drainage and prospective Pleurotus ostreatus development, the bags
were perforated using scissors. The cross-like holes (2 cm × 2 cm) were arranged on both sides
of each bag. 4 holes at intervals of 5 cm (horizontally and vertically) were made on each side.
After the substrates reached room temperature (measured with a mercury thermometer,
-10.0 to +50.0℃, ±0.5℃), they were inoculated with Pleurotus ostreatus spawn. A small hole
(of diameter 4 cm and extending almost to the bottom of the bag) in the middle of each substrate
was made using a long spoon. The 100 g bags containing Pleurotus ostreatus spawn were
opened and their contents were poured into the holes. The bags with inoculated substrates were
re-plugged using zip ties and placed in a basement for the incubation phase (21 days).
The mycelial growth occurred at 20.0℃ (measured with the mercury thermometer, -10.0 to
+50.0℃, ±0.5℃) in darkness. To obtain high humidity, the samples were watered twice a day
– each received 50.0 cm3 of tap water at 8:00 a.m. and 50.0 cm3 of tap water at 8:00 p.m. using
a spray bottle. To measure the volumes for everyday watering, a graduated cylinder (100.0 cm3
±0.5 cm3) was used. The optimal humidity was maintained due to plastic coverage and open
water containers (2 × 15 l) in the vicinity of the samples. Fresh air exchanges were provided
by means of opening the basement doors and fanning for about 15 minutes every day at 8:00
a.m.
003679 - 0027
16
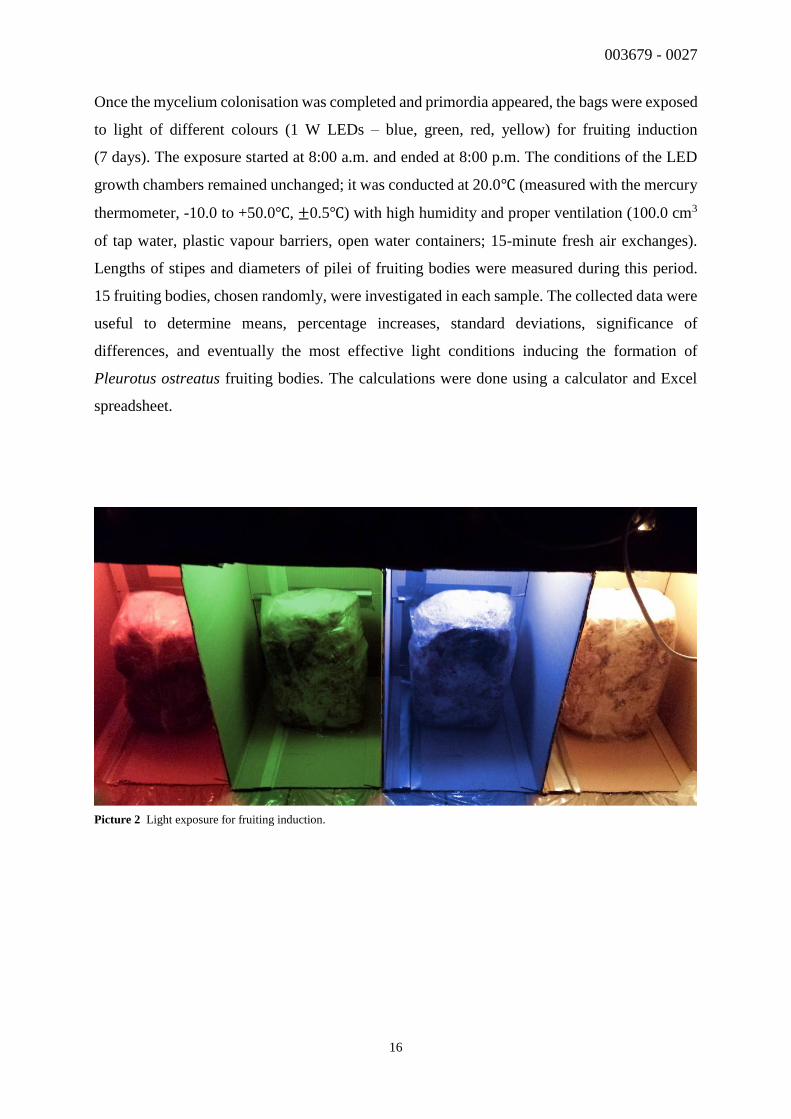
Once the mycelium colonisation was completed and primordia appeared, the bags were exposed
to light of different colours (1 W LEDs – blue, green, red, yellow) for fruiting induction
(7 days). The exposure started at 8:00 a.m. and ended at 8:00 p.m. The conditions of the LED
growth chambers remained unchanged; it was conducted at 20.0℃ (measured with the mercury
thermometer, -10.0 to +50.0℃, ±0.5℃) with high humidity and proper ventilation (100.0 cm3
of tap water, plastic vapour barriers, open water containers; 15-minute fresh air exchanges).
Lengths of stipes and diameters of pilei of fruiting bodies were measured during this period.
15 fruiting bodies, chosen randomly, were investigated in each sample. The collected data were
useful to determine means, percentage increases, standard deviations, significance of
differences, and eventually the most effective light conditions inducing the formation of
Pleurotus ostreatus fruiting bodies. The calculations were done using a calculator and Excel
spreadsheet.
Picture 2 Light exposure for fruiting induction.
003679 - 0027
17
7. DATA COLLECTION AND PROCESSING
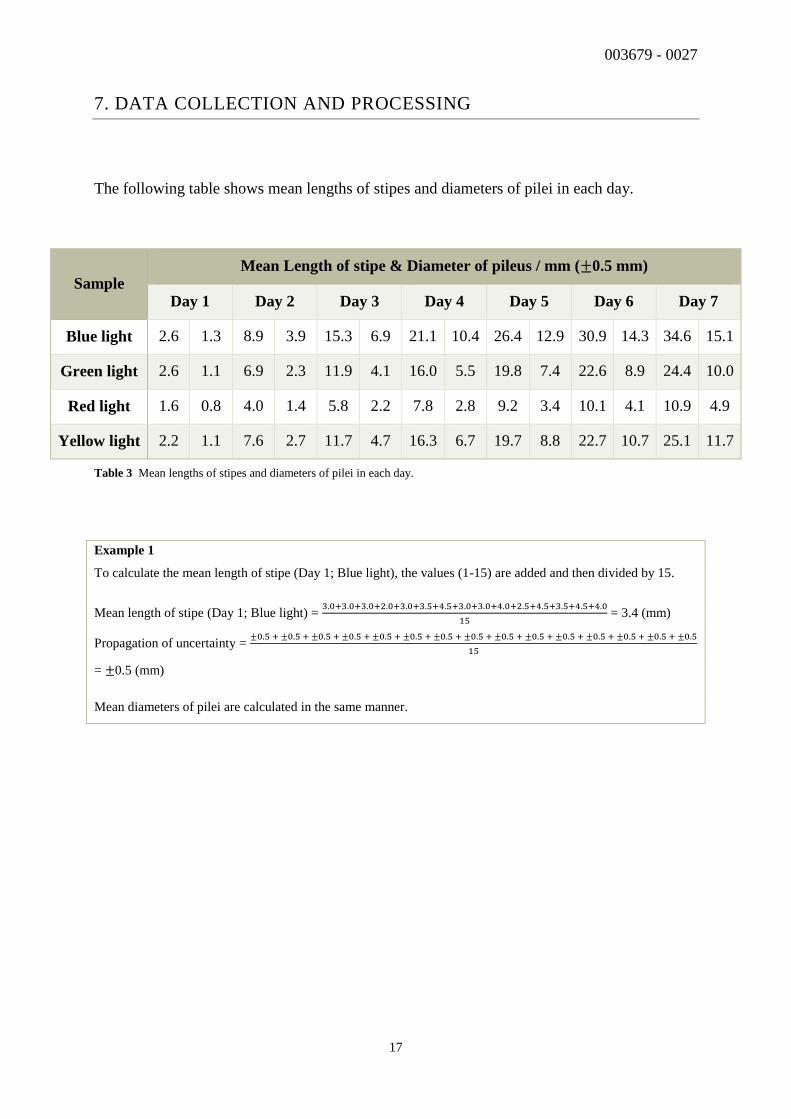
The following table shows mean lengths of stipes and diameters of pilei in each day.
Sample Mean Length of stipe & Diameter of pileus / mm (±0.5 mm)
Day 1 Day 2 Day 3 Day 4 Day 5 Day 6 Day 7
Blue light 2.6 1.3 8.9 3.9 15.3 6.9 21.1 10.4 26.4 12.9 30.9 14.3 34.6 15.1
Green light 2.6 1.1 6.9 2.3 11.9 4.1 16.0 5.5 19.8 7.4 22.6 8.9 24.4 10.0
Red light 1.6 0.8 4.0 1.4 5.8 2.2 7.8 2.8 9.2 3.4 10.1 4.1 10.9 4.9
Yellow light 2.2 1.1 7.6 2.7 11.7 4.7 16.3 6.7 19.7 8.8 22.7 10.7 25.1 11.7
Table 3 Mean lengths of stipes and diameters of pilei in each day.
Example 1
To calculate the mean length of stipe (Day 1; Blue light), the values (1-15) are added and then divided by 15.
Mean length of stipe (Day 1; Blue light) = 3.0+3.0+3.0+2.0+3.0+3.5+4.5+3.0+3.0+4.0+2.5+4.5+3.5+4.5+4.0
15 = 3.4 (mm)
Propagation of uncertainty = ±0.5 + ±0.5 + ±0.5 + ±0.5 + ±0.5 + ±0.5 + ±0.5 + ±0.5 + ±0.5 + ±0.5 + ±0.5 + ±0.5 + ±0.5 + ±0.5 + ±0.5
15
= ±0.5 (mm)
Mean diameters of pilei are calculated in the same manner.

003679 - 0027
18
y = 5.3964x - 1.6143
R² = 0.9917
y = 3.7393x - 0.0714R² = 0.9811
y = 1.5536x + 0.8429R² = 0.9671
y = 3.8179x - 0.2286
R² = 0.9845
0
5
10
15
20
25
30
35
40
45
0 1 2 3 4 5 6 7 8
Mea
n l
ength
of
stip
e /
mm
(±
0.5
mm
)
Days
Mean lengths of stipes in each dayError bars represent Standard Deviation
Blue light Green light Red light Yellow light
Graph 2 Mean diameters of pilei (±1SD) in each day.
y = -0.2262x2 + 4.2452x - 3.2
R² = 0.9924
y = 1.5429x - 0.5571
R² = 0.9965
y = 0.675x + 0.1
R² = 0.9982
y = -0.0393x2 + 2.1679x - 1.2571
R² = 0.9958
0
5
10
15
20
25
30
0 1 2 3 4 5 6 7 8
Mea
n d
iam
eter
of
pil
eus
/ m
m (
±0
.5 m
m)
Days
Mean diameters of pilei in each dayError bars represent Standard Deviation
Blue light Green light Red light Yellow light
Graph 1 Mean lengths of stipes (±1SD) in each day.

003679 - 0027
19
To calculate percentage increase, the following formula is applied:
𝑷𝒆𝒓𝒄𝒆𝒏𝒕𝒂𝒈𝒆 𝒊𝒏𝒄𝒓𝒆𝒂𝒔𝒆 = 𝐹𝑖𝑛𝑎𝑙 𝑣𝑎𝑙𝑢𝑒 (𝐷𝑎𝑦 7) − 𝑆𝑡𝑎𝑟𝑡𝑖𝑛𝑔 𝑣𝑎𝑙𝑢𝑒 (𝐷𝑎𝑦 1)
𝑆𝑡𝑎𝑟𝑡𝑖𝑛𝑔 𝑣𝑎𝑙𝑢𝑒 (𝐷𝑎𝑦 1)× 100%
Sample Percentage increase
Length of stipes Diameter of pilei
Blue light 34.6 − 2.6
2.6× 100% = 𝟏𝟐𝟑𝟏%
15.1 − 1.3
1.3× 100% = 𝟏𝟎𝟔𝟐%
Green light 24.4 − 2.6
2.6× 100% = 𝟖𝟑𝟖%
10.0 − 1.1
1.1× 100% = 𝟖𝟎𝟗%
Red light 10.9 − 1.6
1.6× 100% = 𝟓𝟖𝟏%
4.9 − 0.8
0.8× 100% = 𝟓𝟏𝟑%
Yellow light 25.1 − 2.2
2.2× 100% = 𝟏𝟎𝟒𝟏%
11.7 − 1.1
1.1× 100% = 𝟗𝟔𝟒%
Table 4 Percentage increase in the lengths of stipes and in the diameters of pilei.
1231%
838%
581%
1041%1062%
809%
513%
964%
0%
200%
400%
600%
800%
1000%
1200%
1400%
Blue light Green light Red light Yellow light
Per
centa
ge
incr
ease
Sample
Percentage increase in the lengths of stipes
and in the diameters of pilei
Length of stipes Diameter of pilei
Graph 3 Percentage increase in the lengths of stipes and in the diameters of pilei.
003679 - 0027
20
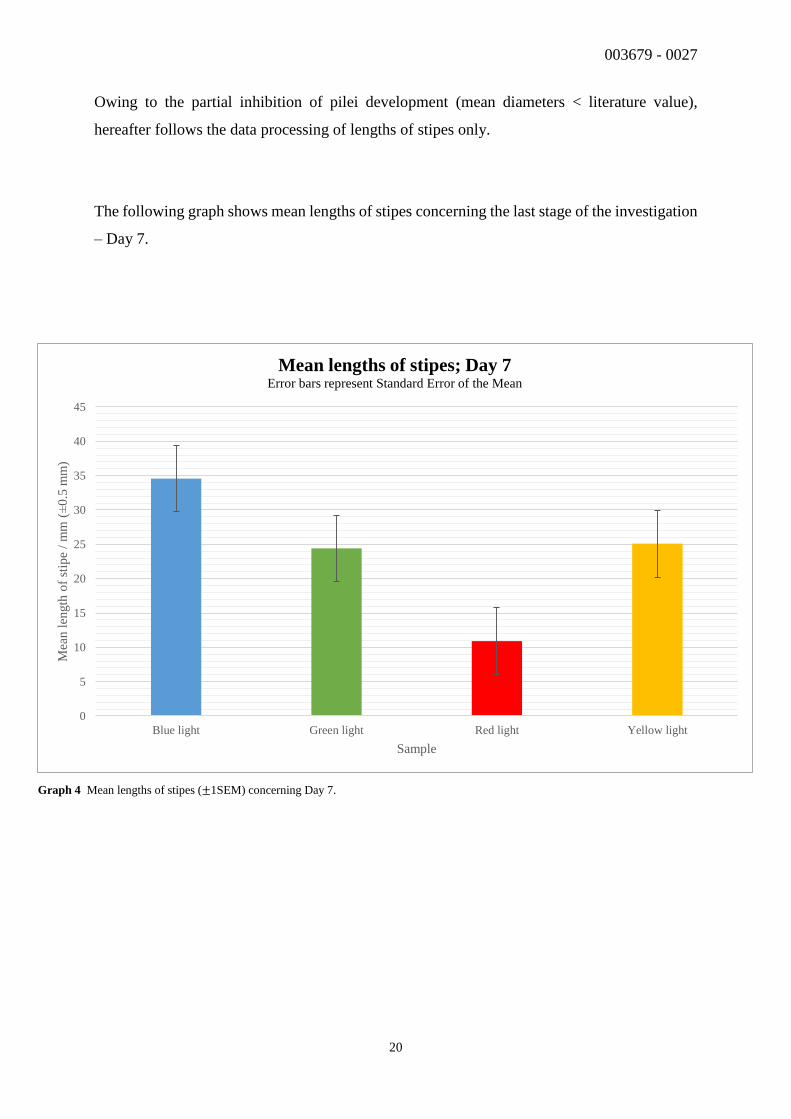
Owing to the partial inhibition of pilei development (mean diameters < literature value),
hereafter follows the data processing of lengths of stipes only.
The following graph shows mean lengths of stipes concerning the last stage of the investigation
– Day 7.
0
5
10
15
20
25
30
35
40
45
Blue light Green light Red light Yellow light
Mea
n l
ength
of
stip
e /
mm
(±
0.5
mm
)
Sample
Mean lengths of stipes; Day 7Error bars represent Standard Error of the Mean
Graph 4 Mean lengths of stipes (±1SEM) concerning Day 7.

003679 - 0027
21
To calculate standard deviation of the length of stipes concerning Day 7, the following formula
is applied:
𝑺𝒕𝒂𝒏𝒅𝒂𝒓𝒅 𝒅𝒆𝒗𝒊𝒂𝒕𝒊𝒐𝒏 = √∑ (𝑥𝑖 − �̅�)2𝑛
𝑖=1
𝑛 − 1
where:
𝑥𝑖 – individual data points
�̅� – mean of 𝑥𝑖
𝑛 – number of data points
Σ – the sum of.
Sample Standard deviation of the length of stipes / mm
Blue light 6.52
Green light 8.53
Red light 5.47
Yellow light 6.97
Table 5 Standard deviation of the length of stipes concerning Day 7.
Example 2
Standard deviation of the length of stipes (Day 7; Blue light) is calculated in the following manner:
Standard deviation =
= √(35.0−34.6)2+(36.0−34.6)2+(14.5−34.6)2+(42.5−34.6)2+(36.0−34.6)2+(37.5−34.6)2+(38.0−34.6)2+(33.5−34.6)2+(32.0−34.6)2+(29.5−34.6)2+(36.5−34.6)2+(39.0−34.6)2+(41.0−34.6)2+(32.0−34.6)2+(35.5−34.6)2
15−1 =
= 6.52 (mm)
In order to check whether the data follow normal distribution, bell-shaped graphs for each
sample has been plotted and relegated to the appendix (pages: 39-42).
003679 - 0027
22
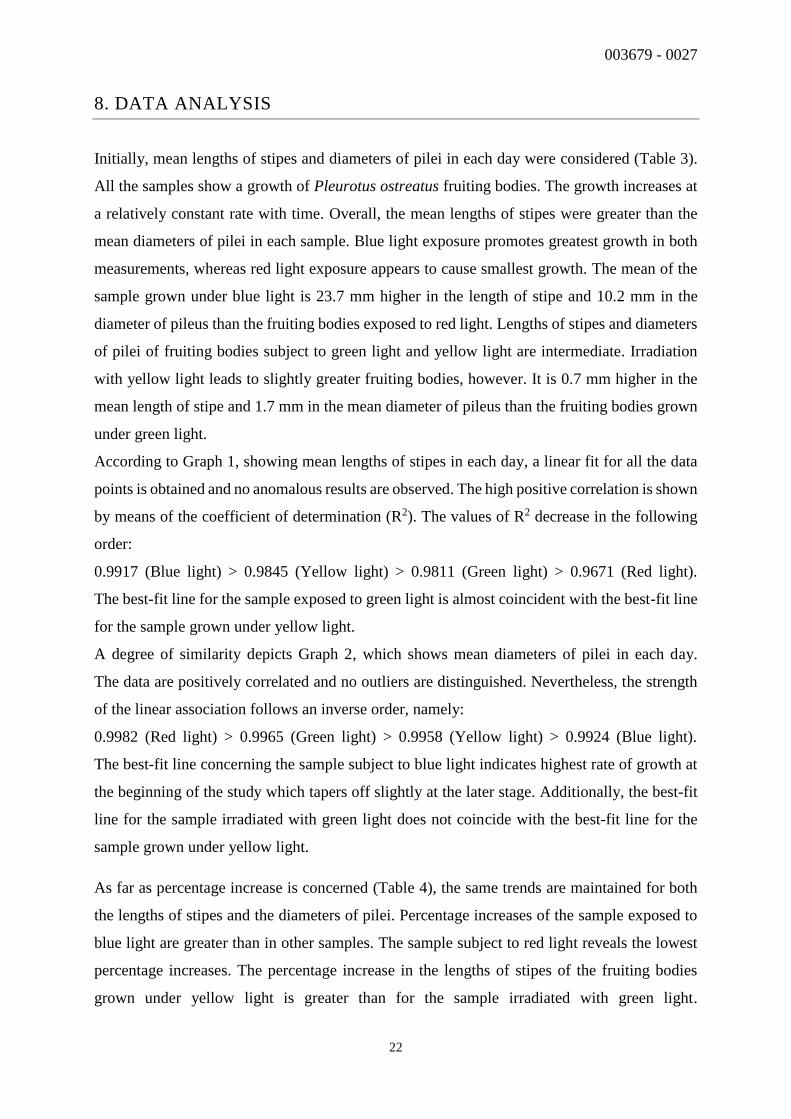
8. DATA ANALYSIS
Initially, mean lengths of stipes and diameters of pilei in each day were considered (Table 3).
All the samples show a growth of Pleurotus ostreatus fruiting bodies. The growth increases at
a relatively constant rate with time. Overall, the mean lengths of stipes were greater than the
mean diameters of pilei in each sample. Blue light exposure promotes greatest growth in both
measurements, whereas red light exposure appears to cause smallest growth. The mean of the
sample grown under blue light is 23.7 mm higher in the length of stipe and 10.2 mm in the
diameter of pileus than the fruiting bodies exposed to red light. Lengths of stipes and diameters
of pilei of fruiting bodies subject to green light and yellow light are intermediate. Irradiation
with yellow light leads to slightly greater fruiting bodies, however. It is 0.7 mm higher in the
mean length of stipe and 1.7 mm in the mean diameter of pileus than the fruiting bodies grown
under green light.
According to Graph 1, showing mean lengths of stipes in each day, a linear fit for all the data
points is obtained and no anomalous results are observed. The high positive correlation is shown
by means of the coefficient of determination (R2). The values of R2 decrease in the following
order:
0.9917 (Blue light) > 0.9845 (Yellow light) > 0.9811 (Green light) > 0.9671 (Red light).
The best-fit line for the sample exposed to green light is almost coincident with the best-fit line
for the sample grown under yellow light.
A degree of similarity depicts Graph 2, which shows mean diameters of pilei in each day.
The data are positively correlated and no outliers are distinguished. Nevertheless, the strength
of the linear association follows an inverse order, namely:
0.9982 (Red light) > 0.9965 (Green light) > 0.9958 (Yellow light) > 0.9924 (Blue light).
The best-fit line concerning the sample subject to blue light indicates highest rate of growth at
the beginning of the study which tapers off slightly at the later stage. Additionally, the best-fit
line for the sample irradiated with green light does not coincide with the best-fit line for the
sample grown under yellow light.
As far as percentage increase is concerned (Table 4), the same trends are maintained for both
the lengths of stipes and the diameters of pilei. Percentage increases of the sample exposed to
blue light are greater than in other samples. The sample subject to red light reveals the lowest
percentage increases. The percentage increase in the lengths of stipes of the fruiting bodies
grown under yellow light is greater than for the sample irradiated with green light.

003679 - 0027
23
The difference equals 203%. Consequently, the difference between the two samples concerning
the percentage increase in the diameters of pilei amounts to 155%.
Judging from Graph 3, it can be seen that the greatest difference between the percentage
increases within the same sample exhibit fruiting bodies exposed to blue light (169%), whereas
the smallest difference show fruiting bodies subject to green light (29%).
Owing to the partial inhibition of pilei development, further data processing centred around
lengths of stipes only. In order to justify this decision, the mean diameters of pilei were
compared with the literature value. It has been emphasised in the introduction that “the size of
pilei can vary from 5 to 30 cm in diameter” (Chang and Miles 2004). However, the greatest
mean diameter of pileus of all the investigated samples is equal to 15.1 mm (Blue light).
The mean lengths of stipes remain in conformity with the literature value. These findings will
be taken into consideration when assessing significance of the differences between
the results.
By taking into account sample size and considering how far apart two Standard Error of the
Men (SEM) error bars are, Cumming (2007) determined some rules for deciding when
a difference is significant or not:
“If two SEM error bars overlap, then the P value is greater than 0.05 (5%), so the
difference is not statistically significant.
If two SEM error bars do not overlap, the P value could be less than 0.05, or it could
be greater than 0.05.”
According to Graph 4, which shows mean lengths of stipes (±1SEM) concerning the last stage
of the investigation – Day 7, the difference in the mean length of stipe between the sample
subject to green light and the sample exposed to yellow light should not be statistically
significant because the two SEM error bars overlap. The significance of the differences between
the remaining results cannot be assessed, however. The error bars do not overlap or just touch.
The error bars has been set to represent SEM instead of SD in this graph because “no
conclusions can be drawn knowing whether SD error bars overlap or not” (Motulsky 2014).
Subsequently, standard deviations of the lengths of stipes concerning Day 7 were calculated
(Table 5). The data points concerning the sample irradiated with green light are spread widely
around the mean and there are many extremes – the standard deviation is the greatest.
The data points of the sample subject to red light are more clustered together and there are fewer

003679 - 0027
24
extremes – the standard deviation is the smallest. The two SD values differ by 3.06 mm.
The SD of the sample grown under yellow light is greater than the SD of the sample exposed
to blue light by 0.45 mm.
All of the samples show Gaussian distribution (Graphs 5-8) – “about 68% of all values lie within
±1 SD from the mean and about 95% lie within ±2 SD” (Damon, McGonegal, and others
2007). Thus a t-test can be carried out.
“A difference is considered statistically significant if the probability of it being due to random
variation (P) is 5% or less” (Allott 2012).
The following samples will be compared in terms of testing the difference between mean
lengths of stipes concerning Day 7:
Blue light and Green light;
Blue light and Red light;
Blue light and Yellow light;
Green light and Red light;
Green light and Yellow light;
Red light and Yellow light.
Sample Blue light and Sample Green light
1. Null hypothesis (H0):
There is no significant difference between the mean lengths of stipes.
2. Alternative hypothesis (H1):
There is a significant difference between the mean lengths of stipes.
3. The degree of freedom is 28 (15 + 15 – 2 = 28).
4. The value of t, calculated using Excel spreadsheet, equals 3.6666.
5. The critical value of t, found using the table of t values, amounts to 2.05.
The chosen level of significance (P) is 0.05 (5%).
6. The calculated value of t is greater than the critical value, showing that the difference
between the mean lengths of stipes is significant.
The remaining comparisons are relegated to the appendix (pages: 43-44).
003679 - 0027
25
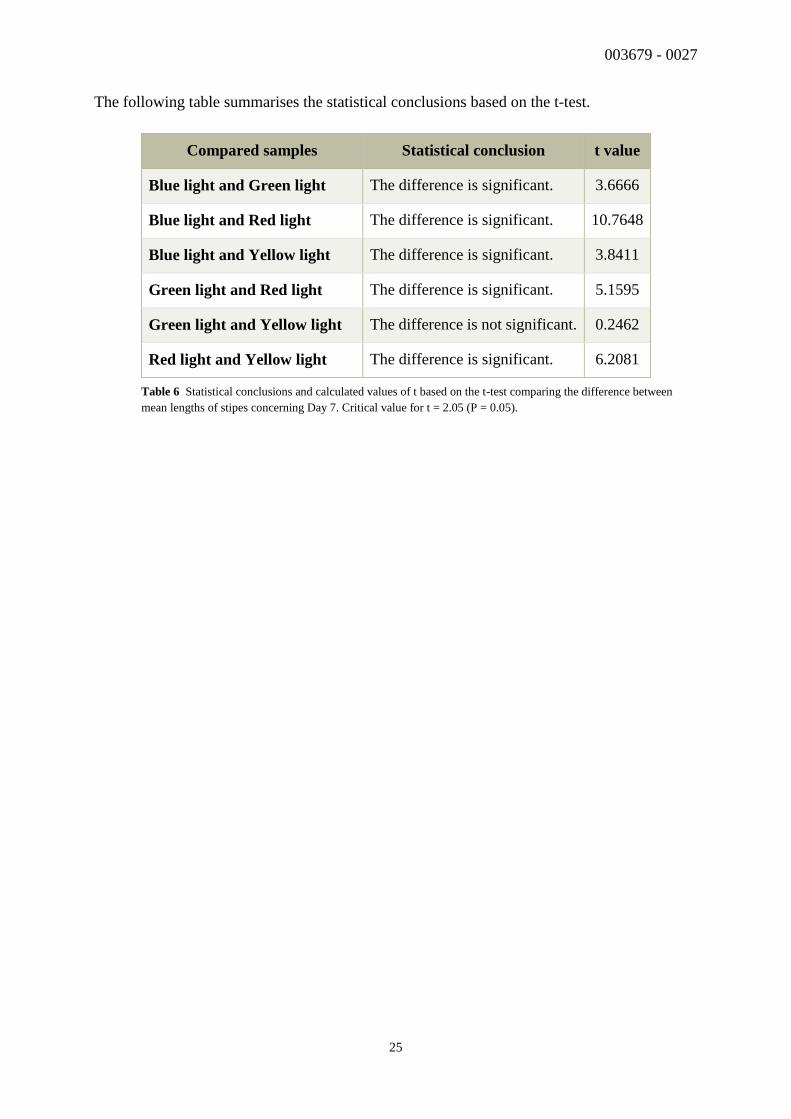
The following table summarises the statistical conclusions based on the t-test.
Compared samples Statistical conclusion t value
Blue light and Green light The difference is significant. 3.6666
Blue light and Red light The difference is significant. 10.7648
Blue light and Yellow light The difference is significant. 3.8411
Green light and Red light The difference is significant. 5.1595
Green light and Yellow light The difference is not significant. 0.2462
Red light and Yellow light The difference is significant. 6.2081
Table 6 Statistical conclusions and calculated values of t based on the t-test comparing the difference between
mean lengths of stipes concerning Day 7. Critical value for t = 2.05 (P = 0.05).
003679 - 0027
26
9. CONCLUSION
The aim of this experiment was to investigate the effect of the colour of light on the growth of
fruiting bodies in Pleurotus ostreatus. Taking everything into account, it is highly probable that
the colour of light affects the growth of oyster mushrooms. The lengths of stipes and the
diameters of pilei were greatest in the sample exposed to blue light. Irradiation with red light
resulted in the smallest values for both measurements. The lengths of stipes and the diameters
of pilei in the sample grown under yellow light were similar to those of subjected to green light.
The yellow light exposure, nevertheless, promoted slightly greater growth compared to the
green one.
These findings are in conformity with the literature to some extent. It was reported that
irradiation with blue LED enabled efficient fruiting body formation. A blue-light photoreceptor
was identified as a resident protein containing a photo-reactive domain responding to light
stimuli essential for fruiting development. Irradiation with red LED had no apparent effect on
the vegetative mycelium growth (Miyazaki, Masuno, and others 2011).
Other studies (Jang, Lee, and others 2013) are also in agreement as to the blue LEDs which
“produced fruit body with better features than the other treatments”. The same studies
concluded that “in mushrooms cultivated under 340~520 nm light there was an increase in the
yield of fruit body because of activation of ATP synthase”. Judging from the wavelengths of
light, the exposure to green light should have promoted greater growth in comparison with the
yellow light. While these assumptions has been rejected, the residue of the hypothesis is
supported.
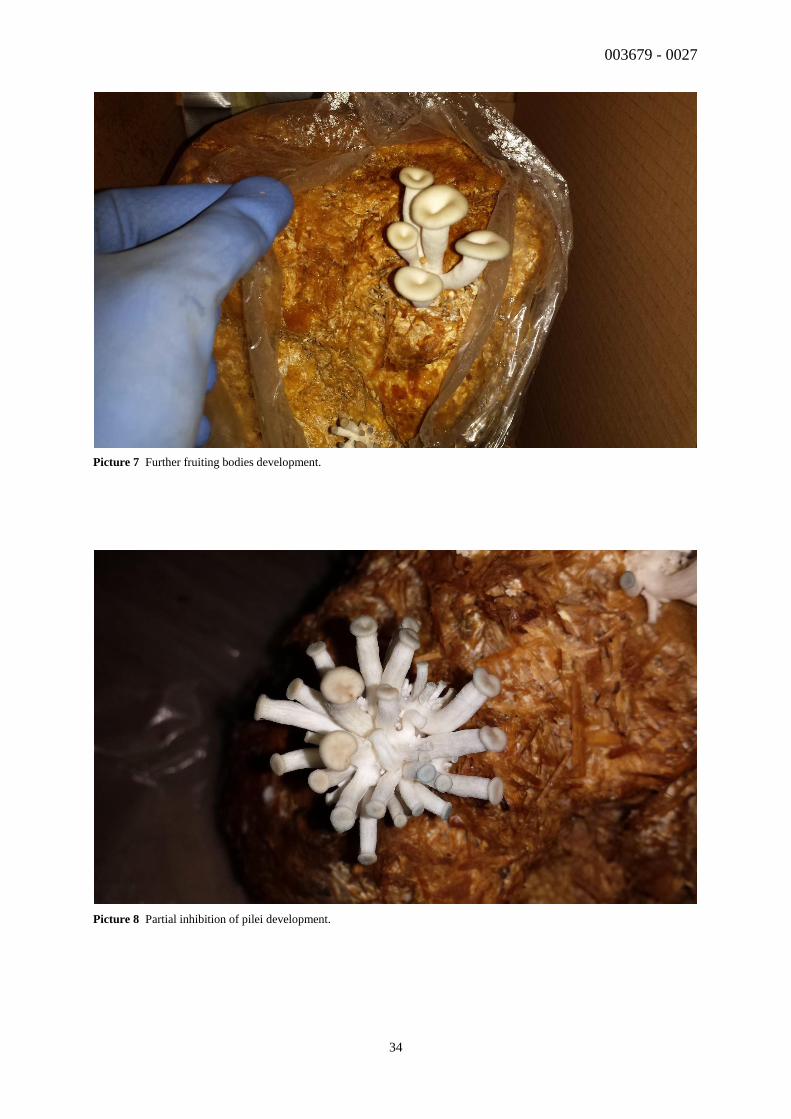
The partial inhibition of pilei development can be clarified by comparison with Kong’s findings
(2004). The researcher stated that “high CO2 concentration (approximately 1000 ppm) causes
mushrooms to produce longs stipes with tiny pilei”. Due to this unexpected outcome, a detailed
statistical analysis could not be completed and original research question could not be fully
answered.
The results of the study might contribute to the development of a new method to cultivate oyster
mushrooms for industrial production.

003679 - 0027
27
10. EVALUATION
Mushroom cultivation methods require that growers possess knowledge of principles and
techniques to mimic interactions favouring growing processes in the natural environment.
Isolating one factor that constitutes an independent variable in these complex events remains
elusive. It is, therefore, unreasonable to have complete confidence in the strength of the
conclusion.
One of the major factors influencing the growth of Pleurotus ostreatus fruiting bodies is CO2
concentration. Although the procedure included fresh air exchanges aimed at lowering the
ambient CO2 content, the exact concentration was not controlled. From the final results it can
be inferred that the CO2 level was too high. It should be measured by a CO2 sensor. It could be
further reduced by more frequent ventilation, the example being three times a day.
Alternatively, Petri dishes containing KOH could be placed in the vicinity of the samples to
absorb CO2 (Niederpruem 1963).
Furthermore, the light intensity should be considered in more detail. This is due to the fact that
the formation of primordia and the growth of fruiting bodies require light of specified
intensities, measured in lux. Application of a lux meter exemplifies appropriate measures.
The partial inhibition of pilei development and further inconsistencies could stem from the
degree of workplace cleanliness, particularly during preparation of the substrates. Despite
complying with standard cleaning methods, protection against contaminants could be
insufficient. An antibacterial cleaning soap and a surface disinfectant spray could be
implemented.
“One of the features of Pleurotus ostreatus is that it requires a low temperature treatment to
initiate successful primordia formation” (Kong 2004). The procedure of the investigation
should incorporate this step after inoculation – the temperature in the cultivation place ought to
be decreased by 10℃ for 3 days. This could be accomplished by using a portable air conditioner.
Additionally, performing several t-tests entails the problem of multiple comparisons. As more
samples are included in the study, the likelihood of observing one or more significant P values
by chance increases. The data should not be analysed with t-tests, but rather with one-way
ANOVA, which would compare all the samples at once (Motulsky 2014).
003679 - 0027
28
11. CITED REFERENCES
1. Allott A. 2012. Biology for the IB Diploma. Glasgow: Oxford University Press. p 2.
2. Aphalo PJ. 2006. Light signals and the growth and development of plants: a gentle
introduction. Helsinki: University of Helsinki. p 7. Available from:
http://www.mv.helsinki.fi/aphalo/photobio/pdf/notes1.pdf. Accessed 2014 August 2.
3. Biology-Online Team. 2005. Biology-Online Dictionary. Stipe. Available from:
http://www.biology-online.org/dictionary/Stipe. Accessed 2014 August 1.
4. Chambers L. 2011. What wavelength goes with a color? National Aeronautics and
Space Administration. Available from:
http://science-edu.larc.nasa.gov/EDDOCS/Wavelengths_for_Colors.html.
Accessed 2014 August 2.
5. Chang ST, Miles PG. 2004. Mushrooms – cultivation, nutritional value, medical
effect, and environmental impact. Boca Raton: CRC Press. p 2-3, 19, 68-69, 95, 136-
137, 255, 315-319, 426.
6. Cumming G, Fidler F, Vaux DL. April 2007. Error bars in experimental biology.
J Cell Biol [online]; 177 (1): 7-11. Available from:
http://www.ncbi.nlm.nih.gov/pmc/articles/PMC2064100/pdf/jcb1770007.pdf.
Accessed 2014 August 13.
7. Damon A, McGonegal R, Tosto P, Ward W. 2007. Biology. Edinburgh: Pearson
Baccalaureate. p 4, 7, 115, 511.
8. Editors of the American Heritage Dictionaries. 2000. The American Heritage
Dictionary of the English Language. Inoculate. Boston: Houghton Mifflin Company.
Available from: http://www.thefreedictionary.com/inoculate.
Accessed 2014 August 1.

003679 - 0027
29
9. Editors of the American Heritage Dictionaries. 2000. The American Heritage
Dictionary of the English Language. Fruiting body. Boston: Houghton Mifflin
Company. Available from: http://www.answers.com/topic/fruiting-body.
Accessed 2014 July 31.
10. Editors of the Collins Dictionaries. 2003. Collins English Dictionary: Complete &
Unabridged. 2003. Pileus. London: HarperCollins Publishers. Available from:
http://www.thefreedictionary.com/pileus. Accessed 2014 August 1.
11. Grzywacz A, Nieto J C. 1988. Grzyby leśne. Warszawa: Państwowe Wydawnictwo
Rolnicze i Leśne. p 164-165.
12. Gupta S. 2013. Preparing to grow oyster mushrooms. Available from:
http://microfungi-themushroomexperts.blogspot.com/2013_08_01_archive.html.
Accessed 2014 July 30.
13. Jang MJ, Lee YH, Ju YC, Kim SM, Koo HM. 2013. Effect of color of light emitting
diode on development of fruit body in Hypsizygus marmoreus. The Korean Society of
Mycology [online]. p 63, 65. Available from:
http://www.ncbi.nlm.nih.gov/pmc/articles/PMC3627973/pdf/mb-41-63.pdf.
Accessed 2014 July 31.
14. Klan J, Vancura B. 1981. Grzyby. Warszawa: Państwowe Wydawnictwo Rolnicze
i Leśne. p 41.
15. Kong WS. 2004. Oyster mushroom cultivation. Descriptions of commercially
important Pleurotus species. Rural Development Administration, Korea [online].
p 57-59. Available from: www.alohamedicinals.com/book1/chapter-4.pdf.
Accessed 2014 July 30.

003679 - 0027
30
16. Miyazaki Y, Masuno K, Abe M, Nishizawa H, Matsumoto T, Kunitomo S, Sakata H,
Nakamura K, Koyama T, Ito M, and others. 2011. Light-stimulative effects on the
cultivation of edible mushrooms by using blue LED. p 59, 61-62. Available from:
http://wsmbmp.org/proceedings/7th%20international%20conference/2/P7.pdf.
Accessed 2014 July 31.
17. Motulsky H. 2014. Intuitive biostatistics: a nonmathematical guide to statistical
thinking. New York: Oxford University Press. p 266, 370.
18. Niederpruem DJ. 1963. Role of carbon dioxide in the control of fruiting of
Schizophyllum commune. Indianapolis: Indiana University Medical Center.
Available from:
http://www.ncbi.nlm.nih.gov/pmc/articles/PMC278332/pdf/jbacter00458-0136.pdf.
Accessed 2014 August 14.
19. Oei P. 2005. Small-scale mushroom cultivation – oyster, shiitake and wood ear
mushrooms. Agromisa Foundation and CTA [online]. Available from:
http://journeytoforever.org/farm_library/AD40.pdf. Accessed 2014 August 8.
20. Roberts A. 2006. Plant Anatomy Glossary. Primordium. Available from:
http://www.uri.edu/cels/bio/plant_anatomy/glossary.html. Accessed 2014 August 1.
21. Woller R. 2007. The Pearl Oyster Mushroom – Pleurotus ostreatus. Available from:
http://bioweb.uwlax.edu/bio203/2011/woller_ryan/index.htm#.
Accessed: 2014 July 29.

003679 - 0027
31
12. APPENDIX
12.1 QUALITATIVE DATA
Table 7 Observations made during the investigation.
Initial appearance of substrates
The substrates are in the form of agro-waste
materials. They are made of cereal grains,
sawdust, straw and other lignocellulosic
wastes. The mixture is yellow-brown in
colour.
Initial appearance of Pleurotus ostreatus
spawn
The bags are filled with grain seeds
thoroughly coated with a whitish powder-like
substance.
Appearance of inoculated substrates
Mycelium grows out from the spawn –
visible as a white substance which permeates
the inoculum sites. After a few days, the
substrates are entirely colonised with
mycelia. The resulting substrates are light
creamy yellow in colour. There are yellowish
patches on their surfaces.
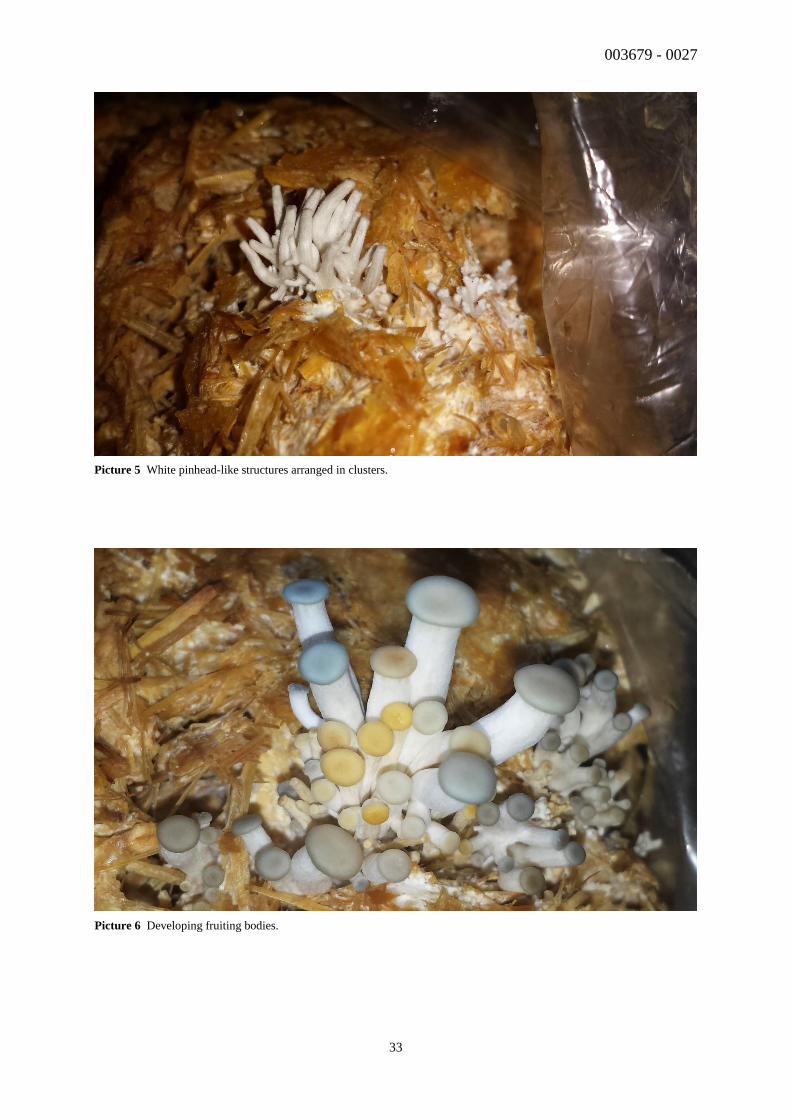
Observations made during fruiting body
development
Primordia appears on the top layers of the
substrates. They are in the form of small
white pinhead-like structures arranged in
clusters. They develop into fruiting bodies
due to light exposure. Their pilei are convex,
pale brown, beige or greyish blue with
smooth surface. Then they flatten out or
become concave (up-rolled at the margins).
Gills are white to pale yellow. Stems are
elongated, white and downy.

003679 - 0027
32
Picture 3 Colonised substrate with yellowish patches on its surface.
Picture 4 Primordia formation.
003679 - 0027
33
Picture 5 White pinhead-like structures arranged in clusters.
Picture 6 Developing fruiting bodies.
003679 - 0027
34
Picture 7 Further fruiting bodies development.
Picture 8 Partial inhibition of pilei development.

003679 - 0027
35
12.2 QUANTITATIVE DATA
Table 8 Lengths of stipes and diameters of pilei; Blue light. Values are obtained from three trials.
Sample Length of stipe & Diameter of pileus / mm (±0.5 mm)
Day 1 Day 2 Day 3 Day 4 Day 5 Day 6 Day 7
Blu
e li
gh
t
1. 2.5 0.5 5.0 1.0 12.5 3.0 18.0 5.0 24.5 10.5 31.0 12.5 35.0 14.0
2. 2.5 1.0 7.0 2.0 14.0 2.5 19.5 5.0 26.0 7.0 32.5 11.0 36.0 11.5
3. 3.0 1.0 6.5 2.5 9.5 4.5 13.0 5.0 13.5 5.0 14.5 5.0 14.5 5.0
4. 1.5 0.5 5.5 1.0 19.5 2.5 24.0 4.0 30.0 8.0 36.5 9.0 42.5 9.5
5. 3.0 1.5 10.0 3.0 19.5 5.5 27.0 7.5 29.5 9.0 32.0 9.0 36.0 9.0
6. 3.0 1.0 8.5 4.0 14.0 7.5 21.5 8.0 29.0 9.0 35.0 10.5 37.5 12.0
7. 2.5 2.0 13.0 4.5 18.5 11.0 23.5 13.0 27.0 14.5 32.5 15.0 38.0 15.0
8. 1.5 1.5 8.0 4.5 15.0 6.5 21.5 13.5 28.0 14.0 33.0 15.0 33.5 15.0
9. 2.0 1.0 6.5 2.0 12.0 6.0 17.5 7.5 26.0 9.0 29.5 12.0 32.0 14.5
10. 4.0 2.0 9.0 11.0 11.5 16.5 18.0 28.0 21.0 36.0 24.5 38.5 29.5 39.5
11. 2.5 0.5 5.0 1.0 12.0 3.0 19.0 6.5 24.0 9.5 31.0 11.0 36.5 12.0
12. 3.5 1.5 10.5 3.5 18.0 7.0 25.5 12.0 33.0 14.5 37.5 16.0 39.0 17.0
13. 2.0 1.0 11.0 5.0 15.0 5.0 20.5 7.5 27.0 8.0 34.0 10.5 41.0 11.0
14. 3.0 2.0 12.5 4.0 15.0 5.0 17.5 7.0 22.0 8.5 25.5 8.5 32.0 9.0
15. 3.0 2.5 15.0 10.0 23.0 18.5 31.0 26.5 35.0 31.0 35.0 31.5 35.5 32.0
003679 - 0027
36
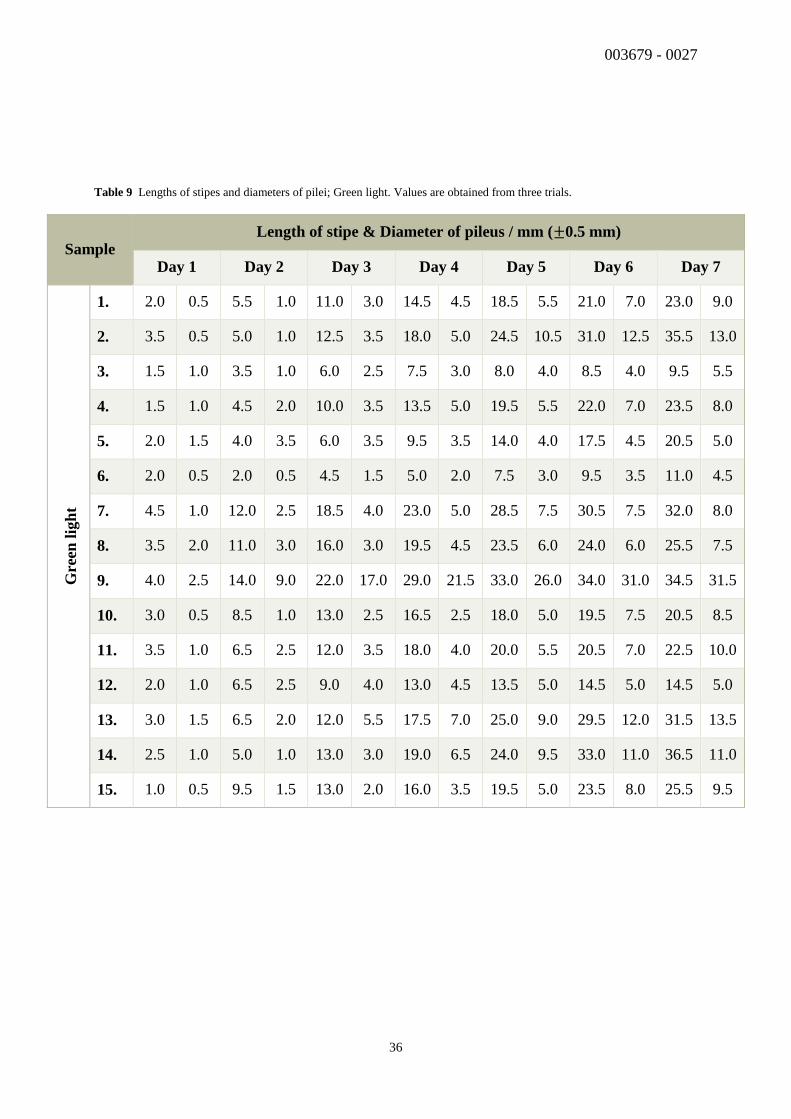
Table 9 Lengths of stipes and diameters of pilei; Green light. Values are obtained from three trials.
Sample Length of stipe & Diameter of pileus / mm (±0.5 mm)
Day 1 Day 2 Day 3 Day 4 Day 5 Day 6 Day 7
Gre
en l
igh
t
1. 2.0 0.5 5.5 1.0 11.0 3.0 14.5 4.5 18.5 5.5 21.0 7.0 23.0 9.0
2. 3.5 0.5 5.0 1.0 12.5 3.5 18.0 5.0 24.5 10.5 31.0 12.5 35.5 13.0
3. 1.5 1.0 3.5 1.0 6.0 2.5 7.5 3.0 8.0 4.0 8.5 4.0 9.5 5.5
4. 1.5 1.0 4.5 2.0 10.0 3.5 13.5 5.0 19.5 5.5 22.0 7.0 23.5 8.0
5. 2.0 1.5 4.0 3.5 6.0 3.5 9.5 3.5 14.0 4.0 17.5 4.5 20.5 5.0
6. 2.0 0.5 2.0 0.5 4.5 1.5 5.0 2.0 7.5 3.0 9.5 3.5 11.0 4.5
7. 4.5 1.0 12.0 2.5 18.5 4.0 23.0 5.0 28.5 7.5 30.5 7.5 32.0 8.0
8. 3.5 2.0 11.0 3.0 16.0 3.0 19.5 4.5 23.5 6.0 24.0 6.0 25.5 7.5
9. 4.0 2.5 14.0 9.0 22.0 17.0 29.0 21.5 33.0 26.0 34.0 31.0 34.5 31.5
10. 3.0 0.5 8.5 1.0 13.0 2.5 16.5 2.5 18.0 5.0 19.5 7.5 20.5 8.5
11. 3.5 1.0 6.5 2.5 12.0 3.5 18.0 4.0 20.0 5.5 20.5 7.0 22.5 10.0
12. 2.0 1.0 6.5 2.5 9.0 4.0 13.0 4.5 13.5 5.0 14.5 5.0 14.5 5.0
13. 3.0 1.5 6.5 2.0 12.0 5.5 17.5 7.0 25.0 9.0 29.5 12.0 31.5 13.5
14. 2.5 1.0 5.0 1.0 13.0 3.0 19.0 6.5 24.0 9.5 33.0 11.0 36.5 11.0
15. 1.0 0.5 9.5 1.5 13.0 2.0 16.0 3.5 19.5 5.0 23.5 8.0 25.5 9.5
003679 - 0027
37
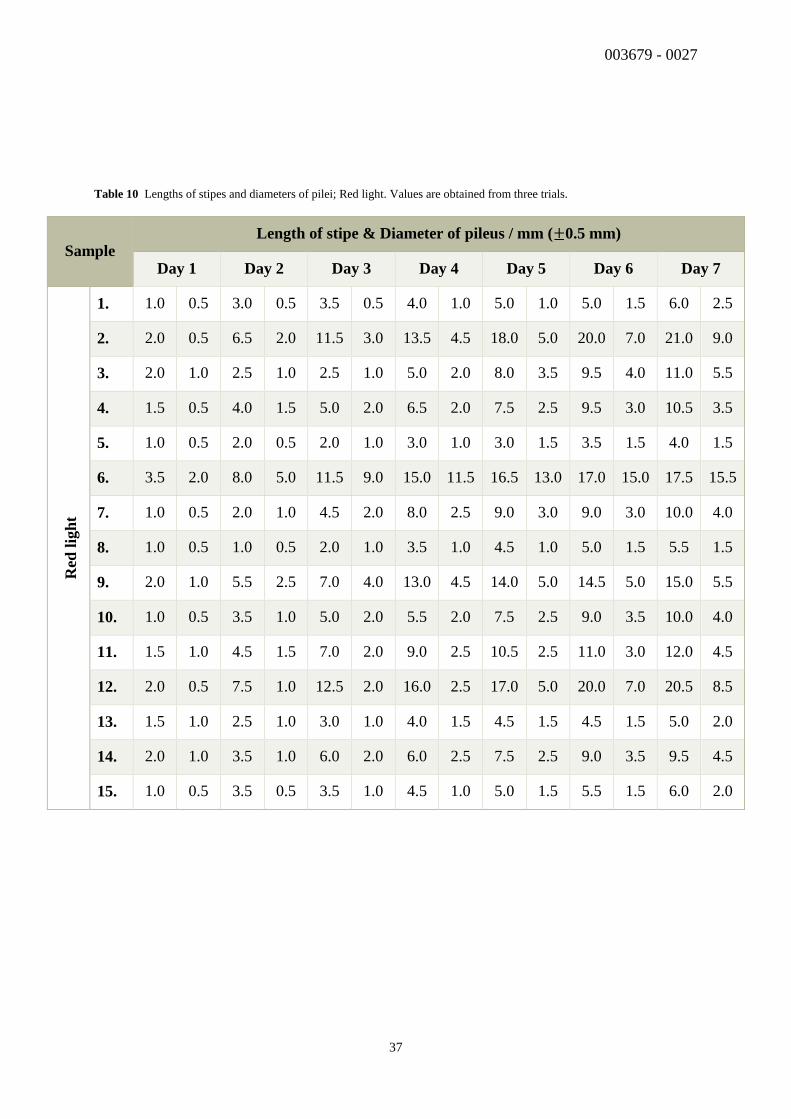
Table 10 Lengths of stipes and diameters of pilei; Red light. Values are obtained from three trials.
Sample Length of stipe & Diameter of pileus / mm (±0.5 mm)
Day 1 Day 2 Day 3 Day 4 Day 5 Day 6 Day 7
Red
lig
ht
1. 1.0 0.5 3.0 0.5 3.5 0.5 4.0 1.0 5.0 1.0 5.0 1.5 6.0 2.5
2. 2.0 0.5 6.5 2.0 11.5 3.0 13.5 4.5 18.0 5.0 20.0 7.0 21.0 9.0
3. 2.0 1.0 2.5 1.0 2.5 1.0 5.0 2.0 8.0 3.5 9.5 4.0 11.0 5.5
4. 1.5 0.5 4.0 1.5 5.0 2.0 6.5 2.0 7.5 2.5 9.5 3.0 10.5 3.5
5. 1.0 0.5 2.0 0.5 2.0 1.0 3.0 1.0 3.0 1.5 3.5 1.5 4.0 1.5
6. 3.5 2.0 8.0 5.0 11.5 9.0 15.0 11.5 16.5 13.0 17.0 15.0 17.5 15.5
7. 1.0 0.5 2.0 1.0 4.5 2.0 8.0 2.5 9.0 3.0 9.0 3.0 10.0 4.0
8. 1.0 0.5 1.0 0.5 2.0 1.0 3.5 1.0 4.5 1.0 5.0 1.5 5.5 1.5
9. 2.0 1.0 5.5 2.5 7.0 4.0 13.0 4.5 14.0 5.0 14.5 5.0 15.0 5.5
10. 1.0 0.5 3.5 1.0 5.0 2.0 5.5 2.0 7.5 2.5 9.0 3.5 10.0 4.0
11. 1.5 1.0 4.5 1.5 7.0 2.0 9.0 2.5 10.5 2.5 11.0 3.0 12.0 4.5
12. 2.0 0.5 7.5 1.0 12.5 2.0 16.0 2.5 17.0 5.0 20.0 7.0 20.5 8.5
13. 1.5 1.0 2.5 1.0 3.0 1.0 4.0 1.5 4.5 1.5 4.5 1.5 5.0 2.0
14. 2.0 1.0 3.5 1.0 6.0 2.0 6.0 2.5 7.5 2.5 9.0 3.5 9.5 4.5
15. 1.0 0.5 3.5 0.5 3.5 1.0 4.5 1.0 5.0 1.5 5.5 1.5 6.0 2.0
003679 - 0027
38
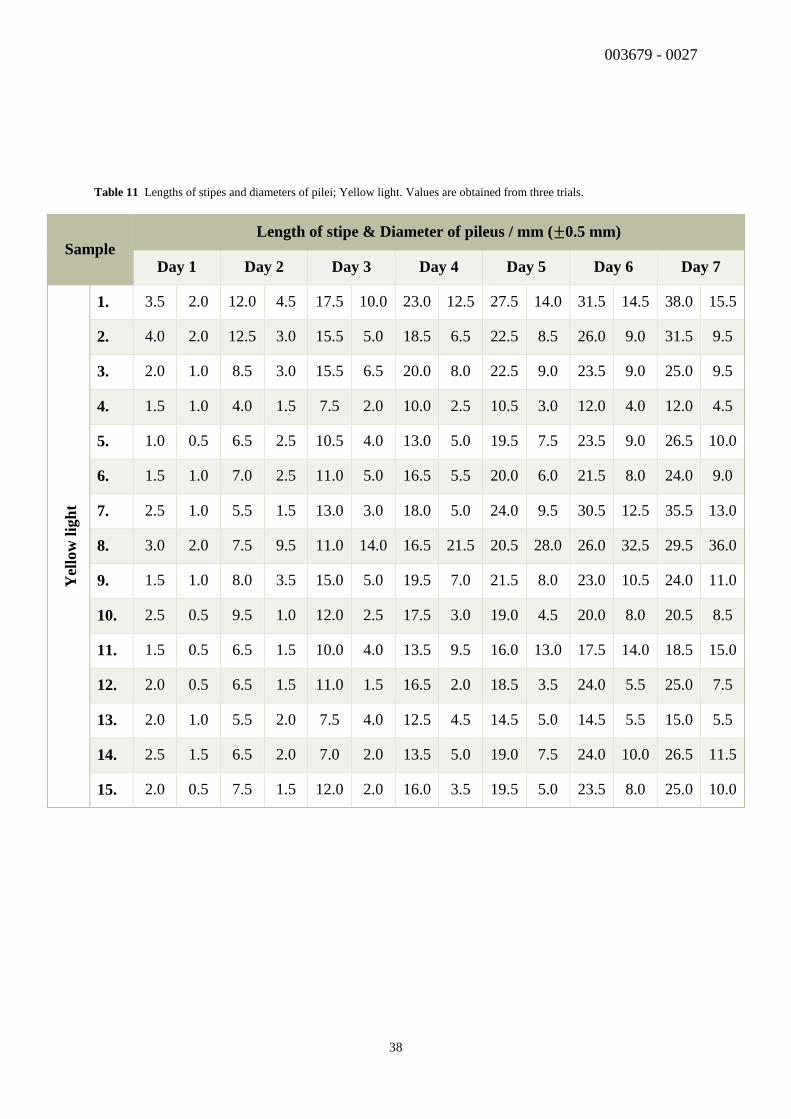
Table 11 Lengths of stipes and diameters of pilei; Yellow light. Values are obtained from three trials.
Sample Length of stipe & Diameter of pileus / mm (±0.5 mm)
Day 1 Day 2 Day 3 Day 4 Day 5 Day 6 Day 7
Yel
low
lig
ht
1. 3.5 2.0 12.0 4.5 17.5 10.0 23.0 12.5 27.5 14.0 31.5 14.5 38.0 15.5
2. 4.0 2.0 12.5 3.0 15.5 5.0 18.5 6.5 22.5 8.5 26.0 9.0 31.5 9.5
3. 2.0 1.0 8.5 3.0 15.5 6.5 20.0 8.0 22.5 9.0 23.5 9.0 25.0 9.5
4. 1.5 1.0 4.0 1.5 7.5 2.0 10.0 2.5 10.5 3.0 12.0 4.0 12.0 4.5
5. 1.0 0.5 6.5 2.5 10.5 4.0 13.0 5.0 19.5 7.5 23.5 9.0 26.5 10.0
6. 1.5 1.0 7.0 2.5 11.0 5.0 16.5 5.5 20.0 6.0 21.5 8.0 24.0 9.0
7. 2.5 1.0 5.5 1.5 13.0 3.0 18.0 5.0 24.0 9.5 30.5 12.5 35.5 13.0
8. 3.0 2.0 7.5 9.5 11.0 14.0 16.5 21.5 20.5 28.0 26.0 32.5 29.5 36.0
9. 1.5 1.0 8.0 3.5 15.0 5.0 19.5 7.0 21.5 8.0 23.0 10.5 24.0 11.0
10. 2.5 0.5 9.5 1.0 12.0 2.5 17.5 3.0 19.0 4.5 20.0 8.0 20.5 8.5
11. 1.5 0.5 6.5 1.5 10.0 4.0 13.5 9.5 16.0 13.0 17.5 14.0 18.5 15.0
12. 2.0 0.5 6.5 1.5 11.0 1.5 16.5 2.0 18.5 3.5 24.0 5.5 25.0 7.5
13. 2.0 1.0 5.5 2.0 7.5 4.0 12.5 4.5 14.5 5.0 14.5 5.5 15.0 5.5
14. 2.5 1.5 6.5 2.0 7.0 2.0 13.5 5.0 19.0 7.5 24.0 10.0 26.5 11.5
15. 2.0 0.5 7.5 1.5 12.0 2.0 16.0 3.5 19.5 5.0 23.5 8.0 25.0 10.0

003679 - 0027
39
12.3 NORMAL DISTRIBUTION CURVES
Graph 5 Normal distribution of lengths of stipes concerning Day 7; Blue light, drawn with the help of a GDC, Ti-84.
The x-axis shows the lengths of stipes / mm (±0.5 mm) and the y-axis shows the frequency.
003679 - 0027
40
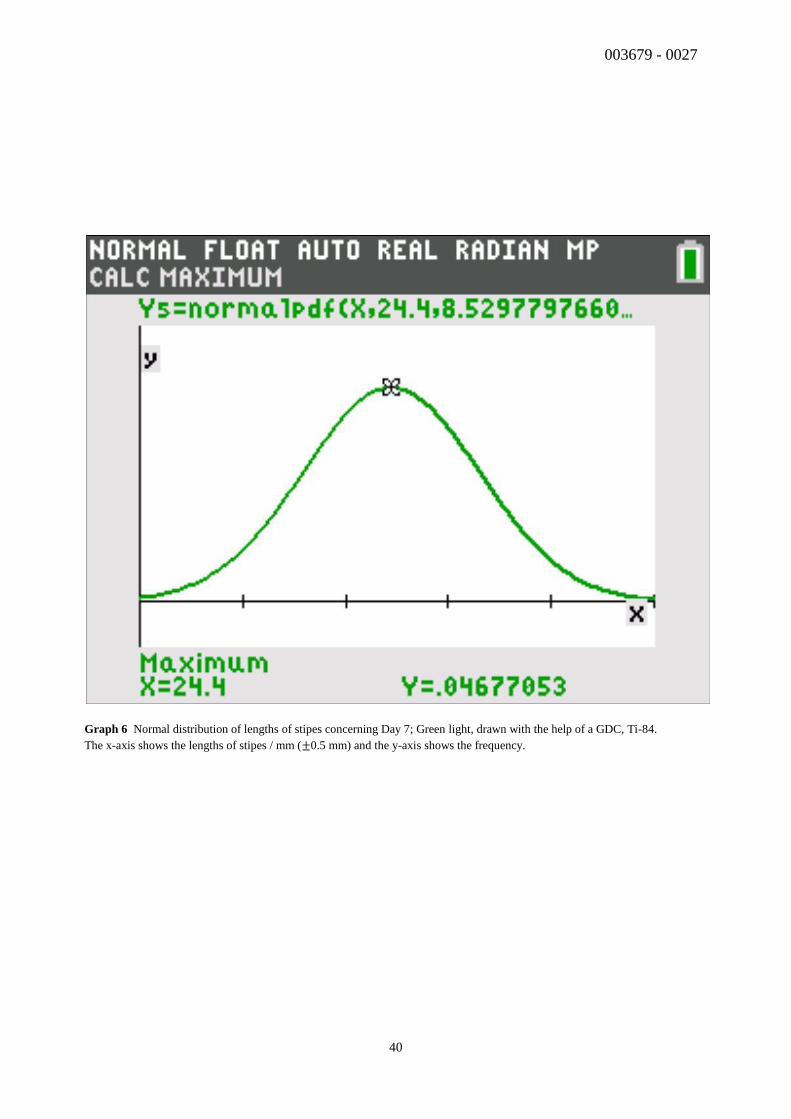
Graph 6 Normal distribution of lengths of stipes concerning Day 7; Green light, drawn with the help of a GDC, Ti-84.
The x-axis shows the lengths of stipes / mm (±0.5 mm) and the y-axis shows the frequency.
003679 - 0027
41
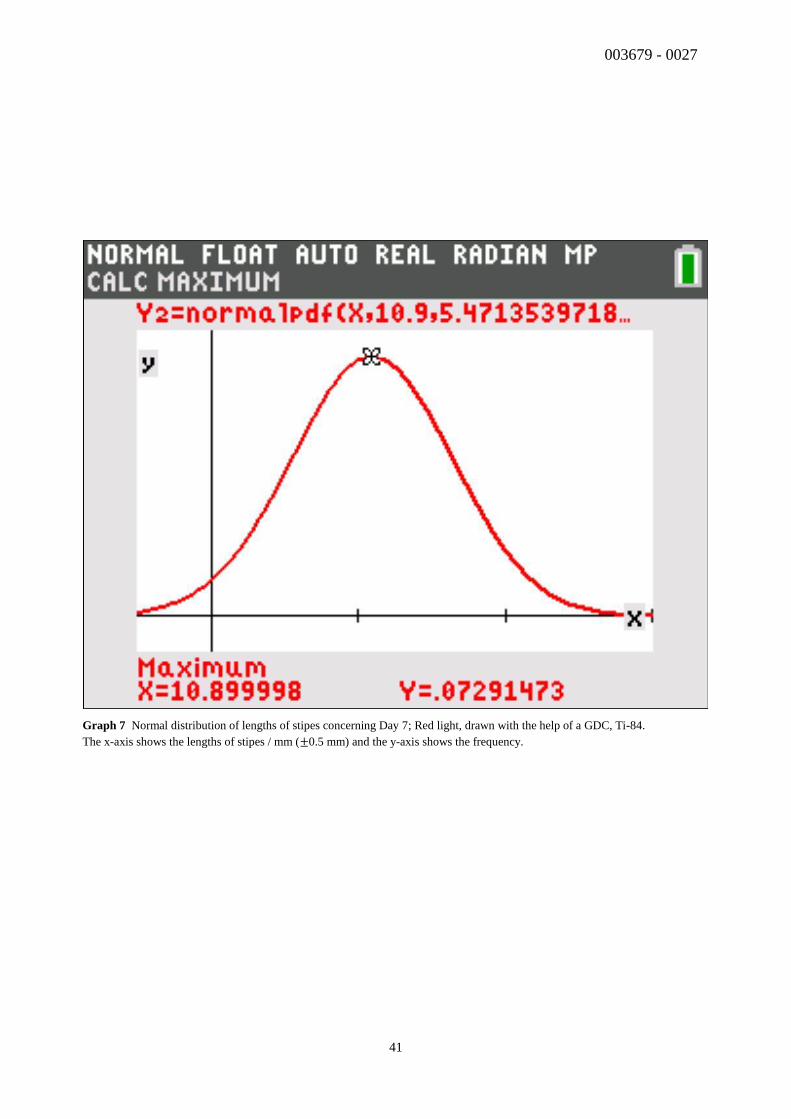
Graph 7 Normal distribution of lengths of stipes concerning Day 7; Red light, drawn with the help of a GDC, Ti-84.
The x-axis shows the lengths of stipes / mm (±0.5 mm) and the y-axis shows the frequency.
003679 - 0027
42
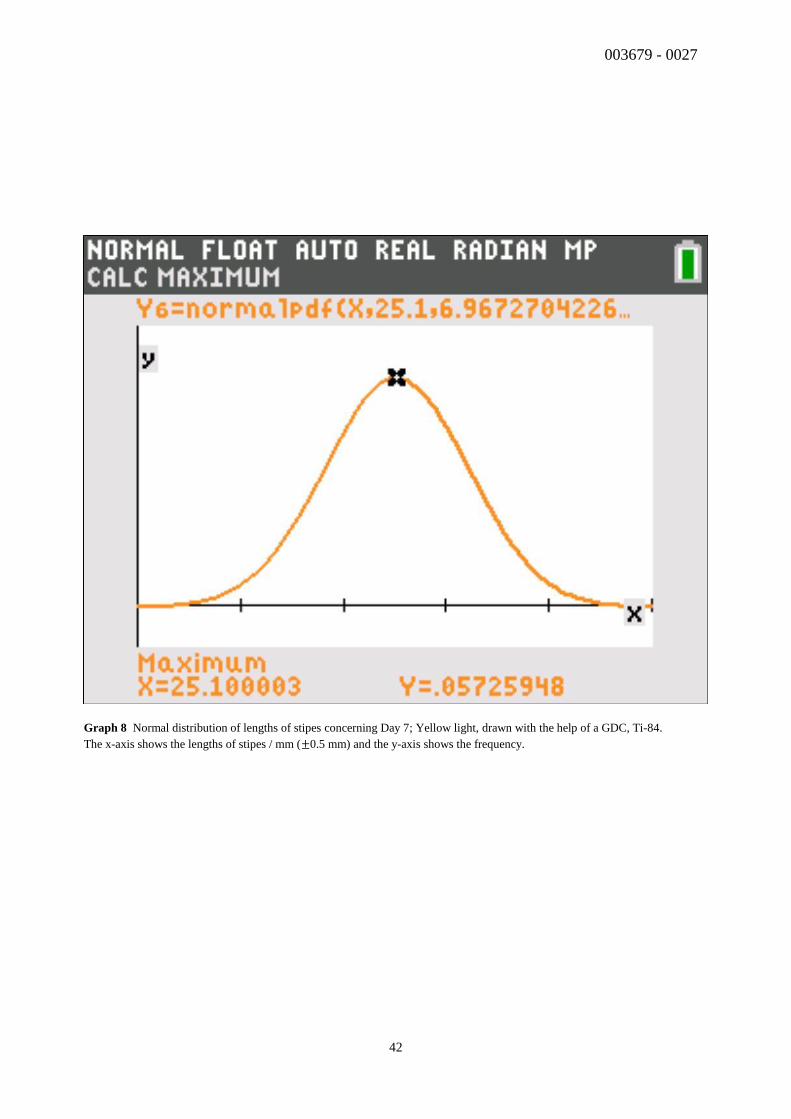
Graph 8 Normal distribution of lengths of stipes concerning Day 7; Yellow light, drawn with the help of a GDC, Ti-84.
The x-axis shows the lengths of stipes / mm (±0.5 mm) and the y-axis shows the frequency.
003679 - 0027
43
12.4 T-TEST
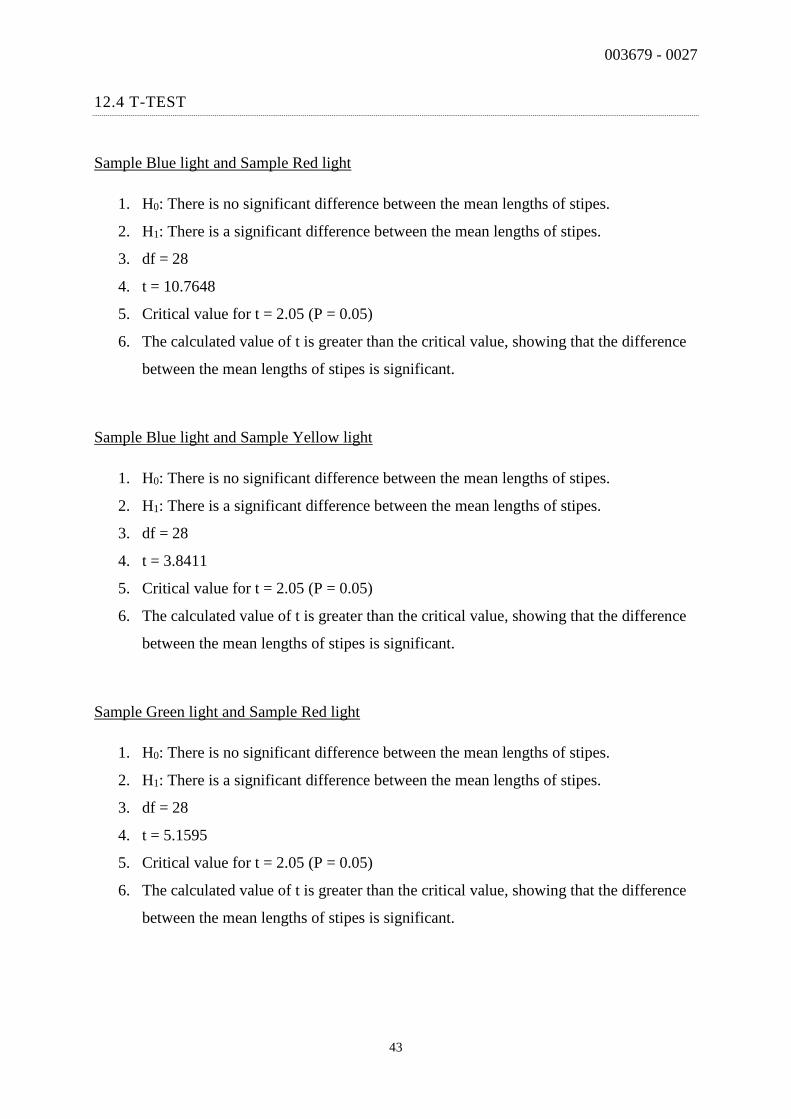
Sample Blue light and Sample Red light
1. H0: There is no significant difference between the mean lengths of stipes.
2. H1: There is a significant difference between the mean lengths of stipes.
3. df = 28
4. t = 10.7648
5. Critical value for t = 2.05 (P = 0.05)
6. The calculated value of t is greater than the critical value, showing that the difference
between the mean lengths of stipes is significant.
Sample Blue light and Sample Yellow light
1. H0: There is no significant difference between the mean lengths of stipes.
2. H1: There is a significant difference between the mean lengths of stipes.
3. df = 28
4. t = 3.8411
5. Critical value for t = 2.05 (P = 0.05)
6. The calculated value of t is greater than the critical value, showing that the difference
between the mean lengths of stipes is significant.
Sample Green light and Sample Red light
1. H0: There is no significant difference between the mean lengths of stipes.
2. H1: There is a significant difference between the mean lengths of stipes.
3. df = 28
4. t = 5.1595
5. Critical value for t = 2.05 (P = 0.05)
6. The calculated value of t is greater than the critical value, showing that the difference
between the mean lengths of stipes is significant.
003679 - 0027
44
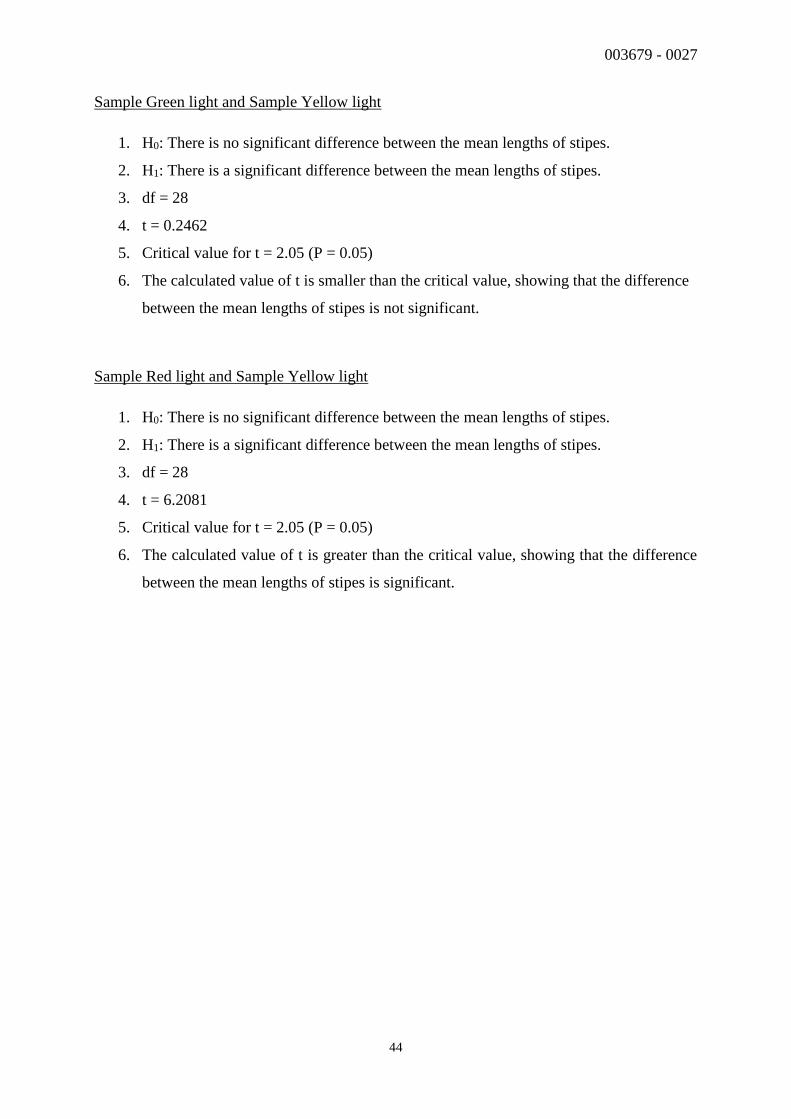
Sample Green light and Sample Yellow light
1. H0: There is no significant difference between the mean lengths of stipes.
2. H1: There is a significant difference between the mean lengths of stipes.
3. df = 28
4. t = 0.2462
5. Critical value for t = 2.05 (P = 0.05)
6. The calculated value of t is smaller than the critical value, showing that the difference
between the mean lengths of stipes is not significant.
Sample Red light and Sample Yellow light
1. H0: There is no significant difference between the mean lengths of stipes.
2. H1: There is a significant difference between the mean lengths of stipes.
3. df = 28
4. t = 6.2081
5. Critical value for t = 2.05 (P = 0.05)
6. The calculated value of t is greater than the critical value, showing that the difference
between the mean lengths of stipes is significant.